![Ab Initio Predictions of Light Nuclei · 2018. 11. 9. · of Light Nuclei Anna McCoy TRIUMF Theory Department. Ab initio nuclear theory!2 me ... The symplectic model [10–12] ...](https://static.fdocuments.in/doc/165x107/606766d6741d0d4353493550/ab-initio-predictions-of-light-nuclei-2018-11-9-of-light-nuclei-anna-mccoy.jpg)
Ab initio and molecular dynamics predictions for electron...
19
Ab initio and molecular dynamics predictions for electron and phonon transport in bismuth telluride Bao-Ling Huang and Massoud Kaviany* Department of Mechanical Engineering, University of Michigan, Ann Arbor, Michigan 48109-2125, USA Received 7 December 2007; revised manuscript received 1 February 2008; published 12 March 2008; publisher error corrected 18 March 2008 Phonon and electron transport in Bi 2 Te 3 has been investigated using a multiscale approach, combining the first-principles calculations, molecular dynamics MD simulations, and Boltzmann transport equations BTEs. Good agreements are found with the available experimental results. The MD simulations along with the Green-Kubo autocorrelation decay method are used to calculate the lattice thermal conductivity in both the in-plane and cross-plane directions, where the required classical interatomic potentials for Bi 2 Te 3 are devel- oped on the basis of first-principles calculations and experimental results. In the decomposition of the lattice thermal conductivity, the contributions from the short-range acoustic and optical phonons are found to be temperature independent and direction independent, while the long-range acoustic phonons dominate the pho- non transport with a strong temperature and direction dependence represented by a modified Slack relation. The sum of the short-range acoustic and optical phonon contribution is about 0.2 W / m K and signifies the limit when the long-range transport is suppressed by nanostructure engineering. The electrical transport is calculated using the full-band structure from the linearized augmented plane-wave method, BTE, and the energy-dependent relaxation-time models with the nonparabolic Kane energy dispersion. Temperature depen- dence of the energy gap is found to be important for the prediction of electrical transport in the intrinsic regime. Appropriate modeling of relaxation times is also essential for the calculation of electric and thermal transport, especially in the intrinsic regime. The maximum of the Seebeck coefficient appears when the chemical potential approaches the band edge and can be estimated by a simple expression containing the band gap. The scatterings by the acoustic, optical, and polar-optical phonons dominate the electrical conductivity and electric thermal conductivity. DOI: 10.1103/PhysRevB.77.125209 PACS numbers: 63.20.e, 72.15.Jf, 71.20.b I. INTRODUCTION Efficient solid state energy conversion devices based on the thermoelectric TE effects, i.e., the Peltier effect for cooling and the Seebeck effect for power generation, have great application potential and economic benefits in many areas. However, present TE devices have a very low effi- ciency, which is directly limited by the performance of TE materials. The search into the fundamentals and improve- ment in TE transport phenomena continues. The performance of TE materials is presented by the dimensionless figure of merit ZT, ZT = S 2 e T/k e + k p , 1 where S is the Seebeck coefficient, e is the electrical con- ductivity, T is the temperature, and k e and k p are the electric and lattice thermal conductivities, respectively. Identifying and designing materials with high ZT has proven to be very challenging. Currently, the best bulk commercial TE materi- als for applications near room temperature are still the com- pounds based on Bi 2 Te 3 , with ZT near 1. Bi 2 Te 3 exhibits many typical features of a good room-temperature TE mate- rial, such as a narrow band gap, high density of states near the band edges, and low total thermal conductivity. Under- standing phonon and electron transport in Bi 2 Te 3 is impor- tant in the design and optimization of TE materials. Bulk Bi 2 Te 3 has a rhombohedral lattice structure that be- longs to the space group D 3d 5 R3 ¯ m and contains five atoms along the trigonal axis in the sequence of Te1-Bi-Te2-Bi-Te1 Fig. 1. At 293 K, the rhombohedral unit-cell parameters 1 are a R =10.473 Å and R = 24.159°, and the corresponding hexagonal unit-cell parameters are a = 10.473 Å and c = 30.487 Å. In the rhombohedral structure, the fractional co- ordinates for Te1 atoms are designated as u , u , u and Te1 Te1 Bi Te2 Bi Bi Bi Bi Te1 Te1 Te1 Te1 Te1 Te2 Te2 Bi Bi2Te3 Block Bi2Te3 Block Bi2Te3 Block Z Γ X a R a (║) c (┴) a R a R a R θ R θ R θ R Bi 2 Te 3 L U a F ĸy ĸz ĸx z x FIG. 1. Color online Crystal structure of Bi 2 Te 3 showing both the rhombohedral and hexagonal unit cells. The first Brillouin zone for the rhombohedral cell and some symmetry axes and k points are also shown. The hexagonal structure is made of Te1-Bi-Te2-Bi-Te1 five-layer blocks. PHYSICAL REVIEW B 77, 125209 2008 1098-0121/2008/7712/12520919 ©2008 The American Physical Society 125209-1
Transcript of Ab initio and molecular dynamics predictions for electron...

Ab initio and molecular dynamics predictions for electron and phonon transportin bismuth telluride
Bao-Ling Huang and Massoud Kaviany*Department of Mechanical Engineering, University of Michigan, Ann Arbor, Michigan 48109-2125, USAReceived 7 December 2007; revised manuscript received 1 February 2008; published 12 March 2008;
publisher error corrected 18 March 2008
Phonon and electron transport in Bi2Te3 has been investigated using a multiscale approach, combining thefirst-principles calculations, molecular dynamics MD simulations, and Boltzmann transport equationsBTEs. Good agreements are found with the available experimental results. The MD simulations along withthe Green-Kubo autocorrelation decay method are used to calculate the lattice thermal conductivity in both thein-plane and cross-plane directions, where the required classical interatomic potentials for Bi2Te3 are devel-oped on the basis of first-principles calculations and experimental results. In the decomposition of the latticethermal conductivity, the contributions from the short-range acoustic and optical phonons are found to betemperature independent and direction independent, while the long-range acoustic phonons dominate the pho-non transport with a strong temperature and direction dependence represented by a modified Slack relation.The sum of the short-range acoustic and optical phonon contribution is about 0.2 W /m K and signifies thelimit when the long-range transport is suppressed by nanostructure engineering. The electrical transport iscalculated using the full-band structure from the linearized augmented plane-wave method, BTE, and theenergy-dependent relaxation-time models with the nonparabolic Kane energy dispersion. Temperature depen-dence of the energy gap is found to be important for the prediction of electrical transport in the intrinsicregime. Appropriate modeling of relaxation times is also essential for the calculation of electric and thermaltransport, especially in the intrinsic regime. The maximum of the Seebeck coefficient appears when thechemical potential approaches the band edge and can be estimated by a simple expression containing the bandgap. The scatterings by the acoustic, optical, and polar-optical phonons dominate the electrical conductivityand electric thermal conductivity.
DOI: 10.1103/PhysRevB.77.125209 PACS numbers: 63.20.e, 72.15.Jf, 71.20.b
I. INTRODUCTION
Efficient solid state energy conversion devices based onthe thermoelectric TE effects, i.e., the Peltier effect forcooling and the Seebeck effect for power generation, havegreat application potential and economic benefits in manyareas. However, present TE devices have a very low effi-ciency, which is directly limited by the performance of TEmaterials. The search into the fundamentals and improve-ment in TE transport phenomena continues. The performanceof TE materials is presented by the dimensionless figure ofmerit ZT,
ZT = S2eT/ke + kp , 1
where S is the Seebeck coefficient, e is the electrical con-ductivity, T is the temperature, and ke and kp are the electricand lattice thermal conductivities, respectively. Identifyingand designing materials with high ZT has proven to be verychallenging. Currently, the best bulk commercial TE materi-als for applications near room temperature are still the com-pounds based on Bi2Te3, with ZT near 1. Bi2Te3 exhibitsmany typical features of a good room-temperature TE mate-rial, such as a narrow band gap, high density of states nearthe band edges, and low total thermal conductivity. Under-standing phonon and electron transport in Bi2Te3 is impor-tant in the design and optimization of TE materials.
Bulk Bi2Te3 has a rhombohedral lattice structure that be-
longs to the space group D3d5 R3m and contains five atoms
along the trigonal axis in the sequence of Te1-Bi-Te2-Bi-Te1
Fig. 1. At 293 K, the rhombohedral unit-cell parameters1
are aR=10.473 Å and R=24.159°, and the correspondinghexagonal unit-cell parameters are a=10.473 Å and c=30.487 Å. In the rhombohedral structure, the fractional co-ordinates for Te1 atoms are designated as u , u , u and
Te1
Te1
BiTe2
Bi
Bi
Bi
Bi
Te1
Te1
Te1
Te1
Te1
Te2
Te2
Bi
Bi2Te3Block
Bi2Te3Block
Bi2Te3Block
ZΓ
X
aR
a ()
c ()
aR
aRaR
θRθR
θR
Bi2Te3
L
Ua
Fĸy
ĸz
ĸx
z
x
FIG. 1. Color online Crystal structure of Bi2Te3 showing boththe rhombohedral and hexagonal unit cells. The first Brillouin zonefor the rhombohedral cell and some symmetry axes and k points arealso shown. The hexagonal structure is made of Te1-Bi-Te2-Bi-Te1five-layer blocks.
PHYSICAL REVIEW B 77, 125209 2008
1098-0121/2008/7712/12520919 ©2008 The American Physical Society125209-1

those for Bi as v , v , v, where u and v at 293 K havebeen found2 to be 0.4001 and 0.2095. In the hexagonal unitcell Fig. 1, it is apparent that Bi2Te3 has a lamella structuremade of Te1-Bi-Te2-Bi-Te1 blocks. The bond length of theTe1-Bi bond is 3.07 Å shorter than that of the Bi-Te2 bond3.25 Å, indicating that they may be of different bond types;the Te1-Te1 bond is the longest 3.64 Å and is believed tobe a van der Waals interaction, which responds to the ease ofcleavage along the planes.1,2 We denote the direction alongthe c axis cross-plane direction as “” and the in-planedirection as “.”
Significant experimental characterization efforts1–9 onBi2Te3 and some ab initio calculations and theoreticaltreatments3,5,10 have been reported. However, theoreticaltreatments for both the phonon and electron transport inBi2Te3 are rare, especially for the lattice thermal conductiv-ity. The difficulty has been due to the different physical fea-tures of phonon and electron transport, and a multiscale ap-proach is required for such investigations.
In order to systematically study the relationship betweenthe TE properties and the structural features and to under-stand the transport mechanisms in TE materials, we developa comprehensive strategy to calculate all the TE transportproperties S, e, ke, and kp. In this strategy, first-principlescalculations based on density functional theory DFT, mo-lecular dynamics MD simulations, and Boltzmann transportequation BTE are combined to calculate the TE transportproperties of Bi2Te3. Below, we first report the classical in-teratomic potentials for Bi2Te3 developed on the basis ofDFT energy calculations. With these potentials, the latticevibrations are analyzed using MD simulations. Then, the lat-tice thermal conductivity along the in-plane and cross-planedirections are calculated in a temperature range from150 to 450 K using MD combined with the Green-KuboGK autocorrelation decay method. For an electric transport,we start with the first-principles band structure calculationsand the modeling for the chemical potential. Then, the elec-tric transport properties S, e, and ke are determined usingBTE with the appropriate modeling of the relaxation timeand chemical potential between 100 and 500 K. The calcu-lated results are in reasonable agreement with the experi-ments, noting that the experiments inherently contain variousdefects.
II. PREDICTION OF PHONON CONDUCTIVITY
There are two common theoretical approaches in the in-vestigation of phonon transport in solids. One is the con-tinuum transport theory or kinetic theory, such as BTE,11,12
which is suitable for fast calculations of large systems. How-ever, this normally needs some parameter input from experi-ments or other predictions; therefore, its application is lim-ited. The other is the atomistic technique, such as MDsimulations. Unlike BTE, MD only requires material struc-tures and suitable interatomic potentials. In a sense, MD ismore fundamental and can provide insight into the latticedynamics at the atomic level. Also, MD allows for decom-posing different transport mechanisms and is therefore cho-sen here.
A. Interatomic potentials
Suitable interatomic potentials are essential for modelingthe lattice dynamics of Bi2Te3 in the MD simulations.Though there are already some simple harmonic potentialsfitted using the experiments in the literature,3,5 they are notsuitable for the calculation of lattice conductivity due to theomitted anharmonic effects. Here, the interatomic potentialsinvolving the anharmonic terms have been developed by fit-ting the energy surface from the ab initio calculations. Theab initio energy surface scan is normally carried out by con-sidering only small isolated clusters. This approach is validonly when the interatomic interactions in a real crystal aremainly of short range. However, long-range interactions,e.g., van der Waals interactions, may be important in deter-mining the structure and dynamics of Bi2Te3.3 Therefore, acrystal structure with a periodic boundary condition wasadopted in the energy surface scan.
The ab initio calculations were performed with theQUANTUM-ESPRESSO package13 within the DFT frameworkusing a plane-wave basis set and pseudopotentials adoptingthe Ceperley-Alder local density approximation LDA withPerdew-Zunger data. A cutoff energy of 50 Ry was used, andthe spin-orbit coupling was included. The energy surface ofBi2Te3 was scanned by changing the bond lengths andangles. Both a rhombohedral primitive cell and a hexagonalrepresentation were used in the scan. The classical potentialswith predetermined forms were first fitted to these data usingthe GULP code.14 Then, the crystal structure and other prop-erties such as the elastic constants were calculated by imple-menting those potentials in the GULP package and comparedwith experimental results. Such procedures iterated untilconvergent results were achieved. Note that the DFT with thegeneralized-gradient approximation GGA or LDA cannotdescribe the true long-range van der Waals interactions.15
Though recent developments15 have seamlessly included vander Waals interactions in DFT, the solutions are not verysimple and are unavailable in most present DFT codes. Inthis work, the van der Waals interactions were first param-etrized by fitting the energy surface scanned by QUANTUM-
ESPRESSO and subsequently refined by fitting to the structureand elastic constants. In the fitting with the energy surface,we adopted the atomic charges fitted by Kullmann et al.5 Thefinal forms of the interatomic potentials are listed in Table I.
It is interesting to note that the Te1-Bi bond has a higherbond energy and a higher force constant than the Te2-Bibond. Also, its potential has a larger spatial variation than theTe2-Bi bond, showing a stronger bond anharmonicity. Thisindicates that the Te1-Bi bond is more ionic than the Te2-Bibond. The Te1-Te1 bond, which is commonly considered as avan der Waals interaction, has a bond energy o=0.0691 eV, lower than that of a typical ionic or covalentbond but much higher than the bond energy of the Xe-Xe orKr-Kr van der Waals interaction for Xe-Xe, o=0.014 eV,and for Kr-Kr, o=0.02 eV,16 which has a close filled-shellatomic radius. Also, the force constant of Te1-Te1 at theequilibrium site is 10.45 N /m, which is also much largerthan those of Xe-Xe =0.96 N /m and Kr-Kr =1.15 N /m.16 This value agrees well with the results ofJenkins et al.3 =9.83 N /m and Kullmann et al.5
BAO-LING HUANG AND MASSOUD KAVIANY PHYSICAL REVIEW B 77, 125209 2008
125209-2
7.98 N /m. The large bond energy, the force constants, andthe large spatial variation of the Te1-Te1 interaction indicatesthat the Te1-Te1 excluding electrostatic interaction interac-tion may be special. As will be discussed in Sec. III A, theinteratomic bonds in each quintuple layer are primarily thepp interactions.
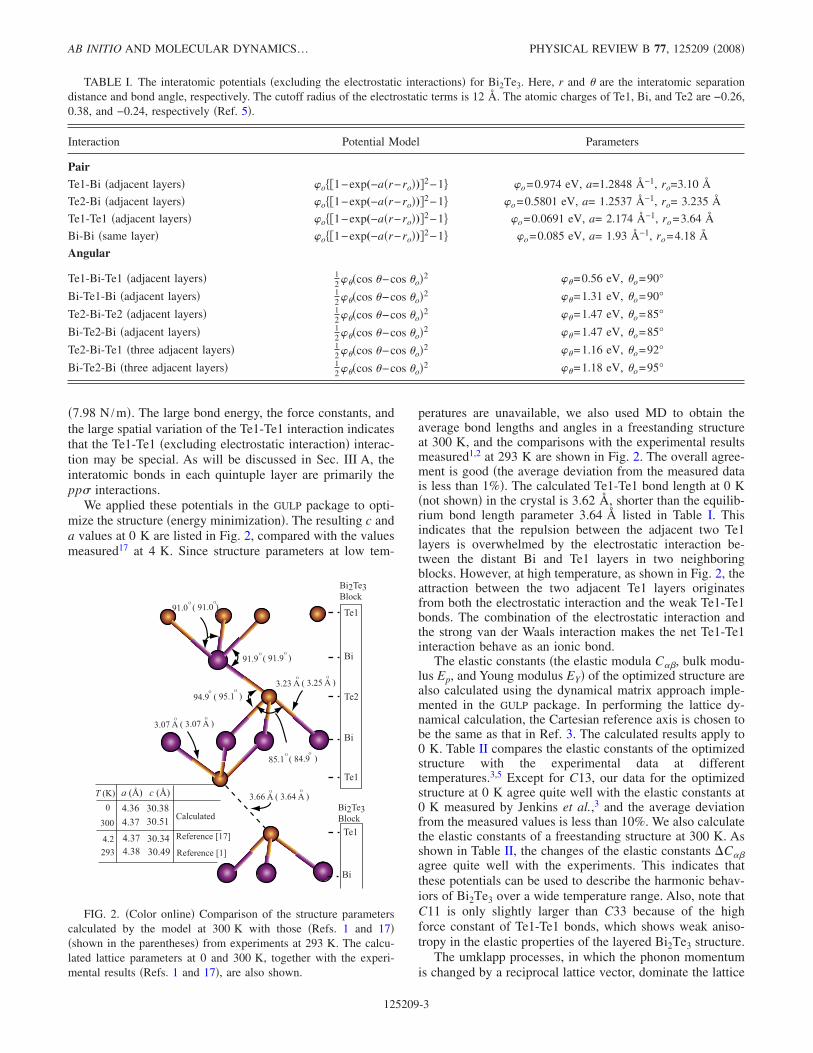
We applied these potentials in the GULP package to opti-mize the structure energy minimization. The resulting c anda values at 0 K are listed in Fig. 2, compared with the valuesmeasured17 at 4 K. Since structure parameters at low tem-
peratures are unavailable, we also used MD to obtain theaverage bond lengths and angles in a freestanding structureat 300 K, and the comparisons with the experimental resultsmeasured1,2 at 293 K are shown in Fig. 2. The overall agree-ment is good the average deviation from the measured datais less than 1%. The calculated Te1-Te1 bond length at 0 Knot shown in the crystal is 3.62 Å, shorter than the equilib-rium bond length parameter 3.64 Å listed in Table I. Thisindicates that the repulsion between the adjacent two Te1layers is overwhelmed by the electrostatic interaction be-tween the distant Bi and Te1 layers in two neighboringblocks. However, at high temperature, as shown in Fig. 2, theattraction between the two adjacent Te1 layers originatesfrom both the electrostatic interaction and the weak Te1-Te1bonds. The combination of the electrostatic interaction andthe strong van der Waals interaction makes the net Te1-Te1interaction behave as an ionic bond.
The elastic constants the elastic modula C, bulk modu-lus Ep, and Young modulus EY of the optimized structure arealso calculated using the dynamical matrix approach imple-mented in the GULP package. In performing the lattice dy-namical calculation, the Cartesian reference axis is chosen tobe the same as that in Ref. 3. The calculated results apply to0 K. Table II compares the elastic constants of the optimizedstructure with the experimental data at differenttemperatures.3,5 Except for C13, our data for the optimizedstructure at 0 K agree quite well with the elastic constants at0 K measured by Jenkins et al.,3 and the average deviationfrom the measured values is less than 10%. We also calculatethe elastic constants of a freestanding structure at 300 K. Asshown in Table II, the changes of the elastic constants Cagree quite well with the experiments. This indicates thatthese potentials can be used to describe the harmonic behav-iors of Bi2Te3 over a wide temperature range. Also, note thatC11 is only slightly larger than C33 because of the highforce constant of Te1-Te1 bonds, which shows weak aniso-tropy in the elastic properties of the layered Bi2Te3 structure.
The umklapp processes, in which the phonon momentumis changed by a reciprocal lattice vector, dominate the lattice
TABLE I. The interatomic potentials excluding the electrostatic interactions for Bi2Te3. Here, r and are the interatomic separationdistance and bond angle, respectively. The cutoff radius of the electrostatic terms is 12 Å. The atomic charges of Te1, Bi, and Te2 are −0.26,0.38, and −0.24, respectively Ref. 5.
Interaction Potential Model Parameters
Pair
Te1-Bi adjacent layers o1−exp(−ar−ro)2−1 o=0.974 eV, a=1.2848 Å−1, ro=3.10 Å
Te2-Bi adjacent layers o1−exp(−ar−ro)2−1 o=0.5801 eV, a= 1.2537 Å−1, ro= 3.235 Å
Te1-Te1 adjacent layers o1−exp(−ar−ro)2−1 o=0.0691 eV, a= 2.174 Å−1, ro=3.64 Å
Bi-Bi same layer o1−exp(−ar−ro)2−1 o=0.085 eV, a= 1.93 Å−1, ro=4.18 Å
Angular
Te1-Bi-Te1 adjacent layers 12cos −cos o2 =0.56 eV, o=90°
Bi-Te1-Bi adjacent layers 12cos −cos o2 =1.31 eV, o=90°
Te2-Bi-Te2 adjacent layers 12cos −cos o2 =1.47 eV, o=85°
Bi-Te2-Bi adjacent layers 12cos −cos o2 =1.47 eV, o=85°
Te2-Bi-Te1 three adjacent layers 12cos −cos o2 =1.16 eV, o=92°
Bi-Te2-Bi three adjacent layers 12cos −cos o2 =1.18 eV, o=95°
Te1
Bi
Te2
Bi
Te1
3.07 A ( 3.07 A )O O
3.23 A ( 3.25 A )O O
3.66 A ( 3.64 A )O O
91.0 ( 91.0 )O O
85.1 ( 84.9 )O O
91.9 ( 91.9 )O O
94.9 ( 95.1 )O O
Te1
Bi
4.37
Bi2Te3Block
Bi2Te3Block
a (Å)4.36 30.38
30.34
c (Å)
4.38 30.494.37
30.51
T (K)0
300
2934.2
Calculated
Reference [17]
Reference [1]
FIG. 2. Color online Comparison of the structure parameterscalculated by the model at 300 K with those Refs. 1 and 17shown in the parentheses from experiments at 293 K. The calcu-lated lattice parameters at 0 and 300 K, together with the experi-mental results Refs. 1 and 17, are also shown.
AB INITIO AND MOLECULAR DYNAMICS… PHYSICAL REVIEW B 77, 125209 2008
125209-3

thermal conductivity of crystalline materials at normal andhigh temperatures typically above 1 /3–1 /2 of the Debyetemperature. This intrinsic resistive process results from theanharmonicity of the interatomic potentials in solids. Itsstrength depends on both the available phonon phase and thephonon-phonon scattering matrix, which are, in turn, deter-mined by the harmonic force constants and anharmonicity ofthe interatomic potentials, respectively.18 Therefore, wechose the Grüneisen parameter and the linear thermal expan-sion coefficients to check the anharmonicity of the inter-atomic potentials before applying them in the thermal con-ductivity calculations.
The mode Grüneisen parameter G,,s describes the rela-tive shift of phonon frequency of the mode , s with thechange of the volume and is defined as
G,,s = −V
ss
V, 2
where the mode is denoted by the wave vector and thebranch identifier s, is the angular frequency, and V is thevolume. The overall Grüneisen parameter is defined as
G =,s,cv,s
,scv,j,
cv,s =s
V
T 1
es/kBT − 1 =
Ep
cv, 3
where cv,s is the contribution of the mode , s to thevolumetric specific heat cv, and is the volumetric thermalexpansion coefficient. To calculate the volume dependenceof the phonon frequencies in Eq. 2, we used GULP to cal-culate the volume of a hexagonal unit cell under different
hydrostatic pressures p by minimizing the enthalpy of thesystem. With the resulting structure, the phonon frequency ateach point was recalculated by diagonalizing the corre-sponding dynamical matrix a 6 6 6 mesh was used.The Grüneisen parameter was then calculated from thechanges in the phonon frequencies and listed in Table III.
The linear thermal expansion coefficient was obtainedfrom the elastic compliance coefficient Sij and from the gen-eralized Grüneisen parameters, which are defined as19
G, =,s,,s cv,s
,scv,s, G,,,s = −
1
s
s
, 4
where is a uniform areal strain along the direction. Thelinear thermal expansion coefficients of a hexagonal crystalcan be obtained from19
= S11 + S12 + S13 cv, 5
= 2S13 + S33 cv. 6
The corresponding volumetric thermal expansion coefficient is
= 2 + . 7
The calculated results and those from experiments at T=300 K are also listed in Table III.
From Table III, the calculated anharmonic propertiesagree well with the experimental results. Therefore, wewould expect this set of interatomic potentials to provide areasonable prediction for the lattice thermal conductivities.
Since Bi2Te3 is a highly anisotropic layered structure, tocharacterize the anharmonicities along different polariza-tions, similar to Eq. 3, we can also define a polarized Grü-neisen parameter,
TABLE II. Comparison of the calculated elastic modula C, bulk modulus Ep, and in-plane Youngmodulus EY in GPa with experimental results Refs. 3 and 5.
C11 C13 C14 C33 C44 C66 Ep EY
Ultrasonic experiment 280 Ka 68.5 27.0 13.3 47.7 27.4 23.4 37.4 54.2
Ultrasonic experiment 0 Ka 74.4 29.2 15.4 51.6 29.2 26.2 39.5b
Neutron scattering experiment 77 K5 76.3 13.2 51.2 30.9 9.9
This study 0 K 69.0 21.6 12.3 54.8 28.8 26.7 34.4 52.5
This study 300 K 65.4 19.0 10.9 50.7 26.5 25.7 31.6 51.4
aReference 3.bcalculated through the bulk modulus relation in Ref. 3.
TABLE III. Comparison of the calculated Grüneisen parameters and thermal expansion coefficients, atT=293 K, with the experimental results Refs. 1, 3, and 20.
Parameter G G, G,
10−6 /K
10−6 /K
10−6 /K
Experiment 1.493 48.0,a 44.0b 12.9,a 13.0b 22.2,a 18.0b
Calculation 1.40 1.17 1.86 46.8 12.9 21.0
aReference 1.bReference 20.
BAO-LING HUANG AND MASSOUD KAVIANY PHYSICAL REVIEW B 77, 125209 2008
125209-4

G, =3Ep
cv, 8
which measures the anharmonicity along the direction andequates to G if the structure is isotropic G=G, /3.Table III shows that the in-plane Grüneisen parameter G, isclose to the G value of an ideal covalent material21 and ismuch smaller than the cross-plane Grüneisen parameter
G,, indicating that the in-plane anharmonic scattering ismuch weaker than the cross-plane anharmonic scattering.The calculated G,, however, is a typical value of an ionicmaterial, which confirms the conclusion about the Te1-Te1ioniclike mixed bond.
B. Lattice vibrations
To further investigate the lattice vibrations of Bi2Te3, wealso used the MD simulations to calculate the normalizedtotal phonon density of states DOS Fig. 3a together withthe atomic partial phonon density of states PDOS Fig. 4.The normalized PDOS of the th species in the direction,D
p,,* , is determined by taking the Fourier transform of the
velocity autocorrelation function 1800 ps raw velocity datawere used in the autocorrelation calculation,22,23
Dp,,* =
exp− itu,tu,0 dt
exp− itui,,tui,,0 dtd, 9
where u, denotes the velocity of an atom of the th speciesin the direction.
The normalized total phonon DOS is obtained by sum-ming over the normalized partial DOS weighted with thespecies concentration c,
Dp* =
,cD
p,,* . 10
To obtain the DOS and PDOS, the MD simulations wererun at 300 K, and 1800 ps raw velocity data were used in the
f (THz)
NormalizedPhononDensityofStates
0 1 2 3 4 50.0
0.3
0.6
0.9
1.2
Current workDOS from Reference [3]DOS from Reference [24]
Bi2Te3
FIG. 3. Color online Predicted variation of the normalizedphonon DOS for Bi2Te3 with respcet to frequency, and the compari-son with the available DOS Refs. 3 and 24.
In plane
Cross plane
Te1Te2Bi
Te1Te2Bi
f (THz)0 1 2 3 4 5
NormalizedPhononDensityofStates
Total In planeCross plane
Te1
Bi
Te2
Bi
Te1
0.087 Å
0.087 Å
0.099 Å
0.099 Å
0.089 Å
0.089 Å
0.11 Å
0.094 Å
0.11 Å
0.094 Å
(a) (b)
Bi2Te3
a ()
c ()
FIG. 4. Color online a Predicted variation of the directional phonon DOS for Bi2Te3 with respect to frequency. b Root mean squareof the displacement for various atoms in Bi2Te3.
AB INITIO AND MOLECULAR DYNAMICS… PHYSICAL REVIEW B 77, 125209 2008
125209-5
calculation for the autocorrelation function. The obtained to-tal phonon DOS is shown in Fig. 3. The generalized phonondensity of states G measured at 77 K by Rauh et al.24
using the inelastic neutron scattering and that calculated byJenkins et al.3 with the assumed Born–von Karman modelare also shown in Fig. 3. Note that the G measured byRauh et al.24 is not the conventional DOS because the differ-ence of the weight factors is significant for Bi and Te. Thecutoff frequency calculated by the MD simulation is4.7 THz, larger than the value of 4.3 THz calculated by Jen-kins et al.3 but agreeing well with the value of 4.7 THz mea-sured by Rauh et al.24 and of 4.55 THz measured by Kull-mann et al.5 Overall, our DOS results agree fairly well withthat of Jenkins et al.3 In our DOS results, there is a gapbetween 2.5 and 2.9 THz, which is mainly determined by theweak Te1-Te1 bond and the Te2-Bi bond. Neither our modelnor that of Jenkins et al.3 can reproduce the transversaleigenmode around 1.0 THz. This may be due to the simplenature of the “rigid-ion” model since the high polarizabilityof Te and Bi may significantly influence the dispersion be-havior of the transverse optical mode. A suitable core-shellmodel may account for this problem, which will be investi-gated in the future.
Figure 4a shows the normalized in-plane and cross-plane phonon DOSs of the entire Bi2Te3 structure and thoseof the different species. Overall, the in-plane and cross-planephonon DOSs almost overlap, especially when f 3 THz,and the difference only lies in the high-frequency regimef 3 THz, where the cross-plane spectrum seems to shift alittle toward a relative higher frequency regime. This roughidentity indicates that there is only a minor difference be-tween the in-plane and cross-plane vibration spectra, whichis consistent with the fact that C11 differs only slightly fromC33. The in-plane and cross-plane PDOSs of the differentspecies provide more details about the lattice vibration.When f 1.5 THz, where acoustic vibrations dominate, thethree PDOSs for both directions are almost the same. The Biatoms have more modes in the low-frequency regime f2.6 THz of the PDOS for both directions, but less modesin the high-frequency regime f 3 THz than those of theTe1 and Te2 atoms. This is due to their larger mass. Overall,the in-plane PDOSs of Te1 and Bi match each other quitewell, and the difference only exists in a narrow frequencyregime 2.8 THz f 3.6 THz. This is believed to directlyresult from the strong Te1-Bi bonds. However, most in-planevibration modes of Te2 atoms concentrate in the high-frequency regime 2.8 THz f 4.6 THz. The in-plane vi-bration spectrum of Te1 shows strong peaks between 2.8 and3.6 THz, where Te1 and Bi have much less vibration modes.Te2 also has much less vibration modes than Bi and Te1atoms in the regime between 1.5 and 2.6 THz. All theseshow that the correlation between the in-plane optical vibra-tions of Te2 and Bi /Te1 is weak, while the correlation be-tween the in-plane vibrations of Bi and Te1 is strong. Thismay be due to the relatively weak Bi-Te2 bonds comparedwith Bi-Te1 bonds and the symmetric position of Te2 atomsin the five-layer sandwich structure. Similarly, the cross-plane PDOS of Te2 atoms mainly focuses on the high-frequency regime f 2.8 THz. There are strong peaks be-
tween 3 and 3.6 THz in the cross-plane PDOS of Te2, butthose peaks are rather weak in the PDOS of Te1 and Bi,indicating the energy localization of those modes. Also, thereare large differences among the cross-plane PDOSs of neigh-boring Te1 /Bi and Bi /Te2 layers, suggesting that phonontransporting across the planes will suffer from strong scatter-ing. Those strong scatterings are mainly due to the massdifference and the large variation in is the productof the force constant and the bond-scaling parameter inthe neighboring bonds.21 Figure 4b shows the root meansquare rms displacement of atoms. The rms’ of the Te2atoms are isotropic, while the Bi atoms have the largestcross-plane rms and the Te1 atoms have the largest in-planerms.
C. Molecular dynamics simulation procedure and GKautocorrelation
The thermal conductivity limited by the phonon-phononscattering Kp is determined using the GK approach, in whichthe thermal conductivity is related to the decay of the heatcurrent autocorrelation function HCACF. The thermal con-ductivity Kp tensor is given by
Kp =1
kBVT20
wtw0 , 11
where kB is the Boltzmann constant, V is the volume of thesimulation system, T is the system temperature, andwt · w0 is the HCACF. A slow-decaying HCACF indi-cates that the heat current fluctuations can spread over a longtime before vanishing, i.e., a long phonon relaxation time.The heat current w is defined as
w =d
dti=1
N
riEi, 12
where r and E are the position vector and the energy of aparticle atom excluding the site energy, respectively.
The MD simulations were performed with a system con-sisting of 6 6 1 hexagonal unit cells and involving 540atoms. The simulations with larger systems produced verysimilar results. The temperatures considered were from100 to 400 K, with an interval of 50 K. The time step waschosen as 10 fs. The Verlet leapfrog algorithm was adoptedfor the calculation, while the Nose-Hoover thermostat andthe Berendsen barostat were used to control the system tem-perature and pressure. The system was first simulated in anNPT constant number of atoms, pressure, and temperatureensemble for 100–200 ps until it reached a freestanding stateat the desired temperature; then, it was switched into an NVEensemble and ran for 200 ps to arrive in equilibrium. At eachtemperature point, 1700 ps raw heat current data were ob-tained for the calculation of HCACFs. After calculatingHCACF, the direct integration method is used to obtain thethermal conductivity. The integral is averaged to smooth thebehavior in a converged region. The final result is the aver-age value over the converged region.
To speed up the calculations, the Wolf method25 wasadopted for the calculation of the long-range electrostatic
BAO-LING HUANG AND MASSOUD KAVIANY PHYSICAL REVIEW B 77, 125209 2008
125209-6
interactions. The decay parameter is chosen to be0.25 Å−1, and the cutoff radius Rc is chosen to be 10 Å.
D. Phonon conductivities and its decomposition
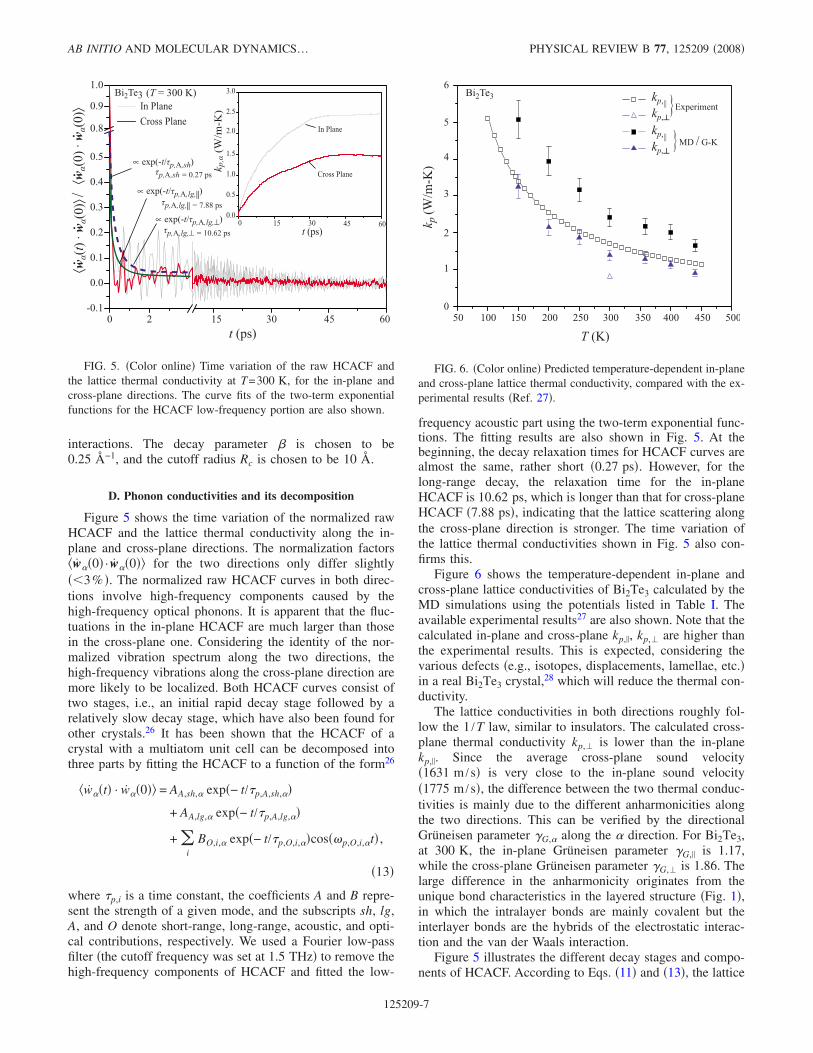
Figure 5 shows the time variation of the normalized rawHCACF and the lattice thermal conductivity along the in-plane and cross-plane directions. The normalization factorsw0 · w0 for the two directions only differ slightly3% . The normalized raw HCACF curves in both direc-tions involve high-frequency components caused by thehigh-frequency optical phonons. It is apparent that the fluc-tuations in the in-plane HCACF are much larger than thosein the cross-plane one. Considering the identity of the nor-malized vibration spectrum along the two directions, thehigh-frequency vibrations along the cross-plane direction aremore likely to be localized. Both HCACF curves consist oftwo stages, i.e., an initial rapid decay stage followed by arelatively slow decay stage, which have also been found forother crystals.26 It has been shown that the HCACF of acrystal with a multiatom unit cell can be decomposed intothree parts by fitting the HCACF to a function of the form26
wt · w0 = AA,sh, exp− t/p,A,sh,
+ AA,lg, exp− t/p,A,lg,
+ i
BO,i, exp− t/p,O,i,cosp,O,i,t ,
13
where p,i is a time constant, the coefficients A and B repre-sent the strength of a given mode, and the subscripts sh, lg,A, and O denote short-range, long-range, acoustic, and opti-cal contributions, respectively. We used a Fourier low-passfilter the cutoff frequency was set at 1.5 THz to remove thehigh-frequency components of HCACF and fitted the low-
frequency acoustic part using the two-term exponential func-tions. The fitting results are also shown in Fig. 5. At thebeginning, the decay relaxation times for HCACF curves arealmost the same, rather short 0.27 ps. However, for thelong-range decay, the relaxation time for the in-planeHCACF is 10.62 ps, which is longer than that for cross-planeHCACF 7.88 ps, indicating that the lattice scattering alongthe cross-plane direction is stronger. The time variation ofthe lattice thermal conductivities shown in Fig. 5 also con-firms this.
Figure 6 shows the temperature-dependent in-plane andcross-plane lattice conductivities of Bi2Te3 calculated by theMD simulations using the potentials listed in Table I. Theavailable experimental results27 are also shown. Note that thecalculated in-plane and cross-plane kp,, kp, are higher thanthe experimental results. This is expected, considering thevarious defects e.g., isotopes, displacements, lamellae, etc.in a real Bi2Te3 crystal,28 which will reduce the thermal con-ductivity.
The lattice conductivities in both directions roughly fol-low the 1 /T law, similar to insulators. The calculated cross-plane thermal conductivity kp, is lower than the in-planekp,. Since the average cross-plane sound velocity1631 m /s is very close to the in-plane sound velocity1775 m /s, the difference between the two thermal conduc-tivities is mainly due to the different anharmonicities alongthe two directions. This can be verified by the directionalGrüneisen parameter G, along the direction. For Bi2Te3,at 300 K, the in-plane Grüneisen parameter G, is 1.17,while the cross-plane Grüneisen parameter G, is 1.86. Thelarge difference in the anharmonicity originates from theunique bond characteristics in the layered structure Fig. 1,in which the intralayer bonds are mainly covalent but theinterlayer bonds are the hybrids of the electrostatic interac-tion and the van der Waals interaction.
Figure 5 illustrates the different decay stages and compo-nents of HCACF. According to Eqs. 11 and 13, the lattice
t (ps)0 15 30 45 60
⟨wα(t)·w
α(0)
⟩/• ⟨wα(0)·w
α(0)
⟩•
••
0 15 30 45 600.0
3.0
2.5
2.0
1.5
1.0
0.5
k p,α(W/m-K)
t (ps)
In Plane
Cross Plane
Cross PlaneIn Plane
Bi2Te3 (T = 300 K)1.0
0.9
0.8
-0.1
0.0
0.1
0.2
0.3
0.4
0.5
2
∝ exp(-t/τp,A,sh)
∝ exp(-t/τp,A,lg,||)
∝ exp(-t/τp,A,lg,⊥)
τp,A,sh = 0.27 ps
τp,A,lg,|| = 7.88 ps
τp,A,lg,⊥ = 10.62 ps
FIG. 5. Color online Time variation of the raw HCACF andthe lattice thermal conductivity at T=300 K, for the in-plane andcross-plane directions. The curve fits of the two-term exponentialfunctions for the HCACF low-frequency portion are also shown.
kp,
kp,||
T (K)
k p(W
/m-K
)
50 100 150 200 250 300 350 400 450 500
6
5
4
3
2
1
0
kp,
kp,|| MD / G-K
ExperimentBi2Te3
FIG. 6. Color online Predicted temperature-dependent in-planeand cross-plane lattice thermal conductivity, compared with the ex-perimental results Ref. 27.
AB INITIO AND MOLECULAR DYNAMICS… PHYSICAL REVIEW B 77, 125209 2008
125209-7
thermal conductivity Kp can then be decomposed into threeparts as
Kp = Kp,A,sh + Kp,A,lg + Kp,O. 14
Here, Kp,lg,A is believed to be the contribution from the long-range acoustic phonons, with a mean-free path larger thanone-half of their wavelengths; Kp,sh,A is the contribution fromthe short-range phonons, with their mean-free pathsminimized26,29 Kaburaki et al.30 attributed it to single-particle motions in a local environment, and Kp,O is thecontribution from the high-frequency optical phonons. Weobtained Kp,sh,A and Kp,lg,A by fitting the low-frequency partof HCACF with the two-term exponential functions shownin Eq. 13 and obtained Kp,O by directly integrating thehigh-frequency part of HCACF. The Fourier low-pass andhigh-pass filters were used to separate the different compo-nents. Further details about the decomposition can be foundelsewhere.26,29
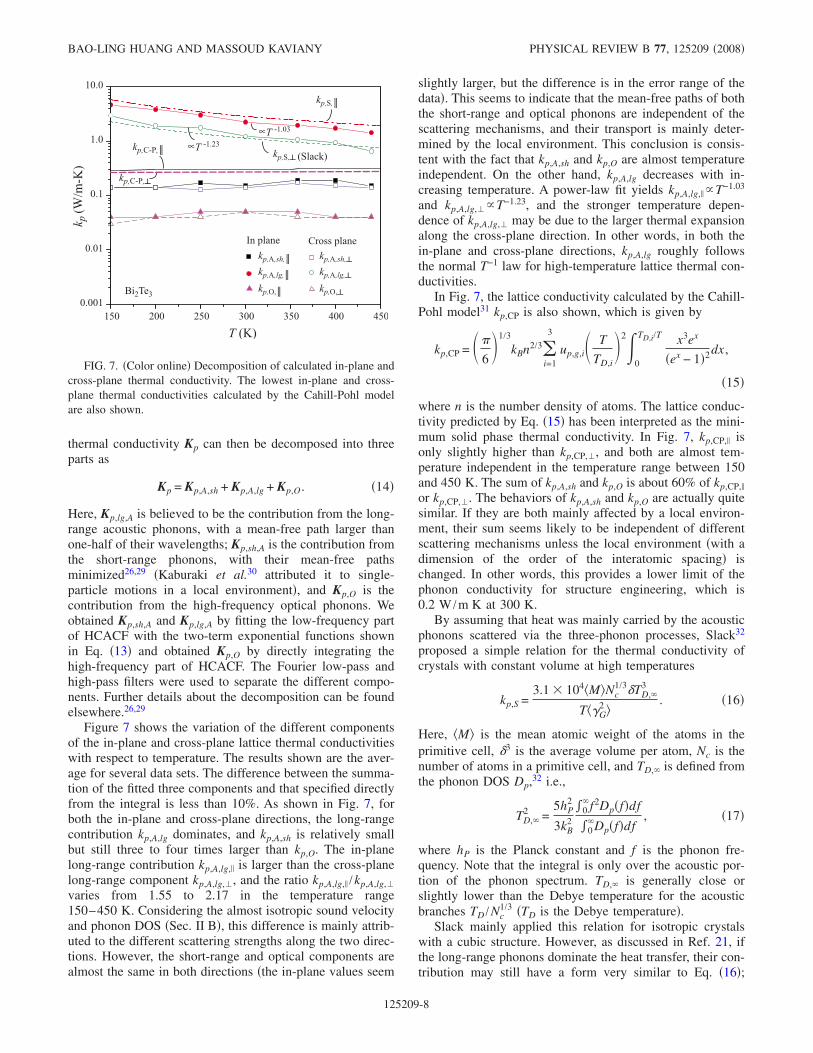
Figure 7 shows the variation of the different componentsof the in-plane and cross-plane lattice thermal conductivitieswith respect to temperature. The results shown are the aver-age for several data sets. The difference between the summa-tion of the fitted three components and that specified directlyfrom the integral is less than 10%. As shown in Fig. 7, forboth the in-plane and cross-plane directions, the long-rangecontribution kp,A,lg dominates, and kp,A,sh is relatively smallbut still three to four times larger than kp,O. The in-planelong-range contribution kp,A,lg, is larger than the cross-planelong-range component kp,A,lg,, and the ratio kp,A,lg, /kp,A,lg,varies from 1.55 to 2.17 in the temperature range150–450 K. Considering the almost isotropic sound velocityand phonon DOS Sec. II B, this difference is mainly attrib-uted to the different scattering strengths along the two direc-tions. However, the short-range and optical components arealmost the same in both directions the in-plane values seem
slightly larger, but the difference is in the error range of thedata. This seems to indicate that the mean-free paths of boththe short-range and optical phonons are independent of thescattering mechanisms, and their transport is mainly deter-mined by the local environment. This conclusion is consis-tent with the fact that kp,A,sh and kp,O are almost temperatureindependent. On the other hand, kp,A,lg decreases with in-creasing temperature. A power-law fit yields kp,A,lg, T−1.03
and kp,A,lg,T−1.23, and the stronger temperature depen-dence of kp,A,lg, may be due to the larger thermal expansionalong the cross-plane direction. In other words, in both thein-plane and cross-plane directions, kp,A,lg roughly followsthe normal T−1 law for high-temperature lattice thermal con-ductivities.
In Fig. 7, the lattice conductivity calculated by the Cahill-Pohl model31 kp,CP is also shown, which is given by
kp,CP =
61/3
kBn2/3i=1
3
up,g,i T
TD,i2
0
TD,i/T x3ex
ex − 12dx ,
15
where n is the number density of atoms. The lattice conduc-tivity predicted by Eq. 15 has been interpreted as the mini-mum solid phase thermal conductivity. In Fig. 7, kp,CP, isonly slightly higher than kp,CP,, and both are almost tem-perature independent in the temperature range between 150and 450 K. The sum of kp,A,sh and kp,O is about 60% of kp,CP,
or kp,CP,. The behaviors of kp,A,sh and kp,O are actually quitesimilar. If they are both mainly affected by a local environ-ment, their sum seems likely to be independent of differentscattering mechanisms unless the local environment with adimension of the order of the interatomic spacing ischanged. In other words, this provides a lower limit of thephonon conductivity for structure engineering, which is0.2 W /m K at 300 K.
By assuming that heat was mainly carried by the acousticphonons scattered via the three-phonon processes, Slack32
proposed a simple relation for the thermal conductivity ofcrystals with constant volume at high temperatures
kp,S =3.1 104M Nc
1/3TD,3
TG2
. 16
Here, M is the mean atomic weight of the atoms in theprimitive cell, 3 is the average volume per atom, Nc is thenumber of atoms in a primitive cell, and TD, is defined fromthe phonon DOS Dp,32 i.e.,
TD,2 =
5hP2
3kB2
0f2Dpfdf
0Dpfdf
, 17
where hP is the Planck constant and f is the phonon fre-quency. Note that the integral is only over the acoustic por-tion of the phonon spectrum. TD, is generally close orslightly lower than the Debye temperature for the acousticbranches TD /Nc
1/3 TD is the Debye temperature.Slack mainly applied this relation for isotropic crystals
with a cubic structure. However, as discussed in Ref. 21, ifthe long-range phonons dominate the heat transfer, their con-tribution may still have a form very similar to Eq. 16;
150 200 250 300 350 400 4500.001
0.01
0.1
1.0
10.0
In plane Cross planekp,A,sh,kp,A,lg,kp,O,
kp,A,sh,kp,A,lg,kp,O,
kp,C-P,
∝T -1.03
∝T -1.23
kp,S,
kp,S, (Slack)
T (K)
k p(W
/m-K
)
kp,C-P,
Bi2Te3
FIG. 7. Color online Decomposition of calculated in-plane andcross-plane thermal conductivity. The lowest in-plane and cross-plane thermal conductivities calculated by the Cahill-Pohl modelare also shown.
BAO-LING HUANG AND MASSOUD KAVIANY PHYSICAL REVIEW B 77, 125209 2008
125209-8

therefore, it is possible to modify this relation and apply itfor anisotropic crystals. Assuming that the scattering ofphonons along the direction is only related to the elasticand anharmonic properties along this direction, that is, thetransport of phonons along this direction is similar to thetransport in an isotropic structure with the same elastic andanharmonic properties, then we extended Eq. 16 as
kp,S, =3.1 104M Nc
1/3TD,,3
TG,2 , = or . 18
Here, TD,, is given by Eq. 17 while replacing Dp withDp,. As discussed in Sec. II B, the total in-plane andcross-plane PDOSs are almost the same, and the calculationaccording to Eq. 17 provides TD,, =76 K and TD,,=75 K. Using G, =1.17 and G,=1.86 calculated in Sec.II A, the in-plane and cross-plane long-range componentsdenoted as kp,A,lg, Slack and kp,A,lg, Slack were calcu-lated by Eq. 18 and are also shown in Fig. 7. Overall, theseresults are in reasonable agreement with those decomposedfrom the MD simulations in both directions the average de-viations from the MD results are within 30% for kp,A,lg, and20% for kp,A,lg,.
E. Role of phonon-electron scattering in phonon conductivity
In semiconductors, phonons are scattered by grain bound-ary, defects, other phonons, and carriers. According to theMatthiessen rule, the total thermal resisitivity can be repre-sented as
1
kp=
1
kp,b+
1
kp,d+
1
kp,U+
1
kp,c, 19
where kp,b, kp,d, kp,U, and kp,c are the thermal conductivitylimited by the scattering of grain boundary, defects, phonon-phonon U process, and carriers, respectively.
The thermal conductivity limited by phonon-carrier scat-tering kp,c can be estimated using the electrical resistivity e.Their relations have been derived by ignoring the differencebetween the N and U processes between carriers andphonons,33,34 as in
1
kp,c=
A
NLTTD
TI5
2ze2
27I42 , 20
e = A T
TD5
I5, 21
where
In = 0
TD/T xnex
ex − 12dx . 22
In the above relations, ze is the number of free electrons peratom, NL the Lorenz constant, and A is a constant for metals,A=3.7. Then, we have
1
kp,c=
e
NLT
TD/T6
27I42 2ze
2. 23
When T /TD increases from 0.1 to 10, TD /T6 / I4TD /T2 de-creases from 97 to 9. Also, for a normal dopant concentration1019 cm−3, ze is of the order of 10−3. Then, for a widetemperature range 0.1T /TD10, 1 /kp,c is only about10−4 of the electrical thermal resistivity 1 /ke found from theWiedemann-Franz law; therefore, it is negligible for mostsemiconductors including Bi2Te3.
III. PREDICTION OF ELECTRONIC PROPERTIES
The thermoelectric transport properties can be derivedfrom BTE with the relaxation time approximation. The gen-eral form of the relations for TE properties is35
e,Ee =1
Ni,
ec2e,i,ui,ui,
Ee − Ee,i,dEe
,
e, =1
V e,Ee−
fT;EeEe
dEe,
v =1
ecTV e,EeEe − −
fT;EeEe
dEe,
S, = e−1 jve,j
ko =
1
ec2TV
e,EeEe − 2−fT;Ee
EedEe,
ke, = ko − Tvje
−1ljvl, 24
where S is the Seebeck coefficient, e is the electrical con-ductivity, ke is the electrical thermal conductivity, i is theband index, e is the relaxation time, ec is the charge ofelectron, is the wave vector, u is the group velocity, f= eEe−/kBT+1−1 is the equilibrium Fermi-Dirac distribu-tion function, is the chemical potential, and Ee is the totalenergy of electron. Accordingly, the band structure Eei ,,chemical potential , and relaxation times e are requiredinputs for the electronic property calculations.
A. Electronic band structure of Bi2Te3
The band structure calculation for Bi2Te3 was carried outin the DFT framework. The WIEN2K Program,36 which em-ploys the full potential, linearized augmented plane-waveand local orbital methods, was chosen for this investigation.The GGA as proposed by Perdew et al.37 was used for theexchange and correlation potential. The experimental rhom-bohedral cell parameters of a=10.48 Å and 24.16° and theatomic parameters1,2 u=0.4001 and v=0.2095 at T=300 Kwere used in the calculations. The radii of both Bi and Teatoms were set at 2.8 a.u. An R ·max value of 9 and a Gmaxvalue of 14 were adopted, and a nonshifted mesh with10 000 points were used. The energy cutoff between the
AB INITIO AND MOLECULAR DYNAMICS… PHYSICAL REVIEW B 77, 125209 2008
125209-9

core and valence states was set at −6 Ry. Because of thesignificant spin-orbit SO effects on the band structure ofBi2Te3, the eigenstates below 10 Ry were considered in theSO calculations. As suggested by Larson,38 the p1/2 correc-tions may significantly affect the band structure; therefore,the p1/2 corrections have also been considered for the Bi 6pand Te 5p states.
The calculated band structures along some high-symmetrylines is plotted in Fig. 8. The solid and dash lines show theresults with and without the p1/2 corrections, respectively.When the p1/2 corrections are not included, our results areconsistent with the results of Scheidemantel et al.10 The bandgap is evaluated as Ee,g=0.13 eV Scheidemantel et al.10
reported Ee,g=0.11 eV, which is slightly smaller than thezero-temperature experimental results4 0.16 eV. The bandedges were found in the mirror plane and off the high-symmetry lines, yielding six highest valence bands and sixlowest conduction bands LCBs. The conduction band edge
CBE is found at 0.667, 0.571, 0.571, close to those ofprevious investigations.10,39,40 The secondary LCB edge isfound at 0.238, 0.238, 0.238 with a 10 meV higher energy.The valence band edge VBE is also found at 0.667, 0.571,0.571, the same position of the LCB edge. This result isclose to 0.652, 0.579, 0.579 reported by Scheidemantel etal.,10 but different from 0.546, 0.383, 0.383 found by Younand Freeman39 and 0.555, 0.397, 0.397 by Kim et al.40
These comparisons are listed in Table IV.As shown in Fig. 8, the addition of p1/2 lowers the CBE
but elevates the VBE, resulting in a decrease in Ee,g from0.13 to 0.07 eV. The positions of the band edges are still offthe high-symmetry lines. The CBE remains at the same po-sition 0.667, 0.571, 0.571, but VBE shifts to 0.571, 0.571,0.429. Figure 8 also illustrates this shift.
The effective masses of electrons and holes for a singlevalley near the band edge m
i,e,o* = m
i,e,o,xx* m
i,e,o,yy* m
i,e,o,zz* 1/3
i=e ,h, where mi,e,o,kl* −1
=−22Ee /kl, were calculatedby choosing a small region around the band extrema. Asshown in Table IV, the addition of the p1/2 corrections sig-nificantly reduces m
e,e,o* and m
h,e,o* . Figure 9a also shows
that the addition of the p1/2 corrections lowers the slope ofthe electron density of states near the band edge. The bandstructure without the p1/2 corrections seems to agree betterwith the experiments.4,8,9
The total electron density of states De with and withoutthe p1/2 corrections are shown in Fig. 9a. It is apparent thatDe of both the valence bands and conduction bands are non-parabolic. However, we find that the Kane band structuremodel,41 with Ee,g and m
i,e,o* calculated from WIEN2K listed
in Table IV, gives a good approximation for De near boththe conduction and valence band edges.
Many semiconductors with narrow band gap exhibit sig-nificant nonparabolicity of their energy bands. The two-bandKane model,41 which has been used successfully to describemany real narrow gap materials,7 was adopted to account fortheoretical calculations of transport coefficients. The Kanemodel assumes that the band extrema for the conduction andvalence bands are located at the same point. The energyseparation from other bands is greater than the main energygap, and the momentum operator has nonzero matrix ele-ments between the states corresponding to the extremalpoints.42 The dispersion relation of the bands of a valley is ofthe form
Bi2Te3
a Г Z F L
EF
E e(eV)
0.0
1.0
2.0
-1.0
-2.0
FIG. 8. Color online Electronic band structure of Bi2Te3 alongthe high-symmetry lines with spin-orbit coupling. The solid anddashed lines are for the results with and without the p1/2 correctionsincluded.
TABLE IV. Comparison of the calculated CBE, VBE, and the corresponding effective masses mi,e,o*
= mi,e,o,xx* m
i,e,o,yy* m
i,e,o,zz* 1/3 at the band edges, with the available results Refs. 10 and 38–40.
ReferenceEe,g
eV CBE VBE me,e,o* m
h,e,o*
Youn and Freeman Ref. 39 0.06 0.663, 0.568, 0.568 0.546, 0.383, 0.383Larson Ref. 38 0.05 0.381, 0.5, 0.5 0.546, 0.383, 0.383Scheidemantel et al. Ref. 10. 0.11 0.663, 0.568, 0.568 0.652, 0.579, 0.579Kim et al. Ref. 40 0.154 0.646, 0.549, 0.549 0.555, 0.397, 0.397 0.07 0.11
Experiment Refs. 4, 8, and 9 0.16 0.07 0.09
This study no p1/2 correction 0.13 0.667, 0.571, 0.571 0.667, 0.571, 0.571 0.06 0.08
This study with p1/2 correction 0.07 0.667, 0.571, 0.571 0.571, 0.571, 0.429 0.02 0.03
BAO-LING HUANG AND MASSOUD KAVIANY PHYSICAL REVIEW B 77, 125209 2008
125209-10

Ee1 +Ee
Ee,g =
22
2mi,e,o, 25
where mi,e,o is the density of state effective mass at the bandedge, Ee,g is the energy gap, and is the wave vector. Notethat here Ee is measured from the band edge. Then, the den-sity of states De can be explicitly written as
DeE =21/2Nme,e,o
3/2
23 Ee1/21 +
Ee
Ee,g1/21 + 2
Ee
Ee,g .
26
Here, N is the multiplicity of the valleys. However, forBi2Te3, it is De calculated by the Kane model using N=12instead of N=6 that can match the results near the band edgefrom WIEN2K shown in Fig. 9a. This is believed to resultfrom the secondary band edges, of which the energy onlyslightly differs from that of the band edges. This also leads tothe total effective masses me,e=N2/3me,e,o=0.31me and mh,e=0.42me me is the mass of a free electron, which agree wellwith me,e=0.32me and mh,e=0.46me measured by Harman etal.43 Also note that the energy regime in which the Kanemodel can provide a good approximation for De is within
0.1 eV around the band edges. Since only the states with anenergy within 3kBT about the chemical potential are impor-tant for the transport properties, the Kane model is believedto be a good approximation for De over a wide temperaturerange.
The total density of states without the p1/2 corrections foreach species a product of the partial De of each species andits multiplicity is shown in Fig. 9b. For a comparison ofthe contributions of different orbitals, the orbital-decomposed De without the p1/2 corrections are also shownin Fig. 9c.
As shown in Fig. 9b, for the valence bands, Te1 atomscontribute the most to the electronic density of states De nearthe band edge, while the contributions from Bi and Te2 at-oms are less and nearly the same. This indicates that the Te1atoms are probably going to lose electrons and be a donor inthe structure. In contrast, for the conduction bands, the Biatoms contribute the most to the density of states near theband edge, indicating that they are probably going to receivean electron and be an acceptor. Note that the contributionsfrom Te1 atoms are only slightly less than those from the Biatoms. This is consistent with the slightly ioniclike bond be-tween the Bi and Te1 atoms. Te2 atoms contribute the least to
Ee (eV)-2 0 2 64-4-6-8-10
De,β
βBiTe2Te1
0
1
2
3
4
5
(a)
(b)
Ee (eV)-2 0 2 64-4-6-8
(c)
-10
Te1
Te2
Bi
sp
sp
De,β,l
0.0
0.3
0.6
0.9
0.0
0.2
0.4
0.6
0.8
0.0
0.25
0.5
0.75
Ee (eV)-3 -2 -1 0 1 3-4 2
De
0
1
2
3
4
5
6
Bi2Te3
p1/2 correctionNo p1/2 correction
-0.2 -0.1 0.0 0.1 0.20
0.3
0.6
0.9
Ee (eV)
0.07 eV
0.13 eV
Kane model, N =12
sp
FIG. 9. Color online a Dimensionless electronic density of states De of Bi2Te3 with and without the p1/2 corrections. The inset is forthe band edge; also shown is De calculated by the Kane model. b Total De, for individual species partial De of each species times itsmultiplicity. c Decomposed, partial De,,l for each species.
AB INITIO AND MOLECULAR DYNAMICS… PHYSICAL REVIEW B 77, 125209 2008
125209-11
the density of states at both the valence and conduction bandedges, indicating that they are relatively inert in determiningthe electronic transport properties of Bi2Te3. Figure 9cshows that for Te1 and Te2 atoms, p-type orbitals predomi-nate in both valence and conduction bands. Bi atoms, how-ever, have a strong s+ p orbital contribution at the valenceband edge, but the wave function at the conduction bandedge is mainly p type. Considering the layer sequence Te1-Bi-Te2-Bi-Te1, it seems that the bonds between the nearest-neighboring atoms in each quintuple layer are primarily thepp interactions, as suggested by Mishra et al.44
B. Chemical potential
In a thermal equilibrium system, chemical potential isan essential parameter to describe the equilibrium distribu-tion of carriers and their concentrations. All the electronictransport coefficients, in fact, are functions of the band struc-ture Ee, , and temperature.
Generally, can be determined from
nd,h − nd,e = nh + nh,b − ne − ne,b, 27
where nd,h and nd,e are the concentrations of acceptors anddonors, nh is the hole concentration, nh,b is the concentrationof holes bound on the acceptors, ne is the electron concen-tration, and ne,b is the concentration of electrons bound onthe donors. For modest doped semiconductors, nh,b and ne,bare normally negligible at normal and high temperatures100 K. Therefore, we can rewrite Eq. 27 as
nd,h − nd,e = −
0
DeEe1
e−Ee/kBT + 1dEe
− Ee,g
DeEe1
eEe−/kBT + 1dEe. 28
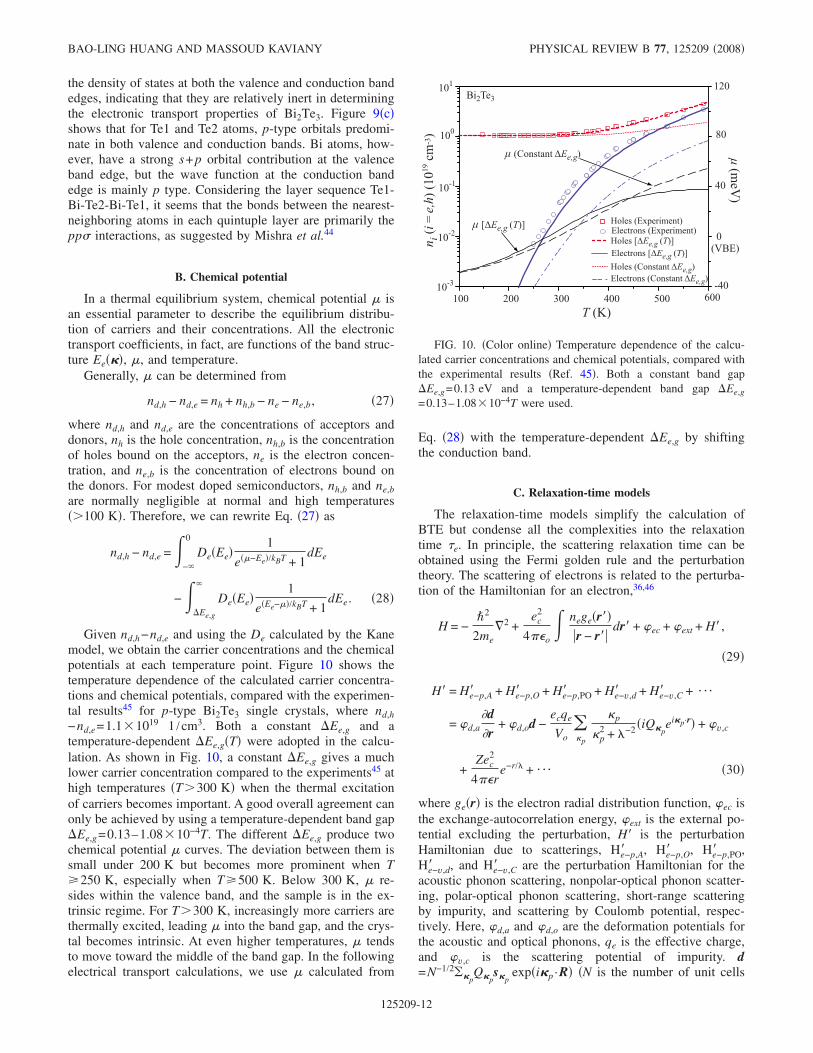
Given nd,h−nd,e and using the De calculated by the Kanemodel, we obtain the carrier concentrations and the chemicalpotentials at each temperature point. Figure 10 shows thetemperature dependence of the calculated carrier concentra-tions and chemical potentials, compared with the experimen-tal results45 for p-type Bi2Te3 single crystals, where nd,h−nd,e=1.1 1019 1 /cm3. Both a constant Ee,g and atemperature-dependent Ee,gT were adopted in the calcu-lation. As shown in Fig. 10, a constant Ee,g gives a muchlower carrier concentration compared to the experiments45 athigh temperatures T300 K when the thermal excitationof carriers becomes important. A good overall agreement canonly be achieved by using a temperature-dependent band gapEe,g=0.13–1.08 10−4T. The different Ee,g produce twochemical potential curves. The deviation between them issmall under 200 K but becomes more prominent when T250 K, especially when T500 K. Below 300 K, re-sides within the valence band, and the sample is in the ex-trinsic regime. For T300 K, increasingly more carriers arethermally excited, leading into the band gap, and the crys-tal becomes intrinsic. At even higher temperatures, tendsto move toward the middle of the band gap. In the followingelectrical transport calculations, we use calculated from
Eq. 28 with the temperature-dependent Ee,g by shiftingthe conduction band.
C. Relaxation-time models
The relaxation-time models simplify the calculation ofBTE but condense all the complexities into the relaxationtime e. In principle, the scattering relaxation time can beobtained using the Fermi golden rule and the perturbationtheory. The scattering of electrons is related to the perturba-tion of the Hamiltonian for an electron,36,46
H = −2
2me2 +
ec2
4o neger
r − rdr + ec + ext + H,
29
H = He−p,A + He−p,O + He−p,PO + He−v,d + He−v,C + ¯
= d,ad
r+ d,od −
ecqe
Vop
p
p2 + −2 iQp
eip·r + v,c
+Zec
2
4re−r/ + ¯ 30
where ger is the electron radial distribution function, ec isthe exchange-autocorrelation energy, ext is the external po-tential excluding the perturbation, H is the perturbationHamiltonian due to scatterings, He−p,A , He−p,O , He−p,PO ,He−v,d , and He−v,C are the perturbation Hamiltonian for theacoustic phonon scattering, nonpolar-optical phonon scatter-ing, polar-optical phonon scattering, short-range scatteringby impurity, and scattering by Coulomb potential, respec-tively. Here, d,a and d,o are the deformation potentials forthe acoustic and optical phonons, qe is the effective charge,and v,c is the scattering potential of impurity. d=N−1/2p
Qpsp
expip ·R N is the number of unit cells
T (K)
n i(i=e,h)
(1019
cm-3)
Bi2Te3
100 200 300 400 500 60010-3
10-2
10-1
100
101
Holes (Experiment)Electrons (Experiment)Holes [Ee,g (T)]Electrons [Ee,g (T)]
-40
0
40
80
120(meV)
(VBE)
(Constant Ee,g)
[Ee,g (T)]
Electrons (Constant Ee,g)Holes (Constant Ee,g)
FIG. 10. Color online Temperature dependence of the calcu-lated carrier concentrations and chemical potentials, compared withthe experimental results Ref. 45. Both a constant band gapEe,g=0.13 eV and a temperature-dependent band gap Ee,g
=0.13–1.08 10−4T were used.
BAO-LING HUANG AND MASSOUD KAVIANY PHYSICAL REVIEW B 77, 125209 2008
125209-12
and spis the polarization vector is the normal coordinate
form of lattice displacement, p is the phonon wave vector,Qp
is the normal coordinate, is the screening length, andZec is the effective charge of impurity.
The electron relaxation time e for mode can be repre-sented as46
1
e=
i
1
e,i= d
23 ,,i1 −g
g
fo
fo ,
31
where fo is the carrier equilibrium distribution, g= f− f
o isthe perturbation of the distribution, and ,,i is the transi-tion rate from state to by the ith scattering, which can,in turn, be given by the Fermi golden rule as46
,,i =2
Ee − EeM,,i2,
M,,i = Hi = †,rHi,rdr , 32
where Hi is the perturbation Hamiltonian for the scatteringmechanism i and ,r is the wave function for mode .The Bloch wave function corresponding to the electron wavevector can be written as
,r =1
V1/2o
CJG
CGei+G·r, 33
where V is the volume, C and C are coefficients, and thesubscripts J and G denote the different orbitals and recipro-cal lattice vectors, respectively. Therefore,
M, =1
V1/2J
J
CJ†CJ
GG
ei−−G·rHei+G·r.
34
If the wave function and the perturbation potential can beobtained from the first-principles calculation, e,i can be di-rectly determined. This calculation is very challenging, andhere we just introduce an analytical relaxation-time model,which is also based on the Fermi golden rule and incorpo-rates the nonparabolic Kane model for energy dispersion.
Five common electron scattering mechanisms are consid-ered in this work, namely, the deformation potential of theacoustic phonons e−p,A, deformation potential of the opticalphonons e−p,O, polar scattering by the optical phononse−p,PO, short-range deformation potential of vacancies e−v,d,and Coulomb potential of vacancies e−v,C. According to theMatthiessen rule, the total scattering relaxation time e isexpressed as
1
e=
1
e−p,A+
1
e−p,O+
1
e−p,PO+
1
e−v,d+
1
e−v,C. 35
Using the Kane model, the expressions for the differentscattering mechanisms are given as follows.6
i Scattering by deformation potential of acousticphonons e−p,A. The relaxation time for electrons dispersed
on the deformational potential of acoustic phonons, whenusing the Kane model of dispersion and assuming an elasticprocedure, can be given as
e−p,A =
e−p,AoEe +Ee
2
Ee,g−1/2
1 + 2Ee
Ee,g1 − A2 − B
,
A
Ee
Ee,g1 − aA
1 + 2Ee
Ee,g , aA =
d,A,v
d,A,c,
B 8
Ee
Ee,g1 +
Ee
Ee,gaA
31 + 2Ee
Ee,g2 ,
e−p,Ao 24Cl
d,a,c2 kBT2me,e,o3/2 , 36
where d,A,c is the acoustic deformation potential couplingconstant for the conduction band, Cl is the combination ofelastic constants, aA is the ratio of the acoustic deformationpotential coupling constants for the valence and conductionbands, and me,e,o is the density of state effective mass for asingle ellipsoid.
ii Scattering by deformation potential of opticalphonons e−p,O
e−p,O =
e−p,OoEe +Ee
2
Ee,g−1/2
1 + 2Ee
Ee,g1 − A2 − B
,
A
Ee
Ee,g1 − aO
1 + 2Ee
Ee,g , aO =
d,O,v
d,O,c,
B 8
Ee
Ee,g1 + Ee/Ee,gaO
31 + 2Ee
Ee,g2 ,
e−p,Oo 22a2p,O2
d,o,c2 kBT2me,e,o3/2 , 37
where a is the lattice constant, is the density, p,O is thefrequency of the optical phonons, aO is the ratio of the opti-cal deformation potential coupling constants for valence andconduction bands.
iii Scattering by polar-optical phonons e−p,PO. In asimple isotropic parabolic model, the relaxation time for po-
AB INITIO AND MOLECULAR DYNAMICS… PHYSICAL REVIEW B 77, 125209 2008
125209-13

lar longitudinal optical phonons has the form
e−p,PO−1
1
ue2
0
2
qdq , 38
where ue is the velocity of electrons. When the integral takesinto account all phonons, we have
e−p,PO =2ue
2kBTec2oe,s−1 − oe,−1
. 39
Inclusion of nonparabolicity and screening effects will leadto
e−p,PO
=
2Ee +Ee
2
Ee,g1/2
F−1
ec22me,e,o1/2kBToe,s−1 − oe,−11 + 2
Ee
Ee,g ,
F 1 − ln1 + −1 −
2Ee
Ee,g1 +
Ee
Ee,g
1 + 2Ee
Ee,g2
1 − 2 + 22 ln1 + −1 ,
2o−2, 40
where e,s and e, are the static and high-frequency relativepermitivities, is the carrier wave vector, and o is thescreening length of the optical phonons.
iv Scattering by short-range deformation potential ofvacancies e−v,d. e−v,d also has a form similar to the relax-ation time of electron-acoustic phonon scattering due to asimilar deformation potential, which is
e−v,d =
e−v,doEe +Ee
2
Ee,g−1/2
1 + 2Ee
Ee,g1 − A2 − B
,
A
Ee
Ee,g1 − av
1 + 2Ee
Ee,g , av =
v,v
v,c,
B 8
Ee
Ee,g1 + Ee/Ee,gav
31 + 2Ee
Ee,g2 ,
e−v,do 4
v,c2 me,e,o2me,e,o1/2nv, 41
where nv is the vacancy density and av is the ratio of theshort-range deformation potential coupling constants of va-cancies for valence and conduction bands.
v Scattering by Coulomb potential of vacancies e−v,C
e−v,C =
s22me,e,o1/2Ee +
Ee2
Ee,g3/2
zec22nvln1 + − /1 + 1 + 2
Ee
Ee,g ,
2v2, 42
where zec is the vacancy charge and v is the screening ra-dius of the vacancy potential and is given as
v−2 =
4ec2
sDe, = EF,
De 21/2me,e,o3/2
23 +2
Ee,g1/21 + 2
Ee,g ,
43
where De is actually the density of states at the Fermilevel.
Figure 11 shows the temperature dependence of the cal-culated average relaxation times described above. The pa-rameters used in the calculation are listed in Table V. Someparameters, e.g., the deformation potentials, are obtained byfitting the electrical conductivity with experimental results at100 K. Overall, the scatterings by acoustic and opticalphonons dominate the electrical transport of Bi2Te3. On theother hand e−v,d and e−v,C are orders of magnitudeslarger than e−p,A and e−p,O . Therefore, the scatteringsby the short-range deformation potential of vacancies andCoulomb potentials are unimportant for the electrical trans-port of Bi2Te3. Note that e−p,PO is comparable withe−p,A and e−p,O . Therefore, the polar scattering byoptical phonons is also important.
0.01
0.1
1
10⟨⟨τ e-i
⟩⟩(ps)
Bi2Te3
100 150 200 250 300 350 400
T (K)500450
⟨⟨τe-p,A⟩⟩
⟨⟨τe-p,PO⟩⟩⟨⟨τe-v,d⟩⟩⟨⟨τe-v,C⟩⟩
⟨⟨τe-p,O⟩⟩
FIG. 11. Color online Variation of calculated average electronrelaxation times for Bi2Te3 with respect to temperature using theKane band model for energy dispersion.
BAO-LING HUANG AND MASSOUD KAVIANY PHYSICAL REVIEW B 77, 125209 2008
125209-14
D. Seebeck coefficient
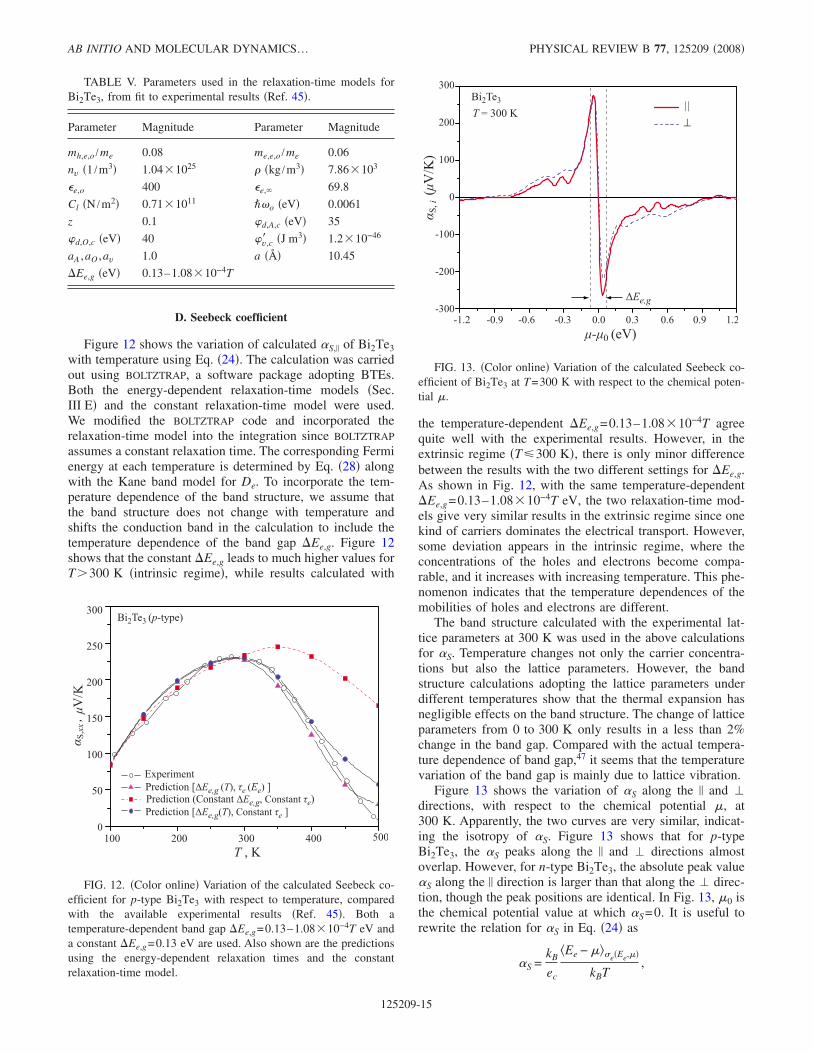
Figure 12 shows the variation of calculated S, of Bi2Te3with temperature using Eq. 24. The calculation was carriedout using BOLTZTRAP, a software package adopting BTEs.Both the energy-dependent relaxation-time models Sec.III E and the constant relaxation-time model were used.We modified the BOLTZTRAP code and incorporated therelaxation-time model into the integration since BOLTZTRAP
assumes a constant relaxation time. The corresponding Fermienergy at each temperature is determined by Eq. 28 alongwith the Kane band model for De. To incorporate the tem-perature dependence of the band structure, we assume thatthe band structure does not change with temperature andshifts the conduction band in the calculation to include thetemperature dependence of the band gap Ee,g. Figure 12shows that the constant Ee,g leads to much higher values forT300 K intrinsic regime, while results calculated with
the temperature-dependent Ee,g=0.13–1.08 10−4T agreequite well with the experimental results. However, in theextrinsic regime T300 K, there is only minor differencebetween the results with the two different settings for Ee,g.As shown in Fig. 12, with the same temperature-dependentEe,g=0.13–1.08 10−4T eV, the two relaxation-time mod-els give very similar results in the extrinsic regime since onekind of carriers dominates the electrical transport. However,some deviation appears in the intrinsic regime, where theconcentrations of the holes and electrons become compa-rable, and it increases with increasing temperature. This phe-nomenon indicates that the temperature dependences of themobilities of holes and electrons are different.
The band structure calculated with the experimental lat-tice parameters at 300 K was used in the above calculationsfor S. Temperature changes not only the carrier concentra-tions but also the lattice parameters. However, the bandstructure calculations adopting the lattice parameters underdifferent temperatures show that the thermal expansion hasnegligible effects on the band structure. The change of latticeparameters from 0 to 300 K only results in a less than 2%change in the band gap. Compared with the actual tempera-ture dependence of band gap,47 it seems that the temperaturevariation of the band gap is mainly due to lattice vibration.
Figure 13 shows the variation of S along the and directions, with respect to the chemical potential , at300 K. Apparently, the two curves are very similar, indicat-ing the isotropy of S. Figure 13 shows that for p-typeBi2Te3, the S peaks along the and directions almostoverlap. However, for n-type Bi2Te3, the absolute peak valueS along the direction is larger than that along the direc-tion, though the peak positions are identical. In Fig. 13, 0 isthe chemical potential value at which S=0. It is useful torewrite the relation for S in Eq. 24 as
S =kB
ec
Ee − eEe,
kBT,
TABLE V. Parameters used in the relaxation-time models forBi2Te3, from fit to experimental results Ref. 45.
Parameter Magnitude Parameter Magnitude
mh,e,o /me 0.08 me,e,o /me 0.06
nv 1 /m3 1.04 1025 kg /m3 7.86 103
e,o 400 e, 69.8
Cl N /m2 0.71 1011 o eV 0.0061
z 0.1 d,A,c eV 35
d,O,c eV 40 v,c J m3 1.2 10−46
aA ,aO ,av 1.0 a Å 10.45
Ee,g eV 0.13–1.08 10−4T
Experiment
T , K
α S,xx,
200 300 400 5001000
50
100
150
200
250
300
V/K
Prediction [Ee,g (T), τe (Ee) ]
Bi2Te3 (p-type)
Prediction (Constant Ee,g, Constant τe)Prediction [Ee,g(T), Constant τe ]
FIG. 12. Color online Variation of the calculated Seebeck co-efficient for p-type Bi2Te3 with respect to temperature, comparedwith the available experimental results Ref. 45. Both atemperature-dependent band gap Ee,g=0.13–1.08 10−4T eV anda constant Ee,g=0.13 eV are used. Also shown are the predictionsusing the energy-dependent relaxation times and the constantrelaxation-time model.
α S,i(V/K)
-300
-200
-100
0
300
200
100
Bi2Te3
-0 (eV)-1.2 -0.9 -0.6 -0.3 0.0 0.3 0.6 0.9 1.2
Ee,g
T = 300 K||⊥
FIG. 13. Color online Variation of the calculated Seebeck co-efficient of Bi2Te3 at T=300 K with respect to the chemical poten-tial .
AB INITIO AND MOLECULAR DYNAMICS… PHYSICAL REVIEW B 77, 125209 2008
125209-15
Ee − eEe, =eEe,Ee − dEe
eEe,dEe. 44
Here, Ee− eEe, is the eEe ,-averaged energy devia-tion from the chemical potential. Then, we have
0 = Ee eEe,0, 45
which is the eEe-averaged energy close to the middle ofthe band gap. Therefore,
S =kB
ec
Ee eEe, − Ee eEe,0 − − 0
kBT. 46
Ee eEe, has a simple form if the nondegenerate approxi-mation may be used, that is,
Ee eEe, e,eEe,g
e,e + e,h=
1
1 + be−2/kBTEe,g, 47
where e,e and e,h are the electrical conductivity contributedby electrons and holes, b= h /eme,h /me,e3/2 h and e
are the mobilities of electrons and holes, and Ee=−Ee,g /2 is the separation of the chemical potential abovethe middle of the band gap. Apparently, for semiconductorswith a large band gap e.g., Ee,g10kBT, the absolutevalue of the maximum S can be estimated as
S,max =kB
ecEe,g
2kBT. 48
For small 2Ee /kBT, we have
Ee eEe, Ee,g
1 + b1 +
2bEe/kBT1 + b
. 49
Therefore,
S kB
ec
2bEe,g
1 + b2kBT− 1 − 0
kBT. 50
For narrow band-gap semiconductors, as shown in Fig.13, Eq. 50 is a good approximation for S when −0Ee,g /2. When moves toward the band edge, the effectsof opposite charges become smaller; when moves furtherinto the band edge, Ee eEe, will become closer to .Therefore, S will achieve the maximum near the band edge,and the maximum value can be estimated from Eq. 50.Assuming that b=1 and the maximum is achieved at theband edge for Bi2Te3 at 300 K, Smax320 V /K, close tothe maximum in Fig. 13.
E. Electrical conductivity and electric thermal conductivity
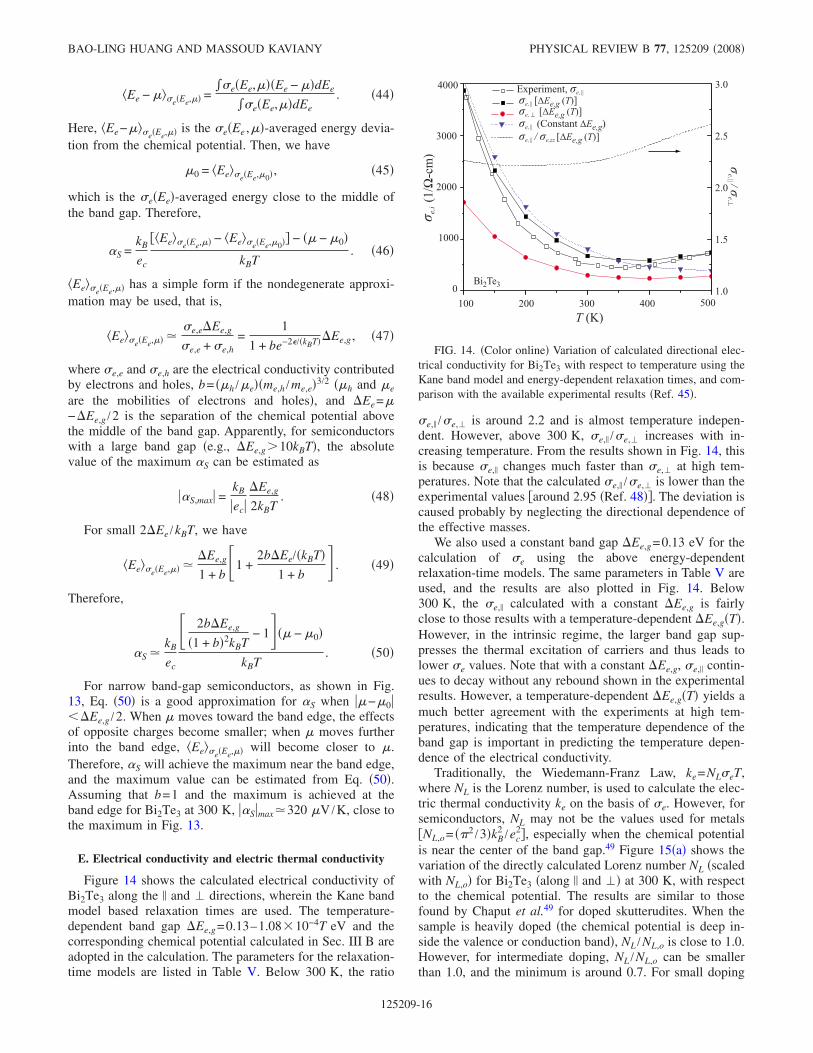
Figure 14 shows the calculated electrical conductivity ofBi2Te3 along the and directions, wherein the Kane bandmodel based relaxation times are used. The temperature-dependent band gap Ee,g=0.13–1.08 10−4T eV and thecorresponding chemical potential calculated in Sec. III B areadopted in the calculation. The parameters for the relaxation-time models are listed in Table V. Below 300 K, the ratio
e, /e, is around 2.2 and is almost temperature indepen-dent. However, above 300 K, e, /e, increases with in-creasing temperature. From the results shown in Fig. 14, thisis because e, changes much faster than e, at high tem-peratures. Note that the calculated e, /e, is lower than theexperimental values around 2.95 Ref. 48. The deviation iscaused probably by neglecting the directional dependence ofthe effective masses.
We also used a constant band gap Ee,g=0.13 eV for thecalculation of e using the above energy-dependentrelaxation-time models. The same parameters in Table V areused, and the results are also plotted in Fig. 14. Below300 K, the e, calculated with a constant Ee,g is fairlyclose to those results with a temperature-dependent Ee,gT.However, in the intrinsic regime, the larger band gap sup-presses the thermal excitation of carriers and thus leads tolower e values. Note that with a constant Ee,g, e, contin-ues to decay without any rebound shown in the experimentalresults. However, a temperature-dependent Ee,gT yields amuch better agreement with the experiments at high tem-peratures, indicating that the temperature dependence of theband gap is important in predicting the temperature depen-dence of the electrical conductivity.
Traditionally, the Wiedemann-Franz Law, ke=NLeT,where NL is the Lorenz number, is used to calculate the elec-tric thermal conductivity ke on the basis of e. However, forsemiconductors, NL may not be the values used for metalsNL,o= 2 /3kB
2 /ec2, especially when the chemical potential
is near the center of the band gap.49 Figure 15a shows thevariation of the directly calculated Lorenz number NL scaledwith NL,o for Bi2Te3 along and at 300 K, with respectto the chemical potential. The results are similar to thosefound by Chaput et al.49 for doped skutterudites. When thesample is heavily doped the chemical potential is deep in-side the valence or conduction band, NL /NL,o is close to 1.0.However, for intermediate doping, NL /NL,o can be smallerthan 1.0, and the minimum is around 0.7. For small doping
T (K)
σ e,i(1/Ω-cm)
100 200 300 400 500
Experiment, σe,||
Bi2Te30
1000
2000
3000
4000
1.0
1.5
2.0
2.5
3.0
σe,|| / σe,zz [Ee,g (T)]
σe,|| [Ee,g (T)]
σe,|| /σ
e,⊥
σe,|| (Constant Ee,g)σe, ⊥ [Ee,g (T)]
FIG. 14. Color online Variation of calculated directional elec-trical conductivity for Bi2Te3 with respect to temperature using theKane band model and energy-dependent relaxation times, and com-parison with the available experimental results Ref. 45.
BAO-LING HUANG AND MASSOUD KAVIANY PHYSICAL REVIEW B 77, 125209 2008
125209-16

concentrations or intrinsic regime, NL /NL,o may be muchlarger than 1.0. Figure 15a also shows that the constantrelaxation-time model will lead to a larger NL, compared tothat for the energy-dependent relaxation-time model dis-cussed above. For both relaxation-time models, NL along the direction is slightly larger than that along the direction.Figure 15b shows the temperature dependence of the elec-tric thermal conductivity calculated according to Eq. 24and that calculated from NL,oeT. The results from Eq. 24show that ke for both directions increase with increasing tem-perature, while NL,oeT results show valleys near the roomtemperature. Due to the significant changes of NL in the in-trinsic regime, NL,oeT underestimates ke at high tempera-tures.
F. Figure of merit
Figure 16 shows the variation of the figure of merit ZT forthe p-type Bi2Te3 specimen of experiment45 along the and directions, with respect to temperature. The lower two
curves are based on the directly MD calculated kp. Since kpand e are very sensitive to defects, which are always presentin fabricated specimens, for comparison between the calcu-lated and measured ZT, we used a modified kp, and the re-sults are shown with the top two curves. Due to the difficultyin modeling various defects, the modified kp was obtained byfitting the total thermal conductivity to the experimentalresults45 at 300 K and then by using the 1 /T law at othertemperatures. The experimental results are also shown in Fig.16. The ZT with a modified kp is higher than experimentalresults above 200 K, mainly due to the overestimation of e.The calculated ZT reaches its maximum at around 250 K. ZTalong the direction is higher than that along the directionbetween 200 and 400 K due to the larger ratio e, /e, com-pared to kp, /kp,. Note that the experimental e, /e, islarger than the calculated results discussed above, so thedifference in the figure of merits along the and directionis expected to be even larger.
IV. SUMMARY AND CONCLUSION
The interatomic potentials for Bi2Te3 have been devel-oped, and the calculated elastic constants and thermal expan-sion coefficients agree well with the experimental data, indi-cating that the proposed force field is suitable in describingboth the harmonic and anharmonic behaviors of Bi2Te3. Theinteraction between two Te1 atoms in the neighboring layersis a mixture of the electrostatic interaction and the van derWaals interaction and behaves like an ionic bond. The forceconstant difference between the Te1-Te1 and Te2-Bi bondsleads to a phonon band gap near 2.5 THz. There is only asmall difference between the in-plane and cross-plane vibra-tions, and no significant two-dimensional elastic behaviorhas been found in this layered structure. However, the aniso-tropy in the polarized Grüneisen parameter shows much
(eV)-0.6 -0.4 -0.2 0.0 0.2 0.4 0.6
Ee,g
Bi2Te3T = 300 K
0.0
1.0
2.0
3.0
4.0
5.0
6.0
7.0
k e,i/(NL,oσ e,iT)=NL/NL,o
NL,o = 2.45×10⁻⁸W-Ω/K2
||, Constant τe⊥, Constant τe||, τe (Ee)⊥, τe (Ee)
T (K)
k e,i
(W/m
-K)
100 200 300 400 500
2.0
1.2
0.8
0.4
0.0Bi2Te3
1.6
||, Directly Calculated⊥, Directly Calculated
⊥, NL,o σe,⊥T||, NL,o σe,||T
(a)
(b)
FIG. 15. Color online a Variation of the calculated scaledLorenz number for Bi2Te3 along and with respect to thechemical potential. Both the constant relaxation-time model and theenergy-dependent relaxation-time model with the Kane band dis-persion results are shown. b Variation of the calculated ke alongthe and directions with respect to temperature. The results cal-culated using the constant NL,o, i.e., NL,oeT, are also shown.
T , K200 300 400 500100
ZT
0.0
0.1
0.2
0.3
0.4
0.5
0.6
0.7
||, Experiment
||, Calculated
⊥, Calculated
Bi2Te3 (p-type)
||, Calculated(MD kp,||)⊥, Calculated(MD kp,⊥)
(Defects Modified kp,||)
(Defects Modified kp,⊥)
FIG. 16. Color online Variation of calculated directional figureof merit for Bi2Te3 along and with respect to temperature.Both the results with the directly calculated kp and that modified bydefects are presented. The experimental results Ref. 45 are alsoshown.
AB INITIO AND MOLECULAR DYNAMICS… PHYSICAL REVIEW B 77, 125209 2008
125209-17
stronger anharmonicity along the cross-plane direction,which is mainly due to the high anharmonic Te1-Te1 inter-action.
The temperature dependence of the in-plane and cross-plane lattice thermal conductivities kp,A, and kp,A, has beencalculated in a temperature range from 150 to 450 K. Theratio kp,A, /kp,A, varies from 1.55 to 2.17 in this temperatureregime. Since the elastic properties along the two directionsare nearly the same, the difference between kp,A, and kp,A,is believed to be mainly due to the different inharmonicityalong the two directions. The calculated in-plane thermalconductivity roughly follows the 1 /T law, while the calcu-lated cross-plane lattice thermal conductivity seems to have aslightly stronger temperature dependence i.e., 1 /T1.23,which may be due to the larger thermal expansion effectsalong that direction. The decomposition of the lattice thermalconductivity shows that the long-range acoustic phononsdominate the heat transfer in both the in-plane and cross-plane directions. The contribution from the long-rangeacoustic phonons kp,A,lg has a strong temperature depen-dence; in contrast, the contribution from the short-rangeacoustic phonons kp,A,sh and that from the optical phononskp,O are also temperature-independent. Also, at each tempera-ture point, kp,A,sh and kp,O along the in-plane and cross-planedirections are almost identical. Therefore, kp,A,sh and kp,O arenot sensitive to the inharmonicity. The sum of kp,A,sh and kp,Oprovides a lower limit for the doped bulk Bi2Te3, which isabout 0.2 W /m K at 300 K. By using direction-dependentTD, and G, the Slack model was also extended for aniso-tropic materials. The extended Slack model gives a goodestimation for both the in-plane and cross-plane lattice ther-mal conductivities, indicating that the phonon transportalong a given direction is only affected by the elastic andinharmonic properties along that direction.
We have also calculated the temperature dependence ofS, e, and ke over the temperature range from 100 to 500 K.These calculations are based on the band structure, , and e.
The Kane band model is found to be appropriate in describ-ing the nonparabolicity of the Bi2Te3 band structure. Thefitting with the carrier concentration and shows that thetemperature dependence of the band gap is important to givea good prediction. The thermal expansion has negligible ef-fects on the relationship between S and ; therefore, theeffects of temperature on S are mainly through changing thedistribution function and . Both the constant relaxation-time model and the analytic relaxation-time model with thenonparabolic Kane model for energy dispersion have beenused in the calculations for S. The results show that S issensitive to the temperature dependence of the band gap andthe relaxation time models in the intrinsic regime.
The fitting for e using the relaxation-time model alsoshows that the polar scattering by optical phonons and thescattering by the deformation potential of acoustic and opti-cal phonons predominate the electron transport in Bi2Te3.The scatterings by the short-range deformation potential ofvacancies and the Coulomb potentials are negligible. Thecomparison of the temperature dependence of different scat-tering mechanisms also shows that the temperature depen-dence of the band gap is important in describing the tempera-ture dependence of e. It is also found that the Lorenznumber can be smaller than the value for metals for interme-diate doping and will become much larger in the intrinsicregime. In the relaxation-time models used, some parametersare found by fitting to the experimental data on e. Furtherwork will use the first-principles methods e.g., Eq. 32 tocalculate the scattering rates by acoustic and opticalphonons.
ACKNOWLEDGMENTS
This work was supported by the U.S. Department of En-ergy, Office of Basic Energy Sciences under Grant No. DE-FG02-00ER45851. Insightful discussions with S. M. Mah-anti, Jasprit Singh, Ctirad Uher, and Anton Van der Ven havebeen very helpful.
*[email protected] M. H. Francombe, Br. J. Appl. Phys. 9, 415 1958.2 J. R. Wiese and L. Muldawer, J. Phys. Chem. Solids 15, 13
1960.3 J. O. Jenkins, J. A. Rayne, and R. W. Ure, Phys. Rev. B 5, 3171
1972.4 H. J. Goldsmid, Thermoelectric Refrigeration Plenum, New
York, 1964.5 W. Kullmann, G. Eichhorn, H. Rauh, R. Geick, G. Eckold, and U.
Steigenberger, Phys. Status Solidi B 162, 125 1990.6 D. M. Zayachuk, Semiconductors 31, 173 1997.7 D. L. Rode, Semicond. Semimetals 10, 1 1975.8 H. Kohler, Phys. Status Solidi B 74, 591 1976.9 H. Kohler, Phys. Status Solidi B 73, 95 1976.
10 T. J. Scheidemantel, C. Ambrosch-Draxl, T. Thonhauser, J. V.Badding, and J. O. Sofo, Phys. Rev. B 68, 125210 2003.
11 J. Callaway, Phys. Rev. 113, 1046 1959.12 M. G. Holland, Phys. Rev. 132, 2461 1963.
13 S. Baroni et al., http://www.pwscf.org/, 2007.14 J. Gale and A. Rohl, Mol. Simul. 29, 291 2003.15 H. Rydberg, M. Dion, N. Jacobson, E. Schröder, P. Hyldgaard, S.
I. Simak, D. C. Langreth, and B. I. Lundqvist, Phys. Rev. Lett.91, 126402 2003.
16 N. W. Ashcroft and N. D. Mermin, Solid State Physics SaunderCollege, Philadelphia, 1976.
17 J. O. Barnes and J. A. Rayne, Phys. Lett. 46A, 317 1974.18 D. A. Broido, A. Ward, and N. Mingo, Phys. Rev. B 72, 014308
2005.19 R. R. Rao and A. Ramanand, Acta Crystallogr., Sect. A: Cryst.
Phys., Diffr., Theor. Gen. Crystallogr. A33, 146 1977.20 K. N. R. Taylor, Br. J. Appl. Phys. 12, 717 1961.21 B. L. Huang and M. Kaviany, J. Appl. Phys. 100, 123507 2006.22 M. T. Dove, Introduction to Lattice Dynamics Cambridge Uni-
versity Press, Cambridge, England, 1993.23 Z. Yao, J. S. Wang, B. Li, and G. R. Liu, Phys. Rev. B 71, 085417
2005.
BAO-LING HUANG AND MASSOUD KAVIANY PHYSICAL REVIEW B 77, 125209 2008
125209-18

24 H. Rauh, R. Geick, H. Kohler, N. Nucker, and N. Lehner, SolidState Phys. 14, 2705 1981.
25 D. Wolf, P. Keblinski, S. R. Phillpot, and J. Eggebrecht, J. Chem.Phys. 110, 8254 1999.
26 A. J. H. McGaughey and M. Kaviany, Int. J. Heat Mass Transfer47, 1799 2004.
27 C. B. Satterthwaite and J. R. W. Ure, Phys. Rev. 108, 11641957.
28 P. A. Walker, Proc. Phys. Soc. London 76, 113 1960.29 B. L. Huang and M. Kaviany, Int. J. Heat Mass Transfer 50, 393
2007.30 H. Kaburaki, J. Li, S. Yip, and H. Kimizuka, J. Appl. Phys. 102,
043514 2007.31 D. G. Cahill, S. K. Watson, and R. O. Pohl, Phys. Rev. B 46,
6131 1992.32 G. A. Slack, Solid State Phys. 34, 1 1979.33 R. Berman, Thermal Conduction in Solids Clarendon, Oxford,
1976.34 J. M. Ziman, Electrons and Phonons Oxford University Press,
London, 1962.35 G. K. H. Madsen and D. J. Singh, Comput. Phys. Commun. 175,
67 2006.36 P. Blaha, K. Schwarz, G. K. H. Madsen, D. Kvasnicka, and J.
Luitz, WIEN2k, An Augmented Plane Wave+Local OrbitalsProgram for Calculating Crystal Properties Karlheinz
Schwarz, Technische Uniersitat Wien, Austria, 2001.37 J. P. Perdew, K. Burke, and M. Ernzerhof, Phys. Rev. Lett. 77,
3865 1996.38 P. Larson, Phys. Rev. B 68, 155121 2003.39 S. J. Youn and A. J. Freeman, Phys. Rev. B 63, 085112 2001.40 M. Kim, A. J. Freeman, and C. B. Geller, Phys. Rev. B 72,
035205 2005.41 E. O. Kane, Semicond. Semimetals 1, 75 1966.42 Y. I. Ravich, B. A. Efimova, and V. I. Tamachenko, Phys. Status
Solidi B 43, 11 1971.43 T. C. Harman, B. Paris, S. E. Miller, and H. L. Goering, J. Phys.
Chem. Solids 2, 181 1957.44 S. K. Mishra, S. Satpathy, and O. Jepsen, J. Phys.: Condens.
Matter 9, 461 1997.45 H.-W. Jeon, H.-P. Ha, D.-B. Hyun, and J.-D. Shim, J. Phys.
Chem. Solids 52, 579 1991.46 J. P. Singh, Electronic and Optoelectrionic Properties of Semicon-
ductor Structures Cambridge University Press, Cambridge,England, 2003.
47 S. Shigetomi and S. Mori, J. Phys. Soc. Jpn. 11, 915 1956.48 R. T. Delves, A. E. Bowley, D. W. Hazelden, and H. J. Goldsmid,
Proc. Phys. Soc. London 78, 838 1961.49 L. Chaput, P. Pecheur, J. Tobola, and H. Scherrer, Phys. Rev. B
72, 085126 2005.
AB INITIO AND MOLECULAR DYNAMICS… PHYSICAL REVIEW B 77, 125209 2008
125209-19


![BMC Biology BioMed Central...ab initio modeling of larger proteins extremely difficult [18]. Current ab initio predictions are mainly focused on small proteins. Several successful](https://static.fdocuments.in/doc/165x107/607bf1070d5d6c78551d36a3/bmc-biology-biomed-central-ab-initio-modeling-of-larger-proteins-extremely-difficult.jpg)