AARTI INDUSTRIES LTD - Myirisbreport.myiris.com/firstcall/AARINDUS_20141201.pdfglobal manufacturers...
12
CMP 282.70 Target Price 317.00 ISIN: INE769A01020 DECEMBER 1 st 2014 AARTI INDUSTRIES LTD Result Update (PARENT BASIS): Q2 FY15 BUY BUY BUY BUY Index Details Stock Data Sector Commodity Chemicals BSE Code 524208 Face Value 5.00 52wk. High / Low (Rs.) 319.50/81.80 Volume (2wk. Avg. Q.) 20000 Market Cap (Rs. in mn.) 25047.22 Annual Estimated Results (A*: Actual / E*: Estimated) YEARS FY14A FY15E FY16E Net Sales 26327.70 31988.16 38385.79 EBITDA 4059.00 5011.31 6087.68 Net Profit 1486.90 2028.04 2572.52 EPS 16.78 22.89 29.04 P/E 16.85 12.35 9.74 Shareholding Pattern (%) 1 Year Comparative Graph AARTI INDUSTRIES LTD BSE SENSEX SYNOPSIS Aarti Industries Ltd (AIL) is a leading supplier to global manufacturers of Specialty Chemicals and Pharmaceuticals with diversified end-uses in Pharmaceuticals, Polymer, Additives, Surfactants, Agrochemicals, Pigments, Dyes, etc. In Q2 FY15, net profit jumps to Rs. 507.20 million against Rs. 423.50 million in the corresponding quarter ending of previous year, an increase of 19.76% y-o-y. Net sales registered 17.95% increase y-o-y of Rs. 7611.60 million in second quarter of current financial year 2014-15 as compared to Rs. 6453.50 million over the prior period last year. The company has reported an EBITDA of Rs. 1222.50 million, increase of 11.58% y-o-y over prior period last year. Profit before tax (PBT) at Rs. 672.20 million in Q2 FY15 compared to Rs. 603.50 million in Q2 FY14, registered a growth of 11.38%. The company has declared Interim Dividend @ 45% Rs. 2.25/ per share on face value of Rs. 5.00 each for the financial year 2014-2015. . Revenue from Specialty Chemicals segment was Rs. 6249.10 million, rose up by 16% in Q2 FY15 compared to Rs. 5372.10 million in Q2 FY14. For the 2 nd quarter of FY15, Revenue from Home & personal care chemicals segment grew by 48% to Rs. 570.50 million from Rs. 386.70 million in the prior period of Last year. Net Sales and PAT of the company are expected to grow at a CAGR of 22% and 25% over 2013 to 2016E respectively. PEER GROUPS CMP MARKET CAP EPS P/E (X) P/BV(X) DIVIDEND Company Name (Rs.) Rs. in mn. (Rs.) Ratio Ratio (%) Aarti Industries Ltd 282.70 25047.22 16.78 16.85 3.22 90.00 Tata Chemicals Ltd 431.30 109876.40 23.85 18.08 1.93 100.00 Gujarat Fluorochemicals Ltd 744.45 81777.80 7.29 102.12 3.24 350.00 Aditya Birla Chemicals Ltd 244.80 5725.00 18.14 13.50 1.35 15.00
Transcript of AARTI INDUSTRIES LTD - Myirisbreport.myiris.com/firstcall/AARINDUS_20141201.pdfglobal manufacturers...
CMP 282.70
Target Price 317.00
ISIN: INE769A01020
DECEMBER 1st
2014
AARTI INDUSTRIES LTD
Result Update (PARENT BASIS): Q2 FY15
BUYBUYBUYBUY
Index Details
Stock Data
Sector Commodity Chemicals
BSE Code 524208
Face Value 5.00
52wk. High / Low (Rs.) 319.50/81.80
Volume (2wk. Avg. Q.) 20000
Market Cap (Rs. in mn.) 25047.22
Annual Estimated Results (A*: Actual / E*: Estimated)
YEARS FY14A FY15E FY16E
Net Sales 26327.70 31988.16 38385.79
EBITDA 4059.00 5011.31 6087.68
Net Profit 1486.90 2028.04 2572.52
EPS 16.78 22.89 29.04
P/E 16.85 12.35 9.74
Shareholding Pattern (%)
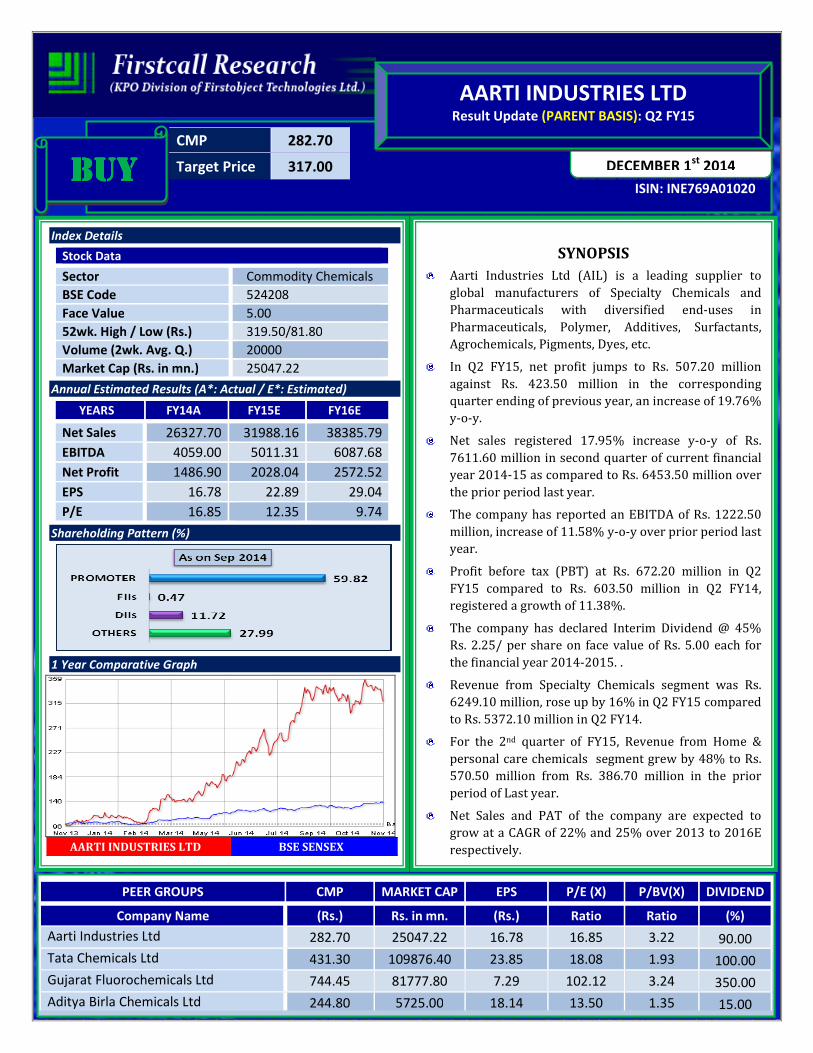
1 Year Comparative Graph
AARTI INDUSTRIES LTD BSE SENSEX
SYNOPSIS
Aarti Industries Ltd (AIL) is a leading supplier to
global manufacturers of Specialty Chemicals and
Pharmaceuticals with diversified end-uses in
Pharmaceuticals, Polymer, Additives, Surfactants,
Agrochemicals, Pigments, Dyes, etc.
In Q2 FY15, net profit jumps to Rs. 507.20 million
against Rs. 423.50 million in the corresponding
quarter ending of previous year, an increase of 19.76%
y-o-y.
Net sales registered 17.95% increase y-o-y of Rs.
7611.60 million in second quarter of current financial
year 2014-15 as compared to Rs. 6453.50 million over
the prior period last year.
The company has reported an EBITDA of Rs. 1222.50
million, increase of 11.58% y-o-y over prior period last
year.
Profit before tax (PBT) at Rs. 672.20 million in Q2
FY15 compared to Rs. 603.50 million in Q2 FY14,
registered a growth of 11.38%.
The company has declared Interim Dividend @ 45%
Rs. 2.25/ per share on face value of Rs. 5.00 each for
the financial year 2014-2015. .
Revenue from Specialty Chemicals segment was Rs.
6249.10 million, rose up by 16% in Q2 FY15 compared
to Rs. 5372.10 million in Q2 FY14.
For the 2nd quarter of FY15, Revenue from Home &
personal care chemicals segment grew by 48% to Rs.
570.50 million from Rs. 386.70 million in the prior
period of Last year.
Net Sales and PAT of the company are expected to
grow at a CAGR of 22% and 25% over 2013 to 2016E
respectively.
PEER GROUPS CMP MARKET CAP EPS P/E (X) P/BV(X) DIVIDEND
Company Name (Rs.) Rs. in mn. (Rs.) Ratio Ratio (%)
Aarti Industries Ltd 282.70 25047.22 16.78 16.85 3.22 90.00
Tata Chemicals Ltd 431.30 109876.40 23.85 18.08 1.93 100.00
Gujarat Fluorochemicals Ltd 744.45 81777.80 7.29 102.12 3.24 350.00
Aditya Birla Chemicals Ltd 244.80 5725.00 18.14 13.50 1.35 15.00
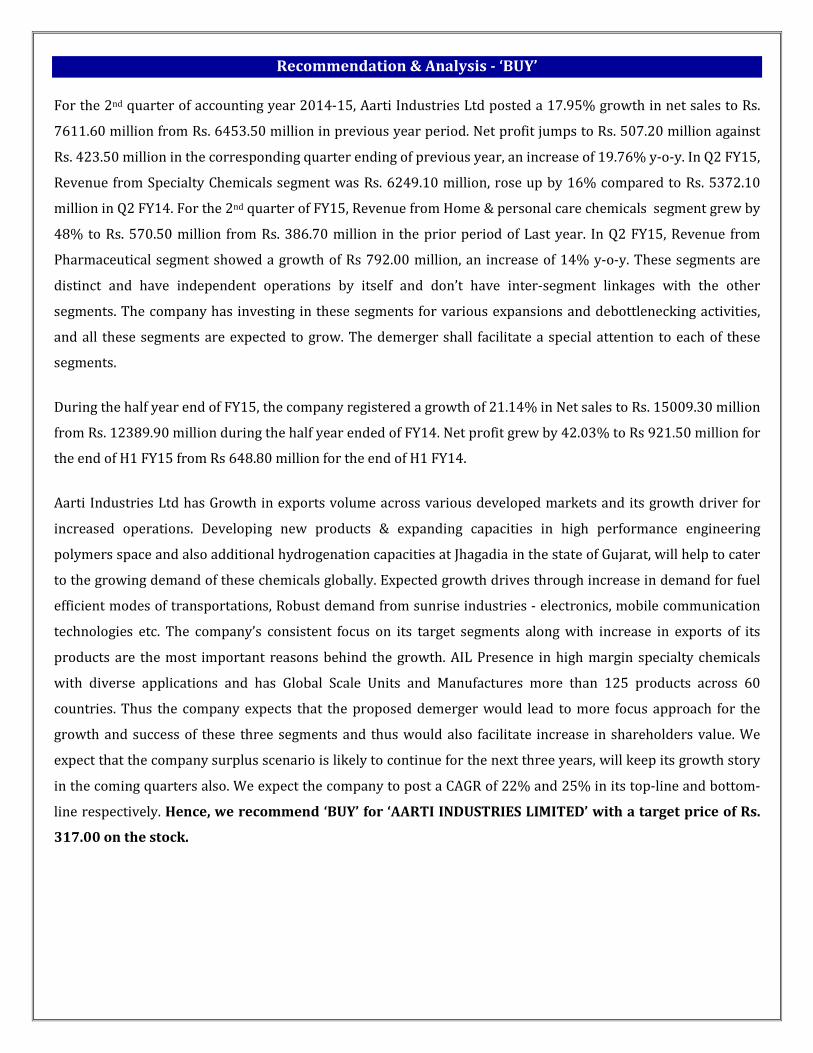
Recommendation & Analysis - ‘BUY’
For the 2nd quarter of accounting year 2014-15, Aarti Industries Ltd posted a 17.95% growth in net sales to Rs.
7611.60 million from Rs. 6453.50 million in previous year period. Net profit jumps to Rs. 507.20 million against
Rs. 423.50 million in the corresponding quarter ending of previous year, an increase of 19.76% y-o-y. In Q2 FY15,
Revenue from Specialty Chemicals segment was Rs. 6249.10 million, rose up by 16% compared to Rs. 5372.10
million in Q2 FY14. For the 2nd quarter of FY15, Revenue from Home & personal care chemicals segment grew by
48% to Rs. 570.50 million from Rs. 386.70 million in the prior period of Last year. In Q2 FY15, Revenue from
Pharmaceutical segment showed a growth of Rs 792.00 million, an increase of 14% y-o-y. These segments are
distinct and have independent operations by itself and don’t have inter-segment linkages with the other
segments. The company has investing in these segments for various expansions and debottlenecking activities,
and all these segments are expected to grow. The demerger shall facilitate a special attention to each of these
segments.
During the half year end of FY15, the company registered a growth of 21.14% in Net sales to Rs. 15009.30 million
from Rs. 12389.90 million during the half year ended of FY14. Net profit grew by 42.03% to Rs 921.50 million for
the end of H1 FY15 from Rs 648.80 million for the end of H1 FY14.
Aarti Industries Ltd has Growth in exports volume across various developed markets and its growth driver for
increased operations. Developing new products & expanding capacities in high performance engineering
polymers space and also additional hydrogenation capacities at Jhagadia in the state of Gujarat, will help to cater
to the growing demand of these chemicals globally. Expected growth drives through increase in demand for fuel
efficient modes of transportations, Robust demand from sunrise industries - electronics, mobile communication
technologies etc. The company’s consistent focus on its target segments along with increase in exports of its
products are the most important reasons behind the growth. AIL Presence in high margin specialty chemicals
with diverse applications and has Global Scale Units and Manufactures more than 125 products across 60
countries. Thus the company expects that the proposed demerger would lead to more focus approach for the
growth and success of these three segments and thus would also facilitate increase in shareholders value. We
expect that the company surplus scenario is likely to continue for the next three years, will keep its growth story
in the coming quarters also. We expect the company to post a CAGR of 22% and 25% in its top-line and bottom-
line respectively. Hence, we recommend ‘BUY’ for ‘AARTI INDUSTRIES LIMITED’ with a target price of Rs.
317.00 on the stock.

QUARTERLY HIGHLIGHTS (PARENT BASIS)
Results updates- Q2 FY15,
Aarti Industries Ltd lead the way to introduce latest
technology and manufacturing processes in India
with the help of World Class R & D and Globally
ranks at 1st– 5th Position for majority of its key
products, has reported its financial results for the
quarter ended 30th Sept, 2014.
Rs. In millions SEP-14 SEP-13 % Change
Net Sales 7611.60 6453.50 17.95
PAT 507.20 423.50 19.76
EPS 5.72 4.78 19.76
EBITDA 1222.50 1095.60 11.58
The company has achieved a turnover of Rs. 7611.60 million for the 2nd quarter of the current year 2014-15 as
against Rs. 6453.50 million in the corresponding quarter of the previous year. The company has reported an
EBITDA of Rs. 1222.50 million, increase of 11.58% y-o-y over prior period last year. In Q2 FY15, net profit Jumps
up by 19.76% y-o-y of Rs. 507.20 million compared to Rs. 423.50 million in the corresponding quarter of the
previous year. The company has reported an EPS of Rs. 5.72 for the 2nd quarter as against an EPS of Rs. 4.78 in
the corresponding quarter of the previous year.
Break up of Expenditure
During the quarter, total Expenditure rose by 17 per cent mainly on account of increased cost of materials
consumed by 20%, other expenditure by 11%, Employee benefits Expenses 21% are the primary attribute for
the growth of expenditure when compared to prior period last year. Total expenditure in Q2 FY15 stood to Rs.
6582.70 million as against Rs. 5609.30 million in Q2 FY14.
Break up of Expenditure
Rs. In millions
Q2 FY15 Q2 FY14
Cost of Materials consumed 4810.10 4010.00
Purchase of Stock in Trade 295.50 262.50
Employee Benefit Expenses 223.40 185.30
Depreciation 190.90 216.00
Other Expenditure 1292.00 1161.40

Segment Revenue
COMPANY PROFILE
Aarti Industries Ltd has started its operations in the year 1975 in the name of alchemie labs in a small of way
with a single product namely Dimentyl sulphate. The Company is a leading manufacturer of Speciality Chemicals
with diversified end-uses into Agrochemicals, Pharmaceuticals, High Performance Polymers, Paints, Pigments,
Printing Inks, Rubber Chemicals, Additives, Surfactants, Dyes, Oil & Gas additives, Flavours & Fragrances, Home &
Personal Care applications, etc. Aarti is amongst the largest producers of Benzene based basic and intermediate
chemicals in India. It has corporate office in Mumbai & representatives in U.S.A & Europe.
A significant portion of the company’s Production capabilities are process driven and not based on a particular
product. This gives Aarti the flexibility to change its input mix and manufacture different products, thereby
resulting into optimum utilization of production capabilities.
• Aarti has 16 manufacturing units spread across Gujarat & Maharashtra and a strong Research & Development
with sophisticated instruments. AARTI has two API manufacturing plants located at Dombivli and Tarapur in
Maharashtra with total area of about 15000 sq. m. and a reactor volume of more than 70 M3.
• Aarti has customers spread across the globe in 60 countries with major presence in USA, Europe, Japan &
India.
AARTI group is strategically placed to exploit growth opportunities in the Chemical Industry. In view of its
technical expertise and broad base satisfied clientele in India and abroad, AARTI is looking for global partners
and strategic alliances in areas of mutual interest viz.
• Development of International markets for AARTI's products.
• Toll manufacturing.
• Transfer of Technology / Technical know-how.

Subsidiary company
• Aarti Corporate Services Limited.
• Shanti Intermediates Private Limited.
• Nascent Chemical Industries Limited.
Products
The company explores and innovate new products & processes in all segments. Details of some of the products
are presented below:
• Para Nitro Chloro Benzene (PNCB) & Derivatives
• Ortho Nitro Chloro Benzne & Derivatives
• 2:4 Dinitro Chloro Benzene & Derivatives
• Para Dichloro Benzene (PDCB) & Derivatives
• Ortho Dichloro Benzene (ODCB) & Derivatives
• Nitro Benzene & Derivatives
• Nitro Toluenes & Derivatives
• Dimethyl Sulfate
• Sulfuric Acid & Allied Products
• Chloro Phenols
• Polymer Additives
• Plastisizers
• Alkylated Anilines & Alkylated Toluidines
• Fluoro Compounds
• Agrochemicals
• Bulk Drug Intermediates / Speciality Chemicals
Other Products
• Mono Chloro Benzene (MCB)
• Single Super Phosphate (SSP)
• Dilute Sulfuric Acids
• Hydro Chloric Acid (HCL)
• Gypsum
• Calcium Chloride
• Di-Calcium Phosphate
• Nitrosyl Sulfuric Acid
Product by End Use
• Dyestuff Intermediates
• Pharma Intermediates
• Pigment Intermediates
• Agro Chemical Intermediates
• Speciality Chemicals
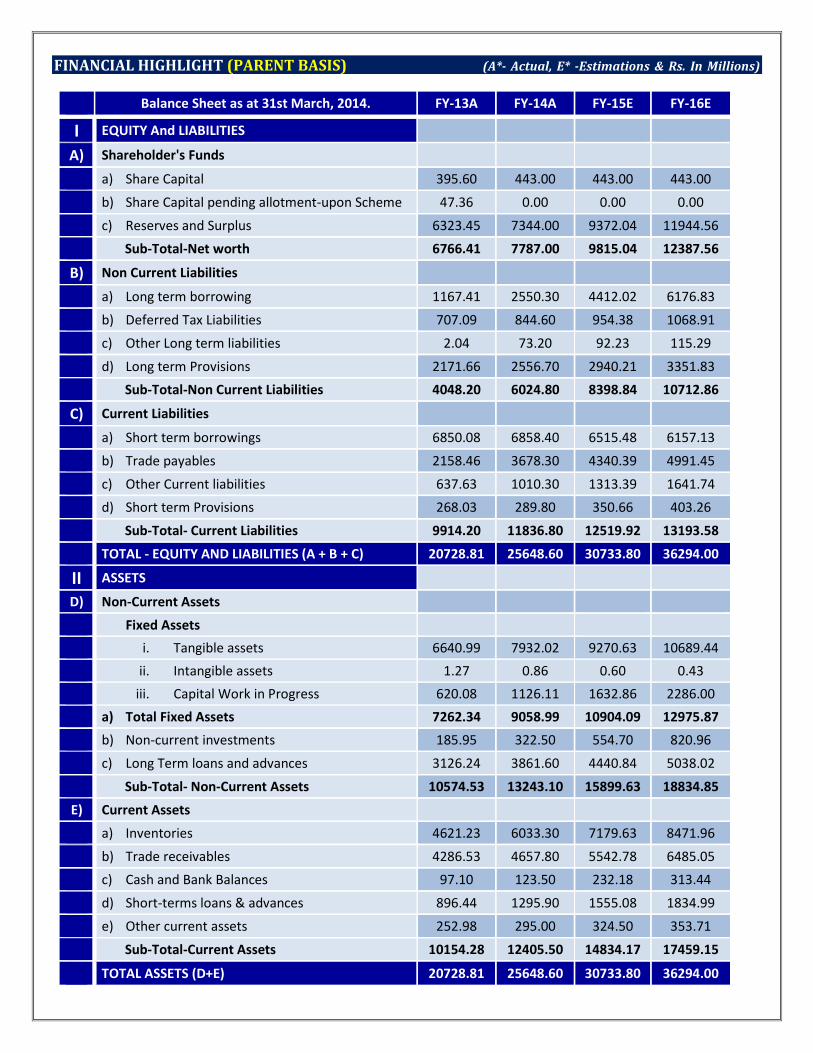
FINANCIAL HIGHLIGHT (PARENT BASIS) (A*- Actual, E* -Estimations & Rs. In Millions)
Balance Sheet as at 31st March, 2014. FY-13A FY-14A FY-15E FY-16E
I EQUITY And LIABILITIES
A) Shareholder's Funds
a) Share Capital 395.60 443.00 443.00 443.00
b) Share Capital pending allotment-upon Scheme 47.36 0.00 0.00 0.00
c) Reserves and Surplus 6323.45 7344.00 9372.04 11944.56
Sub-Total-Net worth 6766.41 7787.00 9815.04 12387.56
B) Non Current Liabilities
a) Long term borrowing 1167.41 2550.30 4412.02 6176.83
b) Deferred Tax Liabilities 707.09 844.60 954.38 1068.91
c) Other Long term liabilities 2.04 73.20 92.23 115.29
d) Long term Provisions 2171.66 2556.70 2940.21 3351.83
Sub-Total-Non Current Liabilities 4048.20 6024.80 8398.84 10712.86
C) Current Liabilities
a) Short term borrowings 6850.08 6858.40 6515.48 6157.13
b) Trade payables 2158.46 3678.30 4340.39 4991.45
c) Other Current liabilities 637.63 1010.30 1313.39 1641.74
d) Short term Provisions 268.03 289.80 350.66 403.26
Sub-Total- Current Liabilities 9914.20 11836.80 12519.92 13193.58
TOTAL - EQUITY AND LIABILITIES (A + B + C) 20728.81 25648.60 30733.80 36294.00
II ASSETS
D) Non-Current Assets
Fixed Assets
i. Tangible assets 6640.99 7932.02 9270.63 10689.44
ii. Intangible assets 1.27 0.86 0.60 0.43
iii. Capital Work in Progress 620.08 1126.11 1632.86 2286.00
a) Total Fixed Assets 7262.34 9058.99 10904.09 12975.87
b) Non-current investments 185.95 322.50 554.70 820.96
c) Long Term loans and advances 3126.24 3861.60 4440.84 5038.02
Sub-Total- Non-Current Assets 10574.53 13243.10 15899.63 18834.85
E) Current Assets
a) Inventories 4621.23 6033.30 7179.63 8471.96
b) Trade receivables 4286.53 4657.80 5542.78 6485.05
c) Cash and Bank Balances 97.10 123.50 232.18 313.44
d) Short-terms loans & advances 896.44 1295.90 1555.08 1834.99
e) Other current assets 252.98 295.00 324.50 353.71
Sub-Total-Current Assets 10154.28 12405.50 14834.17 17459.15
TOTAL ASSETS (D+E) 20728.81 25648.60 30733.80 36294.00

Annual Profit & Loss Statement for the period of 2013A to 2016E
Value(Rs.in.mn) FY13A FY14A FY15E FY16E
Description 12m 12m 12m 12m
Net Sales 20961.20 26327.70 31988.16 38385.79
Other Income 44.00 104.20 53.14 61.11
Total Income 21005.20 26431.90 32041.30 38446.90
Expenditure -17398.80 -22372.90 -27029.99 -32359.22
Operating Profit 3606.40 4059.00 5011.31 6087.68
Interest -950.00 -1175.30 -1539.64 -1847.57
Gross profit 2656.40 2883.70 3471.66 4240.11
Depreciation -818.00 -874.30 -848.07 -890.47
Profit Before Tax 1838.40 2009.40 2623.59 3349.64
Tax -525.00 -522.50 -595.56 -777.12
Net Profit 1313.40 1486.90 2028.04 2572.52
Equity capital 443.00 443.00 443.00 443.00
Reserves 6323.40 7344.00 9372.04 11944.56
Face value 5.00 5.00 5.00 5.00
EPS 14.82 16.78 22.89 29.04
Quarterly Profit & Loss Statement for the period of 31 MAR, 2014 to 31 DEC, 2014E
Value(Rs.in.mn) 31-Mar-14 30-Jun-14 30-Sep-14 31-Dec-14E
Description 3m 3m 3m 3m
Net sales 7441.40 7397.70 7611.60 7885.62
Other income 43.60 1.20 2.70 1.03
Total Income 7485.00 7398.90 7614.30 7886.64
Expenditure -6385.70 -6268.00 -6391.80 -6592.38
Operating profit 1099.30 1130.90 1222.50 1294.27
Interest -316.50 -379.30 -359.40 -406.12
Gross profit 782.80 751.60 863.10 888.15
Depreciation -231.90 -187.30 -190.90 -195.86
Profit Before Tax 550.90 564.30 672.20 692.28
Tax -82.50 -150.00 -165.00 -171.69
Net Profit 468.40 414.30 507.20 520.60
Equity capital 443.00 443.00 443.00 443.00
Face value 5.00 5.00 5.00 5.00
EPS 5.29 4.68 5.72 5.88

Ratio Analysis
Particulars FY13A FY14A FY15E FY16E
EPS (Rs.) 14.82 16.78 22.89 29.04
EBITDA Margin (%) 17.21 15.42 15.67 15.86
PBT Margin (%) 8.77 7.63 8.20 8.73
PAT Margin (%) 6.27 5.65 6.34 6.70
P/E Ratio (x) 19.07 16.85 12.35 9.74
ROE (%) 19.41 19.09 20.66 20.77
ROCE (%) 29.93 28.69 28.25 28.23
Debt Equity Ratio 1.18 1.21 1.11 1.00
EV/EBITDA (x) 9.14 8.46 7.13 6.09
Book Value (Rs.) 76.37 87.89 110.78 139.81
P/BV 3.70 3.22 2.55 2.02
Charts:
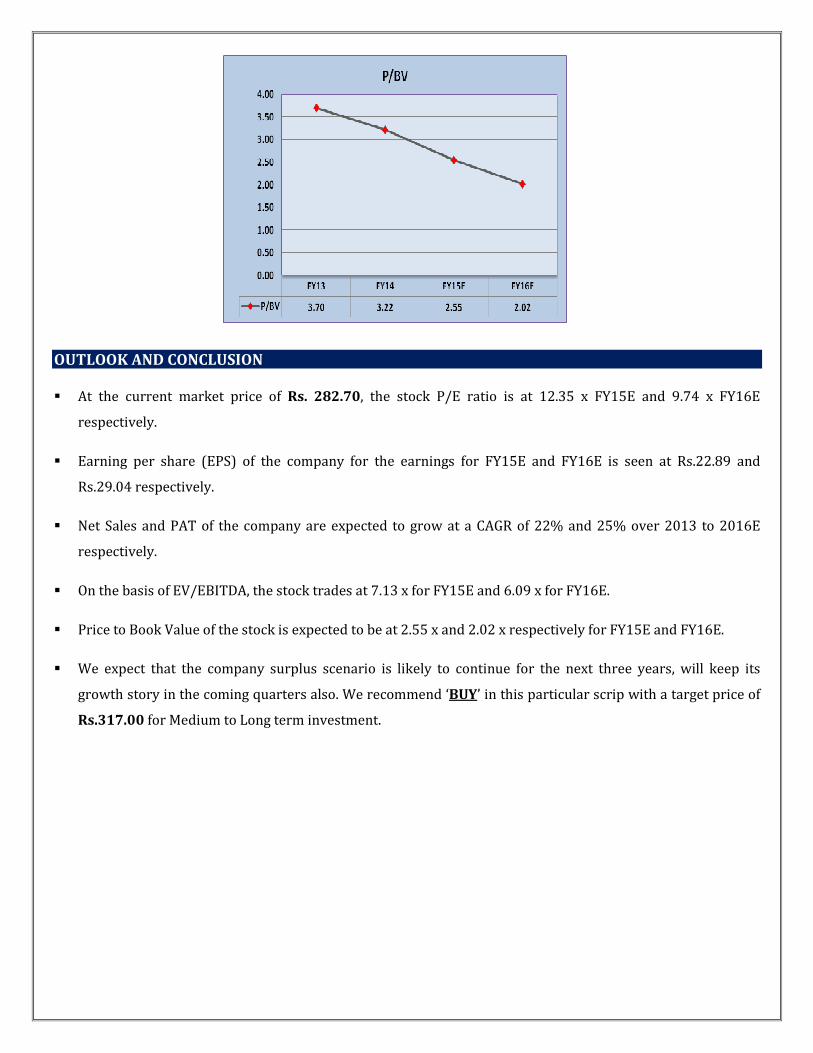
OUTLOOK AND CONCLUSION
� At the current market price of Rs. 282.70, the stock P/E ratio is at 12.35 x FY15E and 9.74 x FY16E
respectively.
� Earning per share (EPS) of the company for the earnings for FY15E and FY16E is seen at Rs.22.89 and
Rs.29.04 respectively.
� Net Sales and PAT of the company are expected to grow at a CAGR of 22% and 25% over 2013 to 2016E
respectively.
� On the basis of EV/EBITDA, the stock trades at 7.13 x for FY15E and 6.09 x for FY16E.
� Price to Book Value of the stock is expected to be at 2.55 x and 2.02 x respectively for FY15E and FY16E.
� We expect that the company surplus scenario is likely to continue for the next three years, will keep its
growth story in the coming quarters also. We recommend ‘BUY’ in this particular scrip with a target price of
Rs.317.00 for Medium to Long term investment.
INDUSTRY OVERVIEW
The commodity and bulk chemicals segment in India is expected to witness slow growth in 2014, while the
specialty chemical segment is projected to register considerable growth. In 2013, the Indian chemical industry
earned revenues in the range of US $155-160 billion. It is likely to grow further at a rate of 11-12 per cent in the
next two to three years. Though the commodity and bulk chemicals segment is expected to experience slow
growth owing to reduced industrial output, the specialty chemicals segment should show considerable growth.
Personal care ingredients and additives, knowledge chemicals like active pharmaceutical ingredients (APIs),
paints and coatings, construction and water chemicals etc., are some of the industry verticals that are likely to
perform well in 2014. Last year, they witnessed good growth and companies in these segments have been
investing and expanding.
Economic growth is expected to pick up in India during 2014. The country’s GDP growth rate will increase from
4.6% in the fiscal year ending 31 March 2014 to 5.6% in the fiscal year ending 31 March 2015 and 6.5% in the
following fiscal year. “The worst may be over for India’s economy, but persistent inflation, a weak investment
climate, and political uncertainty ahead of the 2014 election will lead to slow and uneven progress,” reported by
chief economist at IHS. “Postelection economic reforms and an upturn in capital investment will be essential to
restoring India’s growth momentum.
• The Indian Chemical Council (ICC; Mumbai) and analysts say that demand for chemical products continues to
rise in India. “Disposable surplus income is rising in India, and the increasing standard of living leads to
growth in consumption of consumer goods, which results in greater demand for chemical products.
• “Per capita consumption in India for products such as plastics and paints is still well below the global
average. Despite that, the overall demand for chemicals in India will continue to remain strong in 2014,” as
per, associate director/chemicals, materials, and foods practice at Frost & Sullivan (Bangalore).
• “The Indian chemical industry has always grown 1–2% above the overall GDP growth rate in the country.
This trend will continue, and the chemical industry in India will grow about 2% above the GDP growth rate in
2014,” India’s chemical industry sales are estimated to reach $115–120 billion in 2014, ICC says.
• Exports of chemical products from India grew at a compound annual growth rate of 8–9% during 2008–13, a
rate that will continue in the medium term.
• Certain sectors of India’s chemical industry are likely to grow strongly in 2014, ICC and analysts say. “Sectors
such as agricultural chemicals, specialty chemicals, [and] construction chemicals... are expected to perform
well in 2014.
• Growth rates in India for basic organic chemicals, such as acetic acid and formaldehyde, are expected to
follow GDP and grow at a rate of 5–6%. Meanwhile, the specialty chemicals segment is expected to grow at a
rate of 11–12%, “Specialty chemicals and agro chemicals are likely to grow faster than basic and commodity
chemicals.”
• Certain specialty chemicals, such as personal-care ingredients, additives, active pharmaceutical ingredients,
paints and coatings, construction chemicals, and water chemicals, are likely to grow strongly. “Also, there has
been an increase in activities by Indian players in these segments with respect to expansions—both organic
and inorganic.” Commodity and bulk chemicals are expected to slow in 2014 because of lower growth in end-
user segments.
Double Digit Growth for Specialty Chemicals Expected
The specialty chemicals sector is characterized by the need for high-value products, high-volume requirements
with expanding customer base, a product-driven market and addition of new participants at various levels of the
value chain.
Overall, the market is likely to grow at a compound annual growth rate (CAGR) of 13-14 per cent. The sector
forms about 15-16 per cent of the total chemical industry. This segment includes dyes and pigments, leather
chemicals, construction chemicals, personal care ingredients and other specialty chemicals (excluding
pharmaceuticals and agrochemicals)
Disclaimer:
This document is prepared by our research analysts and it does not constitute an offer or solicitation for the
purchase or sale of any financial instrument or as an official confirmation of any transaction. The information
contained herein is from publicly available data or other sources believed to be reliable but we do not represent that
it is accurate or complete and it should not be relied on as such. Firstcall Research or any of its affiliates shall not be
in any way responsible for any loss or damage that may arise to any person from any inadvertent error in the
information contained in this report. Firstcall Research and/ or its affiliates and/or employees will not be liable for
the recipients’ investment decision based on this document.
Firstcall India Equity Research: Email – [email protected]
C.V.S.L.Kameswari Pharma & Diversified
U. Janaki Rao Capital Goods
B. Anil Kumar Auto, IT & FMCG
M. Vinayak Rao Diversified
C. Bhagya Lakshmi Diversified
G. Amarender Diversified
Firstcall Research Provides
Industry Research on all the Sectors and Equity Research on Major Companies
forming part of Listed and Unlisted Segments
For Further Details Contact:
Tel.: 022-2527 2510/2527 6077 / 25276089 Telefax: 022-25276089
040-20000235 /20000233
E-mail: [email protected]
www.firstcallresearch.com