AARP Utility Survey
13
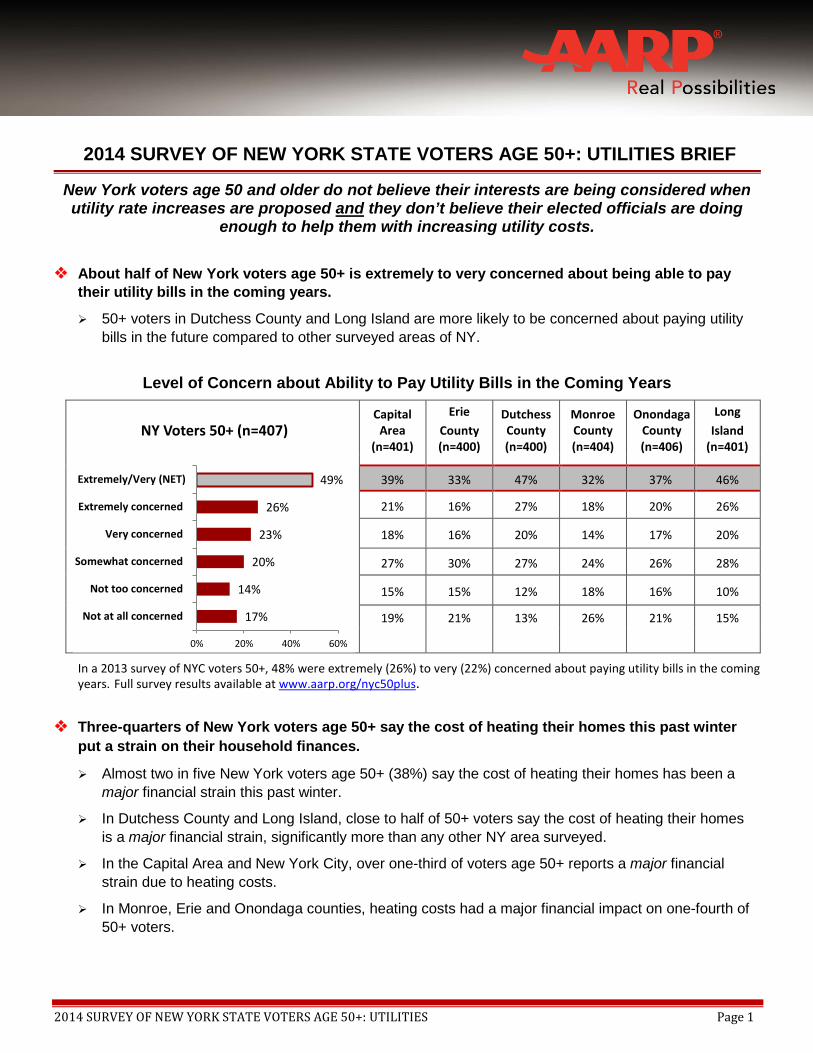
2014 SURVEY OF NEW YORK STATE VOTERS AGE 50+: UTILITIES Page 1 2014 SURVEY OF NEW YORK STATE VOTERS AGE 50+: UTILITIES BRIEF New York voters age 50 and older do not believe their interests are being considered when utility rate increases are proposed and they don’t believe their elected officials are doing enough to help them with increasing utility costs. About half of New York voters age 50+ is extremely to very concerned about being able to pay their utility bills in the coming years. 50+ voters in Dutchess County and Long Island are more likely to be concerned about paying utility bills in the future compared to other surveyed areas of NY. Level of Concern about Ability to Pay Utility Bills in the Coming Years Capital Area (n=401) Erie County (n=400) Dutchess County (n=400) Monroe County (n=404) Onondaga County (n=406) Long Island (n=401) 39% 33% 47% 32% 37% 46% 21% 16% 27% 18% 20% 26% 18% 16% 20% 14% 17% 20% 27% 30% 27% 24% 26% 28% 15% 15% 12% 18% 16% 10% 19% 21% 13% 26% 21% 15% In a 2013 survey of NYC voters 50+, 48% were extremely (26%) to very (22%) concerned about paying utility bills in the coming years. Full survey results available at www.aarp.org/nyc50plus. Three-quarters of New York voters age 50+ say the cost of heating their homes this past winter put a strain on their household finances. Almost two in five New York voters age 50+ (38%) say the cost of heating their homes has been a major financial strain this past winter. In Dutchess County and Long Island, close to half of 50+ voters say the cost of heating their homes is a major financial strain, significantly more than any other NY area surveyed. In the Capital Area and New York City, over one-third of voters age 50+ reports a major financial strain due to heating costs. In Monroe, Erie and Onondaga counties, heating costs had a major financial impact on one-fourth of 50+ voters. 17% 14% 20% 23% 26% 49% 0% 20% 40% 60% Not at all concerned Not too concerned Somewhat concerned Very concerned Extremely concerned Extremely/Very (NET) NY Voters 50+ (n=407)
-
Upload
tim-knauss -
Category
Documents
-
view
1.264 -
download
0
description
Telephone survey of NY consumers on the subject of creating a state utility advocate
Transcript of AARP Utility Survey
2014 SURVEY OF NEW YORK STATE VOTERS AGE 50+: UTILITIES Page 1
2014 SURVEY OF NEW YORK STATE VOTERS AGE 50+: UTILITIES BRIEF
New York voters age 50 and older do not believe their interests are being considered when utility rate increases are proposed and they don’t believe their elected officials are doing
enough to help them with increasing utility costs.
About half of New York voters age 50+ is extremely to very concerned about being able to pay their utility bills in the coming years.
50+ voters in Dutchess County and Long Island are more likely to be concerned about paying utility bills in the future compared to other surveyed areas of NY.
Level of Concern about Ability to Pay Utility Bills in the Coming Years
Capital Area
(n=401)
Erie County (n=400)
Dutchess County (n=400)
Monroe County (n=404)
Onondaga County (n=406)
Long Island
(n=401)
39% 33% 47% 32% 37% 46%
21% 16% 27% 18% 20% 26%
18% 16% 20% 14% 17% 20%
27% 30% 27% 24% 26% 28%
15% 15% 12% 18% 16% 10%
19% 21% 13% 26% 21% 15%
In a 2013 survey of NYC voters 50+, 48% were extremely (26%) to very (22%) concerned about paying utility bills in the coming years. Full survey results available at www.aarp.org/nyc50plus.
Three-quarters of New York voters age 50+ say the cost of heating their homes this past winter
put a strain on their household finances.
Almost two in five New York voters age 50+ (38%) say the cost of heating their homes has been a major financial strain this past winter.
In Dutchess County and Long Island, close to half of 50+ voters say the cost of heating their homes is a major financial strain, significantly more than any other NY area surveyed.
In the Capital Area and New York City, over one-third of voters age 50+ reports a major financial strain due to heating costs.
In Monroe, Erie and Onondaga counties, heating costs had a major financial impact on one-fourth of 50+ voters.
17%
14%
20%
23%
26%
49%
0% 20% 40% 60%
Not at all concerned
Not too concerned
Somewhat concerned
Very concerned
Extremely concerned
Extremely/Very (NET)
NY Voters 50+ (n=407)
2014 SURVEY OF NEW YORK STATE VOTERS AGE 50+: UTILITIES Page 2
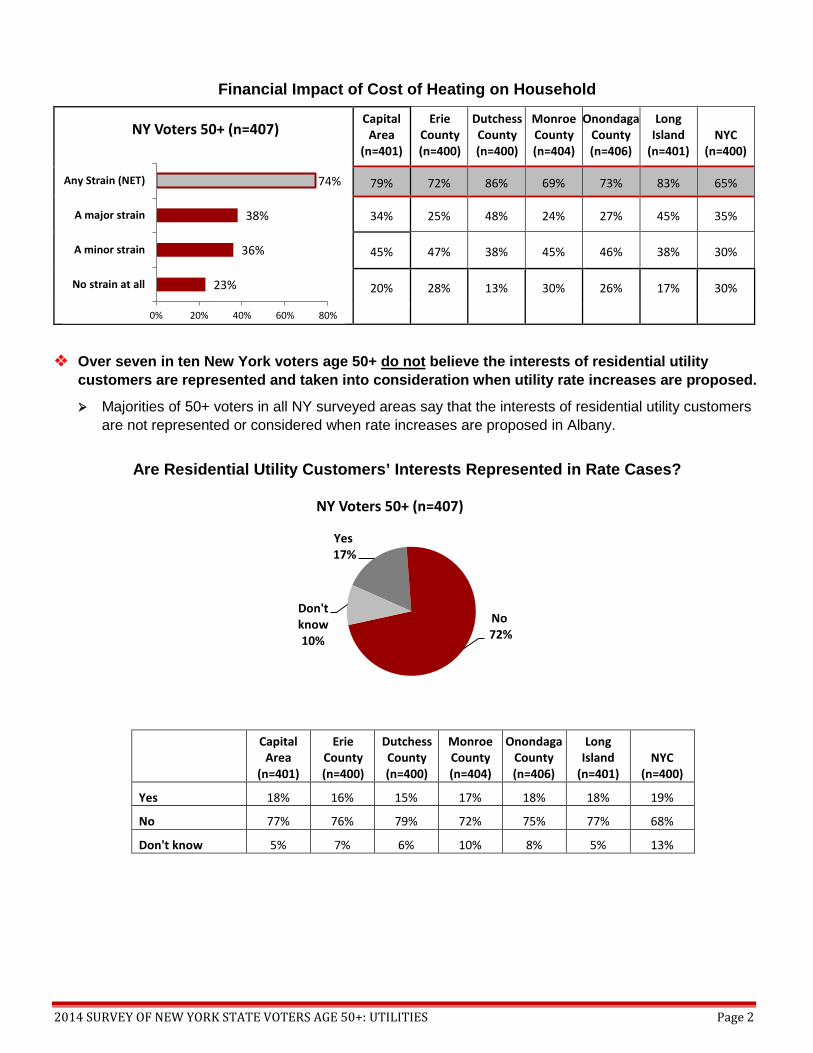
Financial Impact of Cost of Heating on Household
Capital Area
(n=401)
Erie County (n=400)
Dutchess County (n=400)
Monroe County (n=404)
Onondaga County (n=406)
Long Island
(n=401) NYC
(n=400)
79% 72% 86% 69% 73% 83% 65%
34% 25% 48% 24% 27% 45% 35%
45% 47% 38% 45% 46% 38% 30%
20% 28% 13% 30% 26% 17% 30%
Over seven in ten New York voters age 50+ do not believe the interests of residential utility customers are represented and taken into consideration when utility rate increases are proposed.
Majorities of 50+ voters in all NY surveyed areas say that the interests of residential utility customers are not represented or considered when rate increases are proposed in Albany.
Are Residential Utility Customers’ Interests Represented in Rate Cases?
Capital Area
(n=401)
Erie County (n=400)
Dutchess County (n=400)
Monroe County (n=404)
Onondaga County (n=406)
Long Island
(n=401) NYC
(n=400)
Yes 18% 16% 15% 17% 18% 18% 19%
No 77% 76% 79% 72% 75% 77% 68%
Don't know 5% 7% 6% 10% 8% 5% 13%
23%
36%
38%
74%
0% 20% 40% 60% 80%
No strain at all
A minor strain
A major strain
Any Strain (NET)
NY Voters 50+ (n=407)
Yes 17%
No 72%
Don't know 10%
NY Voters 50+ (n=407)
2014 SURVEY OF NEW YORK STATE VOTERS AGE 50+: UTILITIES Page 3
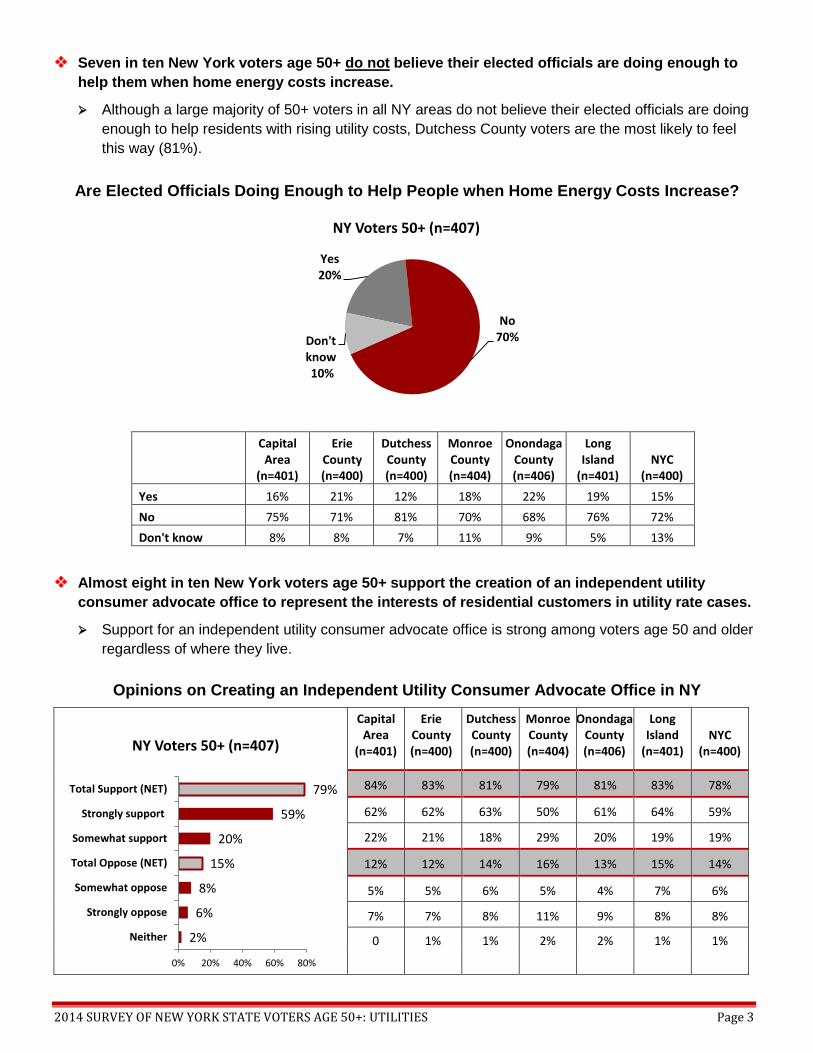
Seven in ten New York voters age 50+ do not believe their elected officials are doing enough to help them when home energy costs increase.
Although a large majority of 50+ voters in all NY areas do not believe their elected officials are doing enough to help residents with rising utility costs, Dutchess County voters are the most likely to feel this way (81%).
Are Elected Officials Doing Enough to Help People when Home Energy Costs Increase?
Capital Area
(n=401)
Erie County (n=400)
Dutchess County (n=400)
Monroe County (n=404)
Onondaga County (n=406)
Long Island
(n=401) NYC
(n=400) Yes 16% 21% 12% 18% 22% 19% 15% No 75% 71% 81% 70% 68% 76% 72% Don't know 8% 8% 7% 11% 9% 5% 13%
Almost eight in ten New York voters age 50+ support the creation of an independent utility consumer advocate office to represent the interests of residential customers in utility rate cases.
Support for an independent utility consumer advocate office is strong among voters age 50 and older regardless of where they live.
Opinions on Creating an Independent Utility Consumer Advocate Office in NY
Capital Area
(n=401)
Erie County (n=400)
Dutchess County (n=400)
Monroe County (n=404)
Onondaga County (n=406)
Long Island
(n=401) NYC
(n=400)
84% 83% 81% 79% 81% 83% 78%
62% 62% 63% 50% 61% 64% 59%
22% 21% 18% 29% 20% 19% 19%
12% 12% 14% 16% 13% 15% 14%
5% 5% 6% 5% 4% 7% 6%
7% 7% 8% 11% 9% 8% 8%
0 1% 1% 2% 2% 1% 1%
Yes 20%
No 70% Don't
know 10%
NY Voters 50+ (n=407)
2%
6%
8%
15%
20%
59%
79%
0% 20% 40% 60% 80%
Neither
Strongly oppose
Somewhat oppose
Total Oppose (NET)
Somewhat support
Strongly support
Total Support (NET)
NY Voters 50+ (n=407)
2014 SURVEY OF NEW YORK STATE VOTERS AGE 50+: UTILITIES Page 4
2014 New York State Telephone Survey of Registered Voters 50+ Annotation of Survey Responses
English Questionnaire, Landline Sample Only
NOTE: Below is an abbreviated survey annotation from a larger survey. The questions shown here relate only to the topic of utilities in addition to screening and demographic questions. A full questionnaire annotation will be
available in the future.
These data were collected by Universal Survey, Inc. on behalf of AARP through a telephone survey of New York State registered voters age 50 and older. There is a statewide sample of n=407 with oversamples in the following NY geographies for approximately n=400 each: the Capital Area (4 counties of Albany, Rensselaer, Saratoga and Schenectady); Erie County; Dutchess County; Monroe County; Onondaga County; Long Island (Nassau and Suffolk counties); and New York City (5 counties of Bronx, King, New York, Queens, Richmond). This survey is very similar to one conducted in NYC in June 2013. Repeated survey questions were not asked in NYC oversample interviews. Interviewing was conducted between March 19 and April 18, 2014. In New York City only, interviewing was conducted in English and Spanish. On a sample size of n=400 the margin of error is ±5.0 percent at the 95% confidence interval. Data have been weighted to reflect the 50+ voter population in each geography.
* Survey sections in blue highlight were skipped for NYC oversample only. INTRODUCTION Hello, this is ______ calling from _________, a national opinion research firm. We are not telemarketers and are not trying to sell you anything. We are calling New Yorkers to ask about their opinions on some issues that may affect them and their families and would like to include your views in our study. We would greatly appreciate your participation and all of your responses will be kept entirely confidential. SCREENER QS1. First, to ensure that we interview a wide variety of people, I have a few questions about you. Can you please tell me your age as of your last birthday? [CAPTURE ACTUAL AGE. DON’T READ LIST UNLESS NECESSARY. USE THE AGE GROUPS BELOW TO KEEP TRACK OF HOW MANY RESPONDENTS WE ARE GETTING IN EACH GROUP.]
New York State
Capital Area
Erie County
Dutchess County
Monroe County
Onondaga County
Long Island NYC
Base: Total Respondents 407 401 400 400 404 406 401 400
50-64 NET 49% 49% 49% 53% 50% 51% 52% 48%
65+ NET 51% 51% 51% 47% 50% 49% 48% 52%
QS2. And, are you registered to vote in New York?
New York State
Capital Area
Erie County
Dutchess County
Monroe County
Onondaga County
Long Island NYC
Base: Total Respondents 407 401 400 400 404 406 401 400
Yes 100% 100% 100% 100% 100% 100% 100% 100%
No - - - - - - - -

2014 SURVEY OF NEW YORK STATE VOTERS AGE 50+: UTILITIES Page 5
QS3. Which New York County do you live in? (DO NOT READ)
New York State
Capital Area
Erie County
Dutchess County
Monroe County
Onondaga County
Long Island NYC
Base: Total Respondents 407 401 400 400 404 406 401 400
CAPITAL AREA 8% 100% - - - - - -
Albany County 4% 36% - - - - - -
Rensselaer County 2% 13% - - - - - -
Saratoga County 1% 31% - - - - - -
Schenectady County 1% 20% - - - - - -
ERIE COUNTY 5% - 100% - - - - -
DUTCHESS COUNTY 1% - - 100% - - - -
MONROE COUNTY 4% - - - 100% - - -
ONONDAGA COUNTY 3% - - - - 100% - -
LONG ISLAND 15% - - - - - 100% -
Nassau County 6% - - - - - 55% -
Suffolk County 8% - - - - - 45% -
NYC 36% - - - - - - 100%
Bronx County 5% - - - - - - 20%
Kings County 5% - - - - - - 24%
New York County 11% - - - - - - 25%
Queens County 11% - - - - - - 23%
Richmond County 4% - - - - - - 8%
REST OF NY 29% - - - - - - -
Allegany County 0 - - - - - - -
Broome County 0 - - - - - - -
Cattaraugus County 1% - - - - - - -
Cayuga County 1% - - - - - - -
Chautauqua County 2% - - - - - - -
Chemung County 1% - - - - - - -
Chenango County 0 - - - - - - -
Clinton County 0 - - - - - - -
Columbia County 0 - - - - - - -
Delaware County 1% - - - - - - -
Essex County 0 - - - - - - -
Franklin County 2% - - - - - - -
Fulton County 0 - - - - - - -
Genesee County 0 - - - - - - -
Herkimer County 1% - - - - - - -
Livingston County 1% - - - - - - -
Madison County 0 - - - - - - -
Montgomery County 1% - - - - - - -
Niagara County 1% - - - - - - -
Oneida County 1% - - - - - - -
Ontario County 1% - - - - - - -
Orange County 1% - - - - - - -
2014 SURVEY OF NEW YORK STATE VOTERS AGE 50+: UTILITIES Page 6
New York State
Capital Area
Erie County
Dutchess County
Monroe County
Onondaga County
Long Island NYC
Oswego County 1% - - - - - - -
Otsego County 1% - - - - - - -
Putnam County 1% - - - - - - -
Rockland County 1% - - - - - - -
St. Lawrence County 1% - - - - - - -
Schoharie County 0 - - - - - - -
Schuyler County 0 - - - - - - -
Seneca County 1% - - - - - - -
Steuben County 1% - - - - - - -
Sullivan County 0 - - - - - - -
Tioga County 1% - - - - - - -
Tompkins County 1% - - - - - - -
Ulster County 1% - - - - - - -
Warren County 1% - - - - - - -
Washington County 1% - - - - - - -
Wayne County 0 - - - - - - -
Westchester County 3% - - - - - - -
Wyoming County 0 - - - - - - -
Yates County 0 - - - - - - -
QS4. RECORD RESPONDENT’S GENDER. ASK ONLY IF ABSOLUTELY NECESSARY: “To ensure it is recorded accurately, could you please state your gender?”
New York State
Capital Area
Erie County
Dutchess County
Monroe County
Onondaga County
Long Island NYC
Base: Total Respondents 407 401 400 400 404 406 401 400 Male 48% 44% 48% 50% 49% 47% 49% 42% Female 52% 56% 52% 50% 51% 53% 51% 58%
QS5. We want to ensure that we interview people from a wide variety of racial and ethnic groups. Can you please tell me if you are of Hispanic, Spanish, or Latino origin or descent?
New York State
Capital Area
Erie County
Dutchess County
Monroe County
Onondaga County
Long Island NYC
Base: Total Respondents 407 401 400 400 404 406 401 400 Yes 10% 2% 2% 3% 2% 1% 6% 24% No 90% 97% 96% 97% 97% 99% 93% 75% Don't know 1% 0 1% - 1% 1% 1% 1%
2014 SURVEY OF NEW YORK STATE VOTERS AGE 50+: UTILITIES Page 7
QS6. And what is your race? [ACCEPT ONLY ONE. IF NECESSARY: WHICH ONE RACE DO YOU MOST IDENTIFY WITH?]
New York State
Capital Area
Erie County
Dutchess County
Monroe County
Onondaga County
Long Island NYC
Base: Total Respondents 407 401 400 400 404 406 401 400 White or Caucasian 81% 90% 90% 93% 89% 91% 89% 56% Black or African American 8% 4% 5% 3% 7% 4% 4% 25% Native American or Alaskan Native 0 0 0 0 - 1% 0 1% Asian 1% 0 0 1% - 0 1% 2% Native Hawaiian or other Pacific Islander 0 1% - - 0 0 - 0 Other 7% 2% 2% 2% 1% 2% 3% 12% Don't know 1% 0 - - 1% 0 1% 2% Refused 2% 3% 2% 1% 1% 1% 2% 2%
QS7. Which of the following best describes your current employment status? Are you… [READ LIST, ACCEPT ONE.]
New York State
Capital Area
Erie County
Dutchess County
Monroe County
Onondaga County
Long Island NYC
Base: Total Respondents 407 401 400 400 404 406 401 400 Labor Force Participation (NET) 39% 36% 37% 42% 42% 33% 46% 31% Self-employed full-time 5% 2% 5% 8% 4% 4% 8% 4% Self-employed part-time 3% 2% 1% 3% 3% 2% 2% 3% Employed full-time 19% 22% 23% 19% 23% 20% 24% 16% Employed part-time 7% 7% 6% 9% 7% 4% 10% 5% Unemployed and looking for work 5% 3% 3% 3% 4% 2% 3% 3% Retired and not working at all 53% 60% 56% 52% 51% 59% 49% 58% Not in the labor force for other reasons 7% 4% 7% 5% 7% 8% 4% 9% Don't know 1% - - - 0 0 - 1% Refused 1% 0 - 0 0 - - 1%
IF LABOR FORCE PARTICIPATION AT QS7, ASK QS8. OTHERWISE GO TO Q3.
QS8. Have you ever retired from a previous career?
New York State
Capital Area
Erie County
Dutchess County
Monroe County
Onondaga County
Long Island NYC
Base: Labor Force Participation 148 153 157 164 179 143 179 145 Yes 14% 23% 14% 23% 18% 16% 14% 12% No 86% 77% 86% 77% 80% 83% 86% 87% Don't know 0 - - - 2% 1% 0 0 Refused - - - - 0 - - -
2014 SURVEY OF NEW YORK STATE VOTERS AGE 50+: UTILITIES Page 8
MAIN QUESTIONNAIRE
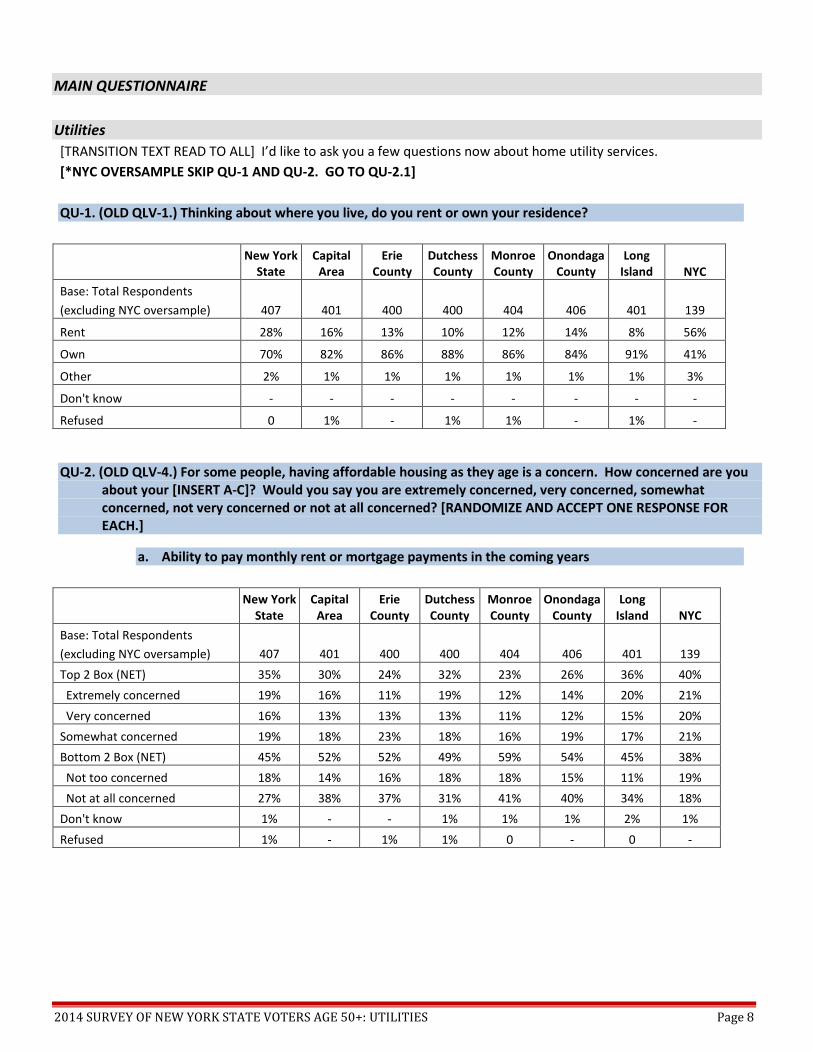
Utilities [TRANSITION TEXT READ TO ALL] I’d like to ask you a few questions now about home utility services. [*NYC OVERSAMPLE SKIP QU-1 AND QU-2. GO TO QU-2.1] QU-1. (OLD QLV-1.) Thinking about where you live, do you rent or own your residence?
New York State
Capital Area
Erie County
Dutchess County
Monroe County
Onondaga County
Long Island NYC
Base: Total Respondents (excluding NYC oversample) 407 401 400 400 404 406 401 139
Rent 28% 16% 13% 10% 12% 14% 8% 56%
Own 70% 82% 86% 88% 86% 84% 91% 41%
Other 2% 1% 1% 1% 1% 1% 1% 3%
Don't know - - - - - - - -
Refused 0 1% - 1% 1% - 1% -
QU-2. (OLD QLV-4.) For some people, having affordable housing as they age is a concern. How concerned are you about your [INSERT A-C]? Would you say you are extremely concerned, very concerned, somewhat concerned, not very concerned or not at all concerned? [RANDOMIZE AND ACCEPT ONE RESPONSE FOR EACH.]
a. Ability to pay monthly rent or mortgage payments in the coming years
New York State
Capital Area
Erie County
Dutchess County
Monroe County
Onondaga County
Long Island NYC
Base: Total Respondents (excluding NYC oversample) 407 401 400 400 404 406 401 139 Top 2 Box (NET) 35% 30% 24% 32% 23% 26% 36% 40% Extremely concerned 19% 16% 11% 19% 12% 14% 20% 21% Very concerned 16% 13% 13% 13% 11% 12% 15% 20% Somewhat concerned 19% 18% 23% 18% 16% 19% 17% 21% Bottom 2 Box (NET) 45% 52% 52% 49% 59% 54% 45% 38% Not too concerned 18% 14% 16% 18% 18% 15% 11% 19% Not at all concerned 27% 38% 37% 31% 41% 40% 34% 18% Don't know 1% - - 1% 1% 1% 2% 1% Refused 1% - 1% 1% 0 - 0 -
2014 SURVEY OF NEW YORK STATE VOTERS AGE 50+: UTILITIES Page 9
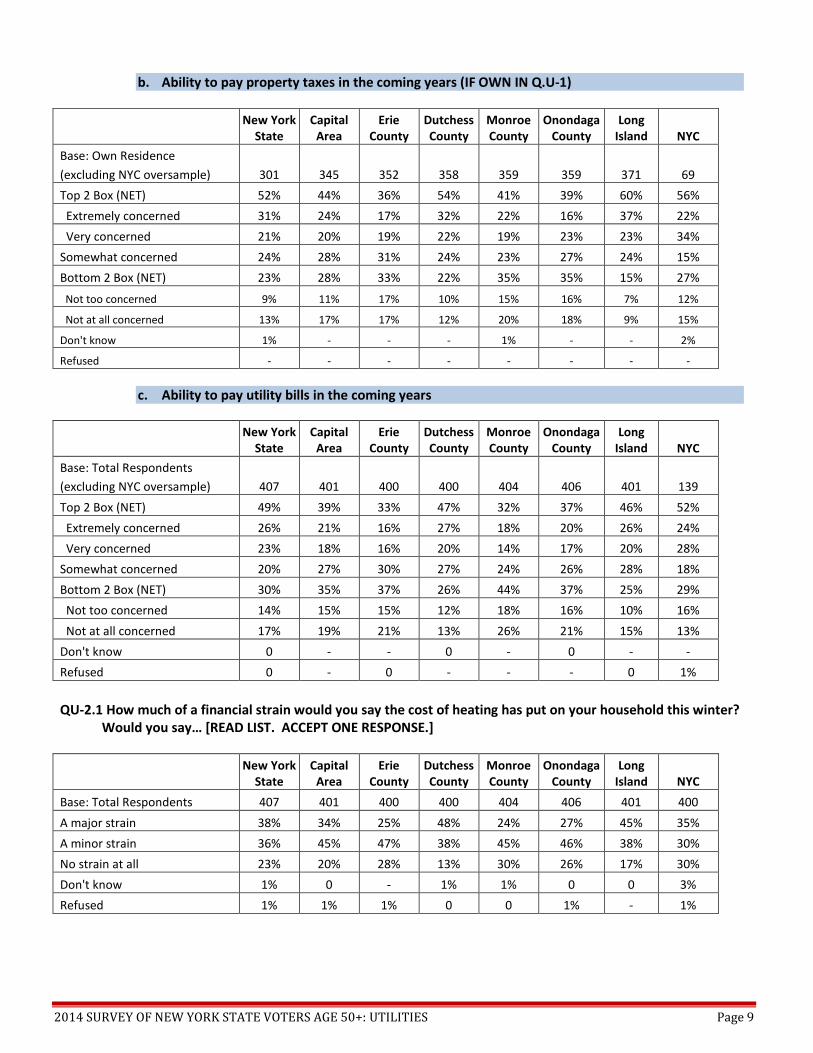
b. Ability to pay property taxes in the coming years (IF OWN IN Q.U-1)
New York State
Capital Area
Erie County
Dutchess County
Monroe County
Onondaga County
Long Island NYC
Base: Own Residence (excluding NYC oversample) 301 345 352 358 359 359 371 69 Top 2 Box (NET) 52% 44% 36% 54% 41% 39% 60% 56% Extremely concerned 31% 24% 17% 32% 22% 16% 37% 22% Very concerned 21% 20% 19% 22% 19% 23% 23% 34% Somewhat concerned 24% 28% 31% 24% 23% 27% 24% 15% Bottom 2 Box (NET) 23% 28% 33% 22% 35% 35% 15% 27%
Not too concerned 9% 11% 17% 10% 15% 16% 7% 12%
Not at all concerned 13% 17% 17% 12% 20% 18% 9% 15%
Don't know 1% - - - 1% - - 2%
Refused - - - - - - - -
c. Ability to pay utility bills in the coming years
New York
State Capital
Area Erie
County Dutchess County
Monroe County
Onondaga County
Long Island NYC
Base: Total Respondents (excluding NYC oversample) 407 401 400 400 404 406 401 139 Top 2 Box (NET) 49% 39% 33% 47% 32% 37% 46% 52% Extremely concerned 26% 21% 16% 27% 18% 20% 26% 24% Very concerned 23% 18% 16% 20% 14% 17% 20% 28% Somewhat concerned 20% 27% 30% 27% 24% 26% 28% 18% Bottom 2 Box (NET) 30% 35% 37% 26% 44% 37% 25% 29% Not too concerned 14% 15% 15% 12% 18% 16% 10% 16% Not at all concerned 17% 19% 21% 13% 26% 21% 15% 13% Don't know 0 - - 0 - 0 - - Refused 0 - 0 - - - 0 1%
QU-2.1 How much of a financial strain would you say the cost of heating has put on your household this winter? Would you say… [READ LIST. ACCEPT ONE RESPONSE.]
New York State
Capital Area
Erie County
Dutchess County
Monroe County
Onondaga County
Long Island NYC
Base: Total Respondents 407 401 400 400 404 406 401 400 A major strain 38% 34% 25% 48% 24% 27% 45% 35% A minor strain 36% 45% 47% 38% 45% 46% 38% 30% No strain at all 23% 20% 28% 13% 30% 26% 17% 30% Don't know 1% 0 - 1% 1% 0 0 3% Refused 1% 1% 1% 0 0 1% - 1%
2014 SURVEY OF NEW YORK STATE VOTERS AGE 50+: UTILITIES Page 10
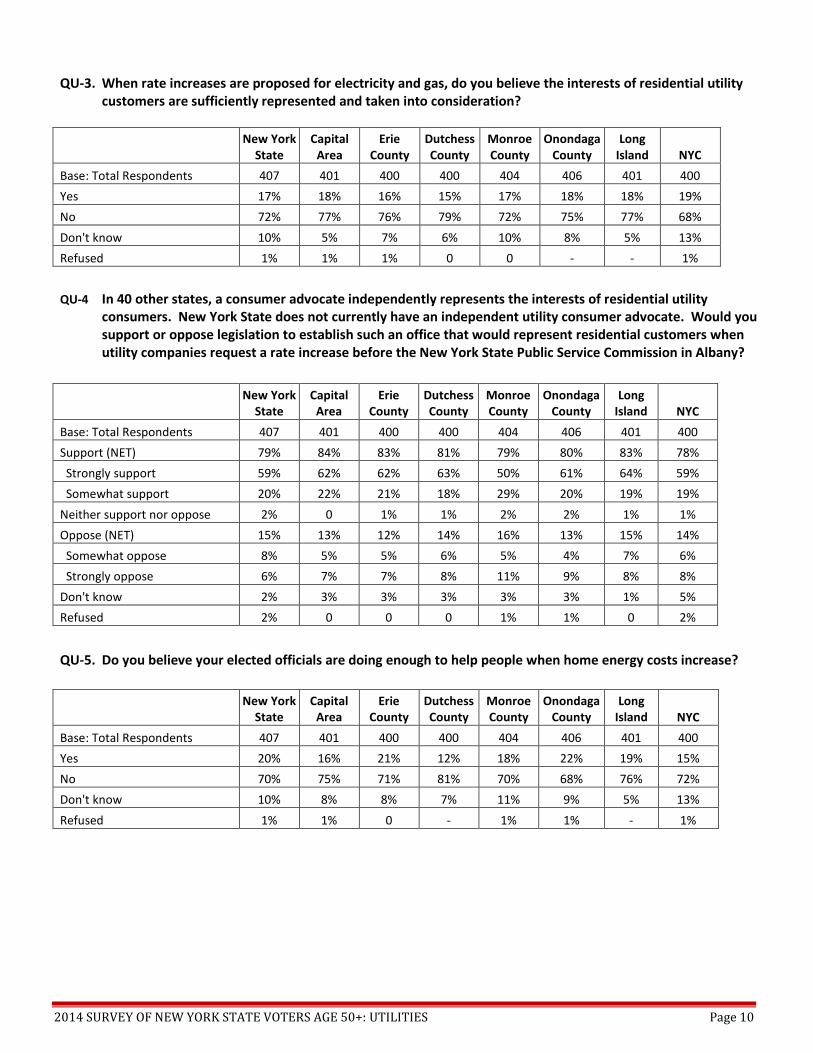
QU-3. When rate increases are proposed for electricity and gas, do you believe the interests of residential utility
customers are sufficiently represented and taken into consideration?
New York State
Capital Area
Erie County
Dutchess County
Monroe County
Onondaga County
Long Island NYC
Base: Total Respondents 407 401 400 400 404 406 401 400 Yes 17% 18% 16% 15% 17% 18% 18% 19% No 72% 77% 76% 79% 72% 75% 77% 68% Don't know 10% 5% 7% 6% 10% 8% 5% 13% Refused 1% 1% 1% 0 0 - - 1%
QU-4 In 40 other states, a consumer advocate independently represents the interests of residential utility
consumers. New York State does not currently have an independent utility consumer advocate. Would you support or oppose legislation to establish such an office that would represent residential customers when utility companies request a rate increase before the New York State Public Service Commission in Albany?
New York State
Capital Area
Erie County
Dutchess County
Monroe County
Onondaga County
Long Island NYC
Base: Total Respondents 407 401 400 400 404 406 401 400 Support (NET) 79% 84% 83% 81% 79% 80% 83% 78% Strongly support 59% 62% 62% 63% 50% 61% 64% 59% Somewhat support 20% 22% 21% 18% 29% 20% 19% 19% Neither support nor oppose 2% 0 1% 1% 2% 2% 1% 1% Oppose (NET) 15% 13% 12% 14% 16% 13% 15% 14% Somewhat oppose 8% 5% 5% 6% 5% 4% 7% 6% Strongly oppose 6% 7% 7% 8% 11% 9% 8% 8% Don't know 2% 3% 3% 3% 3% 3% 1% 5% Refused 2% 0 0 0 1% 1% 0 2%
QU-5. Do you believe your elected officials are doing enough to help people when home energy costs increase?
New York State
Capital Area
Erie County
Dutchess County
Monroe County
Onondaga County
Long Island NYC
Base: Total Respondents 407 401 400 400 404 406 401 400 Yes 20% 16% 21% 12% 18% 22% 19% 15% No 70% 75% 71% 81% 70% 68% 76% 72% Don't know 10% 8% 8% 7% 11% 9% 5% 13% Refused 1% 1% 0 - 1% 1% - 1%
2014 SURVEY OF NEW YORK STATE VOTERS AGE 50+: UTILITIES Page 11
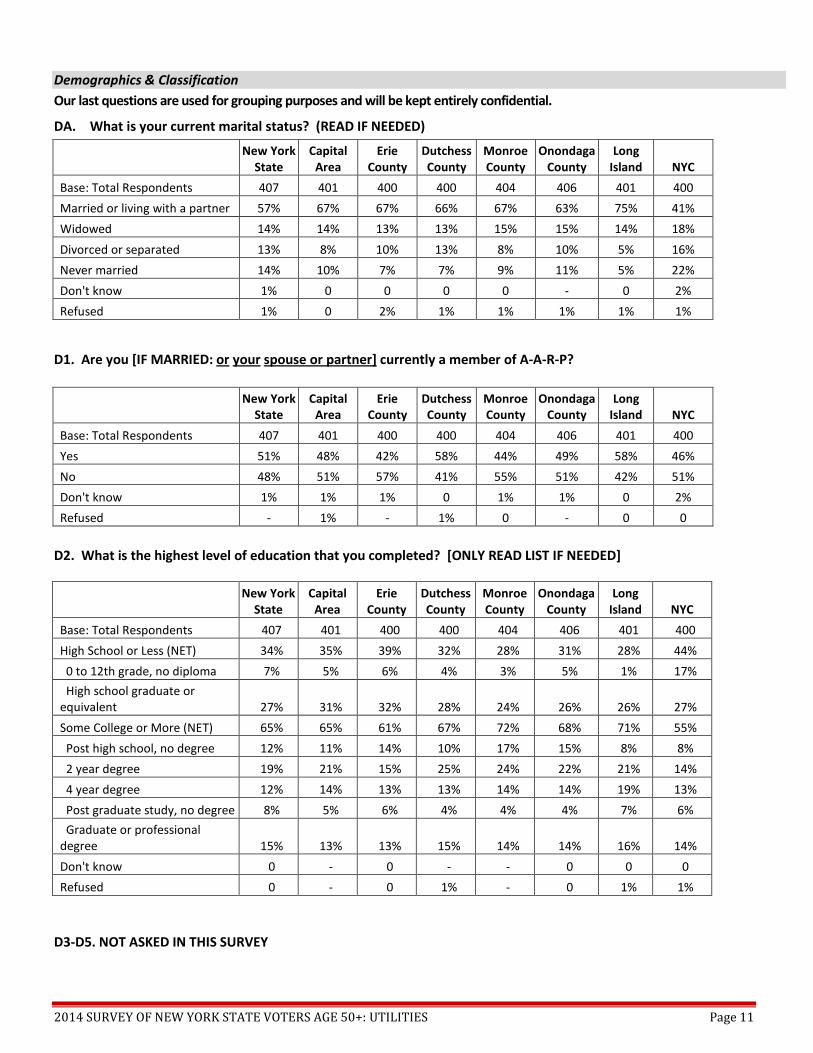
Demographics & Classification Our last questions are used for grouping purposes and will be kept entirely confidential.
DA. What is your current marital status? (READ IF NEEDED)
New York State
Capital Area
Erie County
Dutchess County
Monroe County
Onondaga County
Long Island NYC
Base: Total Respondents 407 401 400 400 404 406 401 400 Married or living with a partner 57% 67% 67% 66% 67% 63% 75% 41% Widowed 14% 14% 13% 13% 15% 15% 14% 18% Divorced or separated 13% 8% 10% 13% 8% 10% 5% 16% Never married 14% 10% 7% 7% 9% 11% 5% 22% Don't know 1% 0 0 0 0 - 0 2% Refused 1% 0 2% 1% 1% 1% 1% 1%
D1. Are you [IF MARRIED: or your spouse or partner] currently a member of A-A-R-P?
New York State
Capital Area
Erie County
Dutchess County
Monroe County
Onondaga County
Long Island NYC
Base: Total Respondents 407 401 400 400 404 406 401 400 Yes 51% 48% 42% 58% 44% 49% 58% 46% No 48% 51% 57% 41% 55% 51% 42% 51% Don't know 1% 1% 1% 0 1% 1% 0 2% Refused - 1% - 1% 0 - 0 0
D2. What is the highest level of education that you completed? [ONLY READ LIST IF NEEDED]
New York State
Capital Area
Erie County
Dutchess County
Monroe County
Onondaga County
Long Island NYC
Base: Total Respondents 407 401 400 400 404 406 401 400 High School or Less (NET) 34% 35% 39% 32% 28% 31% 28% 44% 0 to 12th grade, no diploma 7% 5% 6% 4% 3% 5% 1% 17% High school graduate or equivalent 27% 31% 32% 28% 24% 26% 26% 27% Some College or More (NET) 65% 65% 61% 67% 72% 68% 71% 55% Post high school, no degree 12% 11% 14% 10% 17% 15% 8% 8% 2 year degree 19% 21% 15% 25% 24% 22% 21% 14% 4 year degree 12% 14% 13% 13% 14% 14% 19% 13% Post graduate study, no degree 8% 5% 6% 4% 4% 4% 7% 6% Graduate or professional degree 15% 13% 13% 15% 14% 14% 16% 14% Don't know 0 - 0 - - 0 0 0 Refused 0 - 0 1% - 0 1% 1%
D3-D5. NOT ASKED IN THIS SURVEY
2014 SURVEY OF NEW YORK STATE VOTERS AGE 50+: UTILITIES Page 12
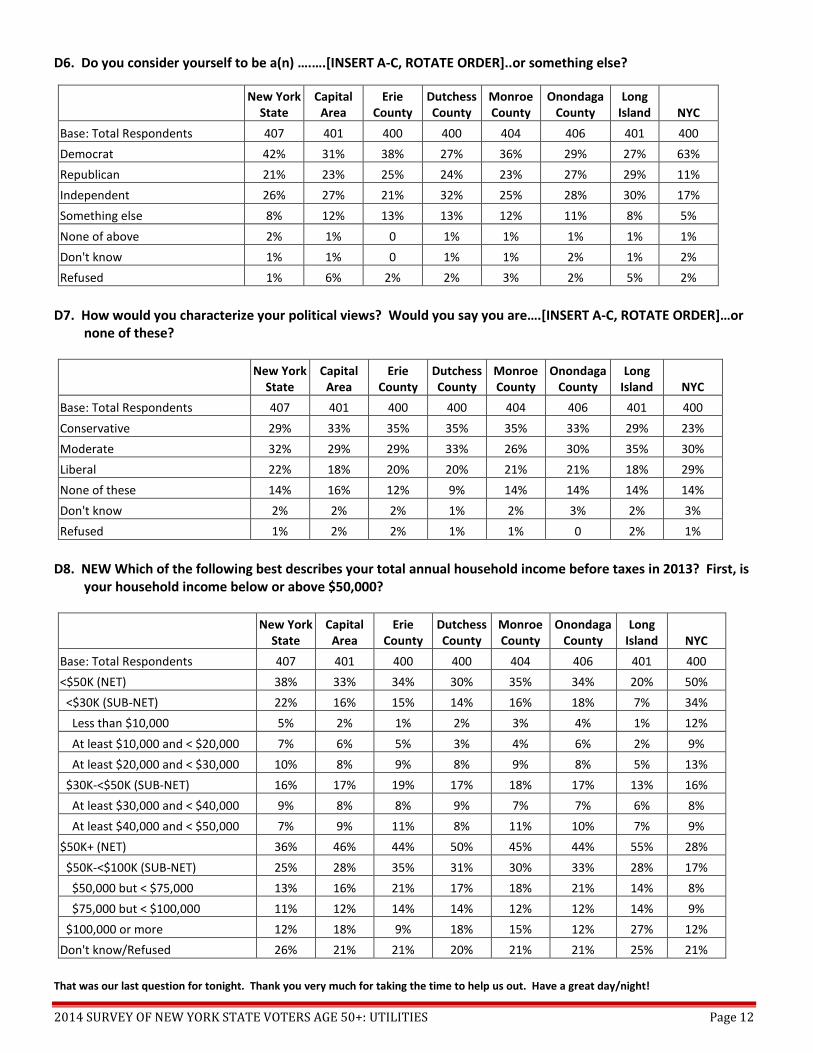
D6. Do you consider yourself to be a(n) ….….[INSERT A-C, ROTATE ORDER]..or something else?
New York State
Capital Area
Erie County
Dutchess County
Monroe County
Onondaga County
Long Island NYC
Base: Total Respondents 407 401 400 400 404 406 401 400 Democrat 42% 31% 38% 27% 36% 29% 27% 63% Republican 21% 23% 25% 24% 23% 27% 29% 11% Independent 26% 27% 21% 32% 25% 28% 30% 17% Something else 8% 12% 13% 13% 12% 11% 8% 5% None of above 2% 1% 0 1% 1% 1% 1% 1% Don't know 1% 1% 0 1% 1% 2% 1% 2% Refused 1% 6% 2% 2% 3% 2% 5% 2%
D7. How would you characterize your political views? Would you say you are….[INSERT A-C, ROTATE ORDER]…or none of these?
New York State
Capital Area
Erie County
Dutchess County
Monroe County
Onondaga County
Long Island NYC
Base: Total Respondents 407 401 400 400 404 406 401 400 Conservative 29% 33% 35% 35% 35% 33% 29% 23% Moderate 32% 29% 29% 33% 26% 30% 35% 30% Liberal 22% 18% 20% 20% 21% 21% 18% 29% None of these 14% 16% 12% 9% 14% 14% 14% 14% Don't know 2% 2% 2% 1% 2% 3% 2% 3% Refused 1% 2% 2% 1% 1% 0 2% 1%
D8. NEW Which of the following best describes your total annual household income before taxes in 2013? First, is your household income below or above $50,000?
New York State
Capital Area
Erie County
Dutchess County
Monroe County
Onondaga County
Long Island NYC
Base: Total Respondents 407 401 400 400 404 406 401 400 <$50K (NET) 38% 33% 34% 30% 35% 34% 20% 50% <$30K (SUB-NET) 22% 16% 15% 14% 16% 18% 7% 34% Less than $10,000 5% 2% 1% 2% 3% 4% 1% 12% At least $10,000 and < $20,000 7% 6% 5% 3% 4% 6% 2% 9% At least $20,000 and < $30,000 10% 8% 9% 8% 9% 8% 5% 13% $30K-<$50K (SUB-NET) 16% 17% 19% 17% 18% 17% 13% 16% At least $30,000 and < $40,000 9% 8% 8% 9% 7% 7% 6% 8% At least $40,000 and < $50,000 7% 9% 11% 8% 11% 10% 7% 9% $50K+ (NET) 36% 46% 44% 50% 45% 44% 55% 28% $50K-<$100K (SUB-NET) 25% 28% 35% 31% 30% 33% 28% 17% $50,000 but < $75,000 13% 16% 21% 17% 18% 21% 14% 8% $75,000 but < $100,000 11% 12% 14% 14% 12% 12% 14% 9% $100,000 or more 12% 18% 9% 18% 15% 12% 27% 12% Don't know/Refused 26% 21% 21% 20% 21% 21% 25% 21%
That was our last question for tonight. Thank you very much for taking the time to help us out. Have a great day/night!
2014 SURVEY OF NEW YORK STATE VOTERS AGE 50+: UTILITIES Page 13
AARP is a nonprofit, nonpartisan organization, with a membership of nearly 38 million, that helps people turn their goals and dreams into real possibilities, strengthens communities and fights for the issues that matter most to families such as healthcare, employment and income security, retirement planning, affordable utilities and protection from financial abuse. We advocate for individuals in the marketplace by selecting products and services of high quality and value to carry the AARP name as well as help our members obtain discounts on a wide range of products, travel, and services. A trusted source for lifestyle tips, news and educational information, AARP produces AARP The Magazine, the world's largest circulation magazine; AARP Bulletin; www.aarp.org; AARP TV & Radio; AARP Books; and AARP en Español, a Spanish-language website addressing the interests and needs of Hispanics. AARP does not endorse candidates for public office or make contributions to political campaigns or candidates. The AARP Foundation is an affiliated charity that provides security, protection, and empowerment to older persons in need with support from thousands of volunteers, donors, and sponsors. AARP has staffed offices in all 50 states, the District of Columbia, Puerto Rico, and the U.S. Virgin Islands. Learn more at www.aarp.org.
AARP Research For more information about this survey, please contact:
Angela Houghton, Senior Research Advisor 202.434.2261 or e-mail [email protected]