AAPI Housing Data
18
Prepared by: Korean churches for Community Development AAPI HOUSING DATA
-
Upload
kccd-korean-churches-for-community-development -
Category
Data & Analytics
-
view
486 -
download
0
Transcript of AAPI Housing Data

Prepared by: Korean churches for Community Development
AAPI HOUSING DATA

Source:h*p://mn.gov/capm/pdf/A-Community-of-Contrast.pdfh*p://www.census.gov/
AAPI-LosAngelesCountyHomeownershipRateComparableorLowerthanBlackorHispanicCommunity
DatafromAsianAmericanJus1ceCenter,U.S.CensusBureau
69%
60%59%57%54%53%52%52%51%51%50%50%48%48%
44%43%42%42%40%40%40%39%36%36%
33%32%31%30%30%
11%
0%10%20%30%40%50%60%70%80%
Taiwan
ese
Japa
nes
Chinese
White
Burm
ese
Vietna
mese
Filip
ino
SriLan
kan
AsianAm
erican
Fijian
Indo
nesian
Thai
TotalPop
ula1
on
Malaysian
Indian
Pakistan
i
Na1
veHaw
aiian
Lao1
an
NHP
I
La1n
o
AIAN
Gua
man
ian
Black
Korean
Cambo
dian
Tongan
Banglade
shi
Samoa
n
Nep
alese
Mon
golian
HomeownershipRate(2010)
2
Source:h*p://mn.gov/capm/pdf/A-Community-of-Contrast.pdfh*p://www.census.gov/
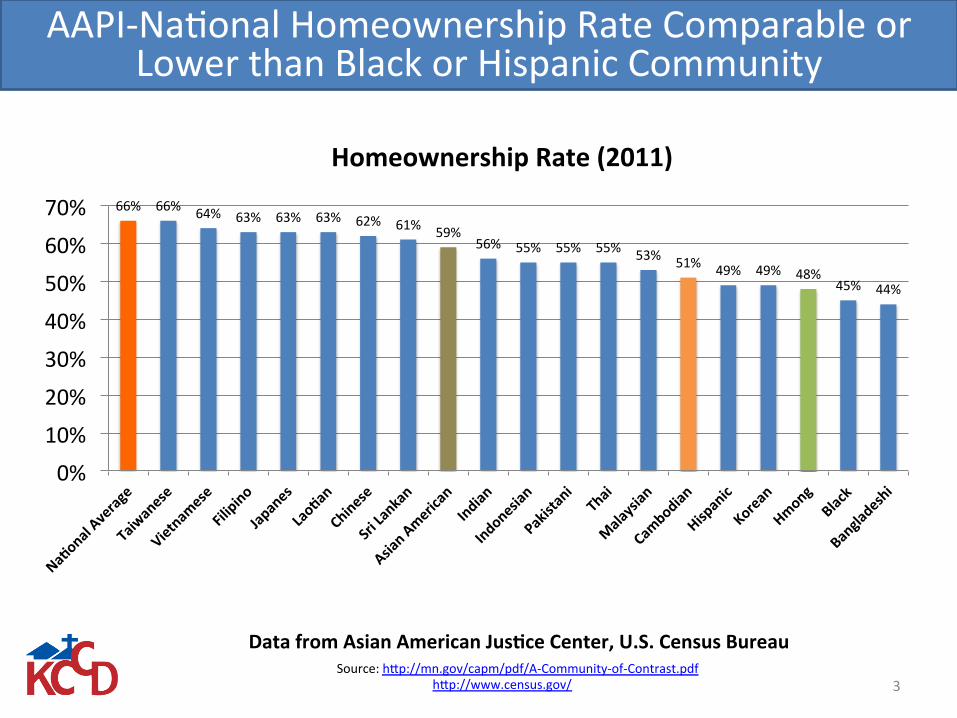
AAPI-NaRonalHomeownershipRateComparableorLowerthanBlackorHispanicCommunity
DatafromAsianAmericanJus1ceCenter,U.S.CensusBureau
66% 66% 64% 63% 63% 63% 62% 61% 59%56% 55% 55% 55% 53% 51% 49% 49% 48%
45% 44%
0%
10%
20%
30%
40%
50%
60%
70%
HomeownershipRate(2011)
3
Source:h*p://mn.gov/capm/pdf/A-Community-of-Contrast.pdfh*p://www.census.gov/
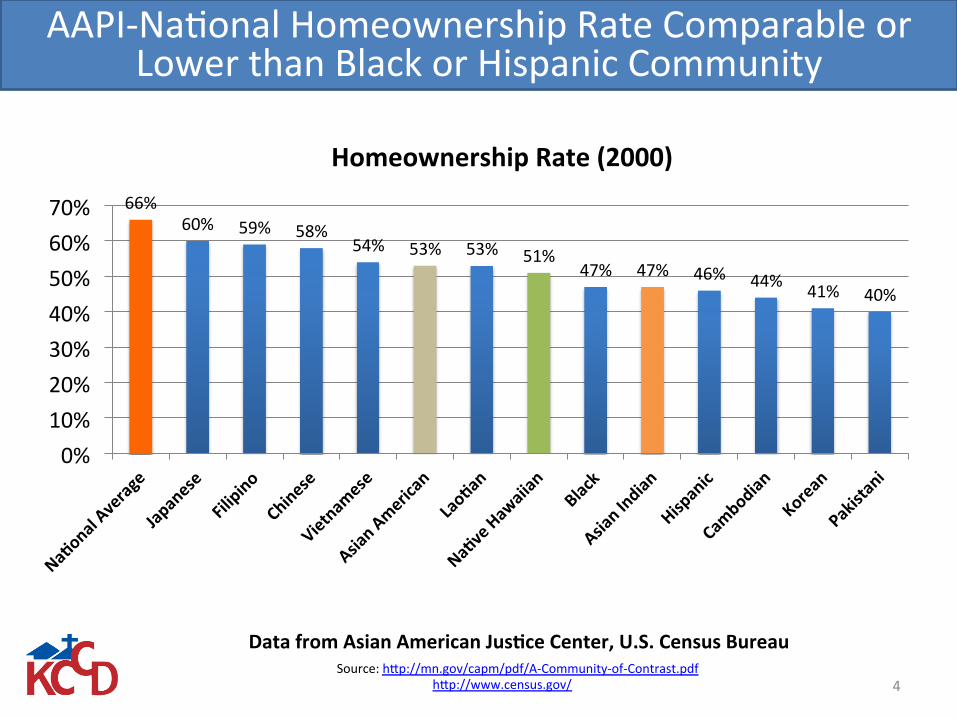
AAPI-NaRonalHomeownershipRateComparableorLowerthanBlackorHispanicCommunity
DatafromAsianAmericanJus1ceCenter,U.S.CensusBureau
66%60% 59% 58%
54% 53% 53% 51%47% 47% 46% 44% 41% 40%
0%10%20%30%40%50%60%70%
HomeownershipRate(2000)
4

Source:h*p://www.huduser.org/publicaRons/pdf/phase2_final.pdf
AAPI-HigherDiscriminaRonRatethanBlacksandHispanicsduringtheHomebuyingProcess
DatafromU.S.DepartmentofHousingandUrbanDevelopment
17% 18%21%
0%
5%
10%
15%
20%
25%
AfricanAmerican Hispanic Asian
2000-2001
5

SystemaRcdiscriminaRonoccurringin
Thislevelofdiscrimina1oniscomparabletothelevelexperiencedbyAfricanAmericanhomebuyers,andsignificantly
higherthanthelevelofdiscrimina1onagainstHispanics.
h*p://www.modelminority.com/joomla/index.php?opRon=com_content&view=arRcle&id=478:housing-bias-against-asian-americans-seen-&caRd=47:society&Itemid=56
OneinFiveAsianAmericansexperiencediscriminaRonintherentalandhomebuyingprocess
• HousingAvailability• Inspec1ons• FinancingAssistance• AgentEncouragement
DatafromModelminority
6

Source:h*p://www.huduser.org/publicaRons/pdf/phase2_final.pdf
AAPI-FaceComparableorHigherRatesofDiscriminaRonthanHispanicsandBlacks
duringtheRentalProcess
DatafromU.S.DepartmentofHousingandUrbanDevelopment
20%
24%22%
0%
5%
10%
15%
20%
25%
AfricanAmerican Hispanic Asian
2000-2001
7
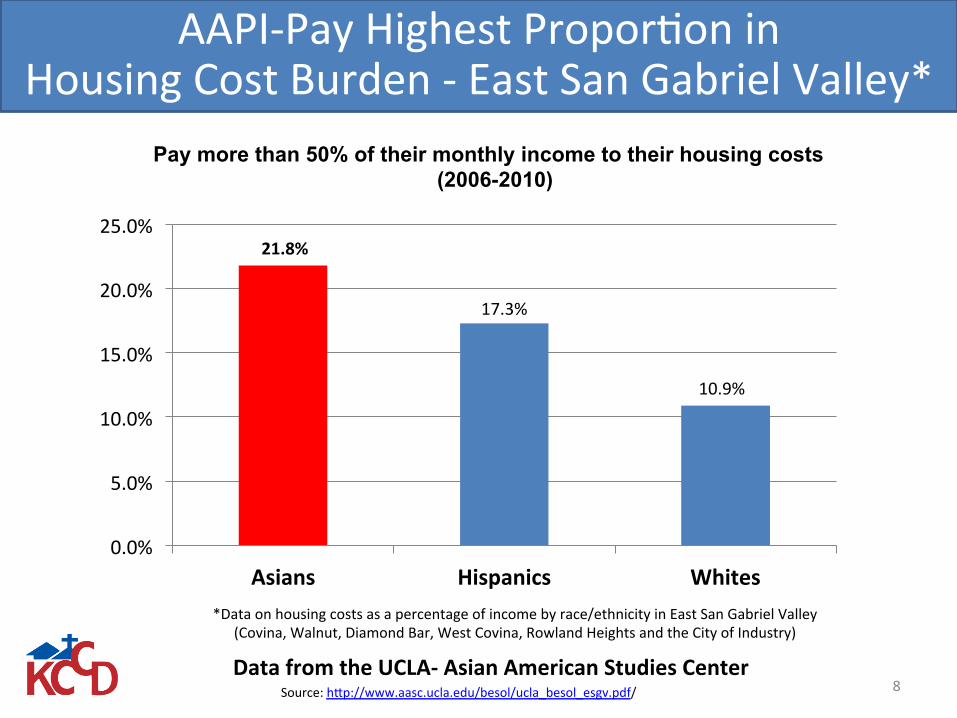
DatafromtheUCLA-AsianAmericanStudiesCenterSource:h*p://www.aasc.ucla.edu/besol/ucla_besol_esgv.pdf/
21.8%
17.3%
10.9%
0.0%
5.0%
10.0%
15.0%
20.0%
25.0%
Asians Hispanics Whites*Dataonhousingcostsasapercentageofincomebyrace/ethnicityinEastSanGabrielValley
(Covina,Walnut,DiamondBar,WestCovina,RowlandHeightsandtheCityofIndustry)
AAPI-PayHighestProporRoninHousingCostBurden-EastSanGabrielValley*
Pay more than 50% of their monthly income to their housing costs (2006-2010)
8

• Receivedsignificantlylessinforma1onontheavailabilityofsimilarunits• Werelesslikelytobeabletoinspecteithertheadver1sedunitorsimilarunits• Werelesslikelytobeofferedhelpwithfinancingfromrealestateagents• Werelesslikelytobeprequalifiedthanwhites
Impact:
ü Longer1me&highercostforhomesearchü Constrainedandlimitedchoicesforavailableunits
h*p://www.huduser.org/portal/PublicaRons/pdf/HUD-514_HDS2012.pdf
AAPI-DiscriminaRonduringHomePurchasingProcess
9

DatafromtheSea\leTimesSource:h*p://www.sea*leRmes.com/business/real-estate/asians-suffered-largest-drop-in-us-homeownership-in-08/
AAPI-GreatestDropinHomeownership
1.2%
0.9%0.8%
0.4%
0.0%
0.2%
0.4%
0.6%
0.8%
1.0%
1.2%
1.4%
Asian Black Hispanic White
2006-2008
10

AAPIHousingData
DatafromtheUCLA-AsianAmericanStudiesCenterSource:h*p://www.aasc.ucla.edu/besol/ucla_besol_esgv.pdf/
AAPI-OnlyGrouptoDeclineinHomeownershipRate–EastSanGabrielValley*
0.5%
-4.1%
0.6%0.3%
-5.0%-4.0%-3.0%-2.0%-1.0%0.0%1.0%
Whites Asians Hispanics Others
2000–2010*
*EastSanGabrielValley(Covina,Walnut,DiamondBar,WestCovina,RowlandHeightsandtheCityofIndustry)
11

AAPIHousingData
DatafromtheUCLA-AsianAmericanStudiesCenterSource:h*p://www.aasc.ucla.edu/besol/ucla_besol_esgv.pdf
AAPI-GreatestDeclineinHomeownershipRate-EastSanGabrielValley*
-0.7%
-7.8%
1.1%
-10.0%
-8.0%
-6.0%
-4.0%
-2.0%
0.0%
2.0%
Whites Asians Hispanics
2006–2010*
*EastSanGabrielValley(Covina,Walnut,DiamondBar,WestCovina,RowlandHeightsandtheCityofIndustry)
12

DatafromtheUCLA-AsianAmericanStudiesCenterSource:h*p://www.aasc.ucla.edu/besol/ucla_besol_esgv.pdf/(pg.27,figure7)
AAPI-HighestRateofForeclosedProperResaherDefaulRng–EastSanGabrielValley*
2007 to 2010*
56%
47% 45%49%
0%
10%
20%
30%
40%
50%
60%
Asian Black Hispanic White
*EastSanGabrielValley(Covina,Walnut,DiamondBar,WestCovina,RowlandHeightsandtheCityofIndustry)
13

“Wefindthatracehasanindependenteffectonforeclosureevena<ercontrollingforborrowerincomeandcreditscore.”
Inpar1cular,Asianborrowerswere1.31mesmore
likelytobeinforeclosureaswhiteborrowers
h\p://www.frbsf.org/community-development/files/wp08-051.pdf
AAPI-ProbabilityofForeclosureComparabletoOtherMinorityGroups
14

AAPI-2ndHighestDropinWealth
DatafromthePewResearchCenterSource:h*p://www.pewsocialtrends.org/2011/07/26/wealth-gaps-rise-to-record-highs-between-whites-blacks-hispanics/
66%
54% 53%
16%
51%
32%
23%18%
0%
10%
20%
30%
40%
50%
60%
70%
Hispanic Asian Black White
AllAssets
HomeEquity
All Assets and Home Equity
15

AAPI-ProbabilityofForeclosureComparabletoLaRnosat1.4xinCalifornia
1.8
1.4 1.3
0
0.4
0.8
1.2
1.6
2
AfricanAmerican Hispanic Asian
DatafromtheFederalReserveBankofSanFranciscoSource:h*p://www.frbsf.org/community-development/files/cra_lending_during_subprime_meltdown11.pdf
(California,2008)
16

*GetStartedprogramhelpspeoplebuyhomesinlower-incomeneighborhoodsor"majorityminority"neighborhoodssuchasHarleminManha*an,orSt.AlbansinQueens.
h*p://www.fairhousingjusRce.org/2015/02/03/opening-acts-february-3-2015/
AAPI-DiscriminaRoninMortgageLendingPracRces
Inves1ga1onandDatafromfairhousingjus1ce17
QualifiedSouthAsiantester(w/SameLoanOfficer)
• Offered$400,000valuehome
• Maximumloanamountof$320,000(ConvenRonal)
• EncouragedtousetheGetStartedprogram(lower-incomeneighborhoods)*
LessQualifiedWhiteTester(w/SameLoanOfficer
• Offered$450,000valuehome
• Maximumloanamountof$405,000(ConvenRonal)
• NottoldabouttheGetStartedprogram(lower-incomeneighborhoods)*

AAPI-SmallBusinessesDisproporRonateDependenceonHomeEquityLine
DatafromtheFederalReserve-SmallBusinessMee1ngSeriesSource:h*p://www.federalreserve.gov/newsevents/conferences/sbc_small_business_summary.pdf
DownwardSpiralLeadingtoForeclosure
18
X
Dispropor1onateDependenceonHomeEquityLine
Reduc1oninHomeValue
Reduc1oninLineofCredit
Nega1veImpactOnBusiness
ImpactsAbilitytoPayMortgage
Payment