AAPA July 12, 2005 · 2005-07-19 · July 12, 2005 The Risk Management Function Presented by: Jeff...
50
Transcript of AAPA July 12, 2005 · 2005-07-19 · July 12, 2005 The Risk Management Function Presented by: Jeff...


AAPA Port Administration and Legal
Issues Seminar July 12, 2005
The Risk Management Function
Presented by: Jeff Hollingsworth, Risk Manager-Port of Seattle

Risk Management Function• Risk Identification
– Knowing what you have, where it is, value, condition, impact– Information is not static - dynamic
• Risk Analysis– Sorting, organizing, and prioritizing information
• Risk Control– Look at all alternatives considering long term strategic plans
• Risk Financing– Integrating risk related costs into budget– Strategic element taking into account future plans
• Risk Administration– Communication throughout all organizational levels– Building relationships– Presenting “risk” data in that management can relate to

Where is my Dozer ?
This is what happens when things get lost and they turn up in the
most unexpected places.
The Risk Manager
Risk Management Function

Risk Management Function at the Port of Seattle Defined by:
• Risk Management Department – What we view as necessary support functions – What we see as value added activity– What we see from a strategic standpoint
• Port Operating Divisions– Where we add value to daily operating functions– Where we can help meet certain Business Unit initiatives– Where we can help meet elements of the Port’s 2003-2007 Values
and Strategies
• Users of Port Facilities– Ensuring their interaction is done in accordance with their needs
• Providers of Port Capital– Protect their investment

DEPUTY CHIEF EXECUTIVE OFFICER/GENERAL COUNSELLinda Strout
DEPUTY CHIEF EXECUTIVE OFFICER/GENERAL COUNSELLinda Strout
RISKMANAGER
Jeff Hollingsworth
RISKMANAGER
Jeff Hollingsworth
DIRECTOR, HEALTH ENVIRONMENTAL AND RISK SERVICES (HERS)Wayne Grotheer
DIRECTOR, HEALTH ENVIRONMENTAL AND RISK SERVICES (HERS)Wayne Grotheer
EMPLOYEE LOSS PREVENTION
PROGRAMMANAGER
Manette Moses
EMPLOYEE LOSS PREVENTION
PROGRAMMANAGER
Manette Moses
HEALTH & SAFETYMANAGEMENT
SPECIALISTS Heather Barden I David Epstein II
Dana Stahl II
HEALTH & SAFETYMANAGEMENT
SPECIALISTS Heather Barden I David Epstein II
Dana Stahl II
MANAGEMENTSPECIALIST DISABILITY
Britney Martinez
MANAGEMENTSPECIALIST DISABILITY
Britney Martinez
HEALTH & SAFETYANALYST
Jennifer Lewis
HEALTH & SAFETYANALYST
Jennifer Lewis
CLAIMSMANAGER
Peggy McPartland
CLAIMSMANAGER
Peggy McPartland
CLAIMSSPECIALIST
Tony King
CLAIMSSPECIALIST
Tony King
STAFF ASSISTANT IVDanielle Foort
STAFF ASSISTANT IVDanielle Foort
RISK MANAGEMENT
SPECIALIST
RISK MANAGEMENT
SPECIALIST
RISK SUMMER INTERN
Christina Lee
RISK SUMMER INTERN
Christina Lee
ENVIRONMENTAL DEPARTMENT
(10 Persons)
ENVIRONMENTAL DEPARTMENT
(10 Persons)

A Diverse PortA Diverse Port

Port CommissionersPort Commissioners
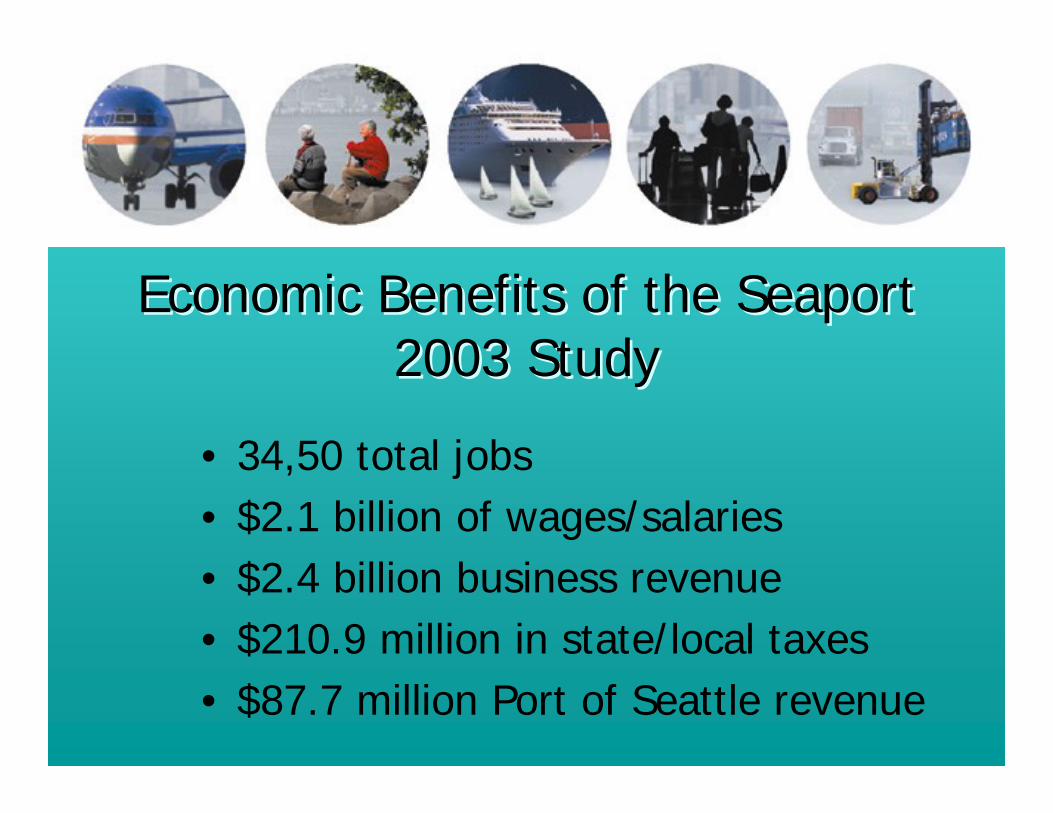
Economic Benefits of the Seaport2003 Study
Economic Benefits of the Seaport2003 Study
• 34,50 total jobs• $2.1 billion of wages/salaries• $2.4 billion business revenue• $210.9 million in state/local taxes• $87.7 million Port of Seattle revenue


Historical PerspectiveHistorical Perspective


Terminal 5Terminal 5

Terminal 18Terminal 18


Piers 90/91
North Bay


Airport Capital ImprovementsAirport Capital Improvements

Erect South Hall Trusses

Complete Glass Curtain Wall

Moving Walkway Installation

Loading Bridge Installation
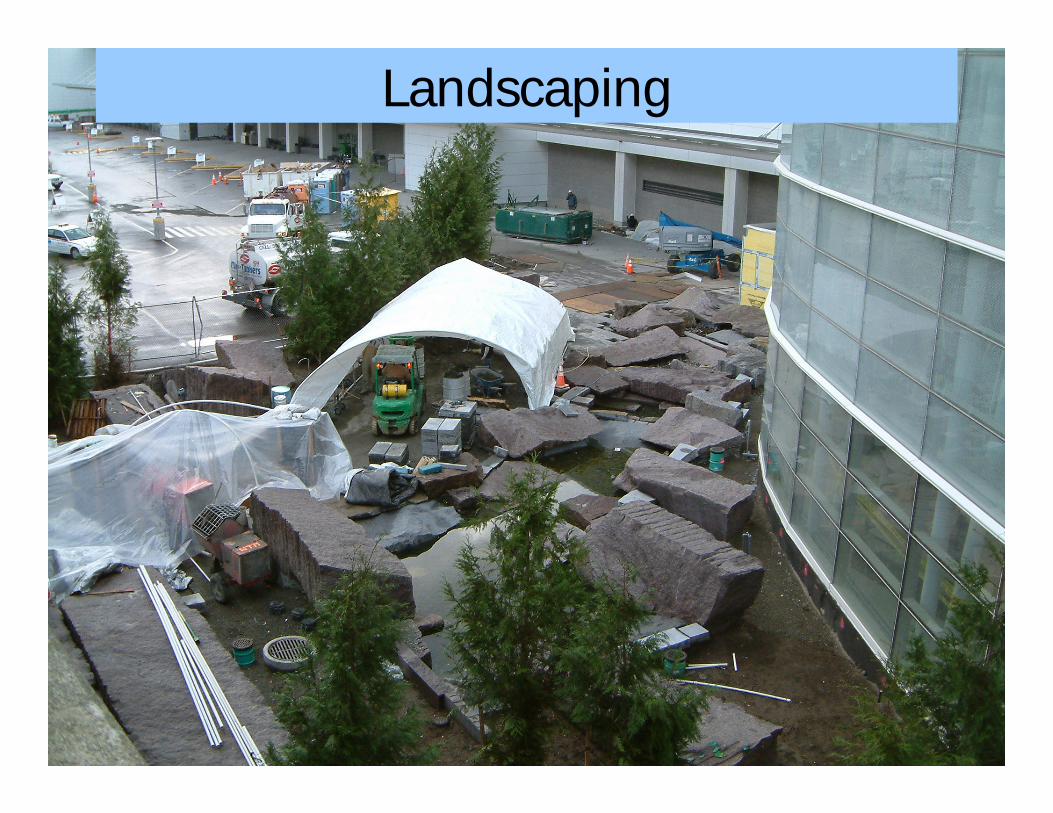
Landscaping

Risk Management Operations
• We need to know what the Port is responsible for:• Port is a big landlord and owns a lot of property• TIV ~ $3 Billion (55% Aviation and 45% Seaport)
• Port operates very little:• Cranes maintained by terminal operators• Some maintenance done on jet bridges
• Port has numerous contractual obligations • Leases• Management agreements • Construction contracts

Risk Management Operations• We need to know how the Port functions
internally
• Budget process- Know timing/cost constraints
• Know the key managers in the Business Units
• Know where to go for information• Insurance renewals• Claims costs for retained losses• Property valuations• Safety improvements• Peers/Benchmarking

Risk Management Operations• Know how to use information
• Insurance renewals• Internal risk management budget justification• Update Senior Managers on Port risk costs • Evaluate and justify new programs• Determine the proper retention point• Benchmarking with peers
• Claims Management System (RMIS)• Critical for monitoring claims costs• To identify target areas for safety improvement• Subrogation of property losses• Cost of risk benchmarking

Risk Management Communication Success
• Relationships with Business Units• Tying proposals into budget process• Justifying new programs• Using a collaborative process• Sharing results of programs• Thinking ahead • Creating realistic targets

Risk Costs 2004-2005
$4,700,626 $1,987,042 $2,713,584 Total
$1,443,916 $ 685,283 $ 758,633 Liability Insurance
$ 16,800 $ 6,800 $ 10,000 Liability Retained
$ 27,500 $ 6,500 $ 21,000 Property Retained
$1,367,974 $ 643,256 $ 724,718 Property Insurance
$ 61,000 $ 21,000 $ 40,000 Worker Compensation Retained
$ 400,000 $ 140,000 $ 260,000 Worker Comp State Assessment
$ 304,975 $ 106,741 $ 198,234 Contracted Services
$1,078,461 $ 377,461 $ 701,000 Risk Management Administration
Total PortSeaport AviationYear 2005 YTD 5/19/05
$5,511,952 $2,538,821 $2,973,131 Total
$1,349,538 $ 715,664 $ 633,874 Liability Insurance
$ 77,700 $ 25,900 $ 51,800 Liability Retained
$ 249,800 $ 194,000 $ 55,800 Property Retained
$1,876,914 $ 938,457 $ 938,457 Property Insurance
$ 286,000 $ 79,600 $ 206,400 Worker Compensation Retained
$ 400,000 $ 140,000 $ 260,000 Worker Comp State Assessment
$ 292,000 $ 102,200 $ 189,800 Contracted Services
$ 980,000 $ 343,000 $ 637,000 Risk Management Administration
Total PortSeaport AviationYear 2004 Actual
Retained Costs Are Variable CostsThat We Try To Control

Cost of Risk 2000-2005Per $1000 of Revenue
$11.84$14.10
$16.93
$12.39 $13.40$11.32 $11.10
$9.62 $8.87
$22.43
$27.72
$33.91 $32.91 $33.12$29.93 $29.76
$26.15
$22.57
$15.27$18.37
$21.81
$17.60 $18.48$15.75 $15.61
$13.31$11.93
$-
$5.00
$10.00
$15.00
$20.00
$25.00
$30.00
$35.00
$40.00
2000 2001 2002 2003Est
2003Act
2004Est
2004Act
2005Est
2005YTD
Cost of Risk Aviation
Cost of Risk Seaport
Cost of Risk Total Port
Average 2003 Cost of Risk: Rims Benchmark Survey
All Industry = $ 11.96Industry with Revenues Between $ 250 - $ 500 million = $ 10.93Government and Non-Profits = $13.12Port of Seattle Seaport 2004 = $29.76Port of Seattle Aviation 2004 = $11.10Port of Seattle Total 2004 = $15.61

Cost of Risk 2000-2005
$5,818,251
$7,362,596$7,053,397
$5,934,870$5,511,952
$5,195,326
$-
$1,000,000
$2,000,000
$3,000,000
$4,000,000
$5,000,000
$6,000,000
$7,000,000
$8,000,000
2000 2001 2002 2003 2004 2005 Est
Risk AdministrationContracted ServicesWorker CompensationProperty ProgramLiability ProgramTotal

Seaport Cost of Risk 2004Seaport Total = $2,538,821
(2003=$2,724,111)
Risk Management Administration
21%
Contracted Services
6%
Worker Comp State Assessment
9%
Worker Compensation
Retained7%
Property Insurance32%
Property Retained2%
Liability Retained2%
Liability Insurance21%

Aviation Cost of Risk 2004Aviation Total =$ 2,973,131
(2003= $3,175,427) Risk Management Administration
21%
Contracted Services
6%
Worker Comp State Assessment
9%
Worker Compensation
Retained7%
Property Insurance32%
Property Retained2%
Liability Retained2%
Liability Insurance21%

41211168114119Total1403922005632192319200438113131120035329231920021042522723200114047219452000TotalEmploymentPropertyAuto/BusInjury/PD
Seaport169818731841423Total931513742005315517442492004292712332402003
30021440244200233829322952001360116223212000TotalEmploymentPropertyAuto/BusInjury/PD
Aviation
Reported Incidents/Not Claims

Claim and Premium Costs
$18,320,000 $ 3,474,217 $ 1,708,217 $ 448,000 $ 1,318,000 Totals
$ 2,900,000 $ 59,000 $ 7,000 $ 6,000 $ 46,000 2005
$ 3,500,000 $ 338,000 $ 206,000 $ 64,000 $ 68,000 2004
$ 4,000,000 $ 564,000 $ 29,000 $ 114,000 $ 421,000 2003
$ 3,620,000 $ 1,239,000 $ 600,000 $ 214,000 $ 425,000 2002
$ 2,400,000 $ 813,217 $ 700,217 $ -$ 113,000 2001
$ 1,900,000 $ 461,000 $ 166,000 $ 50,000 $ 245,000 2000
Insurance Premium
Paid**Total
Claims Paid*Seaport Claims
CorporateClaims
AviationClaims
*Excludes 2001 Earthquake Claims Paid (Insurance Company Paid Claims ~ $ 1.1 million)
**Property and Liability Insurance

Share Improvements
• Good Aviation commitment towards employee safety – Safety focus is translating into better control of liability claims– Incident rate is down and same with lost work day rate
• No passenger injuries related to cruise traffic at airport– Great teamwork between Landside, Maintenance, Project Management,
and Risk Management – Due to preseason efforts to ensure safety of passengers, liability issues
were identified and corrected prior to cruise operations
• Excellent year for landside busing in terms of liability– New buses have reduced # of injuries from getting on/off– No injury claims in 2004
• Good cooperation between AV-Police and Risk Mgt– Police handbook revised, use of force policy refined– SWAT team issues and joint liability
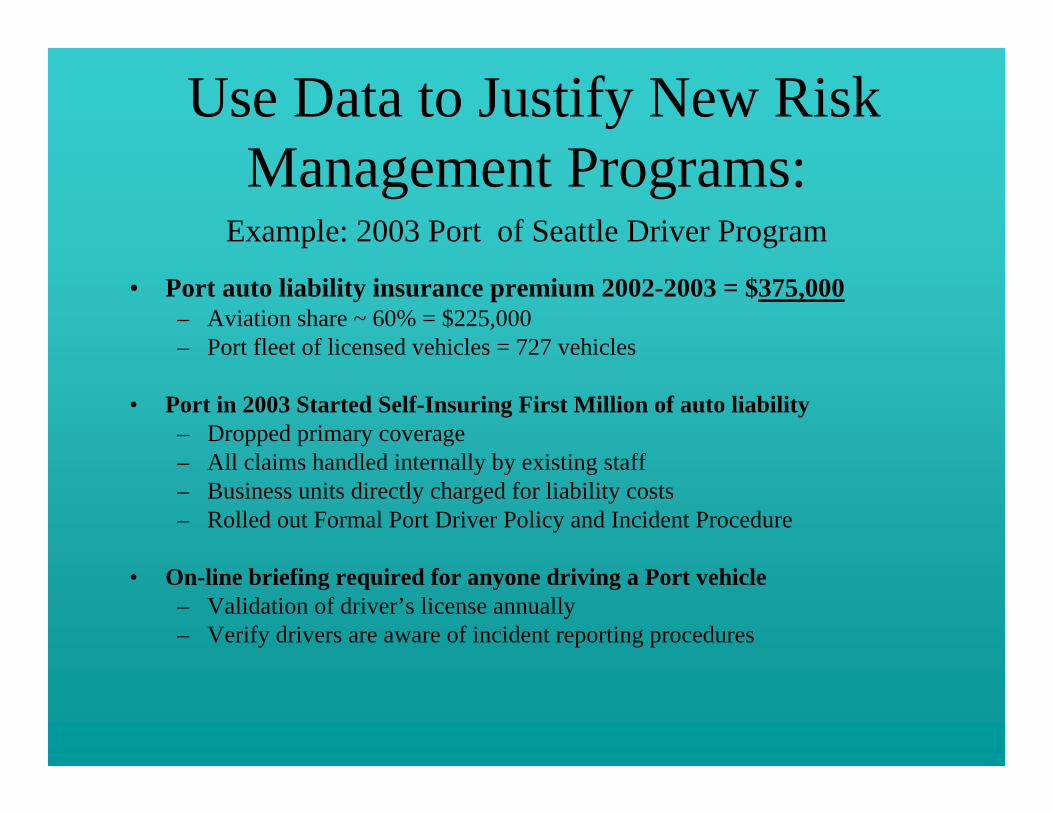
Use Data to Justify New Risk Management Programs:
Example: 2003 Port of Seattle Driver Program
• Port auto liability insurance premium 2002-2003 = $375,000– Aviation share ~ 60% = $225,000– Port fleet of licensed vehicles = 727 vehicles
• Port in 2003 Started Self-Insuring First Million of auto liability– Dropped primary coverage– All claims handled internally by existing staff – Business units directly charged for liability costs– Rolled out Formal Port Driver Policy and Incident Procedure
• On-line briefing required for anyone driving a Port vehicle– Validation of driver’s license annually– Verify drivers are aware of incident reporting procedures

Insurance Premium vs. Auto Liability Cost
$0$50,000
$100,000$150,000$200,000$250,000$300,000$350,000$400,000$450,000
1996 1997 1998 1999 2000 2001 2002 2003 2004
Liability CostPremium
2004 is estimated liability premium cost Premium in 2003 only reflects ½ year of premium.

Port Emphasis on Safe Driving To Avoid This !!!

Risk Management 2005 Targets• Reduce cost of risk by at least 15%
– All risk cost areas to contribute• Claims/Retained Losses (includes worker compensation)• Insurance Premium• Contracted Services
• Raise collections vs. total auto physical damage costs – Requires reducing # of at fault auto accidents – Target is set at 90% - Port is currently at about 45%– All driving incidents to be reported with 24 hours– Driver review and training needs assessment done following incident
• Maintain ratio of Aviation liability claims/events at < 5%– Less than 5 new claims in 2005 (liability for property/injury)
• Business Continuity Exercise – Corporate Pier 69

Thanks for Your Attention!