Aalborg Universitet Visual analysis of faces with ... · sundheds-IT, biometri og kriminaltekniske...
340
Aalborg Universitet Visual analysis of faces with application in biometrics, forensics and health informatics Haque, Mohammad Ahsanul DOI (link to publication from Publisher): 10.5278/vbn.phd.engsci.00104 Publication date: 2016 Document Version Publisher's PDF, also known as Version of record Link to publication from Aalborg University Citation for published version (APA): Haque, M. A. (2016). Visual analysis of faces with application in biometrics, forensics and health informatics. Aalborg Universitetsforlag. Ph.d.-serien for Det Teknisk-Naturvidenskabelige Fakultet, Aalborg Universitet https://doi.org/10.5278/vbn.phd.engsci.00104 General rights Copyright and moral rights for the publications made accessible in the public portal are retained by the authors and/or other copyright owners and it is a condition of accessing publications that users recognise and abide by the legal requirements associated with these rights. ? Users may download and print one copy of any publication from the public portal for the purpose of private study or research. ? You may not further distribute the material or use it for any profit-making activity or commercial gain ? You may freely distribute the URL identifying the publication in the public portal ? Take down policy If you believe that this document breaches copyright please contact us at [email protected] providing details, and we will remove access to the work immediately and investigate your claim. Downloaded from vbn.aau.dk on: February 01, 2020
Transcript of Aalborg Universitet Visual analysis of faces with ... · sundheds-IT, biometri og kriminaltekniske...

Aalborg Universitet
Visual analysis of faces with application in biometrics, forensics and healthinformatics
Haque, Mohammad Ahsanul
DOI (link to publication from Publisher):10.5278/vbn.phd.engsci.00104
Publication date:2016
Document VersionPublisher's PDF, also known as Version of record
Link to publication from Aalborg University
Citation for published version (APA):Haque, M. A. (2016). Visual analysis of faces with application in biometrics, forensics and health informatics.Aalborg Universitetsforlag. Ph.d.-serien for Det Teknisk-Naturvidenskabelige Fakultet, Aalborg Universitethttps://doi.org/10.5278/vbn.phd.engsci.00104
General rightsCopyright and moral rights for the publications made accessible in the public portal are retained by the authors and/or other copyright ownersand it is a condition of accessing publications that users recognise and abide by the legal requirements associated with these rights.
? Users may download and print one copy of any publication from the public portal for the purpose of private study or research. ? You may not further distribute the material or use it for any profit-making activity or commercial gain ? You may freely distribute the URL identifying the publication in the public portal ?
Take down policyIf you believe that this document breaches copyright please contact us at [email protected] providing details, and we will remove access tothe work immediately and investigate your claim.
Downloaded from vbn.aau.dk on: February 01, 2020


MO
HA
MM
AD
AH
SAN
UL H
AQ
UE
VISUA
L AN
ALYSIS O
F FAC
ES WITH
APPLIC
ATION
IN
BIO
METR
ICS, FO
REN
SICS A
ND
HEA
LTH IN
FOR
MATIC
S
VISUAL ANALYSIS OF FACES WITH APPLICATION IN BIOMETRICS,
FORENSICS AND HEALTH INFORMATICS
BYMOHAMMAD AHSANUL HAQUE
DISSERTATION SUBMITTED 2016


VISUAL ANALYSIS OF FACES WITH
APPLICATION IN BIOMETRICS,
FORENSICS AND HEALTH INFORMATICS
PH.D. DISSERTATION
by
Mohammad Ahsanul Haque
Department of Architecture, Design and Media Technology
Aalborg University, Denmark
April 2016

Dissertation submitted: April 2016
PhD supervisor: Prof. Thomas B. Moeslund Aalborg University, Denmark
Assistant PhD supervisor: Associate Prof. Kamal Nasrollahi Aalborg University, Denmark
PhD committee: Associate Prof. Claus B. Madsen (chairman) Aalborg University, Denmark
Assistant Prof. Paulo Luis Serras Lobato Correia Instituto Superior Técnico, Lisboa, Portugal
Associate Prof. Peter Ahrendt Aarhus University, Denmark
PhD Series: Faculty of Engineering and Science, Aalborg University
ISSN (online): 2246-1248ISBN (online): 978-87-7112-562-7
Published by:Aalborg University PressSkjernvej 4A, 2nd floorDK – 9220 Aalborg ØPhone: +45 [email protected]
© Copyright: Mohammad Ahsanul Haque
Printed in Denmark by Rosendahls, 2016

I
CV
Mohammad A. Haque
Mohammad A. Haque received the BS degree in Computer Science and
Engineering from the University of Chittagong, Bangladesh, in 2008 and the MS
degree in Computer Engineering and Information Technology from the University
of Ulsan, South Korea, in 2012. He started his PhD study in Computer Vision at the
Department of Architecture, Design and Media Technology, Aalborg University,
Denmark, at Nov 2012.
Mohammad was a tenured lecturer at the Department of Computer and
Communication Engineering, International Islamic University Chittagong,
Bangladesh. He started his research career by working on Biometrics and Image
Processing during his undergraduate study. Later he expressed his interest to
machine learning and audio-visual signal processing, and defended his Master’s
thesis on machine learning. His PhD study was aiming to developing computer
vision methods for automatic in-home patient monitoring by focusing on the
analysis of human facial videos.
Mohammad has a number of publications in indexed journals and peer-reviewed
international conferences in all of the aforementioned research areas. He received
scholarships and funding from Bangladesh, South Korea, Denmark, and European
Union for his study and research. He is a member of Visual Analysis of people Lab,
Aalborg University, Denmark. He was also a member of Center for Machine Vi-
sion, Oulu University, Finland as a visiting researcher and Embedded Systems Lab,
Ulsan University, South Korea as a research assistant.
Mohammad has supervised a number of individual students and groups for re-
search and project works. His current research interests are visual analysis of peo-
ple, biometrics, and decision support systems in health informatics.


III
ENGLISH SUMMARY
Computer vision-based analysis of human facial video provides information regard-
ing to expression, diseases symptoms, and physiological parameters such as heart-
beat rate, blood pressure and respiratory rate. It also provides a convenient source
of heartbeat signal to be used in biometrics and forensics. This thesis is a collection
of works done in five themes in the realm of computer vision-based facial image
analysis: Monitoring elderly patients at private homes, Face quality assessment,
Measurement of physiological parameters, Contact-free heartbeat biometrics, and
Decision support system for healthcare.
The work related to monitoring elderly patients at private homes includes a de-
tailed survey and review of the monitoring technologies relevant to older patients
living at home by discussing previous reviews and relevant taxonomies, different
scenarios for home monitoring solutions for older patients, sensing and data acqui-
sition techniques, data processing and analysis techniques, available datasets for
research and development, and current challenges and future research directions.
Face quality assessment theme include works related to the application of a face
quality assessment technique in acquiring high quality face sequence in real-time
and alignment of face for further analysis.
In measuring physiological parameters, two parameters are considered among
many different physiological parameters: heartbeat rate and physical fatigue.
Though heartbeat rate estimation from video is available in the literature, this thesis
proposes an improved method by using a new heartbeat footprint tracking approach
in the face. The thesis also introduces a novel way of analyzing heartbeat traces in
facial video to provide visible heartbeat peaks in the signal. A method for physical
fatigue time offset detection from facial video is also introduced.
One of the major contributions of the thesis is introducing heartbeat signal from
facial video as a novel biometric trait. The way to extract and utilize this biometric
trait in person recognition and face spoofing detection is described.
In the last part, the thesis introduces an approach for generating facial expres-
sion log as a decision support tool by employing a face quality assessment tech-
nique to reduce erroneous expression rating.
Despite of the solutions introduced in this thesis, ample of new research ques-
tions have brought forward to be solved in advancing the areas of health informat-
ics, biometrics and forensics.


V
DANSK RESUME
Videoanalyse af ansigter med computer vision kan give information om udtryk,
sygdomme, symptomer og fysiologiske parametre som hjertefrekvens, blodtryk og
respirationsfrekvens. Det er også en oplagt kilde til pulssignaler til brug i biometri
og kriminaltekniske formål. Denne afhandling er en samling af arbejde indenfor
fem områder af billedanalyse på ansigtet: Overvågning af ældre patienter i private
hjem, kvalitet af ansigtsbilleder, måling af fysiologiske parametre, kontaktfri
måling af puls, samt et beslutningsstøttesystem til medicinsk brug.
Arbejdet med overvågning af ældre i deres hjem inkluderer en detaljeret
oversigt og gennemgang af teknikker relevante for ældre patienter, der bor i egne
hjem. Tidligere publikationer og relevante taksonomier gennemgås, sammen med
forskellige scenarier for overvågningssystemer i ældres hjem, sensor- og
dataoptagelsestekninner, databehandlings- og analyseteknikker, tilgængelige
datasæt, samt nuværende udfordringer og fremtidige forskningsspørgsmål.
Vurdering af ansigtskvalitet har været brugt for at finde højkvalitets
ansigtsbilledsekvender i realtid sammen med justering af ansigtets position på tværs
af billederne til videre analyse.
De fysiologiske parametre der er målt er to blandt mange: Hjertefrekvens og
fysisk træthed. Selvom bestemmelse af hjertefrekvens i video er kendt fra
litteraturen, fremlægger denne afhandling en forbedret metode, der anvender en ny
mønstergenkendelse af hjertefrevens i ansigtet. Afhandlingen introducerer også en
ny måde til at analysere spor af hjerteslag i ansigtsvideo, der giver synlige spidser i
hjertesignalet. Yderligere introduceres også en metode til måling af fysisk træthed
fra ansigtsvideo.
Et af de mest markante resultater af arbejder er anvendelsen af hjertesignaler fra
ansigtsvideo som et biometrisk signal. Det beskrives hvordan dette kan måles og
anvendes til persongenkendelse og forhindring af svindel med ansigtsgenkendelse.
I det sidste kapitel introduceres en metode, der kan generere en log over
ansigtsudtryk som et beslutningsstøttesystem. Den bruger en
ansigtskvalitetsvurdering for at mindske mængden af fejl i klassifikationen.
Trods de nye løsninger som denne afhandling introducerer er der også
fremkommet en række nye forskningsspørgsmål, der kan give fremskidt indenfor
sundheds-IT, biometri og kriminaltekniske applikationer.


VII
ACKNOWLEDGEMENTS
PhD study is not simply reading, defining scientific problem and finding out solu-
tion. Contributing in generating new knowledge (also learning how to) is sometimes
joyful and interestingly challenging. But it is not a bed of roses and sometimes full
of anxiety and depression. Realizing these in every moment in the last three years
of continuous endeavor I would like acknowledge some significant points here.
This PhD thesis is an expedition that I could not be completed without the bless-
ings of the almighty Allah and motivation from the sunnah of prophet Muhammad
(peace be upon him).
I would like to express my sincere gratitude to my mentors Prof. Thomas B.
Moeslund and Kamal Nasrollahi, for their support, encouragement and guidance
throughout this research. They directed this research with competence, instilling
their enthusiasm, providing support in uncountable occasions. When Thomas
showed me the roadmap, Kamal gave me the vehicles along with his academic ac-
company to accomplish this journey. This work would not have been completed
without their help and practically infinite supply of comments and ideas. It has been
a great honor to work with them during my stay at Aalborg University. I would also
express my gratitude to Prof. Abdenour Hadid, Zinel and Elhocine for their warm
welcoming and collaboration during my stay at Oulu University, Finland.
I would like to thank all of my colleagues in the Visual Analysis of People La-
boratory (especially Rikke, Andreas, Humain, Chris, Jeppe, Wazahat and Theodore)
and, at a larger extent, my colleagues in the Media Technology section of the De-
partment of Architecture, Design and Media Technology. Their cordial attitude to
help me set up in new to me Danish academic environment, occasional comments
on my research, help in experimental data collections, and collaborations made my
study easier and enjoyable.
I would like to especially express my gratitude to Ramin Irani - my colleague
and my friend - who spent hours of time, talked positively, collaborated in research,
and provided courage in the time of anxiety throughout my PhD study. Special
thanks also go to Mahmudul Hasan who was here in Aalborg for around one year
and, during that time, gifted me some of the memorable moments by providing
spiritual time and deeply thought words both academically and socially.
At this point, I would delightedly like to acknowledge the contributions of my
friends of a tiny but joyful Bangladeshi community in Aalborg. Tanvir Ahmed Ma-
sum, Md. Saifuddin Khalid and Mohammad Bakhtiar Rana along with their family
deserve my gratitude for their hospitality and warm support both academically and

VISUAL ANALYSIS OF FACES WITH APPLICATION IN BIOMETRICS, FORENSICS AND HEALTH INFORMATICS
VIII
spiritually during my life in Aalborg. Mahfuza Begum and her family also provided
me mental peace in the sense of guardianship and spiritual binding. Other members
of this community are also just remarkable to be accompanied with during this
stressful period of PhD endeavor.
While pursuing my PhD, I was socially engage in social and spiritual volunteer-
ing with substantial dedication under the umbrella of Islamic Welfare Society of
Denmark. I would like to share a great deal of my achievement with my brothers
and sisters involved in this organization for their support and encouragement in my
spiritual life in Denmark that helped me balancing my study and social life during
last three years.
Last but not least, I would like to mention the sacrifice of my family members.
My father Muhammad K. Alam, mother Murshida Akter, elder sister Khurshida
Yeamin (and her family), brother Muhammad N. H. Ashif (and his family), and
younger sister Sharmina Alam don’t like my stay out of their company, but they
accepted it for the sake of the achievement of this thesis. My wife Umme S. Mar-
yam and children (two little angels Raiyaan Zaheen and Rashdan Zawad) simply
suppress their rights of having my presence with them and sacrificed years of warm
family moments to help me finishing this expedition. Maryam may not get a PhD
from a university as recognition for her effort and sacrifice during this period, but
she definitely deserves a degree of honor for her support to me while managing her
own full-time undergraduate study and two young kids. I can do nothing but suppli-
cating (d’ua) for all of them to get rewards hereafter and express my heartfelt grati-
tude for their sacrifice.

IX
TABLE OF CONTENTS
Part I ................................................................................................................................... 21
Chapter 1. Framework of the Thesis ................................................................................ 23
1.1. Abstract ........................................................................................................ 25
1.2. Introduction .................................................................................................. 25
1.3. Literature Review: Monitoring Elderly patients at private homes ............... 29
1.4. Face Quality Assessment ............................................................................. 30
1.5. Measurement of Physiological parameters ................................................... 31
1.6. Contact-Free Heartbeat Biometrics .............................................................. 34
1.7. Decision Support System for HealthCare .................................................... 35
1.8. Summary of the Contributions ..................................................................... 36
1.9. Conclusions .................................................................................................. 37
1.10. References .................................................................................................. 37
Part II .................................................................................................................................. 41
Chapter 2. Distributed Computing and Monitoring Technologies for Older
Patients ................................................................................................................................ 43
2.1. Abstract ........................................................................................................ 45
2.2. Introduction .................................................................................................. 45
2.2.1. Definition of Terms and Relevance to This Chapter ............................. 48
2.2.2. Content and Audience of This Chapter ................................................. 53
2.2.3. An Overview of the Relevant Smart-Home Projects............................. 54
2.3. Reviews and Taxonomies ............................................................................ 58
2.3.1. Previous Reviews .................................................................................. 59
2.4. Relevant Scenarios for Home Monitoring Solutions for Older Adults ........ 67
2.4.1. Healthy, Vulnerable, and Acutely Ill Older Adults ............................... 68
2.4.2. Relevant Geriatric Conditions and Threats of Deteriorating Health and
Functional Losses ............................................................................................ 70
2.4.3. Summary of the Needs .......................................................................... 76
2.5. Monitoring Technology ............................................................................... 76
2.5.1. Sensing and Data Acquisition ............................................................... 78

VISUAL ANALYSIS OF FACES WITH APPLICATION IN BIOMETRICS, FORENSICS AND HEALTH INFORMATICS
X
2.5.2. Data Processing and Analysis ............................................................... 88
2.5.3. Standards ............................................................................................... 94
2.6. Datasets ........................................................................................................ 98
2.7. Discussion .................................................................................................. 104
2.7.1. Future Challenges ............................................................................... 105
2.7.2. Future Research Directions ................................................................. 108
2.8. Conclusions ................................................................................................ 108
2.9. References .................................................................................................. 109
Part III .............................................................................................................................. 159
Chapter 3. Real-Time Acquisition of High Quality Face Sequences from an
Active Pan-Tilt-Zoom Camera ....................................................................................... 161
3.1. Abstract ...................................................................................................... 163
3.2. Introduction ................................................................................................ 163
3.3. The Proposed Approach ............................................................................. 165
3.3.1. Face Detection Module ....................................................................... 166
3.3.2. Camera Control Module ...................................................................... 166
3.3.3. Face Tracking Module ........................................................................ 168
3.3.4. Face Quality Assessment Module ....................................................... 169
3.4. Experimental Results ................................................................................. 171
3.4.1. Experimental Environment ................................................................. 171
3.4.2. Performance Evaluation ...................................................................... 172
3.5. Conclusions ................................................................................................ 173
3.6. Acknowledgement ..................................................................................... 174
3.7. References .................................................................................................. 174
Chapter 4. Quality-Aware Estimation of Facial Landmarks in Video
Sequences .......................................................................................................................... 177
4.1. Abstract ...................................................................................................... 179
4.2. Introduction ................................................................................................ 179
4.3. The proposed method ................................................................................. 182
4.3.1. Face detection module ........................................................................ 182
4.3.2. Face quality assessment module ......................................................... 183
4.3.3. Quality-aware face alignment module ................................................ 183

XI
4.4. Experimental results ................................................................................... 187
4.4.1. Performance evaluation ....................................................................... 187
4.4.2. Performance comparison ..................................................................... 188
4.5. Conclusions ................................................................................................ 191
4.6. References .................................................................................................. 193
Part IV .............................................................................................................................. 197
Chapter 5. Heartbeat Rate Measurement from Facial Video ...................................... 199
5.1. Abstract ...................................................................................................... 201
5.2. Introduction ................................................................................................ 201
5.3. Theory ........................................................................................................ 203
5.4. The Proposed Method ................................................................................ 205
5.4.1. Face Detection and Face Quality Assessment ..................................... 207
5.4.2. Feature Points and Landmarks Tracking ............................................. 207
5.4.3. Vibration Signal Extraction ................................................................. 208
5.4.4. Heartbeat Rate (HR) Measurement ..................................................... 208
5.5. Experimental Environments and Datasets .................................................. 208
5.5.1. Experimental Environment ................................................................. 208
5.5.2. Performance Evaluation ...................................................................... 209
5.5.3. Performance Comparison .................................................................... 213
5.6. Conclusions ................................................................................................ 215
5.7. References .................................................................................................. 215
Chapter 6. Facial Video based Detection of Physical Fatigue for Maximal
Muscle Activity ................................................................................................................. 219
6.1. Abstract ...................................................................................................... 221
6.2. Introduction ................................................................................................ 221
6.3. The Proposed Method ................................................................................ 224
6.3.1. Face Detection and Face Quality Assessment ..................................... 224
6.3.2. Feature Points and Landmarks Tracking ............................................. 225
6.3.3. Vibration Signal Extraction ................................................................. 228
6.3.4. Physical Fatigue Detection .................................................................. 229
6.4. Experimental Results ................................................................................. 230

VISUAL ANALYSIS OF FACES WITH APPLICATION IN BIOMETRICS, FORENSICS AND HEALTH INFORMATICS
XII
6.4.1. Experimental Environment ................................................................. 230
6.4.2. Performance Evaluation ...................................................................... 232
6.4.3. Performance Comparision ................................................................... 234
6.5. Conclusions ................................................................................................ 235
6.6. References .................................................................................................. 237
Chapter 7. Multimodal Estimation of Heartbeat Peak Locations and Heartbeat
Rate from Facial Video using Empirical Mode Decomposition ................................... 241
7.1. Abstract ...................................................................................................... 243
7.2. Introduction ................................................................................................ 243
7.3. Related Works ............................................................................................ 245
7.4. The Proposed System ................................................................................. 246
7.4.1. Video Acquisition and Face Detection ................................................ 246
7.4.2. Facial Color and Motion Traces Extraction ........................................ 247
7.4.3. Vibrating Signal Extraction ................................................................. 248
7.4.4. EMD-based Signal Decomposition for the Proposed HPL Estimation 249
7.5. HR Calculation Using the Proposed Mutli-Modal Fusion ......................... 251
7.6. Experiments and Obtained Results ............................................................ 251
7.6.1. Experimental Environment ................................................................. 252
7.6.2. Expeimental Evaluation ...................................................................... 254
7.6.3. Performance Comparison .................................................................... 257
7.7. Discussions and Conclusions ..................................................................... 259
7.8. References .................................................................................................. 261
Part V ................................................................................................................................ 265
Chapter 8. Heartbeat Signal from Facial Video for Biometric Recognition ............... 267
8.1. Abstract ...................................................................................................... 269
8.2. Introduction ................................................................................................ 269
8.3. The HSFV based Biometric Identification System .................................... 271
8.3.1. Facial Video Acquisition and Face Detection ..................................... 271
8.3.2. ROI Detection and Heartbeat Signal Extraction ................................. 272
8.3.3. Feature Extraction ............................................................................... 273
8.3.4. Identifiation ......................................................................................... 275
XIII
8.4. Experimental Results and Discussions ....................................................... 275
8.4.1. Experimental Environment ................................................................. 275
8.4.2. Performance Evaluation ...................................................................... 276
8.5. Conclusions and Future Directions ............................................................ 279
8.6. References .................................................................................................. 280
Chapter 9. Can Conact-Free Measurement of Heartbeat Signal be Used in
Forensics? ......................................................................................................................... 283
9.1. Abstract ...................................................................................................... 285
9.2. Introduction ................................................................................................ 285
9.3. The Proposed System ................................................................................. 287
9.3.1. Facial Video Acquisition ..................................................................... 287
9.3.2. Face Detection ..................................................................................... 287
9.3.3. Region of Interest (ROI) Selection ...................................................... 287
9.3.4. Heartbeat Signal Extraction ................................................................ 287
9.3.5. Feature Extraction ............................................................................... 288
9.3.6. Spoofing Attack Detection .................................................................. 288
9.4. Experimental Results and Discussions ....................................................... 289
9.4.1. Experimental Environment ................................................................. 289
9.4.2. Performance Evaluation ...................................................................... 290
9.4.3. Performance Comparison .................................................................... 290
9.4.4. Discussions About HSFV as a Soft Biometric for Forensic
Investigations ................................................................................................ 291
9.5. Conclusions ................................................................................................ 292
9.6. References .................................................................................................. 292
Chapter 10. Contact-Free Heartbeat Signal for Human Identification and
Forensics ........................................................................................................................... 295
10.1. Abstract .................................................................................................... 297
10.2. Introduction .............................................................................................. 297
10.3. Measurement of Heartbeat Signal ............................................................ 298
10.3.1. Contact-based Measurement of Heartbeat Signal ............................. 298
10.3.2. Contact-Free Measurement of Heartbeat Signal ............................... 299
10.4. Using Heartbeat Signal for Identification Purposes ................................. 302
VISUAL ANALYSIS OF FACES WITH APPLICATION IN BIOMETRICS, FORENSICS AND HEALTH INFORMATICS
XIV
10.4.1. Human Identification using Contact-based Heartbeat Signal............ 302
10.4.2. Human Identification using Contact-free Heartbeat Signal .............. 304
10.5. Discussions and Conclusions ................................................................... 306
10.6. References ................................................................................................ 308
Part VI .............................................................................................................................. 313
Chapter 11. Constructing Facial Expression Log from Video Sequences using
Face Quality Assessment ................................................................................................. 315
11.1. Abstract .................................................................................................... 317
11.2. Introduction .............................................................................................. 317
11.3. State-of-the-Arts....................................................................................... 319
11.4. The Proposed Approach ........................................................................... 321
11.4.1. Face Detection Module ..................................................................... 321
11.4.2. Face Quality Assessment Module ..................................................... 322
11.4.3. Facial Expression Recognition and Logging ..................................... 325
11.5. Experimental Results ............................................................................... 326
11.5.1. Experimental Environment ............................................................... 326
11.5.2. Performance Evaluation .................................................................... 327
11.6. Conclusions .............................................................................................. 330
11.7. References ................................................................................................ 330
XV
THESIS DETAILS
Thesis Title: Visual Analysis of Faces with Application in Biometrics, Forensics
and Health Informatics
PhD Student: Mohammad A. Haque
Supervisor: Prof. Thomas B. Moeslund, Aalborg University
Co-supervisor: Associate Prof. Kamal Nasrollahi, Aalborg University
This thesis has been submitted for assessment in partial fulfillment of the PhD de-
gree. The thesis is based on the submitted or published (at the time of handing in
the thesis) scientific paper which are listed below. Parts of the papers are used di-
rectly or indirectly in the extended summary of the thesis in the introductory sec-
tion. As part of assessment, co-author statements to explicitly mentioning my con-
tributions have been made available to the assessment committee and are also avail-
able at the Faculty.
The main body of this thesis consists of the following book and papers divided
into five research themes presented in the thesis (the index number of the articles
refers to the part and chapter of the thesis it is presented):
PART II: Literature review: Monitoring elderly patients at private homes
[2] J. Klonovs, M. A. Haque, V. Krueger, K. Nasrollahi, K. Andersen-
Ranberg, T. B. Moeslund, and E. G. Spaich, Distributed Computing
and Monitoring Technologies for Older Patients, 1st ed. Springer In-
ternational Publishing, 2015.
PART III: Face quality assessment
[3] M. A. Haque, K. Nasrollahi, and T. B. Moeslund, “Real-time acquisi-
tion of high quality face sequences from an active pan-tilt-zoom cam-
era,” in 10th IEEE International Conference on Advanced Video and
Signal Based Surveillance (AVSS), 2013, pp. 443–448.
[4] M. A. Haque, K. Nasrollahi, and T. B. Moeslund, “Quality-Aware Es-
timation of Facial Landmarks in Video Sequences,” in IEEE Winter
Conference on Applications of Computer Vision (WACV), 2015, pp.
1–8.
VISUAL ANALYSIS OF FACES WITH APPLICATION IN BIOMETRICS, FORENSICS AND HEALTH INFORMATICS
XVI
PART IV: Measurement of physiological parameters
[5] M. A. Haque, R. Irani, K. Nasrollahi, and T. B. Moeslund, “Heartbeat
Rate Measurement from Facial Video (accepted),” IEEE Intell. Syst.,
Dec. 2015.
[6] M. A. Haque, R. Irani, K. Nasrollahi, and T. B. Moeslund, “Facial
Video based Detection of Physical Fatigue for Maximal Muscle Ac-
tivity (accpeted),” IET Comput. Vis., 2016.
[7] M. A. Haque, K. Nasrollahi, and T. B. Moeslund, “Multimodal Esti-
mation of Heartbeat Peak Locations and Heartbeat Rate from Facial
Video using Empirical Mode Decomposition (Submitted),” IEEE
Trans. Multimed., 2016.
PART V: Contact-free heartbeat biometrics
[8] M. A. Haque, K. Nasrollahi, and T. B. Moeslund, “Heartbeat Signal
from Facial Video for Biometric Recognition,” in Image Analysis, R.
R. Paulsen and K. S. Pedersen, Eds. Springer International Publish-
ing, 2015, pp. 165–174.
[9] M. A. Haque, K. Nasrollahi, and T. B. Moeslund, “Can contact-free
measurement of heartbeat signal be used in forensics?,” in 23rd Eu-
ropean Signal Processing Conference (EUSIPCO), Nice, France,
2015, pp. 1–5.
[10] K. Nasrollahi, M. A. Haque, R. Irani, and T. B. Moeslund, “Contact-
Free Heartbeat Signal for Human Identification and Forensics (sub-
mitted),” in Biometrics in Forensic Sciences, 2016, pp. 1–14.
PART VI: Decision support system for healthcare
[11] M. A. Haque, K. Nasrollahi, and T. B. Moeslund, “Constructing Fa-
cial Expression Log from Video Sequences using Face Quality As-
sessment,” in 9th International Conference on Computer Vision The-
ory and Applications (VISAPP), 2014, pp. 1–8.
In addition to the focal papers listed above, following scientific articles have al-
so been published during the time of PhD:
[1] M. S. Hossain, M. A. Haque, R. Mustafa, R. Karim, H. C. Dey, and
M. Yusuf, “An Expert System to Assist the Diagnosis of Ischemic
XVII
Heart Disease (accepted),” Internatinal J. Integr. Care, pp. 1–2, May
2016.
[2] M. A. Haque, K. Nasrollahi, and T. B. Moeslund, “Efficient contact-
less heartbeat rate measurement for health monitoring,” Internatinal
J. Integr. Care, vol. 15, no. 7, pp. 1–2, Oct. 2015.
[3] R. A. Andersen, K. Nasrollahi, T. B. Moeslund, and M. A. Haque,
“Interfacing assessment using facial expression recognition,” in 2014
International Conference on Computer Vision Theory and Applica-
tions (VISAPP), 2014, vol. 3, pp. 186–193.
[4] M. S. Hossain, E. Hossain, M. S. Khalid, and M. A. Haque, “A Belief
Rule-Based (BRB) Decision Support System for Assessing Clinical
Asthma Suspicion,” presented at the Scandinavian Conference on
Health Informatics (SHI), 2014, pp. 83–89.


XIX
PREFACE
This thesis is submitted as a collection of paper in partial fulfillment of a PhD study
in the area of Computer Vision at the Section of Media Technology, Aalborg Uni-
versity, Denmark. It is organized in six parts. The first part contains the framework
of the thesis with a summary of the contributions. The rest of the parts contain lay-
out-revised articles published in different venues in connection to the research car-
ried out during the PhD study.
The focus of this thesis is analyzing human facial video and extracting meaning-
ful information in health monitoring scenarios. The core contributions of the thesis
are divided into five themes: Monitoring elderly patients at private homes, Face
quality assessment, Measurement of physiological parameters, Contact-free heart-
beat biometrics, and Decision support system for healthcare. One book (with seven
chapters) and 9 articles have been included in the thesis.
The work has been carried out from Nov 2012 to Mar 2016 as a part of the pro-
ject ‘Patient@Home’ that is the Denmark’s largest welfare-technological research
and innovation initiative with focus on new technologies and services aimed at
especially rehabilitation and monitoring activities within the Danish public health
sector. The project aimed to have collaborations between health professionals, pa-
tients, private enterprises and research institutions. While writing this thesis I have
collaboration with academicians from the other departments of Aalborg University,
Denmark, Oulu University, Finland and doctors from university hospitals. Some of
the works have also been accomplished by collaborating people from Chittagong
University and International Islamic University Chittagong, Bangladesh; however
these works haven’t been included in the core contributions of the thesis. I was
employed as a PhD fellow with both research and teaching responsibilities during
the time of PhD study.
Computer vision-based health monitoring is a relatively new but rapidly grow-
ing field. Numerous research groups in all over the planet is working to pace up the
development. This thesis’s contribution is a new leaf in this area and, along with
some solutions proposed here to some problems it also provides an overview of the
advances in this field with ample of future research questions.
Have a nice reading!


21
PART I
OVERVIEW OF THE WORK


23
CHAPTER 1. FRAMEWORK OF THE
THESIS
Mohammad Ahsanul Haque
© 2016 PhD thesis
Aalborg University


25
1.1. ABSTRACT
Human facial video can convey information regarding to expression, mental
condition, diseases symptoms, and physiological parameters such as heartbeat rate,
blood pressure and respiratory rate. It also provides a convenient source of heart-
beat signal to be used in biometrics and forensics. This dissertation includes stories
of facial video analysis with application in biometrics, forensics and health infor-
matics. This chapter presents the main themes and summary of the contributions of
the research endeavors during last three years in pursuance of a doctoral degree.
1.2. INTRODUCTION
Traditionally elderly people living with family members or a house-keeper are
monitored and helped manually by their house mates with the help of professional
care givers. Their health conditions were checked by visiting hospital, and in case
of adverse condition patient got admitted to the hospital. Demographic changes due
to the aging of population exhibit rapid increase of elderly population. Two major
problems that come along with such change are increase living alone and lack of
supervision when needed in a vulnerable health condition [1]. Such problems in
turns demand the development of technologies for independent elderly living at
private homes. Healthcare providers also have long sought the ability to
continuously and automatically monitor patients beyond the confines of physicians’
concerns. Improvement of human activity and health monitoring technologies pro-
vides the notion to address such need.
Advances of computing and sensing technologies in last few decades have cre-
ated, with many other, an amazing field called computer vision, where the question
is answered- how computer sense and reason by looking into a scene. Computer
vision techniques are now-a-day not only used in safety, comfort, fun and access
control but also in health monitoring and security. Computer-vision based non-
contact diagnostic and monitoring systems get considerable attention in research
and development of health technologies in order to setup a proactive and preventive
healthcare model. In addition to healthcare technologies, improved well-being of
life long ago initiated an era of vision-based biometrical recognition and forensic
investigation.
Computer vision uses camera to capture a scene in visual color, depth and/or
thermal domain. When human facial video is captured by a camera, by employing
computer vision techniques it conveys information regarding to expression [2], [3],
mental condition [4], [5], diseases symptoms [6], and physiological parameters such
as heartbeat rate, blood pressure and respiratory rate [7], [8]. It also provide a con-
venient source of information to be used in applications like biometrics and foren-
sics [8]–[10].

VISUAL ANALYSIS OF FACES WITH APPLICATION IN BIOMETRICS, FORENSICS AND HEALTH INFORMATICS
26
Facial video analysis for an application follows a multi-step procedure. The first
step is acquisition of facial video by camera. This step requires selection of appro-
priate camera and need to be certain that suitable facial video has been captured.
The second step is selecting appropriate facial features to analyze, which are de-
pending upon the applications. The third and final step is employing the selected
features to obtain the outcome. There are a number of challenges exist in utilizing
facial image in different applications by following the aforementioned procedure.
Among these, three of the challenges are introduced as follows.
The first challenge is associated with acquisition of qualified and applicable fa-
cial images from a camera setup or a video clip [11]. When a video based practical
image acquisition system produces too many facial images to be processed for fur-
ther analysis, most of these image are subjected to the problems of low resolution,
high pose variation, extreme brightness or image blur [12]. The application perfor-
mance greatly depends upon the quality of the face in the image. For example, a
human face at 5 meters distance from the camera subtends only about 4x6 pixels on
a 640x480 sensor with 130 degrees field of view, which is mostly insufficient reso-
lution for further processing [13]. Thus, a quality aware method for facial image
acquisition is necessary. Moreover, the influence of face quality assessment in the
outcome of an application is still unknown due to lack of methodical study on this
topic.
The second challenge arises in selection of appropriate facial features to be
tracked in an application. Different applications require different set of features to
be used. For example, Viola et al. extracted some haar-like features for automatic
face detection [14], Palestra et al. used variation of geometrical features for facial
expression recognition [2], Li et al. used appearance based features from lip for
disease diagnosis [6], and Balakrisnan et al. tracked some facial feature points to
estimate heartbeat [15]. Thus, which features to be selected is necessary to be inves-
tigated.
The third challenge is associated with how to employ the selection features to
obtain the outcome of an application. While some application requires simple tem-
plate matching based on facial features [2], [6], [9], other applications may need
tracking the facial region in the video frames [16], finding out facial color changes
in the video frames [7], [17], aligning face [18], and tracking facial feature or land-
mark points [15]. How to utilize the feature to generate the outcome, thus, implies a
challenge to be addressed.
The motivation of this thesis is associated with addressing the aforementioned
three problems occurred in facial color video analysis in the light of an application.
The solutions are proposed by focusing the application: physiological parameter
measurement. Among various physiological parameters, two vital signs heartbeat
CHAPTER 1. FRAMEWORK OF THE THESIS
27
and physical fatigue are estimated and detected, respectively, from facial video.
While proposing the solutions, this thesis answers the questions like:
a) How low quality faces in the video affect the performance of measuring
these parameters
b) How to acquire high quality face sequences
c) Which features to extract and how to extract for analysis
d) How to analyze these features to obtain the outcome
In addition to the aforementioned three major challenges, facial image based re-
search may exhibit question like ‘what can be new applications based on facial
video’. Besides the traditional application like surveillance, recent advances in au-
tomatic facial video analysis showed other incredible applications like diseases
diagnosis, heartbeat rate estimation, surveillance, biometric and forensic analysis,
etc. However, the trend shows that these applications are just the tip of the iceberg
that represents the potential of automatic face analysis. Thus, this thesis also pre-
sents a quest to propose a new application of automatic facial video analysis by
extracting heartbeat signal from facial video as a new biometric trait.
In summary, this dissertation includes stories of facial video analysis with appli-
cation in biometrics, forensics and health informatics. The thesis provides a descrip-
tive introduction to the monitoring technologies available for assisted elderly living,
addresses the methodical problems of existing facial video-based heartbeat (and
rate) estimation and physical fatigue detection approaches, proposed a novel bio-
metric trait from facial video with application in forensics, and proposed a face-
quality aware decision support system using facial expression from a video. The
contributions are arranged into the following five themes:
I. Literature review: Monitoring elderly patients at private homes
II. Face quality assessment
III. Measurement of physiological parameters
IV. Contact-free heartbeat biometrics
V. Decision support system for healthcare
These five themes are chosen in such a way that the thesis are divided into parts
representing the themes and individual chapter (consisting of single published arti-
cles) in these parts present homogeneity of application area for visual analysis of
face under each part. The following sections provide a brief introduction of each
theme and associated contributions of the thesis in that theme along with the men-
tioning of ‘where to find that contribution’ in the thesis. Table 1-1 shows the key
contents of the thesis in relation to the challenges of facial video analysis discussed
before along with some descriptive figures.

VISUAL ANALYSIS OF FACES WITH APPLICATION IN BIOMETRICS, FORENSICS AND HEALTH INFORMATICS
28
Table 1-1 Contents of the thesis in relation to the challenges associated with of facial video analysis
Content description Figurative illustration Where to
find
Raw facial video frames from camera
Pre
pro
cess
ing
Face quality assessment to
select good quality faces
Ch. 3
Quality-aware face align-
ment by detecting the
landmarks
Ch. 4
Fea
ture
sele
ctio
n
and
tra
ckin
g
Facial feature points and
landmarks to track periodic
color change and motion due
to heartbeat
Ch. 5, 6, 7
& 8
Fea
ture
pro
cess
ing
Filtering and decomposition
Ch. 5 & 7
Energy estimation
Ch. 6
Transformation
Ch. 8
Appli
cati
ons
Heartbeat rate estimation
Ch. 5 & 7
Physical fatigue detection
Ch. 6
Heartbeat signal from facial
video as biometric
Ch. 8, 9 &
10
Facial expression log
Ch. 11
0 5 10 150
0.1
0.2
0.3
0.4
Time
Am
plitu
de
Radon Image: R()[f(x,y)]
(degrees)
x
0 20 40 60 80 100 120 140 160 180
-2000
-1000
0
1000
2000
0 20 40 60
0
100
200
300
Time [Sec]
Forc
e [
N]
0 50-500
0
500
1000
1500
Time [Sec]
Fati
gue
in
de
x
0 200 400 600 800 1000 120074
76
78
80
Frames
RG
B T
race
Heartbeat signal from RGB traces
5 6 7 8 9 10 11 12 13 14
-0.5
0
0.5
6 8 10 12 14
-0.5
0
0.5
0 5 10 15 20 25 300
0.1
0.2
0.3
0.4
0.5
0.6
0.7
0 0.5 1 1.5 2 2.5 3190
195
200
205
210
215
time[Sec]
Amplitu
te
0 0.5 1 1.5 2 2.5 3190
195
200
205
210
215
time[Sec]
Amplitu
te
0 5 10 15 20 25 300
0.1
0.2
0.3
0.4
0.5
0.6
0.7
0 5 10 15 20 25 30-2
-1.5
-1
-0.5
0
0.5
1
1.5
2
2.5
0 0.5 1 1.5 2 2.5 3190
195
200
205
210
215
time[Sec]
Am
plit
ute
0 0.5 1 1.5 2 2.5 3190
195
200
205
210
215
time[Sec]
Am
plit
ute
0 0.5 1 1.5 2 2.5 3190
195
200
205
210
215
time[Sec]
Am
plit
ute
0 0.5 1 1.5 2 2.5 3190
195
200
205
210
215
time[Sec]
Am
plit
ute
0 0.5 1 1.5 2 2.5 3150
152
154
156
158
160
162
164
166
168
time[Sec]
Am
plitu
te
0 50 100 150 200 250 300-0.6
-0.4
-0.2
0
0.2
0.4
0.6
0.8
time[Sec]
Am
plitu
te
HP Filter
E F

CHAPTER 1. FRAMEWORK OF THE THESIS
29
1.3. LITERATURE REVIEW: MONITORING ELDERLY PATIENTS AT PRIVATE HOMES
Demographic and cultural changes in industrialized countries induce an increased
risk of living alone and with having a potentially smaller social network [19]. These
imply the necessity of automatic health monitoring and assisted living systems to be
used more frequently for timely detection of health threats at home. In-home moni-
toring technology can nowadays be used on both healthy older adults, for detecting
health threatening situations, and geriatric patients, for detecting adverse events or
health deterioration. Therefore, there is a vastly growing interest in developing
robust unobtrusive ubiquitous home-based health monitoring systems and services
that can help older home dwellers to live safely and independently. However, due to
the high variety of possible scenarios and circumstances, keeping track on health
conditions of an older individual at home may be exceedingly difficult. Figure 1-1
shows a scenario in laboratory environment that was implemented to capture data
for automatic contactless heartbeat monitoring using a camera.
This theme of the thesis includes the issues regarding to automated in-home
monitoring technologies for elderly by describing- a) which health threats should be
detected, b) what data is relevant for detecting these health threats, and c) how to
acquire the right data about an older home dweller. We summarize recently de-
ployed monitoring approaches with a focus on automatically detecting health
threats for older patients living alone at home. First, in order to give an overview of
the problems at hand, we briefly describe older adults, who would mostly benefit
from healthcare supervision, and explain their eventual health-threats and danger-
ous situations, which need to be timely detected. Second, we summarize possible
scenarios for monitoring an older patient at home and derive common functional
requirements for monitoring technology. Third, we identify the realistic state-of-
the-art technological monitoring approaches, which are practically applicable to
older adults, in general, and to geriatric patients, in particular. In order to uncover
the majority of applicable solutions, we survey the interdisciplinary fields of smart-
homes, telemonitoring, ambient intelligence, ambient assisted living, gerotechnolo-
gy, and aging-in-place technology, among others. Consequently, we discuss the
related experimental studies and how they collect and analyze the measured data,
reporting the application of sensor fusion, signal processing and machine learning
techniques whenever possible, which are shown to be useful for improving the de-
tection and identification of the situations that can threaten older adults’ health.
Finally, we discuss future challenges and offer a number of suggestions for further
research directions, and conclude by highlighting the open issues within automatic
healthcare technologies and link them to the potential solutions.
This part of the thesis consists of a book, title ‘Distributed Computing and Mon-
itoring Technologies for Older Patients’ as published in [1] with seven subchapters.

VISUAL ANALYSIS OF FACES WITH APPLICATION IN BIOMETRICS, FORENSICS AND HEALTH INFORMATICS
30
Figure 1-1 A scenario in laboratory environment for physiological signal acquisition aimed at automatic health monitoring (obtained from [20]).
1.4. FACE QUALITY ASSESSMENT
Acquisition of facial image (or video) is the first step of many important facial im-
age-based applications related to surveillance, medical diagnosis, biometrics, ex-
pression recognition and social cue analysis [8]. Traditional camera-based of facial
image acquisition systems often capture low quality face images. This is mainly due
to the distance between the camera and subjects of interest, movement of subjects,
and changing head poses and facial expression. Furthermore, the imaging condi-
tions like illumination, occlusion, and noise may change. However, the application
performance greatly depends upon the quality of the facial image. In order to get rid
of the problem of having low quality facial image, a Face Quality Assessment
(FQA) technique can be employed to select the qualified faces from the image
frames captured by a camera. On the other hand, if a facial video has low quality
faces, further processing for application like face alignment exhibits low accuracy
in detecting facial landmarks. When a high quality face image is provided to a face
alignment system, it detects the landmarks very accurately. However, when the face
quality is low, the detected landmark positions are not trustworthy. Figure 1-2 illus-
trate a case of low quality face (in terms of high pose variation) and associated chal-
lenge in face alignment. To deal with the alignment problem of low quality facial
images, a FQA system can be employed before running the alignment algorithm.
Such a system uses some quality measures to determine whether a face is qualified
enough and provides assistance to further analysis by providing the quality rating.
This part of the thesis consists of two chapters by following [21] and [12]. The
first chapter proposes an active camera-based real-time high-quality facial image
acquisition system, which utilizes pan-tilt-zoom parameters of a camera to focus on
a human face in a scene and employs a face quality assessment method to log the
best quality faces from the captured frames. The chapter also shows how a FQA

CHAPTER 1. FRAMEWORK OF THE THESIS
31
module automatically discards the low quality faces during video acquisition. On
the other hand, the second chapter proposes a system for quality aware face align-
ment by using a motion based forward extrapolation method. The basic method of
face alignment used in this chapter is obtained from [18], however novel applica-
tion of the FQA module greatly improve the alignment accuracy in challenging
videos available in a relevant public database.
(a) (b)
Figure 1-2 Detection of landmarks in a low quality face can be erroneous as shown in (a).An assessment of face quality can help improving the alignment procedure as shown in (b). Images have taken from “Youtube Celebrities” dataset [21].
1.5. MEASUREMENT OF PHYSIOLOGICAL PARAMETERS
Physiological parameters are measurements describing the physical condition of a
human body. They are also known as vital signs given their relevance to the pa-
tient’s condition in medical scenarios. Examples of physiological parameters in-
clude heartbeat rate, respiration, blood oxygen saturation, and fatigue. Among these
heartbeat rate is the most important physiological parameter providing information
about the condition of cardiovascular system in applications like medical diagnosis,
rehabilitation training program, and fitness assessment. For example, increasing or
decreasing a patient’s heartbeat rate beyond the norm in fitness assessment or reha-
bilitation training can show how tired the trainee is, and indicate whether continu-
ing the exercise is safe. Heartbeat rate is typically measured by an Electrocardio-
gram (ECG) through placing sensors on the body. However, recent studies pro-
posed methods such as [7], [15], [17], [22] to estimate heartbeat rate from facial
video by utilizing the facts that blood circulation causes periodic subtle changes to
facial skin color (which can be observed by Photoplethysmography) and invisible
motion in the head (which can be observed by Ballistocardiography). Figure 1-3
shows a scenario of heartbeat peak detection in the heartbeat signal obtained from
facial video. The method proposed by Balakrisnan et al. [15] is based on head mo-
tion and this method extract facial feature points from forehead and cheek by a
method called Good Feature to Track (GFT) [23]. The authors then employ the
Kanade-Lucas-Tomasi (KLT) feature tracker from [24] to generate the motion tra-
jectories of feature points and some signal processing methods to estimate cyclic
head motion frequency as the subject’s heartbeat rate. However, these calculations

VISUAL ANALYSIS OF FACES WITH APPLICATION IN BIOMETRICS, FORENSICS AND HEALTH INFORMATICS
32
are based on the assumption that the head is static (or close to) during facial video
capture. This means that there is neither internal facial motion nor external move-
ment of the head during the data acquisition phase. We denote internal motion as
facial expression and external motion as head pose. In real life scenarios there are,
of course, both internal and external head motion. Current method, therefore, fails
due to an inability to detect and track the feature points in the presence of internal
and external motion as well as low texture in the facial region. Moreover, real-life
scenarios challenge current methods due to low facial quality in video because of
motion blur, bad posing, and poor lighting conditions. These low quality facial
frames induce noise in the motion trajectories obtained for measuring the heartbeat.
Figure 1-3 An example of heartbeat peak detection in the heartbeat signal obtained from facial video. Red rectangle presents the automatically detect face in a video frame and blue rectangles present region of interest to track for heartbeat footprint in the face. The ‘+’ marks indicate the detected peaks (implies heart pulse) in the signal.
Another important physiological parameter is ‘fatigue’, which usually describes
the overall feeling of tiredness or weakness. Fatigue may be either mental or physi-
cal or both. Stress, for example, makes people mentally exhausted, while hard work
or extended physical exercise can exhaust people physically. Physical fatigue is also
known as muscle fatigue, which is a significant physiological issue, especially for
athletes or therapists. By monitoring a patient’s fatigue during physical exercise, a
therapist can change the exercise, make it easier or even stop it when he/she realizes
that the level of fatigue is harmful for the patient. To the best of our knowledge, the
only video-based non-invasive system for non-localized (i.e., not restricted to a
particular muscle) physical fatigue detection in a maximal muscle activity scenario
is the one introduced in [25] which uses head-motion (shaking) behavior due to
fatigue in video captured by a simple webcam. It takes into account the fact that
muscles start shaking when fatiguing contraction occurs in order to send extra sen-
sation signal to the brain to get enough force in a muscle activity and this shaking is
reflected in the face. Figure 1-4 shows an experimental scenario of the occurrence
of physical fatigue during maximal muscle activity. Inspired by [15] for heartbeat

CHAPTER 1. FRAMEWORK OF THE THESIS
33
detection from Ballistocardiogram, in [25] some feature points on the region of
interest (forehead and cheek) of the subject’s face in a video are selected and
tracked to generate trajectories of the facial feature points, and to calculate the en-
ergy of the vibration signal, which is used for measuring the onset and offset of
fatigue occurrence in a non-localized notion. However, the feature point selection
and tracking methods used in [25] from [23], [24] are not robust in the presence of
voluntary head motions induced by facial expression or pose changes. Thus, this
video-based method for physical fatigue detection also exhibits similar problem as
we discussed in the previous paragraph for heartbeat estimation method in [15].
This part of the thesis consists of three chapters by following [26]–[28]. The
first chapter defines the problems of using facial features used in [15] from [23],
[24] for heartbeat estimation and proposes an improved solution by using a combi-
nation of facial feature points used in [15] and landmarks used in [18]. The pro-
posed method provides robustness in heartbeat rate estimation against the presence
of voluntary head motions. This chapter also shows the influence of employing a
face quality assessment technique in heartbeat rate estimation from facial video.
The second chapter proposes a facial video based physical fatigue detection ap-
proach in a maximal muscle activity scenario. The proposed approach in this chap-
ter improved the method of [25] by a novel application of a combination of facial
feature points and landmarks tracking for physical fatigue detection. This chapter
also analyzes the effect of employ a face quality assessment technique in physical
fatigue detection from facial video. The last chapter of this theme proposes a novel
approach to estimate heartbeat peak locations and heartbeat rate from the heartbeat
signal obtained from facial video. This method employs an Empirical Mode De-
composition (EMD) [29] based approach to obtained heartbeat signal from facial
video in a noise free form. Unlike the other video-based heartbeat signal processing
methods, the proposed method accomplishes the calculation in time domain and
thus is able to provide visible heartbeat peaks in time domain. This chapter also
shows a comparison between color- and head motion-based heartbeat rate estima-
tion. A fusion of both modalities (color and motion) is also presented.
Figure 1-4 Physical fatigue can occur during maximal muscle activity by pressing a hand-grip dynamometer.

VISUAL ANALYSIS OF FACES WITH APPLICATION IN BIOMETRICS, FORENSICS AND HEALTH INFORMATICS
34
1.6. CONTACT-FREE HEARTBEAT BIOMETRICS
Heartbeat signal can be obtained by Electrocardiogram (ECG) using electrical
changes and Phonocardiogram (PCG) using acoustical changes. Both ECG and
PCG heartbeat signals have already been utilized for biometrics recognition in the
literature. ECG based authentication was first introduced by Biel et al. [30]. On the
other hand, The PCG based heartbeat biometric (i.e. heart sound biometric) was
first introduced by Beritelli et al [31]. A review of the important ECG-based au-
thentication approaches can be obtained from [32] and a review of the important
PCG-based method can be found in [33]. However, both of these heartbeat signal
acquisition approaches require obtrusive sensor to be put in the body, which is not
always possible, especially when subject is not cooperative. As heartbeat is reflect-
ed in the human face by subtle periodic color change, heartbeat signal can be ob-
tained from facial video instead of obtrusive electrocardiogram or phonocardio-
gram. As ECG and PCG-based heartbeat signal have already showed its potential in
biometric applications, heartbeat signal from facial video may also be used as a
biometric trait. Figure 1-5 shows an example of a raw noisy heartbeat signal and a
denoised signal obtained from a facial video, respectively in (a) and (b).
a)
b)
Figure 1-5 An example of a raw heartbeat signal in (a) and a denoised signal in (b) obtained from a facial video. The signal is contaminated with noise due to noises induced from light-ing, voluntary facial motion, and the act of blood as a damper to the heart pumping pressure to be transferred from the middle of the chest (where the heart is located) to the face.
This part of the thesis consists of three chapters by following [34]–[36]. The
first chapter proposes the heartbeat signal from facial video as a novel biometric
trait and an application of that new biometric trait for person identification. Unlike
ECG and PCG based heartbeat biometric, the proposed biometric does not require
any obtrusive sensor such as ECG electrode or PCG microphone. Thus, the pro-
posed HSFV biometric has some advantages over the previously proposed biomet-
rics. It is universal and permanent, obviously because every living human being has
an active heart. It can be more secure than its traditional counterparts as it is diffi-
cult to be artificially generated, and can be easily combined with state-of-the-art
face biometric without requiring any additional sensor. The second chapter reports
the outcome of an investigation regarding to using heartbeat signal from facial vid-
eo in a forensic application, more specifically face spoofing detection. As face
CHAPTER 1. FRAMEWORK OF THE THESIS
35
recognition systems need to be robust against spoofing attacks and printed face
spoofing attack is very common in this regard, this chapter investigates the potential
of heartbeat signal from facial video as a soft-biometric for printed face spoofing
attack detection. The results on a publicly available PRINT-ATTACK database [9]
imply that this biometric carries some distinctive features to be useful for forensic
applications. The last chapter reports a review of the characteristics of heartbeat
signal from facial video in regards to the applications of human identification and
forensic investigations.
1.7. DECISION SUPPORT SYSTEM FOR HEALTHCARE
Recent advances in healthcare informatics open up the application of numerous
decision support systems. Among various decision support systems, the systems for
facial image analysis are pretty common in applications like medical diagnosis,
biometrics, expression recognition, and social cue analysis. As human facial ex-
pression can express emotion, intension, cognitive process, pain level, and other
inter- or intrapersonal meanings, facial expression recognition and analysis systems
find their applications in medical diagnosis for diseases like delirium and dementia,
and social behavior analysis. However these applications often require analysis of
facial expressions acquired from videos in a long time-span. A facial expression log
from long video sequences can effectively provide this opportunity to analyze facial
expression changes in a long time-span. Generating such facial expression log from
a video sequence involves expression recognition from each frame of the video.
However, when a video based practical image acquisition system captures facial
image in each frame, many of these images are subjected to low face quality [11],
[16]. This state of affairs can often be observed in scenarios where facial expression
log is used from a patient’s video for medical diagnosis. Extracting features for
expression recognition from a low quality face image often ends up with erroneous
outcome and wastage of valuable computation resource. In order to get rid of this
problem, a face quality assessment technique can be employed to select the quali-
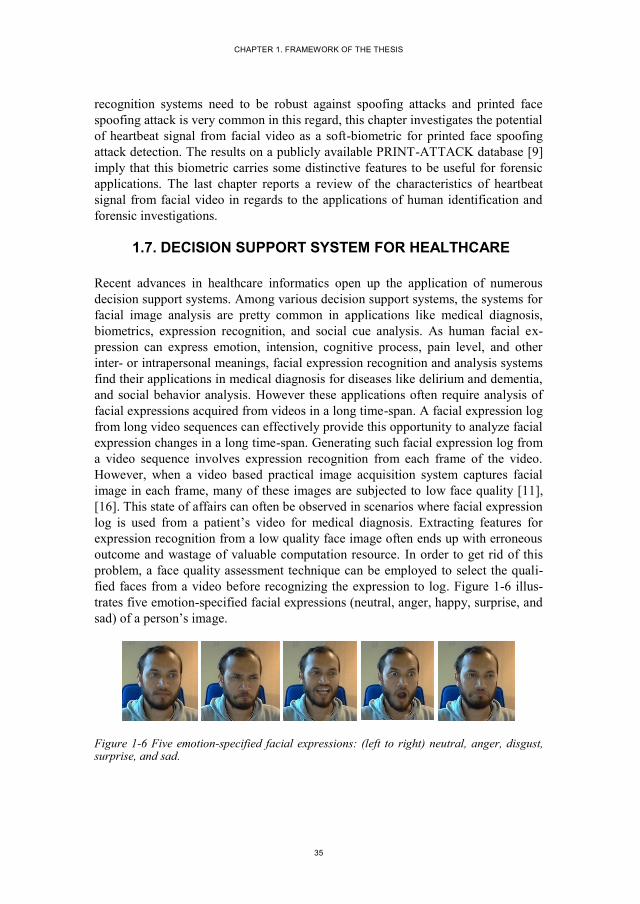
fied faces from a video before recognizing the expression to log. Figure 1-6 illus-
trates five emotion-specified facial expressions (neutral, anger, happy, surprise, and
sad) of a person’s image.
Figure 1-6 Five emotion-specified facial expressions: (left to right) neutral, anger, disgust, surprise, and sad.

VISUAL ANALYSIS OF FACES WITH APPLICATION IN BIOMETRICS, FORENSICS AND HEALTH INFORMATICS
36
This part of the thesis consists of one chapter by following [37]. This chapter
proposes an automatic facial expression log creation system by discarding low qual-
ity faces that may incur erroneous expression rating. The chapter also presents and
analysis of the effect of discarding face frames while making expression log. The
proposed system is expected to be employed as a decision support system in
healthcare domain.
1.8. SUMMARY OF THE CONTRIBUTIONS
During this study, a collection of work done in five themes framed in the field
of computer vision, however applicable in health informatics and security applica-
tions. The contributions are summarized as follows:
Review of the monitoring technologies: This contribution includes a de-
tailed survey and review of the monitoring technologies relevant to older
patients living at home and included in Chapter 2 in multiple sections in
the thesis. These sections discuss previous reviews in this field, relevant
taxonomies and different scenarios for home monitoring solutions for older
patients, sensing and data acquisition techniques, data processing and anal-
ysis techniques, available datasets for research and development, and cur-
rent challenges and future research directions.
Facial image acquisition and alignment: The first contribution presents a
method of acquiring high quality face sequence in real-time by employing
a face quality assessment technique. The second contribution is employing
a face quality assessment technique in face alignment to obtain more accu-
racy. These contributions are included in Chapters 3-4.
Heartbeat signal estimation and physical fatigue detection from facial
video: While heartbeat rate estimation from facial video have already in-
troduced in the area of computer vision, Chapter 5 proposes an improved
method for this purpose by using an improved heartbeat footprint tracking
approach in the face. Chapter 6 introduces a novel method for physical fa-
tigue detection from facial video. The last chapter of this part introduces a
novel way of analyzing heartbeat traces in facial video by a method called
empirical mode decomposition. Unlike the other methods in the literature,
the most significant notion of this method is providing visible heartbeat
peaks in the signal.
Heartbeat signal from facial video as a novel biometric trait: The major
contribution of this part is introducing the heartbeat signal from facial vid-
eo as a new biometric trait. Chapter 8 – 10 introduces the way to extract
and utilize this biometric trait in person recognition and face spoofing de-
tection. The pros and cons of this biometric trait have also analyzed.
CHAPTER 1. FRAMEWORK OF THE THESIS
37
Generating facial expression log as a decision support tool in patient
monitoring: Chapter 11 introduces an approach for generating facial ex-
pression log by employing a face quality assessment technique to reduce
erroneous expression rating.
1.9. CONCLUSIONS
In the pursuance of a doctoral degree from Nov 2012 – Mar 2016, I worked in
the broad area of computer vision and thrived to contribute in two applications
health monitoring and biometrics. While doing this, the focus was using facial vid-
eo. This thesis comprises the stories of facial video by addressing the questions like
how to acquire, how to assess the face quality, how to extract heartbeat signal, how
to detect physical fatigue, and how the face quality influence expression rating. One
of the major contributions of this study is introducing the heartbeat signal from
facial video as novel biometric trait. All the contributions have altogether opens up
an affluence of future research works.
1.10. REFERENCES
[1] J. Klonovs, M. A. Haque, V. Krueger, K. Nasrollahi, K. Andersen-Ranberg, T.
B. Moeslund, and E. G. Spaich, Distributed Computing and Monitoring Tech-
nologies for Older Patients, 1st ed. Springer International Publishing, 2015.
[2] G. Palestra, A. Pettinicchio, M. D. Coco, P. Carcagnì, M. Leo, and C. Distante,
“Improved Performance in Facial Expression Recognition Using 32 Geometric
Features,” in Image Analysis and Processing — ICIAP 2015, V. Murino and E.
Puppo, Eds. Springer International Publishing, 2015, pp. 518–528.
[3] R. A. Andersen, K. Nasrollahi, T. B. Moeslund, and M. A. Haque, “Interfacing
assessment using facial expression recognition,” in 2014 International Confer-
ence on Computer Vision Theory and Applications (VISAPP), 2014, vol. 3, pp.
186–193.
[4] M. P. Hyett, G. B. Parker, and A. Dhall, “The Utility of Facial Analysis Algo-
rithms in Detecting Melancholia,” in Advances in Face Detection and Facial
Image Analysis, M. Kawulok, M. E. Celebi, and B. Smolka, Eds. Springer In-
ternational Publishing, 2016, pp. 359–375.
[5] Y. Chen, “Face Perception in Schizophrenia Spectrum Disorders: Interface
Between Cognitive and Social Cognitive Functioning,” in Handbook of Schiz-
ophrenia Spectrum Disorders, Volume II, M. Ritsner, Ed. Springer Nether-
lands, 2011, pp. 111–120.
[6] F. Li, C. Zhao, Z. Xia, Y. Wang, X. Zhou, and G.-Z. Li, “Computer-assisted
lip diagnosis on traditional Chinese medicine using multi-class support vector

VISUAL ANALYSIS OF FACES WITH APPLICATION IN BIOMETRICS, FORENSICS AND HEALTH INFORMATICS
38
machines,” BMC Complement. Altern. Med., vol. 12, no. 1, pp. 1–13, Dec.
2012.
[7] M.-Z. Poh, D. J. McDuff, and R. W. Picard, “Advancements in Noncontact,
Multiparameter Physiological Measurements Using a Webcam,” IEEE Trans.
Biomed. Eng., vol. 58, no. 1, pp. 7–11, Jan. 2011.
[8] S. Z. Li and A. K. Jain, Handbook of Face Recognition, 2nd Edition. Springer,
2011.
[9] A. Anjos and S. Marcel, “Counter-measures to photo attacks in face recogni-
tion: A public database and a baseline,” in 2011 International Joint Conference
on Biometrics (IJCB), 2011, pp. 1–7.
[10] N. V. Boulgouris, K. N. Plataniotis, and E. Micheli-Tzanakou, Biometrics:
Theory, Methods, and Applications. John Wiley & Sons, 2009.
[11] K. Nasrollahi and T. B. Moeslund, “Complete face logs for video sequences
using face quality measures,” IET Signal Process., vol. 3, no. 4, p. 289, 2009.
[12] M. A. Haque, K. Nasrollahi, and T. B. Moeslund, “Real-time acquisition of
high quality face sequences from an active pan-tilt-zoom camera,” in 10th
IEEE International Conference on Advanced Video and Signal Based Surveil-
lance (AVSS), 2013, pp. 443–448.
[13] S. J. D. Prince, J. Elder, Y. Hou, M. Sizinstev, and E. Olevskiy, “Towards Face
Recognition at a Distance,” in The Institution of Engineering and Technology
Conference on Crime and Security, 2006, 2006, pp. 570–575.
[14] P. Viola and M. J. Jones, “Robust Real-Time Face Detection,” Int J Comput
Vis., vol. 57, no. 2, pp. 137–154, May 2004.
[15] G. Balakrishnan, F. Durand, and J. Guttag, “Detecting Pulse from Head Mo-
tions in Video,” in IEEE Conference on Computer Vision and Pattern Recog-
nition (CVPR), 2013, pp. 3430–3437.
[16] A. D. Bagdanov, A. Del Bimbo, F. Dini, G. Lisanti, and I. Masi, “Posterity
Logging of Face Imagery for Video Surveillance,” IEEE Multimed., vol. 19,
no. 4, pp. 48–59, Oct. 2012.
[17] C. Takano and Y. Ohta, “Heart rate measurement based on a time-lapse im-
age,” Med. Eng. Phys., vol. 29, no. 8, pp. 853–857, Oct. 2007.
[18] X. Xiong and F. De la Torre, “Supervised Descent Method and Its Applica-
tions to Face Alignment,” in IEEE Conference on Computer Vision and Pat-
tern Recognition (CVPR), 2013, pp. 532–539.
[19] C. Wrzus, M. Hänel, J. Wagner, and F. J. Neyer, “Social network changes and
life events across the life span: A meta-analysis.,” Psychol. Bull., vol. 139, no.
1, pp. 53–80, 2013.
CHAPTER 1. FRAMEWORK OF THE THESIS
39
[20] M. Soleymani, J. Lichtenauer, T. Pun, and M. Pantic, “A Multimodal Database
for Affect Recognition and Implicit Tagging,” IEEE Trans. Affect. Comput.,
vol. 3, no. 1, pp. 42–55, Jan. 2012.
[21] M. A. Haque, K. Nasrollahi, and T. B. Moeslund, “Quality-Aware Estimation
of Facial Landmarks in Video Sequences,” in IEEE Winter Conference on Ap-
plications of Computer Vision (WACV), 2015, pp. 1–8.
[22] S. Kwon, H. Kim, and K. S. Park, “Validation of heart rate extraction using
video imaging on a built-in camera system of a smartphone,” in 2012 Annual
International Conference of the IEEE Engineering in Medicine and Biology
Society (EMBC), 2012, pp. 2174–2177.
[23] J. Shi and C. Tomasi, “Good features to track,” in IEEE Conference on Com-
puter Vision and Pattern Recognition (CVPR), 1994, pp. 593–600.
[24] J. Bouguet, “Pyramidal implementation of the Lucas Kanade feature tracker,”
Intel Corp. Microprocess. Res. Labs, 2000.
[25] R. Irani, K. Nasrollahi, and T. B. Moeslund, “Contactless Measurement of
Muscles Fatigue by Tracking Facial Feature Points in A Video,” in IEEE In-
ternational Conference on Image Processing (ICIP), 2014, pp. 1–5.
[26] M. A. Haque, R. Irani, K. Nasrollahi, and T. B. Moeslund, “Heartbeat Rate
Measurement from Facial Video (accepted),” IEEE Intell. Syst., Dec. 2015.
[27] M. A. Haque, K. Nasrollahi, and T. B. Moeslund, “Multimodal Estimation of
Heartbeat Peak Locations and Heartbeat Rate from Facial Video using Empiri-
cal Mode Decomposition (Submitted),” IEEE Trans. Multimed., 2016.
[28] M. A. Haque, R. Irani, K. Nasrollahi, and T. B. Moeslund, “Facial Video based
Detection of Physical Fatigue for Maximal Muscle Activity (accpeted),” IET
Comput. Vis., 2016.
[29] M. E. Torres, M. A. Colominas, G. Schlotthauer, and P. Flandrin, “A complete
ensemble empirical mode decomposition with adaptive noise,” in 2011 IEEE
International Conference on Acoustics, Speech and Signal Processing
(ICASSP), 2011, pp. 4144–4147.
[30] L. Biel, O. Pettersson, L. Philipson, and P. Wide, “ECG analysis: a new ap-
proach in human identification,” IEEE Trans. Instrum. Meas., vol. 50, no. 3,
pp. 808–812, Jun. 2001.
[31] F. Beritelli and S. Serrano, “Biometric Identification Based on Frequency
Analysis of Cardiac Sounds,” IEEE Trans. Inf. Forensics Secur., vol. 2, no. 3,
pp. 596–604, Sep. 2007.
[32] M. Nawal and G. N. Purohit, “ECG Based Human Authentication: A Review,”
Int. J. Emerg. Eng. Res. Technol., vol. 2, no. 3, pp. 178–185, Jun. 2014.

VISUAL ANALYSIS OF FACES WITH APPLICATION IN BIOMETRICS, FORENSICS AND HEALTH INFORMATICS
40
[33] F. Beritelli and A. Spadaccini, “Human Identity Verification based on Heart
Sounds: Recent Advances and Future Directions,” ArXiv11054058 Cs Stat,
May 2011.
[34] M. A. Haque, K. Nasrollahi, and T. B. Moeslund, “Heartbeat Signal from Fa-
cial Video for Biometric Recognition,” in Image Analysis, R. R. Paulsen and
K. S. Pedersen, Eds. Springer International Publishing, 2015, pp. 165–174.
[35] M. A. Haque, K. Nasrollahi, and T. B. Moeslund, “Can contact-free measure-
ment of heartbeat signal be used in forensics?,” presented at the European Sig-
nal Processing Conference, 2015.
[36] K. Nasrollahi, M. A. Haque, R. Irani, and T. B. Moeslund, “Contact-Free
Heartbeat Signal for Human Identification and Forensics (submitted),” in Bio-
metrics in Forensic Sciences, 2016, pp. 1–14.
[37] M. A. Haque, K. Nasrollahi, and T. B. Moeslund, “Constructing Facial Expres-
sion Log from Video Sequences using Face Quality Assessment,” in 9th Inter-
national Conference on Computer Vision Theory and Applications (VISAPP),
2014, pp. 1–8.

41
PART II
MONITORING ELDERLY PATIENTS AT
PRIVATE HOMES


43
CHAPTER 2. DISTRIBUTED COMPUTING
AND MONITORING TECHNOLOGIES
FOR OLDER PATIENTS
Juris Klonovs, Mohammad Ahsanul Haque, Volker Krueger, Kamal Nasrollahi,
Karen Andersen-Ranberg, Thomas B. Moeslund, and Erika G. Spaich
This chapter has been published as a book in a book series
Springer Briefs in Computer Science, 1st Edition DOI: 10.1007/978-3-319-27024-1
No. of pages 102
© 2016 Springer International Publishing
The layout has been revised


45
2.1. ABSTRACT
In this chapter we summarize recently deployed monitoring approaches with a fo-
cus on automatically detecting health threats for older patients living alone at
home. First, in order to give an overview of the problems at hand, we briefly de-
scribe older adults, who would mostly benefit from healthcare supervision, and
explain their eventual health-threats and dangerous situations, which need to be
timely detected. Second, we summarize possible scenarios for monitoring an older
patient at home and derive common functional requirements for monitoring tech-
nology. Third, we identify the realistic state-of-the-art technological monitoring
approaches, which are practically applicable to older adults, in general, and to
geriatric patients, in particular. In order to uncover the majority of applicable solu-
tions, we survey the interdisciplinary fields of smart-homes, telemonitoring, ambi-
ent intelligence, ambient assisted living, gerotechnology, and aging-in-place tech-
nology, among others. Consequently, we discuss the related experimental studies
and how they collect and analyze the measured data, reporting the application of
sensor fusion, signal processing and machine learning techniques whenever possi-
ble, which are shown to be useful for improving the detection and identification of
the situations that can threaten older adults’ health. Finally, we discuss future chal-
lenges and offer a number of suggestions for further research directions, and con-
clude the chapter by highlighting the open issues within automatic healthcare tech-
nologies and link them to the potential solutions.
2.2. INTRODUCTION
In recent years, distributed computing and monitoring technologies have gained a
lot of interest in the cross-disciplinary field of healthcare informatics. This introduc-
tory section reveals the growing need for timely detection of numerous health
threats of older people, who are challenged by various chronic and acute illnesses,
and are susceptible to injuries. First, we give a concise overview of the relevant
terms, which are often used for representing state of the art technologies and re-
search fields dealing with monitoring of older patients. Second, we guide the read-
ers through the contents of this chapter, which are intended for both geriatric care
practitioners and engineers, who are developing or integrating monitoring solutions
for older adults. Then, we provide a summary of notable worldwide smart-home
projects aimed at monitoring and assisting older people, including geriatric patients.
The underlying aim of these projects was to explore the use of ambient and/or
wearable sensing technology to monitor the wellbeing of older adults in their home
environments.
Due to the changing demographics in most industrialized countries, the number and
the proportion of older adults is rapidly increasing [1], [2], [3]. The risk of having to
face health problems increases with advancing age. Advancing age is also associat-
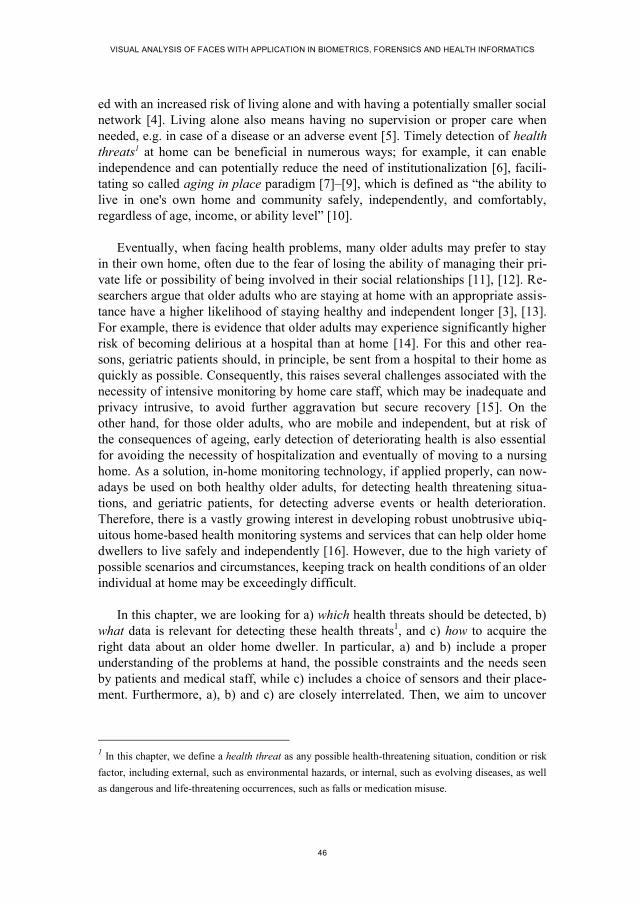
VISUAL ANALYSIS OF FACES WITH APPLICATION IN BIOMETRICS, FORENSICS AND HEALTH INFORMATICS
46
ed with an increased risk of living alone and with having a potentially smaller social
network [4]. Living alone also means having no supervision or proper care when
needed, e.g. in case of a disease or an adverse event [5]. Timely detection of health
threats1 at home can be beneficial in numerous ways; for example, it can enable
independence and can potentially reduce the need of institutionalization [6], facili-
tating so called aging in place paradigm [7]–[9], which is defined as “the ability to
live in one's own home and community safely, independently, and comfortably,
regardless of age, income, or ability level” [10].
Eventually, when facing health problems, many older adults may prefer to stay
in their own home, often due to the fear of losing the ability of managing their pri-
vate life or possibility of being involved in their social relationships [11], [12]. Re-
searchers argue that older adults who are staying at home with an appropriate assis-
tance have a higher likelihood of staying healthy and independent longer [3], [13].
For example, there is evidence that older adults may experience significantly higher
risk of becoming delirious at a hospital than at home [14]. For this and other rea-
sons, geriatric patients should, in principle, be sent from a hospital to their home as
quickly as possible. Consequently, this raises several challenges associated with the
necessity of intensive monitoring by home care staff, which may be inadequate and
privacy intrusive, to avoid further aggravation but secure recovery [15]. On the
other hand, for those older adults, who are mobile and independent, but at risk of
the consequences of ageing, early detection of deteriorating health is also essential
for avoiding the necessity of hospitalization and eventually of moving to a nursing
home. As a solution, in-home monitoring technology, if applied properly, can now-
adays be used on both healthy older adults, for detecting health threatening situa-
tions, and geriatric patients, for detecting adverse events or health deterioration.
Therefore, there is a vastly growing interest in developing robust unobtrusive ubiq-
uitous home-based health monitoring systems and services that can help older home
dwellers to live safely and independently [16]. However, due to the high variety of
possible scenarios and circumstances, keeping track on health conditions of an older
individual at home may be exceedingly difficult.
In this chapter, we are looking for a) which health threats should be detected, b)
what data is relevant for detecting these health threats1, and c) how to acquire the
right data about an older home dweller. In particular, a) and b) include a proper
understanding of the problems at hand, the possible constraints and the needs seen
by patients and medical staff, while c) includes a choice of sensors and their place-
ment. Furthermore, a), b) and c) are closely interrelated. Then, we aim to uncover
1 In this chapter, we define a health threat as any possible health-threatening situation, condition or risk
factor, including external, such as environmental hazards, or internal, such as evolving diseases, as well
as dangerous and life-threatening occurrences, such as falls or medication misuse.
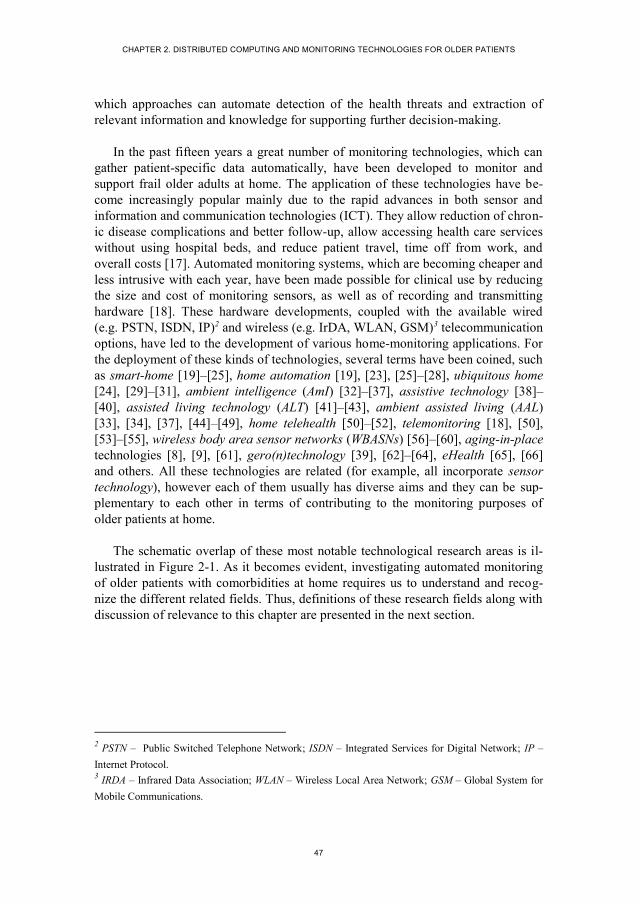
CHAPTER 2. DISTRIBUTED COMPUTING AND MONITORING TECHNOLOGIES FOR OLDER PATIENTS
47
which approaches can automate detection of the health threats and extraction of
relevant information and knowledge for supporting further decision-making.
In the past fifteen years a great number of monitoring technologies, which can
gather patient-specific data automatically, have been developed to monitor and
support frail older adults at home. The application of these technologies have be-
come increasingly popular mainly due to the rapid advances in both sensor and
information and communication technologies (ICT). They allow reduction of chron-
ic disease complications and better follow-up, allow accessing health care services
without using hospital beds, and reduce patient travel, time off from work, and
overall costs [17]. Automated monitoring systems, which are becoming cheaper and
less intrusive with each year, have been made possible for clinical use by reducing
the size and cost of monitoring sensors, as well as of recording and transmitting
hardware [18]. These hardware developments, coupled with the available wired
(e.g. PSTN, ISDN, IP)2 and wireless (e.g. IrDA, WLAN, GSM)3 telecommunication
options, have led to the development of various home-monitoring applications. For
the deployment of these kinds of technologies, several terms have been coined, such
as smart-home [19]–[25], home automation [19], [23], [25]–[28], ubiquitous home
[24], [29]–[31], ambient intelligence (AmI) [32]–[37], assistive technology [38]–
[40], assisted living technology (ALT) [41]–[43], ambient assisted living (AAL)
[33], [34], [37], [44]–[49], home telehealth [50]–[52], telemonitoring [18], [50],
[53]–[55], wireless body area sensor networks (WBASNs) [56]–[60], aging-in-place
technologies [8], [9], [61], gero(n)technology [39], [62]–[64], eHealth [65], [66]
and others. All these technologies are related (for example, all incorporate sensor
technology), however each of them usually has diverse aims and they can be sup-
plementary to each other in terms of contributing to the monitoring purposes of
older patients at home.
The schematic overlap of these most notable technological research areas is il-
lustrated in Figure 2-1. As it becomes evident, investigating automated monitoring
of older patients with comorbidities at home requires us to understand and recog-
nize the different related fields. Thus, definitions of these research fields along with
discussion of relevance to this chapter are presented in the next section.
2 PSTN – Public Switched Telephone Network; ISDN – Integrated Services for Digital Network; IP –
Internet Protocol. 3 IRDA – Infrared Data Association; WLAN – Wireless Local Area Network; GSM – Global System for
Mobile Communications.

VISUAL ANALYSIS OF FACES WITH APPLICATION IN BIOMETRICS, FORENSICS AND HEALTH INFORMATICS
48
Figure 2-1 An overlap of the most notable and emerging state-of-the-art technological re-search fields that contribute to automated monitoring of older patients at home. In this graph, we focus only on those technological domains, which explicitly or implicitly facilitate patient-centred care. Other related areas, such as ICT, wireless sensor networks, telematics, sensor fusion, machine learning, software engineering, etc. (purely from a technological point of view) and homecare, telehealth, telecare, telemedicine, mobile health (i.e. mHealth), etc. (which already indicate a healthcare point of view), are not visualized for redundancy reasons. The horizontal axis abstracts the domain of user requirements (with complexity increasing from left to right), while the vertical axis encapsulates the variety of different environments. Generally, the requirements of monitoring older patients at home are very complex, and thus a very limited selection of all possible technological advances can be practically useful for monitoring this target group. Hence, we schematically illustrate the applicability of the existing state-of-the-art monitoring technologies for older patients at home as a red oval in the upper-right corner of the figure.
2.2.1. DEFINITION OF TERMS AND RELEVANCE TO THIS CHAPTER
The term smart-home has many diverse definitions [19]–[25]. A smart-home is
often defined as a residence equipped with technology that observes its inhabitants
and provides proactive services [21]. Most commonly, it refers to home automation
[19], [23], [25]–[28], which by definition tackles four main goals: comfort, security,
life safety, and low-cost [28]. In the context of this chapter, we focus our analysis
primarily on improving life safety, which is achieved by incorporating telemonitor-
ing technology that can be a part of a smart-home as well.
Telemonitoring is originally defined as the use of audio, video, and other tele-
communications and electronic information processing technologies to monitor
patient status at a distance [67]. Thus, all the other systems intended for increasing
the comfort of home inhabitants by automating their tasks or controlling home ap-
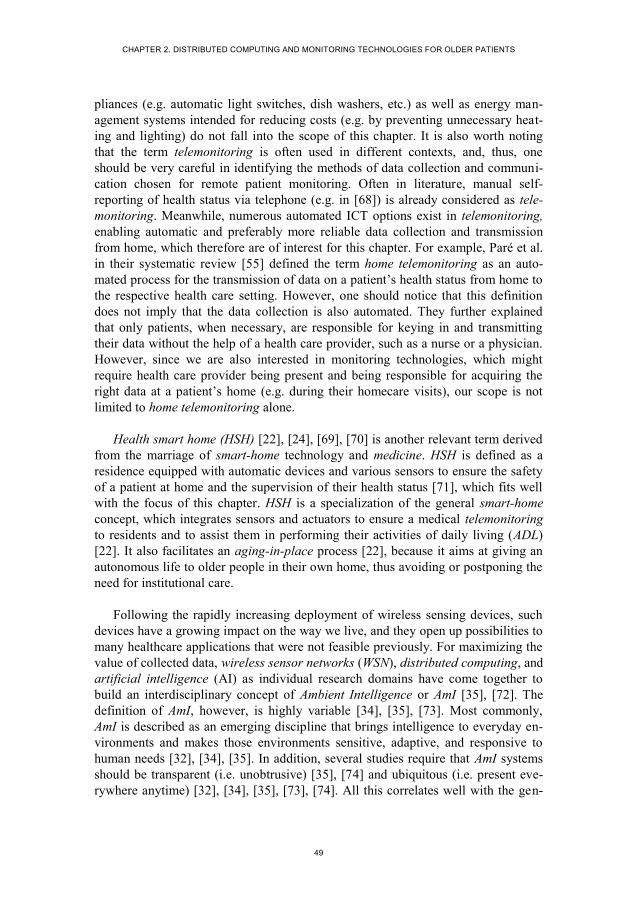
CHAPTER 2. DISTRIBUTED COMPUTING AND MONITORING TECHNOLOGIES FOR OLDER PATIENTS
49
pliances (e.g. automatic light switches, dish washers, etc.) as well as energy man-
agement systems intended for reducing costs (e.g. by preventing unnecessary heat-
ing and lighting) do not fall into the scope of this chapter. It is also worth noting
that the term telemonitoring is often used in different contexts, and, thus, one
should be very careful in identifying the methods of data collection and communi-
cation chosen for remote patient monitoring. Often in literature, manual self-
reporting of health status via telephone (e.g. in [68]) is already considered as tele-
monitoring. Meanwhile, numerous automated ICT options exist in telemonitoring,
enabling automatic and preferably more reliable data collection and transmission
from home, which therefore are of interest for this chapter. For example, Paré et al.
in their systematic review [55] defined the term home telemonitoring as an auto-
mated process for the transmission of data on a patient’s health status from home to
the respective health care setting. However, one should notice that this definition
does not imply that the data collection is also automated. They further explained
that only patients, when necessary, are responsible for keying in and transmitting
their data without the help of a health care provider, such as a nurse or a physician.
However, since we are also interested in monitoring technologies, which might
require health care provider being present and being responsible for acquiring the
right data at a patient’s home (e.g. during their homecare visits), our scope is not
limited to home telemonitoring alone.
Health smart home (HSH) [22], [24], [69], [70] is another relevant term derived
from the marriage of smart-home technology and medicine. HSH is defined as a
residence equipped with automatic devices and various sensors to ensure the safety
of a patient at home and the supervision of their health status [71], which fits well
with the focus of this chapter. HSH is a specialization of the general smart-home
concept, which integrates sensors and actuators to ensure a medical telemonitoring
to residents and to assist them in performing their activities of daily living (ADL)
[22]. It also facilitates an aging-in-place process [22], because it aims at giving an
autonomous life to older people in their own home, thus avoiding or postponing the
need for institutional care.
Following the rapidly increasing deployment of wireless sensing devices, such
devices have a growing impact on the way we live, and they open up possibilities to
many healthcare applications that were not feasible previously. For maximizing the
value of collected data, wireless sensor networks (WSN), distributed computing, and
artificial intelligence (AI) as individual research domains have come together to
build an interdisciplinary concept of Ambient Intelligence or AmI [35], [72]. The
definition of AmI, however, is highly variable [34], [35], [73]. Most commonly,
AmI is described as an emerging discipline that brings intelligence to everyday en-
vironments and makes those environments sensitive, adaptive, and responsive to
human needs [32], [34], [35]. In addition, several studies require that AmI systems
should be transparent (i.e. unobtrusive) [35], [74] and ubiquitous (i.e. present eve-
rywhere anytime) [32], [34], [35], [73], [74]. All this correlates well with the gen-

VISUAL ANALYSIS OF FACES WITH APPLICATION IN BIOMETRICS, FORENSICS AND HEALTH INFORMATICS
50
eral requirements for aging-in-place technologies [8], [9] and gerotechnology [62],
because these systems should be able to adapt to the needs of older adults, to sense
hazardous or unsafe situations with minimal human intervention, and to inform the
involved medical personnel and/or family members if something is truly ‘wrong’
[9]. While smart-home, home automation, ubiquitous home, and ambient intelli-
gence technologies can be intended for any user group and irrespective of age,
gerotechnology is explicitly focusing on older adults, including older patients with
comorbidities, while aging-in-place technology limits the deployment of the gero-
technology to private homes. Aging-in-place technology is a popular and a relative-
ly general term, which refers to increasing the ability of older adults to stay in their
own home as they age [75], [76], and is recognized as a part of gerotechnology
(which is consequently derived from combination of two words: gerontology and
technology). Gerotechnology plays a crucial role in the aging-in-place process and
is defined as “an interdisciplinary field of research and application involving ger-
ontology, the scientific study of aging, and technology, the development and distri-
bution of technologically based products, environments, and services” [77]. How-
ever, gerotechnology does not necessarily involve intelligence in the sense of being
sensitive and adjustable to patient’s needs. Different ageing associated aids (e.g.
vision and hearing aids [78], or even walking aids [79] and toileting aids [80]) are
often considered as appliances of gerotechnology, however these do not directly fall
into the scope of this chapter, unless they are capable of collecting meaningful med-
ically relevant data, which we will reveal in the further sections.
Most commonly, when dealing with geriatric or disabled patients, a majority of
the aforementioned technologies employ Assistive Technology (AT), which by defi-
nition serves three major purposes relevant to life safety of patients at home [81]: 1)
detecting hazards or emergencies, 2) facilitating independence and improving func-
tional performance, and 3) supporting medical staff (i.e. caregivers) by facilitating
provision of personal care. For this chapter, the main focus is put on the first pur-
pose. One of the most important aspects that can differentiate ATs from other tech-
nologies is the User-Centered Design, which can be achieved by complying with
numerous requirements defined by both medical and technical factors. Generally, it
is considered to be a good practice to comply with Universal Design principles
(often called as Design for All) [82]. These fundamental principles include [82]: (a)
usage equitability, i.e. the design should be useful and marketable to people with
diverse abilities; (b) flexibility in use, i.e. the design accommodates a wide range of
individual preferences and abilities; (c) simple and intuitive use, i.e. easy to under-
stand regardless of experience, knowledge, language skills, or current concentration
level of the user; (d) perceptible information, i.e. the design communicates neces-
sary information effectively to the user despite ambient conditions or sensory abili-
ties of the user; (e) tolerance for error, i.e. the design minimizes hazards and the
adverse consequences of accidental or unintended actions; (f) low physical effort,
i.e. effective and comfortable usage with minimum of fatigue; and finally (g) size
and space for approach and use, i.e. appropriate size and space should be provided

CHAPTER 2. DISTRIBUTED COMPUTING AND MONITORING TECHNOLOGIES FOR OLDER PATIENTS
51
for approach, reach, manipulation, and use regardless of human body size, posture,
or mobility of a user, such as older patient.
Assisted living technologies (ALTs) is another relevant and broad term, which
often remains undefined and may have different meanings throughout aging-in-
place related literature [43]. Commonly, it refers to sensors, devices and communi-
cation systems (including software), which, in combination, help to assist older
adults and those who are physically or cognitively impaired in accomplishing their
daily tasks towards independent lives and an improved quality of life, by delivering
assisted living services [83], [84]. These services may include telehealth services
(i.e. delivering medical care, treatment, and monitoring services at home from a
remote location), telecare services (i.e. delivering social care and related monitor-
ing services at home from a remote location), wellness services (i.e. delivering ser-
vices for healthy lifestyles at home from a remote location), digital participation
services (i.e. which remotely engage older and disabled people in terms of social,
educational or entertainment activities at home), and teleworking services (i.e. in
which older and disabled people work remotely from home for an employer, a vol-
untary organisation or themselves and need remote computing to work successfully)
[84]. Noteworthy, telemedicine services (i.e. which involve delivering medical ser-
vices and advices from one practitioner to another at a remote location) are not
considered to be a part of ALTs [84].
Assisted living technologies based on Ambient Intelligence are called Ambient
assisted living (AAL) tools [33] and they are respectively broader than our scope of
monitoring and detecting health-threatening problems. AAL in general can be used
for preventing health problems, treatment, and improving health conditions and
well-being of older individuals. These tools can be installed in (health) smart-
homes and therefore can greatly support monitoring purposes by collecting contex-
tual information and by recording activities of daily living (ADL) [85]–[88], for
example. ADL may include any activity, which can be observed in daily living of an
individual (e.g. walking, laying, sitting, which are considered as basic activities, or
preparing a coffee, laundering, cooking meals, shopping groceries, considered as
instrumental activities). A huge number of AAL tools exists, such as medication
management tools [55], [89], [90], fall detection [91]–[95] and prevention systems
[96]–[98], video surveillance systems [6], [99]–[101], indoor location tracking
[102], [103], communication systems [8], [104], [105], mobile emergency response
systems [8], [63], [106]–[108], and diet suggestion systems [109], which in general
can be built and implemented with the purpose of health monitoring and improving
safety, connectivity and mobility of older adults at home.
The term eHealth, which nowadays seems to serve public as a general
“buzzword”, is currently defined by World Health Organisation (WHO) as “the use
of information and communication technologies (ICT) for health. Examples include
treating patients, conducting research, educating the health workforce, tracking

VISUAL ANALYSIS OF FACES WITH APPLICATION IN BIOMETRICS, FORENSICS AND HEALTH INFORMATICS
52
diseases and monitoring public health” [65]. In the light of this definition, this
chapter is focused on tracking diseases and monitoring public health for older adult
users. Apparently, definitions of eHealth seem to vary with respect to the functions,
stakeholders, contexts and various theoretical issues targeted [110]. The Medical
Subject Headings (MeSH) [111] library directly relates eHealth to the term Tele-
medicine, defining it as a “delivery of health services via remote telecommunica-
tions. This includes interactive consultative and diagnostic services.” One may by
intuition anticipate that eHealth refers to “electronic” healthcare, because of the
prefix “e”. However, the meaning of the letter “e” is rather ambiguous, and there-
fore eHealth term can be found in a very broad context. Furthermore, eHealth and
E-Health are often used interchangeably and are considered as synonyms [110].
However, one might find it rather confusing that WHO itself has another and slight-
ly different definition for the term E-Health, which is following: “the transfer of
health resources and health care by electronic means. It encompasses three main
areas:
The delivery of health information, for health professionals and health con-
sumers, through the Internet and telecommunications.
Using the power of IT and e-commerce to improve public health services,
e.g. through the education and training of health workers.
The use of e-commerce and e-business practices in health systems manage-
ment.” [112]
Eysenbach [113], on the other hand, provided the following definition to e-health
as a term and as a concept, and his definition remains to be broadly accepted till this
date: “e-health is an emerging field in the intersection of medical informatics, pub-
lic health and business, referring to health services and information delivered or
enhanced through the Internet and related technologies. In a broader sense, the
term characterizes not only a technical development, but also a state-of-mind, a
way of thinking, an attitude, and a commitment for networked, global thinking, to
improve health care locally, regionally, and worldwide by using information and
communication technology.” He also explained that the letter “e” in the term
eHealth might refer to ten qualities: (1) efficiency, (2) enhancing quality of care, (3)
evidence based, (4) empowerment of consumers and patients, (5) encouragement of
a new relationship between the patient and health professional, (6) education of
consumers and physicians through online sources, (7) enabling information ex-
change and communication in a standardized way between health care establish-
ments, (8) extending the scope of health care beyond its conventional boundaries,
(9) ethics, and (10) equity, so that everyone who needs eHealth would be able to
receive it. For the context of this chapter, eHealth provides various monitoring ser-
vices for older adults in need. For example, Cabrera-Umpiérrez et al. [66] described
the developed functionalities of the eHealth services for European co-funded pro-
jects, which provided (a) personalized health monitoring, (b) health coaching, and
(c) alerting and assisting services to assure the well-being of the older adult users

CHAPTER 2. DISTRIBUTED COMPUTING AND MONITORING TECHNOLOGIES FOR OLDER PATIENTS
53
during their daily activities. This chapter is thus focused primarily on the eHealth
services referring to the use cases (a) and (c) in that context.
Although much research has been carried out in the aforementioned fields that
deal with older people monitoring at home in the recent years, several unsolved
problems with existing tools persist, such as privacy issues [11], [64], [100], a lack
of accuracy in detecting health-threatening problems [114], invasiveness [115] and
intrusiveness [116], [117] of monitoring devices, and the fact that the monitoring
systems are mostly meant for direct patient-physician communication, while physi-
cians have a very limited time available per patient [16], [46], [118], [119]. Fur-
thermore, the size and complexity of the available data from different electronic
healthcare records is growing, which makes it harder for medical staff to analyse it
and to make clinical decisions [120]. Thus, an automated detection of health threat-
ening situations and clinical decision support systems have become a new prerequi-
site for an effective home healthcare with limited manning [121].
2.2.2. CONTENT AND AUDIENCE OF THIS CHAPTER
This chapter is intended for both geriatric care practitioners and engineers, who are
developing or integrating monitoring solutions for older adults. On the one side, this
chapter helps health care practitioners to familiarize with the available home moni-
toring technologies, and on the other side, it helps engineers to better understand the
purposes and problems of monitoring older people at home through the insight into
different scenarios and potential health-threatening situations and conditions of
older adults with physical, cognitive and/or mental impairments.
We start with reviewing a variety of well-known smart-home projects, which
present an overview of the needed infrastructure and give an insight of what should
be taken into consideration, when monitoring older people at home. The third sec-
tion includes the summary of the existing notable reviews and the taxonomies of
most common home-monitoring scenarios. Subsequently, the fourth section reveals
the spectrum of geriatric diseases and conditions mentioning the known approaches
of solving them in home settings. Section five further reveals the available monitor-
ing technology and possible automation of monitoring approaches, followed by
examples of how to realize these solutions, what the pros and cons are, and what
must be taken into consideration when implementing them in real home environ-
ments. The sixth section summarizes the available datasets, which are practically
useful for developing health-threat detection algorithms based on already monitored
empirical data. Finally, in section seven we discuss some anticipated future chal-
lenges of applying monitoring technology for older adults and consequently pro-
pose possible measures and directions towards dealing with some common issues.
This chapter is based on numerous scientific articles, which were exclusively
published in English, in a peer-reviewed text, and were available as full works.
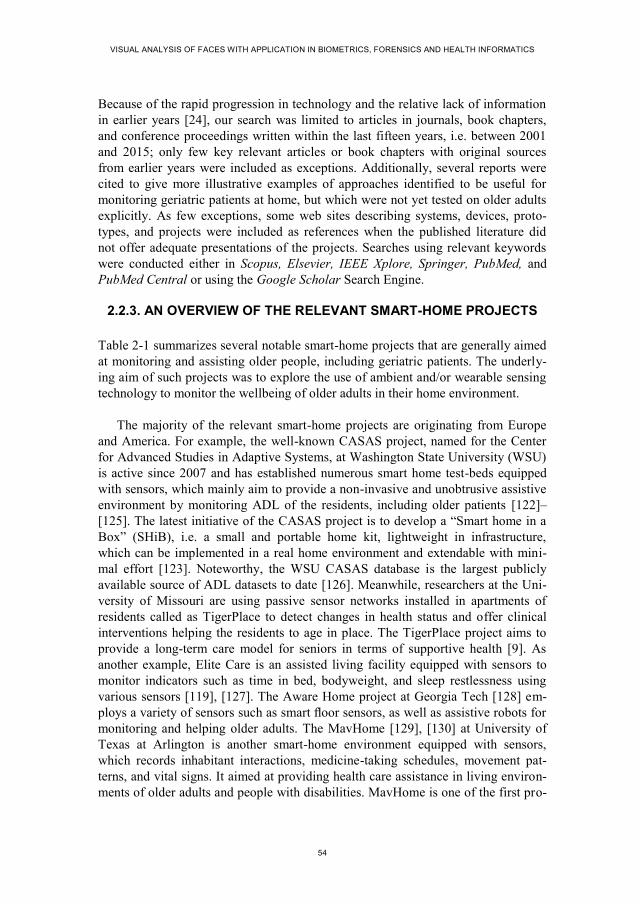
VISUAL ANALYSIS OF FACES WITH APPLICATION IN BIOMETRICS, FORENSICS AND HEALTH INFORMATICS
54
Because of the rapid progression in technology and the relative lack of information
in earlier years [24], our search was limited to articles in journals, book chapters,
and conference proceedings written within the last fifteen years, i.e. between 2001
and 2015; only few key relevant articles or book chapters with original sources
from earlier years were included as exceptions. Additionally, several reports were
cited to give more illustrative examples of approaches identified to be useful for
monitoring geriatric patients at home, but which were not yet tested on older adults
explicitly. As few exceptions, some web sites describing systems, devices, proto-
types, and projects were included as references when the published literature did
not offer adequate presentations of the projects. Searches using relevant keywords
were conducted either in Scopus, Elsevier, IEEE Xplore, Springer, PubMed, and
PubMed Central or using the Google Scholar Search Engine.
2.2.3. AN OVERVIEW OF THE RELEVANT SMART-HOME PROJECTS
Table 2-1 summarizes several notable smart-home projects that are generally aimed
at monitoring and assisting older people, including geriatric patients. The underly-
ing aim of such projects was to explore the use of ambient and/or wearable sensing
technology to monitor the wellbeing of older adults in their home environment.
The majority of the relevant smart-home projects are originating from Europe
and America. For example, the well-known CASAS project, named for the Center
for Advanced Studies in Adaptive Systems, at Washington State University (WSU)
is active since 2007 and has established numerous smart home test-beds equipped
with sensors, which mainly aim to provide a non-invasive and unobtrusive assistive
environment by monitoring ADL of the residents, including older patients [122]–
[125]. The latest initiative of the CASAS project is to develop a “Smart home in a
Box” (SHiB), i.e. a small and portable home kit, lightweight in infrastructure,
which can be implemented in a real home environment and extendable with mini-
mal effort [123]. Noteworthy, the WSU CASAS database is the largest publicly
available source of ADL datasets to date [126]. Meanwhile, researchers at the Uni-
versity of Missouri are using passive sensor networks installed in apartments of
residents called as TigerPlace to detect changes in health status and offer clinical
interventions helping the residents to age in place. The TigerPlace project aims to
provide a long-term care model for seniors in terms of supportive health [9]. As
another example, Elite Care is an assisted living facility equipped with sensors to
monitor indicators such as time in bed, bodyweight, and sleep restlessness using
various sensors [119], [127]. The Aware Home project at Georgia Tech [128] em-
ploys a variety of sensors such as smart floor sensors, as well as assistive robots for
monitoring and helping older adults. The MavHome [129], [130] at University of
Texas at Arlington is another smart-home environment equipped with sensors,
which records inhabitant interactions, medicine-taking schedules, movement pat-
terns, and vital signs. It aimed at providing health care assistance in living environ-
ments of older adults and people with disabilities. MavHome is one of the first pro-
CHAPTER 2. DISTRIBUTED COMPUTING AND MONITORING TECHNOLOGIES FOR OLDER PATIENTS
55
jects, which proposed to apply machine learning approaches to create a smart-home
that can act as an intelligent agent, i.e. which can adapt to its inhabitants, identify
trends that could indicate health concerns or a need for transition to assisted care, or
detect anomalies in regular living patterns that may require intervention. Other no-
table smart home test-beds include DOMUS [131] at the University de Sherbrooke,
and House_n project at the Massachusetts Institute of Technology [132]. Several
smart home projects in Europe include iDorm [133], Grenoble Health Smart Home
[134], GiraffPlus [135], PROSAFE [136], Gloucester Smart House [137] and
ENABLE [138] for dementia patients, and Future Care Lab [47], [139]. The majori-
ty of these research projects monitor a subset of ADL tasks. There are also related
joint initiatives such as the “Ambient Assisted Living Joint Programme” or “The
Active and Assisted Living Joint Programme”, supported by the European commis-
sion with the goal of enhancing the quality of life of older people across Europe
through the use of AAL technologies and to support applied research on innovative
ICT-enhanced services for ageing well [44], [140]. As an example, in one of the
most recent European projects, called as Giraff-Plus [135], researchers develop and
evaluate a complete system that collects daily behavioural and physiological data of
older adults from distributed sensors, performs context recognition, a long-term
trend analysis and presents the information via a personalized interface. Giraff-Plus
supports social interaction between primary users (older citizens) and secondary
users (formal and informal caregivers), thereby allowing caregivers to virtually visit
an older person in the home.
Also in Asia, some notable smart home projects were developed, such as the
early “Welfare Techno Houses” across Japan [141], promoting independence for
older and disabled persons, and for improving their quality of life. For example, the
large Takaoka Techno House [141] measured medical indicators such as electrocar-
diogram (ECG), body and excreta weights, and urinary volume, using sensor sys-
tems placed in the bed, toilet and bathtub. The Ubiquitous Home project [142], [29]
is another Japanese smart home project, which applied passive infrared (PIR) sen-
sors, cameras, microphones, pressure sensors, and radiofrequency identification
(RFID) technology intended for monitoring living activities of residents, including
older adults. The SELF smart home project, also in Japan, monitored posture, body
movement, breathing, and oxygen in the blood, using pressure sensor arrays, cam-
eras, and microphones [143]. In South Korea, a POSTECH’s U-Health smart home
project [144] is focused on establishing autonomic monitoring of home and its ag-
ing inhabitants in order to detect health problems, by applying different environ-
mental wireless sensors and a wearable ECG monitor, and to provide assistance
when needed.
In Oceania region, there are several noteworthy projects as well. For instance,
the Hospital Without Walls project [145] is an early example of home-telecare pro-
ject in Australia that used a wireless wearable fall monitoring system based on
small on-body sensors, which measured heart rate and body movements. The initial
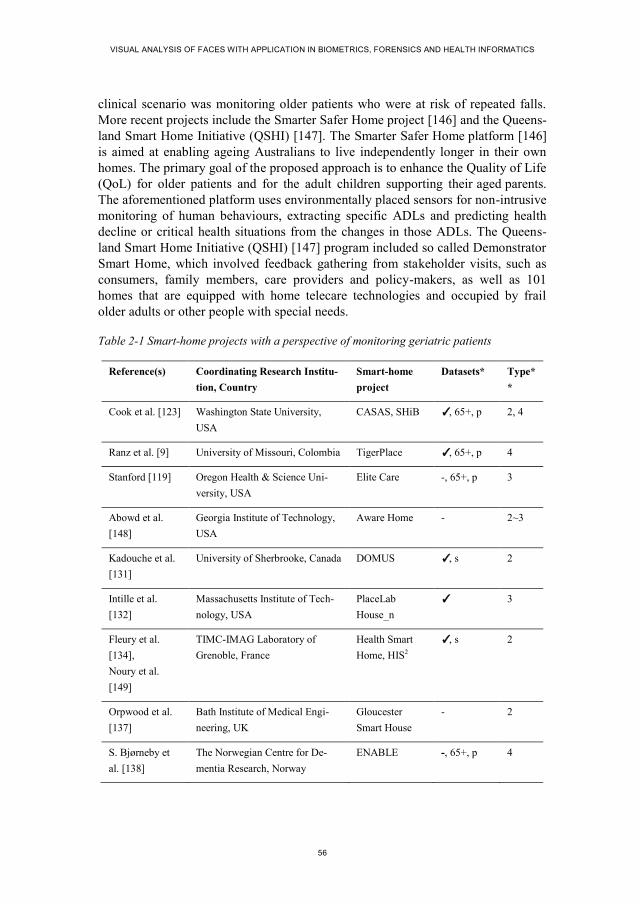
VISUAL ANALYSIS OF FACES WITH APPLICATION IN BIOMETRICS, FORENSICS AND HEALTH INFORMATICS
56
clinical scenario was monitoring older patients who were at risk of repeated falls.
More recent projects include the Smarter Safer Home project [146] and the Queens-
land Smart Home Initiative (QSHI) [147]. The Smarter Safer Home platform [146]
is aimed at enabling ageing Australians to live independently longer in their own
homes. The primary goal of the proposed approach is to enhance the Quality of Life
(QoL) for older patients and for the adult children supporting their aged parents.
The aforementioned platform uses environmentally placed sensors for non-intrusive
monitoring of human behaviours, extracting specific ADLs and predicting health
decline or critical health situations from the changes in those ADLs. The Queens-
land Smart Home Initiative (QSHI) [147] program included so called Demonstrator
Smart Home, which involved feedback gathering from stakeholder visits, such as
consumers, family members, care providers and policy-makers, as well as 101
homes that are equipped with home telecare technologies and occupied by frail
older adults or other people with special needs.
Table 2-1 Smart-home projects with a perspective of monitoring geriatric patients
Reference(s) Coordinating Research Institu-
tion, Country
Smart-home
project
Datasets* Type*
*
Cook et al. [123] Washington State University,
USA
CASAS, SHiB ✓, 65+, p 2, 4
Ranz et al. [9] University of Missouri, Colombia TigerPlace ✓, 65+, p 4
Stanford [119] Oregon Health & Science Uni-
versity, USA
Elite Care -, 65+, p 3
Abowd et al.
[148]
Georgia Institute of Technology,
USA
Aware Home - 2~3
Kadouche et al.
[131]
University of Sherbrooke, Canada DOMUS ✓, s 2
Intille et al.
[132]
Massachusetts Institute of Tech-
nology, USA
PlaceLab
House_n
✓ 3
Fleury et al.
[134],
Noury et al.
[149]
TIMC-IMAG Laboratory of
Grenoble, France
Health Smart
Home, HIS2
✓, s 2
Orpwood et al.
[137]
Bath Institute of Medical Engi-
neering, UK
Gloucester
Smart House
- 2
S. Bjørneby et
al. [138]
The Norwegian Centre for De-
mentia Research, Norway
ENABLE -, 65+, p 4

CHAPTER 2. DISTRIBUTED COMPUTING AND MONITORING TECHNOLOGIES FOR OLDER PATIENTS
57
Reference(s) Coordinating Research Institu-
tion, Country
Smart-home
project
Datasets* Type*
*
Beul et al. [47] Aachen University, Germany Future Care Lab - 1
Helal et al. [150] University of Florida, USA Gator Tech
Smart House
✓, 65+, p 2
Yamazaki et al.
[142], [29]
National Institute of Information
and Communications Technolo-
gy, Japan
Ubiquitous
Home
✓, 65+, p 2
Tamura et al.
[141]
Chiba University, Japan Welfare Techno
House
-, 65+, p 2
Kim et al. [144] Pohang University of Science and
Technology (POSTECH), South
Korea
POSTECH’s U-
Health Smart
Home
- 1
Chan et al.
[136],
Bonhomme et
al. [102]
Laboratory for Analysis and
Architecture of Systems (LAAS),
France
PROSAFE,
PROSAFE-
extended
-, 65+, p 3
Callaghan et al.
[151], [152]
University of Essex, UK iDorm, iDorm2
(iSpace)
- 3
Nishida et al.
[143]
Electrotechnical Lab, Japan SELF - 1
Iversen [153] Danish Technological Institute
(DTI), Denmark
DTI CareLab - 1
Sundar et al.
[154]
University at Buffalo, USA ActiveHome
(X10)
- 4
Youngblood et
al. [130]
The University of Texas at Ar-
lington, USA
MavHome - 1
Orcatech Tech-
nologies [155]
Oregon Center for Aging and
Technology, USA
ORCATECH:
Life Lab, Point
of Care Lab
✓, 65+, p 2, 4
Coradeschi et al.
[135],
Palumbo et al.
[156]
Örebro University, Sweden
Real houses and apartments in
Italy, Spain, Sweden
GiraffPlus -, 65+, p 4
Continued from previous page….

VISUAL ANALYSIS OF FACES WITH APPLICATION IN BIOMETRICS, FORENSICS AND HEALTH INFORMATICS
58
Reference(s) Coordinating Research Institu-
tion, Country
Smart-home
project
Datasets* Type*
*
Soar et al. [147] University of Southern Queens-
land, Australia
Queensland
Smart Home
Initiative
(QSHI)
-, 65+, p 1, 4
Wilson et al.
[145]
Australia's Commonwealth Scien-
tific and Industrial Research
Organization (CSIRO), Australia
Hospital With-
out Walls
-, 65+, p 2
Dodd et al. [146] Australia's Commonwealth Scien-
tific and Industrial Research
Organization (CSIRO), Australia
Smarter Saf-
er Home
-, 65+, p 4
* “Datasets” column indicates, which smart-home projects have collected empirical datasets (‘✓’), and
whether these projects include data form real older adults (‘65+’), and whether real medical patients
were involved (‘p’), or only simulated patients were used (‘s’), i.e. healthy persons (often younger stu-
dents) imitated symptoms of certain illnesses or alarming events, such as falls, or other behaviours of
older patients.
** “Type” column classifies the test-beds of the reviewed smart-home projects into four main types,
according to Tomita et al. [157]: 1 = “Laboratory Setting” (i.e. a facility at a research institution, which
utilizes an infrastructure and sensory equipment that researches find sufficient, but is not meant for
actual habitation), 2 = “Prototype smart-home” (allows actual habitation, usually for a short-term, and is
specifically designed for research purposes), 3 = “Smart-home in use” (necessary infrastructure and
monitoring technology is implemented in actual community settings, apartment complexes, and retire-
ment housing units), 4 = “Retrofitted smart-home” (i.e. a private home or an individual apartment is
converted to a smart-home, by integrating (retro-fitting) monitoring technology on top of existing home
infrastructure).
2.3. REVIEWS AND TAXONOMIES
This section summarizes the existing review articles in the field of monitoring and
diagnosing older adults at risk of health deterioration, in the context of smart-
homes. We classified these review articles based on their aims and reviewing ap-
proaches of proposed monitoring systems capable of detecting health threats in
smart-home settings. We included reviews, which focused on describing technolo-
gy, applications, costs, and quality of monitoring services. These reviews greatly
help to obtain an overview of the assortment of available monitoring solutions for
various scenarios.
Over the past decade, the number of publications concerning the field of moni-
toring older adults at home has grown significantly. To structure an overview of the
Continued from previous page….

CHAPTER 2. DISTRIBUTED COMPUTING AND MONITORING TECHNOLOGIES FOR OLDER PATIENTS
59
individual review articles, including their purpose and approaches, taxonomy was
defined to arrange them into various groups having similar characteristics.
Various categories may be used for a taxonomy to distinguish between different
approaches, e.g. (in random order): patient-centric vs. physician-centric approaches,
vision-based vs. non-vision-based systems, active vs. passive sensing, mobile vs.
stationary sensors, various scenario assumptions (health condition and disabilities,
single patient vs. multiple patients, number of rooms at home, etc.), cost, number of
monitored parameters, sensor modality, long-term monitoring vs. short-term moni-
toring, non-intrusive vs. holistic intrusive methods, etc. The various review works
that are discussed in the next section have used different taxonomies.
2.3.1. PREVIOUS REVIEWS
A number of comprehensive reviews were written which summarized the important
proposals of monitoring and diagnosing at home older adults at risk of health dete-
rioration, in the context of smart-homes, the last one published in March 2015. All
reviews discuss both vision and non-vision based monitoring technology. Some of
these reviews explicitly mentioned medical application contexts [5], [18], [20],
[33], [49], [51], [158]–[164], and some did not [99]. These reviews can be classified
into different overlapping groups according to the view-points used during the re-
view process. The viewpoints are: a) Technology centric, b) Application centric, c)
Cost centric, and d) Quality of Service (QoS) centric. Figure 2-2 illustrates these
four groups and corresponding reviews from the literature. Technology centric re-
views included discussions and summarized methods regarding core technologies,
such as object segmentation, feature extraction, activity detection and recognition,
clinically important symptom detection, etc. Application centric reviews discussed
and summarized methods related to applications such as fall detection, detection of
ADL, detection of instrumental activities, detection of sick samples for diagnosis,
etc. Cost centric reviews discussed the expenditures required for implementation of
activity monitoring systems. The QoS centric reviews discussed and summarized
the service quality of the methods in the area of activity monitoring and elderly
assisted smart-homes. Service quality can be defined in terms of validation study,
performance, user adaptability, sensitivity, etc., which is usually assessed based on
the outcomes. Service quality naturally is focused on benefitting an end user (an
older adult), and when this end user is a patient, QoS centric reviews often discuss
patient-centeredness of the reviewed approaches. They often tend to summarize
outcomes of different telemonitoring solutions and to give best practice recommen-
dations for improving quality of service for older adults.
Among the previous reviews, technology and application centric reviews
achieved good consideration in the study of automated monitoring and diagnosis in
smart homes. Though technology centric reviews in the literature thoroughly ad-
dressed the core technologies used in this area (e.g. describing system architecture,

VISUAL ANALYSIS OF FACES WITH APPLICATION IN BIOMETRICS, FORENSICS AND HEALTH INFORMATICS
60
integrated sensors, proposed algorithms, communication protocols, etc.), applica-
tion centric reviews focus on particular application area and may, for example,
merely consider some subgroups of ADLs, or instrumental activities, or generalized
human activities in both medical and non-medical contexts [5], [33], [49], [158].
Most of these application-centric reviews did not include comprehensively the is-
sues of older patients in an assisted living environment, however, they have men-
tioned general scenarios of monitoring older adults at home. There is a very limited
discussion of patient-centeredness among these reviews, which only includes some
discussions and summaries of the methods in terms of patient’s necessity, services
and measuring parameters, such as handling adverse condition, assessing state of
health, in-home diagnosis methods. Moreover, the previous reviews did not discuss
the methods for in-home diagnosis of patients and include less discussion regarding
collection of datasets in the patient-centred contexts. Thus, in this chapter we sys-
tematically summarize the methods that came up as solutions by utilizing monitored
data to the issues related to patient’s necessity, services and measuring diagnostic
parameters of older adults in smart-home scenarios.
Table 2-2 further summarizes the main features and contents of these key re-
view works in the domain of monitoring technologies and health-threat detection in
older adults, where the column Topic presents the reviews’ context such as the algo-
rithms for activity recognition, hardware tools available for monitoring, hospitality
services available at home, and/or evaluation methods for monitoring systems. The
column Contents presents the summaries of reviews, Types of Analysis notes the
types of data (either quantitative or qualitative) used in the review in order to assess
the existing literature and the application types (medical or general) considered in
the reviews. The medical application in column 4 was drawn from the setup related
to the medically ill patients, whereas the non-medical or general application context
was drawn from the setup not necessarily related to real patients or geriatrics. The
column Sensors discussed presents the types of sensors discussed in the reviews. In
Table 2-2 we have also included reviews covering non-medical applications, be-
cause the contents of the reviews included the literatures and the underlying objec-
tives of monitoring activities and measuring physiological parameters of geriatric
patients at home. In column 5, vision based sensors include, for example, thermal
cameras, RGB cameras, and/or infrared (IR) cameras such as depth-sensing camer-
as. On the other hand the most common non-vision based sensors are microphones,
accelerometers, heat sensors, flow sensors, pressure sensors, electromagnetic sen-
sors, ultrasonic sensors, and particle sensors.
A notable study by Morris et al. [20] systematically reviewed smart-home tech-
nologies that assisted older adults to live well at home. This review is mainly Quali-
ty of Service (QoS) centric, because the authors only reviewed works, which as-
sessed smart-home technologies in terms of effectiveness, feasibility, acceptability,
and perceptions of older people. They indicated that only one study assessed effec-
tiveness of a smart home technology in the context of monitoring and assisting

CHAPTER 2. DISTRIBUTED COMPUTING AND MONITORING TECHNOLOGIES FOR OLDER PATIENTS
61
older adults at home [154], while majority of studies reported on the feasibility of
smart-home technology and other studies were purely observational.
Figure 2-2 Categories of existing reviews in the literature in terms of their viewpoints (men-tioning the first author and year of publication for each reference).
Demiris and Hensel [161] conducted a systematic review of smart-home pro-
jects worldwide, discussing applied technologies and models used, categorizing
these projects according to different goals, as for example, the monitoring of physi-
Previous reviews of monitoring systems capable of detecting health
threats in smart-home settings
Technology centric
1. C. N. Scanaill et al.,
2006 [18]
2. J. K. Aggarwal et al.,
2011 [99]
3. S. R. Ke et al., 2013
[5]
4. O. P. Popoola et al.,
2012 [6]
5. P. Rashidi et al.,
2013 [33]
6. S. C.
Mukhopadhyay,
2015 [164]
Application centric
1. G. Demiris et al.,
2008 [161]
2. J. K. Aggarwal et al.,
2011 [99]
3. F. Sadri, 2011 [34]
4. F. Cardinaux et al.,
2011 [49]
5. R. Bemelmans et al.,
2011 [165]
6. O. P. Popoola et al.,
2012 [6]
7. W. Ludwig et al.,
2012 [51]
8. T. Tamura, 2012
[162]
9. S. Patel et al., 2012
[163]
10. A. Ali et al., 2012
[166]
11. D. Sampaio et al.,
2012 [32]
12. P. Rashidi et al.,
2013 [33]
Cost centric
1. C. N. Scanaill et
al., 2006 [18]
2. H. V. Remoortel et
al., 2012 [159]
3. B. Reeder et al.,
2013 [158]
Quality of Service
(QoS) centric
1. G. Demiris et al.,
2008 [161]
2. F. Cardinaux et al.,
2011 [49]
3. R. Bemelmans et al.,
2011 [165]
4. W. Ludwig et al.,
2012 [51]
5. H. V. Remoortel et
al., 2012 [159]
6. D. Sampaio et al.,
2012 [32]
7. M. J. Kim et al., 2013
[160]
8. B. Reeder et al., 2013
[158]
9. M.E. Morris et al.,
2013 [20]
10. A. Cheung et al.,
2015 [165]

VISUAL ANALYSIS OF FACES WITH APPLICATION IN BIOMETRICS, FORENSICS AND HEALTH INFORMATICS
62
ological vital signs, functional outcomes (e.g. abilities to perform ADLs), safety
(e.g. detecting environmental hazards, such as fire or gas leaks) and security (e.g.
alerts to human threats), social interactions (i.e. measuring and facilitating human
contact including information and communication applications), emergency detec-
tion (e.g. falls), and cognitive and sensory assistance (i.e. cognitive aids such as
reminders and assistance with deficits in sight, hearing, and touch). They stressed
that the design and implementation of informatic applications for older adults
should not be determined simply by technological advances but by the actual needs
of end users. Furthermore, the current smart-home research needs to address such
important questions as health outcomes, clinical algorithms to indicate potential
health problems, user perception and acceptance, and ethical implications [161].
Table 2-2 Summary of the review works in the fields of vision-based and non-vision-based patient monitoring and health-threat detection technologies
Reference Topic Contents / Main contributions
Type of
the analy-
sis
Sensors
View-
points
covered
Number
of re-
viewed
works
J.K. Ag-
garwal,
2011 [99]
Human activity
analysis
Taxonomy of human activity in terms of
automated recognition complexity, tools
for recognition, summarizing the services
of different proposed methods, discus-
sion about dataset creation and availabil-
ity
Both
qualitative
and quanti-
tative in
non-
medical
applica-
tions
Vision
based
Technolo-
gy and
application
centric
102
S.R. Ke,
2013 [5]
Tools for activi-
ty recognition
Discussing object detection methods,
feature extraction and representation
methods, machine learning methods,
some example activity recognition sys-
tems
Qualitative
in both
medical
and non-
medical
applica-
tions
Vision
based
Technolo-
gy centric 145
O.P.
Popoola,
2012 [6]
Video analysis
for abnormal
human behavior
detection
Summarizing the focus of previous
review articles for behavior recognition,
organizing the references for common
tools and paradigms used, theme based
classification of previous research, listing
of datasets
Qualitative
in medical
and sur-
veillance
applica-
tions
Vision
based
Technolo-
gy and
application
centric
141

CHAPTER 2. DISTRIBUTED COMPUTING AND MONITORING TECHNOLOGIES FOR OLDER PATIENTS
63
Reference Topic Contents / Main contributions
Type of
the analy-
sis
Sensors
View-
points
covered
Number
of re-
viewed
works
C.N.
Scanaill,
2006 [18]
Sensors used
for mobility
telemonitoring
of elderly
Estimating expenditure for assisted
independent aging, summarizing the
characteristics of sensors, and corre-
sponding pros and cons
Qualitative
in medical
applica-
tions
Vision
and non-
vision
based
Technolo-
gy and cost
centric
59
F. Cardi-
naux, 2011
[49]
Video analysis
for ambient
assisted living
Application centric listing of existing
methods, services of existing methods for
action detection, visual processing and
privacy of visual data
Qualitative
in medical
applica-
tions
Vision
based
Applica-
tion and
QoS
centric
72
G.
Demiris,
2008 [161]
Systematic
review of
smart-home
applications for
aging society
Discussing technologies and models used
in existing smart-home projects, catego-
rizing them in accordance to monitoring
of physiological, functional outcomes,
safety and security, social interactions,
emergency detection, and cognitive and
sensory assistance.
Qualitative
in medical
applica-
tions
Vision
and non-
vision
based
Applica-
tion and
QoS
centric
31 (114)
B. Reeder,
2013 [158]
Health smart
homes and
home-based
consumer health
technologies for
independent
aging
Classifying technologies into emerging,
promising and effective groups, summa-
rizing the contribution of each article
instead of sub-division of methods used,
analysing the study environment for each
article
Qualitative
in medical
applica-
tions
Vision
and non-
vision
based
QoS
centric
83 (31
key
articles
out of
1685
articles)
W. Lud-
wig, 2012
[51]
Services from
health-enabling
technologies
Handling adverse conditions such as fall
detection and cardiac emergencies,
assessing state of health such as recogni-
tion of diseases and medical conditions,
consultation and education for the use of
services, motivation and feedback from
the user, service ordering, social inclu-
sion of telehealth services
Qualitative
in medical
applica-
tions
Vision
and non-
vision
based
Applica-
tion and
QoS
centric
47 (27
key
articles
out of
1447
articles)
Continued from previous page….

VISUAL ANALYSIS OF FACES WITH APPLICATION IN BIOMETRICS, FORENSICS AND HEALTH INFORMATICS
64
Reference Topic Contents / Main contributions
Type of
the analy-
sis
Sensors
View-
points
covered
Number
of re-
viewed
works
H.V.
Remoortel,
2012 [159]
Validity study
of activity
monitors
Summarizing the features of commercial-
ly available activity monitors, perfor-
mance evaluation and comparison of
different activity monitors in terms of
different statistical measures
Quantita-
tive in
medical
applica-
tions
Non-
vision
based
QoS
centric
154 (134
key
articles
out of
2875
articles)
M.J. Kim,
2013 [160]
Identifying
significant
evaluation
methods
adapted in user
studies of health
smart homes
Listing of system effectiveness evalua-
tion of user studies, analysis of user
experience evaluation
Qualitative
in medical
applica-
tions
Vision
and non-
vision
based
QoS
centric
41 (20
readable
articles in
this
context
out of 82
articles)
T. Tamu-
ra, 2012
[162]
Home geriatric
physiological
and behavioural
monitoring
approaches
Discussing several sensory devices and
appliances, which intend to monitor and
assist older adults and disabled people in
their living environments
Qualitative
in medical
applica-
tions
Vision
and non-
vision
based
Applica-
tion centric 91
S. Patel et
al., 2012
[163]
Wearable
sensors and
systems with
application in
rehabilitation
Summarizing wearable and ambient
sensor technology (incl. off-the-shelf
solutions) applicable to older adults and
subjects with chronic conditions in home
and community settings for monitoring
health and wellness, safety, home reha-
bilitation, treatment efficacy, and early
detection of disorders.
Qualitative
in medical
applica-
tions
Non-
vision
based
Applica-
tion centric 124
M.E.
Morris et
al., 2013
[20]
Systematic
review of
smart-home
technologies
assisting older
adults to live
well at home
Summarizing studies, which assessed
smart-home technologies in terms of
effectiveness, feasibility, acceptability
and perceptions of older people.
Qualitative
in medical
applica-
tions
Vision
and non-
vision
based
QoS-
centric
50 (21
out of
1877 key
articles)
Continued from previous page….

CHAPTER 2. DISTRIBUTED COMPUTING AND MONITORING TECHNOLOGIES FOR OLDER PATIENTS
65
Reference Topic Contents / Main contributions
Type of
the analy-
sis
Sensors
View-
points
covered
Number
of re-
viewed
works
P. Rashidi
et al.,
2013[33]
Sensors and
research pro-
jects of ambient
assisted living
(AAL) tools for
older adults
Summarizing emerging tools and tech-
nologies for smart-home implementation;
classifying the AAL tools and technolo-
gies into a) smart-homes, b) mobile and
wearable sensors, and c) robotics for
supporting ADL, summarizing general
sensor types and measurement parame-
ters used in the existing smart-home
projects.
Qualitative
in medical
applica-
tions
Vision
and non-
vision
based
Technolo-
gy and
application
centric
192
A. Cheung
et al., 2015
[165]
Systematic
literature review
of studies,
which integrat-
ed bedside
monitoring
equipment to an
information
system.
Gathering evidence on the impact of the
patient data management systems
(PDMS) on both organisational and
clinical outcomes, derived from English
articles published between January 2000
and December 2012.
Qualitative
in medical
applica-
tions
Non-
vision
based
QoS-
centric
39 (18
out of
535 key
articles)
S. C.
Mukho-
padhyay,
2015 [164]
Reported litera-
ture on weara-
ble sensors and
devices for
monitoring
human activities
Summarizing architecture and sensors for
human activity monitoring systems,
mentioning design challenges for weara-
ble sensors, energy harvesting issues, as
well as market trends for wearable devic-
es.
Qualitative
in both
medical
and non-
medical
applica-
tions
Non-
vision
based
Technolo-
gy centric 103
In a recent and comprehensive technology- and application-centric surveys, Ra-
shidi et al. [33] summarized the emergence of ambient assisted living (AAL) tools
for older adults based on ambient intelligence (AmI) paradigm. They summarized
the state-of-the-art AAL technologies, tools, and techniques, and revealed current
and future challenges. They divided the AAL tools and technologies into a) smart-
homes, b) mobile and wearable sensors, and c) robotics. They also summarized the
general sensor types and measurement parameters used in the smart-home projects.
Continued from previous page….

VISUAL ANALYSIS OF FACES WITH APPLICATION IN BIOMETRICS, FORENSICS AND HEALTH INFORMATICS
66
Another related application-centric article written by Sadri [34] surveyed AmI
and its applications at home, including care of older adults. The main focus was on
ambient data management and artificial intelligence, for example, planning, learn-
ing, event-condition-action (ECA) rules, temporal reasoning, and agent-oriented
technologies. Sadri found that older adults, typically, need initial training, and often
follow-up daily assistance, to use AmI devices. Finally, security threats as well as
social, ethical and economic issues behind AmI were discussed.
One application-centric systematic review by Ali et al. [166] studied specifically
gait disorder monitoring using vision and non-vision based sensors. They showed
strong evidence for the development of rehabilitation systems using a marker-less
vision-based sensor technology. They therefore believed that the information con-
tained in their review would be able to assist the development of rehabilitation sys-
tems for human gait disorders.
Sampaio et al. [32] in his survey on AmI made a comparative analysis of some
of the research projects, with a specific focus on the human profile, which in the
authors’ point of view is a crucial aspect to take into account when searching for a
correct response to human stimuli. This survey explains both application-centric
and QoS centric matters. The main objective of their work was to understand the
current necessities, devices, and the main results in the development of these pro-
jects. The authors concluded that most projects do not present the different charac-
teristics and needs of people, and miss exploring the potential of human profiles in
the context of ambient adaptation.
Another application and QoS centric review was conducted by Bemelmans et al.
[167], where the authors searched the domain of socially assistive robotics and
studied their effects in elderly care. They found only very few academic publica-
tions, where a small set of robot systems were found to be used in elderly care.
Although individual positive effects were reported, the scientific value of the evi-
dence was limited due to the fact that most research was done in Japan with a small
set of robots (mostly off-the-shelf AIBO, Paro [168] and NeCoRo [169]), with
small sample sets, not yet clearly embedded in a care need driven intervention. The
studies were mainly of an exploratory nature, underlining the initial stage of robot-
ics as monitoring and assistive technology applied within health care.
The recent QoS centric systematic review by Cheung et al. [165] studied organi-
sational and clinical impacts of integrating various bedside monitoring equipment to
an information system, i.e. a computer-based system capable of collecting, storing
and/or manipulating clinical information important to the healthcare delivery pro-
cess. The authors drew a special attention that implementation of so called patient
data management systems (PDMS) potentially offers more than just a replacement
of a paper-based charting and documentation system, but also ensures considerable
time savings, which can lead to more time left for direct patient care. Additionally,
CHAPTER 2. DISTRIBUTED COMPUTING AND MONITORING TECHNOLOGIES FOR OLDER PATIENTS
67
authors concluded that improved legibility, consistency and structure of infor-
mation, achieved by using a PDMS, could result in fewer errors.
In one of the most recent technology centric reviews by Mukhopadhyay [164]
the latest reported systems on human activity monitoring based on wearable sensors
were discussed and several issues to tackle related technical challenges were ad-
dressed. The author pointed out that development of lightweight physiological sen-
sors could lead to comfortable wearable devices for monitoring different types of
activities of home dwellers, while the cost of the devices is expected to decrease in
the future.
2.4. RELEVANT SCENARIOS FOR HOME MONITORING SOLUTIONS FOR OLDER ADULTS
In this section, we describe three common scenarios of older people’s living situa-
tion in order to increase the understanding of when and how home monitoring can
be used among older people at risk of worsening health. We aim at describing the
different circumstances under which monitoring approaches and personal care solu-
tions can be applied. Then, we describe relevant geriatric conditions and threats of
deteriorating health and functional losses, which are considered to be of paramount
need for suitable monitoring solutions. Finally, we summarize these needs in a con-
cise list of conditions and activities that shall be automatically monitored.
We acknowledge that older people are individuals with very different health,
social, and socio-economic characteristics, which make them as a whole a very
heterogeneous group of the population. Yet, we will describe three common scenar-
ios, which we believe cover a majority of the situations encountered by older adults
in need of special attention to prevent health deterioration. This includes, but it is
not limited to, the description of the involved persons4 that are receiving or poten-
tially will receive in-home health and personal care. The descriptions may include,
for example, the older persons’ general health condition (i.e. their physical, mental
and cognitive functional abilities), the current living environment and daily activi-
ties, the health care services and technologies that they already have or are poten-
tially available, and the possible ethical and legal issues. These basic conditions
have to be considered before proposing any home monitoring solution. It is im-
portant to understand the various scenario descriptions in order to identify the key
requirements and needs for an optimal monitoring solution in each single case. For
example, the use of video cameras is legally restricted in many countries for privacy
reasons, which means that it does not make sense to propose video-based solutions
4 In this book we have a primary focus on older adults, mainly aged 70 and over (70+), who are being
monitored. Other involved persons may include formal caregivers (nurses, social- and health care assis-
tants and helpers), informal caregivers (family, neighbours, and friends).

VISUAL ANALYSIS OF FACES WITH APPLICATION IN BIOMETRICS, FORENSICS AND HEALTH INFORMATICS
68
if the legal situation does not allow their installation. But even when it is legal,
cognitively or mentally impaired persons may not be able or willing to cooperate
with caregivers and thus would require other solutions.
Finally, emphasis should be put on establishing seamless and consistent infor-
mation and communication flow between the different actors in health care, i.e.
formal home care, general practitioner (family doctor), and secondary healthcare,
which requires accessibility to Electronic Health Records (EHR), also for mobile
units, to retrieve updated information on health, diseases and actual treatment, as
well as for documentation [104]. Appropriate analysis of which in-home monitoring
tools may be used when and where requires principally a broad cooperation be-
tween involved engineering teams and health care professionals.
The most relevant factors that ultimately influence in-home monitoring scenari-
os are the older person’s conditions and abilities, types of living environment, types
of activities, existing infrastructure, current care and medication plans, parameters
that need to be monitored, intensity of monitoring, and data transmission, among
others.
2.4.1. HEALTHY, VULNERABLE, AND ACUTELY ILL OLDER ADULTS
The older we get the more diverse we become in terms of health and functions. It is
therefore a challenge to categorize older adults into a few descriptive groups and
scenarios. Most commonly, and depending on the general abilities of older adults,
three main groups of in-home monitoring scenarios can be observed: 1) scenarios
involving relatively ‘healthy’ older adults, 2) scenarios involving ‘vulnerable’ older
adults, and 3) scenarios involving ‘acutely ill’ older adults.
Although the meaning of being healthy can be discussed at length, we describe
the main actors of our first scenario as older adults who seem relatively ‘healthy’,
as they most likely are independently living in their own home, and do not show
any particular symptoms of health deterioration [45], [170]. These older adults may
still have a few comorbid diseases, e.g. cataract and osteoarthritis, but are not yet
hampered in their activities of daily living, although they may have had a few inci-
dents in the past such as falls. Thus, they would benefit from early detection of
health-threatening situations and potential risks, e.g. poor lightning at night when
they have to go to the bathroom, or fast movements before the body has gained
stability, for instance, when rising from a chair. Another monitoring example could
be the detection of declining mobility, which may happen, for instance, due to inad-
equate relief of a bodily pain caused by osteoarthritis in the knee. Less physical
activity would lead to a negative spiral with not only worsening of the pain but also
disuse of muscles, which in turn leads to muscle wasting and loss of muscle mass
and strength, i.e. sarcopenia, a disabling disease.

CHAPTER 2. DISTRIBUTED COMPUTING AND MONITORING TECHNOLOGIES FOR OLDER PATIENTS
69
The second scenario type is the most commonly described in the home monitor-
ing literature. It involves ‘vulnerable’ older adults diagnosed with one or more
chronic medical conditions [54], [55], [106], [171]–[174], e.g. chronic obstructive
pulmonary disease (COPD), diabetes, cardiovascular diseases, stroke, hypertension,
depression etc., and/or with impaired physical, mental or cognitive functions. Older
adults with chronic diseases are at higher risk of worsening health, e.g. chronic
atrial fibrillation increases the risk of getting a stroke and cognitive impairment.
Within this scenario, the older persons would in many cases benefit from regular
(daily/weekly) attention and possibly assistance from a caregiver. In addition, the
monitoring equipment should be adaptable to other requirements for this more vul-
nerable group of persons, compared to the first scenario, e.g. being applied to older
adults who would have difficulties in interacting with the technology, perhaps even
accept its presence.
The third scenario type involves older adults, either belonging to the first or the
second scenarios, but who are developing an acute illness, on top of chronic diseas-
es or conditions, and thus at threat of an acute hospitalization, as exemplified in
[172], [175], [176]. This scenario has the most complex requirements for monitor-
ing technology, and is often called Hospital at Home (HH) scenario [177]. In addi-
tion to monitoring technology there is usually a need of appropriate assistive tech-
nology that makes it feasible for older adults with multiple geriatric conditions to
avoid acute admission, or, if admitted to the emergency department, to be dis-
charged earlier to their own dwelling with the appropriate technology.
It is important to note, that the aforementioned three main types of scenarios are
only rough approximations of patient groups. The boundaries between the three
groups are often blurred, while the real-life scenarios would require much deeper
insight into the individual patient’s characteristics, institutional factors, the current
social network situation, the comorbidities, and the main health care tasks and
goals. Therefore, the next subsection describes possible geriatric conditions, which
are relevant and worthy to have an insight to, in order to understand the challenges
of applying in-home monitoring of older adults in their dwellings. Such geriatric
conditions would also be involved in the ultimate decision on which type of moni-
toring devices should be used in one of the three scenarios. Apart from getting in-
sight to the various, but common, geriatric conditions it is also important to under-
stand that with advancing age the risk of suffering from multiple diseases at the
same time increases. Two different words are commonly used when describing
disease profiles in older patients: comorbidity and multi-morbidity. The first is
mainly defined by the co-existence of at least one chronic disease or condition with
the disease of interest, while multi-morbidity is usually defined as the co-
occurrence of at least two chronic conditions within one person at a given time
[178]. Multi-morbidity is very common within the geriatric population and increas-
es with age [179].

VISUAL ANALYSIS OF FACES WITH APPLICATION IN BIOMETRICS, FORENSICS AND HEALTH INFORMATICS
70
2.4.2. RELEVANT GERIATRIC CONDITIONS AND THREATS OF DETERIORATING HEALTH AND FUNCTIONAL LOSSES
This subsection gives a general brief description of common health conditions and
diseases of older adults, focusing on the scenarios of type 2 and 3. Also, we will
discuss the most relevant adversities for which monitoring solutions are needed.
We will start with discussing some key terms. With advancing age, older per-
sons undergo some ageing-related physical, mental and cognitive changes, which
increase their vulnerability [180]. The type 2 scenario of vulnerable older adults
may also include, but not only, persons at risk of Frailty. Frailty has been coined as
a state of increased vulnerability to poor resolution of homeostasis after a stressor
event, which increases the risk of adverse outcomes, including falls, delirium and
disability [181]. Frailty is a complex condition, which is not only defined by diseas-
es, but also by socio-economic status and social network [182], as well as with an
increased level of inflammatory markers [183]. Moreover, frailty is associated with
disability and mortality [180], [181], and identifying or detecting some of the fac-
tors leading to frailty would be an important scope of gerotechnology. As frailty is
not only complex but also very common in old age, older people with frailty would
benefit from being treated by specialist doctors in geriatric medicine or geriatrics,
which however are underrepresented in many countries despite the demographic
challenges of the future [184]. Geriatric medicine is “a branch of general medicine
concerned with the clinical, preventative, remedial and social aspects of illness in
old age. The challenges of frailty, complex comorbidity, different patterns of dis-
ease presentation, slower response to treatment and requirements for social sup-
port call for special medical skills.” [185]. Consequently, a geriatric patient may be
defined as an older person with comorbid conditions and co-occurring functional
limitations, in other words, a host of conditions. Further, the geriatric patient is
challenging for health care professionals by showing atypical symptoms of disease,
delaying diagnosis [186]–[188] and treatment, and consequently, at higher risk of
developing disability, loss of autonomy, and lower quality of life [189].
In order to keep the autonomy of an older person, the health hazards associated
to old age must be addressed from various angles, including the framework of gero-
technology, by applying appropriate monitoring technology, which is described in
more detail in section five.
In the reminder of this section we outline and describe the potentially dangerous
situations and health threats that occur most frequently in older and very often co-
morbid and frail patients in our scenarios. We start with discussing falls and injuries
in older geriatric patients, since these are among the most frequently reported health
problems and serious threats to independent living. Then we review a list of poten-
tial health threats, which are the most alarming in the older co-morbid population,
such as delirium, stroke, hypertension, and heart failure, among others. For each

CHAPTER 2. DISTRIBUTED COMPUTING AND MONITORING TECHNOLOGIES FOR OLDER PATIENTS
71
situation, we first define the problem. Then, we discuss its importance and refer to
the epidemiology of these occurrences. Finally, we discuss if these problems can be
detected, mentioning what data might be necessary to acquire.
For clarity, we are not focusing on diagnostic approaches for major chronic
conditions, such as dementia, but rather describing potential adverse events and
dangerous situations, which are of potential interest for automated detection.
2.4.2.1 Falls and Injuries
Across the main three scenario types, falls are very common and may lead not only
to injuries and adverse outcomes, such as hip fractures or brain concussions, but
also to a secondary effect of fear of falling, which in itself increases the risk of fall-
ing and reduced physical activity [190]. As a consequence, social interaction is
reduced, loneliness becomes frequent, and quality of life is diminished [191]. A
negative spiral may begin and may eventually lead to death, if left unrecognized.
Therefore, detection of falls is of paramount importance, not only for identifying
those who have fractures or intracranial hematomas, but also because many fallers
are simply unable to get up by themselves and are therefore at risk of lying on a
floor for several hours, even days, with the subsequent risk of dehydration, muscle
damage and consequent damage of the kidneys, or even death [192], [193]. Falls
could also be the outcome of a stroke or a cardiac arrest. To lower the risk of subse-
quent further health threatening complications fast identification and diagnosis is
required.
The adoption of a definition of a fall is an important requirement when study-
ing falls as many studies fail to specify an operational definition, leaving space for
interpretation to researchers. This usually results in many different interpreta-
tions of falls in the literature [193]. For example, older adults including their family
members tend to describe a fall as a loss of balance, while health care professionals
generally refer to an event which results in a person coming to rest inadvertently on
the ground or floor or other lower level leading to injuries and health problems
[194], [195].
The geometry of the human body in motion requires an individual to remain
balanced and upright under a variety of conditions. Balance is adversely affected by
intrinsic and extrinsic factors [97]. Intrinsic factors are, for example, side effects of
medication (e.g. orthostatic hypotension), medical conditions (e.g. stroke), ageing-
related physiological changes (e.g. declining muscle strength), and nutritional fac-
tors (e.g. vitamin D deficiency), while extrinsic factors are, for example, poor light-
ing conditions, loose carpets, slippery surfaces, stairs, etc. [196],[197]. A systematic
review and meta-analysis of risk factors for falls in older adults, who live at home,
can be found here [198]. Since in real-life scenarios a great majority of fall inci-

VISUAL ANALYSIS OF FACES WITH APPLICATION IN BIOMETRICS, FORENSICS AND HEALTH INFORMATICS
72
dents in older adults who live alone are not reported to healthcare providers [192],
automated detection of falls is of high practical research interest [199].
2.4.2.2 Delirium
Patients of all three scenarios are potentially at risk of developing delirium, but the
more frail and impaired an older person is, the higher is the risk [200]. Delirium is
described as an acute confusional state [200]. Delirium may develop as a reaction to
infection, dehydration, pain and painkillers, and has a within-hours fluctuating
course from cognitively intact to a state of confusion and even agitation (hyperac-
tive delirium), although silent (hypoactive) delirium also occurs [200]. Furthermore,
neurological disorders, such as dementia, significantly contribute to the risk of hav-
ing delirium. Being in an unfamiliar and busy place with many disturbances and
strange faces, e.g. a hospital emergency ward, does not enhance recovery in frail
older adults, nor does surgery [201]. Some diagnostic tools, such as the Confusion
Assessment Method (CAM) [202], are often used to recognize delirium, and help
distinguishing delirium from other forms of cognitive impairment. Treatment
should be targeted towards the underlying disease, not the symptoms of delirium,
and the delirium will gradually disappear as the initial condition is treated, normally
within hours to a few days. Apart from severe causes of delirium, e.g. severe infec-
tion, in which intravenous medication is imperative, delirium may not always need
to be treated in a hospital setting, but may be cared for in the patient’s own dwelling
if the necessary surveillance can be established. Discharging older persons at risk of
delirium to their own home with in-home monitoring soon after establishing a diag-
nosis and starting targeted treatment will reduce the risk of delirium or shorten the
time period of delirium [203].
2.4.2.3 Wandering and Leaving Home
In cases of cognitive impairment, both unrecognized and recognized, the risk of
accidents and getting lost while being outdoors (mostly referring to scenario type 2
and 3) can be rather high. A frequent symptom of cognitive impairment and demen-
tia is geographical disorientation, and in more advanced stages demented persons
may leave their dwelling to find their childhood home, a typical delusion of parents
being still alive. Such condition may lead to fatal situations, e.g. with wandering in
cold weather without proper clothing followed by hypothermia and subsequent
death. Therefore, it is important for the caregiver to know whether and when the
demented person is leaving the dwelling, and more importantly, when and where
wandering behaviour may have occurred [204], [205]. However, despite of several
attempts to define wandering behaviour, no commonly accepted definition of wan-
dering exists so far [206], assumingly because the underlying behaviour is very
complex and it may present differently depending on the person’s physical location
(e.g. person’s own home, hospital, care facility or a nursing home). One of the latest
and most cited definitions of wandering, proposed by Algase et al. [207], is: “a

CHAPTER 2. DISTRIBUTED COMPUTING AND MONITORING TECHNOLOGIES FOR OLDER PATIENTS
73
syndrome of dementia-related locomotion behaviour having a frequent, repetitive,
temporally disordered, and/or spatially disoriented nature that is manifested in
lapping, random, and/or pacing patterns, some of which are associated with elop-
ing, eloping attempts, or getting lost unless accompanied.” Detecting and analysing
leaving and returning home habits, as well as travel patterns of older people are
therefore of high importance.
2.4.2.4 Malnutrition
Malnutrition and weight loss are mostly relevant for scenarios 2 and 3, but also
valid for scenario type 1. Cognitive impairment, loneliness, and depression, as well
as poor appetite due to undiagnosed or diagnosed disease, or gastrointestinal side
effects of commonly used medicines may lower the appetite of older people and
lead to malnutrition and its typical symptom: weight loss. Apart from a geriatric
assessment of the etiology of weight loss, securing adequate intake of energy and
protein is of paramount importance to revert the otherwise resulting development of
sarcopenia (defined previously on page Error! Bookmark not defined.), and sub-
sequent functional loss. Surveillance of adequate food intake, liquids and medicine,
as well as automated monitoring of body weight would help to identify older per-
sons at risk of adverse outcomes, and thus lead to the initiation of preventive ac-
tions. Sarcopenic older persons are at high risk of severe disability, falls, fractures
and institutionalisation [208]. It has in recent years been acknowledged that sarco-
penia may also be present in obese older adults, so-called ‘sarcopenic obesity’,
caused by excess intake of energy of poor quality, physical inactivity, and hormonal
alterations [209]. Such persons have the same adverse outcomes as low weight
sarcopenic persons, and may too benefit from surveillance of adequate food intake.
2.4.2.5 Sleeping Disorders
Another potential problem, again mostly relevant for scenarios 2 and 3 but also
valid for type 1, is disturbances in sleep. In fact, the majority of the geriatric pa-
tients experience significant alteration of their sleep patterns and thus overall bad
quality of sleep. Changes in sleep pattern are considered to be normal changes with
advancing age, with a greater percentage of the night spent in the lighter sleep stag-
es [210],[211], but other causes exist too, and can be divided into intrinsic condi-
tions of an individual patient and extrinsic factors related to the environment, where
the patient is sleeping. Intrinsic conditions may include pain (e.g. from arthritis),
nocturia, medication effects, depression, restless legs syndrome, obstructive sleep
apnoea (long pauses in breathing associated with snoring), and paroxysmal noctur-
nal dyspnea (sudden pauses in breathing, experienced during exacerbations of con-
gestive heart failure) [212]. Extrinsic factors may include acoustic noise, lightning,
vibration or physical movement, fluctuations of environmental temperature, draught
at home, dust, and poor air condition, among others. Thus, monitoring sleep and

VISUAL ANALYSIS OF FACES WITH APPLICATION IN BIOMETRICS, FORENSICS AND HEALTH INFORMATICS
74
detecting possible causes of sleep disturbances are of high importance for revealing
causes of disturbed sleep.
2.4.2.6 Shortness of Breath
With advancing age certain physical activities, such as walking upstairs, may cause
dyspnoea in older adults, who in turn would adapt their physical activities to less
challenging activity levels, or even inactivity. Ageing is associated to ageing-related
changes in the respiratory organs leading to lower oxygen uptake from the air to the
blood, lower lung volume, and less lung compliance, all leading to shortness of
breath when extra respiratory capacity is needed. Diseases such as osteoporotic
compression or vertebral deformities of the thoracic vertebras may also affect nor-
mal lung function by diminishing the thorax volume [213]. Environmental factors
such as smoking and previous employment in jobs associated with dust may rein-
force these eventually pathologic changes.
A common medical breathing condition is chronic obstructive pulmonary dis-
eases (abbreviated as COPD), which shares many symptoms with pulmonary em-
physema, chronic bronchitis, and asthma. Co-occurring diseases such as chronic
heart failure, anemia, and cancers may worsen breathing, as well as acute pneumo-
nia. Also snoring with apnoea is considered as a breathing problem, which may lead
to lower oxygen intake during sleep and subsequent cognitive impairment [214].
Other reasons of breathing problems may include smoking habits, poor air quality
in the living environment and non-pulmonary infections. Due to the vital im-
portance of pulmonary function, many studies aim at detecting, monitoring, and
preventing respiratory problems in older adults at their living environments [215]–
[218].
2.4.2.7 Hygiene and Infections
Poor hygiene, and not the least in combination with a weaker immune system asso-
ciated to ageing, may increase the risk of contracting infections, often leading to
fever (elevated body temperature). Oral hygiene and oral infections, such as dental
caries and oral fungal infections are important to care about, especially for those
individuals who use artificial dentures [219], as it may lead to malnutrition and
weight loss, and may furthermore cause systemic infections.
Urinary tract infections (UTIs), as another example, can be a serious health
threat to older people [23]. UTIs are common in older adults, especially in women
[23]. Many cases are self-limiting in healthy individuals, but in vulnerable and dis-
eased older persons a UTI, if untreated, may spread to the blood stream causing
systemic infection, kidney damage, delirium, and even death. Common symptoms
of UTIs include urgency, frequent and painful urination, and incontinence, but may
be absent in older adults.
CHAPTER 2. DISTRIBUTED COMPUTING AND MONITORING TECHNOLOGIES FOR OLDER PATIENTS
75
An infection of the lungs (pneumonia) [220], may lead to multiple symptoms,
such as cough, fever, shortness of breath, and weakness. The pneumonia may stress
the heart and lead to acute heart failure and atrial fibrillation, which further worsens
the situation and demands immediate medical attention.
2.4.2.8 Problems Related to Physical Environment
Finding potential threats in older adult’s living environment is relevant for all three
scenarios. However, not many studies investigating health conditions of older adults
at home were able to thoroughly assess the environmental threats of the older per-
sons’ dwellings. For example, levels of environmental noise, lighting, vibrations,
ambient temperature, humidity, climate and air condition, and other matters, such as
availability of household facilities, all can significantly influence the quality of life
of an older individual, especially when the individual suffers from comorbid chron-
ic heart and/or lung conditions. Other environmental hazards may include obstacles
in pathways, slippery surfaces, tripping hazards, loose rugs, unsafe or unstable fur-
niture, etc., which may contribute to injuries or falls [221], [222]. Indeed, the most
frequently cited causes and risk-factors of falls are ‘accidental’ and ‘environment-
related’, accounting for approximately 30–50% of all older adult falls [223]. How-
ever, many falls attributed to accidents stem from the interaction between identifia-
ble environmental hazards and increased individual susceptibility to such hazards
from accumulated effects of age and diseases [223].
2.4.2.9 Underlying Medical Conditions and Multimorbidity
The concept of multimorbidity has been explained earlier and refers to co-
occurrence of two or more chronic diseases or conditions within the same individu-
al [178], [179], [224]. Multimorbidity, associated polypharmacy (i.e. using 5 or
more different medications per day), and adverse side effects of medication increase
with advancing age, resulting in that more than half of older adults suffer from three
or more chronic diseases simultaneously [225]. The most frequent comorbid condi-
tions in older people are [226]: hypertension, coronary artery disease, diabetes
mellitus, history of stroke, chronic obstructive pulmonary disease, and cancer. Early
recognition of acute illness and diagnosis, followed by timely and adequate treat-
ment is not only the key to prevent severe deterioration in health, but also the key to
reducing the risk of functional impairments and mortality in geriatric patients. The
Comprehensive Geriatric Assessment (CGA) is a tool that has proven effective in
terms of reducing mortality and institutionalisation [227]. The same principle of
comprehensive assessment by monitoring medical parameters and features in older
persons at risk, e.g. multimorbid geriatric patients, would be valuable for the indi-
vidual as well as to the society. However, it requires an understanding of the multi-
disciplinary nature of health and health deterioration in older adults, and therefore, a
broad range of medically sensitive parameters, both objective and subjective, that
can detect and measure such deterioration, needs to be considered. Novel automated

VISUAL ANALYSIS OF FACES WITH APPLICATION IN BIOMETRICS, FORENSICS AND HEALTH INFORMATICS
76
monitoring technology yet needs to be identified or developed, which will create
new perspectives on using in-home monitoring.
2.4.3. SUMMARY OF THE NEEDS
A list of conditions and activities that may be monitored is listed below. The list is
far from being exhaustive, but addresses the most common needs given by the indi-
vidual’s living style, culture, and acceptance of remote surveillance and monitoring
in private homes. The future may bring new conditions, e.g. economic challenges,
changed family structures and intergenerational support and care, improved health
literacy as well as IT-literacy of caregivers and the target population itself, which
may identify new ways of monitoring older adults in their dwellings.
The focus is on the following topics:
Gait and balance monitoring
Detecting falls
Detecting problems related to physical environment
Detecting wandering
Detecting delirium
Recognizing abnormal activity, such as, absence of meal preparation or dis-
turbed day-night cycle
Monitoring physiological vital status parameters, including body weight
Monitoring food intake
Detecting adherence to medication
In the next section, we will summarize the available monitoring technologies,
which directly or indirectly address and attempt to contribute to the aforementioned
topics. Most of these monitoring technologies share common ground as organized
in the next section.
2.5. MONITORING TECHNOLOGY
This section aims at giving an insight into a variety of available monitoring tech-
nologies and techniques, which aim to provide solutions to the issues listed in the
previous section. First, we start with discussing possible data collection approaches,
by revealing choices of available sensors and underlying constrains. Second, we
provide a summary of sensors used for data acquisition in regard to needed medical
applications, revealing what relevant parameters can be derived from those sensor
measurements. We then summarize what common data processing and analysis
techniques are used for interpreting this data, with a special focus on machine learn-
ing approaches. Third, we derive important requirements and underlying challenges
for the involved machine learning strategies, and discuss possible implications for

CHAPTER 2. DISTRIBUTED COMPUTING AND MONITORING TECHNOLOGIES FOR OLDER PATIENTS
77
applying the different monitoring approaches. Finally, we refer to a number of es-
tablished standards, which are needed to be complied with, when developing and
implementing home monitoring systems for older adults.
Most of the smart-home projects, which were briefly introduced in section 2.2.3,
significantly contribute to the research and development of automated monitoring
technologies related to the topics listed in section 2.4.3. Many of these projects
proposed holistic approaches, which aim at solving multiple problems simultane-
ously within one smart-home environment. However, these topics are highly ab-
stracted and thus many of them are treated differently, depending on different sce-
nario constraints, on what sensors are applied for data acquisition, and on what
information is available a-priory. For example, recognition of abnormal activity
highly depends on the monitored subset of ADLs, and furthermore the abnormality
may be defined differently. For instance, abnormality may mean a certain deviation
from the learned baseline of “normal” everyday activities, or it can be strictly pre-
defined based on prior expert knowledge, e.g. a known sequence of activities that is
considered to be abnormal and health threatening.
The most common monitoring approach for recognizing health problems at
home is motion capture (e.g. for classifying and assessing ADL). Recordings are
usually examined manually by health care professionals, such as nursing staff,
physiotherapists, and occupational therapists, which is very time consuming [228].
In previous studies about automated monitoring, movement is usually captured
using inertial sensors [229], computer vision [230]–[232], electromyography
(EMG) [233], radio-frequency (RF) sensors, or infra-red (IR) sensors [234]. For
detecting different health-threats, video monitoring and computer vision has been
widely presented and discussed in the literature, but the main two purposes of these
systems were surveillance and communication applications. Video (incl. audio)
transmission is usually made in real-time over an ordinary telephone line [38] or
Internet [235]. The video can be either viewed directly on a tablet or a monitor by a
nurse or doctor, or a video processing system is used to automatically interpret the
video data and present the relevant (alarming) information to the medical staff [236]
only when some abnormality is detected. The main problem with these video-audio
solutions is the ethical issues, i.e., the majority of older adult users are concerned
about being monitored by video, as discovered by usability studies, e.g. in the EU-
funded Seventh Framework Programme (FP7) Project Confidence [237]. Another
common problem is insufficient bandwidth or the quality of Internet connectivity
and poor mobile network coverage in some geographic areas such as rural areas.
Therefore, it may be impossible to establish real-time video link with sufficiently
high resolution of e.g. complicated wounds, which may need to be treated by a
visiting nurse, perhaps guided by a surgeon watching the video in his or her hospital
office. Nevertheless, as a communication tool to allow older adults communicating
with medical staff on their own request, video-audio technology is already com-
monly applied [236], [238], [239], when connectivity allows it.
VISUAL ANALYSIS OF FACES WITH APPLICATION IN BIOMETRICS, FORENSICS AND HEALTH INFORMATICS
78
2.5.1. SENSING AND DATA ACQUISITION
There are numerous ways of collecting data about the older persons’ health condi-
tion, which can be accomplished by asking specific questions and registering an-
swers (considered to be a subjective approach) or by using various sensors (an ob-
jective approach). In this chapter we are mainly interested in collecting objective
data, which can be acquired automatically, by using sensors and data capturing
devices. However, very often both subjective and objective approaches are com-
bined, to provide as full information as possible.
2.5.1.1 Types of Sensors and Data Capturing Devices
The different types of sensors used in the field of patient monitoring and the pur-
pose of their employment in regard to the topics listed in section four are shown in
Table 2-3. The most common purpose of employing these sensors has been for fall
detection applications. Fall detectors [95], [240], in most cases, measure motions
and accelerations of the person using tags worn around the waist or the upper part
of the chest (by using inertial sensors: accelerometers, gyroscopes, and/or tilt sen-
sors). In general, if the accelerations exceed a threshold during a time period, an
alarm is raised and sent to a community alarm service. By defining an appropriate
threshold it is possible to distinguish between the accelerations during falls and the
accelerations produced during the normal ADL. However, threshold-based algo-
rithms tend to produce false alarms, for instance, standing up or sitting down too
quickly often results in crossing a threshold and an erroneous classification of a fall
[228]. Several machine learning approaches were also proposed for detection and
identification of falls [241], [242], [91], [243], [92], which help to minimize those
false alarms by automatically adapting to specifics of the monitored person. The use
of indoor localization sensors (both IR- and RF-based) have also been reported
[241], [244], which are intended for localizing persons in 3D space and analysing
their movements, useful for detecting accidental falls or abnormal activity.
Another common technology for fall and/or accident detection is emergency
alarm systems, which usually include a device with an alarm button [60], [245], e.g.
embedded in a mobile phone, pendant, chainlet, or a wrist-band. These devices can
be used to alert and communicate with a responsible care center. However, such
devices are efficient only if the person consciously recognizes an emergency and is
physically and mentally capable to press the alarm button. Also static alarm buttons
exist, which are often placed in the toilet or bathroom, as required by the BS 8300
and ISO 21542 standards [246], [247].
The sensors reported in the literature included (but were not limited to) infrared
(IR) and near-infrared (NIRS) sensors [254], [322], [326]–[330], video [49], [248],
[275], [331] and thermal cameras [332], [333], bioelectrical sensors (used in ECG,
EMG, EEG) [174], [306], [334], [335], [294], ultrasonic sensors and microphones

CHAPTER 2. DISTRIBUTED COMPUTING AND MONITORING TECHNOLOGIES FOR OLDER PATIENTS
79
[336]–[340], radio-frequency (RF) transceivers, piezoresistive and piezoelectric
sensors [341]–[343], inertial sensors (such as accelerometers, gyroscopes, and tilt
sensors) [90], [91], [170], [240], [287]–[291], [294], [344], electrochemical sensors
(such as smoke detectors, CO2 meters, blood glucose and hemoglobin testers)
[345]–[349], as well as mechanical measurement devices (such as weighing scales).
Table 2-3 Summary of sensors used for data acquisition in regard to needed medical appli-cations
Sensor type /
Sensing modali-
ty
Data of interest Purpose of application* References
Video cameras
Pose estimation, location,
movement speed, size and
shape changes, custom
defined visual features,
temporal semantic data,
facial skin colour, head
motion, face alignment
positions
Gait and balance monitoring, Fall
detection, Monitoring the activity
of daily living, Abnormal activity
recognition, Activity detection in
first person camera view, and De-
tection of activity of taking medi-
cine, Measurement of physiological
parameters, and Tracking medical
conditions, Elopement detection
[173], [248]–
[276]
Microphones
Heart sound, speech,
coughing sounds, snoring
sounds, Stethoscope signal,
environmental noise, etc.
Physiological vital status parame-
ters monitoring, Environmental
threat detection
[277]–[283]
Infrared (IR)
sensors (incl.
motion detectors
and depth cam-
eras)
Indoors location, move-
ment
Fall detection, Abnormal activity
recognition,
Wandering detection
[254], [267],
[284], [285]
Accelerometers Body movement
Fall detection, Abnormal activity
recognition, Wandering detection,
Gait and Balance monitoring, Food
intake monitoring
[240], [286]–
[293], [170],
[294]
Gyroscopes Body movement, orienta-
tion
Fall detection, abnormal activity
recognition, gait and balance moni-
toring
[90], [91],
[286], [295],
[296]

VISUAL ANALYSIS OF FACES WITH APPLICATION IN BIOMETRICS, FORENSICS AND HEALTH INFORMATICS
80
Sensor type /
Sensing modali-
ty
Data of interest Purpose of application* References
GPS trackers Outdoor (and limited out-
door) location, Wandering detection [159], [297]
Pulse Oximeter /
Near-infrared
(cuffless)
SpO2, blood pressure, heart
rate
Physiological vital status parame-
ters monitoring
[272], [277],
[298]
Blood pressure
monitor (cuffed)
Systolic and diastolic blood
pressures and heart rate
Physiological vital status parame-
ters monitoring
[117], [277],
[298]–[304]
Impedance
pneumography
(IP) sensor
Respiration rate Physiological vital status parame-
ters monitoring [305]
ECG device
ECG signal; Heart rate;
including: RR-interval;
beginning, peak and end of
the QRS-complex; the P-
and T-waves; the ST-
segment, etc.
Physiological vital status parame-
ters monitoring, arrhythmia detec-
tion, delirium detection
[68], [174],
[277], [294],
[304], [306]
EMG device EMG signal and related
parameters
Abnormal activity (incl. inactivity)
detection
[294], [304],
[307]
EEG device EEG signal, blood glucose
levels
Physiological vital status parame-
ters monitoring, Detection of vari-
ous health-threats, such as Hypo-
glycemia, Epilepsy, Sleep apnea,
Dementia and other uses
[59], [107],
[307]–[314]
Weighting scale Body weight
Physiological vital status parame-
ters monitoring, Food intake moni-
toring
[277]
Continued from previous page….
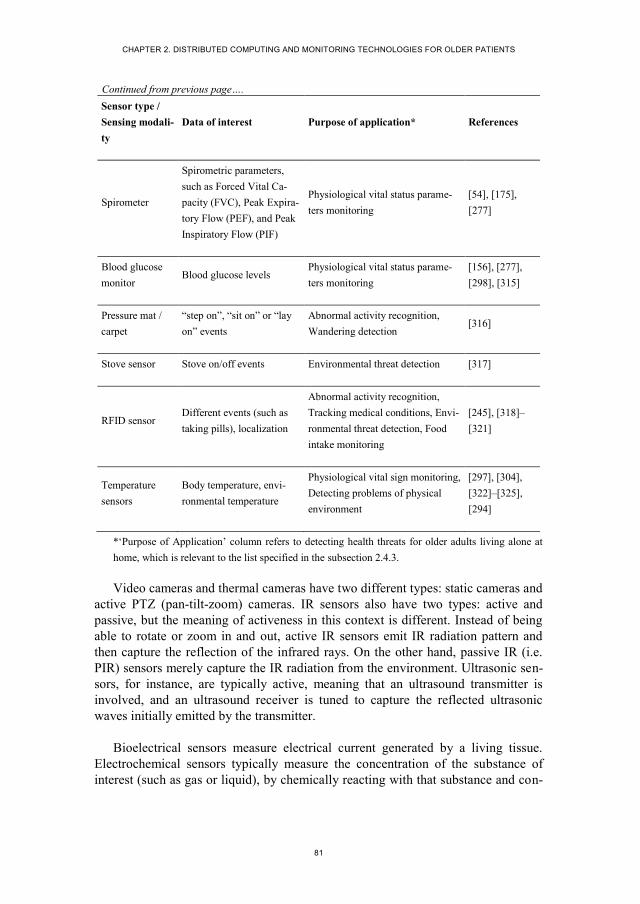
CHAPTER 2. DISTRIBUTED COMPUTING AND MONITORING TECHNOLOGIES FOR OLDER PATIENTS
81
Sensor type /
Sensing modali-
ty
Data of interest Purpose of application* References
Spirometer
Spirometric parameters,
such as Forced Vital Ca-
pacity (FVC), Peak Expira-
tory Flow (PEF), and Peak
Inspiratory Flow (PIF)
Physiological vital status parame-
ters monitoring
[54], [175],
[277]
Blood glucose
monitor Blood glucose levels
Physiological vital status parame-
ters monitoring
[156], [277],
[298], [315]
Pressure mat /
carpet
“step on”, “sit on” or “lay
on” events
Abnormal activity recognition,
Wandering detection [316]
Stove sensor Stove on/off events Environmental threat detection [317]
RFID sensor Different events (such as
taking pills), localization
Abnormal activity recognition,
Tracking medical conditions, Envi-
ronmental threat detection, Food
intake monitoring
[245], [318]–
[321]
Temperature
sensors
Body temperature, envi-
ronmental temperature
Physiological vital sign monitoring,
Detecting problems of physical
environment
[297], [304],
[322]–[325],
[294]
*‘Purpose of Application’ column refers to detecting health threats for older adults living alone at
home, which is relevant to the list specified in the subsection 2.4.3.
Video cameras and thermal cameras have two different types: static cameras and
active PTZ (pan-tilt-zoom) cameras. IR sensors also have two types: active and
passive, but the meaning of activeness in this context is different. Instead of being
able to rotate or zoom in and out, active IR sensors emit IR radiation pattern and
then capture the reflection of the infrared rays. On the other hand, passive IR (i.e.
PIR) sensors merely capture the IR radiation from the environment. Ultrasonic sen-
sors, for instance, are typically active, meaning that an ultrasound transmitter is
involved, and an ultrasound receiver is tuned to capture the reflected ultrasonic
waves initially emitted by the transmitter.
Bioelectrical sensors measure electrical current generated by a living tissue.
Electrochemical sensors typically measure the concentration of the substance of
interest (such as gas or liquid), by chemically reacting with that substance and con-
Continued from previous page….
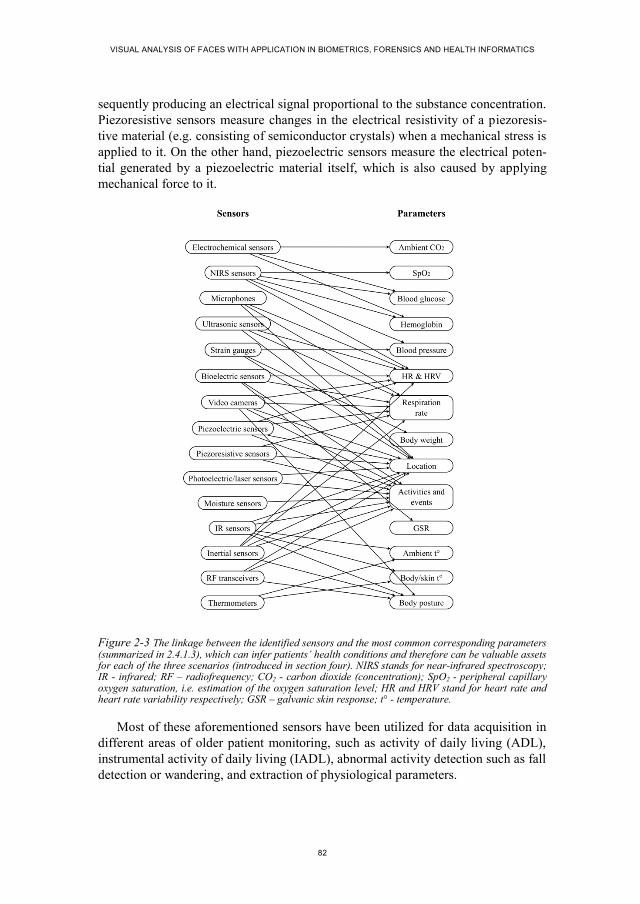
VISUAL ANALYSIS OF FACES WITH APPLICATION IN BIOMETRICS, FORENSICS AND HEALTH INFORMATICS
82
sequently producing an electrical signal proportional to the substance concentration.
Piezoresistive sensors measure changes in the electrical resistivity of a piezoresis-
tive material (e.g. consisting of semiconductor crystals) when a mechanical stress is
applied to it. On the other hand, piezoelectric sensors measure the electrical poten-
tial generated by a piezoelectric material itself, which is also caused by applying
mechanical force to it.
Figure 2-3 The linkage between the identified sensors and the most common corresponding parameters (summarized in 2.4.1.3), which can infer patients’ health conditions and therefore can be valuable assets for each of the three scenarios (introduced in section four). NIRS stands for near-infrared spectroscopy; IR - infrared; RF – radiofrequency; CO2 - carbon dioxide (concentration); SpO2 - peripheral capillary oxygen saturation, i.e. estimation of the oxygen saturation level; HR and HRV stand for heart rate and heart rate variability respectively; GSR – galvanic skin response; t° - temperature.
Most of these aforementioned sensors have been utilized for data acquisition in
different areas of older patient monitoring, such as activity of daily living (ADL),
instrumental activity of daily living (IADL), abnormal activity detection such as fall
detection or wandering, and extraction of physiological parameters.

CHAPTER 2. DISTRIBUTED COMPUTING AND MONITORING TECHNOLOGIES FOR OLDER PATIENTS
83
Hence, the general goal of using the aforementioned sensors is to measure rele-
vant physical properties for estimating specific medically important parameters
(often called as biosignals or biomarkers), which are summarized in section 2.5.1.3,
and which allow to further infer the patients’ health conditions [350] followed by
manual or automatic analysis.
2.5.1.2 Sensor Location and Placement
Technically, there are infinite location options for placing the variety of sensors
intended for in-home monitoring. The choice of these sensors and their placement,
however, highly depends on the needs seen by patients and medical staff, on physi-
cal and mental conditions of a person, who needs to be monitored, and on the vari-
ous scenario constrains, including existing infrastructure options, physical layout of
the dwelling, etc. In general, these sensors can be divided in the following groups in
terms of their placement:
i. On-body sensors, such as skin-patches and sensors worn by an individual as
an accessory or embedded in the outfit (part of clothing), like:
a. Electronic skin patches or artificial skin, as exemplified in [285],
[351], [352], that can be glued to the skin on a body area of interest,
and which may include various sensors for measuring various phys-
iological parameters, such as (but not limited to) body temperature,
heart rate, EMG parameters, pulse oximetry for monitoring the ox-
ygen saturation (SpO2), as well as accelerometers, moisture sensors,
and possibly others.
b. Wrist-watches, wrist-bands and arm-bands [41], [322], [353]–[356]
or rings [322], [357], measuring heart rate, body temperature, near-
body ambient temperature, galvanic skin response (GSR), and
EMG data. Similarly, these sensors can also be incorporated into
jewellery, such as necklaces, brooches, pins, earrings, belt buckles,
etc.
c. Clothes, belts and shoes for monitoring gait, motion, vital signs and
detection of health emergencies [343], [358]. The most common are
chest-worn belts and “smart textile” shirts for measuring vital signs
and motion [305], [341], [343], [359], [360]. Other examples may
include gloves for recording finger and wrist flexion during ADLs
and/or vital signs [40], [361], a waistband with textile sensors for
measuring acidity (pH levels) of sweat and sweat-rate [349], or
moisture sensitive diapers [362].
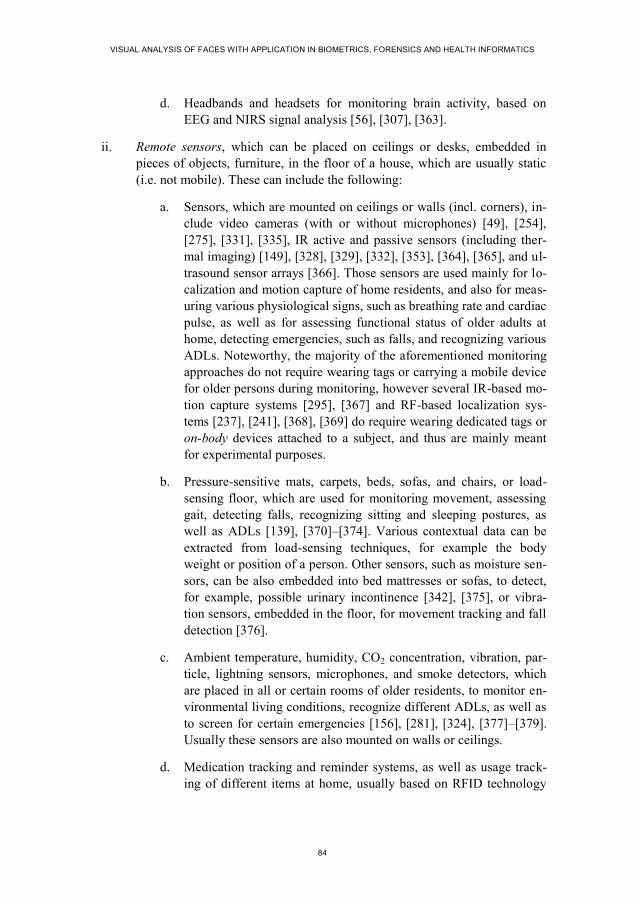
VISUAL ANALYSIS OF FACES WITH APPLICATION IN BIOMETRICS, FORENSICS AND HEALTH INFORMATICS
84
d. Headbands and headsets for monitoring brain activity, based on
EEG and NIRS signal analysis [56], [307], [363].
ii. Remote sensors, which can be placed on ceilings or desks, embedded in
pieces of objects, furniture, in the floor of a house, which are usually static
(i.e. not mobile). These can include the following:
a. Sensors, which are mounted on ceilings or walls (incl. corners), in-
clude video cameras (with or without microphones) [49], [254],
[275], [331], [335], IR active and passive sensors (including ther-
mal imaging) [149], [328], [329], [332], [353], [364], [365], and ul-
trasound sensor arrays [366]. Those sensors are used mainly for lo-
calization and motion capture of home residents, and also for meas-
uring various physiological signs, such as breathing rate and cardiac
pulse, as well as for assessing functional status of older adults at
home, detecting emergencies, such as falls, and recognizing various
ADLs. Noteworthy, the majority of the aforementioned monitoring
approaches do not require wearing tags or carrying a mobile device
for older persons during monitoring, however several IR-based mo-
tion capture systems [295], [367] and RF-based localization sys-
tems [237], [241], [368], [369] do require wearing dedicated tags or
on-body devices attached to a subject, and thus are mainly meant
for experimental purposes.
b. Pressure-sensitive mats, carpets, beds, sofas, and chairs, or load-
sensing floor, which are used for monitoring movement, assessing
gait, detecting falls, recognizing sitting and sleeping postures, as
well as ADLs [139], [370]–[374]. Various contextual data can be
extracted from load-sensing techniques, for example the body
weight or position of a person. Other sensors, such as moisture sen-
sors, can be also embedded into bed mattresses or sofas, to detect,
for example, possible urinary incontinence [342], [375], or vibra-
tion sensors, embedded in the floor, for movement tracking and fall
detection [376].
c. Ambient temperature, humidity, CO2 concentration, vibration, par-
ticle, lightning sensors, microphones, and smoke detectors, which
are placed in all or certain rooms of older residents, to monitor en-
vironmental living conditions, recognize different ADLs, as well as
to screen for certain emergencies [156], [281], [324], [377]–[379].
Usually these sensors are also mounted on walls or ceilings.
d. Medication tracking and reminder systems, as well as usage track-
ing of different items at home, usually based on RFID technology

CHAPTER 2. DISTRIBUTED COMPUTING AND MONITORING TECHNOLOGIES FOR OLDER PATIENTS
85
[264], [320], [321]. These systems could detect how many times an
older adult uses his or her preferred items, and thus providing a
good measure of the person’s ADLs.
iii. Implantable (In-vivo) devices, like:
a. Implantable cardiac monitors, i.e. ECG loop recorders [380];
b. Smart pills, e.g. for gastric pressure and pH level measurement
[381],
c. Continuous glucose-monitoring biosensors, e.g. implanted into the
inner ear of subjects and detecting hypoglycemia from EEG signals
[107], [313],
d. Wireless capsule for endoscopy [382].
iv. Portable (mobile) devices, like:
a. Smartphones and tablets [40], [90], [271], [288], [291], [344],
[383]–[385],
b. Multimedia devices or systems [135], [156], [386],
c. Robots equipped with multimodal sensors [39], [135], [157], [167],
[168], [335],
d. Portable video cameras and microphones [236], [387].
For a number of practical and financial reasons, the devices mentioned in the
fourth group of the above list are often used as devices for the first and second
group. Furthermore, smartphones and tablets typically provide wider range of func-
tionality, including transmission, storage, processing, accessing of the data and
relevant information, as well as providing functionality for human-computer inter-
action.
Systematic evaluation is needed in order to quantify which location and place-
ment is the most suitable for the sensors. For instance, Kaushit et al. [294] evaluat-
ed the characteristics of a pyro-electric infrared (PIR) detector to identify any sec-
tion of a room, where the detector will fail to respond, and assessed the number of
detectors required to identify reliably the movements of the occupant. They showed
the spatial characteristics of PIR detector and assessed the minimum number of
detectors required to sense even small movements (e.g. reading a book) in its de-
fined field of view in order to monitor activities of older people living alone at
home. They suggested combining several detectors (four per room - one at each
corner of the room) in order to gather reliable data for all types of movements to

VISUAL ANALYSIS OF FACES WITH APPLICATION IN BIOMETRICS, FORENSICS AND HEALTH INFORMATICS
86
assess the occupancy patterns of the room, because a single detector was not capa-
ble of providing information about the level of activity performed by the occupant.
One of the most promising patient monitoring technologies is based on health
monitors that are body-worn (e.g. on the wrist). Most commonly, they are intended
to continuously monitor the pulse, skin temperature, movement [115], [388]–[391]
and other data of interest. Usually, at the beginning of the systems usage, the pat-
tern for the user is learned. For this purpose, machine-learning approaches are used.
Afterwards, if any deviations are detected, alarms are typically sent to the emergen-
cy center. Such a system can detect various health-threats, for example, collapses,
faints, blackouts, etc. The drawbacks of these systems are poor tracking accuracy
[237] and that people are not likely to carry the body-worn devices at all times,
even if the transceiver is built into a convenient form, such as a wrist watch, a smart
phone or a bracelet.
Finally, the common problem with most of the currently proposed health moni-
toring systems is that patients are often compelled to wear or even carry-on uncom-
fortable and/or cumbersome equipment, to be within certain smart home rooms or
beds fitted with monitoring devices, which clearly restrict older persons’ activity
[392]. The challenge of building monitoring system, which can automatically moni-
tor older patients at home and detect dangerous conditions and situations, remains
unsolved. In order to solve the above-mentioned problems, it is strategically im-
portant to prioritize the most unobtrusive technological solutions with a trade-off of
capturing enough clinically useful data.
2.5.1.3 Summary of Parameters
All sensible parameters can be categorized into the five main classes, which repre-
sent the nature of the target measures:
i. Physiological parameters, as for example in [15], [30], [116], [393]–
[395],[396], which represent intrinsic functioning of human body (often
called as vital signs) such as pulse, blood pressure, respiration rate, tempera-
ture, lung vital capacity, blood oxygenation, blood glucose levels, hemoglo-
bin, cholesterol, blood lactate and others;
ii. Behavioral parameters, as for example in [16], [90], [95], [230], [393],
[394], [397]–[400], which can be observed extrinsically (e.g. represented as
ADL, cognitive tasks, social interaction, etc.);
iii. Parameters describing sensory, cognitive and functional abilities of a person
[401]–[403], e.g. strength and balance, that can be measured, for instance,
through a ‘hand-grip’ test and a balance tests respectively, or other physical

CHAPTER 2. DISTRIBUTED COMPUTING AND MONITORING TECHNOLOGIES FOR OLDER PATIENTS
87
and cognitive parameters, which can be assessed by preforming specific
ADLs;
iv. Anthropometric parameters [170], [404] (such as weight and height, body
circumferences, body-mass index, and knee-heel length), which usually stay
constant and are necessary for statistical comparison between diversity of
older adults, and in some cases, detecting a body weight loss or gain may be
of interest;
v. Environmental parameters [150], [156], [215], [375], [405]–[407] (such as
ambient temperature, humidity, pressure, lighting, environmental noise, air
quality, etc., which are important factors for health condition);
In general, human health state can be defined by a variety of physiological and
behavioral parameters, which usually are self-interdependent. However, not all of
them are equally important and not all of those parameters can be easily and pre-
cisely measured, requiring different medical equipment and measuring approaches
(e.g. invasive, non-invasive, and distance monitoring).
From the reviewed works, it is evident that only few studies covered two or
more aspects simultaneously, and no work was found where all the five sensor cat-
egories were considered. In practice, there are obvious overlaps between what sen-
sory technology is used, what biosignals are measured, and how and where they are
measured. By applying sensor fusion techniques, it is possible to:
i. Make the sensors work in equilibrium (i.e. synchronized in time and
cross-dependent, when one or more measured parameters can rectify
another parameter of interest being monitored, as described by the het-
erogeneous approach [103])
ii. Optimally select the hardware, with the aim of achieving maximally ac-
curate, complete and consistent patient records.
In the related works, optimality of sensor selection is generally assessed by the
following measures that might play a role in different scenarios:
i. Validity and reliability of the sensor measurements. Validity refers to
the degree to which a measurement method or instrument actually
measures the concept in question and not some other concept. It often
refers to precision and accuracy of a monitored parameter measured by
a sensor or estimated by a sensor system. Reliability refers to the degree
to which a sensor or a sensor system produces stable and consistent data
over time. For example, it should be stable to noise and robust to pa-
tient’s activity and location [389].
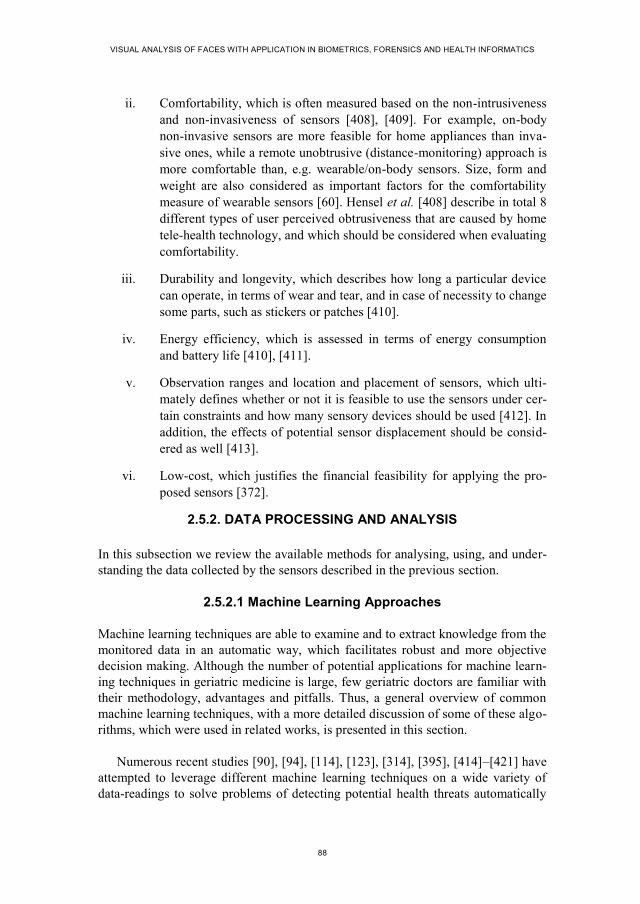
VISUAL ANALYSIS OF FACES WITH APPLICATION IN BIOMETRICS, FORENSICS AND HEALTH INFORMATICS
88
ii. Comfortability, which is often measured based on the non-intrusiveness
and non-invasiveness of sensors [408], [409]. For example, on-body
non-invasive sensors are more feasible for home appliances than inva-
sive ones, while a remote unobtrusive (distance-monitoring) approach is
more comfortable than, e.g. wearable/on-body sensors. Size, form and
weight are also considered as important factors for the comfortability
measure of wearable sensors [60]. Hensel et al. [408] describe in total 8
different types of user perceived obtrusiveness that are caused by home
tele-health technology, and which should be considered when evaluating
comfortability.
iii. Durability and longevity, which describes how long a particular device
can operate, in terms of wear and tear, and in case of necessity to change
some parts, such as stickers or patches [410].
iv. Energy efficiency, which is assessed in terms of energy consumption
and battery life [410], [411].
v. Observation ranges and location and placement of sensors, which ulti-
mately defines whether or not it is feasible to use the sensors under cer-
tain constraints and how many sensory devices should be used [412]. In
addition, the effects of potential sensor displacement should be consid-
ered as well [413].
vi. Low-cost, which justifies the financial feasibility for applying the pro-
posed sensors [372].
2.5.2. DATA PROCESSING AND ANALYSIS
In this subsection we review the available methods for analysing, using, and under-
standing the data collected by the sensors described in the previous section.
2.5.2.1 Machine Learning Approaches
Machine learning techniques are able to examine and to extract knowledge from the
monitored data in an automatic way, which facilitates robust and more objective
decision making. Although the number of potential applications for machine learn-
ing techniques in geriatric medicine is large, few geriatric doctors are familiar with
their methodology, advantages and pitfalls. Thus, a general overview of common
machine learning techniques, with a more detailed discussion of some of these algo-
rithms, which were used in related works, is presented in this section.
Numerous recent studies [90], [94], [114], [123], [314], [395], [414]–[421] have
attempted to leverage different machine learning techniques on a wide variety of
data-readings to solve problems of detecting potential health threats automatically

CHAPTER 2. DISTRIBUTED COMPUTING AND MONITORING TECHNOLOGIES FOR OLDER PATIENTS
89
and to better understand health conditions of older adults at their living environ-
ment. Most of the discussed problems are concerned with classification tasks, as for
example, where the desired result is a categorical variable, i.e. a class label ([91],
[94], [134], [248], [250], [252], [295], [419]–[428]). The most notable examples of
classification tasks are fall detection [91], [248], [250], [252], [419], [422], [424],
[427], [428] and abnormal behaviour or event detection [94], [420], [423] (which
can be caused, for instance, by falls or health deterioration) in older adults. Few
other works are solving regression problems, like in [429]–[431], where the goal is
to estimate a continuous variable. Regression examples include predicting function-
al ability [429], estimating mortality risk in geriatric patients [430], or continuously
estimating a vital-sign, such as blood-pressure or blood-glucose concentration
[298], based on other non-invasively measurable parameters. It is important to note,
that regression is often used as an intermediate step before final classification, as for
example in [424], [432]–[435], where a continuous regression curve is truncated
into two distinct classes or more (most commonly ordinal) categories. It is worthy
to mention that sometimes a regression curve is also used to estimate a boundary
that explicitly separates two classes, but there are no relevant studies yet, where it is
mentioned in our context. For instance, logistic regression can be often used as a
classifier.
There are numerous works, which report treating the posed problems in a super-
vised fashion, when a dataset with empirical data including correct classification or
regression results is provided as a “learning material” for training and testing ma-
chine learning techniques, as for example in studies dealing with recognizing ADLs
[85], [255], [258], [259], [263], [436], [437], where datasets with clear labels for
each activity annotated by a human expert were used. Most of these studies focus
purely on the detection of “alarming situations” (e.g. a fall) commonly treated in
discriminative fashion, i.e. learning to distinguish an alarming event from non-
harmful situations based purely on the previously monitored data and finding de-
pendency of annotations (ground truth). These problems can be solved by discrimi-
native (often called as conditional) models, such as by Logistic Regression [424],
[433], [435], Support Vector Machines (SVMs) [93], [290], [438]–[440], Condi-
tional Random Fields [263], [421], [436], [441], [442], Boosting [443], artificial
Neural Networks (ANNs) [444], [445]. Often researchers simplify the problem as a
binary classification, by considering only two classes, for instance classifying “an
alarming situation” versus “a non-alarming situation” (usually applied in short-term
monitoring scenarios, e.g. fall detection) or diagnosing a certain impairment (usual-
ly applied in long-term monitoring scenarios, e.g. Dementia diagnosis). However,
many recent studies attempted solving multi-class classification problems, i.e. dis-
tinguishing between more than two classes, for instance, in the scenarios, where
multiple ADL are recognized [254], [255], [263], [436], [446], [447]. Binary classi-
fication approaches are relatively easy to evaluate, compared to multi-class classifi-
cation methods.

VISUAL ANALYSIS OF FACES WITH APPLICATION IN BIOMETRICS, FORENSICS AND HEALTH INFORMATICS
90
Furthermore, hierarchical classification models exist, which are useful for dis-
tinguishing activities or events on different abstraction levels. For example, at first,
a fall or a non-fall is classified, then in case of a non-fall, a more specific activity is
then returned, and in case of a fall, the type of fall is further estimated [91], [255],
[448]. These hierarchies, can be learned and represented as decision trees (DTs)
[255] or Random Forests [280]. By default, some of the discriminative approaches,
such as logistic regression, SVMs or ANNs can output only a discrete class label
for a given sample, while some can provide a probabilistic estimate of a sample
being a part of either class, such as CRFs. Thus, in patient-at-home scenarios, when
geriatric care requires a probabilistic measure representing a likelihood of a detect-
ed health-threat, probabilistic approaches are more preferable [449]. This can be
accomplished also by applying several generative models (often referred to proba-
bilistic classification), such as Naïve Bayesian Classifier (NBC) [94], Dynamic
Bayesian Networks (DBN) [249], [450], [451], Hidden Markov Models (HMMs)
[289], [398], [421], [452], Gaussian Processes (GPs) [453]–[455], Gaussian Mix-
ture Models (GMMs) [249], [454], [456], or Deep Belief Networks [457]. GPs
proved to be very effective in the patient monitoring scenarios both for solving
regression [451], [458] as well as for classification [249], [450] tasks. Like SVMs,
GPs are kernel methods. GPs proved to handle well multi-dimensional inputs and
unequally sampled data points, have a relatively small number of tuneable parame-
ters that does not require lots of training data. However, choosing the right kernel
function is a question of experience. Difference between other discriminative and
generative models in the light of activity recognition have been discussed in [263].
Popular graphical models, such as Markov chains, Dynamic Bayesian networks
[249], [450], [451], [263], [431], [459], [460], Hidden Markov Models (HMMs)
[289], [398], [421], [452], and Conditional Random Fields (CRFs) [263], [421],
[436], [442], [460], [461] are reported to deal successfully with the sequential na-
ture of data. HMMs are the most common graphical models for activity recognition,
and many extensions have been proposed, for example the Coupled HMM for rec-
ognizing multi-resident activities, Hierarchal HMM for providing hierarchal defini-
tions of activities, Hidden Semi-Markov model for modelling activity duration, and
Partially Observable Markov Decision Process for modelling sequential decision
processes.
There are also several works, which treat problems in an unsupervised fashion
(without knowing “correct” answers a priori), when the task is to automatically
discover structure or new patterns in given data, and therefore clustering and/or
outlier analysis is used ([266], [268], [286], [414], [420], [443]). Unsupervised and
supervised learning is often used in conjunction, when clustering results serve as an
extra input for classification, as for example in [286], [443]. For instance, in [286]
clustering was used for revealing an uncommon acceleration that potentially indi-
cated a fall, which was used as an input for a classifier; while [443] demonstrated
the use of unsupervised classification for amplifying predictability of models de-

CHAPTER 2. DISTRIBUTED COMPUTING AND MONITORING TECHNOLOGIES FOR OLDER PATIENTS
91
scribing expert classification of coronary heart disease (CHD) patients, as well as
boosting cause-and-effect relationships hidden in the data. As an example of a rela-
tively simple technique, k-means algorithm itself is often used to initialize the pa-
rameters in a Gaussian mixture model before applying the expectation-
maximization algorithm [462, p. 427]. There are also other ways, where a number
of studies reported the application of unsupervised machine learning approaches for
improving the performance of health-threatening event detection systems. For ex-
ample, Yuwono et al. [286] used the data-stream from a waist-worn wireless tri-
axial accelerometer and combined the application of Discrete Wavelet Transform,
Regrouping Particle Swarm Optimization, Gaussian Distribution of Clustered
Knowledge and an ensemble of classifiers, including a multilayer perceptron and
Augmented Radial Basis Function (ARBF) neural networks. Clustering was used
for revealing an uncommon acceleration that potentially indicated a fall, which was
used as an input for a classifier.
2.5.2.2 Requirements and Challenges of Machine Learning Strategies
The types and distributions of monitored data dictate the specific requirements for
machine learning techniques that intend to handle and reason from these data. For
example, the following requirements for machine learning techniques that intend
solving medical-related tasks can be noted [463]:
Good performance (e.g. high accuracy and precision)
Dealing with missing data (e.g. loss of some amount of data should not re-
sult in a rapid drop of performance)
Dealing with noisy data (e.g. when some errors in data are present)
Dealing with imbalanced data (e.g. when class distribution is not uniform
among the classes of interest)
Dealing with uncertainty (e.g. when imprecision, vagueness or gradedness
of training data is present)
Transparency of diagnostic knowledge (i.e. the automatically generated
knowledge and the explanation of decisions should be transparent to the
responsible medical personnel, possibly providing a novel point of view on
the given problem, by revealing interrelation and regularities of the availa-
ble data in an explicit form)
Ability to explain decisions (e.g. the process of decision making of a ma-
chine learning approach should be transparent to the user. For instance,
when a certain health-threat is automatically detected, an algorithm should

VISUAL ANALYSIS OF FACES WITH APPLICATION IN BIOMETRICS, FORENSICS AND HEALTH INFORMATICS
92
present an explanation of the circumstances, which forced to make such a
statement. For example, graphical models and decision trees are more ac-
ceptable than so-called “black box” algorithms, where mathematical rea-
soning is hardly explainable to the responsible medical personnel.)
Ability to reduce a number of tests without compromising the performance
(since the collection of patient data is often expensive and time consuming
for the patients, it is desirable to have a classifier that is able to reliably de-
tect a certain health-threat with a relatively small amount of training data
about the target patients. A machine-learning approach should be able to
select an appropriate subset of attributes during the learning process.)
Dealing with growing dimensionality (e.g. adding new sensors may pro-
vide additional information about a given problem, thus a machine-
learning approach should be able to accept extra measurements or new pa-
rameters as an input, and the decision making should be susceptible to this
input after classifier retraining)
Continuously learn (and improve) from new data (i.e. when new empirical
data is available, a machine-learning approach should be able to relearn
from the new input. For example, so-called Active Learning approaches
may be applied [464]).
In most cases, the performance of a classifier (e.g. a fall detector) is expressed in
terms of sensitivity and specificity. For example, in the case of a binary classifier,
the sensitivity is the ability of a detector to correctly classify a fall event as a fall,
while the specificity is the ability of a detector to correctly classify normal activity
as being normal. In other words, sensitivity represents the percentage of how well
the algorithm detects a certain event or activity when that event or activity actually
occurred (i.e. positive cases), while specificity represents the percentage of how
well the algorithm can rule out all other events or activities than the one that is be-
ing identified (i.e. negative cases). Another commonly used performance measure is
classification accuracy, which represents the percentage of the correctly classified
events or activities among all events or activities that are being observed (both posi-
tive and negative cases). It is important to note, that accuracy measure alone is not
enough for assessing the overall performance of the classifier, because it does not
reveal how well the classifier can detect an important health-threat of interest. For
example, if a dataset contains very few instances of positive cases, comparing to the
number of negative cases, and the algorithm is tuned to classify all instances as
negative cases (i.e. the sensitivity is 0), then the accuracy can still be very high
(close to 100%), which would be obviously misleading, because such algorithm
would not be capable of detecting the important health-threat at all.
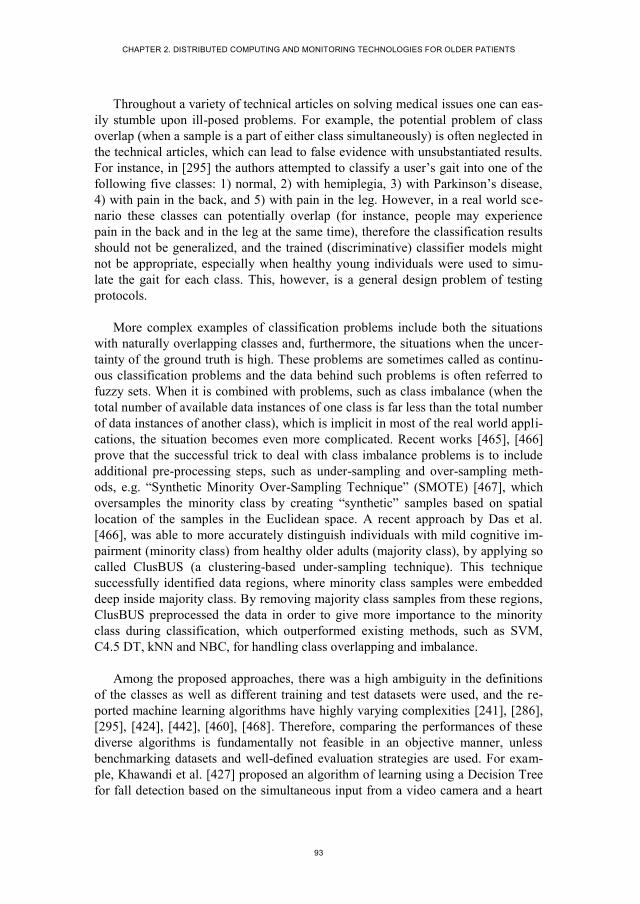
CHAPTER 2. DISTRIBUTED COMPUTING AND MONITORING TECHNOLOGIES FOR OLDER PATIENTS
93
Throughout a variety of technical articles on solving medical issues one can eas-
ily stumble upon ill-posed problems. For example, the potential problem of class
overlap (when a sample is a part of either class simultaneously) is often neglected in
the technical articles, which can lead to false evidence with unsubstantiated results.
For instance, in [295] the authors attempted to classify a user’s gait into one of the
following five classes: 1) normal, 2) with hemiplegia, 3) with Parkinson’s disease,
4) with pain in the back, and 5) with pain in the leg. However, in a real world sce-
nario these classes can potentially overlap (for instance, people may experience
pain in the back and in the leg at the same time), therefore the classification results
should not be generalized, and the trained (discriminative) classifier models might
not be appropriate, especially when healthy young individuals were used to simu-
late the gait for each class. This, however, is a general design problem of testing
protocols.
More complex examples of classification problems include both the situations
with naturally overlapping classes and, furthermore, the situations when the uncer-
tainty of the ground truth is high. These problems are sometimes called as continu-
ous classification problems and the data behind such problems is often referred to
fuzzy sets. When it is combined with problems, such as class imbalance (when the
total number of available data instances of one class is far less than the total number
of data instances of another class), which is implicit in most of the real world appli-
cations, the situation becomes even more complicated. Recent works [465], [466]
prove that the successful trick to deal with class imbalance problems is to include
additional pre-processing steps, such as under-sampling and over-sampling meth-
ods, e.g. “Synthetic Minority Over-Sampling Technique” (SMOTE) [467], which
oversamples the minority class by creating “synthetic” samples based on spatial
location of the samples in the Euclidean space. A recent approach by Das et al.
[466], was able to more accurately distinguish individuals with mild cognitive im-
pairment (minority class) from healthy older adults (majority class), by applying so
called ClusBUS (a clustering-based under-sampling technique). This technique
successfully identified data regions, where minority class samples were embedded
deep inside majority class. By removing majority class samples from these regions,
ClusBUS preprocessed the data in order to give more importance to the minority
class during classification, which outperformed existing methods, such as SVM,
C4.5 DT, kNN and NBC, for handling class overlapping and imbalance.
Among the proposed approaches, there was a high ambiguity in the definitions
of the classes as well as different training and test datasets were used, and the re-
ported machine learning algorithms have highly varying complexities [241], [286],
[295], [424], [442], [460], [468]. Therefore, comparing the performances of these
diverse algorithms is fundamentally not feasible in an objective manner, unless
benchmarking datasets and well-defined evaluation strategies are used. For exam-
ple, Khawandi et al. [427] proposed an algorithm of learning using a Decision Tree
for fall detection based on the simultaneous input from a video camera and a heart

VISUAL ANALYSIS OF FACES WITH APPLICATION IN BIOMETRICS, FORENSICS AND HEALTH INFORMATICS
94
rate monitor, which showed a low error rate of 1.55% in average on test data after
training. However, no definition of a falling event was revealed, and a description
of the used dataset and the learning speed of the algorithm were missing.
It is important to note that every machine learning strategy has some limitations.
For example, Zhang et al. [290] proposed a fall detector based on Support Vector
Machine (SVM) algorithm, which used input from one waist-worn accelerometer.
The features for machine learning were the accelerations in each direction and
changes in acceleration, and their method detected falls with a promising 96.7%
accuracy. Despite that SVMs are relatively fast and efficient to compute, they do
not output with what probability a sample belongs to either class. Other well-known
limitations of SVMs are a choice of the kernel function and high algorithmic com-
plexity.
In order to avoid some limitations of individual machine learning approaches
and consequently to improve the overall classification or regression performances,
multiple learning methods can be used at the same time, called as Ensemble meth-
ods. They use multiple learning algorithms to obtain better predictive perfor-
mance than could be obtained from any of the constituent learning algorithms.
Therefore, ensemble methods are increasingly attractive for research on problems
of monitoring older patients [276], [417], [430], [469]. Furthermore, it is often fa-
vourable to use a set of relatively simple learners, which can result in a better per-
formance, comparing to a single complex and computationally expensive method.
For combining the above machine learning techniques in an effective manner
one should be extremely careful, because there are a number of different learning
stages and different learning problems are addressed, so that incorrect treatment of
data can accumulate and result in false reasoning. As previous research suggests,
for optimal results, a physician or clinical expert will only be able to guide and
understand the research if possesses sufficient basic knowledge of the machine
learning algorithms [470].
Meanwhile, some recent studies have further attempted to compare the perfor-
mances of machine learning systems with human experts. For example, Marschol-
lek et al. [433] compared the performances of a multidisciplinary geriatric care team
with automatically induced logistic regression models based on conventional clini-
cal and assessment data as well as matched sensor data. Their results indicated that
a fall risk model based on accelerometer sensor data performs almost as well as a
model that is derived from conventional geriatric assessment data.
2.5.3. STANDARDS
Generally, a wide variety of monitoring technologies for older patients, i.e. the sen-
sory devices, including software, are considered to fall under the definition of a

CHAPTER 2. DISTRIBUTED COMPUTING AND MONITORING TECHNOLOGIES FOR OLDER PATIENTS
95
“medical device”. A full definition of a “medical device” by World Health Organi-
sation is given here [471]. Medical devices are considered to be a subset of elec-
tronic products that may have general regulatory provisions [472]. Numerous na-
tional and international standards exist that must be complied with before and after
such electronic products enter into commercial use. These standards offer a possi-
bility to cope with the high demands on technical and scientific expertise in the
regulation processes of medical devices. These standards are being constantly up-
dated, following the high rate of innovations.
It is important to note, that medical devices may be regulated even for non-
medical reasons. For example, if the device (an electronic product) emits or can
potentially emit some type of electronic product radiations, such as x-rays and other
ionizing radiation, ultraviolet, visible, infrared, microwave, radio and low frequency
radiation, coherent radiation produced by stimulated emission, and infrasonic, son-
ic, and ultrasonic vibrations [472].
There are two main organizations, which are typically issuing international
standards, namely the International Organization for Standardization (ISO) and the
International Electrotechnical Commission (IEC). Every region (e.g. EU) or a coun-
try (e.g. Japan) has a standards organization that may adopt the established interna-
tional standards, and in some certain cases may modify it or place limitations on it.
Furthermore, the local medical device authorities may recognize the standard, but
normally there is no legal obligation to do so. In other words, a certain international
standard does not define in itself, where it operates. Consequently, any country or
region may adopt them, possibly with certain modifications or limitations. For ex-
ample in EU, all medical devices, which are intended for use within the EU region,
must conform to the Medical Device Directive 93/42/EEC (MDD) [473], which
was updated by the Directive 2007-47-EC [474], and must have a CE conformance
mark [475].
The following relevant standards are mostly and generally requested (this is not
an exhaustive list, and some might not be applicable for the existing solutions, and
furthermore at the same time some more standards could be relevant):
ISO 13485:2012 – Medical devices – Quality management systems – Re-
quirements for regulatory purposes. ISO 13485:2012 is applicable only to
manufacturers placing devices on the market in Europe. For the rest of the
world, the older version ISO 13485:2003 remains the applicable standard
[476].
ISO 14971:2012 – Medical devices – Application of risk management to
medical devices [477].
IEC 60601-1:2015 SER – Medical electrical equipment – All parts [478].

VISUAL ANALYSIS OF FACES WITH APPLICATION IN BIOMETRICS, FORENSICS AND HEALTH INFORMATICS
96
IECEE TRF 60601-1-2:2015 – Medical electrical equipment – Part 1-2:
General requirements for basic safety and essential performance – Collat-
eral standard: Electromagnetic disturbances – Requirements and tests
[479].
IECEE TRF 60601-1-6:2014 – Medical electrical equipment – Part 1-2:
General requirements for basic safety and essential performance – Collat-
eral standard: Usability [480].
IEC 60601-1-8:2006 – Medical electrical equipment – Part 1-8: General
requirements for basic safety and essential performance – Collateral stand-
ard: General requirements, tests and guidance for alarm systems in medical
electrical equipment and medical electrical systems [481] (Included in
[478]).
EN 60601-1-9:2007 – Medical electrical equipment – Part 1-9: General re-
quirements for basic safety and essential performance – Collateral Stand-
ard: Requirements for environmentally conscious design [482] (Included
in [478]).
IEC 60601-1-11:2015 – Medical electrical equipment – Part 1-11: General
requirements for basic safety and essential performance – Collateral stand-
ard: Requirements for medical electrical equipment and medical electrical
systems used in the home healthcare environment [483] (Included in
[478]).
EN 62304:2006 – Medical device software – Software life-cycle processes
[484].
ISO 10993:2009 – Biological evaluation of medical devices – Part 1:
Evaluation and testing within a risk management process [485].
ISO 15223-1:2012 – Symbols to be used with medical device labels, label-
ling and information to be supplied – Part 1: General requirements [486].
EN 1041:2008+A1:2013 – Information supplied by the manufacturer of
medical devices [487].
ISO 14155:2011 – Clinical investigation of medical devices for human
subjects – Good clinical practice [488].
MEDDEV 2.7.1 Rev.3:2009 – Clinical evaluation: A guide for manufac-
turers and notified bodies [489].
IEC 62366-1:2015 – Medical devices – Part 1: Application of usability en-
gineering to medical devices [490].

CHAPTER 2. DISTRIBUTED COMPUTING AND MONITORING TECHNOLOGIES FOR OLDER PATIENTS
97
ISO/IEC 27001 – Information security management [491].
ISO/IEC 25010:2011 – Systems and software engineering – Systems and
software Quality Requirements and Evaluation (SQuaRE) – System and
software quality models [492].
The aforementioned standards facilitate so-called harmonised medical device
regulatory requirements, and more comprehensive and updated list of titles and
references of the harmonised standards under Union harmonisation legislation is
available on the European Commission web site [493].
As an important note, any software, which is related to the monitoring technol-
ogy in our context, must also fulfil the aforementioned requirements of the medical
device wherein it is incorporated. One can typically divide software in two groups.
First, there is so called “embedded” software, which is incorporated in the appa-
ratus, i.e. in a physical device being used for monitoring. Second, there is software
that is used in combination with the apparatus, but is separate from the device, i.e.
software that is involved, for instance, in transferring, receiving, storing, pro-
cessing, and accessing the data. Both types of software fall under the definition of a
“medical device”, as we previously mentioned, since it affects the use of the devic-
es. According to the essential requirements of European Medical Device Directive,
such software “must be validated according to state of the art taking into account
the principles of development lifecycle, risk management, validation and verifica-
tion” (Annex I, 93/42/EEC as amended by Directive 2007/47/EC [473]). There are
numerous specific standards for each area of interest; for example, for the ECG
measurement devices, the health informatics standards, such as ISO 11073-
91064:2009, ISO/TS 22077-2:2015 and ISO/TS 22077-3:2015, are relevant. Fur-
thermore, in accordance with the current security standards (such as ISO/IEC 27001
[491]), the availability, integrity, and confidentiality of the monitored data and in-
formation must be ensured. Last but not least, several generic standards must be
followed. For example, ISO/IEC 25010:2011 [492] is necessary for every computer
system and software products in general.
In general, most of the national and international standards, for example, those
that are published by ISO and IEC, are unfortunately not available free of charge,
since there is a certain fee for obtaining them. Furthermore, each individual stand-
ard may include many cross-references to other standards. In the field of health
telemonitoring, the number of relevant standards is substantially high. Therefore,
for many stakeholders this would result in extra investments, which can be increas-
ingly high due to the fact that these standards are frequently updated and manufac-
turers have to constantly adapt to the state of the art.
As a solution, the responsible authorities for safeguarding the quality and relia-
bility of various health telemonitoring solutions should in principle promote an

VISUAL ANALYSIS OF FACES WITH APPLICATION IN BIOMETRICS, FORENSICS AND HEALTH INFORMATICS
98
open access to the relevant standards, or at least help to improve their availability to
those who develop and deliver health telemonitoring products and services. This
solution is in agreement with previously proposed suggestions [494]. Alternatively,
some reimbursement strategies for successful implementation of those standards
might be initiated, which could further motivate the compliance with those im-
portant standards for further quality improvement of the health care.
2.6. DATASETS
Publicly available datasets constitute the ground to evaluate and compare the per-
formance of proposed approaches for monitoring older patients at home. In this
section, we shed light on the importance of using datasets as a benchmarking tool
for comparing various monitoring techniques for detecting the health threats, which
we discussed in the previous sections. The methods, which are tested by using a
standard publicly available dataset as a benchmark, are considered to be more relia-
ble and are more likely to be accepted by the scientific community for their claimed
results. Therefore, we summarize the references of available datasets, which are
relevant to the field of automatic monitoring of older patients.
In the context of audio-visual content-based monitoring, a dataset contain audio
and video clips of human body-parts and/or activities in experimental or real-life
environments. In the context of measuring movements and locations of patients, for
example, by means of radio frequency sensors, infrared detectors, or inertial sen-
sors, a dataset usually contains annotated recordings of a finite set of specific
ADLs. Sampling rate of these recordings may vary, depending on the monitoring
equipment, and numeric timestamps are usually assigned to every instance of the
recorded data. The attributes of those datasets can be very different, and may simul-
taneously contain both numeric and categorical variables. Every dataset should in
principle contain detailed description about how the data was collected and annotat-
ed. Often the data is already pre-processed. Therefore, the detailed description of
those pre-processing steps should be included in the dataset description as well,
often accompanied with available program source code. Most important dataset
descriptions usually are included in a so-called “readme” file.
Though a vast body of literature has been produced for older patient monitoring,
in fact, a few methods are tested on real older patients’ data. Most of the methods
used their own configuration of sensors for data acquisition and young people as
actors in a laboratory environment to create scenes, and tested the system by their
custom dataset. The datasets are not only varying in number and placement of sen-
sors, but also varying by objective of data collection (e.g. fall detection or specific
set of ADLs detection), environmental description, and subjects’ behaviour. Thus,
the results from one method tested on a custom dataset are not comparable with the
results of another method tested on some other custom datasets. Also, the results
from a method that is tested on the data collected from young volunteers may sig-
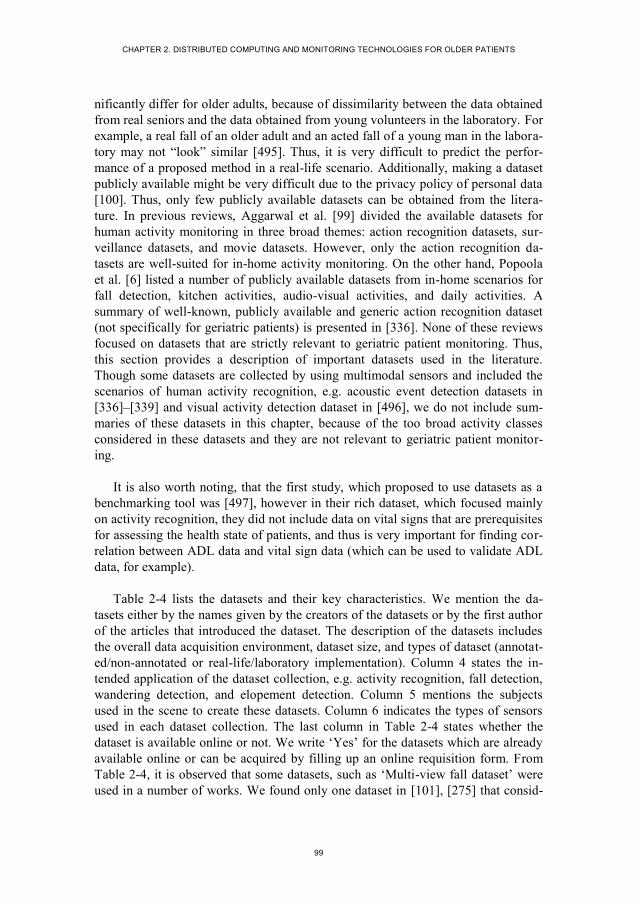
CHAPTER 2. DISTRIBUTED COMPUTING AND MONITORING TECHNOLOGIES FOR OLDER PATIENTS
99
nificantly differ for older adults, because of dissimilarity between the data obtained
from real seniors and the data obtained from young volunteers in the laboratory. For
example, a real fall of an older adult and an acted fall of a young man in the labora-
tory may not “look” similar [495]. Thus, it is very difficult to predict the perfor-
mance of a proposed method in a real-life scenario. Additionally, making a dataset
publicly available might be very difficult due to the privacy policy of personal data
[100]. Thus, only few publicly available datasets can be obtained from the litera-
ture. In previous reviews, Aggarwal et al. [99] divided the available datasets for
human activity monitoring in three broad themes: action recognition datasets, sur-
veillance datasets, and movie datasets. However, only the action recognition da-
tasets are well-suited for in-home activity monitoring. On the other hand, Popoola
et al. [6] listed a number of publicly available datasets from in-home scenarios for
fall detection, kitchen activities, audio-visual activities, and daily activities. A
summary of well-known, publicly available and generic action recognition dataset
(not specifically for geriatric patients) is presented in [336]. None of these reviews
focused on datasets that are strictly relevant to geriatric patient monitoring. Thus,
this section provides a description of important datasets used in the literature.
Though some datasets are collected by using multimodal sensors and included the
scenarios of human activity recognition, e.g. acoustic event detection datasets in
[336]–[339] and visual activity detection dataset in [496], we do not include sum-
maries of these datasets in this chapter, because of the too broad activity classes
considered in these datasets and they are not relevant to geriatric patient monitor-
ing.
It is also worth noting, that the first study, which proposed to use datasets as a
benchmarking tool was [497], however in their rich dataset, which focused mainly
on activity recognition, they did not include data on vital signs that are prerequisites
for assessing the health state of patients, and thus is very important for finding cor-
relation between ADL data and vital sign data (which can be used to validate ADL
data, for example).
Table 2-4 lists the datasets and their key characteristics. We mention the da-
tasets either by the names given by the creators of the datasets or by the first author
of the articles that introduced the dataset. The description of the datasets includes
the overall data acquisition environment, dataset size, and types of dataset (annotat-
ed/non-annotated or real-life/laboratory implementation). Column 4 states the in-
tended application of the dataset collection, e.g. activity recognition, fall detection,
wandering detection, and elopement detection. Column 5 mentions the subjects
used in the scene to create these datasets. Column 6 indicates the types of sensors
used in each dataset collection. The last column in Table 2-4 states whether the
dataset is available online or not. We write ‘Yes’ for the datasets which are already
available online or can be acquired by filling up an online requisition form. From
Table 2-4, it is observed that some datasets, such as ‘Multi-view fall dataset’ were
used in a number of works. We found only one dataset in [101], [275] that consid-
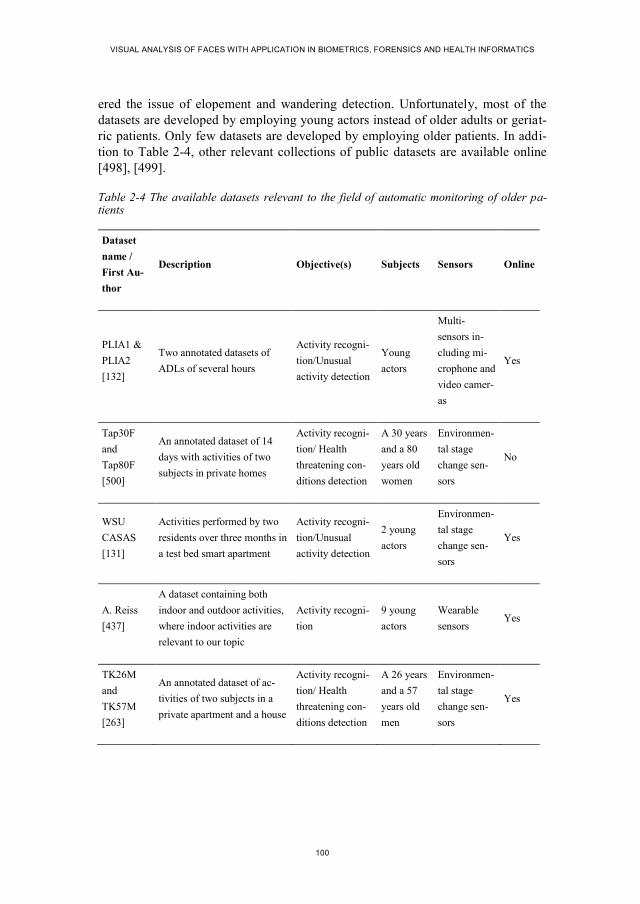
VISUAL ANALYSIS OF FACES WITH APPLICATION IN BIOMETRICS, FORENSICS AND HEALTH INFORMATICS
100
ered the issue of elopement and wandering detection. Unfortunately, most of the
datasets are developed by employing young actors instead of older adults or geriat-
ric patients. Only few datasets are developed by employing older patients. In addi-
tion to Table 2-4, other relevant collections of public datasets are available online
[498], [499].
Table 2-4 The available datasets relevant to the field of automatic monitoring of older pa-tients
Dataset
name /
First Au-
thor
Description Objective(s) Subjects Sensors Online
PLIA1 &
PLIA2
[132]
Two annotated datasets of
ADLs of several hours
Activity recogni-
tion/Unusual
activity detection
Young
actors
Multi-
sensors in-
cluding mi-
crophone and
video camer-
as
Yes
Tap30F
and
Tap80F
[500]
An annotated dataset of 14
days with activities of two
subjects in private homes
Activity recogni-
tion/ Health
threatening con-
ditions detection
A 30 years
and a 80
years old
women
Environmen-
tal stage
change sen-
sors
No
WSU
CASAS
[131]
Activities performed by two
residents over three months in
a test bed smart apartment
Activity recogni-
tion/Unusual
activity detection
2 young
actors
Environmen-
tal stage
change sen-
sors
Yes
A. Reiss
[437]
A dataset containing both
indoor and outdoor activities,
where indoor activities are
relevant to our topic
Activity recogni-
tion
9 young
actors
Wearable
sensors Yes
TK26M
and
TK57M
[263]
An annotated dataset of ac-
tivities of two subjects in a
private apartment and a house
Activity recogni-
tion/ Health
threatening con-
ditions detection
A 26 years
and a 57
years old
men
Environmen-
tal stage
change sen-
sors
Yes

CHAPTER 2. DISTRIBUTED COMPUTING AND MONITORING TECHNOLOGIES FOR OLDER PATIENTS
101
Dataset
name /
First Au-
thor
Description Objective(s) Subjects Sensors Online
Multi-view
fall dataset
[249],
[501]–
[506]
24 fall incidences in 24 sce-
narios and includes different
kinds of fall, e.g. forward and
backward fall.
Fall detection Young
actors
Video cam-
eras Yes
T. Liu
[507]
12 hours of video data con-
taining 7 previously instructed
activities and fall events
Activity recogni-
tion/Unusual
activity detec-
tion/Fall detec-
tion
Young
actors
Video cam-
era Yes
Nursing
Home
Dataset
[101],
[275]
13800 camera-hours of video
(25 days x 24 hours per day x
23 cameras) obtained from a
test bed developed in a de-
mentia unit of a real nursing
home
Elopement (leav-
ing home) detec-
tion/ Unusual
activity detection/
Wandering detec-
tion
15 elderly
dementia
patients
Video cam-
era No
C. Zhang
[508]
A dataset of 200 video se-
quences with RGB-D infor-
mation in three conditions:
subject is within 4 meters
with/without enough illumina-
tion and subject is out of 4
meters distance from the
camera
Fall detection Young
actors
RGB-D
camera No
D. Ander-
son [509]
18 video sequences that are
captured in 3fps capture rate
and a total of 5512 frames (30
minutes)
Fall detection
2 young
actors
Video cam-
era No
I. Charfi
[510]
An annotated dataset of 191
videos that are collected by
varying different environmen-
tal attributes
Fall detection Young
actors
Video cam-
era Yes
Continued from previous page….
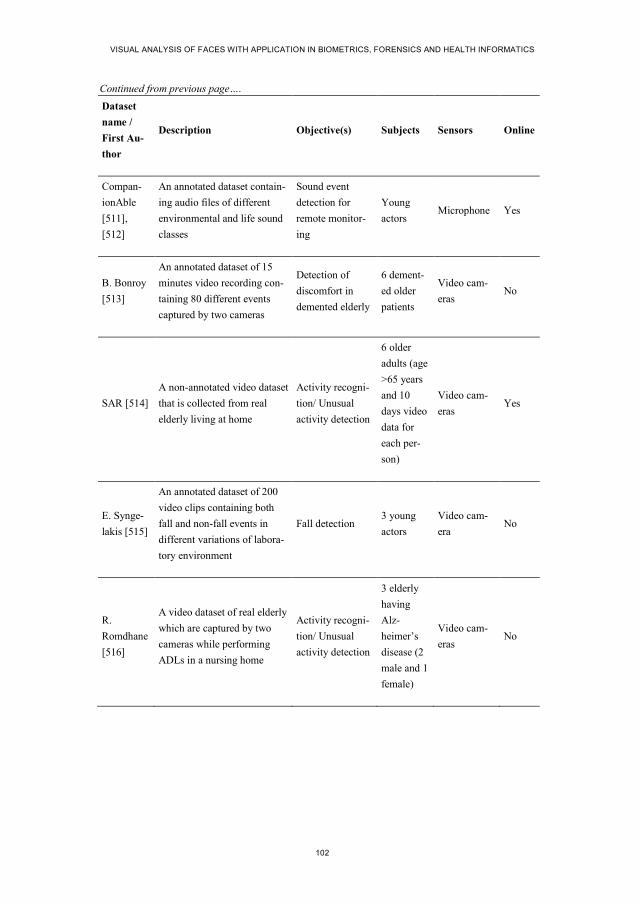
VISUAL ANALYSIS OF FACES WITH APPLICATION IN BIOMETRICS, FORENSICS AND HEALTH INFORMATICS
102
Dataset
name /
First Au-
thor
Description Objective(s) Subjects Sensors Online
Compan-
ionAble
[511],
[512]
An annotated dataset contain-
ing audio files of different
environmental and life sound
classes
Sound event
detection for
remote monitor-
ing
Young
actors Microphone Yes
B. Bonroy
[513]
An annotated dataset of 15
minutes video recording con-
taining 80 different events
captured by two cameras
Detection of
discomfort in
demented elderly
6 dement-
ed older
patients
Video cam-
eras No
SAR [514]
A non-annotated video dataset
that is collected from real
elderly living at home
Activity recogni-
tion/ Unusual
activity detection
6 older
adults (age
>65 years
and 10
days video
data for
each per-
son)
Video cam-
eras Yes
E. Synge-
lakis [515]
An annotated dataset of 200
video clips containing both
fall and non-fall events in
different variations of labora-
tory environment
Fall detection 3 young
actors
Video cam-
era No
R.
Romdhane
[516]
A video dataset of real elderly
which are captured by two
cameras while performing
ADLs in a nursing home
Activity recogni-
tion/ Unusual
activity detection
3 elderly
having
Alz-
heimer’s
disease (2
male and 1
female)
Video cam-
eras No
Continued from previous page….

CHAPTER 2. DISTRIBUTED COMPUTING AND MONITORING TECHNOLOGIES FOR OLDER PATIENTS
103
Dataset
name /
First Au-
thor
Description Objective(s) Subjects Sensors Online
C. F. C.
Junior
[254]
A dataset of ADLs acquired
by multiple sensors in a nurs-
ing home
Activity recogni-
tion/ Unusual
activity detection
4 healthy
and 5 el-
derly peo-
ple with
MCI (Mild
Cognitive
Impair-
ment)
Multiple
sensor in-
cluding video
cameras
No
GER’HO
ME dataset
[265],
[517]
A dataset of ADLs acquired
by multiple sensors in an
experimental apartment
Activity recogni-
tion/ Unusual
activity detection
14 elderly
people
(aged from
60 to 85
years),
each one
during 4
hours
Multiple
sensor in-
cluding 4
video camer-
as and a
number of
environmen-
tal stage
change sen-
sors
Yes
REALDIS
P dataset
[413],
[518]
A dataset of 33 different
physical activities acquired in
3 different scenarios by 9
inertial sensors for investigat-
ing the effects of sensor dis-
placement in the activity
recognition process in real-
world settings
Determining
optimal sensor
positioning for
activity recogni-
tion and bench-
marking activity
recognition algo-
rithms
17 young
healthy
actors (age
ranging
from 22 to
37 years
old)
3D accel-
erometers,
3D gyro-
scopes, 3D
magnetic
field orienta-
tion sensors,
4D quarteri-
ons
Yes
Continued from previous page….

VISUAL ANALYSIS OF FACES WITH APPLICATION IN BIOMETRICS, FORENSICS AND HEALTH INFORMATICS
104
Dataset
name /
First Au-
thor
Description Objective(s) Subjects Sensors Online
B. Kaluža
et al. [519]
A localization dataset for
posture reconstruction and
person activity recognition,
including falling
Activity recogni-
tion and fall de-
tection
5 young
healthy
actors
Attached 4
radio-
frequency
body tags
(chest, belt
and two
angles) re-
cording 3D
coordinates
Yes
D. Cook et
al. [123]
A dataset with IADLs and
memory in older adulthood
and dementia patients in a
real-home setting
Mild cognitive
impairment
(MCI) and de-
mentia detection
using IADL data,
such as cooking
and using the
telephone.
400 sub-
jects, in-
cluding
healthy
younger
adults and
older
adults with
MCI and
dementia
Multimodal
sensors:
motion de-
tectors, door
sensors,
stove sen-
sors, temper-
ature sensors,
water sen-
sors, etc.
Yes
2.7. DISCUSSION
This section briefly discusses the anticipated future challenges within the field of
monitoring older adults and provides a number of future research directions. Some
of the most notable challenges are lack of publically available datasets, poor meas-
urement accuracy of sensors, user-centred design barriers, and user acceptability for
monitoring. We try to draw attention to the importance of acquiring objective in-
formation of older patients’ health conditions by applying appropriate sensor tech-
nology for automated monitoring, which we covered in the previous sections of this
chapter. As possible future research directions, we draw attention to the necessary
research in the fields of sensor fusion and machine learning for detecting various
health-threatening events and conditions in older population.
The need for objective measurements of older patients’ conditions in the home
environment is a critical ingredient of assessment before institutionalization. In the
Continued from previous page….

CHAPTER 2. DISTRIBUTED COMPUTING AND MONITORING TECHNOLOGIES FOR OLDER PATIENTS
105
absence of such measurements, the relationship between certain activities or inac-
tivity, for example, cannot be related to the appearance of a specific health-
threatening event or condition. To date, there is no routine procedure available to
measure activity in a home setting. Attempts to overcome this have predominantly
employed archaic methods using observations and surveys, which are susceptible to
observation and interpretation bias, as well as cannot be directly applied to those
patients, who are living alone.
2.7.1. FUTURE CHALLENGES
2.7.1.1 Defining Taxonomy
In-home activity monitoring initially requires definitions of activities, level of cor-
respondence between activities, and an established relationship model between the
activities. These can be achieved by defining taxonomy of activities systematically.
Unfortunately except the work of [258], which manually defined taxonomy of some
daily living activities, no systematic study was accomplished in order to define the
taxonomy of daily living activities in a private home.
2.7.1.2 Lack of Publicly Available Datasets
The availability of public datasets is necessary to compare the methods proposed to
solve similar problems. However, a few datasets are available in public to assess the
methods proposed in the literature. Moreover, the available datasets have the limita-
tion of the experimental setup and standard quality assurance. It is also observed
from this chapter that most of the previously proposed methods used custom da-
tasets instead of publicly available datasets and furthermore, many of the authors
did not make their dataset publicly available due to privacy policies. Thus, there is a
need of regulatory initiatives, which would lessen the hurdles for the researchers’
community to access and publish datasets necessary for solving the emerging
healthcare problems.
2.7.1.3 Inefficiency of Health-Threat Detection Technologies
As discussed in this chapter, a number of health-threat detection methods have been
proposed, however the false alarm rates from the methods are still questionable.
Moreover, majority of authors used their own custom datasets to generate experi-
mental results for their proposed methods, and thus provided less room for compar-
ison between different methods.
2.7.1.4 Sampling Limitations and Time Delays in Monitoring
Every sensor has temporal sampling limitations, which need to be considered. Eve-
ry measurement process involves some time delays in data capture, which depend
VISUAL ANALYSIS OF FACES WITH APPLICATION IN BIOMETRICS, FORENSICS AND HEALTH INFORMATICS
106
on various factors, such as location of sensors and sensing modality. In general,
sensor signals are noisy and thus require digital filtering, which causes certain time
delays as well. Furthermore, delays in sensor signals may or may not be constant
[315]. If the sampling frequency is too low or irregular, interpolating the measure-
ments reliably over time might not be feasible depending on a given problem. Esti-
mating eventual time delays between irregularly sampled time series is crucial for
avoiding possible data processing and interpretation errors. For scenarios, where
multiple sensors are used, time synchronization among all sensors is necessary to
enable fusion of sensory data, which can be increasingly difficult, because different
time delays in data acquisition, transmission and processing may be present. In
addition, the time lag between sampling and obtaining the analysis results may be
ranging from a matter of milliseconds to several hours, which can be a significant
problem if the situation requires immediate decision concerning patient’s health.
Choosing an optimal sampling frequency in order to provide sufficient resolu-
tion for detecting a certain health-threat is generally not a trivial task. Some sensor
types may have an advantage over other sensors in terms of resolution and detection
times for certain health-threats. It can be discussed at length whether monitoring a
certain parameter is necessary for a given problem, while taking into account vari-
ous trade-offs between sample sizes, measurement costs, detection accuracy, priva-
cy, and comfortability of monitoring. Understanding these trade-offs would require
further research. Furthermore, adaptive sampling techniques might be useful for
scenarios, where it does not make sense to continuously measure a certain parame-
ter rather than to take a sample once in a while or only when the risk of a health-
threat is detected by analysing other parameters. Such approach may potentially
improve energy-efficiency, when certain sensors can be in sleep mode, and are set
active only when there is an identified need for using them in time.
Another area of great importance, which we did not have the space to cover, is
ICT solutions for the transmission of large data over long distances, which can po-
tentially improve the accessibility of monitoring technologies for those living in
rural areas. Network delays in data transmission can have a critical impact on de-
tecting health-threats at home. Even for relatively short distances, the network delay
problem may present a significant obstacle for monitoring scenarios. One example
is the delay in active camera based systems, which use the pan-tilt-zoom capability
of video cameras. Industry standard available cameras exhibit long network delays
in executing move instructions. Thus, real time monitoring and tracking suffer from
the camera delays and frequently miss the object of interest during monitoring or
tracking. Thus, active research is necessary to address network delay problem as
well [5].
CHAPTER 2. DISTRIBUTED COMPUTING AND MONITORING TECHNOLOGIES FOR OLDER PATIENTS
107
2.7.1.5 Accuracy in Measuring Physiological Parameters
Although a number of innovative methods have been proposed for physiological
parameters measurements, for example, automatic heart rate measurement by using
facial image or fingertip image from video cameras, the accuracy of such approach
is not up to the standard yet, while successful examples were only possible in high-
ly limited lab conditions. Besides, when the facial expression changes or the face
moves in the video frames, the accuracy of heart rate estimation decreases signifi-
cantly. To overcome this problem, the use of quality assessment techniques as an
intermediate step between facial detection and relevant feature extraction was re-
cently proposed [274].
2.7.1.6 User-Centred Design Barriers for Older Adults
Resolving barriers to engagement, participation, and spreading of telemontoring
service programs among older populations, is challenging [520]. In [520], authors
described the specific issues concerning technological acceptance, human resources
development, and collaboration with service systems. They discussed possible
strategies and policy implications with regard to human-computer interaction de-
sign considerations for telemonitoring of medical and aging conditions of older
adults, and possible improvements for the access to technology services and addi-
tional training for effective use of the technology. However, it can be increasingly
challenging to find a balance between user requirements for designing a dedicated
technological solution for a specific need of some target patients and for complying
such solution with the Universal Design principles [82] at the same time. In our
view, the concept of Universal Design should not be seen as a synonym to user-
centeredness for designing and applying monitoring technology to older patients, in
other words, ‘one size fits all’ cannot be used in this context. It is important to have
end-users involved in the process of designing, testing, and evaluating the monitor-
ing technologies [62].
2.7.1.7 User Acceptability in Monitoring
As stated in [33], accepting monitoring systems in a person’s home, especially
when it is the home of an older person, is very difficult. This is due to the fact that
people do not want to be monitored for privacy concerns, even if this is necessary
for assisted living. However, if it is possible to provide high data and privacy pro-
tection by other means, then the acceptability can be increased, as discussed in [49].
Therefore, privacy is a crucial consideration for the design and implementation of
monitoring technologies.

VISUAL ANALYSIS OF FACES WITH APPLICATION IN BIOMETRICS, FORENSICS AND HEALTH INFORMATICS
108
2.7.2. FUTURE RESEARCH DIRECTIONS
First, as a prerequisite to further research in this field, a direct involvement of vari-
ous end-users is needed, including healthy, vulnerable and acutely ill older adults,
as well as their family members and health care staff, to ensure the quality and ap-
plicability of monitoring technologies in real life settings. Further research is neces-
sary that can contribute to creation of a systematic guideline for developing bench-
marking datasets for the topics covered in section four. For collecting new datasets,
it would be important to use multiple sensor categories for collecting a wide diver-
sity of measurable parameters and to apply sensor fusion techniques with a purpose
of dealing with uncertainties in detecting individual health-threats. For example,
those datasets should at least contain both physiological parameters and data about
environmental conditions of older adults collected at the same time. More effort
should be put on creating and applying generative machine learning methods on
these datasets, instead of discriminative methods, with the purpose of detecting new
health-threatening events and conditions in older population. Furthermore, the re-
search on machine learning techniques should in principle be done in collaboration
with the involved health care personnel to ensure that the algorithms are properly
understood. For this reason, further research on graphical models and incorporating
them into end user interfaces is expected to be beneficial. For future studies, it is
important to clearly communicate the limitations of the developed systems and
constrains of their evaluation results. Last but not least, further research is needed to
find the balance between privacy constrains of data collection and what data is a
strict requirement for successful monitoring of specific geriatric conditions.
2.8. CONCLUSIONS
This section concludes the article by summarizing the current status and visions for
research and developments in the cross-disciplinary field of monitoring older popu-
lations.
Common data quality standards for patient databases and datasets need to be
developed, because currently little is known about how to organize and store data
from monitored older patients in an efficient way, which is a prerequisite for learn-
ing. Also benchmarking techniques for testing the performance of machine learning
techniques on these datasets are currently lacking. As the number of databases and
datasets with diverse data about older patients at home is very limited but is on the
rise, we are only at the beginning of understanding and analysing these data.
Though, the number of possible applications is high. As long as no single machine
learning technique proved to be substantially superior to others for some given task,
it would be wise to run multiple algorithms whenever possible for objective com-
parison of these learning approaches.
CHAPTER 2. DISTRIBUTED COMPUTING AND MONITORING TECHNOLOGIES FOR OLDER PATIENTS
109
The described technological applications are mainly aimed at older adults, and
as mentioned earlier, it is of utmost importance to understand the enormous hetero-
geneity of the older populations. This heterogeneity has the effect that there is no
such thing as ‘one size fits all’. Also, eHealth technology has to be adaptable to the
needs of the individual older adults, i.e. to his or hers cognitive, physical, emotional
and societal skills as well as the environment. The heterogeneity is further enlarged
by the differences in IT skills and competencies of older adults both today and in
the near future, as some countries already today have a high proportion of IT lit-
erate older adults, while other countries have a majority of older adults with low
educational attainment and IT-illiteracy. A further constraint is that, while the most
remote and rural areas would benefit a lot in using eHealth, these areas are usually
also those with the most poorly developed IT-infrastructure, a fact that emphasizes
the challenges of using eHealth in the health monitoring of older adults. Hopefully,
innovative solutions for the transmission of large data over long distances will soon
come, and thereby would add to some of the solutions to challenges of ageing so-
cieties.
Indeed, the room for innovative solutions in the area of monitoring older adults
at home environment is very large, and a lot of improvements of existing solutions
can be made. Non-intrusiveness and non-invasiveness of sensor technology will
likely be the key factor for successful application. Smaller and cheaper types of
sensors, such as piezoresistive and piezoelectric textile sensors, will have the ad-
vantage for becoming a part of daily life of older adults, because they have a better
potential to be embedded in garments and furniture with prospect of being comfort-
able and reusable. In terms of advances in software solutions, various machine
learning techniques have shown a great potential towards more reliable detection of
health-threatening situations and conditions of older adults. There is a large re-
search potential for the interplay of unsupervised and supervised learning, where
there is only a small amount of labelled data and a large amount of unlabelled data
available, because for many of the patient-at-home scenarios data labelling can be
expensive and time consuming. Furthermore, combining the available knowledge
from the research results of the various cross-disciplinary fields of smart-homes,
telemonitoring, ambient intelligence, ambient assisted living, gerotechnology, ag-
ing-in-place technology, and others, which we have mentioned in this chapter, can
boost the further development of technological monitoring solutions for health care,
long-term care, and welfare systems to better meet the needs of ageing populations.
2.9. REFERENCES
[1] K. Christensen, G. Doblhammer, R. Rau, and J. W. Vaupel, “Ageing popula-
tions: the challenges ahead,” The Lancet, vol. 374, no. 9696, pp. 1196–1208,
Oct. 2009.

VISUAL ANALYSIS OF FACES WITH APPLICATION IN BIOMETRICS, FORENSICS AND HEALTH INFORMATICS
110
[2] European Commission, “Demography Report 2010: Older, more numerous and
diverse Europeans,” Belgium, 2011.
[3] A. Birkeland and G. K. Natvig, “Coping with ageing and failing health: a qual-
itative study among elderly living alone,” Int. J. Nurs. Pract., vol. 15, no. 4,
pp. 257–264, Aug. 2009.
[4] C. Wrzus, M. Hänel, J. Wagner, and F. J. Neyer, “Social network changes and
life events across the life span: A meta-analysis.,” Psychol. Bull., vol. 139,
no. 1, pp. 53–80, 2013.
[5] S. R. Ke, H. Thuc, Y. J. Lee, J. N. Hwang, J. H. Yoo, and K. H. Choi, “A Re-
view on Video-Based Human Activity Recognition,” Computers, vol. 2, no.
2, pp. 88–131, Jun. 2013.
[6] O. P. Popoola and K. Wang, “Video-Based Abnormal Human Behavior
Recognition: A Review,” IEEE Trans. Syst. Man Cybern. Part C Appl. Rev.,
vol. 42, no. 6, pp. 865–878, 2012.
[7] J. J. Sabia, “There’s No Place Like Home: A Hazard Model Analysis of Aging
in Place Among Older Homeowners in the PSID,” Res. Aging, vol. 30, no. 1,
pp. 3–35, Jan. 2008.
[8] M. Rantz, M. Skubic, S. Miller, and J. Krampe, “Using Technology to En-
hance Aging in Place,” in Smart Homes and Health Telematics, S. Helal, S.
Mitra, J. Wong, C. K. Chang, and M. Mokhtari, Eds. Springer Berlin Hei-
delberg, 2008, pp. 169–176.
[9] M. J. Rantz, M. Skubic, S. J. Miller, C. Galambos, G. Alexander, J. Keller, and
M. Popescu, “Sensor Technology to Support Aging in Place,” J. Am. Med.
Dir. Assoc., vol. 14, no. 6, pp. 386–391, Jun. 2013.
[10] Centers for Disease Control and Prevention, “Healthy Places Terminology,”
2009. [Online]. Available:
http://www.cdc.gov/healthyplaces/terminology.htm.
[11] R. Steele, A. Lo, C. Secombe, and Y. K. Wong, “Elderly persons’ perception
and acceptance of using wireless sensor networks to assist healthcare,” Int. J.
Med. Inf., vol. 78, no. 12, pp. 788–801, Dec. 2009.
[12] T. Frits, L.-N. Ana, C. Francesca, and M. Jérôme, OECD Health Policy
Studies Help Wanted? Providing and Paying for Long-Term Care: Provid-
ing and Paying for Long-Term Care. OECD Publishing, 2011.
[13] S. Hinck, “The lived experience of oldest-old rural adults,” Qual. Health
Res., vol. 14, no. 6, pp. 779–791, Jul. 2004.
[14] N. Siddiqi, A. Clegg, and J. Young, “Delirium in care homes,” Rev. Clin.
Gerontol., vol. 19, no. 04, pp. 309–316, 2009.

CHAPTER 2. DISTRIBUTED COMPUTING AND MONITORING TECHNOLOGIES FOR OLDER PATIENTS
111
[15] T. Tamura, “Home geriatric physiological measurements,” Physiol. Meas.,
vol. 33, no. 10, pp. R47–65, Oct. 2012.
[16] A. Alahmadi and B. Soh, “A smart approach towards a mobile e-health mon-
itoring system architecture,” in 2011 International Conference on Research
and Innovation in Information Systems (ICRIIS), 2011, pp. 1 –5.
[17] S. Meystre, “The Current State of Telemonitoring: A Comment on the Liter-
ature,” Telemed. E-Health, vol. 11, no. 1, pp. 63–69, Feb. 2005.
[18] C. N. Scanaill, S. Carew, P. Barralon, N. Noury, D. Lyons, and G. M. Lyons,
“A Review of Approaches to Mobility Telemonitoring of the Elderly in
Their Living Environment,” Ann. Biomed. Eng., vol. 34, no. 4, pp. 547–563,
Apr. 2006.
[19] L. Jiang, D. Liu, and B. Yang, “Smart home research,” in Proceedings of
2004 International Conference on Machine Learning and Cybernetics, 2004,
2004, vol. 2, pp. 659–663 vol.2.
[20] M. E. Morris, B. Adair, K. Miller, E. Ozanne, R. Hansen, A. J. Pearce, N.
Santamaria, L. Viegas, L. Maureen, and C. M. Said, “Smart-Home Technol-
ogies to Assist Older People to Live Well at Home,” J. Aging Sci., vol. 1, no.
1, pp. 1–9, Mar. 2013.
[21] D. Ding, R. A. Cooper, P. F. Pasquina, and L. Fici-Pasquina, “Sensor tech-
nology for smart homes,” Maturitas, vol. 69, no. 2, pp. 131–136, Jun. 2011.
[22] X. H. B. Le, M. Di Mascolo, A. Gouin, and N. Noury, “Health Smart Home
- Towards an assistant tool for automatic assessment of the dependence of
elders,” in 29th Annual International Conference of the IEEE Engineering in
Medicine and Biology Society, 2007. EMBS 2007, 2007, pp. 3806–3809.
[23] F. Grossi, V. Bianchi, G. Matrella, I. De Munari, and P. Ciampolini, “An
Assistive Home Automation and Monitoring System,” in International Con-
ference on Consumer Electronics, 2008. ICCE 2008. Digest of Technical
Papers, 2008, pp. 1–2.
[24] S. Martin, G. Kelly, W. G. Kernohan, B. McCreight, and C. Nugent, “Smart
home technologies for health and social care support,” in Cochrane Data-
base of Systematic Reviews, John Wiley & Sons, Ltd, 2009.
[25] F. Franchimon and M. Brink, “Matching technologies of home automation,
robotics, assistance, geriatric telecare and telemedicine,” Gerontechnology,
vol. 8, no. 2, Apr. 2009.
[26] W. C. Mann, P. Belchior, M. R. Tomita, and B. J. Kemp, “Older adults’ per-
ception and use of PDAs, home automation system, and home health moni-
toring system,” Top. Geriatr. Rehabil., vol. 23, no. 1, pp. 35–46, Mar. 2007.

VISUAL ANALYSIS OF FACES WITH APPLICATION IN BIOMETRICS, FORENSICS AND HEALTH INFORMATICS
112
[27] S. Nourizadeh, C. Deroussent, Y.-Q. Song, and J.-P. Thomesse, “Medical
and Home Automation Sensor Networks for Senior Citizens Telehomecare,”
in IEEE International Conference on Communications Workshops, 2009, pp.
1–5.
[28] P. D. K. Pohl and E. Sikora, “Overview of the Example Domain: Home Au-
tomation,” in Software Product Line Engineering, Springer Berlin Heidel-
berg, 2005, pp. 39–52.
[29] T. Yamazaki, “The ubiquitous home,” Int. J. Smart Home, vol. 1, no. 1, pp.
17–22, 2007.
[30] S. Wang, L. Ji, A. Li, and J. Wu, “Body sensor networks for ubiquitous
healthcare,” J. Control Theory Appl., vol. 9, no. 1, pp. 3–9, Feb. 2011.
[31] S. Sneha and U. Varshney, “Enabling ubiquitous patient monitoring: Model,
decision protocols, opportunities and challenges,” Decis. Support Syst., vol.
46, no. 3, pp. 606–619, Feb. 2009.
[32] D. Sampaio, L. P. Reis, and R. Rodrigues, “A survey on Ambient Intelli-
gence projects,” in 2012 7th Iberian Conference on Information Systems and
Technologies (CISTI), 2012, pp. 1–6.
[33] P. Rashidi and A. Mihailidis, “A Survey on Ambient-Assisted Living Tools
for Older Adults,” IEEE J. Biomed. Health Inform., vol. 17, no. 3, pp. 579–
590, 2013.
[34] F. Sadri, “Ambient intelligence: A survey,” ACM Comput Surv, vol. 43, no.
4, pp. 36:1–36:66, Oct. 2011.
[35] D. J. Cook, J. C. Augusto, and V. R. Jakkula, “Ambient intelligence: Tech-
nologies, applications, and opportunities,” Pervasive Mob. Comput., vol. 5,
no. 4, pp. 277–298, Aug. 2009.
[36] E. Farella, S. O’Modhrain, L. Benini, and B. Riccó, “Gesture Signature for
Ambient Intelligence Applications: A Feasibility Study,” in Pervasive Com-
puting, vol. 3968, K. P. Fishkin, B. Schiele, P. Nixon, and A. Quigley, Eds.
Berlin, Heidelberg: Springer Berlin Heidelberg, 2006, pp. 288–304.
[37] A. Aztiria, G. Farhadi, and H. Aghajan, “User Behavior Shift Detection in
Intelligent Environments,” in Ambient Assisted Living and Home Care, J.
Bravo, R. Hervás, and M. Rodríguez, Eds. Springer Berlin Heidelberg, 2012,
pp. 90–97.
[38] F. G. Miskelly, “Assistive technology in elderly care,” Age Ageing, vol. 30,
no. 6, pp. 455–458, Nov. 2001.
[39] J. Broekens, M. Heerink, and H. Rosendal, “Assistive social robots in elder-
ly care: a review,” Gerontechnology, vol. 8, no. 2, Apr. 2009.

CHAPTER 2. DISTRIBUTED COMPUTING AND MONITORING TECHNOLOGIES FOR OLDER PATIENTS
113
[40] R. K. Megalingam, V. Radhakrishnan, D. C. Jacob, D. K. M. Unnikrishnan,
and A. K. Sudhakaran, “Assistive Technology for Elders: Wireless Intelli-
gent Healthcare Gadget,” in 2011 IEEE Global Humanitarian Technology
Conference (GHTC), 2011, pp. 296–300.
[41] S. Chernbumroong, S. Cang, A. Atkins, and H. Yu, “Elderly activities
recognition and classification for applications in assisted living,” Expert
Syst. Appl., vol. 40, no. 5, pp. 1662–1674, Apr. 2013.
[42] M. H. Vastenburg, T. Visser, M. Vermaas, and D. V. Keyson, “Designing
Acceptable Assisted Living Services for Elderly Users,” in Ambient Intelli-
gence, E. Aarts, J. L. Crowley, B. de Ruyter, H. Gerhäuser, A. Pflaum, J.
Schmidt, and R. Wichert, Eds. Springer Berlin Heidelberg, 2008, pp. 1–12.
[43] E. M. Graybill, P. McMeekin, and J. Wildman, “Can Aging in Place Be Cost
Effective? A Systematic Review,” PLoS ONE, vol. 9, no. 7, p. e102705, Jul.
2014.
[44] European Commission, “Ambient assisted living joint programme,” DOI
Httpwww Aal-Eur. EuprojectsAALCatalogueV3pdflast Checked 3011 2011,
2011.
[45] J. A. Botia, A. Villa, and J. Palma, “Ambient Assisted Living system for in-
home monitoring of healthy independent elders,” Expert Syst. Appl., vol. 39,
no. 9, pp. 8136–8148, Jul. 2012.
[46] M. Kanis, S. Alizadeh, J. Groen, M. Khalili, S. Robben, S. Bakkes, and B.
Kröse, “Ambient Monitoring from an Elderly-Centred Design Perspective:
What, Who and How,” in Ambient Intelligence, D. V. Keyson, M. L. Maher,
N. Streitz, A. Cheok, J. C. Augusto, R. Wichert, G. Englebienne, H.
Aghajan, and B. J. A. Kröse, Eds. Springer Berlin Heidelberg, 2011, pp.
330–334.
[47] S. Beul, L. Klack, K. Kasugai, C. Moellering, C. Roecker, W. Wilkowska,
and M. Ziefle, “Between Innovation and Daily Practice in the Development
of AAL Systems: Learning from the Experience with Today’s Systems,” in
Electronic Healthcare, M. Szomszor and P. Kostkova, Eds. Springer Berlin
Heidelberg, 2012, pp. 111–118.
[48] J. C. Augusto, M. Huch, A. Kameas, J. Maitland, P. J. McCullagh, J. Rob-
erts, A. Sixsmith, and R. Wichert, Handbook of Ambient Assisted Living:
Technology for Healthcare, Rehabilitation and Well-being. IOS Press, 2012.
[49] F. Cardinaux, D. Bhowmik, C. Abhayaratne, and M. S. Hawley, “Video
based technology for ambient assisted living: A review of the literature,” J.
Ambient Intell. Smart Environ., vol. 3, no. 3, pp. 253–269, Jan. 2011.

VISUAL ANALYSIS OF FACES WITH APPLICATION IN BIOMETRICS, FORENSICS AND HEALTH INFORMATICS
114
[50] S. Dang, S. Dimmick, and G. Kelkar, “Evaluating the Evidence Base for the
Use of Home Telehealth Remote Monitoring in Elderly with Heart Failure,”
Telemed. E-Health, vol. 15, no. 8, pp. 783–796, Oct. 2009.
[51] W. Ludwig, K.-H. Wolf, C. Duwenkamp, N. Gusew, N. Hellrung, M.
Marschollek, M. Wagner, and R. Haux, “Health-enabling technologies for
the elderly--an overview of services based on a literature review,” Comput.
Methods Programs Biomed., vol. 106, no. 2, pp. 70–78, May 2012.
[52] H.-P. Klose, M. Braecklein, and S. Nelles, “Telehealth - Home-Based Self-
monitoring of Elderly Chronically Sick or At-Risk Patients,” in World Con-
gress on Medical Physics and Biomedical Engineering, September 7 - 12,
2009, Munich, Germany, vol. 25/7, O. Dössel and W. C. Schlegel, Eds. Ber-
lin, Heidelberg: Springer Berlin Heidelberg, 2009, pp. 931–935.
[53] M. Pieper and K. Stroetmann, “Chapter 9 Patients and EHRs Tele Home
Monitoring Reference Scenario,” in Universal Access in Health Telematics,
C. Stephanidis, Ed. Springer Berlin Heidelberg, 2005, pp. 77–87.
[54] I. Martín-Lesende, E. Orruño, A. Bilbao, I. Vergara, M. C. Cairo, J. C.
Bayón, E. Reviriego, M. I. Romo, J. Larrañaga, J. Asua, R. Abad, and E.
Recalde, “Impact of telemonitoring home care patients with heart failure or
chronic lung disease from primary care on healthcare resource use (the
TELBIL study randomised controlled trial),” BMC Health Serv. Res., vol.
13, no. 1, p. 118, Mar. 2013.
[55] G. Paré, M. Jaana, and C. Sicotte, “Systematic Review of Home Telemoni-
toring for Chronic Diseases: The Evidence Base,” J. Am. Med. Inform. As-
soc., vol. 14, no. 3, pp. 269–277, May 2007.
[56] A. Rehman, M. Mustafa, N. Javaid, U. Qasim, and Z. A. Khan, “Analytical
Survey of Wearable Sensors,” arXiv:1208.2376, Aug. 2012.
[57] S. González-Valenzuela, M. Chen, and V. C. M. Leung, “Mobility Support
for Health Monitoring at Home Using Wearable Sensors,” IEEE Trans. Inf.
Technol. Biomed., vol. 15, no. 4, pp. 539 –549, Jul. 2011.
[58] S. Dagtas, G. Pekhteryev, and Z. Sahinoglu, “Multi-Stage Real Time Health
Monitoring via ZigBee in Smart Homes,” in 21st International Conference
on Advanced Information Networking and Applications Workshops, 2007,
AINAW ’07, 2007, vol. 2, pp. 782 –786.
[59] Y. M. Chi, S. R. Deiss, and G. Cauwenberghs, “Non-contact Low Power
EEG/ECG Electrode for High Density Wearable Biopotential Sensor Net-
works,” in Sixth International Workshop on Wearable and Implantable Body
Sensor Networks, 2009. BSN 2009, 2009, pp. 246 –250.
[60] L. Cheng, V. Shum, G. Kuntze, G. McPhillips, A. Wilson, S. Hailes, D.
Kerwin, and G. Kerwin, “A wearable and flexible Bracelet computer for on-

CHAPTER 2. DISTRIBUTED COMPUTING AND MONITORING TECHNOLOGIES FOR OLDER PATIENTS
115
body sensing,” in 2011 IEEE Consumer Communications and Networking
Conference (CCNC), 2011, pp. 860 –864.
[61] E. Dishman, “Inventing wellness systems for aging in place,” Computer, vol.
37, no. 5, pp. 34–41, May 2004.
[62] G. Rodeschini, “Gerotechnology: A new kind of care for aging? An analysis
of the relationship between older people and technology,” Nurs. Health Sci.,
vol. 13, no. 4, pp. 521–528, 2011.
[63] G. Bestente, M. Bazzani, A. Frisiello, A. Fiume, D. Mosso, and L. M. Perni-
gotti, “DREAM: emergency monitoring system for the elderly,” Gerontech-
nology, vol. 7, no. 2, Apr. 2008.
[64] K. Wild, L. Boise, J. Lundell, and A. Foucek, “Unobtrusive in-home moni-
toring of cognitive and physical health: Reactions and perceptions of older
adults,” J. Appl. Gerontol., vol. 27, no. 2, pp. 181–200, Apr. 2008.
[65] World Health Organisation, “WHO | eHealth,” WHO, 2015. [Online]. Avail-
able: http://www.who.int/topics/ehealth/en/. [Accessed: 16-Sep-2015].
[66] M. F. Cabrera-Umpiérrez, V. Jiménez, M. M. Fernández, J. Salazar, and M.
A. Huerta, “eHealth services for the elderly at home and on the move,” in
IST-Africa, 2010, 2010, pp. 1–6.
[67] Institute of Medicine (US) Committee on Evaluating Clinical Applications
of Telemedicine, Telemedicine: A Guide to Assessing Telecommunications
in Health Care. Washington (DC): National Academies Press (US), 1996.
[68] S. I. Chaudhry, J. A. Mattera, J. P. Curtis, J. A. Spertus, J. Herrin, Z. Lin, C.
O. Phillips, B. V. Hodshon, L. S. Cooper, and H. M. Krumholz, “Telemoni-
toring in Patients with Heart Failure,” N. Engl. J. Med., vol. 363, no. 24, pp.
2301–2309, 2010.
[69] X. H. B. Le, M. Di Mascolo, A. Gouin, and N. Noury, “Health smart home
for elders - a tool for automatic recognition of activities of daily living,” in
30th Annual International Conference of the IEEE Engineering in Medicine
and Biology Society, 2008. EMBS 2008, 2008, pp. 3316–3319.
[70] A. Choukeir, B. Fneish, N. Zaarour, W. Fahs, and M. Ayache, “Health Smart
Home,” Int. Comput. Sci. Issues, vol. 7, no. 6, pp. 126–130, Nov. 2010.
[71] V. Rialle, F. Duchene, N. Noury, L. Bajolle, and J. Demongeot, “Health
‘Smart’ Home: Information Technology for Patients at Home,” Telemed. J.
E Health, vol. 8, no. 4, pp. 395–409, Dec. 2002.
[72] J. O’Donoghue, R. Wichert, and M. Divitini, “Introduction to the thematic
issue: Home-based health and wellness measurement and monitoring,” J.
Ambient Intell. Smart Environ., vol. 4, no. 5, pp. 399–401, Jan. 2012.

VISUAL ANALYSIS OF FACES WITH APPLICATION IN BIOMETRICS, FORENSICS AND HEALTH INFORMATICS
116
[73] A. Vasilakos and W. Pedrycz, Ambient intelligence, wireless networking,
and ubiquitous computing. Artech House, 2006.
[74] C. K. M. Crutzen, “Invisibility and the meaning of ambient intelligence,”
Int. Rev. Inf. Ethics, vol. 6, pp. 52–62, Dec. 2006.
[75] C. B. Fausset, A. J. Kelly, W. A. Rogers, and A. D. Fisk, “Challenges to Ag-
ing in Place: Understanding Home Maintenance Difficulties,” J. Hous. El-
der., vol. 25, no. 2, pp. 125–141, 2011.
[76] Innotraction Solutions Inc., “Continuing Care Health Technologies
Roadmap: Aging in the Right Place,” Alberta Advanced Education and
Technology, Calgary, Canada, 09, Nov. 2009.
[77] J. L. Fozard, Jan Rietsema, Herman Bouma, J. A. M. Graafmans, “Geron-
technology: Creating Enabling Environments for the Challenges and Oppor-
tunities of Aging,” Educ. Gerontol., vol. 26, no. 4, pp. 331–344, 2000.
[78] K. D. Seelman, C. V. Palmer, A. Ortmann, E. Mormer, O. Guthrie, J. Miele,
and J. Brabyn, “Quality-of-life technology for vision and hearing loss [High-
lights of Recent Developments and Current Challenges in Technology],”
IEEE Eng. Med. Biol. Mag., vol. 27, no. 2, pp. 40–55, 2008.
[79] S. Stowe, J. Hopes, and G. Mulley, “Gerotechnology series: 2. Walking
aids,” Eur. Geriatr. Med., vol. 1, no. 2, pp. 122–127, May 2010.
[80] D. Harman and S. Craigie, “Gerotechnology series: Toileting aids,” Eur.
Geriatr. Med., vol. 2, no. 5, pp. 314–318, Oct. 2011.
[81] D. Burdick and S. Kwon, Gerotechnology: Research and Practice in Tech-
nology and Aging. Springer Publishing Company, 2004.
[82] A. M. Cook and J. M. Polgar, Assistive Technologies: Principles and Prac-
tice. Elsevier Health Sciences, 2014.
[83] G. Lushai and T. Cox, “Assisted Living Technology: A market and technol-
ogy review,” Life Sciences-Healthcare and the Institute of Bio-Sensing
Technology, Bristol, UK, Mar. 2012.
[84] D. Lewin, S. Adshead, B. Glennon, B. Williamson, T. Moore, L. Damo-
daran, and P. Hansell, “Assisted Living Technologies for Older and Disabled
People in 2030,” Plum Consulting, London, UK, Mar. 2010.
[85] L. Kalra, X. Zhao, A. J. Soto, and E. Milios, “Detection of daily living activ-
ities using a two-stage Markov model,” J. Ambient Intell. Smart Environ.,
vol. 5, no. 3, pp. 273–285, Jan. 2013.
[86] T. Bosse, M. Hoogendoorn, M. C. A. Klein, and J. Treur, “An ambient agent
model for monitoring and analysing dynamics of complex human behav-
CHAPTER 2. DISTRIBUTED COMPUTING AND MONITORING TECHNOLOGIES FOR OLDER PATIENTS
117
iour,” J. Ambient Intell. Smart Environ., vol. 3, no. 4, pp. 283–303, Jan.
2011.
[87] G. C. Franco, F. Gallay, M. Berenguer, C. Mourrain, and P. Couturier,
“Non-invasive monitoring of the activities of daily living of elderly people at
home - a pilot study of the usage of domestic appliances,” J. Telemed. Tel-
ecare, vol. 14, no. 5, pp. 231–235, 2008.
[88] Y. Sun, “Design of Low Cost Human ADL Signal Acquire System Based on
Wireless Wearable MEMS Sensor,” in Advances in Computer Science, Intel-
ligent System and Environment, vol. 104, D. Jin and S. Lin, Eds. Berlin,
Heidelberg: Springer Berlin Heidelberg, 2011, pp. 703–707.
[89] C.-H. Chang, Y.-L. Lai, and C.-C. Chen, “Implement the RFID Position
Based System of Automatic Tablets Packaging Machine for Patient Safety,”
J. Med. Syst., vol. 36, no. 6, pp. 3463–3471, Dec. 2012.
[90] B. H. Dobkin and A. Dorsch, “The Promise of mHealth Daily Activity Mon-
itoring and Outcome Assessments by Wearable Sensors,” Neurorehabil.
Neural Repair, vol. 25, no. 9, pp. 788–798, Nov. 2011.
[91] M. Luštrek and B. Kaluža, “Fall Detection and Activity Recognition with
Machine Learning,” Informatica, vol. 33, pp. 205–212, 2009.
[92] B. Pogorelc and M. Gams, “Discovering the Chances of Health Problems
and Falls in the Elderly Using Data Mining,” in Advances in Chance Dis-
covery, Y. Ohsawa and A. Abe, Eds. Springer Berlin Heidelberg, 2013, pp.
163–175.
[93] M. Yu, A. Rhuma, S. M. Naqvi, L. Wang, and J. Chambers, “A Posture
Recognition-Based Fall Detection System for Monitoring an Elderly Person
in a Smart Home Environment,” Ieee Trans. Inf. Technol. Biomed., vol. 16,
no. 6, pp. 1274–1286, Nov. 2012.
[94] G. Uslu, O. Altun, and S. Baydere, “A Bayesian approach for indoor human
activity monitoring,” in 2011 11th International Conference on Hybrid Intel-
ligent Systems (HIS), 2011, pp. 324 –327.
[95] N. K. Suryadevara, A. Gaddam, R. K. Rayudu, and S. C. Mukhopadhyay,
“Wireless sensors network based safe home to care elderly people: Behav-
iour detection,” Sens. Actuators Phys., vol. 186, pp. 277–283, Oct. 2012.
[96] A. Arcelus, M. Holtzman, R. Goubran, H. Sveistrup, P. Guitard, and F.
Knoefel, “Analysis of commode grab bar usage for the monitoring of older
adults in the smart home environment.,” Conf. Proc. Annu. Int. Conf. IEEE
Eng. Med. Biol. Soc. IEEE Eng. Med. Biol. Soc. Conf., vol. 2009, pp. 6155–
8, 2009.

VISUAL ANALYSIS OF FACES WITH APPLICATION IN BIOMETRICS, FORENSICS AND HEALTH INFORMATICS
118
[97] R. J. Przybelski and T. A. Shea, “Falls in the geriatric patient,” WMJ Off.
Publ. State Med. Soc. Wis., vol. 100, no. 2, pp. 53–56, 2001.
[98] V. A. Moyer and U.S. Preventive Services Task Force, “Prevention of falls
in community-dwelling older adults: U.S. Preventive Services Task Force
recommendation statement,” Ann. Intern. Med., vol. 157, no. 3, pp. 197–204,
Aug. 2012.
[99] J. K. Aggarwal and M. S. Ryoo, “Human activity analysis: A review,” ACM
Comput Surv, vol. 43, no. 3, pp. 16:1–16:43, Apr. 2011.
[100] A. J. Bharucha, A. J. London, D. Barnard, H. Wactlar, M. A. Dew, and C. F.
Reynolds 3rd, “Ethical considerations in the conduct of electronic surveil-
lance research,” J. Law Med. Ethics J. Am. Soc. Law Med. Ethics, vol. 34,
no. 3, pp. 611–619, 482, 2006.
[101] M.-Y. Chen, A. Hauptmann, A. Bharucha, H. Wactlar, and Y. Yang, “Hu-
man Activity Analysis for Geriatric Care in Nursing Homes,” in The Era of
Interactive Media, Springer New York, 2013, pp. 53–61.
[102] S. Bonhomme, E. Campo, D. Esteve, and J. Guennec, “An extended
PROSAFE platform for elderly monitoring at home.,” Conf. Proc. Annu. Int.
Conf. IEEE Eng. Med. Biol. Soc. IEEE Eng. Med. Biol. Soc. Conf., vol.
2007, pp. 4056–9, 2007.
[103] J. M. Corchado, J. Bajo, D. I. Tapia, and A. Abraham, “Using Heterogene-
ous Wireless Sensor Networks in a Telemonitoring System for Healthcare,”
IEEE Trans. Inf. Technol. Biomed., vol. 14, no. 2, pp. 234 –240, Mar. 2010.
[104] M. Hägglund, I. Scandurra, and S. Koch, “Scenarios to capture work pro-
cesses in shared homecare—From analysis to application,” Int. J. Med. Inf.,
vol. 79, no. 6, pp. e126–e134, Jun. 2010.
[105] Y. Liuqing, “Video Monitoring Communication System Design Based on
Wireless Mesh Networks,” in 2012 International Conference on Computer
Science and Electronics Engineering (ICCSEE), 2012, vol. 3, pp. 503 –507.
[106] H. Kim, B. Jarochowski, and D. Ryu, “A proposal for a home-based health
monitoring system for the elderly or disabled,” in Computers Helping Peo-
ple with Special Needs, Proceedings, vol. 4061, K. Miesenberger, J. Klaus,
W. Zagler, and A. Karshmer, Eds. 2006, pp. 473–479.
[107] L. S. Snogdal, L. Folkestad, R. Elsborg, L. S. Remvig, H. Beck-Nielsen, B.
Thorsteinsson, P. Jennum, M. Gjerstad, and C. B. Juhl, “Detection of hypo-
glycemia associated EEG changes during sleep in type 1 diabetes mellitus,”
Diabetes Res. Clin. Pract., vol. 98, no. 1, pp. 91–97, Oct. 2012.
[108] M. Kozlovszky, J. Sicz-Mesziár, J. Ferenczi, J. Márton, G. Windisch, V.
Kozlovszky, P. Kotcauer, A. Boruzs, P. Bogdanov, Z. Meixner, K.

CHAPTER 2. DISTRIBUTED COMPUTING AND MONITORING TECHNOLOGIES FOR OLDER PATIENTS
119
Karóczkai, and S. Ács, “Combined Health Monitoring and Emergency Man-
agement through Android Based Mobile Device for Elderly People,” in
Wireless Mobile Communication and Healthcare, vol. 83, K. S. Nikita, J. C.
Lin, D. I. Fotiadis, and M.-T. Arredondo Waldmeyer, Eds. Berlin, Heidel-
berg: Springer Berlin Heidelberg, 2012, pp. 268–274.
[109] Y.-C. Huang, C.-H. Lu, T.-H. Yang, L.-C. Fu, and C.-Y. Wang, “Context-
Aware Personal Diet Suggestion System,” in Aging Friendly Technology for
Health and Independence, Y. Lee, Z. Z. Bien, M. Mokhtari, J. T. Kim, M.
Park, J. Kim, H. Lee, and I. Khalil, Eds. Springer Berlin Heidelberg, 2010,
pp. 76–84.
[110] C. Pagliari, D. Sloan, P. Gregor, F. Sullivan, D. Detmer, J. P. Kahan, W.
Oortwijn, and S. MacGillivray, “What is eHealth (4): a scoping exercise to
map the field,” J. Med. Internet Res., vol. 7, no. 1, p. e9, 2005.
[111] U.S. National Library of Medicine, “MeSH Browser - 2015,” Medical Sub-
ject Headings, 2015. [Online]. Available:
https://www.nlm.nih.gov/mesh/MBrowser.html. [Accessed: 16-Sep-2015].
[112] World Health Organisation, “WHO | E-Health,” WHO, 2015. [Online].
Available: http://www.who.int/trade/glossary/story021/en/. [Accessed: 16-
Sep-2015].
[113] G. Eysenbach, “What is e-health?,” J. Med. Internet Res., vol. 3, no. 2, p.
e20, Jun. 2001.
[114] Y. Zhang, “Real-Time Development of Patient-Specific Alarm Algorithms
for Critical Care,” in 29th Annual International Conference of the IEEE En-
gineering in Medicine and Biology Society, 2007. EMBS 2007, 2007, pp.
4351 –4354.
[115] S. Watson, R. R. Wenzel, C. di Matteo, B. Meier, and T. F. Lüscher, “Accu-
racy of a New Wrist Cuff Oscillometric Blood Pressure Device Comparisons
with Intraarterial and Mercury Manometer Measurements,” Am. J. Hyper-
tens., vol. 11, no. 12, pp. 1469–1474, Dec. 1998.
[116] Y. Lin, “A Natural Contact Sensor Paradigm for Nonintrusive and Real-
Time Sensing of Biosignals in Human-Machine Interactions,” IEEE Sens. J.,
vol. 11, no. 3, pp. 522 –529, Mar. 2011.
[117] W. C. Mann, T. Marchant, M. Tomita, L. Fraas, and K. Stanton, “Elder ac-
ceptance of health monitoring devices in the home.,” Care Manag. J. J. Case
Manag. J. Long Term Home Health Care, vol. 3, no. 2, pp. 91–8, Winter
2001 2002.
[118] Z. Mapundu, T. Simonnet, and J. S. van der Walt, “A videoconferencing tool
acting as a home-based healthcare monitoring robot for elderly patients.,”
Stud. Health Technol. Inform., vol. 182, pp. 180–8, 2012.

VISUAL ANALYSIS OF FACES WITH APPLICATION IN BIOMETRICS, FORENSICS AND HEALTH INFORMATICS
120
[119] V. Stanford, “Using pervasive computing to deliver elder care,” IEEE Per-
vasive Comput., vol. 1, no. 1, pp. 10–13, 2002.
[120] “WHO | Knowledge translation framework for ageing and health,” WHO.
[Online]. Available:
http://www.who.int/ageing/publications/knowledge_translation/en/index.htm
l. [Accessed: 22-Nov-2012].
[121] M. J. Eskola, K. C. Nikus, L.-M. Voipio-Pulkki, H. Huhtala, T. Parviainen,
J. Lund, T. Ilva, and P. Porela, “Comparative accuracy of manual versus
computerized electrocardiographic measurement of J-, ST- and T-wave de-
viations in patients with acute coronary syndrome,” Am. J. Cardiol., vol. 96,
no. 11, pp. 1584–1588, Dec. 2005.
[122] A. S. Crandall and D. J. Cook, “Smart Home in a Box: A Large Scale Smart
Home Deployment,” in Workshop Proceedings of the 8th International Con-
ference on Intelligent Environments, Guanajuato, México, June 26-29, 2012,
2012, vol. 13, pp. 169–178.
[123] D. J. Cook, A. S. Crandall, B. L. Thomas, and N. C. Krishnan, “CASAS: A
Smart Home in a Box,” Computer, vol. 46, no. 7, pp. 62–69, 2013.
[124] D. Cook, M. Schmitter-Edgecombe, A. Crandall, C. Sanders, and B. Thom-
as, “Collecting and disseminating smart home sensor data in the CASAS
project,” in Proc. of CHI09 Workshop on Developing Shared Home Behav-
ior Datasets to Advance HCI and Ubiquitous Computing Research, 2009.
[125] P. Rashidi and D. J. Cook, “Keeping the Resident in the Loop: Adapting the
Smart Home to the User,” IEEE Trans. Syst. Man Cybern. Part Syst. Hum.,
vol. 39, no. 5, pp. 949–959, Sep. 2009.
[126] D. Cook, A. Crandall, H. Ghasemzadeh, L. Holder, M. Schmitter-
Edgecombe, B. Shirazi, and M. Taylor, “WSU CASAS Datasets,” WSU
CASAS, 2012. [Online]. Available: http://ailab.wsu.edu/casas/datasets/. [Ac-
cessed: 01-Oct-2013].
[127] “Home | Elite Care | Senior Living Tigard, Milwaukie & Vancouver,” Elite
Care. [Online]. Available: http://www.elitecare.com/. [Accessed: 23-Aug-
2013].
[128] I. A. Essa, “Aware Home: Sensing, Interpretation, and Recognition of
Everday Activities,” 29-Mar-2005. [Online]. Available:
https://smartech.gatech.edu/handle/1853/11279. [Accessed: 23-Aug-2013].
[129] S. K. Das and D. J. Cook, “Health Monitoring in an Agent-Based Smart
Home,” in In Proceedings of the International Conference on Smart Homes
and Health Telematics (ICOST, 2004, pp. 3–14.

CHAPTER 2. DISTRIBUTED COMPUTING AND MONITORING TECHNOLOGIES FOR OLDER PATIENTS
121
[130] G. M. Youngblood, L. B. Holder, and D. J. Cook, “Managing Adaptive Ver-
satile Environments,” in Third IEEE International Conference on Pervasive
Computing and Communications, 2005. PerCom 2005, 2005, pp. 351–360.
[131] R. Kadouche, H. Pigot, B. Abdulrazak, and S. Giroux, “User’s Behavior
Classification Model for Smart Houses Occupant Prediction,” in Activity
Recognition in Pervasive Intelligent Environments, L. Chen, C. D. Nugent,
J. Biswas, and J. Hoey, Eds. Atlantis Press, 2011, pp. 149–164.
[132] S. S. Intille, K. Larson, E. M. Tapia, J. S. Beaudin, P. Kaushik, J. Nawyn,
and R. Rockinson, “Using a Live-In Laboratory for Ubiquitous Computing
Research,” in Pervasive Computing, K. P. Fishkin, B. Schiele, P. Nixon, and
A. Quigley, Eds. Springer Berlin Heidelberg, 2006, pp. 349–365.
[133] H. Duman, H. Hagras, and V. Callaghan, “Adding Intelligence to Ubiquitous
Computing Environments,” in Computational Intelligence for Agent-based
Systems, P. R. S. T. Lee and P. V. Loia, Eds. Springer Berlin Heidelberg,
2007, pp. 61–102.
[134] A. Fleury, N. Noury, M. Vacher, H. Glasson, and J. F. Seri, “Sound and
speech detection and classification in a Health Smart Home,” Conf. Proc.
Annu. Int. Conf. IEEE Eng. Med. Biol. Soc. IEEE Eng. Med. Biol. Soc.
Conf., vol. 2008, pp. 4644–4647, 2008.
[135] S. Coradeschi, A. Cesta, G. Cortellessa, L. Coraci, C. Galindo, J. Gonzalez,
L. Karlsson, A. Forsberg, S. Frennert, F. Furfari, A. Loutfi, A. Orlandini, F.
Palumbo, F. Pecora, S. von Rump, A. Štimec, J. Ullberg, and B. Ötslund,
“GiraffPlus: A System for Monitoring Activities and Physiological Parame-
ters and Promoting Social Interaction for Elderly,” in Human-Computer Sys-
tems Interaction: Backgrounds and Applications 3, Z. S. Hippe, J. L. Kuli-
kowski, T. Mroczek, and J. Wtorek, Eds. Springer International Publishing,
2014, pp. 261–271.
[136] M. Chan, E. Campo, and D. Esteve, “PROSAFE, a Multisensory Remote
Monitoring System for the Elderly or the Handicapped,” Indep. Living Pers.
Disabil. Elder. People, pp. 89–95, 2003.
[137] R. Orpwood, C. Gibbs, T. Adlam, R. Faulkner, and D. Meegahawatte, “The
Gloucester Smart House for People with Dementia — User-Interface As-
pects,” in Designing a More Inclusive World, S. K. MA, J. C. M. , MIEE
CEng, P. L. BA, and P. R. M. CEng, Eds. Springer London, 2004, pp. 237–
245.
[138] S. Bjørneby, P. Topo, S. Cahill, E. Begley, K. Jones, I. Hagen, J. Mac-
ijauskiene, and T. Holthe, “Ethical considerations in the ENABLE project,”
Dementia, vol. 3, no. 3, pp. 297–312, 2004.

VISUAL ANALYSIS OF FACES WITH APPLICATION IN BIOMETRICS, FORENSICS AND HEALTH INFORMATICS
122
[139] L. Klack, C. Möllering, M. Ziefle, and T. Schmitz-Rode, “Future Care Floor:
A Sensitive Floor for Movement Monitoring and Fall Detection in Home
Environments,” in Wireless Mobile Communication and Healthcare, J. C.
Lin and K. S. Nikita, Eds. Springer Berlin Heidelberg, 2011, pp. 211–218.
[140] “The Active and Assisted Living Joint Programme (AAL JP),” Digital
Agenda for Europe. [Online]. Available: ec.europa.eu//digital-
agenda/en/active-and-assisted-living-joint-programme-aal-jp. [Accessed: 02-
Oct-2014].
[141] T. Tamura, A. Kawarada, M. Nambu, A. Tsukada, K. Sasaki, and K.-I.
Yamakoshi, “E-Healthcare at an Experimental Welfare Techno House in Ja-
pan,” Open Med. Inform. J., vol. 1, pp. 1–7, Jul. 2007.
[142] T. Yamazaki, “Ubiquitous home: real-life testbed for home context-aware
service,” in First International Conference on Testbeds and Research Infra-
structures for the Development of Networks and Communities, 2005. Tri-
dentcom 2005, 2005, pp. 54–59.
[143] Y. Nishida, T. Hori, T. Suehiro, and S. Hirai, “Sensorized environment for
self-communication based on observation of daily human behavior,” in 2000
IEEE/RSJ International Conference on Intelligent Robots and Systems,
2000. (IROS 2000). Proceedings, 2000, vol. 2, pp. 1364–1372 vol.2.
[144] J. Kim, H. Choi, H. Wang, N. Agoulmine, M. J. Deerv, and J. W.-K. Hong,
“POSTECH’s U-Health Smart Home for elderly monitoring and support,” in
World of Wireless Mobile and Multimedia Networks (WoWMoM), 2010
IEEE International Symposium on a, 2010, pp. 1 –6.
[145] L. S. Wilson, R. W. Gill, I. F. Sharp, J. Joseph, S. A. Heitmann, C. F. Chen,
M. J. Dadd, A. Kajan, A. F. Collings, and M. Gunaratnam, “Building the
Hospital Without Walls--a CSIRO home telecare initiative,” Telemed. J. Off.
J. Am. Telemed. Assoc., vol. 6, no. 2, pp. 275–281, 2000.
[146] Q. Zhang, M. Karunanithi, R. Rana, and J. Liu, “Determination of Activities
of Daily Living of independent living older people using environmentally
placed sensors,” Conf. Proc. Annu. Int. Conf. IEEE Eng. Med. Biol. Soc.
IEEE Eng. Med. Biol. Soc. Annu. Conf., vol. 2013, pp. 7044–7047, 2013.
[147] J. Soar, A. Livingstone, and S.-Y. Wang, “A Case Study of an Ambient Liv-
ing and Wellness Management Health Care Model in Australia,” in Ambient
Assistive Health and Wellness Management in the Heart of the City, M.
Mokhtari, I. Khalil, J. Bauchet, D. Zhang, and C. Nugent, Eds. Springer Ber-
lin Heidelberg, 2009, pp. 48–56.
[148] G. D. Abowd and E. D. Mynatt, “Designing for the Human Experience in
Smart Environments,” in Smart Environments, D. J. Cook and S. K. Das,
Eds. John Wiley & Sons, Inc., 2005, pp. 151–174.
CHAPTER 2. DISTRIBUTED COMPUTING AND MONITORING TECHNOLOGIES FOR OLDER PATIENTS
123
[149] N. Noury, G. Virone, and T. Creuzet, “The health integrated smart home
information system (HIS2): rules based system for the localization of a hu-
man,” in Microtechnologies in Medicine amp; Biology 2nd Annual Interna-
tional IEEE-EMB Special Topic Conference on, 2002, pp. 318–321.
[150] S. Helal, W. Mann, H. El-Zabadani, J. King, Y. Kaddoura, and E. Jansen,
“The Gator Tech Smart House: a programmable pervasive space,” Comput-
er, vol. 38, no. 3, pp. 50–60, Mar. 2005.
[151] V. Callaghan, M. Colley, H. Hagras, J. Chin, F. Doctor, and G. Clarke,
“Programming iSpaces — A Tale of Two Paradigms,” in Intelligent Spaces,
A. S. Bs. MTech,, CPhys MInstP and S. W. M. , CEng MIEE, Eds. Springer
London, 2006, pp. 389–421.
[152] Intelligent Inhabited Environments Group, “iSpace,” Intelligent Inhabited
Environments Group, Department of Computer Science, University of Essex,
United Kingdom, 2010. [Online]. Available:
http://cswww.essex.ac.uk/Research/iieg/idorm2/index.htm. [Accessed: 08-
Aug-2014].
[153] J. Iversen, “CareLab,” Try More Than 15 New Welfare Technologies, 2014.
[Online]. Available: http://www.dti.dk/try-more-than-15-new-welfare-
technologies/34367?cms.query=carelab. [Accessed: 12-Sep-2014].
[154] W. C. M. Machiko R. Tomita, “Use of Currently Available Smart Home
Technology by Frail Elders: Process and Outcomes,” Top. Geriatr. Rehabil.,
vol. 23, no. 1, pp. 24–34, 2006.
[155] OHSU, “ORCATECH TECHNOLOGIES,” Oregon Health & Science Uni-
versity, 2014. [Online]. Available: http://www.ohsu.edu/xd/research/centers-
institutes/orcatech/tech/index.cfm. [Accessed: 06-Sep-2014].
[156] F. Palumbo, J. Ullberg, A. Štimec, F. Furfari, L. Karlsson, and S. Corades-
chi, “Sensor Network Infrastructure for a Home Care Monitoring System,”
Sensors, vol. 14, no. 3, pp. 3833–3860, Feb. 2014.
[157] M. Tomita, L. S., R. Sridhar, and B. J. Naughton M., “Smart Home with
Healthcare Technologies for Community-Dwelling Older Adults,” in Smart
Home Systems, M. A., Ed. InTech, 2010.
[158] B. Reeder, E. Meyer, A. Lazar, S. Chaudhuri, H. J. Thompson, and G.
Demiris, “Framing the evidence for health smart homes and home-based
consumer health technologies as a public health intervention for independent
aging: A systematic review,” Int. J. Med. Inf., vol. 82, no. 7, pp. 565–579,
Jul. 2013.
[159] H. V. Remoortel, S. Giavedoni, Y. Raste, C. Burtin, Z. Louvaris, E. Gimeno-
Santos, D. Langer, A. Glendenning, N. S. Hopkinson, I. Vogiatzis, B. T. Pe-
terson, F. Wilson, B. Mann, R. Rabinovich, M. A. Puhan, T. Troosters, and
VISUAL ANALYSIS OF FACES WITH APPLICATION IN BIOMETRICS, FORENSICS AND HEALTH INFORMATICS
124
$author firstName $author.lastName, “Validity of activity monitors in health
and chronic disease: a systematic review,” Int. J. Behav. Nutr. Phys. Act.,
vol. 9, no. 1, p. 84, Jul. 2012.
[160] M. J. Kim, M. W. Oh, M. E. Cho, H. Lee, and J. T. Kim, “A Critical Review
of User Studies on Healthy Smart Homes,” Indoor Built Environ., Dec.
2012.
[161] G. Demiris and B. K. Hensel, “Technologies for an aging society: a system-
atic review of ‘smart home’ applications,” Yearb. Med. Inform., pp. 33–40,
2008.
[162] T. Tamura, “Home geriatric physiological measurements,” Physiol. Meas.,
vol. 33, no. 10, pp. R47–R65, Oct. 2012.
[163] S. Patel, H. Park, P. Bonato, L. Chan, and M. Rodgers, “A review of weara-
ble sensors and systems with application in rehabilitation,” J. NeuroEngi-
neering Rehabil., vol. 9, no. 1, p. 21, Apr. 2012.
[164] S. C. Mukhopadhyay, “Wearable Sensors for Human Activity Monitoring: A
Review,” IEEE Sens. J., vol. 15, no. 3, pp. 1321–1330, Mar. 2015.
[165] A. Cheung, F. H. P. van Velden, V. Lagerburg, and N. Minderman, “The
organizational and clinical impact of integrating bedside equipment to an in-
formation system: A systematic literature review of patient data management
systems (PDMS),” Int. J. Med. Inf., vol. 84, no. 3, pp. 155–165, Mar. 2015.
[166] A. Ali, K. Sundaraj, B. Ahmad, N. Ahamed, and A. Islam, “Gait disorder
rehabilitation using vision and non-vision based sensors: a systematic re-
view,” Bosn. J. Basic Med. Sci. Udruženje Basičnih Med. Znan. Assoc. Basic
Med. Sci., vol. 12, no. 3, pp. 193–202, Aug. 2012.
[167] R. Bemelmans, G. J. Gelderblom, P. Jonker, and L. Witte, “The Potential of
Socially Assistive Robotics in Care for Elderly, a Systematic Review,” in
Human-Robot Personal Relationships, vol. 59, M. H. Lamers and F. J. Ver-
beek, Eds. Berlin, Heidelberg: Springer Berlin Heidelberg, 2011, pp. 83–89.
[168] W.-L. Chang, S. Sabanovic, and L. Huber, “Use of seal-like robot PARO in
sensory group therapy for older adults with dementia,” in 2013 8th
ACM/IEEE International Conference on Human-Robot Interaction (HRI),
2013, pp. 101–102.
[169] T. Nakashima, G. Fukutome, and N. Ishii, “Healing Effects of Pet Robots at
an Elderly-Care Facility,” in 2010 IEEE/ACIS 9th International Conference
on Computer and Information Science (ICIS), 2010, pp. 407–412.
[170] D. Naranjo-Hernandez, L. M. Roa, J. Reina-Tosina, and M. A. Estudillo-
Valderrama, “SoM: A Smart Sensor for Human Activity Monitoring and As-

CHAPTER 2. DISTRIBUTED COMPUTING AND MONITORING TECHNOLOGIES FOR OLDER PATIENTS
125
sisted Healthy Ageing,” IEEE Trans. Biomed. Eng., vol. 59, no. 11, pp. 3177
–3184, Nov. 2012.
[171] P. Y. Takahashi, G. J. Hanson, J. L. Pecina, R. J. Stroebel, R. Chaudhry, N.
D. Shah, and J. M. Naessens, “A randomized controlled trial of telemonitor-
ing in older adults with multiple chronic conditions: the Tele-ERA study,”
BMC Health Serv. Res., vol. 10, p. 255, Sep. 2010.
[172] H. G. Kang, D. F. Mahoney, H. Hoenig, V. A. Hirth, P. Bonato, I. Hajjar,
and L. A. Lipsitz, “In situ monitoring of health in older adults: technologies
and issues,” J. Am. Geriatr. Soc., vol. 58, no. 8, pp. 1579–1586, Aug. 2010.
[173] F. Pitta, T. Troosters, M. A. Spruit, M. Decramer, and R. Gosselink, “Activi-
ty Monitoring for Assessment of Physical Activities in Daily Life in Patients
With Chronic Obstructive Pulmonary Disease,” Arch. Phys. Med. Rehabil.,
vol. 86, no. 10, pp. 1979–1985, Oct. 2005.
[174] M. W. Raad and L. T. Yang, “A ubiquitous smart home for elderly,” in 4th
IET International Conference on Advances in Medical, Signal and Infor-
mation Processing, 2008. MEDSIP 2008, 2008, pp. 1–4.
[175] G. Segrelles Calvo, C. Gómez-Suárez, J. B. Soriano, E. Zamora, A. Gónza-
lez-Gamarra, M. González-Béjar, A. Jordán, E. Tadeo, A. Sebastián, G. Fer-
nández, and J. Ancochea, “A home telehealth program for patients with se-
vere COPD: The PROMETE study,” Respir. Med., vol. 108, no. 3, pp. 453–
462, Mar. 2014.
[176] J. G. Ouslander and R. A. Berenson, “Reducing Unnecessary Hospitaliza-
tions of Nursing Home Residents,” N. Engl. J. Med., vol. 365, no. 13, pp.
1165–1167, 2011.
[177] A. Morley, John E Sinclair, B. J. Vellas, and M. S. J. Pathy, Pathy’s princi-
ples and practice of geriatric medicine, 5th ed., 2 vols. Chichester, West
Sussex, UK; Hoboken, NJ: Wiley-Blackwell, 2012.
[178] S. H. van Oostrom, H. S. J. Picavet, B. M. van Gelder, L. C. Lemmens, N.
Hoeymans, C. E. van Dijk, R. A. Verheij, F. G. Schellevis, and C. A. Baan,
“Multimorbidity and comorbidity in the Dutch population – data from gen-
eral practices,” BMC Public Health, vol. 12, no. 1, p. 715, Aug. 2012.
[179] K. Barnett, S. W. Mercer, M. Norbury, G. Watt, S. Wyke, and B. Guthrie,
“Epidemiology of multimorbidity and implications for health care, research,
and medical education: a cross-sectional study,” The Lancet, vol. 380, no.
9836, pp. 37–43, Jul. 2012.
[180] C. C. Sieber, “[The elderly patient - who is that?],” Internist, vol. 48, no. 11,
pp. 1190, 1192–1194, Nov. 2007.
[181] J. Y. Andrew Clegg, “Frailty in elderly people.,” Lancet, 2013.

VISUAL ANALYSIS OF FACES WITH APPLICATION IN BIOMETRICS, FORENSICS AND HEALTH INFORMATICS
126
[182] L. P. Fried, C. M. Tangen, J. Walston, A. B. Newman, C. Hirsch, J. Gott-
diener, T. Seeman, R. Tracy, W. J. Kop, G. Burke, and M. A. McBurnie,
“Frailty in older adults: evidence for a phenotype.,” J. Gerontol. A. Biol. Sci.
Med. Sci., vol. 56, no. 3, pp. M146–56, 2001.
[183] J. Collerton, C. Martin-Ruiz, K. Davies, C. M. Hilkens, J. Isaacs, C. Kolen-
da, C. Parker, M. Dunn, M. Catt, C. Jagger, T. von Zglinicki, and T. B. L.
Kirkwood, “Frailty and the role of inflammation, immunosenescence and
cellular ageing in the very old: Cross-sectional findings from the Newcastle
85+ Study,” Mech. Ageing Dev., vol. 133, no. 6, pp. 456–466, Jun. 2012.
[184] G. Kolb, K. Andersen-Ranberg, A. Cruz-Jentoft, D. O’Neill, E. Topinkova,
and J. P. Michel, “Geriatric care in Europe – the EUGMS Survey part I:
Belgium, Czech Republic, Denmark, Germany, Ireland, Spain, Switzerland,
United Kingdom,” Eur. Geriatr. Med., vol. 2, no. 5, pp. 290–295, Oct. 2011.
[185] “Geriatric medicine | Royal College of Physicians,” 2013. [Online]. Availa-
ble: https://www.rcplondon.ac.uk/geriatric-medicine. [Accessed: 12-May-
2014].
[186] W. S. Aronow, “Silent MI. Prevalence and prognosis in older patients diag-
nosed by routine electrocardiograms,” Geriatrics, vol. 58, no. 1, pp. 24–26,
36–38, 40, Jan. 2003.
[187] J. C. Johnson, R. Jayadevappa, P. D. Baccash, and L. Taylor, “Nonspecific
presentation of pneumonia in hospitalized older people: age effect or demen-
tia?,” J. Am. Geriatr. Soc., vol. 48, no. 10, pp. 1316–1320, Oct. 2000.
[188] P. Berman, D. B. Hogan, and R. A. Fox, “The Atypical Presentation of In-
fection in Old Age,” Age Ageing, vol. 16, no. 4, pp. 201–207, Jul. 1987.
[189] L. M. Verbrugge and A. M. Jette, “The Disablement Process,” Soc. Sci.
Med. 1982, vol. 38, no. 1, pp. 1–14, Jan. 1994.
[190] T. M. Gill, T. E. Murphy, E. A. Gahbauer, and H. G. Allore, “The Course of
Disability Before and After a Serious Fall Injury,” JAMA Intern. Med., vol.
173, no. 19, pp. 1780–1786, Oct. 2013.
[191] A. C. Scheffer, M. J. Schuurmans, N. van Dijk, T. van der Hooft, and S. E.
de Rooij, “Fear of falling: measurement strategy, prevalence, risk factors and
consequences among older persons,” Age Ageing, vol. 37, no. 1, pp. 19–24,
Jan. 2008.
[192] J. A. Stevens, “Falls among older adults—risk factors and prevention strate-
gies,” J. Safety Res., vol. 36, no. 4, pp. 409–411, 2005.
[193] World Health Organisation, “Global Report on Falls Prevention in Older
Age,” France, Mar. 2007.
CHAPTER 2. DISTRIBUTED COMPUTING AND MONITORING TECHNOLOGIES FOR OLDER PATIENTS
127
[194] WHO, “WHO | Falls,” World Health Organisation, Oct-2012. [Online].
Available: http://www.who.int/mediacentre/factsheets/fs344/en/. [Accessed:
18-Apr-2014].
[195] A. A. Zecevic, A. W. Salmoni, M. Speechley, and A. A. Vandervoort, “De-
fining a Fall and Reasons for Falling: Comparisons Among the Views of
Seniors, Health Care Providers, and the Research Literature,” The Gerontol-
ogist, vol. 46, no. 3, pp. 367–376, Jun. 2006.
[196] N. Samaras, T. Chevalley, D. Samaras, and G. Gold, “Older Patients in the
Emergency Department: A Review,” Ann. Emerg. Med., vol. 56, no. 3, pp.
261–269, Sep. 2010.
[197] T. Masud and R. O. Morris, “Epidemiology of falls,” Age Ageing, vol. 30,
no. suppl 4, pp. 3–7, Nov. 2001.
[198] S. Deandrea, E. Lucenteforte, F. Bravi, R. Foschi, C. La Vecchia, and E.
Negri, “Risk Factors for Falls in Community-dwelling Older People: A Sys-
tematic Review and Meta-analysis,” Epidemiology, vol. 21, no. 5, pp. 658–
668, Sep. 2010.
[199] R. Igual, C. Medrano, and I. Plaza, “Challenges, issues and trends in fall de-
tection systems,” Biomed. Eng. OnLine, vol. 12, p. 66, Jul. 2013.
[200] S. K. Inouye, “Delirium in Older Persons,” N. Engl. J. Med., vol. 354, no.
11, pp. 1157–1165, 2006.
[201] J. Freibrodt, M. Hüppe, B. Sedemund-Adib, H. Sievers, and C. Schmidtke,
“Effect of postoperative delirium on quality of life and daily activities 6
month after elective cardiac surgery in the elderly,” Thorac. Cardiovasc.
Surg., vol. 61, no. S 01, Jan. 2013.
[202] C. M. Waszynski, “How to try this: detecting delirium,” Am. J. Nurs., vol.
107, no. 12, pp. 50–59; quiz 59–60, Dec. 2007.
[203] G. Isaia, M. A. Astengo, V. Tibaldi, M. Zanocchi, B. Bardelli, R. Obialero,
A. Tizzani, M. Bo, C. Moiraghi, M. Molaschi, and N. A. Ricauda, “Delirium
in elderly home-treated patients: a prospective study with 6-month follow-
up,” AGE, vol. 31, no. 2, pp. 109–117, Jun. 2009.
[204] G. Cipriani, C. Lucetti, A. Nuti, and S. Danti, “Wandering and dementia,”
Psychogeriatrics, vol. 14, no. 2, pp. 135–142, Jun. 2014.
[205] N. K. Vuong, S. Chan, and C. T. Lau, “Automated detection of wandering
patterns in people with dementia,” Gerontechnology, vol. 12, no. 3, pp. 127–
147, 2014.
[206] Q. Lin, D. Zhang, L. Chen, H. Ni, and X. Zhou, “Managing Elders’ Wander-
ing Behavior Using Sensors-based Solutions: A Survey,” Int. J. Gerontol.,
vol. 8, no. 2, pp. 49–55, Jun. 2014.

VISUAL ANALYSIS OF FACES WITH APPLICATION IN BIOMETRICS, FORENSICS AND HEALTH INFORMATICS
128
[207] D. L. Algase, D. H. Moore, C. Vandeweerd, and D. J. Gavin-Dreschnack,
“Mapping the maze of terms and definitions in dementia-related wandering,”
Aging Ment. Health, vol. 11, no. 6, pp. 686–698, Nov. 2007.
[208] A. J. Cruz-Jentoft, J. P. Baeyens, J. M. Bauer, Y. Boirie, T. Cederholm, F.
Landi, F. C. Martin, J.-P. Michel, Y. Rolland, S. M. Schneider, E. Topinko-
vá, M. Vandewoude, and M. Zamboni, “Sarcopenia: European consensus on
definition and diagnosis Report of the European Working Group on Sarco-
penia in Older People,” Age Ageing, vol. 39, no. 4, pp. 412–423, Jul. 2010.
[209] S. Stenholm, T. B. Harris, T. Rantanen, M. Visser, S. B. Kritchevsky, and L.
Ferrucci, “Sarcopenic obesity - definition, etiology and consequences,”
Curr. Opin. Clin. Nutr. Metab. Care, vol. 11, no. 6, pp. 693–700, Nov. 2008.
[210] M. Hägg, B. Houston, S. Elmståhl, H. Ekström, and C. Wann-Hansson,
“Sleep quality, use of hypnotics and sleeping habits in different age-groups
among older people,” Scand. J. Caring Sci., p. n/a–n/a, Feb. 2014.
[211] K. H. Namazi and P. Chafetz, Assisted Living: Current Issues in Facility
Management and Resident Care. Greenwood Publishing Group, 2001.
[212] K. Crowley, “Sleep and Sleep Disorders in Older Adults,” Neuropsychol.
Rev., vol. 21, no. 1, pp. 41–53, Mar. 2011.
[213] E. M. Lowery, A. L. Brubaker, E. Kuhlmann, and E. J. Kovacs, “The aging
lung,” Clin. Interv. Aging, vol. 8, pp. 1489–1496, 2013.
[214] H. Engleman and N. Douglas, “Sleep 4: Sleepiness, cognitive function, and
quality of life in obstructive sleep apnoea/hypopnoea syndrome,” Thorax,
vol. 59, no. 7, pp. 618–622, Jul. 2004.
[215] D. G. Karottki, M. Spilak, M. Frederiksen, L. Gunnarsen, E. V. Brauner, B.
Kolarik, Z. J. Andersen, T. Sigsgaard, L. Barregard, B. Strandberg, G.
Sallsten, P. Møller, and S. Loft, “An indoor air filtration study in homes of
elderly: cardiovascular and respiratory effects of exposure to particulate mat-
ter,” Environ. Health, vol. 12, no. 1, p. 116, Dec. 2013.
[216] Y. Masuda, M. Sekimoto, M. Nambu, Y. Higashi, T. Fujimoto, K. Chihara,
and T. Tamura, “An unconstrained monitoring system for home rehabilita-
tion,” IEEE Eng. Med. Biol. Mag., vol. 24, no. 4, pp. 43–47, 2005.
[217] Y. Chee, J. Han, J. Youn, and K. Park, “Air mattress sensor system with bal-
ancing tube for unconstrained measurement of respiration and heart beat
movements,” Physiol. Meas., vol. 26, no. 4, p. 413, Aug. 2005.
[218] J. Hao, M. Jayachandran, P. L. Kng, S. F. Foo, P. W. A. Aung, and Z. Cai,
“FBG-based smart bed system for healthcare applications,” Front. Optoelec-
tron. China, vol. 3, no. 1, pp. 78–83, Mar. 2010.

CHAPTER 2. DISTRIBUTED COMPUTING AND MONITORING TECHNOLOGIES FOR OLDER PATIENTS
129
[219] I. B. Lamster and N. D. Crawford, “The Oral Disease Burden Faced by Old-
er Adults,” in Improving Oral Health for the Elderly, I. B. Lamster and M.
E. Northridge, Eds. Springer New York, 2008, pp. 15–40.
[220] M. Juthani-Mehta, N. De Rekeneire, H. Allore, S. Chen, J. R. O’Leary, D. C.
Bauer, T. B. Harris, A. B. Newman, S. Yende, R. J. Weyant, S. Kritchevsky,
and V. Quagliarello, “Modifiable Risk Factors for Pneumonia Requiring
Hospitalization among Community-Dwelling Older Adults: The Health, Ag-
ing, and Body Composition Study,” J. Am. Geriatr. Soc., vol. 61, no. 7, pp.
1111–1118, Jul. 2013.
[221] T. M. Gill, C. S. Williams, J. T. Robison, and M. E. Tinetti, “A population-
based study of environmental hazards in the homes of older persons.,” Am. J.
Public Health, vol. 89, no. 4, pp. 553–556, Apr. 1999.
[222] M. E. Northridge, M. C. Nevitt, J. L. Kelsey, and B. Link, “Home hazards
and falls in the elderly: the role of health and functional status.,” Am. J. Pub-
lic Health, vol. 85, no. 4, pp. 509–515, Apr. 1995.
[223] L. Z. Rubenstein, “Falls in older people: epidemiology, risk factors and
strategies for prevention,” Age Ageing, vol. 35, no. suppl 2, pp. ii37–ii41,
Sep. 2006.
[224] S. W. Mercer, S. M. Smith, S. Wyke, T. O’Dowd, and G. C. Watt, “Multi-
morbidity in primary care: developing the research agenda,” Fam. Pract.,
vol. 26, no. 2, pp. 79–80, Apr. 2009.
[225] American Geriatrics Society Expert Panel on the Care of Older Adults with
Multimorbidity, “Guiding principles for the care of older adults with multi-
morbidity: an approach for clinicians: American Geriatrics Society Expert
Panel on the Care of Older Adults with Multimorbidity,” J. Am. Geriatr.
Soc., vol. 60, no. 10, pp. E1–E25, Oct. 2012.
[226] A. S. D. Akca, U. Emre, A. Unal, E. Aciman, and F. Akca, “Comorbid Dis-
eases and Drug Usage Among Geriatric Patients Presenting with Neurologi-
cal Problems at the Emergency Department,” Turk. J. Geriatr.-Turk Geriatri
Derg., vol. 15, no. 2, pp. 151–155, 2012.
[227] G. Ellis, M. A. Whitehead, D. Robinson, D. O’Neill, and P. Langhorne,
“Comprehensive geriatric assessment for older adults admitted to hospital:
meta-analysis of randomised controlled trials,” BMJ, vol. 343, no. oct27 1,
pp. d6553–d6553, Oct. 2011.
[228] B. Pogorelc and M. Gams, “Home-based health monitoring of the elderly
through gait recognition,” J. Ambient Intell. Smart Environ., vol. 4, no. 5, pp.
415–428, 2012.
[229] V. Kempe, Inertial MEMS: Principles and Practice, 1st ed. Cambridge Uni-
versity Press, 2011.
VISUAL ANALYSIS OF FACES WITH APPLICATION IN BIOMETRICS, FORENSICS AND HEALTH INFORMATICS
130
[230] E. Stone and M. Skubic, “Evaluation of an inexpensive depth camera for in-
home gait assessment,” J Ambient Intell Smart Env., vol. 3, no. 4, pp. 349–
361, Dec. 2011.
[231] R.-D. Vatavu, “Nomadic gestures: A technique for reusing gesture com-
mands for frequent ambient interactions,” J. Ambient Intell. Smart Environ.,
vol. 4, no. 2, pp. 79–93, Jan. 2012.
[232] R. Poppe, “Vision-based human motion analysis: An overview,” Comput.
Vis. Image Underst., vol. 108, no. 1–2, pp. 4–18, Oct. 2007.
[233] T. Matsukawa, T. Umetani, and K. Yokoyama, “Development of Health
Monitoring System based on Three-dimensional Imaging using Bio-signals
and Motion Data,” in 29th Annual International Conference of the IEEE En-
gineering in Medicine and Biology Society, 2007. EMBS 2007, 2007, pp.
1523 –1527.
[234] A. Kaushik, N. Lovell, and B. Celler, “Evaluation of PIR Detector Charac-
teristics for Monitoring Occupancy Patterns of Elderly People Living Alone
at Home,” in 29th Annual International Conference of the IEEE Engineering
in Medicine and Biology Society, 2007. EMBS 2007, 2007, pp. 3802 –3805.
[235] B.-R. Chen, S. Patel, T. Buckley, R. Rednic, D. J. McClure, L. Shih, D.
Tarsy, M. Welsh, and P. Bonato, “A Web-Based System for Home Monitor-
ing of Patients With Parkinson’s Disease Using Wearable Sensors,” IEEE
Trans. Biomed. Eng., vol. 58, no. 3, pp. 831 –836, Mar. 2011.
[236] C.-Y. Chiang, Y.-L. Chen, C.-W. Yu, S.-M. Yuan, and Z.-W. Hong, “An
Efficient Component-Based Framework for Intelligent Home-Care System
Design with Video and Physiological Monitoring Machineries,” in 2011
Fifth International Conference on Genetic and Evolutionary Computing
(ICGEC), 2011, pp. 33 –36.
[237] Confidence Consortium, “Ubiquitous Care System to Support Independent
Living,” FP7-ICT-214986, Jul. 2011.
[238] L. Colizzi, N. Savino, P. Rametta, L. Rizzi, G. Fiorino, G. Piccininno, M.
Piccinno, G. Rana, F. Petrosillo, M. Natrella, and L. Laneve, “H@H: A tel-
emedicine suite for de-hospitalization of chronic disease patients,” in 2010
10th IEEE International Conference on Information Technology and Appli-
cations in Biomedicine (ITAB), 2010, pp. 1 –4.
[239] C. Lau, R. S. Churchill, J. Kim, F. A. Matsen, and Yongmin Kim, “Asyn-
chronous web-based patient-centered home telemedicine system,” IEEE
Trans. Biomed. Eng., vol. 49, no. 12, pp. 1452–1462, Dec. 2002.
[240] A. K. Bourke, C. N. Scanaill, K. M. Culhane, J. V. O’Brien, and G. M. Ly-
ons, “An optimum accelerometer configuration and simple algorithm for ac-
curately detecting falls,” in Proceedings of the 24th IASTED international

CHAPTER 2. DISTRIBUTED COMPUTING AND MONITORING TECHNOLOGIES FOR OLDER PATIENTS
131
conference on Biomedical engineering, Anaheim, CA, USA, 2006, pp. 156–
160.
[241] B. Kaluža, V. Mirchevska, E. Dovgan, M. Luštrek, and M. Gams, “An
Agent-Based Approach to Care in Independent Living,” in Ambient Intelli-
gence, B. de Ruyter, R. Wichert, D. V. Keyson, P. Markopoulos, N. Streitz,
M. Divitini, N. Georgantas, and A. M. Gomez, Eds. Springer Berlin Heidel-
berg, 2010, pp. 177–186.
[242] B. Kaluža and M. Gams, “Analysis of daily-living dynamics,” J. Ambient
Intell. Smart Environ., vol. 4, no. 5, pp. 403–413, Jan. 2012.
[243] X. Yu, “Approaches and principles of fall detection for elderly and patient,”
in 10th International Conference on e-health Networking, Applications and
Services, 2008. HealthCom 2008, 2008, pp. 42–47.
[244] X. Wang, M. Li, H. Ji, and Z. Gong, “A novel modeling approach to fall
detection and experimental validation using motion capture system,” in 2013
IEEE International Conference on Robotics and Biomimetics (ROBIO),
2013, pp. 234–239.
[245] J. R. Smith, K. P. Fishkin, B. Jiang, A. Mamishev, M. Philipose, A. D. Rea,
S. Roy, and K. Sundara-Rajan, “RFID-based techniques for human-activity
detection,” Commun ACM, vol. 48, no. 9, pp. 39–44, Sep. 2005.
[246] British Standards, “BS 8300:2009+A1:2010 Design of buildings and their
approaches to meet the needs of disabled people,” 28-Feb-2009.
[247] International Organization for Standardization, “ISO 21542:2011: Building
construction -- Accessibility and usability of the built environment,” 2011.
[248] M. Shoaib, R. Dragon, and J. Ostermann, “View-invariant Fall Detection for
Elderly in Real Home Environment,” in 2010 Fourth Pacific-Rim Symposi-
um on Image and Video Technology (PSIVT), 2010, pp. 52–57.
[249] C. Rougier, J. Meunier, A. St-Arnaud, and J. Rousseau, “Robust Video Sur-
veillance for Fall Detection Based on Human Shape Deformation,” IEEE
Trans. Circuits Syst. Video Technol., vol. 21, no. 5, pp. 611–622, May 2011.
[250] H. Foroughi, A. Rezvanian, and A. Paziraee, “Robust Fall Detection Using
Human Shape and Multi-class Support Vector Machine,” in Sixth Indian
Conference on Computer Vision, Graphics Image Processing, 2008. ICVGIP
’08, 2008, pp. 413–420.
[251] A. Meffre, C. Collet, N. Lachiche, and P. Gançarski, “Real-Time Fall Detec-
tion Method Based on Hidden Markov Modelling,” in Image and Signal
Processing, A. Elmoataz, D. Mammass, O. Lezoray, F. Nouboud, and D.
Aboutajdine, Eds. Springer Berlin Heidelberg, 2012, pp. 521–530.

VISUAL ANALYSIS OF FACES WITH APPLICATION IN BIOMETRICS, FORENSICS AND HEALTH INFORMATICS
132
[252] H. Foroughi, B. S. Aski, and H. Pourreza, “Intelligent video surveillance for
monitoring fall detection of elderly in home environments,” in 11th Interna-
tional Conference on Computer and Information Technology, 2008. ICCIT
2008, 2008, pp. 219–224.
[253] X. Yu, X. Wang, P. Kittipanya-Ngam, H. L. Eng, and L.-F. Cheong, “Fall
Detection and Alert for Ageing-at-Home of Elderly,” in Ambient Assistive
Health and Wellness Management in the Heart of the City, M. Mokhtari, I.
Khalil, J. Bauchet, D. Zhang, and C. Nugent, Eds. Springer Berlin Heidel-
berg, 2009, pp. 209–216.
[254] C. F. Crispim-Junior, F. Bremond, and V. Joumier, “A Multi-Sensor Ap-
proach for Activity Recognition in Older Patients,” presented at the Second
International Conference on Ambient Computing, Applications, Services
and Technologies - AMBIENT 2012, 2012.
[255] Z. Zhou, X. Chen, Y.-C. Chung, Z. He, T. X. Han, and J. M. Keller, “Video-
based activity monitoring for indoor environments,” in IEEE International
Symposium on Circuits and Systems, 2009. ISCAS 2009, 2009, pp. 1449–
1452.
[256] T. Banerjee, J. Keller, M. Skubic, and E. Stone, “Day or Night Activity
Recognition from Video Using Fuzzy Clustering Techniques,” IEEE Trans.
Fuzzy Syst., vol. Early Access Online, 2013.
[257] K. Sim, G.-E. Yap, C. Phua, J. Biswas, A. A. P. Wai, A. Tolstikov, W.
Huang, and P. Yap, “Improving the accuracy of erroneous-plan recognition
system for Activities of Daily Living,” in 2010 12th IEEE International
Conference on e-Health Networking Applications and Services (Healthcom),
2010, pp. 28–35.
[258] H. Pirsiavash and D. Ramanan, “Detecting activities of daily living in first-
person camera views,” in 2012 IEEE Conference on Computer Vision and
Pattern Recognition (CVPR), 2012, pp. 2847–2854.
[259] R. Messing, C. Pal, and H. Kautz, “Activity recognition using the velocity
histories of tracked keypoints,” in 2009 IEEE 12th International Conference
on Computer Vision, 2009, pp. 104–111.
[260] C. Schuldt, I. Laptev, and B. Caputo, “Recognizing human actions: a local
SVM approach,” in Proceedings of the 17th International Conference on
Pattern Recognition, 2004. ICPR 2004, 2004, vol. 3, pp. 32–36 Vol.3.
[261] Q. Ma, B. Fosty, C. F. Crispim-Junior, and F. Bremond, “Fusion Framework
for Video Event Recognition,” presented at the The 10th IASTED Interna-
tional Conference on Signal Processing, Pattern Recognition and Applica-
tions, 2013.

CHAPTER 2. DISTRIBUTED COMPUTING AND MONITORING TECHNOLOGIES FOR OLDER PATIENTS
133
[262] Y. Tang, B. Ma, and H. Yan, “Intelligent Video Surveillance System for El-
derly People Living Alone Based on ODVS,” Adv. Internet Things, vol. 03,
no. 02, pp. 44–52, 2013.
[263] T. L. M. van Kasteren, G. Englebienne, and B. J. A. Kröse, “An activity
monitoring system for elderly care using generative and discriminative mod-
els,” Pers. Ubiquitous Comput., vol. 14, no. 6, pp. 489–498, Sep. 2010.
[264] F. M. Hasanuzzaman, X. Yang, Y. Tian, Q. Liu, and E. Capezuti, “Monitor-
ing activity of taking medicine by incorporating RFID and video analysis,”
Netw. Model. Anal. Health Inform. Bioinforma., vol. 2, no. 2, pp. 61–70, Jul.
2013.
[265] N. Zouba, F. Bremond, and M. Thonnat, “An Activity Monitoring System
for Real Elderly at Home: Validation Study,” in 2010 Seventh IEEE Interna-
tional Conference on Advanced Video and Signal Based Surveillance
(AVSS), 2010, pp. 278–285.
[266] H. Zhong, J. Shi, and M. Visontai, “Detecting unusual activity in video,” in
Proceedings of the 2004 IEEE Computer Society Conference on Computer
Vision and Pattern Recognition, 2004. CVPR 2004, 2004, vol. 2, pp. II–819–
II–826 Vol.2.
[267] H. Nait-Charif and S. J. McKenna, “Activity summarisation and fall detec-
tion in a supportive home environment,” in Proceedings of the 17th Interna-
tional Conference on Pattern Recognition, 2004. ICPR 2004, 2004, vol. 4,
pp. 323–326 Vol.4.
[268] C.-W. Lin and Z.-H. Ling, “Automatic Fall Incident Detection in Com-
pressed Video for Intelligent Homecare,” in Proceedings of 16th Interna-
tional Conference on Computer Communications and Networks, 2007.
ICCCN 2007, 2007, pp. 1172–1177.
[269] M. Belshaw, B. Taati, D. Giesbrecht, and A. Mihailidis, “Intelligent Vision-
Based Fall Detection System: Preliminary Results from a Real-World De-
ployment,” in RESNA/ICTA, Toronto, Canada, 2011.
[270] M.-Z. Poh, D. J. McDuff, and R. W. Picard, “Advancements in Noncontact,
Multiparameter Physiological Measurements Using a Webcam,” IEEE
Trans. Biomed. Eng., vol. 58, no. 1, pp. 7–11, 2011.
[271] S. Kwon, H. Kim, and K. S. Park, “Validation of heart rate extraction using
video imaging on a built-in camera system of a smartphone,” in 2012 Annual
International Conference of the IEEE Engineering in Medicine and Biology
Society (EMBC), 2012, pp. 2174–2177.
[272] C. Scully, J. Lee, J. Meyer, A. M. Gorbach, D. Granquist-Fraser, Y. Mendel-
son, and K. H. Chon, “Physiological Parameter Monitoring from Optical Re-

VISUAL ANALYSIS OF FACES WITH APPLICATION IN BIOMETRICS, FORENSICS AND HEALTH INFORMATICS
134
cordings With a Mobile Phone,” IEEE Trans. Biomed. Eng., vol. 59, no. 2,
pp. 303–306, 2012.
[273] B. Kim, S. Lee, D. Cho, and S. Oh, “A Proposal of Heart Diseases Diagnosis
Method Using Analysis of Face Color,” in International Conference on Ad-
vanced Language Processing and Web Information Technology, 2008.
ALPIT ’08, 2008, pp. 220–225.
[274] M. A. Haque, K. Nasrollahi, and T. B. Moeslund, “Constructing Facial Ex-
pression Log from Video Sequences using Face Quality Assessment,” pre-
sented at the International Conference on Computer Vision Theory and Ap-
plications, Lisbon, Portugal, 2014.
[275] D. Chen, A. J. Bharucha, and H. D. Wactlar, “Intelligent Video Monitoring
to Improve Safety of Older Persons,” in 29th Annual International Confer-
ence of the IEEE Engineering in Medicine and Biology Society, 2007. EMBS
2007, 2007, pp. 3814–3817.
[276] E. E. Stone and M. Skubic, “Fall Detection in Homes of Older Adults Using
the Microsoft Kinect,” IEEE J. Biomed. Health Inform., vol. 19, no. 1, pp.
290–301, Jan. 2015.
[277] S. Spinsante, R. Antonicelli, I. Mazzanti, and E. Gambi, “Technological Ap-
proaches to Remote Monitoring of Elderly People in Cardiology: A Usabil-
ity Perspective,” Int. J. Telemed. Appl., vol. 2012, Dec. 2012.
[278] S. H. Salleh, H. S. Hussain, T. T. Swee, C.-M. Ting, A. M. Noor, S.
Pipatsart, J. Ali, and P. P. Yupapin, “Acoustic cardiac signals analysis: a
Kalman filter-based approach,” Int. J. Nanomedicine, vol. 7, pp. 2873–2881,
2012.
[279] B. S. Emmanuel, “A review of signal processing techniques for heart sound
analysis in clinical diagnosis,” J. Med. Eng. Technol., vol. 36, no. 6, pp.
303–307, Aug. 2012.
[280] A. Tsanas, M. A. Little, P. E. McSharry, J. Spielman, and L. O. Ramig,
“Novel Speech Signal Processing Algorithms for High-Accuracy Classifica-
tion of Parkinson’s Disease,” IEEE Trans. Biomed. Eng., vol. 59, no. 5, pp.
1264–1271, 2012.
[281] A. K. Ng and T.-S. Koh, “Using psychoacoustics of snoring sounds to screen
for obstructive sleep apnea,” in 30th Annual International Conference of the
IEEE Engineering in Medicine and Biology Society, 2008. EMBS 2008,
2008, pp. 1647–1650.
[282] M. Vacher, A. Fleury, F. Portet, J.-F. Serignat, and N. Noury, “Complete
Sound and Speech Recognition System for Health Smart Homes: Applica-
tion to the Recognition of Activities of Daily Living,” in New Developments
in Biomedical Engineering, D. Campolo, Ed. InTech, 2010.

CHAPTER 2. DISTRIBUTED COMPUTING AND MONITORING TECHNOLOGIES FOR OLDER PATIENTS
135
[283] J. Ye, T. Kobayashi, and T. Higuchi, “Audio-Based Indoor Health Monitor-
ing System Using FLAC Features,” in 2010 International Conference on
Emerging Security Technologies (EST), 2010, pp. 90–95.
[284] M. Kepski and B. Kwolek, “Human Fall Detection Using Kinect Sensor,” in
Proceedings of the 8th International Conference on Computer Recognition
Systems CORES 2013, R. Burduk, K. Jackowski, M. Kurzynski, M. Wozni-
ak, and A. Zolnierek, Eds. Springer International Publishing, 2013, pp. 743–
752.
[285] Y. Charlon, W. Bourennane, F. Bettahar, and E. Campo, “Activity monitor-
ing system for elderly in a context of smart home,” IRBM, vol. 34, no. 1, pp.
60–63, Feb. 2013.
[286] M. Yuwono, B. D. Moulton, S. W. Su, B. G. Celler, and H. T. Nguyen, “Un-
supervised machine-learning method for improving the performance of am-
bulatory fall-detection systems,” Biomed. Eng. OnLine, vol. 11, no. 1, p. 9,
Feb. 2012.
[287] M. Kurella Tamura, K. E. Covinsky, G. M. Chertow, K. Yaffe, C. S. Lande-
feld, and C. E. McCulloch, “Functional Status of Elderly Adults before and
after Initiation of Dialysis,” N. Engl. J. Med., vol. 361, no. 16, pp. 1539–
1547, 2009.
[288] M. Silva, P. M. Teixeira, F. Abrantes, and F. Sousa, “Design and Evaluation
of a Fall Detection Algorithm on Mobile Phone Platform,” in Ambient Media
and Systems, S. Gabrielli, D. Elias, and K. Kahol, Eds. Springer Berlin Hei-
delberg, 2011, pp. 28–35.
[289] L. Tong, Q. Song, Y. Ge, and M. Liu, “HMM-Based Human Fall Detection
and Prediction Method Using Tri-Axial Accelerometer,” IEEE Sens. J., vol.
13, no. 5, pp. 1849–1856, May 2013.
[290] T. Zhang, J. Wang, L. Xu, and P. Liu, “Fall Detection by Wearable Sensor
and One-Class SVM Algorithm,” in Intelligent Computing in Signal Pro-
cessing and Pattern Recognition, D.-S. Huang, K. Li, and G. W. Irwin, Eds.
Springer Berlin Heidelberg, 2006, pp. 858–863.
[291] M. A. Alam, W. Wang, S. I. Ahamed, and W. Chu, “Elderly Safety: A
Smartphone Based Real Time Approach,” in Inclusive Society: Health and
Wellbeing in the Community, and Care at Home, J. Biswas, H. Kobayashi,
L. Wong, B. Abdulrazak, and M. Mokhtari, Eds. Springer Berlin Heidelberg,
2013, pp. 134–142.
[292] S. Sasidhar, S. K. Panda, and J. Xu, “A Wavelet Feature Based Mechano-
myography Classification System for a Wearable Rehabilitation System for
the Elderly,” in Inclusive Society: Health and Wellbeing in the Community,

VISUAL ANALYSIS OF FACES WITH APPLICATION IN BIOMETRICS, FORENSICS AND HEALTH INFORMATICS
136
and Care at Home, J. Biswas, H. Kobayashi, L. Wong, B. Abdulrazak, and
M. Mokhtari, Eds. Springer Berlin Heidelberg, 2013, pp. 45–52.
[293] G.-C. Chen, C.-N. Huang, C.-Y. Chiang, C.-J. Hsieh, and C.-T. Chan, “A
Reliable Fall Detection System Based on Wearable Sensor and Signal Mag-
nitude Area for Elderly Residents,” in Aging Friendly Technology for Health
and Independence, Y. Lee, Z. Z. Bien, M. Mokhtari, J. T. Kim, M. Park, J.
Kim, H. Lee, and I. Khalil, Eds. Springer Berlin Heidelberg, 2010, pp. 267–
270.
[294] F. Yu, A. Bilberg, E. Stenager, C. Rabotti, B. Zhang, and M. Mischi, “A
wireless body measurement system to study fatigue in multiple sclerosis,”
Physiol. Meas., vol. 33, no. 12, p. 2033, 2012.
[295] B. Pogorelc, Z. Bosnić, and M. Gams, “Automatic recognition of gait-related
health problems in the elderly using machine learning,” Multimed. Tools
Appl., vol. 58, no. 2, pp. 333–354, May 2012.
[296] M. Zhou, S. Wang, Y. Chen, Z. Chen, and Z. Zhao, “An Activity Transition
Based Fall Detection Model on Mobile Devices,” in Human Centric Tech-
nology and Service in Smart Space, J. J. (Jong H. Park, Q. Jin, M. S. Yeo,
and B. Hu, Eds. Springer Netherlands, 2012, pp. 1–8.
[297] B. M. C. Silva, J. J. P. C. Rodrigues, T. M. C. Simoes, S. Sendra, and J. Llo-
ret, “An ambient assisted living framework for mobile environments,” in
2014 IEEE-EMBS International Conference on Biomedical and Health In-
formatics (BHI), 2014, pp. 448–451.
[298] E. Monte-Moreno, “Non-invasive estimate of blood glucose and blood pres-
sure from a photoplethysmograph by means of machine learning tech-
niques,” Artif. Intell. Med., vol. 53, no. 2, pp. 127–138, Oct. 2011.
[299] C. Qiu, B. Winblad, and L. Fratiglioni, “The age-dependent relation of blood
pressure to cognitive function and dementia,” Lancet Neurol., vol. 4, no. 8,
pp. 487–499, Aug. 2005.
[300] R. H. Fagard, C. Van Den Broeke, and P. De Cort, “Prognostic significance
of blood pressure measured in the office, at home and during ambulatory
monitoring in older patients in general practice,” J. Hum. Hypertens., vol.
19, no. 10, pp. 801–807, Jun. 2005.
[301] B. Ilie, “Portable equipment for monitoring human functional parameters,”
in Roedunet International Conference (RoEduNet), 2010 9th, 2010, pp. 299
–302.
[302] P. Brindel, O. Hanon, J.-F. Dartigues, K. Ritchie, J.-M. Lacombe, P. Duci-
metiere, A. Alperovitch, C. Tzourio, and for the 3C Study Investigators,
“Prevalence, awareness, treatment, and control of hypertension in the elder-

CHAPTER 2. DISTRIBUTED COMPUTING AND MONITORING TECHNOLOGIES FOR OLDER PATIENTS
137
ly: the Three City study,” J. Hypertens. January 2006, vol. 24, no. 1, pp. 51–
58, 2006.
[303] Y. Nishida and T. Hori, “Non-invasive and unrestrained monitoring of hu-
man respiratory system by sensorized environment,” in Proceedings of IEEE
Sensors, 2002, 2002, vol. 1, pp. 705–710 vol.1.
[304] H. Lee, Y. T. Kim, J. W. Jung, K. H. Park, D. J. Kim, B. Bang, and Z. Z.
Bien, “A 24-hour health monitoring system in a smart house,” Gerontech-
nology, vol. 7, no. 1, pp. 22–35, Jan. 2008.
[305] P. Fiedler, S. Biller, S. Griebel, and J. Haueisen, “Impedance pneumography
using textile electrodes,” in 2012 Annual International Conference of the
IEEE Engineering in Medicine and Biology Society (EMBC), 2012, pp. 1606
–1609.
[306] W.-Y. Chung, S. Bhardwaj, A. Punvar, D.-S. Lee, and R. Myllylae, “A fu-
sion health monitoring using ECG and accelerometer sensors for elderly per-
sons at home.,” Conf. Proc. Annu. Int. Conf. IEEE Eng. Med. Biol. Soc.
IEEE Eng. Med. Biol. Soc. Conf., vol. 2007, pp. 3818–21, 2007.
[307] Y. M. Chi and G. Cauwenberghs, “Wireless Non-contact EEG/ECG Elec-
trodes for Body Sensor Networks,” in 2010 International Conference on
Body Sensor Networks (BSN), 2010, pp. 297 –301.
[308] Y. M. Chi, P. Ng, E. Kang, J. Kang, J. Fang, and G. Cauwenberghs, “Wire-
less non-contact cardiac and neural monitoring,” in Wireless Health 2010,
New York, NY, USA, 2010, pp. 15–23.
[309] J. Klonovs, C. K. Petersen, H. Olesen, and A. Hammershoj, “ID Proof on the
Go: Development of a Mobile EEG-Based Biometric Authentication Sys-
tem,” IEEE Veh. Technol. Mag., vol. 8, no. 1, pp. 81–89, 2013.
[310] G. Henderson, E. Ifeachor, N. Hudson, C. Goh, N. Outram, S. Wimalaratna,
C. Del Percio, and F. Vecchio, “Development and assessment of methods for
detecting dementia using the human electroencephalogram,” IEEE Trans.
Biomed. Eng., vol. 53, no. 8, pp. 1557–1568, 2006.
[311] H. T. Nguyen and T. W. Jones, “Detection of nocturnal hypoglycemic epi-
sodes using EEG signals,” in 2010 Annual International Conference of the
IEEE Engineering in Medicine and Biology Society (EMBC), 2010, pp. 4930
–4933.
[312] H. Abdullah, N. C. Maddage, I. Cosic, and D. Cvetkovic, “Cross-correlation
of EEG frequency bands and heart rate variability for sleep apnoea classifi-
cation,” Med. Biol. Eng. Comput., vol. 48, no. 12, pp. 1261–1269, Dec.
2010.
VISUAL ANALYSIS OF FACES WITH APPLICATION IN BIOMETRICS, FORENSICS AND HEALTH INFORMATICS
138
[313] C. B. Juhl, K. Højlund, R. Elsborg, M. K. Poulsen, P. E. Selmar, J. J. Holst,
C. Christiansen, and H. Beck-Nielsen, “Automated detection of hypoglyce-
mia-induced EEG changes recorded by subcutaneous electrodes in subjects
with type 1 diabetes--the brain as a biosensor,” Diabetes Res. Clin. Pract.,
vol. 88, no. 1, pp. 22–28, Apr. 2010.
[314] R. Harikumar, C. Ganeshbabu, M. Balasubramani, and P. Sinthiya, “Analy-
sis of SVD Neural Networks for Classification of Epilepsy Risk Level from
EEG Signals,” in Proceedings of the Fourth International Conference on
Signal and Image Processing 2012 (ICSIP 2012), M. S and S. S. Kumar,
Eds. Springer India, 2013, pp. 27–34.
[315] D. B. Keenan, J. J. Mastrototaro, G. Voskanyan, and G. M. Steil, “Delays in
Minimally Invasive Continuous Glucose Monitoring Devices: A Review of
Current Technology,” J. Diabetes Sci. Technol., vol. 3, no. 5, pp. 1207–
1214, Sep. 2009.
[316] M. Rowe, S. Lane, and C. Phipps, “CareWatch: A Home Monitoring System
for Use in Homes of Persons With Cognitive Impairment,” Top. Geriatr.
Rehabil., vol. 23, no. 1, pp. 3–8, Jan. 2007.
[317] A. M. Seelye, M. Schmitter-Edgecombe, D. J. Cook, and A. Crandall, “Nat-
uralistic Assessment of Everyday Activities and Prompting Technologies in
Mild Cognitive Impairment,” J. Int. Neuropsychol. Soc., vol. 19, no. 04, pp.
442–452, 2013.
[318] N. Cislo, “Undernutrition Prevention for Disabled and Elderly People in
Smart Home with Bayesian Networks and RFID Sensors,” in Aging Friendly
Technology for Health and Independence, Y. Lee, Z. Z. Bien, M. Mokhtari,
J. T. Kim, M. Park, J. Kim, H. Lee, and I. Khalil, Eds. Springer Berlin Hei-
delberg, 2010, pp. 246–249.
[319] S.-C. Kim, Y.-S. Jeong, and S.-O. Park, “RFID-based indoor location track-
ing to ensure the safety of the elderly in smart home environments,” Pers.
Ubiquitous Comput., Sep. 2012.
[320] A. Mateska, M. Pavloski, and L. Gavrilovska, “RFID and sensors enabled
In-home elderly care,” in 2011 Proceedings of the 34th International Con-
vention MIPRO, 2011, pp. 285–290.
[321] M. M. Pérez, M. Cabrero-Canosa, J. V. Hermida, L. C. García, D. L.
Gómez, G. V. González, and I. M. Herranz, “Application of RFID Technol-
ogy in Patient Tracking and Medication Traceability in Emergency Care,” J.
Med. Syst., vol. 36, no. 6, pp. 3983–3993, Dec. 2012.
[322] K. W. Sum, Y. P. Zheng, and A. F. T. Mak, “Vital sign monitoring for elder-
ly at home: development of a compound sensor for pulse rate and motion.,”
Stud. Health Technol. Inform., vol. 117, pp. 43–50, 2005.
CHAPTER 2. DISTRIBUTED COMPUTING AND MONITORING TECHNOLOGIES FOR OLDER PATIENTS
139
[323] A. Fleury, M. Vacher, N. Noury, and S. Member, “SVM-based multimodal
classification of activities of daily living in health smart homes: Sensors, al-
gorithms, and first experimental results,” IEEE Trans. Inf. Technol. Biomed.,
pp. 274–283, 2010.
[324] S. Chiriac, B. R. Saurer, G. Stummer, and C. Kunze, “Introducing a low-cost
ambient monitoring system for activity recognition,” in 2011 5th Interna-
tional Conference on Pervasive Computing Technologies for Healthcare
(PervasiveHealth), 2011, pp. 340–345.
[325] C. Franco, B. Diot, A. Fleury, J. Demongeot, and N. Vuillerme, “Ambient
Assistive Healthcare and Wellness Management – Is ‘The Wisdom of the
Body’ Transposable to One’s Home?,” in Inclusive Society: Health and
Wellbeing in the Community, and Care at Home, J. Biswas, H. Kobayashi,
L. Wong, B. Abdulrazak, and M. Mokhtari, Eds. Springer Berlin Heidelberg,
2013, pp. 143–150.
[326] D. Austin, T. L. Hayes, J. Kaye, N. Mattek, and M. Pavel, “Unobtrusive
monitoring of the longitudinal evolution of in-home gait velocity data with
applications to elder care.,” Conf. Proc. Annu. Int. Conf. IEEE Eng. Med.
Biol. Soc. IEEE Eng. Med. Biol. Soc. Conf., vol. 2011, pp. 6495–8, 2011.
[327] A. R. Kaushik, N. H. Lovell, and B. G. Celler, “Evaluation of PIR detector
characteristics for monitoring occupancy patterns of elderly people living
alone at home.,” Conf. Proc. Annu. Int. Conf. IEEE Eng. Med. Biol. Soc.
IEEE Eng. Med. Biol. Soc. Conf., vol. 2007, pp. 3802–5, 2007.
[328] A. R. Kaushik, N. H. Lovell, and B. G. Celler, “Evaluation of PIR Detector
Characteristics for Monitoring Occupancy Patterns of Elderly People Living
Alone at Home,” in 29th Annual International Conference of the IEEE En-
gineering in Medicine and Biology Society, 2007. EMBS 2007, 2007, pp.
3802–3805.
[329] A. R. Kaushik and B. G. Celler, “Characterization of PIR detector for moni-
toring occupancy patterns and functional health status of elderly people liv-
ing alone at home,” Technol. Health Care, vol. 15, no. 4, pp. 273–288, Jan.
2007.
[330] C. Franco, J. Demongeot, C. Villemazet, and N. Vuillerme, “Behavioral
Telemonitoring of the Elderly at Home: Detection of Nycthemeral Rhythms
Drifts from Location Data,” in 2010 IEEE 24th International Conference on
Advanced Information Networking and Applications Workshops (WAINA),
2010, pp. 759–766.
[331] P. Panek and P. Mayer, “Monitoring system for day-to-day activities of older
persons living at home alone,” Gerontechnology, vol. 11, no. 2, p. 302, Jun.
2012.
VISUAL ANALYSIS OF FACES WITH APPLICATION IN BIOMETRICS, FORENSICS AND HEALTH INFORMATICS
140
[332] J. Fei and I. Pavlidis, “Thermistor at a Distance: Unobtrusive Measurement
of Breathing,” IEEE Trans. Biomed. Eng., vol. 57, no. 4, pp. 988–998, 2010.
[333] L. B. Wolff, D. A. Socolinsky, and C. K. Eveland, “Quantitative Measure-
ment of Illumination Invariance for Face Recognition Using Thermal Infra-
red Imagery,” 2003, pp. 140–151.
[334] V. S. Stel, S. M. F. Pluijm, D. J. H. Deeg, J. H. Smit, L. M. Bouter, and P.
Lips, “A Classification Tree for Predicting Recurrent Falling in Community-
Dwelling Older Persons,” J. Am. Geriatr. Soc., vol. 51, no. 10, pp. 1356–
1364, Oct. 2003.
[335] R. Woolrych, A. Sixsmith, B. Mortenson, S. Robinovitch, and F. Feldman,
“The Nature and Use of Surveillance Technologies in Residential Care,” in
Inclusive Society: Health and Wellbeing in the Community, and Care at
Home, J. Biswas, H. Kobayashi, L. Wong, B. Abdulrazak, and M. Mokhtari,
Eds. Springer Berlin Heidelberg, 2013, pp. 1–9.
[336] M. A. R. Ahad, J. Tan, H. Kim, and S. Ishikawa, “Action dataset - A sur-
vey,” in 2011 Proceedings of SICE Annual Conference (SICE), Tokyo, Ja-
pan, 2011, pp. 1650–1655.
[337] O. Dikmen and A. Mesaros, “Sound event detection using non-negative dic-
tionaries learned from annotated overlapping events,” in 2013 IEEE Work-
shop on Applications of Signal Processing to Audio and Acoustics
(WASPAA), 2013, pp. 1–4.
[338] A. Mesaros, T. Heittola, A. Eronen, and T. Virtanen, “Acoustic event detec-
tion in real life recordings,” in 18th European Signal Processing Confer-
ence, 2010, pp. 1267–1271.
[339] L. Vuegen, B. V. D. Broeck, P. Karsmakers, H. V. Hamme, and B. Vanrum-
ste, “Automatic Monitoring of Activities of Daily Living based on Real-life
Acoustic Sensor Data: a~preliminary study,” Proc. Fourth Workshop Speech
Lang. Process. Assist. Technol., pp. 113–118, 2013.
[340] P. Arlotto, M. Grimaldi, R. Naeck, and J.-M. Ginoux, “An Ultrasonic Con-
tactless Sensor for Breathing Monitoring,” Sensors, vol. 14, no. 8, pp.
15371–15386, Aug. 2014.
[341] F. Lorussi, S. Galatolo, and D. E. De Rossi, “Textile-Based Electrogoniome-
ters for Wearable Posture and Gesture Capture Systems,” IEEE Sens. J., vol.
9, no. 9, pp. 1014 –1024, Sep. 2009.
[342] H. Carvalho, A. P. Catarino, A. Rocha, and O. Postolache, “Health monitor-
ing using textile sensors and electrodes: An overview and integration of
technologies,” in 2014 IEEE International Symposium on Medical Meas-
urements and Applications (MeMeA), 2014, pp. 1–6.

CHAPTER 2. DISTRIBUTED COMPUTING AND MONITORING TECHNOLOGIES FOR OLDER PATIENTS
141
[343] M. Pacelli, L. Caldani, and R. Paradiso, “Textile Piezoresistive Sensors for
Biomechanical Variables Monitoring,” in 28th Annual International Confer-
ence of the IEEE Engineering in Medicine and Biology Society, 2006. EMBS
’06, 2006, pp. 5358 –5361.
[344] R. Y. W. Lee and A. J. Carlisle, “Detection of falls using accelerometers and
mobile phone technology,” Age Ageing, p. afr050, May 2011.
[345] W. Lu, X. Qin, A. M. Asiri, A. O. Al-Youbi, and X. Sun, “Ni foam: a novel
three-dimensional porous sensing platform for sensitive and selective nonen-
zymatic glucose detection,” Analyst, vol. 138, no. 2, pp. 417–420, Dec.
2012.
[346] R. Bellazzi, P. Magni, and G. De Nicolao, “Bayesian analysis of blood glu-
cose time series from diabetes home monitoring,” IEEE Trans. Biomed.
Eng., vol. 47, no. 7, pp. 971 –975, Jul. 2000.
[347] F. C. Tian, C. Kadri, L. Zhang, J. W. Feng, L. H. Juan, and P. L. Na, “A
Novel Cost-Effective Portable Electronic Nose for Indoor-/In-Car Air Quali-
ty Monitoring,” in 2012 International Conference on Computer Distributed
Control and Intelligent Environmental Monitoring (CDCIEM), 2012, pp. 4 –
8.
[348] J. Fonollosa, I. Rodriguez-Lujan, A. V. Shevade, M. L. Homer, M. A. Ryan,
and R. Huerta, “Human activity monitoring using gas sensor arrays,” Sens.
Actuators B Chem., vol. 199, pp. 398–402, Aug. 2014.
[349] S. Coyle, D. Morris, K.-T. Lau, D. Diamond, F. Di Francesco, N. Taccini,
M. G. Trivella, D. Costanzo, P. Salvo, J.-A. Porchet, and J. Luprano, “Tex-
tile sensors to measure sweat pH and sweat-rate during exercise,” in 3rd In-
ternational Conference on Pervasive Computing Technologies for
Healthcare, 2009. PervasiveHealth 2009, 2009, pp. 1–6.
[350] P. M. Mendes, C. P. Figueiredo, M. Fernandes, and Ó. S. Gama, “Electron-
ics in Medicine,” in Springer Handbook of Medical Technology, R.
Kramme, K.-P. Hoffmann, and R. S. Pozos, Eds. Berlin, Heidelberg: Spring-
er Berlin Heidelberg, 2011, pp. 1337–1376.
[351] R. G. Haahr, S. Duun, E. V. Thomsen, K. Hoppe, and J. Branebjerg, “A
wearable ‘electronic patch’ for wireless continuous monitoring of chronical-
ly diseased patients,” in 5th International Summer School and Symposium on
Medical Devices and Biosensors, 2008. ISSS-MDBS 2008, 2008, pp. 66–70.
[352] D. B. Nielsen, K. Egstrup, J. Branebjerg, G. B. Andersen, and H. B. D.
Sorensen, “Automatic QRS complex detection algorithm designed for a nov-
el wearable, wireless electrocardiogram recording device,” in 2012 Annual
International Conference of the IEEE Engineering in Medicine and Biology
Society (EMBC), 2012, pp. 2913 –2916.

VISUAL ANALYSIS OF FACES WITH APPLICATION IN BIOMETRICS, FORENSICS AND HEALTH INFORMATICS
142
[353] J. Demongeot, G. Virone, F. Duchêne, G. Benchetrit, T. Hervé, N. Noury,
and V. Rialle, “Multi-sensors acquisition, data fusion, knowledge mining
and alarm triggering in health smart homes for elderly people,” C. R. Biol.,
vol. 325, no. 6, pp. 673–682, Jun. 2002.
[354] P. Rajendran, A. Corcoran, B. Kinosian, and M. Alwan, “Falls, Fall Preven-
tion, and Fall Detection Technologies,” in Eldercare Technology for Clinical
Practitioners, M. Alwan and R. A. Felder, Eds. Humana Press, 2008, pp.
187–202.
[355] T. Degen, H. Jaeckel, M. Rufer, and S. Wyss, “SPEEDY:a fall detector in a
wrist watch,” in Seventh IEEE International Symposium on Wearable Com-
puters, 2003. Proceedings, 2003, pp. 184–187.
[356] S. M. Koenig, D. Mack, and M. Alwan, “Sleep and Sleep Assessment Tech-
nologies,” in Eldercare Technology for Clinical Practitioners, M. Alwan
and R. A. Felder, Eds. Humana Press, 2008, pp. 77–120.
[357] K. Hung, Y. T. Zhang, and B. Tai, “Wearable medical devices for tele-home
healthcare,” in 26th Annual International Conference of the IEEE Engineer-
ing in Medicine and Biology Society, 2004. IEMBS ’04, 2004, vol. 2, pp.
5384–5387.
[358] S. Y. Sim, H. S. Jeon, G. S. Chung, S. K. Kim, S. J. Kwon, W. K. Lee, and
K. S. Park, “Fall detection algorithm for the elderly using acceleration sen-
sors on the shoes,” in 2011 Annual International Conference of the IEEE
Engineering in Medicine and Biology Society, EMBC, 2011, pp. 4935–4938.
[359] A. Lanata, E. P. Scilingo, R. Francesconi, G. Varone, and D. De Rossi,
“New Ultrasound-Based Wearable System for Cardiac Monitoring,” in 5th
IEEE Conference on Sensors, 2006, 2006, pp. 489 –492.
[360] A. Dittmar, R. Meffre, F. De Oliveira, C. Gehin, and G. Delhomme, “Wear-
able Medical Devices Using Textile and Flexible Technologies for Ambula-
tory Monitoring,” in Engineering in Medicine and Biology Society, 2005.
IEEE-EMBS 2005. 27th Annual International Conference of the, 2005, pp.
7161–7164.
[361] A. Mohan, S. R. Devasahayam, G. Tharion, and J. George, “A Sensorized
Glove and Ball for Monitoring Hand Rehabilitation Therapy in Stroke Pa-
tients,” in India Educators’ Conference (TIIEC), 2013 Texas Instruments,
2013, pp. 321–327.
[362] A. A. P. Wai, S. F. Foo, M. Jayachandran, J. Biswas, C. Nugent, M. Mul-
venna, D. Zhang, D. Craig, P. Passmore, J.-E. Lee, and P. Yap, “Towards
developing effective Continence Management through wetness alert diaper:
Experiences, lessons learned, challenges and future directions,” in Pervasive

CHAPTER 2. DISTRIBUTED COMPUTING AND MONITORING TECHNOLOGIES FOR OLDER PATIENTS
143
Computing Technologies for Healthcare (PervasiveHealth), 2010 4th Inter-
national Conference on-NO PERMISSIONS, 2010, pp. 1–8.
[363] T. H. Falk, M. Guirgis, S. Power, and T. T. Chau, “Taking NIRS-BCIs Out-
side the Lab: Towards Achieving Robustness Against Environment Noise,”
IEEE Trans. Neural Syst. Rehabil. Eng., vol. 19, no. 2, pp. 136 –146, Apr.
2011.
[364] C. Franco, J. Demongeot, C. Villemazet, and N. Vuillerme, “Behavioral
Telemonitoring of the Elderly at Home: Detection of Nycthemeral Rhythms
Drifts from Location Data,” in 2010 IEEE 24th International Conference on
Advanced Information Networking and Applications Workshops (WAINA),
2010, pp. 759–766.
[365] M. Garbey, N. Sun, A. Merla, and I. Pavlidis, “Contact-Free Measurement
of Cardiac Pulse Based on the Analysis of Thermal Imagery,” IEEE Trans.
Biomed. Eng., vol. 54, no. 8, pp. 1418–1426, 2007.
[366] R. Cheng, W. Heinzelman, M. Sturge-Apple, and Z. Ignjatovic, “A Motion-
Tracking Ultrasonic Sensor Array for Behavioral Monitoring,” IEEE Sens.
J., vol. PP, no. 99, p. 1, Aug. 2011.
[367] B. Pogorelc and M. Gams, “Detecting gait-related health problems of the
elderly using multidimensional dynamic time warping approach with seman-
tic attributes,” Multimed. Tools Appl., vol. 66, no. 1, pp. 95–114, Sep. 2013.
[368] R. Leser, A. Schleindlhuber, K. Lyons, and A. Baca, “Accuracy of an UWB-
based position tracking system used for time-motion analyses in game
sports,” Eur. J. Sport Sci., vol. 0, no. 0, pp. 1–8, 0.
[369] E. Dovgan, M. Luštrek, B. Pogorelc, A. Gradišek, H. Bruger, and M. Gams,
“Intelligent elderly-care prototype for fall and disease detection,” Slov. Med.
J., vol. 80, no. 11, Jan. 2011.
[370] P. O. Riley, K. W. Paylo, and D. C. Kerrigan, “Mobility and Gait Assess-
ment Technologies,” in Eldercare Technology for Clinical Practitioners, M.
Alwan and R. A. Felder, Eds. Humana Press, 2008, pp. 33–51.
[371] H. Ni, B. Abdulrazak, D. Zhang, and S. Wu, “Unobtrusive Sleep Posture
Detection for Elder-Care in Smart Home,” in Aging Friendly Technology for
Health and Independence, Y. Lee, Z. Z. Bien, M. Mokhtari, J. T. Kim, M.
Park, J. Kim, H. Lee, and I. Khalil, Eds. Springer Berlin Heidelberg, 2010,
pp. 67–75.
[372] B. Mutlu, A. Krause, J. Forlizzi, C. Guestrin, and J. Hodgins, “Robust, low-
cost, non-intrusive sensing and recognition of seated postures,” in Proceed-
ings of the 20th annual ACM symposium on User interface software and
technology, New York, NY, USA, 2007, pp. 149–158.

VISUAL ANALYSIS OF FACES WITH APPLICATION IN BIOMETRICS, FORENSICS AND HEALTH INFORMATICS
144
[373] D. I. Townsend, R. Goubran, M. Frize, and F. Knoefel, “Preliminary results
on the effect of sensor position on unobtrusive rollover detection for sleep
monitoring in smart homes,” in Annual International Conference of the
IEEE Engineering in Medicine and Biology Society, 2009. EMBC 2009,
2009, pp. 6135–6138.
[374] A. Arcelus, I. Veledar, R. Goubran, F. Knoefel, H. Sveistrup, and M. Bilo-
deau, “Measurements of Sit-to-Stand Timing and Symmetry From Bed Pres-
sure Sensors,” IEEE Trans. Instrum. Meas., vol. 60, no. 5, pp. 1732–1740,
May 2011.
[375] L. Alwis, T. Sun, and K. T. V. Grattan, “Optical fibre-based sensor technol-
ogy for humidity and moisture measurement: Review of recent progress,”
Measurement, vol. 46, no. 10, pp. 4052–4074, Dec. 2013.
[376] M. Alwan, P. J. Rajendran, S. Kell, D. Mack, S. Dalal, M. Wolfe, and R.
Felder, “A Smart and Passive Floor-Vibration Based Fall Detector for Elder-
ly,” in Information and Communication Technologies, 2006. ICTTA ’06.
2nd, 2006, vol. 1, pp. 1003–1007.
[377] C. B. Salvosa, P. R. Payne, and E. F. Wheeler, “Environmental Conditions
and Body Temperatures of Elderly Women Living Alone or in Local Au-
thority Home,” Br. Med. J., vol. 4, no. 5788, pp. 656–659, Dec. 1971.
[378] A. Fleury, N. Noury, M. Vacher, H. Glasson, and J.-F. Seri, “Sound and
speech detection and classification in a Health Smart Home,” in 30th Annual
International Conference of the IEEE Engineering in Medicine and Biology
Society, 2008. EMBS 2008, 2008, pp. 4644–4647.
[379] G. Virone, D. Istrate, M. Vacher, N. Noury, J.-F. Serignat, and J. De-
mongeot, “First steps in data fusion between a multichannel audio acquisi-
tion and an information system for home healthcare,” in Proceedings of the
25th Annual International Conference of the IEEE Engineering in Medicine
and Biology Society, 2003, 2003, vol. 2, pp. 1364–1367 Vol.2.
[380] M. Solbiati and R. S. Sheldon, “Implantable rhythm devices in the manage-
ment of vasovagal syncope,” Auton. Neurosci.
[381] S. S. Rao, J. A. Paulson, R. J. Saad, R. McCallum, H. P. Parkman, B. Kuo, J.
Semler, and W. D. Chey, “950 Assessment of Colonic, Whole Gut and Re-
gional Transit in Elderly Constipated and Healthy Subjects with a Novel
Wireless pH/Pressure Capsule (SmartPill®),” Gastroenterology, vol. 136,
no. 5, p. A–144, May 2009.
[382] T. F. Budinger, “Biomonitoring with Wireless Communications,” Annu. Rev.
Biomed. Eng., vol. 5, no. 1, pp. 383–412, 2003.
[383] B. Abdulrazak, Y. Malik, F. Arab, and S. Reid, “PhonAge: Adapted
SmartPhone for Aging Population,” in Inclusive Society: Health and Wellbe-
CHAPTER 2. DISTRIBUTED COMPUTING AND MONITORING TECHNOLOGIES FOR OLDER PATIENTS
145
ing in the Community, and Care at Home, J. Biswas, H. Kobayashi, L.
Wong, B. Abdulrazak, and M. Mokhtari, Eds. Springer Berlin Heidelberg,
2013, pp. 27–35.
[384] “Daytime monitoring of patients with epileptic seizures using a smartphone
processing framework and on-body sensors.” [Online]. Available:
http://www.tue.nl/publicatie/ep/p/d/ep-uid/280415/. [Accessed: 16-Aug-
2013].
[385] H. Ogawa, Y. Yonezawa, H. Maki, H. Sato, and W. M. Caldwell, “A mobile
phone-based Safety Support System for wandering elderly persons,” in 26th
Annual International Conference of the IEEE Engineering in Medicine and
Biology Society, 2004. IEMBS ’04, 2004, vol. 2, pp. 3316–3317.
[386] T. Lemlouma, S. Laborie, and P. Roose, “Toward a context-aware and au-
tomatic evaluation of elderly dependency in smart homes and cities,” in
World of Wireless, Mobile and Multimedia Networks (WoWMoM), 2013
IEEE 14th International Symposium and Workshops on a, 2013, pp. 1–6.
[387] F. Nicolo, S. Parupati, V. Kulathumani, and N. A. Schmid, “Near real-time
face detection and recognition using a wireless camera network,” Proc SPIE,
vol. 8392, pp. 1–10, 2012.
[388] S. A. Yarows, “Comparison of the Omron HEM-637 Wrist Monitor to the
Auscultation Method With the Wrist Position Sensor On or Disabled*,” Am.
J. Hypertens., vol. 17, no. 1, pp. 54–58, Jan. 2004.
[389] S. Uen, B. Weisser, P. Wieneke, H. Vetter, and T. Mengden, “Evaluation of
the Performance of a Wrist Blood Pressure Measuring Device With a Posi-
tion Sensor Compared to Ambulatory 24-Hour Blood Pressure Measure-
ments,” Am. J. Hypertens., vol. 15, no. 9, pp. 787–792, Sep. 2002.
[390] S. Uen, B. Weisser, H. Vetter, and T. Mengden, “P-25: Clinical evaluation
of a wrist blood pressure device with an active positioning system by com-
parison with 24-H ambulatory blood pressure measurement,” Am. J. Hyper-
tens., vol. 14, no. S1, p. 37A–37A, Apr. 2001.
[391] G. S. Stergiou, G. R. Christodoulakis, E. G. Nasothimiou, P. P. Giovas, and
P. G. Kalogeropoulos, “Can Validated Wrist Devices With Position Sensors
Replace Arm Devices for Self-Home Blood Pressure Monitoring? A Ran-
domized Crossover Trial Using Ambulatory Monitoring as Reference,” Am.
J. Hypertens., vol. 21, no. 7, pp. 753–758, Jul. 2008.
[392] A. Alahmadi and B. Soh, “A smart approach towards a mobile e-health mon-
itoring system architecture,” in 2011 International Conference on Research
and Innovation in Information Systems (ICRIIS), 2011, pp. 1 –5.
VISUAL ANALYSIS OF FACES WITH APPLICATION IN BIOMETRICS, FORENSICS AND HEALTH INFORMATICS
146
[393] R. H. Jacobsen, K. Kortermand, Q. Zhang, and T. S. Toftegaard, “Under-
standing Link Behavior of Non-intrusive Wireless Body Sensor Networks,”
Wirel. Pers. Commun., vol. 64, no. 3, pp. 561–582, Jun. 2012.
[394] H. J. Baek, G. S. Chung, K. K. Kim, and K. S. Park, “A Smart Health Moni-
toring Chair for Nonintrusive Measurement of Biological Signals,” IEEE
Trans. Inf. Technol. Biomed., vol. 16, no. 1, pp. 150 –158, Jan. 2012.
[395] A. M. Sullivan, H. Xia, J. C. McBride, and X. Zhao, “Reconstruction of
missing physiological signals using artificial neural networks,” in Compu-
ting in Cardiology, 2010, 2010, pp. 317 –320.
[396] B. Dinesen, N. Sørensen, and C. U. Østergaard, “Effect evaluation of the
intelligent bed in a nursing home: the case of Tangshave Nursing Home,”
Department of Health Science and Technology. Aalborg University, 2012.
[397] Â. Costa, J. C. Castillo, P. Novais, A. Fernández-Caballero, and R. Simoes,
“Sensor-driven agenda for intelligent home care of the elderly,” Expert Syst.
Appl., vol. 39, no. 15, pp. 12192–12204, Nov. 2012.
[398] D. N. Monekosso and P. Remagnino, “Monitoring Behavior with an Array
of Sensors,” Comput. Intell., vol. 23, no. 4, pp. 420–438, 2007.
[399] A. Helal, D. J. Cook, and M. Schmalz, “Smart Home-Based Health Platform
for Behavioral Monitoring and Alteration of Diabetes Patients,” J. Diabetes
Sci. Technol. Online, vol. 3, no. 1, pp. 141–148, Jan. 2009.
[400] R. Jafari, W. Li, R. Bajcsy, S. Glaser, and S. Sastry, “Physical Activity Mon-
itoring for Assisted Living at Home,” in 4th International Workshop on
Wearable and Implantable Body Sensor Networks (BSN 2007), vol. 13, S.
Leonhardt, T. Falck, and P. Mähönen, Eds. Berlin, Heidelberg: Springer
Berlin Heidelberg, pp. 213–219.
[401] P. Kulkarni and Y. Ozturk, “mPHASiS: Mobile patient healthcare and sen-
sor information system,” J. Netw. Comput. Appl., vol. 34, no. 1, pp. 402–
417, Jan. 2011.
[402] M. E. Williams, J. E. Owens, B. E. Parker, and K. P. Granata, “A new ap-
proach to assessing function in elderly people.,” Trans. Am. Clin. Climatol.
Assoc., vol. 114, pp. 203–217, 2003.
[403] M. Karunanithi, “Monitoring technology for the elderly patient,” Expert Rev.
Med. Devices, vol. 4, no. 2, pp. 267–277, Mar. 2007.
[404] S. Sanchez-Garcia, C. Garcia-Pena, M. X. Duque-Lopez, T. Juarez-Cedillo,
A. R. Cortes-Nunez, and S. Reyes-Beaman, “Anthropometric measures and
nutritional status in a healthy elderly population,” BMC Public Health, vol.
7, p. 2, Jan. 2007.

CHAPTER 2. DISTRIBUTED COMPUTING AND MONITORING TECHNOLOGIES FOR OLDER PATIENTS
147
[405] E. Dodd, P. Hawting, E. Horton, M. Karunanithi, and A. Livingstone, “Aus-
tralian Community Care Experience on the Design, Development, Deploy-
ment and Evaluation of Implementing the Smarter Safer Homes Platform,”
in Inclusive Smart Cities and e-Health, A. Geissbühler, J. Demongeot, M.
Mokhtari, B. Abdulrazak, and H. Aloulou, Eds. Springer International Pub-
lishing, 2015, pp. 282–286.
[406] A. J. McMichael, R. E. Woodruff, and S. Hales, “Climate change and human
health: present and future risks,” The Lancet, vol. 367, no. 9513, pp. 859–
869, 11.
[407] M. A. Sehili, B. Lecouteux, M. Vacher, F. Portet, D. Istrate, B. Dorizzi, and
J. Boudy, “Sound Environment Analysis in Smart Home,” in Ambient Intel-
ligence, F. Paternò, B. de Ruyter, P. Markopoulos, C. Santoro, E. van
Loenen, and K. Luyten, Eds. Springer Berlin Heidelberg, 2012, pp. 208–223.
[408] B. K. Hensel, G. Demiris, and K. L. Courtney, “Defining Obtrusiveness in
Home Telehealth Technologies A Conceptual Framework,” J. Am. Med. In-
form. Assoc., vol. 13, no. 4, pp. 428–431, Jul. 2006.
[409] S. Rahimi, A. D. C. Chan, and R. A. Goubran, “Nonintrusive load monitor-
ing of electrical devices in health smart homes,” in Instrumentation and
Measurement Technology Conference (I2MTC), 2012 IEEE International,
2012, pp. 2313 –2316.
[410] M. Soltan and M. Pedram, “Durability of wireless networks of battery-
powered devices,” in Proceedings of the 6th IEEE Conference on Consumer
Communications and Networking Conference, Piscataway, NJ, USA, 2009,
pp. 263–268.
[411] H. Pensas, H. Raula, and J. Vanhala, “Energy Efficient Sensor Network with
Service Discovery for Smart Home Environments,” in Third International
Conference on Sensor Technologies and Applications, 2009.
SENSORCOMM ’09, 2009, pp. 399 –404.
[412] E. Becker, G. Guerra-Filho, and F. Makedon, “Automatic sensor placement
in a 3D volume,” in Proceedings of the 2nd International Conference on
PErvasive Technologies Related to Assistive Environments, New York, NY,
USA, 2009, pp. 36:1–36:8.
[413] O. Banos, M. A. Toth, M. Damas, H. Pomares, and I. Rojas, “Dealing with
the effects of sensor displacement in wearable activity recognition,” Sensors,
vol. 14, no. 6, pp. 9995–10023, 2014.
[414] R. Watrous and G. Towell, “A patient-adaptive neural network ECG patient
monitoring algorithm,” in Computers in Cardiology 1995, 1995, pp. 229 –
232.

VISUAL ANALYSIS OF FACES WITH APPLICATION IN BIOMETRICS, FORENSICS AND HEALTH INFORMATICS
148
[415] J. Liszka-Hackzell, “Categorization of fetal heart rate patterns using neural
networks,” in Computers in Cardiology 1994, 1994, pp. 97 –100.
[416] V. Abouei, H. Sharifian, F. Towhidkhah, V. Nafisi, and H. Abouie, “Using
neural network in order to predict hypotension of hemodialysis patients,” in
2011 19th Iranian Conference on Electrical Engineering (ICEE), 2011, pp.
1 –4.
[417] P. Dawadi, D. Cook, C. Parsey, M. Schmitter-Edgecombe, and M. Schnei-
der, “An approach to cognitive assessment in smart home,” in Proceedings
of the 2011 workshop on Data mining for medicine and healthcare, New
York, NY, USA, 2011, pp. 56–59.
[418] H. Atoui, J. Fayn, and P. Rubel, “A neural network approach for patient-
specific 12-lead ECG synthesis in patient monitoring environments,” in
Computers in Cardiology, 2004, 2004, pp. 161 – 164.
[419] M. Yu, A. Rhuma, S. M. Naqvi, L. Wang, and J. Chambers, “A Posture
Recognition-Based Fall Detection System for Monitoring an Elderly Person
in a Smart Home Environment,” IEEE Trans. Inf. Technol. Biomed., vol. 16,
no. 6, pp. 1274–1286, Nov. 2012.
[420] M. Novak, M. Binas, and F. Jakab, “Unobtrusive anomaly detection in pres-
ence of elderly in a smart-home environment,” in ELEKTRO, 2012, 2012,
pp. 341–344.
[421] E. Nazerfard, B. Das, L. B. Holder, and D. J. Cook, “Conditional random
fields for activity recognition in smart environments,” in Proceedings of the
1st ACM International Health Informatics Symposium, New York, NY,
USA, 2010, pp. 282–286.
[422] M. Sánchez, P. Martín, L. Álvarez, V. Alonso, C. Zato, A. Pedrero, and J.
Bajo, “A New Adaptive Algorithm for Detecting Falls through Mobile De-
vices,” in Trends in Practical Applications of Agents and Multiagent Sys-
tems, J. M. Corchado, J. B. Pérez, K. Hallenborg, P. Golinska, and R. Cor-
chuelo, Eds. Springer Berlin Heidelberg, 2011, pp. 17–24.
[423] S. M. Mahmoud, A. Lotfi, and C. Langensiepen, “Behavioural Pattern Iden-
tification in a Smart Home Using Binary Similarity and Dissimilarity
Measures,” in 2011 7th International Conference on Intelligent Environ-
ments (IE), 2011, pp. 55–60.
[424] M. V. Albert, K. Kording, M. Herrmann, and A. Jayaraman, “Fall Classifica-
tion by Machine Learning Using Mobile Phones,” PLoS ONE, vol. 7, no. 5,
p. e36556, May 2012.
[425] A. H. Snijders, B. P. van de Warrenburg, N. Giladi, and B. R. Bloem, “Neu-
rological gait disorders in elderly people: clinical approach and classifica-
tion,” Lancet Neurol., vol. 6, no. 1, pp. 63–74, Jan. 2007.
CHAPTER 2. DISTRIBUTED COMPUTING AND MONITORING TECHNOLOGIES FOR OLDER PATIENTS
149
[426] B. Roark, M. Mitchell, J. Hosom, K. Hollingshead, and J. Kaye, “Spoken
Language Derived Measures for Detecting Mild Cognitive Impairment,”
IEEE Trans. Audio Speech Lang. Process., vol. 19, no. 7, pp. 2081–2090,
2011.
[427] S. Khawandi, A. Ballit, and B. Daya, “Applying Machine Learning Algo-
rithm in Fall Detection Monitoring System,” in 2013 5th International Con-
ference on Computational Intelligence and Communication Networks
(CICN), 2013, pp. 247–250.
[428] A. Oguz Kansiz, M. Amac Guvensan, and H. Irem Turkmen, “Selection of
Time-Domain Features for Fall Detection Based on Supervised Learning,” in
Proceedings of the World Congress on Engineering and Computer Science
2013, San Francisco, USA, 2013, vol. 2, pp. 796–801.
[429] H. G. Hong and X. He, “Prediction of Functional Status for the Elderly
Based on a New Ordinal Regression Model,” J. Am. Stat. Assoc., vol. 105,
no. 491, pp. 930–941, Sep. 2010.
[430] S. Rose, “Mortality Risk Score Prediction in an Elderly Population Using
Machine Learning,” Am. J. Epidemiol., vol. 177, no. 5, pp. 443–452, Mar.
2013.
[431] F. Cheng and Z. Zhao, “Machine learning-based prediction of drug–drug
interactions by integrating drug phenotypic, therapeutic, chemical, and ge-
nomic properties,” J. Am. Med. Inform. Assoc., Mar. 2014.
[432] Y. Yang, A. Hauptmann, M. Chen, Y. Cai, A. Bharucha, and H. Wactlar,
“Learning to predict health status of geriatric patients from observational da-
ta,” in 2012 IEEE Symposium on Computational Intelligence in Bioinformat-
ics and Computational Biology (CIBCB), 2012, pp. 127–134.
[433] M. Marschollek, A. Rehwald, K.-H. Wolf, M. Gietzelt, G. Nemitz, H. M. zu
Schwabedissen, and M. Schulze, “Sensors vs. experts - A performance com-
parison of sensor-based fall risk assessment vs. conventional assessment in a
sample of geriatric patients,” BMC Med. Inform. Decis. Mak., vol. 11, no. 1,
pp. 1–7, Dec. 2011.
[434] M. Marschollek, M. Gövercin, S. Rust, M. Gietzelt, M. Schulze, K.-H. Wolf,
and E. Steinhagen-Thiessen, “Mining geriatric assessment data for in-patient
fall prediction models and high-risk subgroups,” BMC Med. Inform. Decis.
Mak., vol. 12, no. 1, pp. 1–6, Dec. 2012.
[435] W. R. Shankle, A. K. Romney, J. Hara, D. Fortier, M. B. Dick, J. M. Chen,
T. Chan, and X. Sun, “Methods to improve the detection of mild cognitive
impairment,” Proc. Natl. Acad. Sci. U. S. A., vol. 102, no. 13, pp. 4919–
4924, Mar. 2005.
VISUAL ANALYSIS OF FACES WITH APPLICATION IN BIOMETRICS, FORENSICS AND HEALTH INFORMATICS
150
[436] T. van Kasteren, A. Noulas, G. Englebienne, and B. Kröse, “Accurate Activ-
ity Recognition in a Home Setting,” in Proceedings of the 10th International
Conference on Ubiquitous Computing, New York, NY, USA, 2008, pp. 1–9.
[437] A. Reiss and D. Stricker, “Creating and Benchmarking a New Dataset for
Physical Activity Monitoring,” in Proceedings of the 5th International Con-
ference on PErvasive Technologies Related to Assistive Environments, New
York, NY, USA, 2012, pp. 40:1–40:8.
[438] L.-N. Li, J.-H. Ouyang, H.-L. Chen, and D.-Y. Liu, “A Computer Aided Di-
agnosis System for Thyroid Disease Using Extreme Learning Machine,” J.
Med. Syst., vol. 36, no. 5, pp. 3327–3337, Oct. 2012.
[439] Y. Yang, A. Hauptmann, M. Chen, Y. Cai, A. Bharucha, and H. Wactlar,
“Learning to predict health status of geriatric patients from observational da-
ta,” in 2012 IEEE Symposium on Computational Intelligence in Bioinformat-
ics and Computational Biology (CIBCB), 2012, pp. 127–134.
[440] J. Petersen, N. Larimer, J. A. Kaye, M. Pavel, and T. L. Hayes, “SVM to
detect the presence of visitors in a smart home environment,” in 2012 Annu-
al International Conference of the IEEE Engineering in Medicine and Biol-
ogy Society (EMBC), 2012, pp. 5850–5853.
[441] J. Lafferty, “Conditional random fields: Probabilistic models for segmenting
and labeling sequence data,” 2001, pp. 282–289.
[442] L. T. Vinh, S. Lee, H. X. Le, H. Q. Ngo, H. I. Kim, M. Han, and Y.-K. Lee,
“Semi-Markov conditional random fields for accelerometer-based activity
recognition,” Appl. Intell., vol. 35, no. 2, pp. 226–241, Oct. 2011.
[443] T. Šmuc, D. Gamberger, and G. Krstačić, “Combining Unsupervised and
Supervised Machine Learning in Analysis of the CHD Patient Database,” in
Artificial Intelligence in Medicine, S. Quaglini, P. Barahona, and S. Andre-
assen, Eds. Springer Berlin Heidelberg, 2001, pp. 109–112.
[444] M. Obayya and F. Abou-Chadi, “Data fusion for heart diseases classification
using multi-layer feed forward neural network,” in International Conference
on Computer Engineering Systems, 2008. ICCES 2008, 2008, pp. 67 –70.
[445] T. Obo and N. Kubota, “Remote monitoring and control using smart phones
and sensor networks,” in 2012 IEEE 1st Global Conference on Consumer
Electronics (GCCE), 2012, pp. 466–469.
[446] N. Ravi, N. D, P. Mysore, and M. L. Littman, “Activity recognition from
accelerometer data,” in In Proceedings of the Seventeenth Conference on In-
novative Applications of Artificial Intelligence(IAAI, 2005, pp. 1541–1546.
[447] L. Bao and S. S. Intille, “Activity recognition from user-annotated accelera-
tion data,” pp. 1–17, 2004.

CHAPTER 2. DISTRIBUTED COMPUTING AND MONITORING TECHNOLOGIES FOR OLDER PATIENTS
151
[448] C. Franco, J. Demongeot, C. Villemazet, and N. Vuillerme, “Behavioral
Telemonitoring of the Elderly at Home: Detection of Nycthemeral Rhythms
Drifts from Location Data,” in 2010 IEEE 24th International Conference on
Advanced Information Networking and Applications Workshops (WAINA),
2010, pp. 759–766.
[449] M. Cherkassky, “Application of machine learning methods to medical diag-
nosis,” CHANCE, vol. 22, no. 1, pp. 42–50, Mar. 2009.
[450] L. Clifton, D. A. Clifton, M. Pimentel, P. J. Watkinson, and L. Tarassenko,
“Gaussian Processes for Personalized e-Health Monitoring With Wearable
Sensors,” IEEE Trans. Biomed. Eng., vol. 60, no. 1, pp. 193 –197, Jan. 2013.
[451] D. Wong, D. A. Clifton, and L. Tarassenko, “Probabilistic detection of vital
sign abnormality with Gaussian process regression,” in 2012 IEEE 12th In-
ternational Conference on Bioinformatics Bioengineering (BIBE), 2012, pp.
187 –192.
[452] J. Chen, J. Zhang, A. H. Kam, and L. Shue, “An automatic acoustic bath-
room monitoring system,” in IEEE International Symposium on Circuits and
Systems, 2005. ISCAS 2005, 2005, pp. 1750 – 1753 Vol. 2.
[453] C. E. Rasmussen and C. K. I. Williams, Gaussian processes for machine
learning. Cambridge, Mass.: MIT Press, 2006.
[454] N. C. Laydrus, E. Ambikairajah, and B. Celler, “Automated Sound Analysis
System for Home Telemonitoring using Shifted Delta Cepstral Features,” in
2007 15th International Conference on Digital Signal Processing, 2007, pp.
135–138.
[455] V. Libal, B. Ramabhadran, N. Mana, F. Pianesi, P. Chippendale, O. Lanz,
and G. Potamianos, “Multimodal Classification of Activities of Daily Living
Inside Smart Homes,” in Distributed Computing, Artificial Intelligence, Bio-
informatics, Soft Computing, and Ambient Assisted Living, S. Omatu, M. P.
Rocha, J. Bravo, F. Fernández, E. Corchado, A. Bustillo, and J. M. Corcha-
do, Eds. Springer Berlin Heidelberg, 2009, pp. 687–694.
[456] X. Zhuang, J. Huang, G. Potamianos, and M. Hasegawa-Johnson, “Acoustic
fall detection using Gaussian mixture models and GMM supervectors,” in
IEEE International Conference on Acoustics, Speech and Signal Processing,
2009. ICASSP 2009, 2009, pp. 69–72.
[457] M. A. Salama, A. E. Hassanien, and A. A. Fahmy, “Deep Belief Network for
clustering and classification of a continuous data,” in 2010 IEEE Interna-
tional Symposium on Signal Processing and Information Technology
(ISSPIT), 2010, pp. 473 –477.

VISUAL ANALYSIS OF FACES WITH APPLICATION IN BIOMETRICS, FORENSICS AND HEALTH INFORMATICS
152
[458] J. Q. Shi, R. Murray-Smith, and D. M. Titterington, “Hierarchical Gaussian
process mixtures for regression,” Stat. Comput., vol. 15, no. 1, pp. 31–41,
Jan. 2005.
[459] S. J. McKenna and H. N. Charif, “Summarising contextual activity and de-
tecting unusual inactivity in a supportive home environment,” Pattern Anal.
Appl., vol. 7, no. 4, pp. 386–401, Dec. 2004.
[460] L. Wang, T. Gu, X. Tao, H. Chen, and J. Lu, “Multi-User Activity Recogni-
tion in a Smart Home,” in Activity Recognition in Pervasive Intelligent Envi-
ronments, L. Chen, C. D. Nugent, J. Biswas, and J. Hoey, Eds. Atlantis
Press, 2011, pp. 59–81.
[461] Y. Tong and R. Chen, “Latent-Dynamic Conditional Random Fields for rec-
ognizing activities in smart homes,” J. Ambient Intell. Smart Environ., vol.
6, no. 1, pp. 39–55, Jan. 2014.
[462] C. M. Bishop, Pattern Recognition and Machine Learning, 1st ed. 2006.
Corr. 2nd printing 2011. Springer, 2007.
[463] I. Kononenko, “Machine learning for medical diagnosis: history, state of the
art and perspective,” Artif. Intell. Med., vol. 23, no. 1, pp. 89–109, Aug.
2001.
[464] B. Settles, “From theories to queries: Active learning in practice,” Act.
Learn. Exp. Des. W, pp. 1–18, 2011.
[465] V. López, A. Fernández, J. G. Moreno-Torres, and F. Herrera, “Analysis of
preprocessing vs. cost-sensitive learning for imbalanced classification. Open
problems on intrinsic data characteristics,” Expert Syst. Appl., vol. 39, no. 7,
pp. 6585–6608, Jun. 2012.
[466] B. Das, N. C. Krishnan, and D. J. Cook, “Handling Class Overlap and Im-
balance to Detect Prompt Situations in Smart Homes,” in 2013 IEEE 13th
International Conference on Data Mining Workshops (ICDMW), 2013, pp.
266–273.
[467] N. V. Chawla, K. W. Bowyer, L. O. Hall, and W. P. Kegelmeyer, “SMOTE:
Synthetic Minority Over-sampling Technique,” J. Artif. Intell. Res., vol. 16,
pp. 321–357, 2002.
[468] Z. Zeng and Q. Ji, “Knowledge Based Activity Recognition with Dynamic
Bayesian Network,” in Computer Vision – ECCV 2010, K. Daniilidis, P.
Maragos, and N. Paragios, Eds. Springer Berlin Heidelberg, 2010, pp. 532–
546.
[469] A. Ozcift and A. Gulten, “Classifier ensemble construction with rotation
forest to improve medical diagnosis performance of machine learning algo-

CHAPTER 2. DISTRIBUTED COMPUTING AND MONITORING TECHNOLOGIES FOR OLDER PATIENTS
153
rithms,” Comput. Methods Programs Biomed., vol. 104, no. 3, pp. 443–451,
Dec. 2011.
[470] G. Meyfroidt, F. Güiza, J. Ramon, and M. Bruynooghe, “Machine learning
techniques to examine large patient databases,” Best Pract. Res. Clin. Anaes-
thesiol., vol. 23, no. 1, pp. 127–143, Mar. 2009.
[471] “WHO | Medical Device – Full Definition,” WHO. [Online]. Available:
http://www.who.int/medical_devices/full_deffinition/en/. [Accessed: 10-
Sep-2015].
[472] C. for D. and R. Health, “FDA Basics - Are medical devices regulated for
non-medical reasons?” [Online]. Available:
http://www.fda.gov/AboutFDA/Transparency/Basics/ucm302659.htm. [Ac-
cessed: 10-Sep-2015].
[473] Council of the European Communities, “Council Directive 93/42/EEC con-
cerning medical devices,” Off. J., pp. 1–60, 2007.
[474] European Commission, “Implementation of Directive 2007/47/EC amending
Directives 90/385/EEC, 93/42/EEC and 98/8/EC.” European Commission,
Jun-2009.
[475] MDC Medical Device Certification Gmbh, “Basic Information about the
European Directive 93/42/EEC on Medical Devices.” 13-Nov-2009.
[476] International Organization for Standardization, “ISO 13485:2003 - Medical
devices -- Quality management systems -- Requirements for regulatory pur-
poses,” 2003. [Online]. Available:
http://www.iso.org/iso/home/store/catalogue_tc/catalogue_detail.htm?csnum
ber=36786. [Accessed: 11-Sep-2015].
[477] International Organization for Standardization, “ISO 14971:2007 - Medical
devices -- Application of risk management to medical devices,” 2007.
[Online]. Available:
http://www.iso.org/iso/catalogue_detail?csnumber=38193. [Accessed: 11-
Sep-2015].
[478] International Electrotechnical Commission, “IEC 60601-1:2015 SER Series
| Medical electrical equipment - ALL PARTS,” 2015. [Online]. Available:
https://webstore.iec.ch/publication/2612. [Accessed: 11-Sep-2015].
[479] International Electrotechnical Commission, “IECEE TRF 60601-1-2:2015 |
Medical electrical equipment - Part 1-2: General requirements for basic safe-
ty and essential performance - Collateral Standard: Electromagnetic disturb-
ances - Requirements and tests.,” 2015. [Online]. Available:
https://webstore.iec.ch/publication/8218. [Accessed: 17-Sep-2015].

VISUAL ANALYSIS OF FACES WITH APPLICATION IN BIOMETRICS, FORENSICS AND HEALTH INFORMATICS
154
[480] International Electrotechnical Commission, “IECEE TRF 60601-1-6:2014 |
Medical electrical equipment - Part 1-6: General requirements for basic safe-
ty and essential performance - Collateral standard: Usability,” 2014.
[Online]. Available: https://webstore.iec.ch/publication/8225. [Accessed: 17-
Sep-2015].
[481] “IEC 60601-1-8:2006 - Medical electrical equipment -- Part 1-8: General
requirements for basic safety and essential performance -- Collateral stand-
ard: General requirements, tests and guidance for alarm systems in medical
electrical equipment and medical electrical systems,” 2006. [Online]. Avail-
able:
http://www.iso.org/iso/home/store/catalogue_tc/catalogue_detail.htm?csnum
ber=41986. [Accessed: 11-Sep-2015].
[482] International Electrotechnical Commission, “IEC 60601-1-9:2007 | Medical
electrical equipment - Part 1-9: General requirements for basic safety and es-
sential performance - Collateral Standard: Requirements for environmentally
conscious design,” 2007. [Online]. Available:
https://webstore.iec.ch/publication/2601. [Accessed: 17-Sep-2015].
[483] International Electrotechnical Commission, “IEC 60601-1-11:2015 - Medi-
cal electrical equipment -- Part 1-11: General requirements for basic safety
and essential performance -- Collateral standard: Requirements for medical
electrical equipment and medical electrical systems used in the home
healthcare environment,” 2015. [Online]. Available:
http://www.iso.org/iso/home/store/catalogue_tc/catalogue_detail.htm?csnum
ber=65529. [Accessed: 11-Sep-2015].
[484] International Electrotechnical Commission, “IEC 62304:2006 - Medical de-
vice software -- Software life cycle processes,” 2006. [Online]. Available:
http://www.iso.org/iso/catalogue_detail.htm?csnumber=38421. [Accessed:
16-Sep-2015].
[485] International Organization for Standardization, “ISO 10993-1:2009 - Biolog-
ical evaluation of medical devices -- Part 1: Evaluation and testing within a
risk management process,” 2009. [Online]. Available:
http://www.iso.org/iso/catalogue_detail.htm?csnumber=44908. [Accessed:
17-Sep-2015].
[486] International Organization for Standardization, “ISO 15223-1:2012 - Medi-
cal devices -- Symbols to be used with medical device labels, labelling and
information to be supplied -- Part 1: General requirements,” 2012. [Online].
Available: http://www.iso.org/iso/catalogue_detail.htm?csnumber=50335.
[Accessed: 17-Sep-2015].
CHAPTER 2. DISTRIBUTED COMPUTING AND MONITORING TECHNOLOGIES FOR OLDER PATIENTS
155
[487] British Standards Institution, “BS EN 1041:2008+A1:2013,” 2013. [Online].
Available: http://www.techstreet.com/products/1867028#jumps. [Accessed:
17-Sep-2015].
[488] International Organization for Standardization, “ISO 14155:2011 - Clinical
investigation of medical devices for human subjects -- Good clinical prac-
tice,” 2011. [Online]. Available:
http://www.iso.org/iso/catalogue_detail?csnumber=45557. [Accessed: 17-
Sep-2015].
[489] European Commission, “MEDDEV 2.7.1 Rev.3:2009 Guidelines on Medical
Devices. Clinical evaluation: A guide for manufacturers and notified bod-
ies.” GHTF, 2009.
[490] International Electrotechnical Commission, “IEC 62366-1:2015 - Medical
devices -- Part 1: Application of usability engineering to medical devices,”
2015. [Online]. Available:
http://www.iso.org/iso/catalogue_detail.htm?csnumber=63179. [Accessed:
11-Sep-2015].
[491] International Organization for Standardization, “ISO 27001 - Information
security management,” 2013. [Online]. Available:
http://www.iso.org/iso/home/standards/management-
standards/iso27001.htm. [Accessed: 16-Sep-2015].
[492] International Organization for Standardization, “ISO/IEC 25010:2011 - Sys-
tems and software engineering -- Systems and software Quality Require-
ments and Evaluation (SQuaRE) -- System and software quality models,”
2011. [Online]. Available:
http://www.iso.org/iso/home/store/catalogue_ics/catalogue_detail_ics.htm?c
snumber=35733. [Accessed: 16-Sep-2015].
[493] “Medical devices - European Commission,” Jul-2015. [Online]. Available:
http://ec.europa.eu/growth/single-market/european-standards/harmonised-
standards/medical-devices/index_en.htm. [Accessed: 11-Sep-2015].
[494] K. Yogesan, P. Brett, and M. C. Gibbons, Handbook of Digital Homecare.
Springer Science & Business Media, 2009.
[495] J. Dalton, M. McGrath, M. Pavel, and H. Jimison, “Home and Mobile Moni-
toring Systems,” CAPSIL, School of Public Health, Physiotherapy, and
Population Science, Dublin, Ireland, Deliverable, Roadmap Draft 3.12, May
2009.
[496] B. Ni, G. Wang, and P. Moulin, “RGBD-HuDaAct: A color-depth video da-
tabase for human daily activity recognition,” in 2011 IEEE International
Conference on Computer Vision Workshops (ICCV Workshops), 2011, pp.
1147–1153.

VISUAL ANALYSIS OF FACES WITH APPLICATION IN BIOMETRICS, FORENSICS AND HEALTH INFORMATICS
156
[497] D. Roggen, A. Calatroni, M. Rossi, T. Holleczek, K. F{ö}rster, G. Tr{ö}ster,
P. Lukowicz, D. Bannach, G. Pirkl, A. Ferscha, J. Doppler, C. Holzmann,
M. Kurz, G. Holl, R. Chavarriaga, M. Creatura, and Del, “Collecting com-
plex activity data sets in highly rich networked sensor environments,” pre-
sented at the Proceedings of the 7th International Conference on Networked
Sensing Systems (INSS), Kassel, Germany, 2010.
[498] Center for Advanced Studies in Adaptive Systems, “Datasets,” WSU CASAS,
2014. .
[499] Parisa Rashidi, “Ambient Intelligence Datasets,” Aug-2013. [Online]. Avail-
able: http://www.cise.ufl.edu/~prashidi/Datasets/ambientIntelligence.html.
[Accessed: 18-Sep-2015].
[500] E. M. Tapia, S. S. Intille, and K. Larson, “Activity Recognition in the Home
Using Simple and Ubiquitous Sensors,” in Pervasive Computing, A. Ferscha
and F. Mattern, Eds. Springer Berlin Heidelberg, 2004, pp. 158–175.
[501] B. Yogameena, G. Deepika, and J. Mehjabeen, “RVM Based Human Fall
Analysis for Video Surveillance Applications,” Res. J. Appl. Sci. Eng. Tech-
nol., vol. 4, no. 24, pp. 5361–5366, 2012.
[502] E. Auvinet, C. Rougier, J. Meunier, A. St-Arnaud, and J. Rousseau, “Multi-
ple cameras fall dataset,” DIRO-Univ. Montr. Tech Rep, vol. 1350, 2010.
[503] E. Auvinet, F. Multon, A. Saint-Arnaud, J. Rousseau, and J. Meunier, “Fall
detection with multiple cameras: An occlusion-resistant method based on 3-
d silhouette vertical distribution,” Inf. Technol. Biomed. IEEE Trans. On,
vol. 15, no. 2, pp. 290–300, 2011.
[504] D. H. Hung and H. Saito, “The Estimation of Heights and Occupied Areas of
Humans from Two Orthogonal Views for Fall Detection,” 電気学会論文誌
C 電子・情報・システム部門誌, vol. 133, no. 1, pp. 117–127, 2013.
[505] D. H. Hung and H. Saito, “Fall Detection with Two Cameras based on Oc-
cupied Area,” in Proc. of 18th Japan-Korea Joint Workshop on Frontier in
Computer Vision, 2012, pp. 33–39.
[506] C. Rougier, A. St-Arnaud, J. Rousseau, and J. Meunier, Video surveillance
for fall detection. INTECH Open Access Publisher, 2011.
[507] T. Liu, H. Yao, R. Ji, Y. Liu, X. Liu, X. Sun, P. Xu, and Z. Zhang, “Vision-
Based Semi-supervised Homecare with Spatial Constraint,” in Advances in
Multimedia Information Processing-PCM 2008, Springer, 2008, pp. 416–
425.
[508] C. Zhang, Y. Tian, and E. Capezuti, Privacy preserving automatic fall detec-
tion for elderly using RGBD cameras. Springer, 2012.

CHAPTER 2. DISTRIBUTED COMPUTING AND MONITORING TECHNOLOGIES FOR OLDER PATIENTS
157
[509] D. Anderson, R. Luke, M. Skubic, J. M. Keller, M. Rantz, and M. Aud,
“Evaluation of a video based fall recognition system for elders using voxel
space,” Gerontechnology, vol. 7, no. 2, p. 68, 2008.
[510] I. Charfi, J. Miteran, J. Dubois, M. Atri, and R. Tourki, “Definition and Per-
formance Evaluation of a Robust SVM Based Fall Detection Solution,” in
Signal Image Technology and Internet Based Systems (SITIS), 2012 Eighth
International Conference on, 2012, pp. 218–224.
[511] J. E. Rougui, D. Istrate, and W. Souidene, “Audio sound event identification
for distress situations and context awareness,” in Engineering in Medicine
and Biology Society, 2009. EMBC 2009. Annual International Conference of
the IEEE, 2009, pp. 3501–3504.
[512] J. Montalvao, D. Istrate, J. Boudy, and J. Mouba, “Sound event detection in
remote health care-small learning datasets and over constrained Gaussian
Mixture Models,” in Engineering in Medicine and Biology Society (EMBC),
2010 Annual International Conference of the IEEE, 2010, pp. 1146–1149.
[513] B. Bonroy, P. Schiepers, G. Leysens, D. Miljkovic, M. Wils, L. De Maess-
chalck, S. Quanten, E. Triau, V. Exadaktylos, D. Berckmans, and others,
“Acquiring a dataset of labeled video images showing discomfort in dement-
ed elderly,” ℡EMEDICINE E-Health, vol. 15, no. 4, pp. 370–378, 2009.
[514] H. Cheng, Z. Liu, Y. Zhao, G. Ye, and X. Sun, “Real world activity sum-
mary for senior home monitoring,” Multimed. Tools Appl., vol. 70, no. 1, pp.
177–197, 2014.
[515] E. Syngelakis and J. Collomosse, “A bag of features approach to ambient
fall detection for domestic elder-care,” 2011.
[516] R. Romdhane, E. Mulin, A. Derreumeaux, N. Zouba, J. Piano, L. Lee, I.
Leroi, P. Mallea, R. David, M. Thonnat, and others, “Automatic video moni-
toring system for assessment of Alzheimer’s disease symptoms,” J. Nutr.
Health Aging, vol. 16, no. 3, pp. 213–218, 2012.
[517] N. Z. E. Valentin, “Multisensor Fusion for Monitoring Elderly Activities at
Home,” Université Nice Sophia Antipolis, 2010.
[518] O. Baños, M. Damas, H. Pomares, I. Rojas, M. A. Tóth, and O. Amft, “A
Benchmark Dataset to Evaluate Sensor Displacement in Activity Recogni-
tion,” in Proceedings of the 2012 ACM Conference on Ubiquitous Compu-
ting, New York, NY, USA, 2012, pp. 1026–1035.
[519] B. Kaluža, B. Cvetković, E. Dovgan, H. Gjoreski, M. Gams, M. Luštrek, and
V. Mirchevska, “A Multi-Agent Care System to Support Independent Liv-
ing,” Int. J. Artif. Intell. Tools, vol. 23, no. 01, p. 1440001, Jan. 2014.

VISUAL ANALYSIS OF FACES WITH APPLICATION IN BIOMETRICS, FORENSICS AND HEALTH INFORMATICS
158
[520] H. Chen and S. E. Levkoff, “Delivering Telemonitoring Care to Digitally
Disadvantaged Older Adults: Human-Computer Interaction (HCI) Design
Recommendations,” in Human Aspects of IT for the Aged Population. De-
sign for Everyday Life, J. Zhou and G. Salvendy, Eds. Springer International
Publishing, 2015, pp. 50–60.

159
PART III
FACE QUALITY ASSESSMENT


161
CHAPTER 3. REAL-TIME ACQUISITION
OF HIGH QUALITY FACE SEQUENCES
FROM AN ACTIVE PAN-TILT-ZOOM
CAMERA
Mohammad Ahsanul Haque, Kamal Nasrollahi, and Thomas B. Moeslund
This paper has been published in the
Proceedings of the 10th IEEE International Conference on Advanced Video and
Signal Based Surveillance (AVSS)
pp. 443-448, 2013
© 2013 IEEE
The layout has been revised.


163
3.1. ABSTRACT
Traditional still camera-based facial image acquisition systems in surveillance
applications produce low quality face images. This is mainly due to the distance
between the camera and subjects of interest. Furthermore, people in such videos
usually move around, change their head poses, and facial expressions. Moreover,
the imaging conditions like illumination, occlusion, and noise may change. These
all aggregate the quality of most of the detected face images in terms of measures
like resolution, pose, brightness, and sharpness. To deal with these problems this
chapter presents an active camera-based real-time high-quality face image acquisi-
tion system, which utilizes pan-tilt-zoom parameters of a camera to focus on a hu-
man face in a scene and employs a face quality assessment method to log the best
quality faces from the captured frames. The system consists of four modules: face
detection, camera control, face tracking, and face quality assessment before log-
ging. Experimental results show that the proposed system can effectively log the
high quality faces from the active camera in real-time (an average of 61.74ms was
spent per frame) with an accuracy of 85.27% compared to human annotated data.
3.2. INTRODUCTION
Computer-based automatic analysis of facial image has important applications in
many different areas, such as, surveillance, medical diagnosis, biometrics, expres-
sion recognition and social cue analysis [1]. However, acquisition of qualified and
applicable images from a camera setup or a video clip is essentially the first step of
facial image analysis. The application performance greatly depends upon the quali-
ty of the face in the image. A number of parameters such as face resolution, pose,
brightness, and sharpness determine the quality of a face image. When a video
based practical image acquisition system produces too many facial images to be
processed in surveillance applications, most of these images are subjected to the
aforementioned problems [2]. For example, a human face at 5 meters distance from
the camera subtends only about 4x6 pixels on a 640x480 sensor with 130 degrees
field of view, which is mostly insufficient resolution for further processing [3]. In
order to get rid of the computational cost and inaccuracy problem of low quality
facial image processing, a Face Quality Assessment (FQA) technique can be em-
ployed to select the qualified faces from the image frames captured by a camera [4].
This reduces significant amount of disqualified faces from the captured imagery
and keeps a small number of best face images which are named as face sequence or
so called Face Log. However, FQA merely checks whether a face is qualified or
not, and cannot increase the quality of captured face. Besides, processing time to
determine the face quality is also an obstacle to achieve real-time performance
while extracting faces from video sequences. A possible solution to low resolution
faces from a video sequence is to employ techniques like Super-Resolution (SR)
image reconstruction algorithms, to generate high resolution faces [5]. However, it

VISUAL ANALYSIS OF FACES WITH APPLICATION IN BIOMETRICS, FORENSICS AND HEALTH INFORMATICS
164
is still an active research area and subjected to problems like huge computational
costs, uncertainty in reconstructed high frequency components, and small doable
magnification factor [6]. On the other hand, due to improvements in digital Pan-
Tilt-Zoom (PTZ) camera technology and availability of PTZ cameras in low cost,
acquisition of high resolution facial images in surveillance, forensic and medical
applications by directly using camera instead of SR techniques is an emerging field
of study [7].
Figure 3-1 Block diagram of a typical facial image acquisition system with face quality measure.
A typical facial image acquisition system including FQA is shown in Figure 3-1,
which was proposed in [4]. Given a video sequence in the face detection step the
regions including a face are detected and are considered as Region of Interest (ROI)
in the frames. Then, a FQA algorithm assesses the ROIs in terms of face quality
measures and stores the best quality faces in face log.
A vast body of literature addressed different issues of facial image acquisition.
An appearance-based approach to real-time face detection from video frames was
proposed in [8] which merely work in real-time in VGA resolution images. For
real-time face detection in high resolution image frames, Mustafah et al. proposed
two high resolution (5 MP) smart camera-based systems by extending the works of
[9-10]. Cheng et al. also proposed a face detection method in high resolution image-
ry by employing a grid sampling and a skin color based approach [11]. For dealing
with too low-resolution faces in surveillance videos in [3] and [12], networks of two
active cameras were proposed to detect faces in a wide-view camera and later ex-
tract high resolution face images in a narrow-view camera by using PTZ control.
When a face is detected in a video frame, instead of detecting face in further
frames of that video clip it can be tracked. Tracking of a face in video frames has
been proposed by using still camera and active PTZ camera in [13] and [14-15],
respectively. In [14], an adaptive algorithm was employed along with some features
extracted from face motion in order to calculate pan and tilt parameters (not includ-
ing zoom parameter) of the camera to track a face. In [15], the authors however
proposed a general object tracking framework by using a multi-step feature evalua-
Color Images from Video
Frames
Face Detection from
the Frames
Face Quality Assessment and
Selecting Best Faces

CHAPTER 3. REAL-TIME ACQUISITION OF HIGH QUALITY FACE SEQUENCES FROM AN ACTIVE PAN-TILT-ZOOM CAMERA
165
tion process and applied it to a face tracking application. They further extended
their method to extract high resolution face sequences [7].
In addition to the above mentioned face detection and face tracking methods in
video, a number of methods proposed for face quality assessment and/or face log-
ging. Kamal et al. proposed a face quality assessment system in video sequences by
using four quality metrics- resolution, brightness, sharpness, and pose [4]. This
method was further extended for near infrared scenario and was included two more
quality metrics- eye status (open/close) and mouth status (open/closed) [16]. In
[17-18], two FQA methods have been proposed in order to improve face recogni-
tion performance. Instead of using threshold based quality metrics, [17] used a mul-
ti-layer perceptron neural network with a face recognition method and a training
database. The neural network learns effective face features from the training data-
base and checks these features from the experimental faces to detect qualified can-
didates for face recognition. On the other hand, Wong et al. used a multi-step pro-
cedure with some probabilistic features to detect qualified faces [18]. Kamal et al.
explicitly addressed posterity facial logging problem by building sequences of in-
creasing quality face images from a video sequence [2]. They employed a method
which uses a fuzzy combination of primitive quality measures instead of a linear
combination. This method was further improved in [19] by incorporating multi-
target tracking capability along with a multi-pose face detection method.
Through our intensive study so far, we observed that networks of wide-view and
narrow-view PTZ camera have been employed for high resolution facial image
capture [3, 7, 12]. However, the quality of images was not assessed while the PTZ
features of the cameras are active. On the other hand, some FQA methods have
been utilized for posterity logging of face sequences from offline video clips [2, 4,
17-18]. Thus, in this article, we propose a way to real-time capturing of high quality
facial image sequences by addressing both quality and time complexity issues in an
active PTZ camera capture.
The rest of the chapter is organized as follows. Section three presents the pro-
posed approach. Section four describes the experimental environment and results.
Section five concludes the chapter.
3.3. THE PROPOSED APPROACH
A typical single PTZ camera based facial image acquisition system consists of a
face detection module, a camera control module, a face tracking module, and a face
logging module [7]. Face detection module detects face in an image while camera
sensor set in wide angle view. Camera control module utilizes the PTZ features of
the camera in order to zoom in narrowly the face area of the image. Face tracking
module tracks the face in subsequent frames captured by the camera. Finally, face
logging module stores the faces for further processing. While logging the faces, low
quality faces in terms of resolution, sharpness, brightness, and pose can be stored.

VISUAL ANALYSIS OF FACES WITH APPLICATION IN BIOMETRICS, FORENSICS AND HEALTH INFORMATICS
166
Moreover, non-face images can also be logged due to false positives produced by
tracking module. Thus, FQA module can be employed before face logging module.
However, all these steps are computationally expensive and need to be solved real-
time in order to develop an active camera based acquisition system. This chapter
proposes a real-time acquisition of high quality facial image from an active PTZ
camera by assessing some quality metrics using a FQA method.
The architecture of the proposed system are depicted in Figure 3-2 and de-
scribed in the following subsections.
3.3.1. FACE DETECTION MODULE
This module is responsible to detect face in the image frames. A well-known face
detection approach has been employed from [8], which is known as Viola and Jones
method. This method utilizes so called Haar-like features extracted by using Haar
wavelet. The Haar-like features are applied to sub-windows of the gray-scale ver-
sion of an image frame with varying scale and translation. An integral image is used
to reduce the redundant computation involved in computing many Haar-like fea-
tures across an image. A linear combination of some weak classifiers is used to
form a strong classifier in order to classify face and non-face by using an adaptive
boosting method. In order to speed up the detection process an evolutionary pruning
method from [20] is employed to form strong classifiers using fewer classifiers. In
the implementation of this article, the face detector was empirically configured
using the following constants:
Minimum search window size:
o 10x10 pixels in the initial camera frames
o 70x70 pixels in the zoomed and tracked frames
The scale change step: 10% increase per iteration
Merging factor: 3 overlapping detections
After initializing the camera, face detection module continuously run and try to
detect face. Once the face is detected, it transfers the control to the camera control
module by sending face ROI of the frame.
3.3.2. CAMERA CONTROL MODULE
When a face is detected in the face detection module, the size of the face is deter-
mined by the face bounding rectangle obtained from the output of the face detection
module. Suppose, an input image frame is expressed by a 2-tuples I(h, w), where h
is the height of the image in pixels and w is the width of the image in pixels. Then,
a face ROI in that image frame can be expressed by a 4-tuples F(x, y, h, w), where
(x, y) is the upper-left point of the rectangle in the image frame, and h and w are the

CHAPTER 3. REAL-TIME ACQUISITION OF HIGH QUALITY FACE SEQUENCES FROM AN ACTIVE PAN-TILT-ZOOM CAMERA
167
height and width of the face, respectively. Camera control module utilizes this in-
formation from the face detection module and automatically controls the camera to
zoom the face.
Figure 3-2 Block diagram of the proposed facial image acquisition system with face quality assessment.
Face Frame Area-zooming
using PTZ Control
Camera Control
Frames from Camera
Face Detection from the Frames
Face Detection
Face in the Zoomed Frame
Tracking in the
Subsequent
Frames
Face Tracking
Extracted Faces
from the Tracked
Area
Selecting & Storing
Best Faces after FQA
Face Quality Assessment
Active PTZ
Camera
Face Log
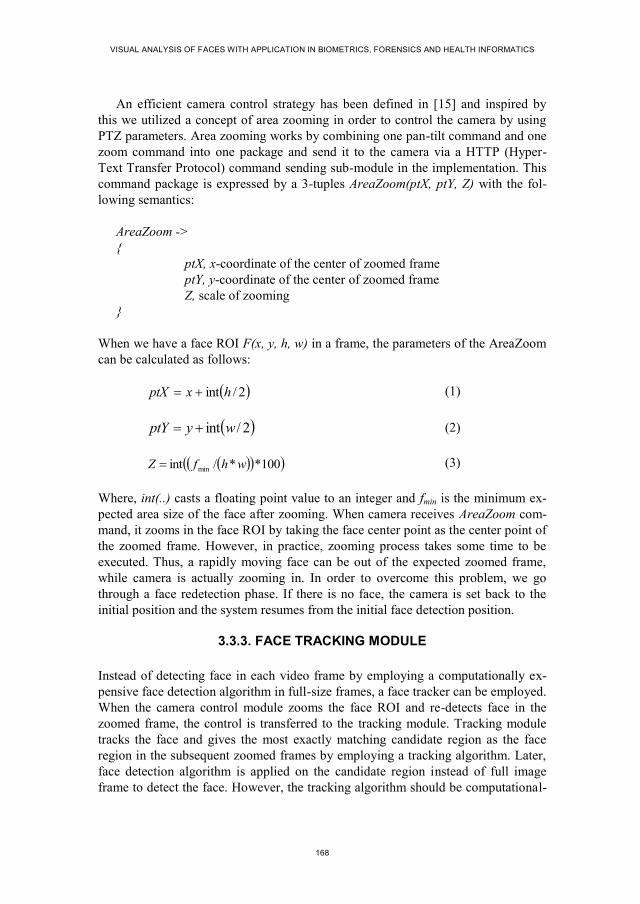
VISUAL ANALYSIS OF FACES WITH APPLICATION IN BIOMETRICS, FORENSICS AND HEALTH INFORMATICS
168
An efficient camera control strategy has been defined in [15] and inspired by
this we utilized a concept of area zooming in order to control the camera by using
PTZ parameters. Area zooming works by combining one pan-tilt command and one
zoom command into one package and send it to the camera via a HTTP (Hyper-
Text Transfer Protocol) command sending sub-module in the implementation. This
command package is expressed by a 3-tuples AreaZoom(ptX, ptY, Z) with the fol-
lowing semantics:
AreaZoom ->
{
ptX, x-coordinate of the center of zoomed frame
ptY, y-coordinate of the center of zoomed frame
Z, scale of zooming
}
When we have a face ROI F(x, y, h, w) in a frame, the parameters of the AreaZoom
can be calculated as follows:
2/int hxptX (1)
2/int wyptY (2)
100**/int min whfZ (3)
Where, int(..) casts a floating point value to an integer and fmin is the minimum ex-
pected area size of the face after zooming. When camera receives AreaZoom com-
mand, it zooms in the face ROI by taking the face center point as the center point of
the zoomed frame. However, in practice, zooming process takes some time to be
executed. Thus, a rapidly moving face can be out of the expected zoomed frame,
while camera is actually zooming in. In order to overcome this problem, we go
through a face redetection phase. If there is no face, the camera is set back to the
initial position and the system resumes from the initial face detection position.
3.3.3. FACE TRACKING MODULE
Instead of detecting face in each video frame by employing a computationally ex-
pensive face detection algorithm in full-size frames, a face tracker can be employed.
When the camera control module zooms the face ROI and re-detects face in the
zoomed frame, the control is transferred to the tracking module. Tracking module
tracks the face and gives the most exactly matching candidate region as the face
region in the subsequent zoomed frames by employing a tracking algorithm. Later,
face detection algorithm is applied on the candidate region instead of full image
frame to detect the face. However, the tracking algorithm should be computational-

CHAPTER 3. REAL-TIME ACQUISITION OF HIGH QUALITY FACE SEQUENCES FROM AN ACTIVE PAN-TILT-ZOOM CAMERA
169
ly inexpensive in order to ensure real-time acquisition of face image. Among differ-
ent tracking algorithms, we select a computationally inexpensive and highly compe-
tent tracking method known as Camshift. The performance of Camshift is evident
from [19] and [21].
Camshift tracker takes the input image in HSV color model, finds the object
center by iteratively examining a search window in the image frame by employing
color histogram technique, and finally detects the window size and rotation for the
object in the current frame. The readers are suggested to see [19] and [21] to get a
detailed description of Camshift. When Camshift tracker selects a candidate region
as the tracked face and a face detector validates it as face, the face is extracted from
the image frame. Later, it is transferred to the FQA module in order to measure the
quality metrics.
3.3.4. FACE QUALITY ASSESSMENT MODULE
FQA module is responsible to assess the quality of the extracted faces from the
video sequences captured by the camera. Which parameters can effectively deter-
mine face quality have been thoroughly studied in [2]. They selected some parame-
ters among a number of parameters defined by International Civil Aviation Organi-
zation (ICAO) for identification documents. A short list of important parameters is
shown in Table 3-1. Among these parameters four parameters were selected for
real-time camera capturing and face log generation. These parameters are: out-of-
plan face rotation (pose), sharpness, brightness, and resolution. In this chapter, we
utilize these four features in order to determine the face quality. A normalized score
with the range [0:1] is calculated for each parameter by employing empirical
thresholds for the parameters and a linear combination of scores has been utilized to
generate single score for each face. Thresholds are determined by using a scaling
factor with the analysis of [2]. Best faces are selected by thresholding the final sin-
gle score for each face. The basic calculation process of the parameters is described
in [2], we, however, include a short introduction below for readers’ interest. We
also include the changes necessary in the equations below in order to make it com-
patible with our proposed system to run in online real-time mode.
Pose estimation - Least out-of-plan rotated face: The face ROI is first converted into a binary image and the center of mass is calculated using:
A
jiibx
n
i
m
j
m
,1 1
,
A
jijby
n
i
m
j
m
,1 1
(4)
Then the geometric center of face region is detected and the distance between
the center of region and center of mass is calculated by:
22 )()( mcmc yyxxDist (5)

VISUAL ANALYSIS OF FACES WITH APPLICATION IN BIOMETRICS, FORENSICS AND HEALTH INFORMATICS
170
Finally the normalized score is calculated by:
min_max_
max_
ThTh
Th
PoseDistDist
DistDistP
(6)
Where mm yx , is the center of mass, b is the binary face image, m is the
width, n is the height, A is the area of image, x1, x2 and y1, y2 are the boundary
coordinate of the face, and DistTh_max and DistTh_min are the delimiters of the al-
lowable pose values.
Table 3-1 Some Significant Face Quality Assessment Parameters Defined by ICAO [2]
No. Parameter Name ICAO Requirement
1 Image Resolution At least 420x525
2 Sharpness & Brightness Not specified
3 Horizontal Eye Position Center
4 Vertical Eye Position 50-70% of the image height
5 Head Width Between 4:7 and 1:2
6 Head Height 70-80% of image height
7 Head Rotation About 5 degrees
Sharpness: Sharpness of a face image can be affected by motion blur or unfo-cused capture:
yxlowAyxAabsSharp ,, (7)
Sharpness’s associated score is calculated:
min_max_
min_
ThTh
Th
SharpSharpSharp
SharpSharpP
(8)
Where, lowA(x,y) is the low-pass filtered counterpart of the image A(x,y), and
SharpTh_max and SharpTh_min are the delimiters of the allowable sharpness to be
accepted.
Brightness: This parameter measures whether a face image is too dark to use. It is calculated by the average value of the illumination component of all pixels in an image. Thus, the brightness score is calculated by (9), where I(i,j) is the in-

CHAPTER 3. REAL-TIME ACQUISITION OF HIGH QUALITY FACE SEQUENCES FROM AN ACTIVE PAN-TILT-ZOOM CAMERA
171
tensity of pixels in the face image, and BrightTh_max and BrightTh_min are the de-limiters of the allowable brightness to be qualified.
min_max_
min_1 1
*
,
ThTh
Th
n
i
m
j
BrightBrightBright
Brightnm
jiI
P
(9)
Image size or resolution: Depending upon the application, face images with higher resolution generally yield better results than lower resolution faces. The score for image resolution is calculated by (10), where w is image width, h is image height, Widthth and Heightth are two thresholds for expected face height and width, respectively.
thth
SizeHeight
h
Width
wP ,1min
(10)
The final single score for each face is calculated by linearly combining the
abovementioned 4 quality parameters with empirically assigned weight factor, as
shown in (11):
4
1
4
1
i i
i ii
Score
w
PwQuality
(11)
Where, wi are the weight associated with Pi, and Pi are the score values for the pa-
rameters pose, sharpness, brightness and resolution, consecutively. Finally, the
faces exceeding a quality threshold QualityTh are selected for logging from the im-
agery.
3.4. EXPERIMENTAL RESULTS
3.4.1. EXPERIMENTAL ENVIRONMENT
The experimental system was implemented by using an off-the-shelf Axis PTZ 214
IP camera. The camera specification is given in Table 3-2. The camera was con-
nected with the computer via an Ethernet switch and camera control was accom-
plished by HTTP commands. The underlying algorithms of the system was imple-
mented in Visual C++ environment by utilizing two libraries OpenCV (computer
vision) and POCO (network package).
The empirical threshold values used in the implementation are listed in Table
3-3. These threshold values were determined by considering the quality metrics
requirements listed in Table 3-1 and the analysis showed in [2, 4]. We recorded
several video sequences by using the proposed camera capture system, which in-
volved both male and female objects from indoor and outdoor environment in dif-
ferent lighting conditions. Faces were extracted from the frames of 8 video clips

VISUAL ANALYSIS OF FACES WITH APPLICATION IN BIOMETRICS, FORENSICS AND HEALTH INFORMATICS
172
(named as, Sq1, Sq2, Sq3, Sq4, Sq5, Sq6, Sq7, and Sq8) and manually annotated to
high-quality and low-quality faces. This annotated dataset further used to evaluate
the performance.
Table 3-2 Camera Specification for Experimental Setup
Parameter Name Specification
Angle of View, FPS 2.70 - 480 , 21-30/s
Shutter Time and Resolution 1/10000s to 1s, 0.4MP
Pan Range and Speed + 1700 range, 1000/s speed
Titl Range and Speed -300 – 900 range, 900/s speed
Zoom 18x optical, 12x digital
Table 3-3 Parameters Used in the Implementation
Parameter Name(s) Value(s)
DistTh_max, DistTh_min 95, 30
SharpTh_max, SharpTh_min 105, 30
BrightTh_max, BrightTh_min 150, 80
WidthTh, HeightTh 310, 275
QualityTh 0.65
Weights: w1, w2, w3, w4 0.9, 1, 0.7, 0.5
3.4.2. PERFORMANCE EVALUATION
We employed the proposed approach to extract high quality faces from camera
frames. Figure 3-3 depicts some example faces extracted from Sq1, Sq2, Sq3, and
Sq4 by the system using FQA. Figure 3-4 shows some example faces which were
discarded due to failure to meet the quality requirements. As Camshift sometimes
track face-colored non-face region and generate false-positive results as shown in
Figure 3-4(a), face re-detection after Camshift tracking plays important role to re-
duce this error.
Table 3-4 summarizes the performance analysis data of the proposed approach
on the aforementioned 8 annotated video clips. The clips contain 9857 image
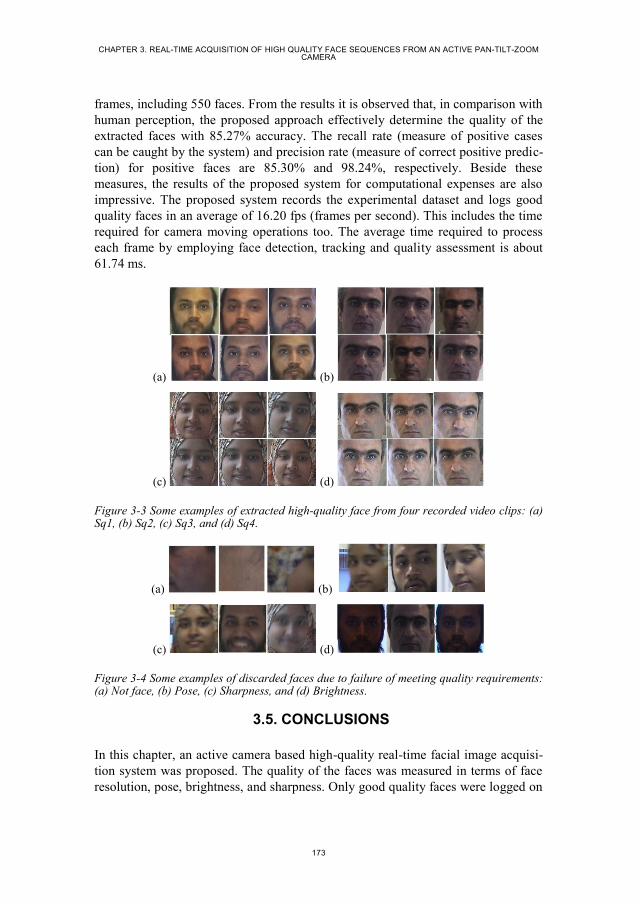
CHAPTER 3. REAL-TIME ACQUISITION OF HIGH QUALITY FACE SEQUENCES FROM AN ACTIVE PAN-TILT-ZOOM CAMERA
173
frames, including 550 faces. From the results it is observed that, in comparison with
human perception, the proposed approach effectively determine the quality of the
extracted faces with 85.27% accuracy. The recall rate (measure of positive cases
can be caught by the system) and precision rate (measure of correct positive predic-
tion) for positive faces are 85.30% and 98.24%, respectively. Beside these
measures, the results of the proposed system for computational expenses are also
impressive. The proposed system records the experimental dataset and logs good
quality faces in an average of 16.20 fps (frames per second). This includes the time
required for camera moving operations too. The average time required to process
each frame by employing face detection, tracking and quality assessment is about
61.74 ms.
(a) (b)
(c) (d)
Figure 3-3 Some examples of extracted high-quality face from four recorded video clips: (a) Sq1, (b) Sq2, (c) Sq3, and (d) Sq4.
(a) (b)
(c) (d)
Figure 3-4 Some examples of discarded faces due to failure of meeting quality requirements: (a) Not face, (b) Pose, (c) Sharpness, and (d) Brightness.
3.5. CONCLUSIONS
In this chapter, an active camera based high-quality real-time facial image acquisi-
tion system was proposed. The quality of the faces was measured in terms of face
resolution, pose, brightness, and sharpness. Only good quality faces were logged on

VISUAL ANALYSIS OF FACES WITH APPLICATION IN BIOMETRICS, FORENSICS AND HEALTH INFORMATICS
174
by discarding the non-qualified imagery. Experimental result showed that the sys-
tem is doable for real-time applications with an overall accuracy of 85.27% while
compared with human annotated data. However, the face detection framework
(Viola & Jones approach) utilized by the system is not robust to high degree of pose
variation and color histogram based Camshift tracking often produce false positive
results. Therefore, an effort is necessary to improve the system by addressing these
issues. Not to mention, incorporating multi-agent tracking within real-time frame-
work of an active camera is also an important issue to be addressed.
Table 3-4 Performance Analysis of High Quality Face Acquisition on the Experimental Da-taset
Seq. No. of
Frames
No. of
Tracked
Frames
No. of Faces in
Tracked
Frames
Correct
Detection
TP/TN
False De-
tection
FP/FN
Processing
Time (s)
Accuracy
& Speed
Sq1 1479 890 120 49/49 19/5 91 Accuracy
85.27%
Recall
85.30%
Precision
98.24%
Speed
16.20 fps
Sq2 1669 683 49 37/4 0/8 103
Sq3 656 201 48 43/1 1/3 40
Sq4 1491 813 18 13/4 1/0 94
Sq5 2037 1103 82 51/17 4/10 124
Sq6 447 188 71 52/7 2/10 28
Sq7 1034 770 124 48/65 2/9 64
Sq8 1044 660 38 3/26 3/6 65
3.6. ACKNOWLEDGEMENT
This work is supported by the Patient@home project which is granted by the Dan-
ish Research Council, DSF/RTI (SPIR).
3.7. REFERENCES
[1] S. Z. Li, and A. K. Jain, Handbook of Face Recognition, 2nd
Edition, DOI
10.1007/978-0-85729-932-1, 2011.
[2] K. Nasrollahi, and T. B. Moeslund, “Complete face logs for video sequences
using face quality measures,” IET Signal Porcessing, vol. 3, no. 4. Pp. 289-300,
DOI 10.1049/iet-spr.2008.0172, 2009.
CHAPTER 3. REAL-TIME ACQUISITION OF HIGH QUALITY FACE SEQUENCES FROM AN ACTIVE PAN-TILT-ZOOM CAMERA
175
[3] S. J. D. Prince, J. Elder, Y. Hou, M. Sizinstev, and E Olevskiy, “Towards Face
Recognition at a Distance,” Proc. Of the IET Conf. on Crime and Security, pp.
570-575, 2006.
[4] K. Nasrollahi, and T. B. Moeslund, “Face Quality Assessment System in Video
Sequences,” 1st European Workshop on Biometrics and Identity Management,
Springer-LNCS, vol. 5372, pp. 10-18, 2008.
[5] J. Tian, and K. K Ma, “A survery on super-resolution imaging,” Signal, Image
and Video Processing, vol. 5, no. 3, pp. 329-342, 2011.
[6] P. Milanfar, Super-Resolution Imaging, ISBN: 13:978-1-4398-1931-9, 2010.
[7] T. B. Dinh, N. Vo, and G. Medioni, “High Resolution Face Sequences from a
PTZ Network Camera,” Proc. of the IEEE Int. Conf. on Automatic Face &
Gesture Recognition and Workshops, pp. 531-538, 2011.
[8] P. Viola, and M. Jones, “Robust real-time face detection,” Proc. Of the 8th
IEEE Int. Conf. on Computer Vision, pp. 747, 2001.
[9] Y. M. Mustafah, T. Shan, A. W. Azman, A Bigdeli, and B. C. Lovell, “Real-
Time Face Detection and Tracking for High Resolution Smart Camera Sys-
tem,” Proc. Of the 9th
Biennial Conf. of the Australian Pattern Recognition So-
ciety on Digital Image Computing Techniques and Applications, pp. 387-393,
2007.
[10] Y. M. Mustafah, A. Bigdeli, A. W. Azman, and B. C. Lovell, “Face Detection
System Design for Real-Time High Resolution Smart Camera,” Proc. Of the
3rd
ACM/IEEE Int. Conf. on Distributed Smart Cameras, pp. 1-6, 2009.
[11] X. Cheng, R. Lakemond, C. Fookes, and S. Sridharan, “Efficient Real-Time
Face Detection For High Resolution Surveillance Applications,” Proc. Of the
6th
Int. Conf. on Signal Proce. and Comm. Systems, pp.1-6, 2012.
[12] F. W. Wheeler, R. L. Weiss, and P. H. Tu, “Face Recognition at a Distance
System for Surveillance Applications,” Proc. Of the 4th IEEE Int. Conf. on Bi-
ometrics, pp. 1-8, 2010.
[13] F. Nicolo, S. Parupati, V. Kulathumani, and N. A. Schmid, “Near real-time
face detection and recognition using a wireless camera network,” Proc. of Sig-
nal Processing, Sensor Fusion, and Target Recognition XXI, vol. 8392, DOI
10.1117/12.920696, 2012.
[14] P. Corcoran, E. Steingerg, P. Bigioi, and A. Brimbarean, “Real-Time Face
Tracking in a Digital Image Acquisition Device,” European Patent No. EP 2
052 349 B1, pages 25, 2007.
[15] P. S. Dhillon, “Robust Real-Time Face Tracking Using an Active Camera,”
Advances in Intellignet and Soft Computing: Computational Intelligences in
Security for Information Systems, vol. 63, pp. 179-186, 2009.
VISUAL ANALYSIS OF FACES WITH APPLICATION IN BIOMETRICS, FORENSICS AND HEALTH INFORMATICS
176
[16] T. Dinh, Q. Yu, and G. Medioni, “Real Time Tracking using an Active Pan-
Tilt-Zoom network Camera,” Proc. of the IEEE/RSJ Int. Conf. on Intelligent
Robots and Systems, pp. 3786-3793, 2009.
[17] J. Long, and S. Li, “Near Infrared Face Image Quality Assessment System of
Video Sequences”, Proc. of the 6th
Int. Conf. on Image and Graphics, pp. 275-
279, 2011.
[18] Y. Wong, S. Chen, S. Mau, C. Sanderson, and B. C. Lovell, “Patch-based
Probabilistic Image Quality Assessment for Face Selection and Improved Vid-
eo-based Face Recognition,” Proc. of the IEEE Conf. on Computer Vision and
Pattern Recognition Workshops, pp. 74-81, 2011.
[19] A. D. Bagdanov, and A. D. Bimbo, “Posterity Logging of Face Imagery for
Video Surveillance,” IEEE MultiMedia, vol. 19, no. 4, pp. 48-59, 2012.
[20] J. Jun-Su, and K. Jong-Hwan, “Fast and Robust face Detection using Evolu-
tionary Prunning,” IEEE Trans. On Evolutionary Computation, vol. 12, no. 5,
pp. 562-571, 2008.
[21] A. Salhi, and A. Y. Jammoussi, “Object tracking system using Camshift,
Meanshift and Kalman filter,” World Academy of Science, Engineering and
Technology, vol. 64, pp. 674-679, 2012.
177
CHAPTER 4. QUALITY-AWARE
ESTIMATION OF FACIAL LANDMARKS
IN VIDEO SEQUENCES
Mohammad Ahsanul Haque, Kamal Nasrollahi, and Thomas B. Moeslund
This paper has been published in the
Proceedings of the IEEE Winter Conference on Applications of Computer Visions
(WACV)
pp. 678-685, 2015
© 2015 IEEE
The layout has been revised.


179
4.1. ABSTRACT
Face alignment in video is a primitive step for facial image analysis. The accuracy
of the alignment greatly depends on the quality of the face image in the video
frames and low quality faces are proven to cause erroneous alignment. Thus, this
chapter proposes a system for quality aware face alignment by using a Supervised
Decent Method (SDM) along with a motion based forward extrapolation method.
The proposed system first extracts faces from video frames. Then, it employs a face
quality assessment technique to measure the face quality. If the face quality is high,
the proposed system uses SDM for facial landmark detection. If the face quality is
low the proposed system corrects the facial landmarks that are detected by SDM.
Depending upon the face velocity in consecutive video frames and face quality
measure, two algorithms are proposed for correction of landmarks in low quality
faces by using an extrapolation polynomial. Experimental results illustrate the
competency of the proposed method while comparing with the state-of-the-art
methods including an SDM-based method (from CVPR-2013) and a very recent
method (from CVPR-2014) that uses parallel cascade of linear regression (Par-
CLR).
4.2. INTRODUCTION
Automatic analysis of facial image plays an important role in many different areas
such as surveillance, medical diagnosis, biometrics, and expression recognition [1].
Detecting facial landmarks, also called face alignment, is an essential step in auto-
matic facial image analysis. The accuracy of alignment, i.e., pertinent detection of
facial landmarks, affects the performance of the analysis. Face alignment is consid-
ered as a mathematical optimization problem and a number of methods were pro-
posed to solve this problem. The Active Appearance Model (AAM) fitting along
with its derivatives are some of the early but effective solutions in this area [2]. The
AAM fitting works by estimating some parameters of a model which is close
enough to the given image. A number of regression based approaches was proposed
for the AAM fitting, e.g., a linear regression based fitting [3], a non-linear regressor
using boosted learning [4], a boosted ranking model [5], and discriminative ap-
proaches [6-7]. Figure 4-1(a) shows 66 facial landmark points detected in two ex-
amples by an AAM fitting algorithm (Fast-Simultaneous Inverse Compositional
algorithm (Fast-SIC)) [2].
Though the results of regression based AAM fitting methods are good, they are
computationally expensive due to the iterative nature of learning the shape and the
appearance parameters. To deal with this problem a number of works were done by
optimizing least-square functions. For example, Matthews et al. formulated the
AAM fitting as a Lukas-Kanade (LK) problem which can be solved using Gauss-
Newton optimization [8, 9]. Similar Gauss-Newton or gradient decent based opti-
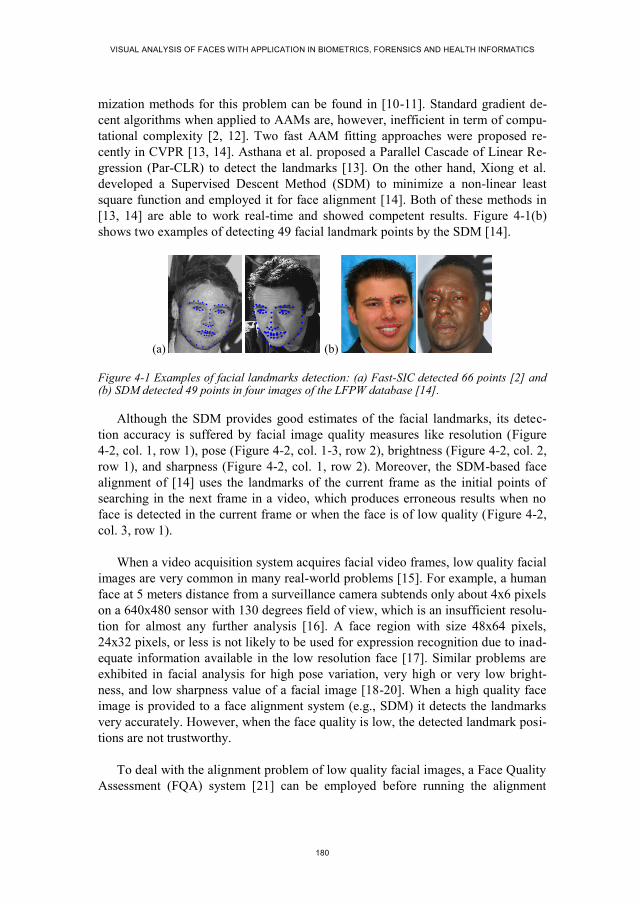
VISUAL ANALYSIS OF FACES WITH APPLICATION IN BIOMETRICS, FORENSICS AND HEALTH INFORMATICS
180
mization methods for this problem can be found in [10-11]. Standard gradient de-
cent algorithms when applied to AAMs are, however, inefficient in term of compu-
tational complexity [2, 12]. Two fast AAM fitting approaches were proposed re-
cently in CVPR [13, 14]. Asthana et al. proposed a Parallel Cascade of Linear Re-
gression (Par-CLR) to detect the landmarks [13]. On the other hand, Xiong et al.
developed a Supervised Descent Method (SDM) to minimize a non-linear least
square function and employed it for face alignment [14]. Both of these methods in
[13, 14] are able to work real-time and showed competent results. Figure 4-1(b)
shows two examples of detecting 49 facial landmark points by the SDM [14].
(a) (b)
Figure 4-1 Examples of facial landmarks detection: (a) Fast-SIC detected 66 points [2] and (b) SDM detected 49 points in four images of the LFPW database [14].
Although the SDM provides good estimates of the facial landmarks, its detec-
tion accuracy is suffered by facial image quality measures like resolution (Figure
4-2, col. 1, row 1), pose (Figure 4-2, col. 1-3, row 2), brightness (Figure 4-2, col. 2,
row 1), and sharpness (Figure 4-2, col. 1, row 2). Moreover, the SDM-based face
alignment of [14] uses the landmarks of the current frame as the initial points of
searching in the next frame in a video, which produces erroneous results when no
face is detected in the current frame or when the face is of low quality (Figure 4-2,
col. 3, row 1).
When a video acquisition system acquires facial video frames, low quality facial
images are very common in many real-world problems [15]. For example, a human
face at 5 meters distance from a surveillance camera subtends only about 4x6 pixels
on a 640x480 sensor with 130 degrees field of view, which is an insufficient resolu-
tion for almost any further analysis [16]. A face region with size 48x64 pixels,
24x32 pixels, or less is not likely to be used for expression recognition due to inad-
equate information available in the low resolution face [17]. Similar problems are
exhibited in facial analysis for high pose variation, very high or very low bright-
ness, and low sharpness value of a facial image [18-20]. When a high quality face
image is provided to a face alignment system (e.g., SDM) it detects the landmarks
very accurately. However, when the face quality is low, the detected landmark posi-
tions are not trustworthy.
To deal with the alignment problem of low quality facial images, a Face Quality
Assessment (FQA) system [21] can be employed before running the alignment
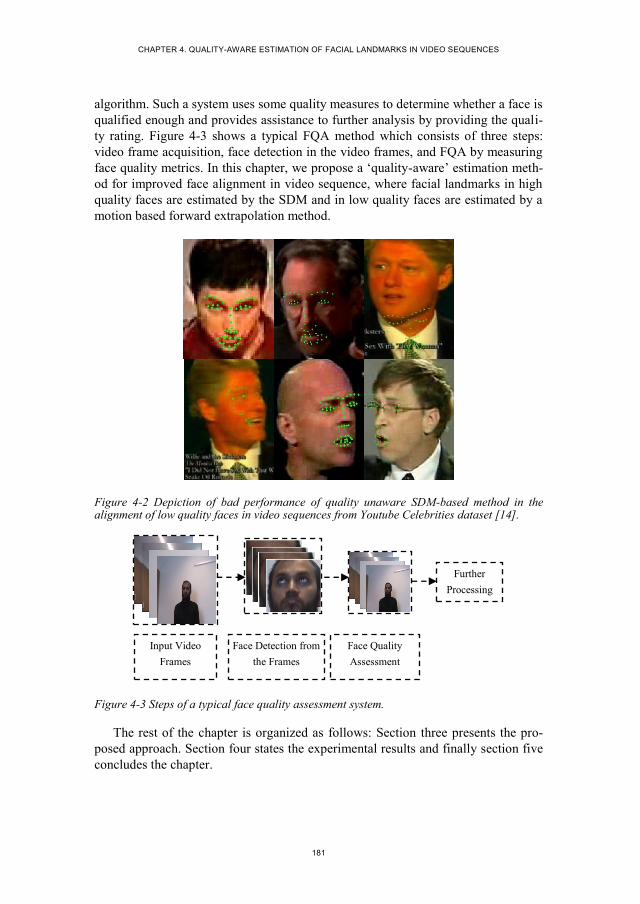
CHAPTER 4. QUALITY-AWARE ESTIMATION OF FACIAL LANDMARKS IN VIDEO SEQUENCES
181
algorithm. Such a system uses some quality measures to determine whether a face is
qualified enough and provides assistance to further analysis by providing the quali-
ty rating. Figure 4-3 shows a typical FQA method which consists of three steps:
video frame acquisition, face detection in the video frames, and FQA by measuring
face quality metrics. In this chapter, we propose a ‘quality-aware’ estimation meth-
od for improved face alignment in video sequence, where facial landmarks in high
quality faces are estimated by the SDM and in low quality faces are estimated by a
motion based forward extrapolation method.
Figure 4-2 Depiction of bad performance of quality unaware SDM-based method in the alignment of low quality faces in video sequences from Youtube Celebrities dataset [14].
Figure 4-3 Steps of a typical face quality assessment system.
The rest of the chapter is organized as follows: Section three presents the pro-
posed approach. Section four states the experimental results and finally section five
concludes the chapter.
Further
Processing
Input Video
Frames
Face Detection from
the Frames
Face Quality
Assessment
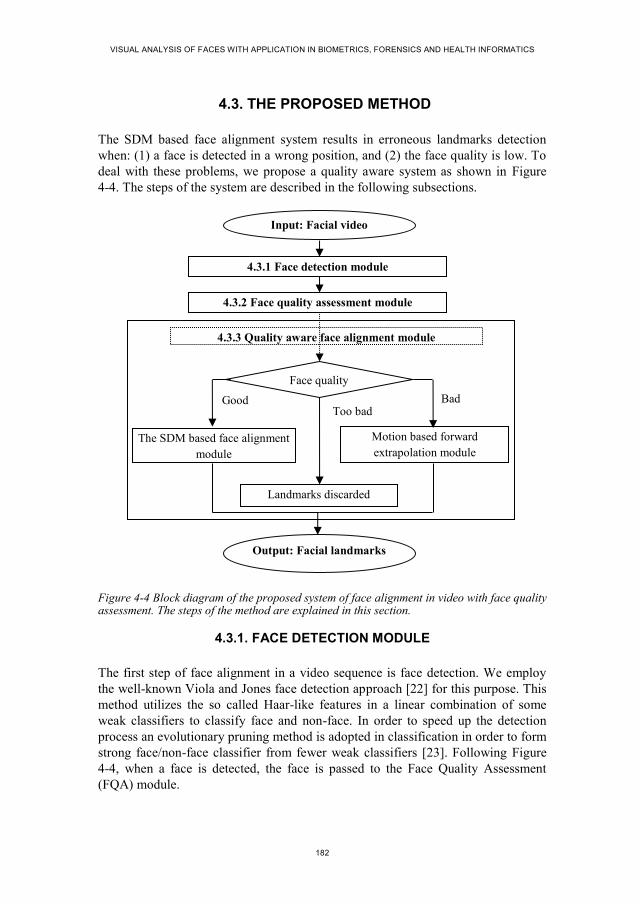
VISUAL ANALYSIS OF FACES WITH APPLICATION IN BIOMETRICS, FORENSICS AND HEALTH INFORMATICS
182
4.3. THE PROPOSED METHOD
The SDM based face alignment system results in erroneous landmarks detection
when: (1) a face is detected in a wrong position, and (2) the face quality is low. To
deal with these problems, we propose a quality aware system as shown in Figure
4-4. The steps of the system are described in the following subsections.
Figure 4-4 Block diagram of the proposed system of face alignment in video with face quality assessment. The steps of the method are explained in this section.
4.3.1. FACE DETECTION MODULE
The first step of face alignment in a video sequence is face detection. We employ
the well-known Viola and Jones face detection approach [22] for this purpose. This
method utilizes the so called Haar-like features in a linear combination of some
weak classifiers to classify face and non-face. In order to speed up the detection
process an evolutionary pruning method is adopted in classification in order to form
strong face/non-face classifier from fewer weak classifiers [23]. Following Figure
4-4, when a face is detected, the face is passed to the Face Quality Assessment
(FQA) module.
4.3.1 Face detection module
4.3.2 Face quality assessment module
4.3.3 Quality aware face alignment module
Bad Good Too bad
The SDM based face alignment
module
Motion based forward
extrapolation module
Face quality
Landmarks discarded
Input: Facial video
Output: Facial landmarks
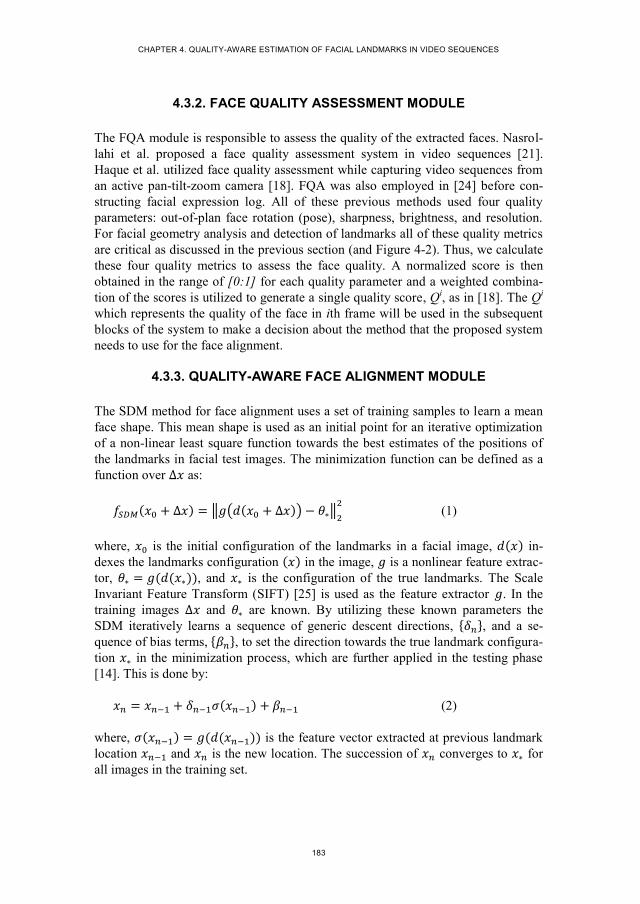
CHAPTER 4. QUALITY-AWARE ESTIMATION OF FACIAL LANDMARKS IN VIDEO SEQUENCES
183
4.3.2. FACE QUALITY ASSESSMENT MODULE
The FQA module is responsible to assess the quality of the extracted faces. Nasrol-
lahi et al. proposed a face quality assessment system in video sequences [21].
Haque et al. utilized face quality assessment while capturing video sequences from
an active pan-tilt-zoom camera [18]. FQA was also employed in [24] before con-
structing facial expression log. All of these previous methods used four quality
parameters: out-of-plan face rotation (pose), sharpness, brightness, and resolution.
For facial geometry analysis and detection of landmarks all of these quality metrics
are critical as discussed in the previous section (and Figure 4-2). Thus, we calculate
these four quality metrics to assess the face quality. A normalized score is then
obtained in the range of [0:1] for each quality parameter and a weighted combina-
tion of the scores is utilized to generate a single quality score, Qi, as in [18]. The Q
i
which represents the quality of the face in ith frame will be used in the subsequent
blocks of the system to make a decision about the method that the proposed system
needs to use for the face alignment.
4.3.3. QUALITY-AWARE FACE ALIGNMENT MODULE
The SDM method for face alignment uses a set of training samples to learn a mean
face shape. This mean shape is used as an initial point for an iterative optimization
of a non-linear least square function towards the best estimates of the positions of
the landmarks in facial test images. The minimization function can be defined as a
function over ∆𝑥 as:
𝑓𝑆𝐷𝑀(𝑥0 + ∆𝑥) = ‖𝑔(𝑑(𝑥0 + ∆𝑥)) − 𝜃∗‖2
2 (1)
where, 𝑥0 is the initial configuration of the landmarks in a facial image, 𝑑(𝑥) in-
dexes the landmarks configuration (𝑥) in the image, 𝑔 is a nonlinear feature extrac-
tor, 𝜃∗ = 𝑔(𝑑(𝑥∗)), and 𝑥∗ is the configuration of the true landmarks. The Scale
Invariant Feature Transform (SIFT) [25] is used as the feature extractor 𝑔. In the
training images ∆𝑥 and 𝜃∗ are known. By utilizing these known parameters the
SDM iteratively learns a sequence of generic descent directions, {𝛿𝑛}, and a se-
quence of bias terms, {𝛽𝑛}, to set the direction towards the true landmark configura-
tion 𝑥∗ in the minimization process, which are further applied in the testing phase
[14]. This is done by:
𝑥𝑛 = 𝑥𝑛−1 + 𝛿𝑛−1𝜎(𝑥𝑛−1) + 𝛽𝑛−1 (2)
where, 𝜎(𝑥𝑛−1) = 𝑔(𝑑(𝑥𝑛−1)) is the feature vector extracted at previous landmark
location 𝑥𝑛−1 and 𝑥𝑛 is the new location. The succession of 𝑥𝑛 converges to 𝑥∗ for
all images in the training set.

VISUAL ANALYSIS OF FACES WITH APPLICATION IN BIOMETRICS, FORENSICS AND HEALTH INFORMATICS
184
In the proposed approach, following Figure 4-4, the face region is passed to the
SDM based alignment module, if the quality score is greater than an empirical
threshold, QTh_high. Otherwise, the face region is passed to the motion based forward
extrapolation module in order to estimate the landmarks or reject the landmark if
the quality based on an empirical threshold, QTh_low, is too bad. To be more precise,
we first rewrite the SDM’s objective function in (1) for a video sequence as:
𝑓𝑆𝐷𝑀(𝑥0𝑖 + ∆𝑥𝑖) = ‖𝑔 (𝑑(𝑥0
𝑖 + ∆𝑥𝑖)) − 𝜃∗𝑖‖
2
2
(3)
where, the 𝑖 superscript implies the frame number and the other symbols have simi-
lar meaning as (1). Then, we include the information 𝑄𝑖 provided by the FQA sys-
tem as a prior for the processing of the next frame. This will change the objective
function of (3) to:
𝑓𝑃𝑟𝑜𝑝𝑜𝑠𝑒𝑑 𝑠𝑦𝑠𝑡𝑒𝑚 = {
𝑓𝑆𝐷𝑀(𝑥0𝑖 + ∆𝑥𝑖), 𝑄𝑖 > 𝑄𝑇ℎ_ℎ𝑖𝑔ℎ
𝑓𝐸𝑠𝑡(𝑥𝑖), 𝑄𝑇ℎ_𝑙𝑜𝑤 < 𝑄𝑖 < 𝑄𝑇ℎ_ℎ𝑖𝑔ℎ
𝑁𝑜 𝐿𝑎𝑛𝑑𝑚𝑎𝑟𝑘𝑠, 𝑄𝑖 < 𝑄𝑇ℎ_𝑙𝑜𝑤
(4)
where, 𝑓𝐸𝑠𝑡(𝑥𝑖) = ‖𝑑(𝑥𝑖) − 𝑑(𝑥∗𝑖)‖
2
2 minimizes the non-likelihood error between
corrected landmarks 𝑑(𝑥𝑖) using the landmark configuration of previous good qual-
ity frames and the true landmark configuration 𝑑(𝑥∗𝑖). The working procedure of the
SDM based method with the minimization function 𝑓𝑆𝐷𝑀 and the forward extrapola-
tion method with the minimization function 𝑓𝐸𝑠𝑡 are described in the following
subsections, respectively.
4.3.3.1 SDM-based face alignment module
In the proposed system, we employed a simple deviation of SDM for good quality
faces. We initialize the iterative minimization of SDM for landmark configuration
in each frame by giving a shape estimate (initial landmark positions) that is ob-
tained from the mean shape of the training images. This is in contrary with [14]
which initializes the landmarks in subsequent video frames by using the detected
landmarks of the previous frame. This technique of [14] incurs the problem of get-
ting trapped into local maxima, especially in the videos where the faces have high
velocity due to video motion [26] among the frames. Thus, instead of using land-
marks of the previous frames to initialize the minimization process, we initialize
each frame by following the same procedure of using an estimated mean shape
from the training data. This provides a more genuine estimate for initial position of
landmarks for high-velocity frames. Moreover, as the mean shape initialization is a
low-cost computational process involving merely a translation and scaling opera-
tion on the pre-trained landmark configuration, this does not incur any undoable
computational complexity for real-time operation in video. Besides, the translation-

CHAPTER 4. QUALITY-AWARE ESTIMATION OF FACIAL LANDMARKS IN VIDEO SEQUENCES
185
al and scaling differences are also considered during initialization by scaling the
mean shape from training with the size of the present face region.
4.3.3.2 Motion-based forward extrapolation module
As shown in Figure 4-2 when face quality is low, the SDM’s minimization function
𝑓𝑆𝐷𝑀 fails to converge in the right place. Furthermore, when a face is detected in a
wrong position, the SDM tries to converge in that wrong place. These can be dealt
with by considering the temporal stability that is usually present among subsequent
facial images of a video. In another words, the alignment problem in low quality
and/or wrongly detected facial frames can be addressed by exploiting landmarks
positions in the previous good quality faces. This is exactly the point that we have
utilized in this chapter: the landmarks in low quality faces and/or wrongly detected
faces are extrapolated from the landmarks of the previous frames that are of good
quality.
When 𝑓𝐸𝑠𝑡 is called for action, the FQA module provides some information such
as the quality of the detected face, the displacement of the detected face from the
face in the previous frame (the velocity of the face in the frames), the degree of
pose in the current face and the amount of pose variation in the two previous faces
in the video sequence. In order to calculate 𝑑(𝑥𝑖) for a low quality face in the 𝑖th
frame of a video, let 𝑑(𝑥𝑖−𝑚) and 𝑑(𝑥𝑖−𝑛) denote two landmark configurations of
the previous good quality face frames. We define the correction polynomial to min-
imize 𝑓𝐸𝑠𝑡(𝑥𝑖) as:
𝑑(𝑥𝑖) = 𝑑(𝑥𝑖−𝑛) +𝑑(𝑥𝑖−𝑚).−𝑑(𝑥𝑖−𝑛)
𝑥𝑖−𝑚−𝑥𝑖−𝑛 × (𝑥 − 𝑥𝑖−𝑛) (5)
where, 𝑥𝑖−𝑚 − 𝑥𝑖−𝑛 and (𝑥 − 𝑥𝑖−𝑛) are the velocities of face in the correspond-
ing frames with respect to the previous frames, and (. −) indicates the subtraction
operation for each landmarks (49 landmarks) separately.
In the proposed method, we utilize the extrapolation polynomial of (5) in two
different ways for two different conditions:
Condition 1: When the face is detected in a wrong position. In this case the face
motion shows a larger displacement for the current face than the faces in the previ-
ous frames and the face quality shows a sharp change than the face quality in the
previous frames. We employed Algorithm I in order to extrapolate the landmarks.
Two parameters, Displacement and Quality_Change, are compared with two empir-
ically set thresholds and the landmarks in current frame (Current_Landmarks) are
calculated from the landmarks in the previous qualified frame (Prev_Landmarks).

VISUAL ANALYSIS OF FACES WITH APPLICATION IN BIOMETRICS, FORENSICS AND HEALTH INFORMATICS
186
Condition 2: When the face quality is low. In this case the landmarks detected
from the previous high-quality facial images are used to incorporate the motion
information of the pose variation in the landmarks to extrapolate the landmarks of
the current face. We employed Algorithm II in order to extrapolate the landmarks in
this case. Two face quality parameters for pose and size, Qual_Pose and Qual_Size
are compared with empirically set Pose_Threshold and Size_Threshold, and used
for conditionally estimating Current_Landmarks by using Prev_Landmarks and
Displacement. If the correction is not possible due to the missing of face in previous
video frames, the landmarks detected in the current low quality face are also dis-
carded in order to reduce false estimation.
Algorithm I
WRONG_DETECTION_ESTIMATE (Displacement, Quality_Change) { IF Displacement > Dis_Threshold AND
Quality_Change > Qual_Threshold THEN Prev_Landmarks = The landmarks of previous qualified face; Current_Landmarks = ESTIMATE(Prev_Landmarks, Displacement); RETURN Current_Landmarks; END }
Algorithm II
LOW_QUALITY_ESTIMATE (Qual_Pose, Qual_Size, Displacement) { IF Qual_Pose < Pose_Threshold AND Qual_Size > Size_Threshold THEN Prev_Landmarks = The landmarks of previous qualified face; Current_Landmarks = ESTIMATE (Prev_Landmarks, Displacement); RETURN Current_Landmarks; END }
ESTIMATE (Prev_Landmarks, Displacement) { temp_Landmarks = Landmarks calculated from (Eq. 5) Current_Landmarks = Rotation of temp_Landmarks with pose variation RETURN Current_Landmarks; }

CHAPTER 4. QUALITY-AWARE ESTIMATION OF FACIAL LANDMARKS IN VIDEO SEQUENCES
187
4.4. EXPERIMENTAL RESULTS
The proposed system was implemented in a combination of VISUAL C++ and
MATLAB environments. An implementation of SDM along with its trained direc-
tion and bias terms is given in [14]. In order to evaluate the proposed system we
used the well-known Youtube Celebrities database [27]. However, as a general
database created for face recognition research, most of the videos in this database
are either single-subject video (as we assume single face from the same subject in a
video), or too short to provide enough motion information for erroneous frames, or
do not subjected to the problem of low-quality face. However, we managed to se-
lect 18 videos containing 2537 frames from this database wherein the problem of
low face-quality in alignment are exhibited. To generate ground truth data, we
manually aligned the low quality faces in all of these selected videos and compared
the performance of the proposed system and state-of-the-art facial alignment sys-
tems against this ground truth data.
4.4.1. PERFORMANCE EVALUATION
Figure 4-5 shows some results of landmarks detection in some good quality face
frames of Youtube Celebrities database. The results for SDM [14] and the proposed
method are similar for these good quality faces. When the face quality is too bad to
detect the landmarks, the proposed algorithm discards the erroneous landmarks
detected by SDM. Figure 4-6 shows some example faces from Youtube Celebrities
database where erroneous landmarks detected by SDM are discarded. Figure 4-7
illustrates some results of landmarks correction by the proposed method in order to
provide the mean of qualitative assessment. The first and third rows of Figure 4-7
present the results generated by the SDM, and the second and fourth rows present
the results generated by our method. From the results (col. 1, 2, 4, row 1-2 of Figure
4-7) it is observed that when the face detector produces a wrong detection, the pro-
posed approach can detect the error from the face quality and the displacement (face
velocity in consecutive frames) parameters, and then extrapolate the landmarks by
using the motion information. In the other cases the faces have low resolution prob-
lem (col. 3-5, row 1-2), low brightness (col. 6, row 1-2), high pose variation (col. 1-
4, row 3-4) and low sharpness (col. 5, row 3-4) in Figure 4-7. Some faces do not
exhibit problem from low-quality, instead they get trapped into local minima in the
SDM’s minimization process due to poor initialization for high velocity face frames
(e.g., col. 6, row 3-4).
Figure 4-8 shows the relationship between face quality with the SDM and the
proposed methods. We used 84 frames of 0450_03_001_bill_clinton sequence of
Youtube Celebrities database in order to generate this result. It can be seen that
when the face quality is low (in frames 70-80) the detection error is high in the
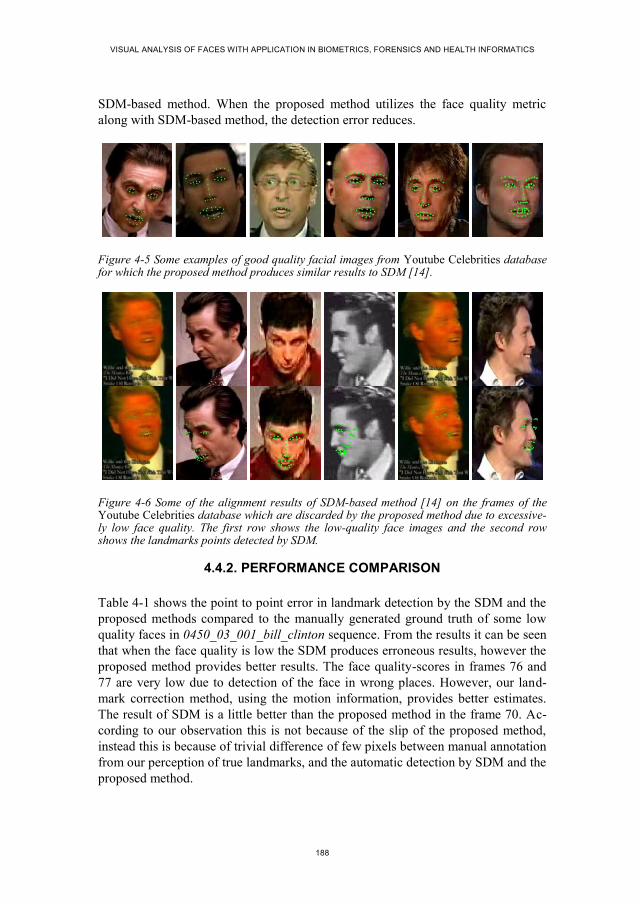
VISUAL ANALYSIS OF FACES WITH APPLICATION IN BIOMETRICS, FORENSICS AND HEALTH INFORMATICS
188
SDM-based method. When the proposed method utilizes the face quality metric
along with SDM-based method, the detection error reduces.
Figure 4-5 Some examples of good quality facial images from Youtube Celebrities database for which the proposed method produces similar results to SDM [14].
Figure 4-6 Some of the alignment results of SDM-based method [14] on the frames of the Youtube Celebrities database which are discarded by the proposed method due to excessive-ly low face quality. The first row shows the low-quality face images and the second row shows the landmarks points detected by SDM.
4.4.2. PERFORMANCE COMPARISON
Table 4-1 shows the point to point error in landmark detection by the SDM and the
proposed methods compared to the manually generated ground truth of some low
quality faces in 0450_03_001_bill_clinton sequence. From the results it can be seen
that when the face quality is low the SDM produces erroneous results, however the
proposed method provides better results. The face quality-scores in frames 76 and
77 are very low due to detection of the face in wrong places. However, our land-
mark correction method, using the motion information, provides better estimates.
The result of SDM is a little better than the proposed method in the frame 70. Ac-
cording to our observation this is not because of the slip of the proposed method,
instead this is because of trivial difference of few pixels between manual annotation
from our perception of true landmarks, and the automatic detection by SDM and the
proposed method.

CHAPTER 4. QUALITY-AWARE ESTIMATION OF FACIAL LANDMARKS IN VIDEO SEQUENCES
189
Figure 4-7 Comparing the landmark correction results of the proposed system (second and fourth row) against the results of the SDM-based method of [12] (first and third row) in some low quality frames of the Youtube Celebrities database.
Table 4-2 shows the comparison between the Par-CLR based method [13], the
SDM-based method [14], and the proposed method in normalized point to point
error for all 18 selected video sequences from the Youtube Celebrities database.
These results are depicted in Figure 4-9. The data for each video in Figure 4-9 is
independent of the data for other videos. Because, we have normalized the point-to-
point errors of the frames of a video by the highest value of error in that video.
Thus, showing higher error in a video does not necessarily mean that the error of
detection in this video is higher than that of the other videos. From the results it is
observed that the proposed method outperforms both SDM and Par-CLR when the
videos have low quality face-frames. Another significant observation of the exper-
imental results is that the proposed method either improves the detection results or
at least maintains the accuracy of SDM and does not worsen the detection error in
comparison with both SDM and Par-CLR. Thus, the contribution of the proposed
method is significant when high accuracy is expected in landmark-based facial
image analysis.
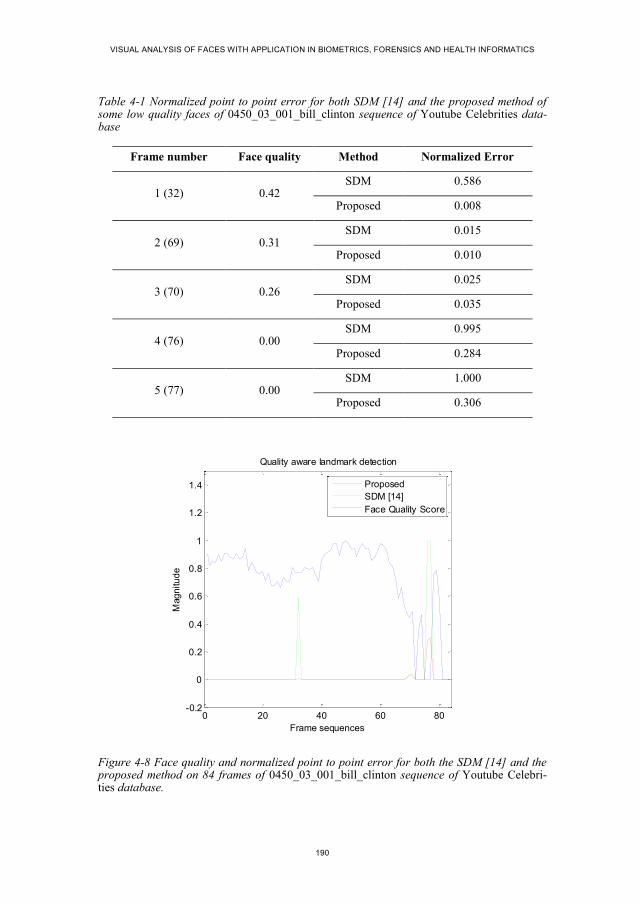
VISUAL ANALYSIS OF FACES WITH APPLICATION IN BIOMETRICS, FORENSICS AND HEALTH INFORMATICS
190
Table 4-1 Normalized point to point error for both SDM [14] and the proposed method of some low quality faces of 0450_03_001_bill_clinton sequence of Youtube Celebrities data-base
Frame number Face quality Method Normalized Error
1 (32) 0.42 SDM 0.586
Proposed 0.008
2 (69) 0.31 SDM 0.015
Proposed 0.010
3 (70) 0.26 SDM 0.025
Proposed 0.035
4 (76) 0.00 SDM 0.995
Proposed 0.284
5 (77) 0.00 SDM 1.000
Proposed 0.306
Figure 4-8 Face quality and normalized point to point error for both the SDM [14] and the proposed method on 84 frames of 0450_03_001_bill_clinton sequence of Youtube Celebri-ties database.
0 20 40 60 80-0.2
0
0.2
0.4
0.6
0.8
1
1.2
1.4
Quality aware landmark detection
Frame sequences
Mag
nitu
de
Proposed
SDM [14]
Face Quality Score

CHAPTER 4. QUALITY-AWARE ESTIMATION OF FACIAL LANDMARKS IN VIDEO SEQUENCES
191
Table 4-2 Average point to point error of the Par-CLR [13], the SDM [14] and the proposed methods compared to the manually generated ground truth for erroneous frames of 18 exper-imental videos from the Youtube Celebrities database. Higher values indicate higher detec-tion errors
No. Sequence name Pt-pt error
Par-CLR SDM Proposed
1. 0450_03_001 0.3821 0.0315 0.0081
2. 0051_03_008 0.7926 0.0786 0.0021
3. 0049_03_006 0.8926 0.7506 0.3246
4. 1304_01_001 0.9702 0.4145 0.2841
5. 0009_01_009 0.8776 0.8369 0.3506
6. 0033_02_001 0.8515 0.9000 0.4402
7. 0054_03_011 0.8907 1.0000 0.6834
8. 0079_01_024 0.5156 0.5060 0.0067
9. 0162_02_026 0.6732 0.5000 0.3321
10. 0182_03_015 0.9663 0.9515 0.5956
11. 0193_01_004 0.5087 0.5064 0.0018
12. 0458_03_009 0.7045 0.8898 0.4913
13. 0492_03_009 0.7903 0.8973 0.3456
14. 0518_03_002 0.8669 0.8096 0.1920
15. 0532_01_007 0.9863 0.3348 0.0012
16. 0606_03_001 0.6480 0.7661 0.1547
17. 0795_01_004 0.8063 0.5039 0.0027
18. 1744_01_017 0.7928 0.8552 0.1675
Average error in erroneous frames of
18 videos with 2537 frames in total 0.7731 0.6314 0.2318
4.5. CONCLUSIONS
This chapter investigated the problem of detecting facial landmarks in low-quality
faces of videos. As the SDM-based face alignment system exhibits the problems of
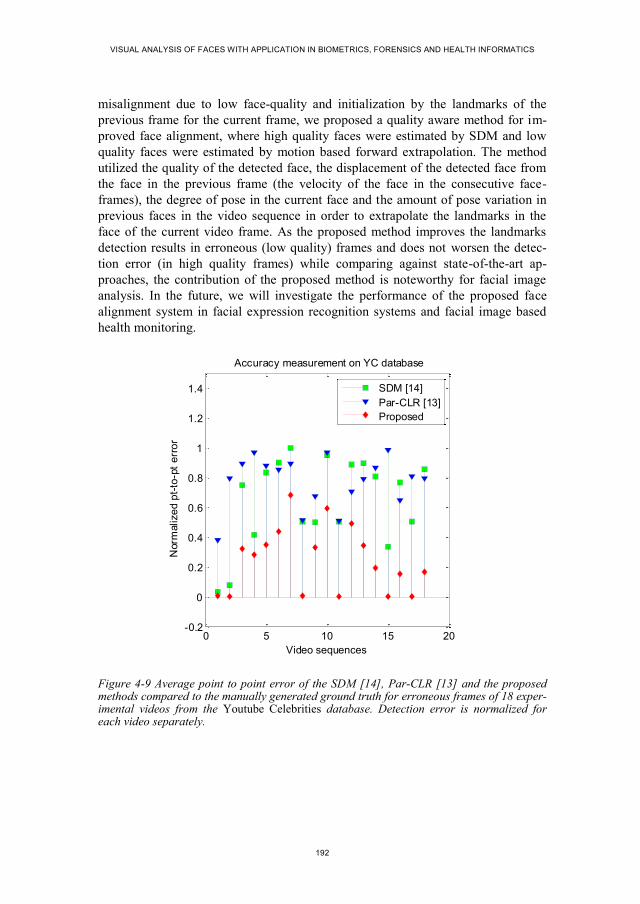
VISUAL ANALYSIS OF FACES WITH APPLICATION IN BIOMETRICS, FORENSICS AND HEALTH INFORMATICS
192
misalignment due to low face-quality and initialization by the landmarks of the
previous frame for the current frame, we proposed a quality aware method for im-
proved face alignment, where high quality faces were estimated by SDM and low
quality faces were estimated by motion based forward extrapolation. The method
utilized the quality of the detected face, the displacement of the detected face from
the face in the previous frame (the velocity of the face in the consecutive face-
frames), the degree of pose in the current face and the amount of pose variation in
previous faces in the video sequence in order to extrapolate the landmarks in the
face of the current video frame. As the proposed method improves the landmarks
detection results in erroneous (low quality) frames and does not worsen the detec-
tion error (in high quality frames) while comparing against state-of-the-art ap-
proaches, the contribution of the proposed method is noteworthy for facial image
analysis. In the future, we will investigate the performance of the proposed face
alignment system in facial expression recognition systems and facial image based
health monitoring.
Figure 4-9 Average point to point error of the SDM [14], Par-CLR [13] and the proposed methods compared to the manually generated ground truth for erroneous frames of 18 exper-imental videos from the Youtube Celebrities database. Detection error is normalized for each video separately.
0 5 10 15 20-0.2
0
0.2
0.4
0.6
0.8
1
1.2
1.4
Accuracy measurement on YC database
Video sequences
Norm
alize
d p
t-to
-pt
err
or
SDM [14]
Par-CLR [13]
Proposed
CHAPTER 4. QUALITY-AWARE ESTIMATION OF FACIAL LANDMARKS IN VIDEO SEQUENCES
193
4.6. REFERENCES
[1] S.Z. Li, and A.K. Jain, Handbook of Face Recognition, 2nd Edition, Springer,
2011.
[2] G. Tzimiropoulos, and M. Pantic, Optimization Problems for Fast AAM Fitting
In-The-Wild, Proc. of the Int. Conf. on Computer Vision (ICCV), 2013.
[3] T. Cootes, G. Edwards, and C. Taylor, Active Appearance Models, IEEE
Trans. on Pattern Analysis and Machine Intelligence (TPAMI), vol. 23, no. 6,
pp. 681-685, 2001.
[4] J. Saragih, and R. Gocke, A Nonlinear Discriminative Approach to AAM Fit-
ting, Proc. of the Int. Conf. on Computer Vision (ICCV), 2007.
[5] H. Wu, Z. Liu, and G. Doretto, Face Alignment via Boosted Ranking Model,
Proc. of the Int. Conf. on Computer Vision (ICCV), 2008.
[6] X. Liu, Generic Face Alignment using Boosted Appearance Model, Proc. of the
Int. Conf. on Computer Vision and Pattern Recognition (CVPR), 2007.
[7] A. Asthana, S. Zafeiriou, S. Cheng, and M. Pantic, Robust Discriminative Re-
sponse Map Fitting with Constrained Local Models, Proc. of the Int. Conf. on
Computer Vision and Pattern Recognition (CVPR), 2013.
[8] I. Matthews, and S. Baker, Active Appearance Models Revisited, International
Journal of Computer Vision (IJCV), 60(2):135-164, 2004.
[9] S. Lucey, R. Navarathna, A. Ashraf, and S. Sridharan, Fourier Lucas-Kanade
Algorithm, IEEE Trans. on Pattern Analysis and Machine Intelligence
(TPAMI), vol. 35, no. 6, pp. 1383-1396, 2013.
[10] F. De la Torre, and M.H. Nguyen, Parameterized Kernel Principal Component
Analysis: Theory and Applications to Supervised and Unsupervised Image
Alignment, Proc. of the Int. Conf. on Computer Vision (ICCV), 2008.
[11] K.T.A. Moustafa, F. De la Torre, and F.P. Ferrie, Pareto Discriminant Analy-
sis, Proc. of the Int. Conf. on Computer Vision and Pattern Recognition
(CVPR), 2010.
[12] L. Unzueta, W. Pimenta, J. Goenetxea, L.P. Santos, and F. Dornaika, Efficient
Generic Face Model Fitting to Images and Video, Image and Vision Compu-
ting, vol. 32, no. 5, pp. 321-334, 2014.
[13] A. Asthana, S. Zafeiriou, S. Cheng, and M. Pantic, Incremental Face Align-
ment in the Wild, Proc. of the Int. Conf. on Computer Vision and Pattern
Recognition (CVPR), 2014.

VISUAL ANALYSIS OF FACES WITH APPLICATION IN BIOMETRICS, FORENSICS AND HEALTH INFORMATICS
194
[14] X. Xiong, and F.D.L. Torre, Supervised Descent Method and Its Application to
Face Alignment, Proc. of the Int. Conf. on Computer Vision and Pattern
Recognition (CVPR), 2013.
[15] K. Nasrollahi, and T.B. Moeslund, Complete face logs for video sequences
using face quality measures, IET Signal Processing, vol. 3, no. 4. pp. 289-300,
2009.
[16] S.J.D. Prince, J. Elder, Y. Hou, M. Sizinstev, and E Olevskiy, Towards Face
Recognition at a Distance, Proc. of the IET Conf. on Crime and Security, pp.
570-575, 2006.
[17] Y. Tian, T. Kanade, and J.F. Cohn, Facial Expression Recognition, Handbook
of Face Recognition, Chapter 19, pp. 487-519, Springer, 2011.
[18] M.A. Haque, K. Nasrollahi, and T.B. Moeslund, Real-Time Acquisition of
High Quality Face Sequences from an Active Pan-Tilt-Zoom Camera, Proc. of
the Int. Conf. on Advanced Video and Surveillance Systems (AVSS), pp. 1-6,
2013.
[19] K. Nasrollahi, and T.B. Moeslund, Extracting a Good Quality Frontal Face
Image From a Low Resolution Video Sequence, IEEE Trans. On Circuits and
Systems for Video Technology, vol. 21, no. 10, pp. 1353-1362, 2011.
[20] I.V.D. Linde, and T. Watson, A combinatorial study of pose effects in unfamil-
iar face recognition, Vision Research, vol. 50, pp. 522-533, 2010.
[21] K. Nasrollahi, and T.B. Moeslund, Face Quality Assessment System in Video
Sequences, 1st European Workshop on Biometrics and Identity Management,
Springer-LNCS, vol. 5372, pp. 10-18, 2008.
[22] P. Viola, and M. Jones, Robust real-time face detection, Proc. of the 8th IEEE
Int. Conf. on Computer Vision, pp. 747, 2001.
[23] J. Jun-Su, and K. Jong-Hwan, Fast and Robust Face Detection using Evolu-
tionary Pruning, IEEE Trans. On Evolutionary Computation, vol. 12, no. 5, pp.
562-571, 2008.
[24] M.A. Haque, K. Nasrollahi, and T.B. Moeslund, Constructing Facial Expres-
sion Log from Video Sequences using Face Quality Assessment, Proc. of the
Int. Conf. on Computer Vision Theory and Applications (VISAPP), pp. 1-8,
2014.
[25] D.G. Lowe, Object recognition from local scale-invariant features, Proc. of the
Int. Conf. on Computer Vision (ICCV), pp. 1150-1157, 1999.
[26] Y. Feng et al., Exploiting Temporal Stability and Low-Rank Structure for Mo-
tion Capture Dara Refinement, Information Sciences, vol. 277, no. 1, pp. 777-
793, 2014.

CHAPTER 4. QUALITY-AWARE ESTIMATION OF FACIAL LANDMARKS IN VIDEO SEQUENCES
195
[27] L. Wolf, T. Hassner, and I. Maoz, Face Recognition in Unconstrained Videos
with Matched Background Similarity, Proc. of the Int. Conf. on Computer Vi-
sion and Pattern Recognition (CVPR), 2011.


197
PART IV
MEASUREMENT OF PHYSIOLOGICAL
PARAMETERS


199
CHAPTER 5. HEARTBEAT RATE
MEASUREMENT FROM FACIAL
VIDEO
Mohammad Ahsanul Haque, Ramin Irani, Kamal Nasrollahi, and Thomas B.
Moeslund
This paper has been accepted and pre-published in the
IEEE Intelligent Systems
vol. -, no. 99, pp. 678-685, 2016
© 2016 IEEE
The layout has been revised.


201
5.1. ABSTRACT
Heartbeat Rate (HR) reveals a person’s health condition. This chapter presents an
effective system for measuring HR from facial videos acquired in a more realistic
environment than the testing environment of current systems. The proposed method
utilizes a facial feature point tracking method by combining a ‘Good feature to
track’ and a ‘Supervised descent method’ in order to overcome the limitations of
currently available facial video based HR measuring systems. Such limitations
include, e.g., unrealistic restriction of the subject’s movement and artificial lighting
during data capture. A face quality assessment system is also incorporated to au-
tomatically discard low quality faces that occur in a realistic video sequence to
reduce erroneous results. The proposed method is comprehensively tested on the
publicly available MAHNOB-HCI database and our local dataset, which are col-
lected in realistic scenarios. Experimental results show that the proposed system
outperforms existing video based systems for HR measurement.
5.2. INTRODUCTION
Heartbeat Rate (HR) is an important physiological parameter that provides infor-
mation about the condition of the human body’s cardiovascular system in applica-
tions like medical diagnosis, rehabilitation training programs, and fitness assess-
ments [1]. Increasing or decreasing a patient’s HR beyond the norm in a fitness
assessment or rehabilitation training, for example, can show how the exercise af-
fects the trainee, and indicates whether continuing the exercise is safe.
HR is typically measured by an Electrocardiogram (ECG) through placing sen-
sors on the body. A recent study was driven by the fact that blood circulation causes
periodic subtle changes to facial skin color [2]. This fact was utilized in [3]–[7] for
HR estimation and [8]–[10] for applications of heartbeat signal from facial video.
These facial color-based methods, however, are not effective when taking into ac-
count the sensitivity to color noise and changes in illumination during tracking.
Thus, Balakrishnan et al. proposed a system for measuring HR based on the fact
that the flow of blood through the aorta causes invisible motion in the head (which
can be observed by Ballistocardiography) due to pulsation of the heart muscles
[11]. An improvement of this method was proposed in [12]. These motion-based
methods of [11], [12] extract facial feature points from forehead and cheek (as
shown in Figure 5-1(a)) by a method called Good Feature to Track (GFT). They
then employ the Kanade-Lucas-Tomasi (KLT) feature tracker from [13] to generate
the motion trajectories of feature points and some signal processing methods to
estimate cyclic head motion frequency as the subject’s HR. These calculations are
based on the assumption that the head is static (or close to) during facial video cap-
ture. This means that there is neither internal facial motion nor external movement
of the head during the data acquisition phase. We denote internal motion as facial
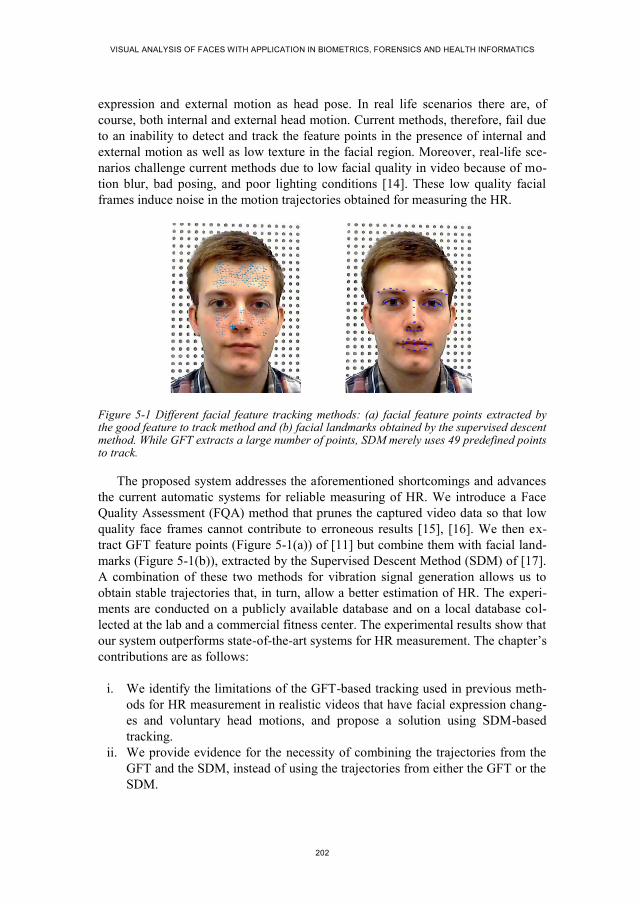
VISUAL ANALYSIS OF FACES WITH APPLICATION IN BIOMETRICS, FORENSICS AND HEALTH INFORMATICS
202
expression and external motion as head pose. In real life scenarios there are, of
course, both internal and external head motion. Current methods, therefore, fail due
to an inability to detect and track the feature points in the presence of internal and
external motion as well as low texture in the facial region. Moreover, real-life sce-
narios challenge current methods due to low facial quality in video because of mo-
tion blur, bad posing, and poor lighting conditions [14]. These low quality facial
frames induce noise in the motion trajectories obtained for measuring the HR.
Figure 5-1 Different facial feature tracking methods: (a) facial feature points extracted by the good feature to track method and (b) facial landmarks obtained by the supervised descent method. While GFT extracts a large number of points, SDM merely uses 49 predefined points to track.
The proposed system addresses the aforementioned shortcomings and advances
the current automatic systems for reliable measuring of HR. We introduce a Face
Quality Assessment (FQA) method that prunes the captured video data so that low
quality face frames cannot contribute to erroneous results [15], [16]. We then ex-
tract GFT feature points (Figure 5-1(a)) of [11] but combine them with facial land-
marks (Figure 5-1(b)), extracted by the Supervised Descent Method (SDM) of [17].
A combination of these two methods for vibration signal generation allows us to
obtain stable trajectories that, in turn, allow a better estimation of HR. The experi-
ments are conducted on a publicly available database and on a local database col-
lected at the lab and a commercial fitness center. The experimental results show that
our system outperforms state-of-the-art systems for HR measurement. The chapter’s
contributions are as follows:
i. We identify the limitations of the GFT-based tracking used in previous meth-
ods for HR measurement in realistic videos that have facial expression chang-
es and voluntary head motions, and propose a solution using SDM-based
tracking.
ii. We provide evidence for the necessity of combining the trajectories from the
GFT and the SDM, instead of using the trajectories from either the GFT or the
SDM.

CHAPTER 5. HEARTBEAT RATE MEASUREMENT FROM FACIAL VIDEO
203
iii. We introduce the notion of FQA in the HR measurement context and demon-
strate empirical evidence for its effectiveness.
The rest of the chapter is organized as follows. Section three provides the theo-
retical basis for the proposed method, which is then described in section four. Sec-
tion five presents the experimental results, and the paper’s conclusions are provided
in section six.
5.3. THEORY
This section describes the basics of GFT- and SDM-based facial point tracking,
explains the limitations of the GFT-based tracking, and proposes a solution via a
combination of GFT- and SDM-based tracking.
Tracking facial feature points to detect head motion in consecutive facial video
frames was accomplished in [11], [12] using GFT-based method. The GFT-based
method uses an affine motion model to express changes in the level of intensity in
the face. Tracking a window of size 𝑤𝑥 × 𝑤𝑦 in frame 𝐼 to frame 𝐽 is defined on a
point velocity parameter 𝛅 = [𝛿𝑥 𝛿𝑦]𝑇 for minimizing a residual function 𝑓𝐺𝐹𝑇 that
is defined by:
𝑓𝐺𝐹𝑇(𝛅) = ∑ ∑ (𝐼(𝐱) − 𝐽(𝐱 + 𝛅))2𝑝𝑦+𝑤𝑦
𝑦=𝑝𝑦
𝑝𝑥+𝑤𝑥𝑥=𝑝𝑥
(1)
where (𝐼(𝐱) − 𝐽(𝐱 + 𝛅)) stands for (𝐼(𝑥, 𝑦) − 𝐽(𝑥 + 𝛿𝑥, 𝑦 + 𝛿𝑦)), and 𝐩 =
[𝑝𝑥 , 𝑝𝑦]𝑇 is a point to track from the first frame to the second frame. According to
observations made in [18], the quality of the estimate by this tracker depends on
three factors: the size of the window, the texture of the image frame, and the
amount of motion between frames. Thus, in the presence of voluntary head motion
(both external and internal) and low-texture in facial videos, the GFT-based track-
ing exhibits the following problems:
i. Low texture in the tracking window: In general, not all parts of a video
frame contain complete motion information because of an aperture problem.
This difficulty can be overcome by tracking feature points in corners or re-
gions with high spatial frequency content. However, GFT-based systems for
HR utilized the feature points from the forehead and cheek that have low
spatial frequency content.
ii. Losing track in a long video sequence: The GFT-based method applies a
threshold to the cost function 𝑓𝐺𝐹𝑇(𝛅) in order to declare a point ‘lost’ if the
cost function is higher than the threshold. While tracking a point over many
frames of a video, as done in [11], [12], the point may drift throughout the
extended sequences and may be prematurely declared ‘lost.’

VISUAL ANALYSIS OF FACES WITH APPLICATION IN BIOMETRICS, FORENSICS AND HEALTH INFORMATICS
204
iii. Window size: When the window size (i.e. 𝑤𝑥 × 𝑤𝑦 in (1)) is small a defor-
mation matrix to find the track is harder to estimate because the variations of
motion within it are smaller and therefore less reliable. On the other hand, a
bigger window is more likely to straddle a depth discontinuity in subsequent
frames.
iv. Large optical flow vectors in consecutive video frames: When there is vol-
untary motion or expression change in a face the optical flow or face veloci-
ty in consecutive video frames is very high and GFT-based method misses
the track due to occlusion [13].
Instead of tracking feature points by GFT-based method, facial landmarks can
be tracked by employing a face alignment system. The Active Appearance Model
(AAM) fitting [19] and its derivatives [20] are some of the early solutions for face
alignment. A fast and highly accurate AAM fitting approach that was proposed
recently in [17] is SDM. The SDM uses a set of manually aligned faces as training
samples to learn a mean face shape. This mean shape is then used as an initial point
for an iterative minimization of a non-linear least square function towards the best
estimates of the positions of the landmarks in facial test images. The minimization
function can be defined as a function over ∆𝑥:
𝑓𝑆𝐷𝑀(𝑥0 + ∆𝑥) = ‖𝑔(𝑑(𝑥0 + ∆𝑥)) − 𝜃∗‖2
2 (2)
where 𝑥0 is the initial configuration of the landmarks in a facial image, 𝑑(𝑥) index-
es the landmarks configuration (𝑥) in the image, 𝑔 is a nonlinear feature extractor,
𝜃∗ = 𝑔(𝑑(𝑥∗)), and 𝑥∗ is the configuration of the true landmarks. In the training
images ∆𝑥 and 𝜃∗ are known. By utilizing these known parameters the SDM itera-
tively learns a sequence of generic descent directions, {𝜕𝑛}, and a sequence of bias
terms, {𝛽𝑛}, to set the direction towards the true landmarks configuration 𝑥∗ in the
minimization process, which are further applied in the alignment of unlabelled faces
[17]. The evaluation of the descent directions and bias terms is accomplished by:
𝑥𝑛 = 𝑥𝑛−1 + 𝜕𝑛−1𝜎(𝑥𝑛−1) + 𝛽𝑛−1 (3)
where 𝜎(𝑥𝑛−1) = 𝑔(𝑑(𝑥𝑛−1)) is the feature vector extracted at the previous land-
mark location 𝑥𝑛−1, 𝑥𝑛 is the new location, and 𝜕𝑛−1 and 𝛽𝑛−1 are defined as:
𝜕𝑛−1 = −2 × 𝐇−1(𝑥𝑛−1) × 𝐉T(𝑥𝑛−1) × 𝑔(𝑑(𝑥𝑛−1)) (4)
𝛽𝑛−1 = −2 × 𝐇−1(𝑥𝑛−1) × 𝐉T(𝑥𝑛−1) × 𝑔(𝑑(𝑥∗)) (5)
where 𝐇(𝑥𝑛−1) and 𝐉(𝑥𝑛−1) are, respectively, the Hessian and Jacobian matrices of
the function 𝑔 evaluated at (𝑥𝑛−1). The succession of 𝑥𝑛 converges to 𝑥∗ for all
images in the training set.

CHAPTER 5. HEARTBEAT RATE MEASUREMENT FROM FACIAL VIDEO
205
The SDM is free from the problems of the GFT-based tracking approach for the
following reasons:
i. Low texture in the tracking window: The 49 facial landmarks of SDM are
taken from face patches around eye, lip, and nose edges and corners (as
shown in Figure 5-1(b)), which have high spatial frequency due to the exist-
ence of edges and corners as discussed in [18].
ii. Losing track in a long video sequence: The SDM does not use any reference
points in tracking. Instead, it detects each point around the edges and corners
in the facial region of each video frame by using supervised descent direc-
tions and bias terms as shown in (3), (4) and (5). Thus, the problems of point
drifting or dropping a point too early do not occur.
iii. Window size: The SDM does not define the facial landmarks by using the
window based ‘neighborhood sense’ and, thus, does not use any window-
based point tracking system. Instead, the SDM utilizes the ‘neighborhood
sense’ on a pixel-by-pixel basis along with the descent detections and bias
terms.
iv. Large optical flow vectors in consecutive video frames: As mentioned in
[13], occlusion can occur by large optical flow vectors in consecutive video
frames. As a video with human motion satisfies temporal stability constraint
[21], increasing the search space can be a solution. SDM uses supervised de-
scent direction and bias terms that allow searching selectively in a wider
space with high computational efficiency.
Though GFT-based method fails to preserve enough information to measure the
HR when the video has facial expression change or head motion, it uses a larger
number of facial feature points (e.g., more than 150) to track than SDM (only 49
points). This matter causes the GFT-based method to generate a better trajectory
than SDM when there is no voluntary motion. On the other hand, SDM does not
miss or erroneously track the landmarks in the presence of voluntary facial motions.
In order to exploit the advantages of the both methods, a combination of GFT- and
SDM-based tracking outcome can be used, which is explained in the methodology
section. Thus, merely using GFT or SDM to extract facial points in cases where
subjects may have both voluntary motion and non-motion periods does not produce
competent results.
5.4. THE PROPOSED METHOD
A block diagram of the proposed method is shown in Figure 5-2. The steps are ex-
plained below.

VISUAL ANALYSIS OF FACES WITH APPLICATION IN BIOMETRICS, FORENSICS AND HEALTH INFORMATICS
206
Figure 5-2 The block diagram of the proposed system. We acquire the facial video, track the intended facial points, extract the vibration signal associated with heartbeat, and estimate the HR.
0 0.5 1 1.5 2 2.5 3190
195
200
205
210
215
time[Sec]
Am
plitu
te
0 0.5 1 1.5 2 2.5 3190
195
200
205
210
215
time[Sec]
Am
plitu
te
0 0.5 1 1.5 2 2.5 3190
195
200
205
210
215
time[Sec]
Am
plitu
te
0 0.5 1 1.5 2 2.5 3190
195
200
205
210
215
time[Sec]
Am
plitu
te
0 0.5 1 1.5 2 2.5 3150
152
154
156
158
160
162
164
166
168
time[Sec]
Ampl
itute
0 50 100 150 200 250 300-0.6
-0.4
-0.2
0
0.2
0.4
0.6
0.8
time[Sec]
Am
plitu
te
0 0.5 1 1.5 2 2.5 3150
152
154
156
158
160
162
164
166
168
time[Sec]
Amplitute
0 500 1000 1500-1
0
1
Stable Facial Point Trajectory Vibration
Signal
Vibration Signal Extraction
Filter
HR Calculation
Signal Processing HR Estimation
PCA
DCT
Frames from Camera Face Detection and Face Quality
Assessment
Face Detection and Face Quality Assessment
Feature Point and Landmark Tracking
Region of Interest
Selection Facial Points Tracking
GFT Points SDM Points

CHAPTER 5. HEARTBEAT RATE MEASUREMENT FROM FACIAL VIDEO
207
5.4.1. FACE DETECTION AND FACE QUALITY ASSESSMENT
The first step of the proposed motion-based system is face detection from facial
video acquired by a webcam. We employed the Haar-like features of Viola and
Jones to extract the facial region from the video frames [22]. However, facial vide-
os captured in real-life scenarios can exhibit low face quality due to the problems of
pose variation, varying levels of brightness, and motion blur. A low quality face
produces erroneous results in facial feature points or landmarks tracking. To solve
this problem, a FQA module is employed by following [16], [23]. The module cal-
culates four scores for four quality metrics: resolution, brightness, sharpness, and
out-of-plan face rotation (pose). The quality scores are compared with thresholds
(following [23], with values 150x150, 0.80, 0.8, and 0.20, for resolution, brightness,
sharpness, and pose, respectively) to check whether the face needs to be discarded.
If a face is discarded, we concatenate the trajectory segments to remove disconti-
nuity by following [5]. As we measure the average HR over a long video sequence
(e.g. 30 secs to 60 secs) discarding few frames (e.g., less than 5% of the total
frames) does not greatly affect the regular characteristic of the trajectories but re-
moves the most erroneous segments coming from low quality faces.
5.4.2. FEATURE POINTS AND LANDMARKS TRACKING
Tracking facial feature points and generating trajectory keep record of head motion
in facial video due to heartbeat. Our objective with trajectory extraction and signal
processing is to find the cyclic trajectories of tracked points by removing the non-
cyclic components from the trajectories. Since GFT-based tracking has some limita-
tions, as we discussed in the previous section, having voluntary head motion and
facial expression change in a video produces one of two problems: i) completely
missing the track of feature points and ii) erroneous tracking. We observed more
than 80% loss of feature points by the system in such cases. In contrast, the SDM
does not miss or erroneously track the landmarks in the presence of voluntary facial
motions or expression change as long as the face is qualified by the FQA. Thus, the
system can find enough trajectories to measure the HR. However, the GFT uses a
large number of facial points to track when compared to SDM, which uses only 49
points. This causes the GFT to preserve more motion information than SDM when
there is no voluntary motion. Hence, merely using GFT or SDM to extract facial
points in cases where subjects may have both voluntary motion and non-motion
periods does not produce competent results. We therefore propose to combine the
trajectories of GFT and SDM. In order to generate combined trajectories, the face is
passed to the GFT-based tracker to generate trajectories from facial feature points
and then appended with the SDM trajectories. Let the trajectories be expressed by
location time-series 𝑆𝑡,𝑛(𝑥, 𝑦), where (𝑥, 𝑦) is the location of a tracked point 𝑛 in
the video frame 𝑡.

VISUAL ANALYSIS OF FACES WITH APPLICATION IN BIOMETRICS, FORENSICS AND HEALTH INFORMATICS
208
5.4.3. VIBRATION SIGNAL EXTRACTION
The trajectories from the previous step are usually noisy due to, e.g., voluntary head
motion, facial expression, and/or vestibular activity. We reduce the effect of such
noises by employing filters to the vertical component of the trajectories of each
feature point. An 8th
order Butterworth band pass filter with cutoff frequency of
[0.75-5.0] Hz (human HR lies within this range [11]) is used along with a moving
average filter defined below:
𝑆𝑛(𝑡) =1
𝑤∑ 𝑆𝑛(𝑡 + 𝑖)
𝑤
2 − 1
𝑖=−𝑤
2
, 𝑤ℎ𝑒𝑟𝑒 𝑤
2< 𝑡 < 𝑇 −
𝑤
2 (6)
where 𝑤 is the length of the moving average window (length is 300 in our experi-
ment) and 𝑇 is the total number of frames in the video. These filtered trajectories
are then passed to the HR measurement module.
5.4.4. HEARTBEAT RATE (HR) MEASUREMENT
As head motions can originate from different sources and only those caused by
blood circulation through the aorta reflect the heartbeat rate, we apply a Principal
Component Analysis (PCA) algorithm to the filtered trajectories (𝑆) to separate the
sources of head motion. PCA transforms 𝑆 to a new coordinate system through
calculating the orthogonal components 𝑃 by using a load matrix 𝐿 as follows:
𝑃 = 𝑆 . 𝐿 (7)
where 𝐿 is a 𝑇 × 𝑇 matrix with columns obtained from the eigenvectors of 𝑆𝑇𝑆.
Among these components, the most periodic one belongs to heartbeat as obtained in
[11]. We apply Discrete Cosine Transform (DCT) to all the components (𝑃) to find
the most periodic one by following [12]. We then employ Fast Fourier Transform
(FFT) on the inverse-DCT of the component and select the first harmonic to obtain
the HR.
5.5. EXPERIMENTAL ENVIRONMENTS AND DATASETS
This section describes the experimental environment, evaluates the performance of
the proposed system, and compares the performance with the state-of-the-art meth-
ods.
5.5.1. EXPERIMENTAL ENVIRONMENT
The proposed method was implemented using a combination of Matlab (SDM) and
C++ (GFT with KLT) environments. We used three databases to generate results: a
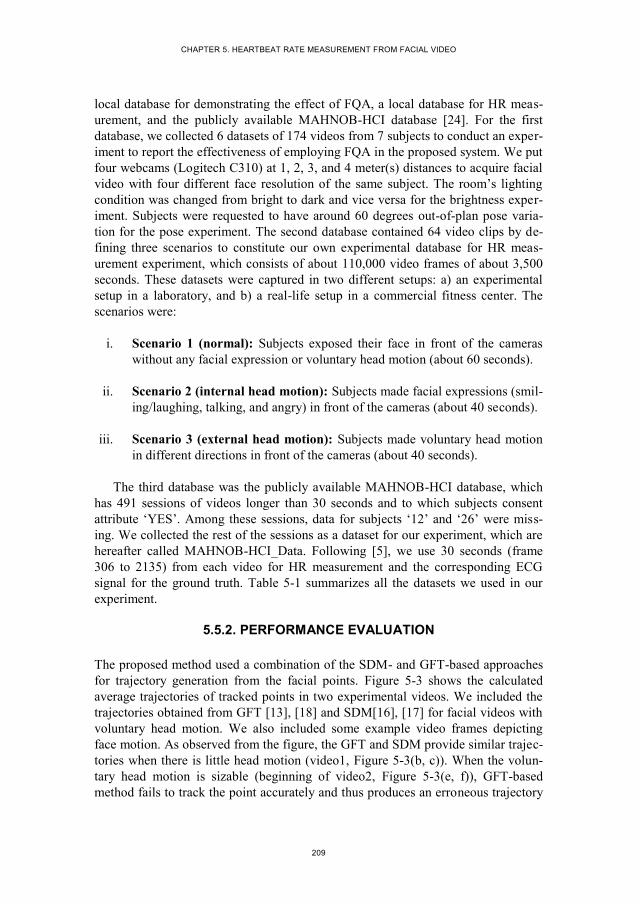
CHAPTER 5. HEARTBEAT RATE MEASUREMENT FROM FACIAL VIDEO
209
local database for demonstrating the effect of FQA, a local database for HR meas-
urement, and the publicly available MAHNOB-HCI database [24]. For the first
database, we collected 6 datasets of 174 videos from 7 subjects to conduct an exper-
iment to report the effectiveness of employing FQA in the proposed system. We put
four webcams (Logitech C310) at 1, 2, 3, and 4 meter(s) distances to acquire facial
video with four different face resolution of the same subject. The room’s lighting
condition was changed from bright to dark and vice versa for the brightness exper-
iment. Subjects were requested to have around 60 degrees out-of-plan pose varia-
tion for the pose experiment. The second database contained 64 video clips by de-
fining three scenarios to constitute our own experimental database for HR meas-
urement experiment, which consists of about 110,000 video frames of about 3,500
seconds. These datasets were captured in two different setups: a) an experimental
setup in a laboratory, and b) a real-life setup in a commercial fitness center. The
scenarios were:
i. Scenario 1 (normal): Subjects exposed their face in front of the cameras
without any facial expression or voluntary head motion (about 60 seconds).
ii. Scenario 2 (internal head motion): Subjects made facial expressions (smil-
ing/laughing, talking, and angry) in front of the cameras (about 40 seconds).
iii. Scenario 3 (external head motion): Subjects made voluntary head motion
in different directions in front of the cameras (about 40 seconds).
The third database was the publicly available MAHNOB-HCI database, which
has 491 sessions of videos longer than 30 seconds and to which subjects consent
attribute ‘YES’. Among these sessions, data for subjects ‘12’ and ‘26’ were miss-
ing. We collected the rest of the sessions as a dataset for our experiment, which are
hereafter called MAHNOB-HCI_Data. Following [5], we use 30 seconds (frame
306 to 2135) from each video for HR measurement and the corresponding ECG
signal for the ground truth. Table 5-1 summarizes all the datasets we used in our
experiment.
5.5.2. PERFORMANCE EVALUATION
The proposed method used a combination of the SDM- and GFT-based approaches
for trajectory generation from the facial points. Figure 5-3 shows the calculated
average trajectories of tracked points in two experimental videos. We included the
trajectories obtained from GFT [13], [18] and SDM[16], [17] for facial videos with
voluntary head motion. We also included some example video frames depicting
face motion. As observed from the figure, the GFT and SDM provide similar trajec-
tories when there is little head motion (video1, Figure 5-3(b, c)). When the volun-
tary head motion is sizable (beginning of video2, Figure 5-3(e, f)), GFT-based
method fails to track the point accurately and thus produces an erroneous trajectory
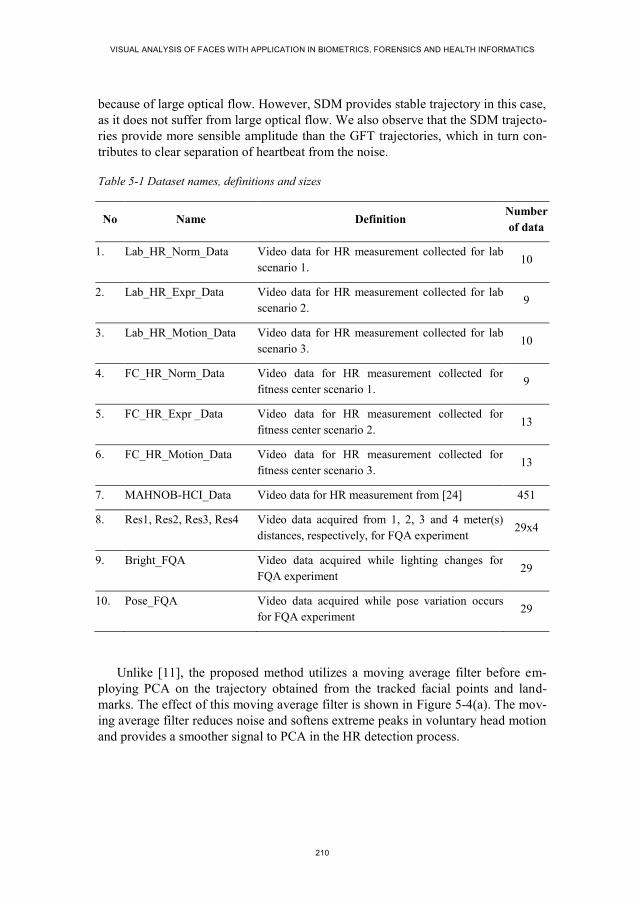
VISUAL ANALYSIS OF FACES WITH APPLICATION IN BIOMETRICS, FORENSICS AND HEALTH INFORMATICS
210
because of large optical flow. However, SDM provides stable trajectory in this case,
as it does not suffer from large optical flow. We also observe that the SDM trajecto-
ries provide more sensible amplitude than the GFT trajectories, which in turn con-
tributes to clear separation of heartbeat from the noise.
Table 5-1 Dataset names, definitions and sizes
No Name Definition Number
of data
1. Lab_HR_Norm_Data Video data for HR measurement collected for lab
scenario 1. 10
2. Lab_HR_Expr_Data Video data for HR measurement collected for lab
scenario 2. 9
3. Lab_HR_Motion_Data Video data for HR measurement collected for lab
scenario 3. 10
4. FC_HR_Norm_Data Video data for HR measurement collected for
fitness center scenario 1. 9
5. FC_HR_Expr _Data Video data for HR measurement collected for
fitness center scenario 2. 13
6. FC_HR_Motion_Data Video data for HR measurement collected for
fitness center scenario 3. 13
7. MAHNOB-HCI_Data Video data for HR measurement from [24] 451
8. Res1, Res2, Res3, Res4 Video data acquired from 1, 2, 3 and 4 meter(s)
distances, respectively, for FQA experiment 29x4
9. Bright_FQA Video data acquired while lighting changes for
FQA experiment 29
10. Pose_FQA Video data acquired while pose variation occurs
for FQA experiment 29
Unlike [11], the proposed method utilizes a moving average filter before em-
ploying PCA on the trajectory obtained from the tracked facial points and land-
marks. The effect of this moving average filter is shown in Figure 5-4(a). The mov-
ing average filter reduces noise and softens extreme peaks in voluntary head motion
and provides a smoother signal to PCA in the HR detection process.
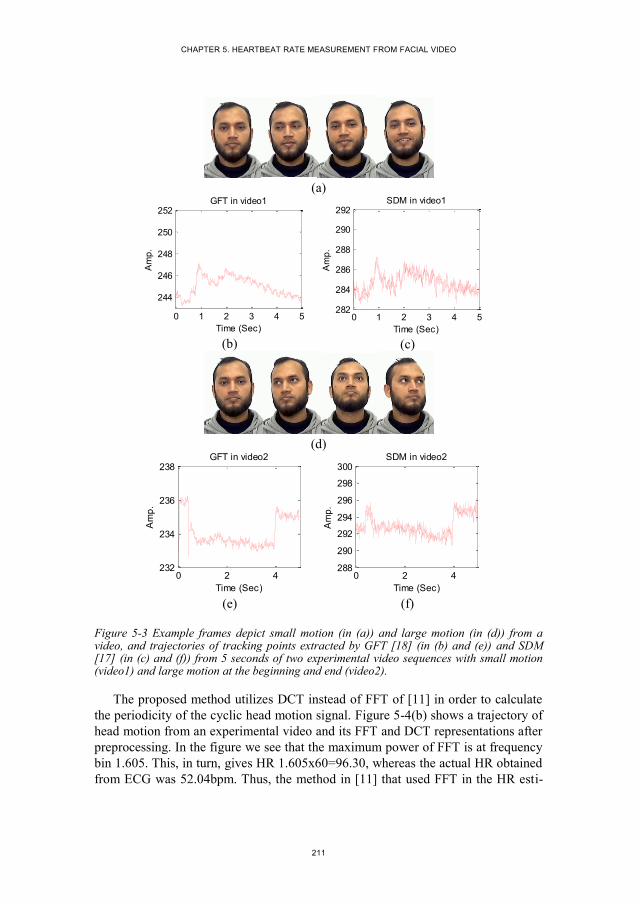
CHAPTER 5. HEARTBEAT RATE MEASUREMENT FROM FACIAL VIDEO
211
(a)
(b)
(c)
(d)
(e)
(f)
Figure 5-3 Example frames depict small motion (in (a)) and large motion (in (d)) from a video, and trajectories of tracking points extracted by GFT [18] (in (b) and (e)) and SDM [17] (in (c) and (f)) from 5 seconds of two experimental video sequences with small motion (video1) and large motion at the beginning and end (video2).
The proposed method utilizes DCT instead of FFT of [11] in order to calculate
the periodicity of the cyclic head motion signal. Figure 5-4(b) shows a trajectory of
head motion from an experimental video and its FFT and DCT representations after
preprocessing. In the figure we see that the maximum power of FFT is at frequency
bin 1.605. This, in turn, gives HR 1.605x60=96.30, whereas the actual HR obtained
from ECG was 52.04bpm. Thus, the method in [11] that used FFT in the HR esti-
0 1 2 3 4 5
244
246
248
250
252
Time (Sec)
Am
p.
GFT in video1
0 1 2 3 4 5282
284
286
288
290
292
Time (Sec)A
mp
.
SDM in video1
0 2 4232
234
236
238
Time (Sec)
Am
p.
GFT in video2
0 2 4288
290
292
294
296
298
300
Time (Sec)
Am
p.
SDM in video2
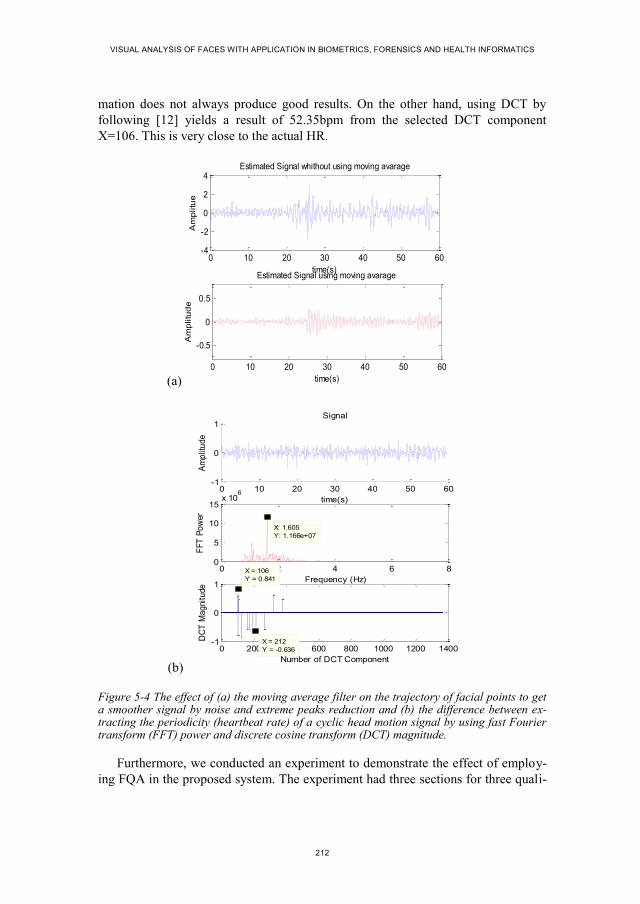
VISUAL ANALYSIS OF FACES WITH APPLICATION IN BIOMETRICS, FORENSICS AND HEALTH INFORMATICS
212
mation does not always produce good results. On the other hand, using DCT by
following [12] yields a result of 52.35bpm from the selected DCT component
X=106. This is very close to the actual HR.
(a)
(b)
Figure 5-4 The effect of (a) the moving average filter on the trajectory of facial points to get a smoother signal by noise and extreme peaks reduction and (b) the difference between ex-tracting the periodicity (heartbeat rate) of a cyclic head motion signal by using fast Fourier transform (FFT) power and discrete cosine transform (DCT) magnitude.
Furthermore, we conducted an experiment to demonstrate the effect of employ-
ing FQA in the proposed system. The experiment had three sections for three quali-
0 10 20 30 40 50 60-4
-2
0
2
4
time(s)
Estimated Signal whithout using moving avarage
Am
plitu
e
0 10 20 30 40 50 60
-0.5
0
0.5
time(s)
Estimated Signal using moving avarage
Am
plitu
de
0 10 20 30 40 50 60-1
0
1
time(s)
Signal
Am
plit
ud
e
0 2 4 6 80
5
10
15x 10
6
X: 1.605
Y: 1.166e+07
Frequency (Hz)
FF
T P
ow
er
0 200 400 600 800 1000 1200 1400-1
0
1
X = 212
Y = -0.636
Number of DCT Component
DC
T M
ag
nitu
de
X = 106
Y = 0.841

CHAPTER 5. HEARTBEAT RATE MEASUREMENT FROM FACIAL VIDEO
213
ty metrics: resolution, brightness, and out-of-plan pose. The results of HR meas-
urement on six datasets collected for FQA experiment are shown in Table 5-2.
From the results, it is clear that when resolution decreases the accuracy of the sys-
tem decreases accordingly. Thus, FQA for face resolution is necessary to ensure a
good size face in the system. The results also show that the brightness variation and
the pose variation have influence on the HR measurement. We observe that when
frames of low quality, in terms of brightness and pose, are discarded the accuracy of
HR measurement increases.
Table 5-2 Analysing the effect of the FQA in HR measurement
Exp. Name Dataset Average percentage (%) of error in HR
measurement
Resolution
Res1 10.65
Res2 11.74
Res3 18.86
Res4 37.35
Brightness Bright_FQA before FQA 18.77
Bright_FQA after FQA 17.62
Pose variation Pose_FQA before FQA 17.53
Pose_FQA after FQA 14.01
5.5.3. PERFORMANCE COMPARISON
We have compared the performance of the proposed method against state-of-the-art
methods from [3], [5], [6], [11], [12] on the experimental datasets listed in Table
5-1. Table 5-3 lists the accuracy of HR measurement results of the proposed method
in comparison with the motion-based state of the art methods [11], [12] on our local
database. We have measured the accuracy in terms of percentage of measurement
error. The lower the error generated by a method, the higher the accuracy of that
method. From the results we observe that the proposed method showed consistent
performance, although the data acquisition scenarios were different for different
datasets. By using both GFT and SDM trajectories, the proposed method gets more
trajectories to estimate the HR pattern in the case of HR_Norm_Data and accurate
trajectories due to non-missing facial points in the cases of HR_Expr_Data and
HR_Motion_Data. On the other hand, the previous methods suffer from fewer tra-
jectories and/or erroneous trajectories from the data acquired in challenging scenar-
ios, e.g. Balakrishnan’s method showed an up to 25.07% error in HR estimation

VISUAL ANALYSIS OF FACES WITH APPLICATION IN BIOMETRICS, FORENSICS AND HEALTH INFORMATICS
214
from videos having facial expression change. The proposed method outperforms the
previous methods in both environments (lab and in a fitness center) of data acquisi-
tion, including all three scenarios.
Table 5-3 Performance comparison between the proposed method and the state-of-the-art methods of HR measurement on our local databases
Dataset name
Average percentage (%) of error in HR measurement
Balakrishnan et al.
[11] Irani et al. [12]
The proposed
method
Lab_HR_Norm_Data 7.76 7.68 2.80
Lab_HR_Expr_Data 13.86 9.00 4.98
Lab_HR_Motion_Data 16.84 5.59 3.61
FC_HR_Norm_Data 8.07 10.75 5.11
FC_HR_Expr_Data 25.07 10.16 6.23
FC_HR_Motion_Data 23.90 15.16 7.01
Table 5-4 Performance comparison between the proposed method and the state-of-the-art methods of HR measurement on MAHNOB-HCI database
Method RMSE (bpm) Mean error rate (%)
Poh et al. [3] 25.90 25.00
Kwon et al. [7] 25.10 23.60
Balakrishnan et al. [11] 21.00 20.07
Poh et al. [6] 13.60 13.20
Li et al. [5] 7.62 6.87
Irani et al. [12] 5.03 6.61
The proposed method 3.85 4.65
Table 5-4 shows the performance comparison of HR measurement by our pro-
posed method and state-of-the-art methods (both color-based and motion-based) on
MAHNOB-HCI_Data. We calculate the Root Mean Square Error (RMSE) in beat-
per-minute (bpm) and mean error rate in percentage to compare the results. From
the results we can observe that Li’s [5], Irani’s [12], and the proposed method

CHAPTER 5. HEARTBEAT RATE MEASUREMENT FROM FACIAL VIDEO
215
showed considerably higher results than the other methods because they take into
consideration the presence of voluntary head motion in the video. However, unlike
Li’s color-based method, Irani’s method and the proposed method are motion-
based. Thus, changing the illumination condition in MAHNOB-HCI_Data does not
greatly affect the motion-based methods, as indicated by the results. Finally, we
observe that the proposed method outperforms all these state-of-the-art methods in
the accuracy of HR measurement.
5.6. CONCLUSIONS
This chapter proposes a system for measuring HR from facial videos acquired in
more realistic scenarios than the scenarios of previous systems. The previous meth-
ods work well only when there is neither voluntary motion of the face nor change of
expression and when the lighting conditions help keeping sufficient texture in the
forehead and cheek. The proposed method overcomes these problems by using an
alternative facial landmarks tracking system (the SDM-based system) along with
the previous feature points tracking system (the GFT-based system) and provides
competent results. The performance of the proposed system for HR measurement is
highly accurate and reliable not only in a laboratory setting with no-motion, no-
expression cases in artificial light in the face, as considered in [11], [12], but also in
challenging real-life environments. However, the proposed system is not adapted
yet to the real-time application for HR measurement due to dependency on temporal
stability of the facial point trajectory.
5.7. REFERENCES
[1] J. Klonovs, M. A. Haque, V. Krueger, K. Nasrollahi, K. Andersen-Ranberg, T.
B. Moeslund, and E. G. Spaich, Distributed Computing and Monitoring Tech-
nologies for Older Patients, 1st ed. Springer International Publishing, 2015.
[2] H.-Y. Wu, M. Rubinstein, E. Shih, J. Guttag, F. Durand, and W. Freeman,
“Eulerian Video Magnification for Revealing Subtle Changes in the World,”
ACM Trans Graph, vol. 31, no. 4, pp. 65:1–65:8, Jul. 2012.
[3] M.-Z. Poh, D. J. McDuff, and R. W. Picard, “Non-contact, automated cardiac
pulse measurements using video imaging and blind source separation,” Opt.
Express, vol. 18, no. 10, pp. 10762–10774, May 2010.
[4] H. Monkaresi, R. . Calvo, and H. Yan, “A Machine Learning Approach to
Improve Contactless Heart Rate Monitoring Using a Webcam,” IEEE J. Bio-
med. Health Inform., vol. 18, no. 4, pp. 1153–1160, Jul. 2014.
[5] X. Li, J. Chen, G. Zhao, and M. Pietikainen, “Remote Heart Rate Measurement
From Face Videos Under Realistic Situations,” in IEEE Conference on Com-
puter Vision and Pattern Recognition (CVPR), 2014, pp. 4321–4328.

VISUAL ANALYSIS OF FACES WITH APPLICATION IN BIOMETRICS, FORENSICS AND HEALTH INFORMATICS
216
[6] M.-Z. Poh, D. J. McDuff, and R. W. Picard, “Advancements in Noncontact,
Multiparameter Physiological Measurements Using a Webcam,” IEEE Trans.
Biomed. Eng., vol. 58, no. 1, pp. 7–11, Jan. 2011.
[7] S. Kwon, H. Kim, and K. S. Park, “Validation of heart rate extraction using
video imaging on a built-in camera system of a smartphone,” in 2012 Annual
International Conference of the IEEE Engineering in Medicine and Biology
Society (EMBC), 2012, pp. 2174–2177.
[8] M. A. Haque, K. Nasrollahi, and T. B. Moeslund, “Heartbeat Signal from Fa-
cial Video for Biometric Recognition,” in Image Analysis, R. R. Paulsen and
K. S. Pedersen, Eds. Springer International Publishing, 2015, pp. 165–174.
[9] M. A. Haque, K. Nasrollahi, and T. B. Moeslund, “Can contact-free measure-
ment of heartbeat signal be used in forensics?,” in 23rd European Signal Pro-
cessing Conference (EUSIPCO), Nice, France, 2015, pp. 1–5.
[10] M. A. Haque, K. Nasrollahi, and T. B. Moeslund, “Efficient contactless heart-
beat rate measurement for health monitoring,” Internatinal J. Integr. Care, vol.
15, no. 7, pp. 1–2, Oct. 2015.
[11] G. Balakrishnan, F. Durand, and J. Guttag, “Detecting Pulse from Head Mo-
tions in Video,” in IEEE Conference on Computer Vision and Pattern Recog-
nition (CVPR), 2013, pp. 3430–3437.
[12] R. Irani, K. Nasrollahi, and T. B. Moeslund, “Improved Pulse Detection from
Head Motions Using DCT,” in 9th International Conference on Computer Vi-
sion Theory and Applications (VISAPP), 2014, pp. 1–8.
[13] J. Bouguet, “Pyramidal implementation of the Lucas Kanade feature tracker,”
Intel Corp. Microprocess. Res. Labs, 2000.
[14] A. D. Bagdanov, A. Del Bimbo, F. Dini, G. Lisanti, and I. Masi, “Posterity
Logging of Face Imagery for Video Surveillance,” IEEE Multimed., vol. 19,
no. 4, pp. 48–59, Oct. 2012.
[15] K. Nasrollahi and T. B. Moeslund, “Extracting a Good Quality Frontal Face
Image From a Low-Resolution Video Sequence,” IEEE Trans. Circuits Syst.
Video Technol., vol. 21, no. 10, pp. 1353–1362, Oct. 2011.
[16] M. A. Haque, K. Nasrollahi, and T. B. Moeslund, “Quality-Aware Estimation
of Facial Landmarks in Video Sequences,” in IEEE Winter Conference on Ap-
plications of Computer Vision (WACV), 2015, pp. 1–8.
[17] X. Xiong and F. De la Torre, “Supervised Descent Method and Its Applica-
tions to Face Alignment,” in IEEE Conference on Computer Vision and Pat-
tern Recognition (CVPR), 2013, pp. 532–539.
[18] J. Shi and C. Tomasi, “Good features to track,” in IEEE Conference on Com-
puter Vision and Pattern Recognition (CVPR), 1994, pp. 593–600.
CHAPTER 5. HEARTBEAT RATE MEASUREMENT FROM FACIAL VIDEO
217
[19] T. F. Cootes, G. J. Edwards, and C. J. Taylor, “Active appearance models,”
IEEE Trans. Pattern Anal. Mach. Intell., vol. 23, no. 6, pp. 681–685, Jun.
2001.
[20] A. U. Batur and M. H. Hayes, “Adaptive active appearance models,” IEEE
Trans. Image Process., vol. 14, no. 11, pp. 1707–1721, Nov. 2005.
[21] Y. Feng, J. Xiao, Y. Zhuang, X. Yang, J. J. Zhang, and R. Song, “Exploiting
temporal stability and low-rank structure for motion capture data refinement,”
Inf. Sci., vol. 277, pp. 777–793, Sep. 2014.
[22] P. Viola and M. J. Jones, “Robust Real-Time Face Detection,” Int J Comput
Vis., vol. 57, no. 2, pp. 137–154, May 2004.
[23] M. A. Haque, K. Nasrollahi, and T. B. Moeslund, “Real-time acquisition of
high quality face sequences from an active pan-tilt-zoom camera,” in 10th
IEEE International Conference on Advanced Video and Signal Based Surveil-
lance (AVSS), 2013, pp. 443–448.
[24] M. Soleymani, J. Lichtenauer, T. Pun, and M. Pantic, “A Multimodal Database
for Affect Recognition and Implicit Tagging,” IEEE Trans. Affect. Comput.,
vol. 3, no. 1, pp. 42–55, Jan. 2012.

219
CHAPTER 6. FACIAL VIDEO BASED
DETECTION OF PHYSICAL FATIGUE
FOR MAXIMAL MUSCLE ACTIVITY
Mohammad Ahsanul Haque, Ramin Irani, Kamal Nasrollahi, and Thomas B.
Moeslund
This paper has been accepted and pre-published in the
IET Computer Vision
vol. -, no. -, pp. 1-20, 2016
DOI: 10.1049/iet-cvi.2015.0215
© 2016 IET
The layout has been revised.


221
6.1. ABSTRACT
Physical fatigue reveals the health condition of a person at for example health
check-up, fitness assessment or rehabilitation training. This chapter presents an
efficient noncontact system for detecting non-localized physical fatigue from maxi-
mal muscle activity using facial videos acquired in a realistic environment with
natural lighting where subjects were allowed to voluntarily move their head,
change their facial expression, and vary their pose. The proposed method utilizes a
facial feature point tracking method by combining a ‘Good feature to track’ and a
‘Supervised descent method’ to address the challenges originates from realistic
scenario. A face quality assessment system was also incorporated in the proposed
system to reduce erroneous results by discarding low quality faces that occurred in
a video sequence due to problems in realistic lighting, head motion and pose varia-
tion. Experimental results show that the proposed system outperforms video based
existing system for physical fatigue detection.
6.2. INTRODUCTION
Fatigue is an important physiological parameter that usually describes the overall
feeling of tiredness or weakness in human body. Fatigue may be either mental or
physical or both [1]. Mental fatigue is a state of cortical deactivation due to pro-
longed periods of cognitive activity that reduces mental performance. On the other
hand, physical fatigue refers to the declination of the ability of muscles to generate
force. Stress, for example, makes people mentally exhausted, while hard work or
extended physical exercise can exhaust people physically. Though mental fatigue is
related to cognitive activity, it can occur during a physical activity that comprises
neurological phenomenon, for example directed attention as found in the area of
intelligent transportation systems [2]. Unlike mental fatigue that is related to cogni-
tive performance, physical fatigue specifically refers to muscles’ inability to force
optimally due to inadequate rest during a muscle activity [1]. Physical fatigue oc-
curs from two types of activities: submaximal muscle activity (e.g. using a cycle
ergometer or motor driven treadmill) and maximal muscle activity (e.g. pressing a
dynamometer or lifting a load with great force) [3]. This kind of fatigue is a signifi-
cant physiological parameter, especially for athletes or therapists. For example, by
monitoring the occurrence of a patient’s fatigue during physical exercise in rehabili-
tation scenarios, a therapist can change the exercise, make it easier or even stop it if
necessary. Estimating the fatigue time offsets can also provide information in pos-
terity health analysis [1].
A number of video-based non-invasive methods for fatigue detection and quan-
tification have been proposed in the literature. The methods utilized some features
and clues, as shown in Figure 6-1(a), automatically extracted from a subject’s facial
video and discriminate between fatigue and non-fatigue classes automatically. For
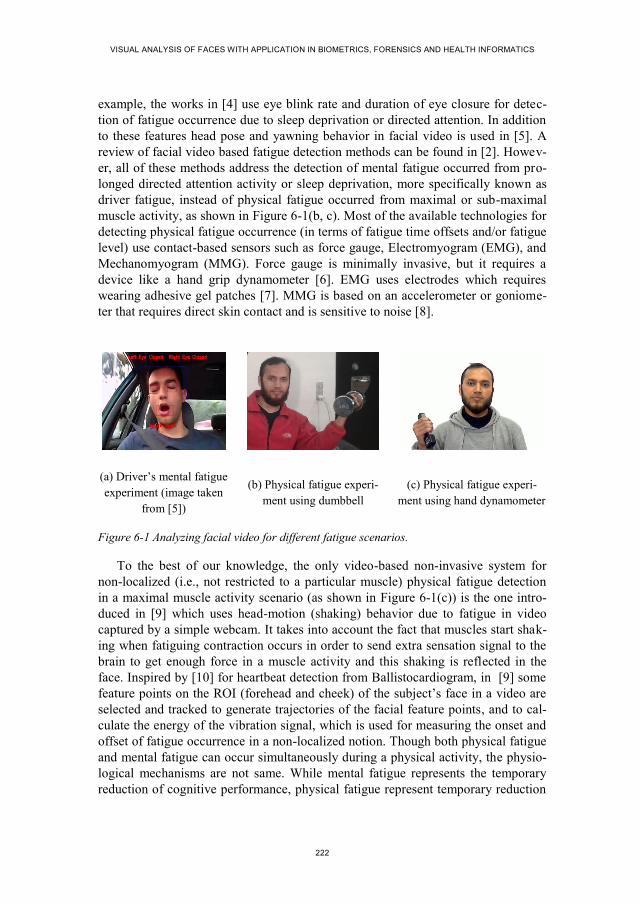
VISUAL ANALYSIS OF FACES WITH APPLICATION IN BIOMETRICS, FORENSICS AND HEALTH INFORMATICS
222
example, the works in [4] use eye blink rate and duration of eye closure for detec-
tion of fatigue occurrence due to sleep deprivation or directed attention. In addition
to these features head pose and yawning behavior in facial video is used in [5]. A
review of facial video based fatigue detection methods can be found in [2]. Howev-
er, all of these methods address the detection of mental fatigue occurred from pro-
longed directed attention activity or sleep deprivation, more specifically known as
driver fatigue, instead of physical fatigue occurred from maximal or sub-maximal
muscle activity, as shown in Figure 6-1(b, c). Most of the available technologies for
detecting physical fatigue occurrence (in terms of fatigue time offsets and/or fatigue
level) use contact-based sensors such as force gauge, Electromyogram (EMG), and
Mechanomyogram (MMG). Force gauge is minimally invasive, but it requires a
device like a hand grip dynamometer [6]. EMG uses electrodes which requires
wearing adhesive gel patches [7]. MMG is based on an accelerometer or goniome-
ter that requires direct skin contact and is sensitive to noise [8].
(a) Driver’s mental fatigue
experiment (image taken
from [5])
(b) Physical fatigue experi-
ment using dumbbell
(c) Physical fatigue experi-
ment using hand dynamometer
Figure 6-1 Analyzing facial video for different fatigue scenarios.
To the best of our knowledge, the only video-based non-invasive system for
non-localized (i.e., not restricted to a particular muscle) physical fatigue detection
in a maximal muscle activity scenario (as shown in Figure 6-1(c)) is the one intro-
duced in [9] which uses head-motion (shaking) behavior due to fatigue in video
captured by a simple webcam. It takes into account the fact that muscles start shak-
ing when fatiguing contraction occurs in order to send extra sensation signal to the
brain to get enough force in a muscle activity and this shaking is reflected in the
face. Inspired by [10] for heartbeat detection from Ballistocardiogram, in [9] some
feature points on the ROI (forehead and cheek) of the subject’s face in a video are
selected and tracked to generate trajectories of the facial feature points, and to cal-
culate the energy of the vibration signal, which is used for measuring the onset and
offset of fatigue occurrence in a non-localized notion. Though both physical fatigue
and mental fatigue can occur simultaneously during a physical activity, the physio-
logical mechanisms are not same. While mental fatigue represents the temporary
reduction of cognitive performance, physical fatigue represent temporary reduction

CHAPTER 6. FACIAL VIDEO BASED DETECTION OF PHYSICAL FATIGUE FOR MAXIMAL MUSCLE ACTIVITY
223
of force induced in muscle to accomplish a physical activity [2]. Unlike driver men-
tal fatigue, physical fatigue for maximal muscle activity does not necessarily re-
quire a prolonged period. Thus, the visual clues found in the case of driver fatigue
cannot be found in the case of physical fatigue from maximal muscle contraction.
Changes in facial features in these two different types of fatigue are very different:
in the driver mental fatigue eye blinking, yawning, varying head pose and degree of
mouth openness are used (as shown in Figure 6-1(a)), while in the non-localized
maximal muscle contraction based physical fatigue head motion behavior from
shaking is used. Consequently, physical fatigue occurred from maximal muscle
activity cannot be detected or quantized by the computer vision methods used for
detecting driver mental fatigue.
The previous facial video based method in [9] for non-localized physical fatigue
detection extracts some facial feature points as shown in Figure 6-2(a). Depending
upon imaging scenario, the number of feature points and their position can vary.
The method then employs signal processing techniques to detect head motion tra-
jectories from feature points in the video frames and estimates energy escalation to
detect fatiguing contraction. However, the work in [9] assumes that there is neither
internal facial motion, nor external movement or rotation of the head during the
data acquisition phase. We denote internal motion as facial expression and external
motion as head pose. In real life scenarios there are, of course, both internal and
external head motion. The current method, therefore, fails due to an inability to
detect and track the feature points in the presence of internal and external motion,
and low texture in the facial region. Moreover, real-life scenarios challenge current
methods due to low facial quality in video because of motion blur, bad posing, and
poor lighting conditions [11]. The proposed system in this chapter extends [9] by
addressing the abovementioned shortcomings and thereby allows for automatic and
more reliable detection of fatigue time offsets from facial video captured by a sim-
ple webcam. To address the shortcomings, we introduce a Face Quality Assessment
(FQA) method that prunes the captured video data so that low quality face frames
cannot contribute to erroneous results [12], [13]. Following [10], [14], we track
feature points (Figure 6-2(a)) through a method Good Feature to Track (GFT) with
Kanady-Lucas-Tomasi (KLT) tracker, and then combine these trajectories with 49
facial landmark trajectories (Figure 6-2(b)), tracked by a Supervised Descent Meth-
od (SDM) of [15], [16]. The idea of combining these two types of features has been
developed in our paper [17], which was applied to heartbeat estimation from facial
video. Here we look at another application of this idea for physical fatigue estima-
tion. The experiments are conducted on realistic datasets collected at the lab and a
commercial fitness center for fatigue measurement. The chapter’s contributions are
as follows:
We identify the limitations of the GFT-based tracking used in previous
methods for physical fatigue detection and propose a solution using SDM-
based tracking.

VISUAL ANALYSIS OF FACES WITH APPLICATION IN BIOMETRICS, FORENSICS AND HEALTH INFORMATICS
224
We provide evidence for the necessity of combining the trajectories from the
GFT and the SDM, instead of using the trajectories from either the GFT or
the SDM.
We introduce the notion of FQA in the physical fatigue detection context
and demonstrate empirical evidence for its effectiveness.
The rest of the chapter is organized as follows. Section three describes the pro-
posed method. The results are summarized in section four. Finally, section five
concludes the chapter.
(a) (b)
Figure 6-2 (a) Facial feature points (total numbers can vary) in a face obtained by GFT-based tracking [9], (b) 49 facial landmarks in a face obtained by SDM-based tracking [15].
6.3. THE PROPOSED METHOD
The block diagram of the proposed method is shown in Figure 6-3. The steps are
explained in the following subsections.
6.3.1. FACE DETECTION AND FACE QUALITY ASSESSMENT
The first step of the proposed motion-based physical fatigue detection system is
face detection from facial video, which has been accomplished by Viola and Jones
object detection framework using Haar-like features obtained from integral images
[18].
Facial videos captured in real-life scenarios can be subject to the problems of
pose variation, varying levels of brightness, and motion blur. When the intensity of
these problems increases, the face quality decreases. A low quality face produces
erroneous results in detecting facial features using either GFT or SDM [11]. To
solve this problem, we pass the detected face to a FQA module. The FQA module
assesses the quality of the face in the video frames. As investigated in [17], [19],
four quality metrics can be critical for facial geometry analysis and detection of
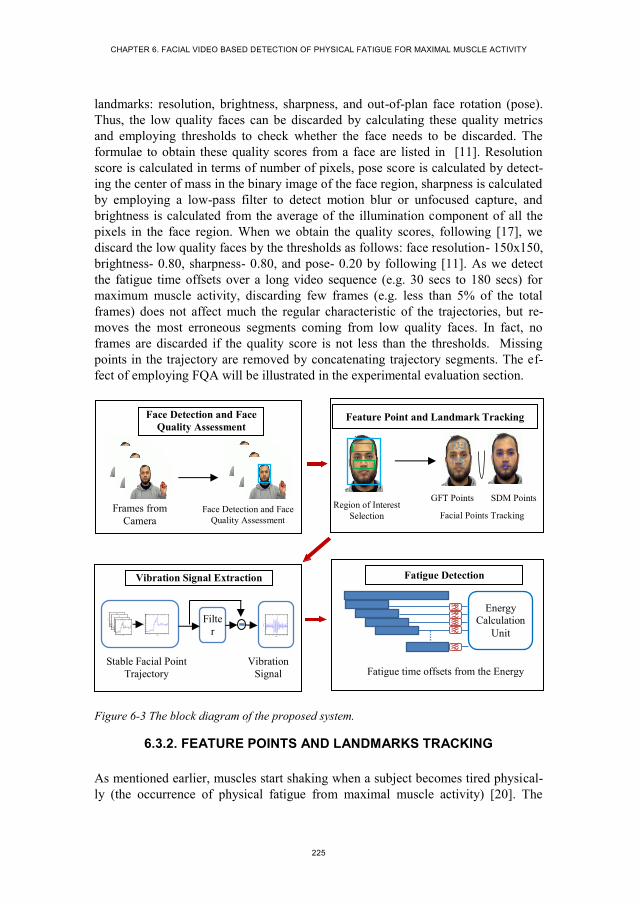
CHAPTER 6. FACIAL VIDEO BASED DETECTION OF PHYSICAL FATIGUE FOR MAXIMAL MUSCLE ACTIVITY
225
landmarks: resolution, brightness, sharpness, and out-of-plan face rotation (pose).
Thus, the low quality faces can be discarded by calculating these quality metrics
and employing thresholds to check whether the face needs to be discarded. The
formulae to obtain these quality scores from a face are listed in [11]. Resolution
score is calculated in terms of number of pixels, pose score is calculated by detect-
ing the center of mass in the binary image of the face region, sharpness is calculated
by employing a low-pass filter to detect motion blur or unfocused capture, and
brightness is calculated from the average of the illumination component of all the
pixels in the face region. When we obtain the quality scores, following [17], we
discard the low quality faces by the thresholds as follows: face resolution- 150x150,
brightness- 0.80, sharpness- 0.80, and pose- 0.20 by following [11]. As we detect
the fatigue time offsets over a long video sequence (e.g. 30 secs to 180 secs) for
maximum muscle activity, discarding few frames (e.g. less than 5% of the total
frames) does not affect much the regular characteristic of the trajectories, but re-
moves the most erroneous segments coming from low quality faces. In fact, no
frames are discarded if the quality score is not less than the thresholds. Missing
points in the trajectory are removed by concatenating trajectory segments. The ef-
fect of employing FQA will be illustrated in the experimental evaluation section.
Figure 6-3 The block diagram of the proposed system.
6.3.2. FEATURE POINTS AND LANDMARKS TRACKING
As mentioned earlier, muscles start shaking when a subject becomes tired physical-
ly (the occurrence of physical fatigue from maximal muscle activity) [20]. The
0 0.5 1 1.5 2 2.5 3190
195
200
205
210
215
time[Sec]
Am
plitu
te
0 0.5 1 1.5 2 2.5 3190
195
200
205
210
215
time[Sec]
Am
plitu
te
0 0.5 1 1.5 2 2.5 3190
195
200
205
210
215
time[Sec]
Am
plitu
te
0 0.5 1 1.5 2 2.5 3190
195
200
205
210
215
time[Sec]
Am
plitu
te
0 0.5 1 1.5 2 2.5 3150
152
154
156
158
160
162
164
166
168
time[Sec]
Am
plitu
te
0 50 100 150 200 250 300-0.6
-0.4
-0.2
0
0.2
0.4
0.6
0.8
time[Sec]
Am
plitu
te
Fatigue Detection
Fatigue time offsets from the Energy
Energy
Calculation
Unit
Stable Facial Point
Trajectory
Vibration
Signal
Vibration Signal Extraction
Filte
r
Region of Interest
Selection Facial Points Tracking
GFT Points SDM Points
Feature Point and Landmark Tracking
Frames from
Camera Face Detection and Face
Quality Assessment
Face Detection and Face
Quality Assessment
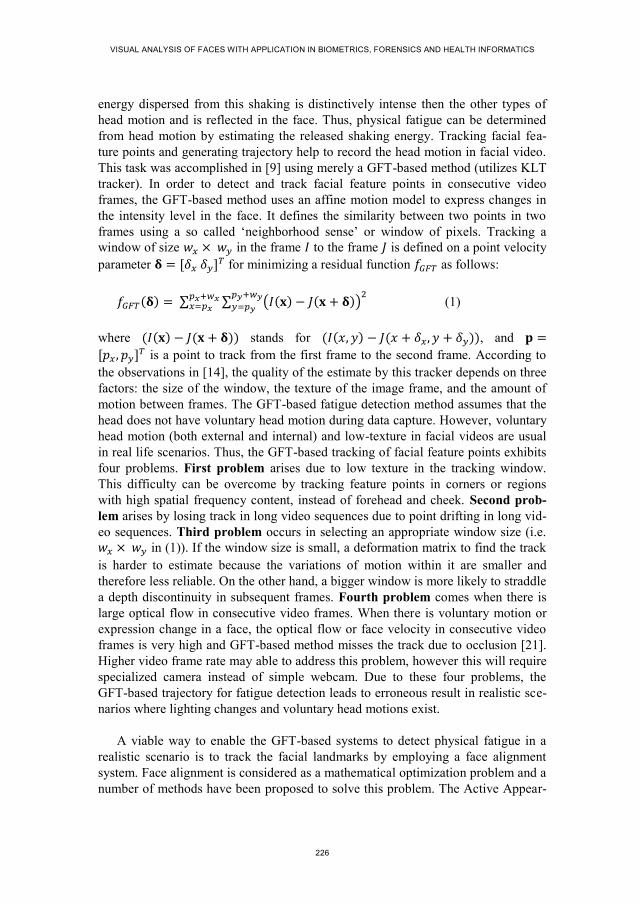
VISUAL ANALYSIS OF FACES WITH APPLICATION IN BIOMETRICS, FORENSICS AND HEALTH INFORMATICS
226
energy dispersed from this shaking is distinctively intense then the other types of
head motion and is reflected in the face. Thus, physical fatigue can be determined
from head motion by estimating the released shaking energy. Tracking facial fea-
ture points and generating trajectory help to record the head motion in facial video.
This task was accomplished in [9] using merely a GFT-based method (utilizes KLT
tracker). In order to detect and track facial feature points in consecutive video
frames, the GFT-based method uses an affine motion model to express changes in
the intensity level in the face. It defines the similarity between two points in two
frames using a so called ‘neighborhood sense’ or window of pixels. Tracking a
window of size 𝑤𝑥 × 𝑤𝑦 in the frame 𝐼 to the frame 𝐽 is defined on a point velocity
parameter 𝛅 = [𝛿𝑥 𝛿𝑦]𝑇 for minimizing a residual function 𝑓𝐺𝐹𝑇 as follows:
𝑓𝐺𝐹𝑇(𝛅) = ∑ ∑ (𝐼(𝐱) − 𝐽(𝐱 + 𝛅))2𝑝𝑦+𝑤𝑦
𝑦=𝑝𝑦
𝑝𝑥+𝑤𝑥𝑥=𝑝𝑥
(1)
where (𝐼(𝐱) − 𝐽(𝐱 + 𝛅)) stands for (𝐼(𝑥, 𝑦) − 𝐽(𝑥 + 𝛿𝑥, 𝑦 + 𝛿𝑦)), and 𝐩 =
[𝑝𝑥 , 𝑝𝑦]𝑇 is a point to track from the first frame to the second frame. According to
the observations in [14], the quality of the estimate by this tracker depends on three
factors: the size of the window, the texture of the image frame, and the amount of
motion between frames. The GFT-based fatigue detection method assumes that the
head does not have voluntary head motion during data capture. However, voluntary
head motion (both external and internal) and low-texture in facial videos are usual
in real life scenarios. Thus, the GFT-based tracking of facial feature points exhibits
four problems. First problem arises due to low texture in the tracking window.
This difficulty can be overcome by tracking feature points in corners or regions
with high spatial frequency content, instead of forehead and cheek. Second prob-
lem arises by losing track in long video sequences due to point drifting in long vid-
eo sequences. Third problem occurs in selecting an appropriate window size (i.e.
𝑤𝑥 × 𝑤𝑦 in (1)). If the window size is small, a deformation matrix to find the track
is harder to estimate because the variations of motion within it are smaller and
therefore less reliable. On the other hand, a bigger window is more likely to straddle
a depth discontinuity in subsequent frames. Fourth problem comes when there is
large optical flow in consecutive video frames. When there is voluntary motion or
expression change in a face, the optical flow or face velocity in consecutive video
frames is very high and GFT-based method misses the track due to occlusion [21].
Higher video frame rate may able to address this problem, however this will require
specialized camera instead of simple webcam. Due to these four problems, the
GFT-based trajectory for fatigue detection leads to erroneous result in realistic sce-
narios where lighting changes and voluntary head motions exist.
A viable way to enable the GFT-based systems to detect physical fatigue in a
realistic scenario is to track the facial landmarks by employing a face alignment
system. Face alignment is considered as a mathematical optimization problem and a
number of methods have been proposed to solve this problem. The Active Appear-

CHAPTER 6. FACIAL VIDEO BASED DETECTION OF PHYSICAL FATIGUE FOR MAXIMAL MUSCLE ACTIVITY
227
ance Model (AAM) fitting [22] and its derivatives [23] were some of the early solu-
tions in this area. The AAM fitting works by estimating parameters of an artificial
model that is sufficiently close to the given image. In order to do that AAM fitting
was formulated as a Lukas-Kanade (LK) problem [24], which could be solved using
Gauss-Newton optimization [25]. A fast and effective solution to this was proposed
recently in [15], which develops a Supervised Descent Method (SDM) to minimize
a non-linear least square function for face alignment. The SDM first uses a set of
manually aligned faces as training samples to learn a mean face shape. This mean
shape is then used as an initial point for an iterative minimization of a non-linear
least square function towards the best estimates of the positions of the landmarks in
facial test images. The minimization function can be defined as a function over ∆𝑥
as:
𝑓𝑆𝐷𝑀(𝑥0 + ∆𝑥) = ‖𝑔(𝑑(𝑥0 + ∆𝑥)) − 𝜃∗‖2
2 (2)
where 𝑥0 is the initial configuration of the landmarks in a facial image, 𝑑(𝑥) index-
es the landmarks configuration (𝑥) in the image, 𝑔 is a nonlinear feature extractor,
𝜃∗ = 𝑔(𝑑(𝑥∗)), and 𝑥∗ is the configuration of the true landmarks. The Scale Invari-
ant Feature Transform (SIFT) [11] is used as the feature extractor 𝑔. In the training
images ∆𝑥 and 𝜃∗ are known. By utilizing these known parameters the SDM itera-
tively learns a sequence of generic descent directions, {𝜕𝑛}, and a sequence of bias
terms, {𝛽𝑛}, to set the direction towards the true landmarks configuration 𝑥∗ in the
minimization process, which are further applied in the alignment of unlabelled faces
[15]. This working procedure of SDM in turns addresses the four previously men-
tioned problems of the GFT-based approach for head motion trajectory extraction
by as follows. First, the 49 facial landmark point tracked by SDM are taken only
around eye, lip, and nose edges and corners, as shown in Figure 6-2(b). As these
landmarks around the face patches have high spatial frequency and do not suffer
from low texturedness, this eventually solves the problem of low texturedness. We
cannot simply add these landmarks in the GFT based tracking, because the GFT
based method has its own feature point selector. Second, SDM does not use any
reference points in tracking. Instead, it detects each point around the edges and
corners in the facial region of each video frame by using supervised descent direc-
tions and bias terms. Thus, the problems of point drifting do not occur in long vide-
os. Third, SDM utilizes the ‘neighborhood sense’ on a pixel-by-pixel basis instead
of a window. Therefore, window size is not relevant to SDM. Fourth, the use of
supervised descent direction and bias terms allows the SDM to search selectively in
a wider space and look after it from large optical flow problem. Thus, large optical
flow cannot create occlusion in the SDM-based approach.
As in realistic scenarios the subjects are allowed to have voluntary head motion
and facial expression change in addition to the natural cyclic motion, the GFT-
based method results to either of the two consequences for videos having challeng-

VISUAL ANALYSIS OF FACES WITH APPLICATION IN BIOMETRICS, FORENSICS AND HEALTH INFORMATICS
228
ing scenarios: i) completely missing the track of feature points and ii) erroneous
tracking. We observed more than 80% loss of feature points by the system in such
cases. The GFT-based method, in fact, fails to preserve enough information to esti-
mate fatigue from trajectories even though the video have minor expression change
or head motion voluntarily. On the other hand, the SDM does not miss or errone-
ously track the landmarks in the presence of voluntary facial motions or expression
change or low texturedness as long as the face is qualified by the FQA. Thus, the
system can find enough trajectories to detect fatigue. However, the GFT-based
method uses a large number of facial points to track when compared to SDM. This
matter causes the GFT-based method to generate a better trajectory than SDM when
there is no voluntary motion or low texturedness. Following the above discussions
Table 6-1 summarizes the behavior of GFT, SDM and a combination of these two
methods in facial point tracking. We observe that a combination of trajectories ob-
tained by GFT and SDM-based methods can produce better results in cases where
subjects may have both motion and non-motion periods. We thus propose to com-
bine the trajectories. In order to generate combined trajectories, the face is passed to
the GFT-based tracker to generate trajectories from facial feature points and then
appended with the SDM trajectories.
6.3.3. VIBRATION SIGNAL EXTRACTION
To obtain vibration signal for fatigue detection, we take the average of all the tra-
jectories obtained from both feature and landmark points of a video by as follows:
𝑇(𝑛) =1
𝑀∑ (𝑦𝑚(𝑛) − �̅�𝑚)𝑀
𝑚=1 (3)
where 𝑇(𝑛) is the shifted mean filtered trajectory, 𝑦𝑚(𝑛) is the 𝑛-th frame of the
trajectory 𝑚, 𝑀 is the number of the trajectories, 𝑁 is the number of the frames in
each trajectory, and �̅�𝑚 is the mean value of the trajectory 𝑚 given by:
�̅�𝑚 = 1
𝑁∑ 𝑦𝑚(𝑛)𝑁
𝑛=1 (4)
The vibration signal that keeps the shaking information is calculated from 𝑇 by
using a window of size 𝑅 by:
𝑉𝑠(𝑛) = 𝑇(𝑛) − 1
𝑅∑ 𝑇(𝑛 − 𝑟)𝑅−1
𝑟=0 (5)
The obtained signal is then passed to the fatigue detection block.
Table 6-1 Behaviour of the GFT, SDM and a combination of both methods for facial points tracking in different scenarios
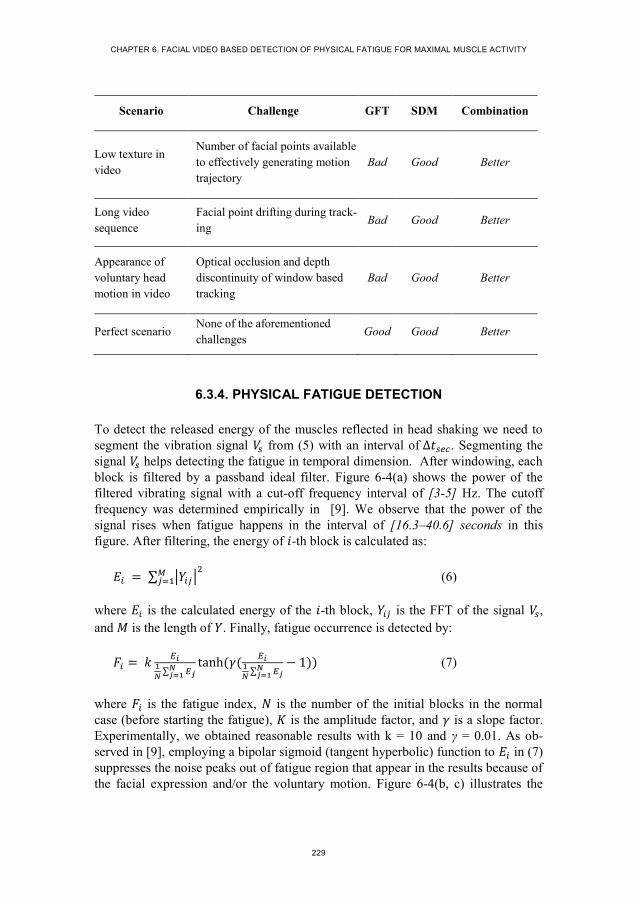
CHAPTER 6. FACIAL VIDEO BASED DETECTION OF PHYSICAL FATIGUE FOR MAXIMAL MUSCLE ACTIVITY
229
Scenario Challenge GFT SDM Combination
Low texture in
video
Number of facial points available
to effectively generating motion
trajectory
Bad Good Better
Long video
sequence
Facial point drifting during track-
ing Bad Good Better
Appearance of
voluntary head
motion in video
Optical occlusion and depth
discontinuity of window based
tracking
Bad Good Better
Perfect scenario None of the aforementioned
challenges Good Good Better
6.3.4. PHYSICAL FATIGUE DETECTION
To detect the released energy of the muscles reflected in head shaking we need to
segment the vibration signal 𝑉𝑠 from (5) with an interval of ∆𝑡𝑠𝑒𝑐. Segmenting the
signal 𝑉𝑠 helps detecting the fatigue in temporal dimension. After windowing, each
block is filtered by a passband ideal filter. Figure 6-4(a) shows the power of the
filtered vibrating signal with a cut-off frequency interval of [3-5] Hz. The cutoff
frequency was determined empirically in [9]. We observe that the power of the
signal rises when fatigue happens in the interval of [16.3–40.6] seconds in this
figure. After filtering, the energy of 𝑖-th block is calculated as:
𝐸𝑖 = ∑ |𝑌𝑖𝑗|2𝑀
𝑗=1 (6)
where 𝐸𝑖 is the calculated energy of the 𝑖-th block, 𝑌𝑖𝑗 is the FFT of the signal 𝑉𝑠,
and 𝑀 is the length of 𝑌. Finally, fatigue occurrence is detected by:
𝐹𝑖 = 𝑘𝐸𝑖
1
𝑁∑ 𝐸𝑗
𝑁𝑗=1
tanh (𝛾(𝐸𝑖
1
𝑁∑ 𝐸𝑗
𝑁𝑗=1
− 1)) (7)
where 𝐹𝑖 is the fatigue index, 𝑁 is the number of the initial blocks in the normal
case (before starting the fatigue), 𝐾 is the amplitude factor, and 𝛾 is a slope factor.
Experimentally, we obtained reasonable results with k = 10 and γ = 0.01. As ob-
served in [9], employing a bipolar sigmoid (tangent hyperbolic) function to 𝐸𝑖 in (7)
suppresses the noise peaks out of fatigue region that appear in the results because of
the facial expression and/or the voluntary motion. Figure 6-4(b, c) illustrates the

VISUAL ANALYSIS OF FACES WITH APPLICATION IN BIOMETRICS, FORENSICS AND HEALTH INFORMATICS
230
effect of the sigmoid function on the output results and Figure 6-4(d, e) depicts the
effect in values. To realize the effect of such noise suppression in percentage, by
following [26] we use the following metric:
𝑆𝑈𝑃𝑖 =𝐹𝑖
𝐹𝑚𝑎𝑥× 100% (8)
where 𝑆𝑈𝑃𝑖 is the ratio of the noise to the released fatigue energy. If we employ (8)
on Figure 6-4(d, e), we obtain values 8.94%, 11.65% and 0.77%, 1.38%, respective-
ly, for the noise datatips shown in the figures. It can be noticed that before employ-
ing the suppression the noise to fatigue energy were ~10%, however reduced to
~1% after employing the suppression. When we obtain the fatigue index, the start-
ing and ending time of fatigue occurrence in a subject’s video are detected by em-
ploying a threshold with value: 1.0 to the normalized fatigue index, as the bipolar
sigmoid suppresses the signal energy out of fatigue region to less than 1.0 by (7).
Fatigue starts when the fatigue index exceeds the threshold upward and fatigue ends
when fatigue index exceeds the threshold downward.
6.4. EXPERIMENTAL RESULTS
6.4.1. EXPERIMENTAL ENVIRONMENT
The proposed method was implemented using a combination of Matlab (2013a) and
C++ environments. We integrated the SDM [15] with the GFT-based tracker from
[9], [11] to develop the system as explained in the methodology section. We col-
lected four experimental video databases to generate results: a database for demon-
strating the effect of FQA, a database with voluntary motions in some moments for
evaluating the performance of GFT, SDM and the combination of GFT and SDM, a
database collected from the subjects in a natural laboratory environment, and a
database collected from the subjects at a real-life environment in a commercial
fitness center. We named the databases as “FQA_Fatigue_Data”,
“Eval_Fatigue_Data” “Lab_Fatigue_Data” and “FC_Fatigue_Data” respectively.
All the video clips were captured in VGA resolution using a Logitech C310
webcam. The videos were collected from 16 subjects (including both male and
female from different ethnicities with the ages between 25 to 40 years) after ade-
quately informing the subjects about the concepts of maximal muscle fatigue and
the experimental scenarios. Subjects exposed their face in front of the cameras
while performing maximal muscle activity by using a handgrip dynamometer for
about 30-180 seconds (varies from subject to subject). Subjects were free to have
natural head motion and expression variation due to activity prompted by using the
dynamometer. Both setups (in the laboratory and in the fitness center) used indoor
lighting for video capturing and the dynamometer reading to measure ground truth
for fatigue. The FQA_Fatigue_Data has 12 videos, each of which contains some
low quality face in some moments. The Eval_Fatigue_Data has 17 videos with

CHAPTER 6. FACIAL VIDEO BASED DETECTION OF PHYSICAL FATIGUE FOR MAXIMAL MUSCLE ACTIVITY
231
voluntary motion, Lab_Fatigue_Data has 54 videos and the FC_Fatigue_Data has
11 videos in natural scenario.
(a)
(b) (c)
(d) (e)
Figure 6-4 Analyzing trajectory for fatigue detection: (a) The power of the trajectory where the blue region is the resting time and the red region shows the fatigue due to exercise in the interval (16.3–40.6) seconds, (b) and (c) before and after using a bipolar sigmoid function to suppress the noise peaks, respectively, and (d) and (e) depicts the effect of bipolar sigmoid in values corresponding to (b) and (c), respectively.
As physical fatigue in a video clip occurs between a starting time and an ending
time, the starting and ending times detected from the video by the experimental
methods should match with the starting and ending times of fatigue obtained from
the ground truth dynamometer data. Thus, we analyzed and measured the error
between the ground truth and the output of the experimental methods for starting
and ending time agreement by defining a parameter μ. This parameter expresses the
0 20 40 60 800
0.05
0.1
0.15
0.2
Time [Sec]
Pow
er
Power of filtered vibrating signal in the interval (3-5)Hz
0 20 40 60
0
20
40
60
Time [min]
Fati
gue
in
de
x
0 20 40 60
0
200
400
600
Time [min]
Fati
gue
in
de
x
0 20 40 60
0
20
40
60
X: 17.52
Y: 6.068
Time [min]
Fatigue index
X: 50.26
Y: 7.911
X: 30.46
Y: 67.91
0 20 40 60-100
0
100
200
300
400
500
600
X: 17.52
Y: 4.441
Time [min]
Fatigue index
X: 50.26
Y: 7.888
X: 30.46
Y: 573.6

VISUAL ANALYSIS OF FACES WITH APPLICATION IN BIOMETRICS, FORENSICS AND HEALTH INFORMATICS
232
average of the total of starting and ending point distances of fatigue occurrence for
each subject in the datasets, and is calculated as follows:
𝜇 = 1
𝑛∑ (|𝐺𝑆
𝑖 − 𝑅𝑆𝑖 | + |𝐺𝐸
𝑖 − 𝑅𝐸𝑖 |)𝑛
𝑖=1 (9)
where, 𝑛 is the number of video (subjects) in a dataset, 𝐺𝑆𝑖 is the ground truth of the
starting point of fatigue, 𝐺𝐸𝑖 is the ground truth of the ending point of fatigue, 𝑅𝑆
𝑖 is
the calculated starting point of fatigue, and 𝑅𝐸𝑖 is the calculated ending point of
fatigue.
Figure 6-5 Trajectories of tracking points extracted by Par-CLR [27], GFT [14], and SDM [15] from 5 seconds of two experimental video sequences with continuous small motion (for video1 in the first row) and large motion at the beginning and end (for video2 in the second row).
6.4.2. PERFORMANCE EVALUATION
The proposed method used a combination of the SDM- and GFT-based approaches
for trajectory generation from the facial points. Figure 6-5 shows the calculated
average trajectories of tracked points in two experimental videos. We depicted the
trajectories obtained from GFT-based tracker, SDM and another recent face align-
ment algorithm Par-CLR [27] for two facial videos with voluntary head motion. As
observed from the figure, the GFT and SDM-based trackers provide similar trajec-
tories when there is little head motion (video1, first row of Figure 6-5). On the other
hand, Par-CLR provides a trajectory very different than the other two because of
tracking on false positive face in the video frames. When the voluntary head motion
is sizable (beginning of video2, second row of Figure 6-5), GFT-based method fails
to track the point accurately and thus produces an erroneous trajectory. However,
0 1 2 3 4 5
285
290
295
Time (Sec)
Am
p.
Par-CLR in video1
0 1 2 3 4 5
244
246
248
250
252
Time (Sec)
Am
p.
GFT in video1
0 1 2 3 4 5282
284
286
288
290
292
Time (Sec)
Am
p.
SDM in video1
0 2 4
280
290
300
310
Time (Sec)
Am
p.
Par-CLR in video2
0 2 4232
234
236
238
Time (Sec)
Am
p.
GFT in video2
0 2 4288
290
292
294
296
298
300
Time (Sec)
Am
p.
SDM in video2

CHAPTER 6. FACIAL VIDEO BASED DETECTION OF PHYSICAL FATIGUE FOR MAXIMAL MUSCLE ACTIVITY
233
SDM provides stable trajectory in this case. Thus, lack in proper selection of meth-
od(s) for trajectory generation can contribute to erroneous results in estimating
fatigue time offsets, as we observe for the GFT-based tracker and the recently pro-
posed Par-CLR in comparison to SDM.
(a) (b)
Figure 6-6 Detection of physical fatigue due to maximal muscle activity: a) dynamometer reading during fatigue event, and b) fatigue time spectral map for fatigue time offset meas-urement. The blue region is the resting time and the red region shows the fatigue due to exercise.
For the fatigue time offset measurement experiment we asked the test subjects
to squeeze the handgrip dynamometer as much as they could. As they did this we
recorded their face. The squeezed dynamometer provides a pressure force, which is
used as the ground truth data in fatigue detection. Figure 6-6(a) displays the data
recorded while using the dynamometer, where the part of the graph with a falling
force indicates the fatigue region. The measured fatigue level from the dynamome-
ter reading is shown in Figure 6-6(b). Fatigue in this figure happens when the fa-
tigue level sharply goes beyond a threshold defined in [9]. Comparative experi-
mental results for fatigue detection using different methods are shown in the next
section.
We conducted experiments to evaluate the effect of employing FQA, and a
combination of GFT and SDM in the proposed system. Figure 6-7 shows the effect
of employing FQA on a trajectory obtained from a subject’s video. It is observed
that low quality face region (due to pose variation) shows erroneous trajectory and
contributed to the wrong detection of fatigue onset (Figure 6-7(a)). When, FQA
module discarded this region, the actual fatigue region was detected as shown in
Figure 6-7(b). Table 6-2 shows the results of employing FQA on the
FQA_Fatigue_Data, and evaluating the performance of GFT, SDM and the combi-
nation of these two on the Eval_Fatigue_Data. From the results it is observed that
when videos have low quality faces (which are true for all the videos of the
FQA_Fatigue_Data), automatic detection of fatigue time stumps exhibited very
0 20 40 60
0
100
200
300
Time [Sec]
Forc
e [
N]
0 50-500
0
500
1000
1500
Time [Sec]F
ati
gue
in
de
x

VISUAL ANALYSIS OF FACES WITH APPLICATION IN BIOMETRICS, FORENSICS AND HEALTH INFORMATICS
234
high error due to wrong place of detection. When we employed FQA the fatigue
was detected in the expected time with minor error. While comparing GFT, SDM
and the combination of these two, we observe that the SDM minimally outper-
formed the GFT, however the combination worked better. These observations came
with the agreement of the characteristics we listed in Table 6-1.
(a) (b)
Figure 6-7 Analyzing the effect of employing FQA on a trajectory obtained from an experi-mental video: (a) without employing FQA (red circle presents the real fatigue location and green rectangle presents the moments of low quality faces), (b) employing FQA (presenting the area within the red circle of (a)).
Table 6-2 Analysing the effect of the FQA and evaluating the performance of GFT, SDM, and the combination of GFT and SDM in fatigue detection
Dataset Scenario
Average of the total of the starting and
ending point distance of fatigue occurrence
for each subject in a dataset (𝝁)
FQA_Fatigue_Data Without FQA 65.32
With FQA 3.79
Eval_Fatigue Data
GFT 6.81
SDM 6.35
Combination of GFT
and SDM 5.16
6.4.3. PERFORMANCE COMPARISION
To the best of our knowledge, the method of [9] is the first and the only work in the
literature to detect physical fatigue from facial video. Other methods for facial vid-
eo based fatigue detection work for driver mental fatigue [2], and use different sce-
narios than what is used in physical fatigue detection environment. Thus, we have
100 110 120 130 140 150-2
0
2
4
6x 10
6
Rele
ase
d e
ne
rgy r
ati
ng
Time
0 50 100 150 2000
20
40
60
80
100
Time [sec]
Rele
ase
d e
nerg
y ra
ting
0 0.1 0.2 0.3 0.4 0.5 0.6 0.7 0.8 0.9 1
0 20 40 60-2
0
2
4
6x 10
6
Time [sec]
Rele
ase
d e
nerg
y ra
ting
0 0.1 0.2 0.3 0.4 0.5 0.6 0.7 0.8 0.9 1

CHAPTER 6. FACIAL VIDEO BASED DETECTION OF PHYSICAL FATIGUE FOR MAXIMAL MUSCLE ACTIVITY
235
compared the performance of the proposed method merely against the method of
[9] on the experimental datasets. Figure 6-8(a) shows the physical fatigue detection
duration for a subset of database Lab_Fatigue_Data in a bar diagram. The height of
the bar shows the duration of fatigue in seconds. Figure 6-8(b) shows the total de-
tection error in seconds for starting and ending points of fatigue in the videos. From
the result it is observed that the proposed method detected the presence of fatigue
(expressed by fatigue duration) more accurately than the previous method of [9] in
comparison to the ground truth as shown in Figure 6-8(a) and demonstrated better
agreement with the starting and ending time of fatigue with the ground truth as
shown Figure 6-8(b). Table 6-3 shows the fatigue detection results on both
Lab_Fatigue_Data and FC_Fatigue_Data, and compares the performance between
the state of the art method of [9] and the proposed method. While analyzing the
agreement with the starting and ending time of fatigue with the ground truth, we
observed that the proposed method shows more consistency than the method of [9]
both in the Lab_Fatigue_Data experimental scenario and the FC_Fatigue_Data real-
life scenario. However, the performance is higher for Lab_Fatigue_Data than
FC_Fatigue_Data. We believe the realistic scenario of a commercial fitness center
(in terms of lighting and subject’s natural behavior) contributes to lower perfor-
mance. The computational time of the proposed method suggest that the method is
doable for real-time application, because it requires only 3.5 milliseconds (app.)
processing time for each video frame in a platform with 3.3 GHz processor and
8GB RAM.
6.5. CONCLUSIONS
This chapter proposes a physical fatigue detecting system from facial video cap-
tured by a simple webcam. The proposed system overcomes the drawbacks of pre-
vious facial video based method of [9] by extending the application of SDM over
GFT based tracking and employing FQA. The previous method works well only
when there is neither voluntary motion of the face nor change of expression, and
when the lighting conditions help keeping sufficient texture in the forehead and
cheek. The proposed method overcomes these problems by using an alternative
facial landmarks tracking system (the SDM-based system) along with the previous
feature points tracking system (the GFT-based system) and provides competent
results. The performance of the proposed system showed very high accuracy in
proximity to the ground truth not only in a laboratory setting with controlled envi-
ronment, as considered in [9], but also in a real-life environment in a fitness center
where faces have some voluntary motion or expression change and lighting condi-
tions are normal.

VISUAL ANALYSIS OF FACES WITH APPLICATION IN BIOMETRICS, FORENSICS AND HEALTH INFORMATICS
236
a)
b)
Figure 6-8 Comparison of physical fatigue detection results of the proposed method with the Irani’s method [9] on a subset of the Lab_Fatigue_Data: (a) total duration of fatigue, and (b) total starting and ending point error in detection.
The proposed method has some limitations. The camera was placed in close
proximity to the face (about one meter away) because the GFT-based feature track-
er in the combined system does not work well if the face is far from the camera
1 2 3 4 5 6 7 8 9 10 11 120
10
20
30
40
50
60Total fatigue duration
Test subjects
Dur
ati
on o
f fa
tigu
e (s
ec)
Ground truth
Irani et al.
Proposed
1 2 3 4 5 6 7 8 9 10 11 120
2
4
6
8
10
12
14Total starting and ending point error with respect to ground truth
Test subjects
Det
ect
ion
err
or
(sec
)
Irani et al.
Proposed
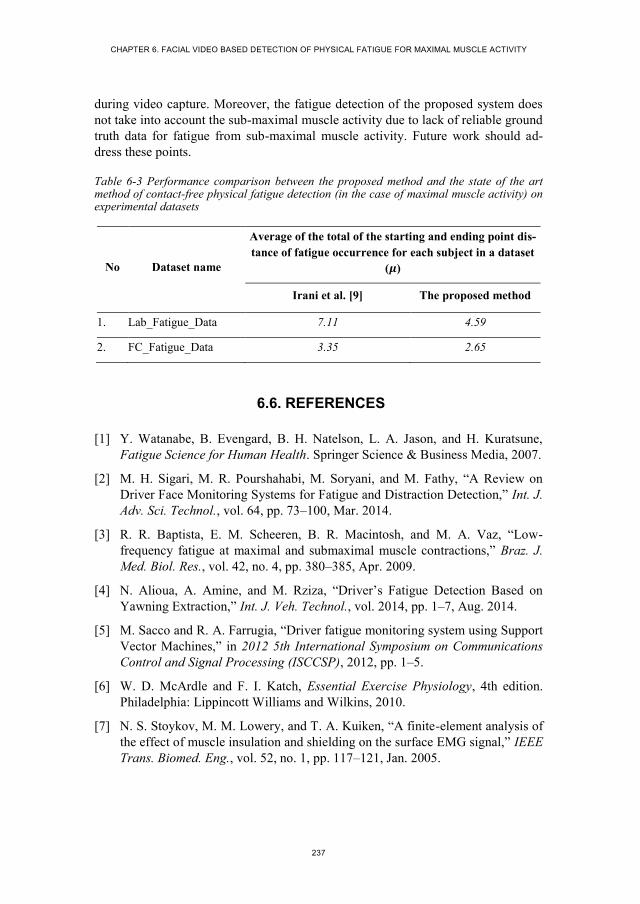
CHAPTER 6. FACIAL VIDEO BASED DETECTION OF PHYSICAL FATIGUE FOR MAXIMAL MUSCLE ACTIVITY
237
during video capture. Moreover, the fatigue detection of the proposed system does
not take into account the sub-maximal muscle activity due to lack of reliable ground
truth data for fatigue from sub-maximal muscle activity. Future work should ad-
dress these points.
Table 6-3 Performance comparison between the proposed method and the state of the art method of contact-free physical fatigue detection (in the case of maximal muscle activity) on experimental datasets
No Dataset name
Average of the total of the starting and ending point dis-
tance of fatigue occurrence for each subject in a dataset
(𝝁)
Irani et al. [9] The proposed method
1. Lab_Fatigue_Data 7.11 4.59
2. FC_Fatigue_Data 3.35 2.65
6.6. REFERENCES
[1] Y. Watanabe, B. Evengard, B. H. Natelson, L. A. Jason, and H. Kuratsune,
Fatigue Science for Human Health. Springer Science & Business Media, 2007.
[2] M. H. Sigari, M. R. Pourshahabi, M. Soryani, and M. Fathy, “A Review on
Driver Face Monitoring Systems for Fatigue and Distraction Detection,” Int. J.
Adv. Sci. Technol., vol. 64, pp. 73–100, Mar. 2014.
[3] R. R. Baptista, E. M. Scheeren, B. R. Macintosh, and M. A. Vaz, “Low-
frequency fatigue at maximal and submaximal muscle contractions,” Braz. J.
Med. Biol. Res., vol. 42, no. 4, pp. 380–385, Apr. 2009.
[4] N. Alioua, A. Amine, and M. Rziza, “Driver’s Fatigue Detection Based on
Yawning Extraction,” Int. J. Veh. Technol., vol. 2014, pp. 1–7, Aug. 2014.
[5] M. Sacco and R. A. Farrugia, “Driver fatigue monitoring system using Support
Vector Machines,” in 2012 5th International Symposium on Communications
Control and Signal Processing (ISCCSP), 2012, pp. 1–5.
[6] W. D. McArdle and F. I. Katch, Essential Exercise Physiology, 4th edition.
Philadelphia: Lippincott Williams and Wilkins, 2010.
[7] N. S. Stoykov, M. M. Lowery, and T. A. Kuiken, “A finite-element analysis of
the effect of muscle insulation and shielding on the surface EMG signal,” IEEE
Trans. Biomed. Eng., vol. 52, no. 1, pp. 117–121, Jan. 2005.

VISUAL ANALYSIS OF FACES WITH APPLICATION IN BIOMETRICS, FORENSICS AND HEALTH INFORMATICS
238
[8] M. B. I. Raez, M. S. Hussain, and F. Mohd-Yasin, “Techniques of EMG signal
analysis: detection, processing, classification and applications,” Biol. Proced.
Online, vol. 8, pp. 11–35, Mar. 2006.
[9] R. Irani, K. Nasrollahi, and T. B. Moeslund, “Contactless Measurement of
Muscles Fatigue by Tracking Facial Feature Points in A Video,” in IEEE In-
ternational Conference on Image Processing (ICIP), 2014, pp. 1–5.
[10] G. Balakrishnan, F. Durand, and J. Guttag, “Detecting Pulse from Head Mo-
tions in Video,” in IEEE Conference on Computer Vision and Pattern Recog-
nition (CVPR), 2013, pp. 3430–3437.
[11] M. A. Haque, K. Nasrollahi, and T. B. Moeslund, “Quality-Aware Estimation
of Facial Landmarks in Video Sequences,” in IEEE Winter Conference on Ap-
plications of Computer Vision (WACV), 2015, pp. 1–8.
[12] M. A. Haque, K. Nasrollahi, and T. B. Moeslund, “Real-time acquisition of
high quality face sequences from an active pan-tilt-zoom camera,” in 10th
IEEE International Conference on Advanced Video and Signal Based Surveil-
lance (AVSS), 2013, pp. 443–448.
[13] J. Klonovs, M. A. Haque, V. Krueger, K. Nasrollahi, K. Andersen-Ranberg, T.
B. Moeslund, and E. G. Spaich, Distributed Computing and Monitoring Tech-
nologies for Older Patients, 1st ed. Springer International Publishing, 2015.
[14] J. Shi and C. Tomasi, “Good features to track,” in IEEE Conference on Com-
puter Vision and Pattern Recognition (CVPR), 1994, pp. 593–600.
[15] X. Xiong and F. De la Torre, “Supervised Descent Method and Its Applica-
tions to Face Alignment,” in IEEE Conference on Computer Vision and Pat-
tern Recognition (CVPR), 2013, pp. 532–539.
[16] G. Tzimiropoulos and M. Pantic, “Optimization Problems for Fast AAM Fit-
ting in-the-Wild,” in IEEE Conference on Computer Vision and Pattern
Recognition (CVPR), 2013, pp. 593–600.
[17] M. A. Haque, R. Irani, K. Nasrollahi, and T. B. Moeslund, “Heartbeat Rate
Measurement from Facial Video (accepted),” IEEE Intell. Syst., Dec. 2015.
[18] P. Viola and M. J. Jones, “Robust Real-Time Face Detection,” Int J Comput
Vis., vol. 57, no. 2, pp. 137–154, May 2004.
[19] M. A. Haque, K. Nasrollahi, and T. B. Moeslund, “Constructing Facial Expres-
sion Log from Video Sequences using Face Quality Assessment,” in 9th Inter-
national Conference on Computer Vision Theory and Applications (VISAPP),
2014, pp. 1–8.
[20] R. R. Young and K.-E. Hagbarth, “Physiological tremor enhanced by manoeu-
vres affecting the segmental stretch reflex,” Journal of Neurology, Neurosur-
gery, and Psychiatry, vol. 43, pp. 248–256, 1980.

CHAPTER 6. FACIAL VIDEO BASED DETECTION OF PHYSICAL FATIGUE FOR MAXIMAL MUSCLE ACTIVITY
239
[21] J. Bouguet, “Pyramidal implementation of the Lucas Kanade feature tracker,”
Intel Corp. Microprocess. Res. Labs, 2000.
[22] T. F. Cootes, G. J. Edwards, and C. J. Taylor, “Active appearance models,”
IEEE Trans. Pattern Anal. Mach. Intell., vol. 23, no. 6, pp. 681–685, Jun.
2001.
[23] A. U. Batur and M. H. Hayes, “Adaptive active appearance models,” IEEE
Trans. Image Process., vol. 14, no. 11, pp. 1707–1721, Nov. 2005.
[24] S. Baker and I. Matthews, “Lucas-Kanade 20 Years On: A Unifying Frame-
work,” Int. J. Comput. Vis., vol. 56, no. 3, pp. 221–255, Feb. 2004.
[25] S. Lucey, R. Navarathna, A. B. Ashraf, and S. Sridharan, “Fourier Lucas-
Kanade Algorithm,” IEEE Trans. Pattern Anal. Mach. Intell., vol. 35, no. 6,
pp. 1383–1396, Jun. 2013.
[26] K. Nasrollahi, T. B. Moeslund, and M. Rahmati, “Summarization of Surveil-
lance Video Sequences using Face Quality Assessment,” Int. J. Image Graph.,
vol. 11, no. 02, pp. 207–233, Apr. 2011.
[27] A. Asthana, S. Zafeiriou, S. Cheng, and M. Pantic, “Incremental Face Align-
ment in the Wild,” in IEEE Conference on Computer Vision and Pattern
Recognition (CVPR), 2014, pp. 1–8.

241
CHAPTER 7. MULTIMODAL ESTIMATION
OF HEARTBEAT PEAK LOCATIONS AND
HEARTBEAT RATE FROM FACIAL
VIDEO USING EMPIRICAL MODE
DECOMPOSITION
Mohammad Ahsanul Haque, Kamal Nasrollahi, and Thomas B. Moeslund
This paper has been submitted (under review) in the
IEEE Transactions on Multimedia Computer Vision
© 2016 IEEE
The layout has been revised.


243
7.1. ABSTRACT
Available systems for heartbeat signal estimations from facial video only provide
an average of Heartbeat Rate (HR) over a period of time. However, physicians
require Heartbeat Peak Locations (HPL) to assess a patient’s heart condition by
detecting cardiac events and measuring different physiological parameters includ-
ing HR and its variability. This chapter proposes a new method of HPL estimation
from facial video using Empirical Mode Decomposition (EMD), which provides
clearly visible heartbeat peaks in a decomposed signal. The method also provides
the notion of both color- and motion-based HR estimation by using HPLs. Moreo-
ver, it introduces a decision level fusion of color and motion information for better
accuracy of multi-modal HR estimation. We have reported our results on the pub-
licly available challenging database MAHNOB-HCI to demonstrate the success of
our system in estimating HPL and HR from facial videos, even when there are vol-
untary internal and external head motions in the videos. The employed signal pro-
cessing technique has resulted in a system that could significantly advance, among
others, health-monitoring technologies.
7.2. INTRODUCTION
Heartbeat signals represent Heartbeat Peak Locations (HPLs) in a temporal domain
and help physicians assess the condition of a human cardiovascular system by de-
tecting cardiac events and measuring different important physiological parameters
such as Heartbeat Rate (HR) and its variability [1]. Until now the most popular
standard device for heartbeat signal acquisition has been the “Electrocardiogram
(ECG)”. Use of an ECG requires the patient to wear electrodes or chest straps,
which are obtrusive and fail in cases where patients/users get upset about the use of
the sensors and in cases where patients’/users’ skin is sensitive to the sensors. Thus,
technologies with contact-free sensors have emerged. Some of the contact-free
systems are the Radar Vital Sign Monitor (RVSM) [2], Laser Doppler Vibrometer
(LDV) [3], and Photoplethysmography (PPG) [4]. However, the availability of low
cost multimedia hardware including webcam and cell phone cameras has made it
possible to carry out research that involves extracting heartbeat signals and estimat-
ing HR from facial video acquired by an ordinary camera.
When the human heart pumps blood, subtle chromatic changes in the facial skin
and slight head motion occur periodically. These changes and motion are associated
with the periodic heartbeat signal and can be detected in a facial video [5]. Takano
et al. first utilized the subtle color changes as heartbeat signals from facial video
acquired by a camera to estimate HR [6]. Subsequently a number of methods have
been proposed to extract heartbeat signal from color change or head motion due to
heartbeat in facial video. However, all of these methods drew attention to the idea
of simply obtaining HR from the signal by employing filters and frequency domain
VISUAL ANALYSIS OF FACES WITH APPLICATION IN BIOMETRICS, FORENSICS AND HEALTH INFORMATICS
244
decomposition. In view of these previous methods, here are the demands/challenges
that we address in this chapter:
i. Previous methods provide an average HR over a certain time period, e.g.
30-60 seconds. Average HR alone is not sufficient to reveal some condi-
tions of the cardiovascular system [7]. Health monitoring personnel of-
ten ask for a more detailed view of heartbeat signals with visible peaks
that indicate the beats. However, employing frequency domain decom-
positions along with some filters on the extracted color or motion traces
from the facial video does not provide visible HPLs for further analysis.
ii. The accuracy of HR estimation from facial video has yet to reach the
level of ECG-based HR estimation. This compels investigations of a
more effective signal processing method than the methods used in the
literature to estimate HR.
iii. When a facial video is available, the beating of a heart typically shows
in the face through changing skin color and head movement. Thus,
merely estimating HR from color or motion information may be sur-
passed in accuracy by a fusion of these two modalities extracted from
the same video.
iv. Most of the facial video-based fully automatic HR estimation methods,
including color-based [6], [8]–[10] and motion-based [7], assume that
the head is static (or close to) during data capture. This means that there
is neither internal facial motion nor external movement or rotation of the
head during the data acquisition phase. We ascribe internal motion to
facial expression and external motion to head pose. However, in real life
scenarios there are, of course, both internal and external head motion.
Current methods, therefore, provide less accuracy in HR estimation and
no results for HPL.
In this chapter we address the aforementioned demands/challenges by proposing
a novel Empirical Mode Decomposition (EMD)-based approach to estimate HPL
and then HR. Unlike previous methods, the proposed EMD-based decomposition of
raw heartbeat traces provides a novel way to look into the heartbeat signal from
facial video and generates clearly visible heartbeat peaks that can be used in, among
others, further clinical analysis. We estimate the HR from both the number of peaks
detected in a time interval and inter-beat distance in a heartbeat signal from HPLs
obtained by employing the EMD. We then introduce a multimodal HR estimation
from facial video by fusion of color and motion information and demonstrate the
effectiveness of such a fusion in estimating HR. We report our results through a
publicly available challenging database MAHNOB-HCI [11] in order to demon-
strate the success of our system in estimating HR from facial videos, even when
there are voluntary internal and external head motions in the videos.
CHAPTER 7. MULTIMODAL ESTIMATION OF HEARTBEAT PEAK LOCATIONS AND HEARTBEAT RATE FROM FACIAL VIDEO USING EMPIRICAL MODE DECOMPOSITION
245
The rest of the chapter is organized as follows. Section three is a literature re-
view. Section four describes the proposed system for EMD-based HPL estimation.
Section five describes HR estimation from HPLs, and an approach to fusing color
and motion information for HR estimation. Section six presents the experimental
environment and the obtained results. Section seven contains the conclusions.
7.3. RELATED WORKS
Takano et al. first utilized the trace of skin color changes in facial video to extract
heartbeat signal and estimate HR [6]. They recorded the variations in the average
brightness of the Region of Interest (ROI) – a rectangular area on the subject’s
cheek – to estimate HR. This method was further improved by Verkruysse et al.,
who separated color channels (R, G and B) of ROI in captured video frames,
tracked each channel independently, and extracted HR by filtering and analyzing
the average color traces of pixels [12]. About two years later, Poh et al. proposed a
method that used ROI mean color values as color traces from facial video acquired
by a simple webcam, and employed Independent Component Analysis (ICA) to
separate the periodic signal sources and a frequency domain analysis of an ICA
component to measure HR [8]. The authors later improved their method by employ-
ing some filters before and after ICA [9]. Kwon et al. improved Poh’s method in [8]
by using merely green color channel instead of all three Red-Green-Blue (RGB)
color channels [10]. Wei et al. employed a Laplacian Eigenmap (LE), rather than
ICA, to obtain the uncontaminated heartbeat signal and demonstrated better per-
formance than the ICA-based method [13]. Other articles contributed a peripheral
improvement of the color-based HR measurement by using a better estimation of
ROI [14], adding a supervised machine learning component to the system [15], and
analyzing the distance between the camera and the face during data capture [16].
Color-based methods suffer from tracking sensitivity to color noise and illumi-
nation variation. Thus, Balakrishnan et al. proposed a method for HR estimation
which was based on invisible motion in the head due to pulsation of the heart mus-
cles, which can be obtained by a Ballistocardiogram [7]. In this approach, some
feature points were automatically selected on the ROI of the subject’s facial video
frames. These feature points were tracked by the Kanade–Lucas–Tomasi (KLT)
feature tracker [17] to generate some trajectories, and then a Principle Component
Analysis (PCA) was applied to decompose trajectories into a set of orthogonal sig-
nals based on Eigen values. Selection of the heartbeat rate was accomplished by
using the percentage of the total spectral power of the signal, which accounted for
the frequency with the maximum power and its first harmonic. In contrast to color-
based methods, Balakrishnan’s system was not only able to address the color noise
sensitivity but also to provide similar accuracy without requiring color video. How-
ever, Balakrishnan’s assumption of selecting maximal frequency of the chosen
signal as pulse frequency is not very precise. Thus, a semi-supervised method in
[18] was proposed to improve the results of Balakrishnan’s method by using the

VISUAL ANALYSIS OF FACES WITH APPLICATION IN BIOMETRICS, FORENSICS AND HEALTH INFORMATICS
246
Discrete Cosine Transform (DCT) along with a moving average filter rather than
the Fast Fourier Transform (FFT) employed in Balakrishnan’s work. The method in
[19] also utilized motion information; however, unlike [7] it used ICA (previously
used in color-based methods) to decompose the signal, but demonstrated the results
on a local database.
7.4. THE PROPOSED SYSTEM
The proposed HPL estimation method extracts the color and motion traces from
facial video as the raw heartbeat signal. As heartbeats are cyclic, the raw signal is
passed through a filter to discard extraneous trends and cyclical components. The
resultant signal is then decomposed into some Intrinsic Mode Functions (IMF) by
employing a decomposition method. We then select the IMF that keeps the heart-
beat peaks and employ a peak detection method to estimate the HPLs. This section
describes the steps of the proposed EMD-based HPL estimation method from color
or motion traces as shown in Figure 7-1.
Figure 7-1 Steps of the proposed HPL estimation method using skin color or head motion information from facial video.
7.4.1. VIDEO ACQUISITION AND FACE DETECTION
The first step of the proposed HPL estimation system is face detection from facial
video acquired by a simple RGB camera. We employ the well-known Haar-like
feature-based Viola and Jones object detection framework [20] for face detection.
Examples of face detection results in a video frame are shown by the red rectangles
in Figure 7-2.
5 6 7 8 9 10 11 12 13 14
-0.5
0
0.5
6 8 10 12 14
-0.5
0
0.5
0 5 10 15 20 25 300
0.1
0.2
0.3
0.4
0.5
0.6
0.7
0 0.5 1 1.5 2 2.5 3190
195
200
205
210
215
time[Sec]
Am
plitu
te
0 0.5 1 1.5 2 2.5 3190
195
200
205
210
215
time[Sec]
Am
plitu
te
0 5 10 15 20 25 300
0.1
0.2
0.3
0.4
0.5
0.6
0.7
0 5 10 15 20 25 30-2
-1.5
-1
-0.5
0
0.5
1
1.5
2
2.5
Video Acquisition
and Face Detection
Decomposition
and HPL
Estimation
Color or Motion
Traces Extraction
OR
Vibrating Signal
Extraction
HP Filter

CHAPTER 7. MULTIMODAL ESTIMATION OF HEARTBEAT PEAK LOCATIONS AND HEARTBEAT RATE FROM FACIAL VIDEO USING EMPIRICAL MODE DECOMPOSITION
247
7.4.2. FACIAL COLOR AND MOTION TRACES EXTRACTION
As mentioned earlier, periodic circulation of the blood from the heart through the
body causes facial skin to change color, and the head to move or shake in a cyclic
motion. The proposed system for HPL estimation can utilize either of the modalities
(skin color variations and head motions) as shown in Figure 7-1. Recoding RGB
values of pixels in facial regions to generate the color trace and tracking some facial
feature points to generate the motion trace help to record such skin color variation
and head motion from facial video, respectively. In order to obtain the traces of
either of the two modalities, we first select a ROI in the detected face. For the color-
based approach, the ROI contains 60% of the facial area width (following [5]) de-
tected by the automatic face detection method, as shown by the green rectangle in
Figure 7-2(a). We take the average of the RGB values of all pixels in the ROI in
each frame and obtain a single color trace as follows:
𝑆�̅�𝑜𝑙𝑜𝑟(𝑡) = 1
𝑛∑ 𝜇𝑖(𝑅, 𝐺, 𝐵)𝑛
𝑖=1 (1)
where, 𝑆�̅�𝑜𝑙𝑜𝑟 is the color trace, 𝑛 is the total number of pixels in the ROI, 𝜇𝑖 is the
grayscale value of the 𝑖-th pixel obtained from R, G and B values, and 𝑡 is the frame
index.
Figure 7-2 Selected ROIs (green rectangles) and tracked feature points (inside the green rectangles) in a face of a subject’s video for the color trace (left) and the motion trace (right).
For the motion-based approach the ROI (following [18]) contains two areas of
forehead and cheek, as shown by the green rectangles in Figure 7-2(b). We divide
the ROI into a grid of rectangular regions of pixels and detect some feature points
in each region by employing a method called Good Features to Track (GFT) [21].
The GFT works by finding corner points from the minimal Eigen values of the win-
dows of pixels in the ROI. An example of all the feature points detected by GFT in
the ROI is shown by white markers in Figure 7-2(b). When the head moves due to

VISUAL ANALYSIS OF FACES WITH APPLICATION IN BIOMETRICS, FORENSICS AND HEALTH INFORMATICS
248
heart pulse, the feature points also move in the pixel coordinates. We employ a
KLT tracker to track the feature points in consecutive video frames and obtain a
single trajectory of each feature points in the video by measuring Euclidian distance
of the point-locations in consecutive frames. We then fuse all trajectories into a
single motion trace as follows:
𝑆�̅�𝑜𝑡𝑖𝑜𝑛(𝑡) = 1
𝑛∑ 𝑆𝑖(𝑡)𝑛
𝑖=1 (2)
where, 𝑆𝑖(𝑡) is the trajectory of 𝑖-th feature point in the video frame 𝑡 and 𝑛 is the
total number of trajectories.
Both color and motion traces (𝑆�̅�𝑜𝑙𝑜𝑟 and 𝑆�̅�𝑜𝑡𝑖𝑜𝑛 , respectively) are one dimen-
sional raw heartbeat signals with lengths equivalent to the number of video frames
and values that represent the color variation and head motion, respectively. The
next steps of the proposed method follow the same procedure for both color and
motion and hereafter we refer to the raw heartbeat signal as 𝑆̅.
7.4.3. VIBRATING SIGNAL EXTRACTION
The raw heartbeat signal (𝑆̅) contains other extraneous high and low frequency
cyclic components than heart beat due to ambient color and motion noise induced
from the data capturing environment. It also exhibits non-cyclical trendy noise due
to voluntary head motion, facial expression, and/or vestibular activity. Thus, to
remove/reduce the extraneous frequency components and trends from the signal we
decompose it using Hodrick-Prescott (HP) filter [22]. The filter breaks down the
signal into the following components with respect to a smoothing penalty parame-
ter, 𝜏:
𝑆𝜏𝑙𝑜𝑔(𝑡) = 𝑇𝜏(𝑡) + 𝐶𝜏(𝑡) (3)
where 𝑆𝜏𝑙𝑜𝑔
is the logarithm of 𝑆̅, 𝑇𝜏 is the trend component, and 𝐶𝜏 denotes the
cyclical component of the signal with 𝑡 as the time index (video frame index). We
follow two times the decomposition of the trajectory by using two smoothing pa-
rameter values 𝜏 = ∞ and 𝜏 = 400 to obtain all of the cyclic components (𝐶∞) and
high frequency cyclic components (𝐶400), respectively. A detailed description of the
HP filter can be obtained from [22]. We completely overlook the trend components
(𝑇𝜏) because these are not characterized by cyclic pattern of heartbeat. We then
obtain the difference between the cyclical components to get the vibrating signal as
follows:
𝑉(𝑡) = 𝐶∞(𝑡) − 𝐶400(𝑡) (4)

CHAPTER 7. MULTIMODAL ESTIMATION OF HEARTBEAT PEAK LOCATIONS AND HEARTBEAT RATE FROM FACIAL VIDEO USING EMPIRICAL MODE DECOMPOSITION
249
We will show how a signal evolves by employing the aforementioned phases in
the experimental evaluation section. The obtained vibrating signal (𝑉) is then
passed to the next step of the system.
7.4.4. EMD-BASED SIGNAL DECOMPOSITION FOR THE PROPOSED HPL ESTIMATION
The vibrating signal (𝑉) cannot clearly depict the heartbeat peaks (which will be
shown in the experimental evaluation section). This is because of the contamination
of heartbeat information by the other lighting and motion sources, which the HP
filter alone cannot restore for visibility. Previous methods in [7]–[10], [14], [18]
moved to the frequency domain and filtered the signal by different bandpass filters
and/or calculating the power spectrum of the signal to determine the HR in the fre-
quency domain. However, this cannot provide a heartbeat signal with visible peaks,
i.e. no possible HPL estimation, and thus cannot be useful for clinical applications
where inter-beat intervals are necessary or signal variation needs to be observed
over time. Thus, we employ a derivative of EMD to address the issue. EMD usually
decomposes a nonlinear and non-stationary time-series into functions that form a
complete and nearly orthogonal basis for the original signal [23]. The functions into
which a signal is decomposed are all in the time domain and of the same length as
the original signal. However, the functions allow for varying frequency in time to
be preserved. When a signal is generated as a composite of multiple source signals
and each of the source signals may have individual frequency band, calculating
IMFs using EMD can provide illustratable source signals.
In the case of processing the heart signal obtained from skin color or head mo-
tion information from facial video, the obtained vibrating signal (𝑉) is a nonlinear
and nonstationary time-series that comes as a composite of multiple source signals
from lighting change, and/or internal and external head motions along with heart-
beat. The basic EMD, as defined by Huang [24], breaks down a signal into IMFs
satisfying the following two conditions:
i. In the whole signal, the number of extrema and the number of zero-crossings
cannot differ by more than 1.
ii. At any point, both means of the envelopes defined by the local maxima and
local minima are zero.
The decomposition can be formulated as follows:
𝑉(𝑡) = ∑ 𝑀𝑖 + 𝑟𝑚𝑖=1 (5)
where 𝑀𝑖 presents the mode functions satisfying the aforementioned conditions, 𝑚
is the number of modes, and 𝑟 is the residue of the signal after extracting all the
IMFs. The procedure of extracting such IMFs (𝑀𝑖) is called shifting. The shifting
VISUAL ANALYSIS OF FACES WITH APPLICATION IN BIOMETRICS, FORENSICS AND HEALTH INFORMATICS
250
process starts by calculating the first mean (µ𝑖,0) from the upper and lower enve-
lopes of the original signal (𝑉 in our case) by connecting local maxima. Then a
component is calculated as the first component (𝐼𝑖,0) for iteration as follows:
𝐼𝑖,0 = 𝑉(𝑡) − µ𝑖,0 (6)
The component 𝐼𝑖,0 is then considered the data signal for an iterative process, which
is defined as follows:
𝐼𝑖,𝑗 = 𝐼𝑖,𝑗−1 − µ𝑖,𝑗 (7)
The iteration stops when a predefined value exceeds the following parameter (δ)
calculated in each step:
δ𝑖,𝑗 = ∑(𝐼𝑖,𝑗−1(𝑘)−𝐼𝑖,𝑗(𝑘))2
𝐼𝑖,𝑗−12 (𝑘)
𝑙𝑘=1 (8)
where 𝑙 is the number of samples in 𝐼 (in our case, the number of video frames
used).
The basic model of EMD described above, however, exhibits some problems
such as the presence of oscillations of very disparate amplitudes in a mode and/or
the presence of very similar oscillations in different modes. In order to solve these
problems an enhanced model of EMD was proposed by Torres et al. [25], which is
called Complete Ensemble Empirical Mode Decomposition with Adaptive Noise
(CEEMDAN). CEEMDAN adds a particular noise at each stage of the decomposi-
tion and then computes residue to generate each IMF. The results reported by
Torres showed the efficiency of CEEMDAN over EMD. Therefore, we decompose
our vibrating signal (𝑉) into IMFs (𝑀𝑖) by using the CEEMDAN. The total number
of IMFs depends on the vibrating signal’s nature. As a normal adult’s resting HR
falls within the frequencies [0.75 − 2.0] Hz (i.e. [45 − 120] bpm) [7] and merely
6-th IMF falls within this range, we selected the 6-th IMF as the final uncontami-
nated (or less contaminated) form of the heartbeat signal of all experimental cases.
We employ a local maxima-based peak detection algorithm on the selected
heartbeat signal (the 6-th IMF) to estimate the HPL. The peak detection process
was restricted by a minimum peak distance parameter to avoid redundant peaks in
nearby positions. The obtained peak locations are the HPLs estimated by the pro-
posed system.

CHAPTER 7. MULTIMODAL ESTIMATION OF HEARTBEAT PEAK LOCATIONS AND HEARTBEAT RATE FROM FACIAL VIDEO USING EMPIRICAL MODE DECOMPOSITION
251
7.5. HR CALCULATION USING THE PROPOSED MUTLI-MODAL FUSION
The HPLs we obtained in the previous section can be utilized to measure the total
number of peaks and peak distances in a heartbeat signal. These can be obtained for
either case of the color and motion information from facial video. We calculate the
HR in bpm for both approaches in two different ways – from the total number of
peaks and average peak distance – as follows:
𝐻𝑅𝑛𝑢𝑚𝑃𝑒𝑎𝑘 = (𝑁×𝐹𝑟𝑎𝑡𝑒
𝐹𝑡𝑜𝑡𝑎𝑙) × 60 (9)
𝐻𝑅𝑑𝑖𝑠𝑡𝑃𝑒𝑎𝑘 = (𝐹𝑟𝑎𝑡𝑒
1(𝑁−1)
∑ 𝑑𝑘(𝑁−1)𝑘=1
) × 60 (10)
where 𝑁 is the total number of peaks detected, 𝐹𝑟𝑎𝑡𝑒 is the video frame rate per
second, 𝐹𝑡𝑜𝑡𝑎𝑙 is the total number of video frames used to generate the heartbeat
signal, and 𝑑𝑘 is the distance between two consecutive peaks.
As we stated in the first section of this chapter, facial video contains both color
and motion information that denote heartbeat. Along with the proposed EMD-based
method, the applications of color information for HR estimation were shown in [8]–
[10], [14], [15], and the applications of motion information were shown in [7], [18].
None of these methods exploited both color and motion information. We assume
that, since color and motion information have different notions of heartbeat repre-
sentation, a fusion of these two modalities in estimating HR can include more de-
terministic characteristics of heart pulses in the heartbeat signal.
There are three levels that can be considered for the fusion of modalities: raw-
data level, feature level, and decision level [26]. Although the extracted raw heart-
beat signals in color and motion-based approaches have the same dimensions, they
are mismatched due to the nature of the data they present. Thus, instead of raw-data
level and feature level fusion, we propose a rule-based decision level (HR estima-
tion results) fusion in this chapter for exploiting the HR estimation results from
both modalities. For each of the modalities, we obtain two results using the total
number of peaks and average peak distance. Thus, we have four different estimates
of the HR: 𝐻𝑅𝑛𝑢𝑚𝑃𝑒𝑎𝑘𝑐𝑜𝑙𝑜𝑟 , 𝐻𝑅𝑑𝑖𝑠𝑡𝑃𝑒𝑎𝑘
𝑐𝑜𝑙𝑜𝑟 , 𝐻𝑅𝑛𝑢𝑚𝑃𝑒𝑎𝑘𝑚𝑜𝑡𝑖𝑜𝑛 , and 𝐻𝑅𝑑𝑖𝑠𝑡𝑃𝑒𝑎𝑘
𝑚𝑜𝑡𝑖𝑜𝑛 . We employed
four feasible rules, listed in Table 7-1, to find the optimal fusion.
7.6. EXPERIMENTS AND OBTAINED RESULTS
This section first describes the experimental environment used to generate the re-
sults and then describes the performance evaluation and comparison against state of
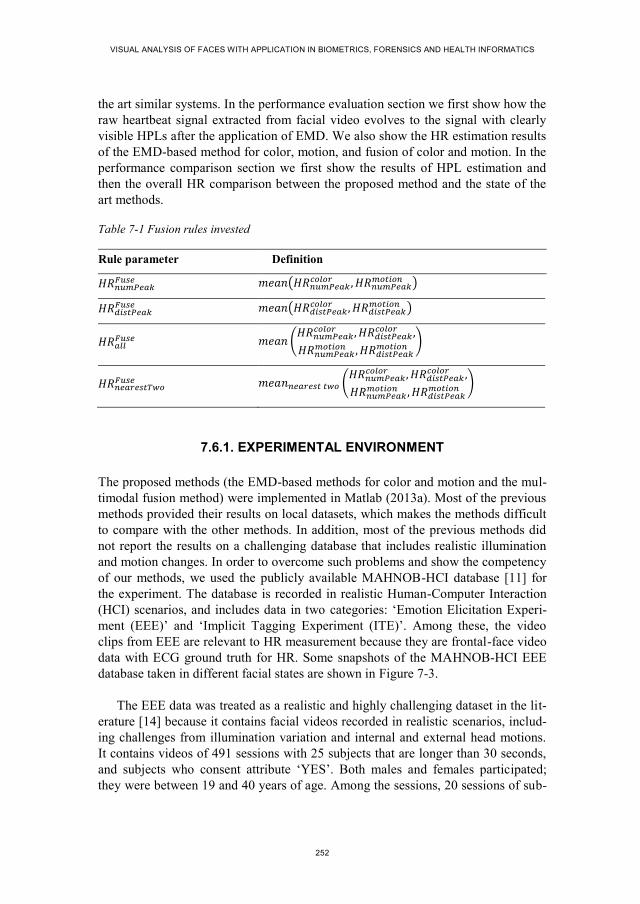
VISUAL ANALYSIS OF FACES WITH APPLICATION IN BIOMETRICS, FORENSICS AND HEALTH INFORMATICS
252
the art similar systems. In the performance evaluation section we first show how the
raw heartbeat signal extracted from facial video evolves to the signal with clearly
visible HPLs after the application of EMD. We also show the HR estimation results
of the EMD-based method for color, motion, and fusion of color and motion. In the
performance comparison section we first show the results of HPL estimation and
then the overall HR comparison between the proposed method and the state of the
art methods.
Table 7-1 Fusion rules invested
Rule parameter Definition
𝐻𝑅𝑛𝑢𝑚𝑃𝑒𝑎𝑘𝐹𝑢𝑠𝑒 𝑚𝑒𝑎𝑛(𝐻𝑅𝑛𝑢𝑚𝑃𝑒𝑎𝑘
𝑐𝑜𝑙𝑜𝑟 , 𝐻𝑅𝑛𝑢𝑚𝑃𝑒𝑎𝑘𝑚𝑜𝑡𝑖𝑜𝑛 )
𝐻𝑅𝑑𝑖𝑠𝑡𝑃𝑒𝑎𝑘𝐹𝑢𝑠𝑒 𝑚𝑒𝑎𝑛(𝐻𝑅𝑑𝑖𝑠𝑡𝑃𝑒𝑎𝑘
𝑐𝑜𝑙𝑜𝑟 , 𝐻𝑅𝑑𝑖𝑠𝑡𝑃𝑒𝑎𝑘𝑚𝑜𝑡𝑖𝑜𝑛 )
𝐻𝑅𝑎𝑙𝑙𝐹𝑢𝑠𝑒 𝑚𝑒𝑎𝑛 (
𝐻𝑅𝑛𝑢𝑚𝑃𝑒𝑎𝑘𝑐𝑜𝑙𝑜𝑟 , 𝐻𝑅𝑑𝑖𝑠𝑡𝑃𝑒𝑎𝑘
𝑐𝑜𝑙𝑜𝑟 ,
𝐻𝑅𝑛𝑢𝑚𝑃𝑒𝑎𝑘𝑚𝑜𝑡𝑖𝑜𝑛 , 𝐻𝑅𝑑𝑖𝑠𝑡𝑃𝑒𝑎𝑘
𝑚𝑜𝑡𝑖𝑜𝑛)
𝐻𝑅𝑛𝑒𝑎𝑟𝑒𝑠𝑡𝑇𝑤𝑜𝐹𝑢𝑠𝑒 𝑚𝑒𝑎𝑛𝑛𝑒𝑎𝑟𝑒𝑠𝑡 𝑡𝑤𝑜 (
𝐻𝑅𝑛𝑢𝑚𝑃𝑒𝑎𝑘𝑐𝑜𝑙𝑜𝑟 , 𝐻𝑅𝑑𝑖𝑠𝑡𝑃𝑒𝑎𝑘
𝑐𝑜𝑙𝑜𝑟 ,
𝐻𝑅𝑛𝑢𝑚𝑃𝑒𝑎𝑘𝑚𝑜𝑡𝑖𝑜𝑛 , 𝐻𝑅𝑑𝑖𝑠𝑡𝑃𝑒𝑎𝑘
𝑚𝑜𝑡𝑖𝑜𝑛)
7.6.1. EXPERIMENTAL ENVIRONMENT
The proposed methods (the EMD-based methods for color and motion and the mul-
timodal fusion method) were implemented in Matlab (2013a). Most of the previous
methods provided their results on local datasets, which makes the methods difficult
to compare with the other methods. In addition, most of the previous methods did
not report the results on a challenging database that includes realistic illumination
and motion changes. In order to overcome such problems and show the competency
of our methods, we used the publicly available MAHNOB-HCI database [11] for
the experiment. The database is recorded in realistic Human-Computer Interaction
(HCI) scenarios, and includes data in two categories: ‘Emotion Elicitation Experi-
ment (EEE)’ and ‘Implicit Tagging Experiment (ITE)’. Among these, the video
clips from EEE are relevant to HR measurement because they are frontal-face video
data with ECG ground truth for HR. Some snapshots of the MAHNOB-HCI EEE
database taken in different facial states are shown in Figure 7-3.
The EEE data was treated as a realistic and highly challenging dataset in the lit-
erature [14] because it contains facial videos recorded in realistic scenarios, includ-
ing challenges from illumination variation and internal and external head motions.
It contains videos of 491 sessions with 25 subjects that are longer than 30 seconds,
and subjects who consent attribute ‘YES’. Both males and females participated;
they were between 19 and 40 years of age. Among the sessions, 20 sessions of sub-

CHAPTER 7. MULTIMODAL ESTIMATION OF HEARTBEAT PEAK LOCATIONS AND HEARTBEAT RATE FROM FACIAL VIDEO USING EMPIRICAL MODE DECOMPOSITION
253
ject ‘12’ do not have ECG ground truth data and 20 sessions of subject ‘26’ are
missing video data. Excluding these sessions, we used the remainder as the dataset
for our experiment. In this database, the ground truth ECG signals were acquired
using three sensors and listed as EXG1, EXG2 and EXG3 channels in the data files.
As the original videos are of different lengths, we use 30 seconds (frame 306 to
2135) of each video and the corresponding ECG from EXG3 for the ground truth.
(a) Video acquisition environment
(b) Faces in normal (leftmost column) and challeng-
ing states (rest of the columns)
Figure 7-3 Video acquisition environment and example faces of five subjects from the MAHNOB-HCI database [11].
We show the experimental results for HPL estimation in a qualitative manner
and HR estimation through four statistical parameters used in the previous literature
[8], [14]. The first one is mean error, defined as follows:
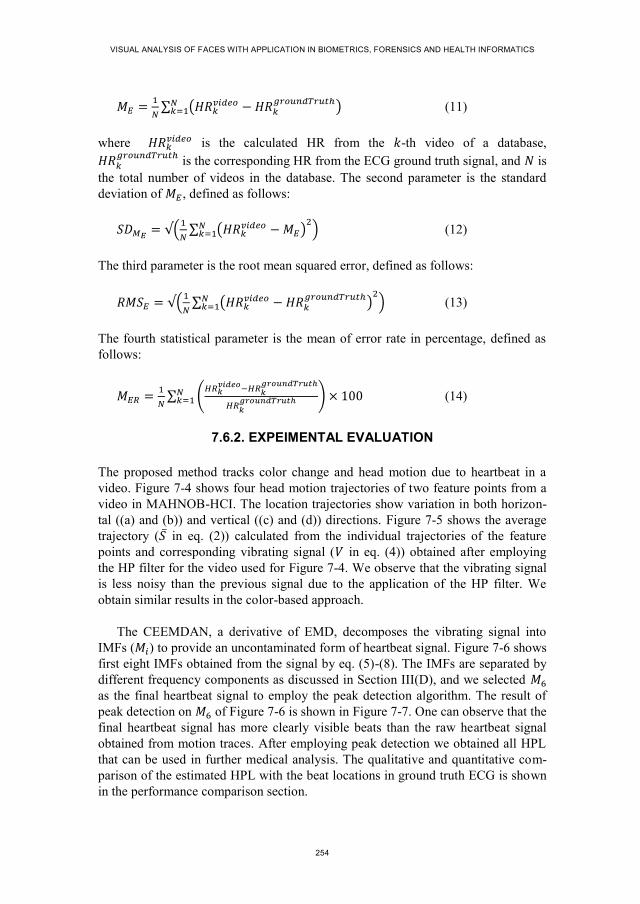
VISUAL ANALYSIS OF FACES WITH APPLICATION IN BIOMETRICS, FORENSICS AND HEALTH INFORMATICS
254
𝑀𝐸 =1
𝑁∑ (𝐻𝑅𝑘
𝑣𝑖𝑑𝑒𝑜 − 𝐻𝑅𝑘𝑔𝑟𝑜𝑢𝑛𝑑𝑇𝑟𝑢𝑡ℎ
)𝑁𝑘=1 (11)
where 𝐻𝑅𝑘𝑣𝑖𝑑𝑒𝑜 is the calculated HR from the 𝑘-th video of a database,
𝐻𝑅𝑘𝑔𝑟𝑜𝑢𝑛𝑑𝑇𝑟𝑢𝑡ℎ
is the corresponding HR from the ECG ground truth signal, and 𝑁 is
the total number of videos in the database. The second parameter is the standard
deviation of 𝑀𝐸, defined as follows:
𝑆𝐷𝑀𝐸= √(
1
𝑁∑ (𝐻𝑅𝑘
𝑣𝑖𝑑𝑒𝑜 − 𝑀𝐸)2𝑁
𝑘=1 ) (12)
The third parameter is the root mean squared error, defined as follows:
𝑅𝑀𝑆𝐸 = √(1
𝑁∑ (𝐻𝑅𝑘
𝑣𝑖𝑑𝑒𝑜 − 𝐻𝑅𝑘𝑔𝑟𝑜𝑢𝑛𝑑𝑇𝑟𝑢𝑡ℎ
)2
𝑁𝑘=1 ) (13)
The fourth statistical parameter is the mean of error rate in percentage, defined as
follows:
𝑀𝐸𝑅 =1
𝑁∑ (
𝐻𝑅𝑘𝑣𝑖𝑑𝑒𝑜−𝐻𝑅𝑘
𝑔𝑟𝑜𝑢𝑛𝑑𝑇𝑟𝑢𝑡ℎ
𝐻𝑅𝑘𝑔𝑟𝑜𝑢𝑛𝑑𝑇𝑟𝑢𝑡ℎ )𝑁
𝑘=1 × 100 (14)
7.6.2. EXPEIMENTAL EVALUATION
The proposed method tracks color change and head motion due to heartbeat in a
video. Figure 7-4 shows four head motion trajectories of two feature points from a
video in MAHNOB-HCI. The location trajectories show variation in both horizon-
tal ((a) and (b)) and vertical ((c) and (d)) directions. Figure 7-5 shows the average
trajectory (𝑆̅ in eq. (2)) calculated from the individual trajectories of the feature
points and corresponding vibrating signal (𝑉 in eq. (4)) obtained after employing
the HP filter for the video used for Figure 7-4. We observe that the vibrating signal
is less noisy than the previous signal due to the application of the HP filter. We
obtain similar results in the color-based approach.
The CEEMDAN, a derivative of EMD, decomposes the vibrating signal into
IMFs (𝑀𝑖) to provide an uncontaminated form of heartbeat signal. Figure 7-6 shows
first eight IMFs obtained from the signal by eq. (5)-(8). The IMFs are separated by
different frequency components as discussed in Section III(D), and we selected 𝑀6
as the final heartbeat signal to employ the peak detection algorithm. The result of
peak detection on 𝑀6 of Figure 7-6 is shown in Figure 7-7. One can observe that the
final heartbeat signal has more clearly visible beats than the raw heartbeat signal
obtained from motion traces. After employing peak detection we obtained all HPL
that can be used in further medical analysis. The qualitative and quantitative com-
parison of the estimated HPL with the beat locations in ground truth ECG is shown
in the performance comparison section.

CHAPTER 7. MULTIMODAL ESTIMATION OF HEARTBEAT PEAK LOCATIONS AND HEARTBEAT RATE FROM FACIAL VIDEO USING EMPIRICAL MODE DECOMPOSITION
255
a)
b)
c)
d)
Figure 7-4 Trajectories of two feature points (both horizontal and vertical trajectories) in a video of the MAHNOB-HCI database.
a)
b)
Figure 7-5 Vibrating signal extraction by HP filtering: a) average signal from motion trajec-tories and b) filtered vibrating signal.
We count the number of peaks and measure average peak distance from HPLs.
These two measures have been used to measure four parameters 𝐻𝑅𝑛𝑢𝑚𝑃𝑒𝑎𝑘𝑐𝑜𝑙𝑜𝑟 ,
𝐻𝑅𝑑𝑖𝑠𝑡𝑃𝑒𝑎𝑘𝑐𝑜𝑙𝑜𝑟 , 𝐻𝑅𝑛𝑢𝑚𝑃𝑒𝑎𝑘
𝑚𝑜𝑡𝑖𝑜𝑛 , and 𝐻𝑅𝑑𝑖𝑠𝑡𝑃𝑒𝑎𝑘𝑚𝑜𝑡𝑖𝑜𝑛 in bpm. These results and the results of
four fusion rules defined in Table 7-1 have been shown in Table 7-2. From the re-
sults we observe that counting the number of peaks provides better results than
measuring peak distance for both color and motion information. This is because,
unlike counting peaks, heartbeat rate variability in the signal can contribute nega-
tively to the average peak distance. The overall error rates (𝑀𝐸𝑅) are less than 10%
for HR estimation by counting the number of peaks for both motion and color sig-
nals. The fusion results show that, similar to the individual use of motion or color
0 5 10 15370
380
390
400
Time
Am
plitu
de
0 5 10 15440
460
480
Time
Am
plitu
de
0 5 10 15160
170
180
Time
Am
plitu
de
0 5 10 15310
320
330
Time
Am
plitu
de
0 5 10 150
0.1
0.2
0.3
0.4
Time
Am
plitu
de
0 5 10 15-2
-1
0
1
2
Time
Am
plitu
de

VISUAL ANALYSIS OF FACES WITH APPLICATION IN BIOMETRICS, FORENSICS AND HEALTH INFORMATICS
256
information, the number of peaks fusion generates the best results out of the four
fusion rules. Simple arithmetic mean in decision level fusion, as we used, shows a
strong correlation with the corresponding color and motion-based results. While
comparing the results to the individual motion and color-based estimations, the
fusion shows greater accuracy.
Figure 7-6 Obtained IMFs (𝑀𝑖) after employing CEEMDAN on the vibrating signal (𝑉).
Figure 7-7 Heartbeat peak detection in the 6-th IMF.
We have also depicted in Figure 7-8 the HR estimation performance of the pro-
posed approaches in a scatter plot by plotting the estimated HR against the ground
truth HR for all the experimental videos of the MAHNOB-HCI database. From the
figure one can observe that most of the estimation was highly consistent with the
ground truth. However, there are cases where the estimations were not good (outlier
points in the plot) due to contamination of noise from extraneous face movement in
the video. It is important to note that the points in the scatter plot are much closer to
0 5 10 15-0.02
0
0.02
Time
M1
0 5 10 15-0.5
0
0.5
Time
M5
0 5 10 15-0.01
0
0.01
Time
M2
0 5 10 15
-0.5
0
0.5
Time
M6
0 5 10 15-0.05
0
0.05
Time
M3
0 5 10 15
-0.5
0
0.5
Time
M7
0 5 10 15-0.1
0
0.1
Time
M4
0 5 10 15-0.5
0
0.5
Time
M8
0 5 10 15
-0.5
-0.4
-0.3
-0.2
-0.1
0
0.1
0.2
0.3
0.4
0.5
Time
Am
plitu
de
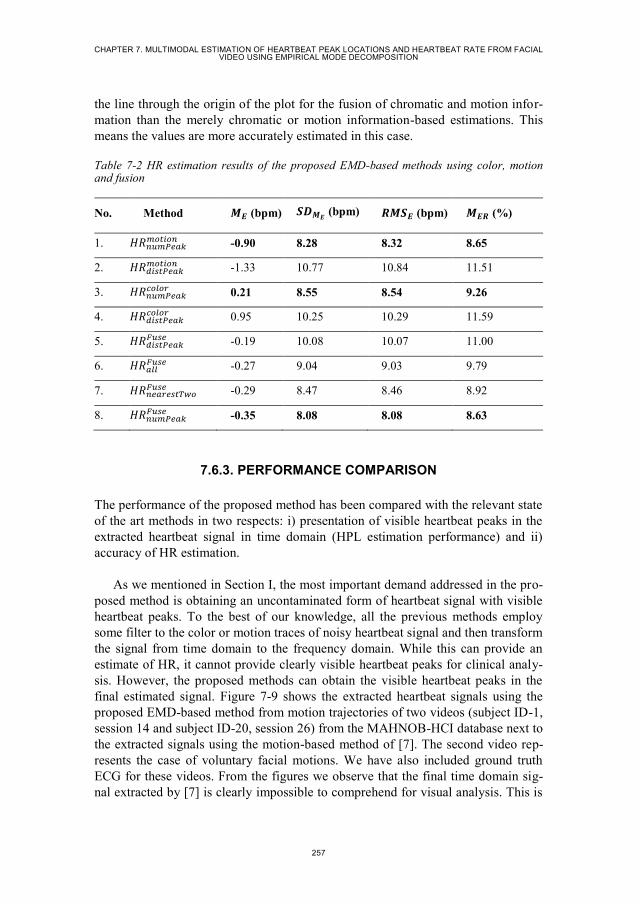
CHAPTER 7. MULTIMODAL ESTIMATION OF HEARTBEAT PEAK LOCATIONS AND HEARTBEAT RATE FROM FACIAL VIDEO USING EMPIRICAL MODE DECOMPOSITION
257
the line through the origin of the plot for the fusion of chromatic and motion infor-
mation than the merely chromatic or motion information-based estimations. This
means the values are more accurately estimated in this case.
Table 7-2 HR estimation results of the proposed EMD-based methods using color, motion and fusion
No. Method 𝑴𝑬 (bpm) 𝑺𝑫𝑴𝑬 (bpm) 𝑹𝑴𝑺𝑬 (bpm) 𝑴𝑬𝑹 (%)
1. 𝐻𝑅𝑛𝑢𝑚𝑃𝑒𝑎𝑘𝑚𝑜𝑡𝑖𝑜𝑛 -0.90 8.28 8.32 8.65
2. 𝐻𝑅𝑑𝑖𝑠𝑡𝑃𝑒𝑎𝑘𝑚𝑜𝑡𝑖𝑜𝑛 -1.33 10.77 10.84 11.51
3. 𝐻𝑅𝑛𝑢𝑚𝑃𝑒𝑎𝑘𝑐𝑜𝑙𝑜𝑟 0.21 8.55 8.54 9.26
4. 𝐻𝑅𝑑𝑖𝑠𝑡𝑃𝑒𝑎𝑘𝑐𝑜𝑙𝑜𝑟 0.95 10.25 10.29 11.59
5. 𝐻𝑅𝑑𝑖𝑠𝑡𝑃𝑒𝑎𝑘𝐹𝑢𝑠𝑒 -0.19 10.08 10.07 11.00
6. 𝐻𝑅𝑎𝑙𝑙𝐹𝑢𝑠𝑒 -0.27 9.04 9.03 9.79
7. 𝐻𝑅𝑛𝑒𝑎𝑟𝑒𝑠𝑡𝑇𝑤𝑜𝐹𝑢𝑠𝑒 -0.29 8.47 8.46 8.92
8. 𝐻𝑅𝑛𝑢𝑚𝑃𝑒𝑎𝑘𝐹𝑢𝑠𝑒 -0.35 8.08 8.08 8.63
7.6.3. PERFORMANCE COMPARISON
The performance of the proposed method has been compared with the relevant state
of the art methods in two respects: i) presentation of visible heartbeat peaks in the
extracted heartbeat signal in time domain (HPL estimation performance) and ii)
accuracy of HR estimation.
As we mentioned in Section I, the most important demand addressed in the pro-
posed method is obtaining an uncontaminated form of heartbeat signal with visible
heartbeat peaks. To the best of our knowledge, all the previous methods employ
some filter to the color or motion traces of noisy heartbeat signal and then transform
the signal from time domain to the frequency domain. While this can provide an
estimate of HR, it cannot provide clearly visible heartbeat peaks for clinical analy-
sis. However, the proposed methods can obtain the visible heartbeat peaks in the
final estimated signal. Figure 7-9 shows the extracted heartbeat signals using the
proposed EMD-based method from motion trajectories of two videos (subject ID-1,
session 14 and subject ID-20, session 26) from the MAHNOB-HCI database next to
the extracted signals using the motion-based method of [7]. The second video rep-
resents the case of voluntary facial motions. We have also included ground truth
ECG for these videos. From the figures we observe that the final time domain sig-
nal extracted by [7] is clearly impossible to comprehend for visual analysis. This is

VISUAL ANALYSIS OF FACES WITH APPLICATION IN BIOMETRICS, FORENSICS AND HEALTH INFORMATICS
258
also true for the other state of the art methods because of similar filters and
ICA/PCA/DCT-based decomposition. On the other hand, the final time domain
signal generated by the proposed EMD-based method not only shows heartbeat
peaks but also preserves a correspondence to the ECG ground truth.
a)
b)
c)
Figure 7-8 Scatter plots of the HR obtained from video (y-axis) against HR obtained from the ECG ground truth for the videos of MAHNOB-HCI database by employing: a) color-based
method (𝐻𝑅𝑛𝑢𝑚𝑃𝑒𝑎𝑘𝑐𝑜𝑙𝑜𝑟 ), b) motion-based method (𝐻𝑅𝑛𝑢𝑚𝑃𝑒𝑎𝑘
𝑚𝑜𝑡𝑖𝑜𝑛 ) and c) fusion of color and
motion (𝐻𝑅𝑛𝑢𝑚𝑃𝑒𝑎𝑘𝐹𝑢𝑠𝑒 ).
The proposed method used HPLs (number of HPLs and distance between HPLs)
to estimate HR. Thus, the statistical parameters used to present HR estimation accu-
racy in turns show the consistency of estimating HPLs with respect to the heartbeat
peaks in ground truth ECG. This provides a quantification of the qualitative presen-
tation of HPL in Figure 7-9. We use this quantification to compare the accuracy of
the proposed method with state of the art color and the motion-based methods of
[7]–[10]. We overlooked some other recently proposed methods from [14]–[16],
[18], [27] in the comparison. We did this because some of the methods provide a
peripheral contribution in data capturing and facial region selection for HR estima-
tion instead of providing novel methodology of better estimation (which is our one
of the major contributions), and other methods need prior training for HR estima-
tion; we believe that comparing an unsupervised fully automatic method with su-
pervised or semi-automatic methods is not reasonable. The results of the accuracy
comparison are summarized in Table 7-3. From the results, it is clear that the pro-
50 60 70 80 90 10060
70
80
90
HR from ECG ground truth
HR
fro
m v
ide
o
50 60 70 80 90 10060
70
80
90
HR from ECG ground truth
HR
fro
m v
ide
o
50 60 70 80 90 10060
70
80
90
HR from ECG ground truth
HR
fro
m v
ide
o
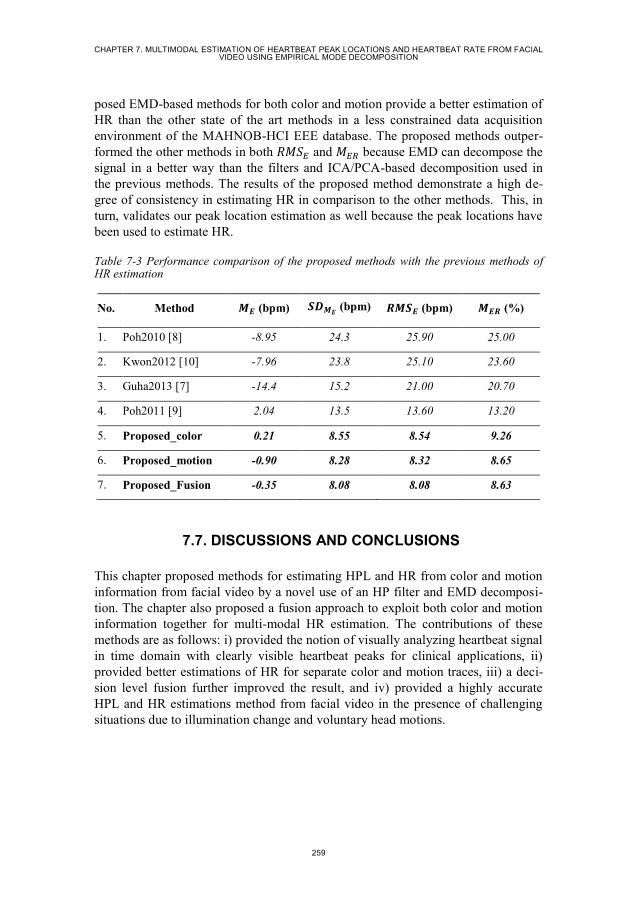
CHAPTER 7. MULTIMODAL ESTIMATION OF HEARTBEAT PEAK LOCATIONS AND HEARTBEAT RATE FROM FACIAL VIDEO USING EMPIRICAL MODE DECOMPOSITION
259
posed EMD-based methods for both color and motion provide a better estimation of
HR than the other state of the art methods in a less constrained data acquisition
environment of the MAHNOB-HCI EEE database. The proposed methods outper-
formed the other methods in both 𝑅𝑀𝑆𝐸 and 𝑀𝐸𝑅 because EMD can decompose the
signal in a better way than the filters and ICA/PCA-based decomposition used in
the previous methods. The results of the proposed method demonstrate a high de-
gree of consistency in estimating HR in comparison to the other methods. This, in
turn, validates our peak location estimation as well because the peak locations have
been used to estimate HR.
Table 7-3 Performance comparison of the proposed methods with the previous methods of HR estimation
No. Method 𝑴𝑬 (bpm) 𝑺𝑫𝑴𝑬 (bpm) 𝑹𝑴𝑺𝑬 (bpm) 𝑴𝑬𝑹 (%)
1. Poh2010 [8] -8.95 24.3 25.90 25.00
2. Kwon2012 [10] -7.96 23.8 25.10 23.60
3. Guha2013 [7] -14.4 15.2 21.00 20.70
4. Poh2011 [9] 2.04 13.5 13.60 13.20
5. Proposed_color 0.21 8.55 8.54 9.26
6. Proposed_motion -0.90 8.28 8.32 8.65
7. Proposed_Fusion -0.35 8.08 8.08 8.63
7.7. DISCUSSIONS AND CONCLUSIONS
This chapter proposed methods for estimating HPL and HR from color and motion
information from facial video by a novel use of an HP filter and EMD decomposi-
tion. The chapter also proposed a fusion approach to exploit both color and motion
information together for multi-modal HR estimation. The contributions of these
methods are as follows: i) provided the notion of visually analyzing heartbeat signal
in time domain with clearly visible heartbeat peaks for clinical applications, ii)
provided better estimations of HR for separate color and motion traces, iii) a deci-
sion level fusion further improved the result, and iv) provided a highly accurate
HPL and HR estimations method from facial video in the presence of challenging
situations due to illumination change and voluntary head motions.

VISUAL ANALYSIS OF FACES WITH APPLICATION IN BIOMETRICS, FORENSICS AND HEALTH INFORMATICS
260
(a)
(b)
(c)
(d)
Figure 7-9 Illustrating heartbeats obtained by different methods for two facial videos from two different subjects for normal case (left) and challenging case with voluntary motion (right): a) raw heartbeat signals from motion trajectories, b) ECG ground truth, c) Final heartbeat signal obtained by the proposed method and detected peak locations, and d) Final heartbeat signal obtained by Guha2013 [7] after PCA, which cannot produce clear peak locations.
The proposed method, however, also imposed some limitations when generating
the results. We assume that the camera will be placed in close proximity to the face
(about one meter away). Moreover, we did not employ any sophisticated ROI detec-
tion and tracking methods, illumination rectification methods, or extraneous motion
filtering before final decomposition. Instead of these peripheral fine-tuning notions,
our contribution focused on a core signal processing technique for heartbeat extrac-
tion. The system is not adapted yet to the real-time application for HR measurement
due to the high volume of computation required for CEEMDAN decomposition. In
addition, instead of instant estimation of the peak location and intensity, the system
0 5 10 150
0.05
0.1
0.15
0.2
0.25
0.3
0.35
TimeA
mp
litu
de
0 5 10 150
0.2
0.4
0.6
0.8
1
Time
Am
plitu
de
0 5 10 15-7.3
-7.2
-7.1
-7
-6.9
-6.8
-6.7
-6.6x 10
5
Time
Am
plitu
de
0 5 10 15-6
-5.8
-5.6
-5.4
-5.2
-5x 10
5
Time
Am
plitu
de
0 5 10 15-0.8
-0.6
-0.4
-0.2
0
0.2
0.4
0.6
Time
Am
plitu
de
0 5 10 15-0.8
-0.6
-0.4
-0.2
0
0.2
0.4
0.6
Time
Am
plitu
de
0 5 10 15-10
-5
0
5
10
Time
Am
plitu
de
0 5 10 15-30
-20
-10
0
10
20
30
Time
Am
plitu
de

CHAPTER 7. MULTIMODAL ESTIMATION OF HEARTBEAT PEAK LOCATIONS AND HEARTBEAT RATE FROM FACIAL VIDEO USING EMPIRICAL MODE DECOMPOSITION
261
estimates the heartbeat peaks in a time period (30 seconds in our experiment). Fu-
ture work should address these points.
7.8. REFERENCES
[1] A. P. M. Gorgels, “Electrocardiography,” in Cardiovascular Medicine, J. T.
Willerson, H. J. J. Wellens, J. N. Cohn, and D. R. Holmes Jr, Eds. Springer
London, 2007, pp. 43–77.
[2] E. F. Greneker, “Radar sensing of heartbeat and respiration at a distance with
applications of the technology,” in Radar 97 (Conf. Publ. No. 449), 1997, pp.
150–154.
[3] E. P. Tomasini, G. M. Revel, and P. Castellini, “Laser Based Measurements,”
in Encyclopedia of Vibration, S. Braun, Ed. Oxford: Elsevier, 2001, pp. 699–
710.
[4] N. Blanik, A. K. Abbas, B. Venema, V. Blazek, and S. Leonhardt, “Hybrid
optical imaging technology for long-term remote monitoring of skin perfusion
and temperature behavior,” J. Biomed. Opt., vol. 19, no. 1, pp. 016012–
016012, 2014.
[5] M. A. Haque, K. Nasrollahi, and T. B. Moeslund, “Heartbeat Signal from Fa-
cial Video for Biometric Recognition,” presented at the 19th Scandinavian
Conference on Image Analysis (SCIA), 2015, pp. 1–10.
[6] C. Takano and Y. Ohta, “Heart rate measurement based on a time-lapse im-
age,” Med. Eng. Phys., vol. 29, no. 8, pp. 853–857, Oct. 2007.
[7] G. Balakrishnan, F. Durand, and J. Guttag, “Detecting Pulse from Head Mo-
tions in Video,” in IEEE Conference on Computer Vision and Pattern Recog-
nition (CVPR), 2013, pp. 3430–3437.
[8] M.-Z. Poh, D. J. McDuff, and R. W. Picard, “Non-contact, automated cardiac
pulse measurements using video imaging and blind source separation,” Opt.
Express, vol. 18, no. 10, pp. 10762–10774, May 2010.
[9] M.-Z. Poh, D. J. McDuff, and R. W. Picard, “Advancements in Noncontact,
Multiparameter Physiological Measurements Using a Webcam,” IEEE Trans.
Biomed. Eng., vol. 58, no. 1, pp. 7–11, Jan. 2011.
[10] S. Kwon, H. Kim, and K. S. Park, “Validation of heart rate extraction using
video imaging on a built-in camera system of a smartphone,” in 2012 Annual
International Conference of the IEEE Engineering in Medicine and Biology
Society (EMBC), 2012, pp. 2174–2177.
[11] M. Soleymani, J. Lichtenauer, T. Pun, and M. Pantic, “A Multimodal Database
for Affect Recognition and Implicit Tagging,” IEEE Trans. Affect. Comput.,
vol. 3, no. 1, pp. 42–55, Jan. 2012.

VISUAL ANALYSIS OF FACES WITH APPLICATION IN BIOMETRICS, FORENSICS AND HEALTH INFORMATICS
262
[12] W. Verkruysse, L. O. Svaasand, and J. S. Nelson, “Remote plethysmographic
imaging using ambient light,” Opt. Express, vol. 16, no. 26, pp. 21434–21445,
Dec. 2008.
[13] L. Wei, Y. Tian, Y. Wang, T. Ebrahimi, and T. Huang, “Automatic Webcam-
Based Human Heart Rate Measurements Using Laplacian Eigenmap,” in Com-
puter Vision – ACCV 2012, K. M. Lee, Y. Matsushita, J. M. Rehg, and Z. Hu,
Eds. Springer Berlin Heidelberg, 2012, pp. 281–292.
[14] X. Li, J. Chen, G. Zhao, and M. Pietikainen, “Remote Heart Rate Measurement
From Face Videos Under Realistic Situations,” in IEEE Conference on Com-
puter Vision and Pattern Recognition (CVPR), 2014, pp. 4321–4328.
[15] H. Monkaresi, R. . Calvo, and H. Yan, “A Machine Learning Approach to
Improve Contactless Heart Rate Monitoring Using a Webcam,” IEEE J. Bio-
med. Health Inform., vol. 18, no. 4, pp. 1153–1160, Jul. 2014.
[16] A. Shagholi, M. Charmi, and H. Rakhshan, “The effect of the distance from the
webcam in heart rate estimation from face video images,” in 2015 2nd Interna-
tional Conference on Pattern Recognition and Image Analysis (IPRIA), 2015,
pp. 1–6.
[17] J. Bouguet, “Pyramidal implementation of the Lucas Kanade feature tracker,”
Intel Corp. Microprocess. Res. Labs, 2000.
[18] R. Irani, K. Nasrollahi, and T. B. Moeslund, “Improved Pulse Detection from
Head Motions Using DCT,” in 9th International Conference on Computer Vi-
sion Theory and Applications (VISAPP), 2014, pp. 1–8.
[19] L. Shan and M. Yu, “Video-based heart rate measurement using head motion
tracking and ICA,” in 2013 6th International Congress on Image and Signal
Processing (CISP), 2013, vol. 01, pp. 160–164.
[20] P. Viola and M. J. Jones, “Robust Real-Time Face Detection,” Int J Comput
Vis., vol. 57, no. 2, pp. 137–154, May 2004.
[21] J. Shi and C. Tomasi, “Good features to track,” in IEEE Conference on Com-
puter Vision and Pattern Recognition (CVPR), 1994, pp. 593–600.
[22] T. McElroy, “Exact Formulas for the Hodrick-Prescott Filter.” Statistical Re-
search Division, U.S. Census Bureau, Sep-2006.
[23] H. Ren, Y. Wang, M. Huang, Y. Chang, and H. Kao, “Ensemble Empirical
Mode Decomposition Parameters Optimization for Spectral Distance Meas-
urement in Hyperspectral Remote Sensing Data,” Remote Sens., vol. 6, pp.
2069–2083, Mar. 2014.
[24] N. E. Huang, “An Adaptive Data Analysis Method for Nonlinear and Nonsta-
tionary Time Series: The Empirical Mode Decomposition and Hilbert Spectral

CHAPTER 7. MULTIMODAL ESTIMATION OF HEARTBEAT PEAK LOCATIONS AND HEARTBEAT RATE FROM FACIAL VIDEO USING EMPIRICAL MODE DECOMPOSITION
263
Analysis,” in Wavelet Analysis and Applications, T. Qian, M. I. Vai, and Y.
Xu, Eds. Birkhäuser Basel, 2006, pp. 363–376.
[25] M. E. Torres, M. A. Colominas, G. Schlotthauer, and P. Flandrin, “A complete
ensemble empirical mode decomposition with adaptive noise,” in 2011 IEEE
International Conference on Acoustics, Speech and Signal Processing
(ICASSP), 2011, pp. 4144–4147.
[26] N. V. Boulgouris, K. N. Plataniotis, and E. Micheli-Tzanakou, Biometrics:
Theory, Methods, and Applications. John Wiley & Sons, 2009.
[27] P. Werner, A. Al-Hamadi, S. Walter, S. Gruss, and H. C. Traue, “Automatic
heart rate estimation from painful faces,” in 2014 IEEE International Confer-
ence on Image Processing (ICIP), 2014, pp. 1947–1951.


265
PART V
CONTACT-FREE HEARTBEAT
BIOMETRICS

267
CHAPTER 8. HEARTBEAT SIGNAL FROM
FACIAL VIDEO FOR BIOMETRIC
RECOGNITION
Mohammad Ahsanul Haque, Kamal Nasrollahi, and Thomas B. Moeslund
This paper has been published in the
Proceedings of the 19th
Scandinavian Conference on Image Analysis
Springer-LNCS, vol. 9127, pp. 165-174, 2015
© 2015 Springer Publishing Company
The layout has been revised.


269
8.1. ABSTRACT
Different biometric traits such as face appearance and heartbeat signal from Elec-
trocardiogram (ECG)/Phonocardiogram (PCG) are widely used in the human iden-
tity recognition. Recent advances in facial video based measurement of cardio-
physiological parameters such as heartbeat rate, respiratory rate, and blood vol-
ume pressure provide the possibility of extracting heartbeat signal from facial video
instead of using obtrusive ECG or PCG sensors in the body. This chapter proposes
the Heartbeat Signal from Facial Video (HSFV) as a new biometric trait for human
identity recognition, for the first time to the best of our knowledge. Feature extrac-
tion from the HSFV is accomplished by employing Radon transform on a waterfall
model of the replicated HSFV. The pairwise Minkowski distances are obtained from
the Radon image as the features. The authentication is accomplished by a decision
tree based supervised approach. The potential of the proposed HSFV biometric for
human identification is demonstrated on a public database.
8.2. INTRODUCTION
Human identity recognition using biometrics is a well explored area of research to
facilitate security systems, forensic analysis, and medical record keeping and moni-
toring. Biometrics provides a way of identifying a person using his/her physiologi-
cal and/or behavioral features. Among different biometric traits iris image, finger-
print, voice, hand-written signature, facial image, hand geometry, hand vein pat-
terns, and retinal pattern are well-known for human authentication [1]. However,
most of these biometric traits exhibit disadvantages in regards to accuracy, spoofing
and/or unobtrusiveness. For example, fingerprint and hand-written signature can be
forged to breach the identification system [2], voice can be altered or imitated, and
still picture based traits can be used in absence of the person [3]. Thus, scientific
community always searches for new biometric traits to overcome these mentioned
problems. Heartbeat signal is one of such novel biometric traits.
Human heart is a muscular organ that works as a circulatory pump by taking de-
oxygenated blood through the veins and delivers oxygenated blood to the body
through the arteries. It has four chambers and two sets of valves to control the blood
flow. When blood is pumped by the heart, some electrical and acoustic changes
occur in and around the heart in the body, which is known as heartbeat signal [4].
Heartbeat signal can be obtained by Electrocardiogram (ECG) using electrical
changes and Phonocardiogram (PCG) using acoustic changes, as shown in Figure
8-1.
Both ECG and PCG heartbeat signals have already been utilized for biometrics
recognition in the literature. ECG based authentication was first introduced by Biel
et al. [5]. They proposed the extraction of a set of temporal and amplitude features
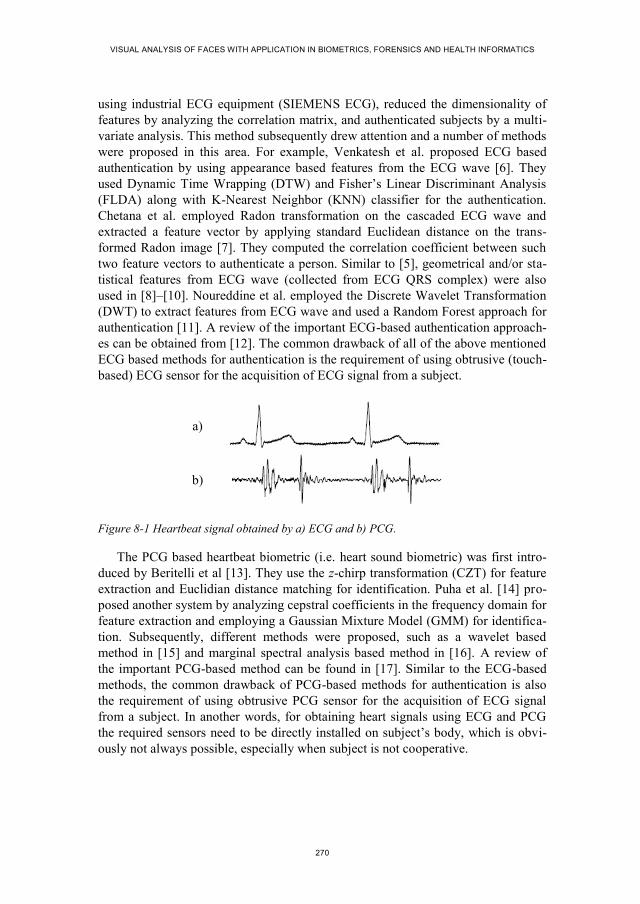
VISUAL ANALYSIS OF FACES WITH APPLICATION IN BIOMETRICS, FORENSICS AND HEALTH INFORMATICS
270
using industrial ECG equipment (SIEMENS ECG), reduced the dimensionality of
features by analyzing the correlation matrix, and authenticated subjects by a multi-
variate analysis. This method subsequently drew attention and a number of methods
were proposed in this area. For example, Venkatesh et al. proposed ECG based
authentication by using appearance based features from the ECG wave [6]. They
used Dynamic Time Wrapping (DTW) and Fisher’s Linear Discriminant Analysis
(FLDA) along with K-Nearest Neighbor (KNN) classifier for the authentication.
Chetana et al. employed Radon transformation on the cascaded ECG wave and
extracted a feature vector by applying standard Euclidean distance on the trans-
formed Radon image [7]. They computed the correlation coefficient between such
two feature vectors to authenticate a person. Similar to [5], geometrical and/or sta-
tistical features from ECG wave (collected from ECG QRS complex) were also
used in [8]–[10]. Noureddine et al. employed the Discrete Wavelet Transformation
(DWT) to extract features from ECG wave and used a Random Forest approach for
authentication [11]. A review of the important ECG-based authentication approach-
es can be obtained from [12]. The common drawback of all of the above mentioned
ECG based methods for authentication is the requirement of using obtrusive (touch-
based) ECG sensor for the acquisition of ECG signal from a subject.
a)
b)
Figure 8-1 Heartbeat signal obtained by a) ECG and b) PCG.
The PCG based heartbeat biometric (i.e. heart sound biometric) was first intro-
duced by Beritelli et al [13]. They use the z-chirp transformation (CZT) for feature
extraction and Euclidian distance matching for identification. Puha et al. [14] pro-
posed another system by analyzing cepstral coefficients in the frequency domain for
feature extraction and employing a Gaussian Mixture Model (GMM) for identifica-
tion. Subsequently, different methods were proposed, such as a wavelet based
method in [15] and marginal spectral analysis based method in [16]. A review of
the important PCG-based method can be found in [17]. Similar to the ECG-based
methods, the common drawback of PCG-based methods for authentication is also
the requirement of using obtrusive PCG sensor for the acquisition of ECG signal
from a subject. In another words, for obtaining heart signals using ECG and PCG
the required sensors need to be directly installed on subject’s body, which is obvi-
ously not always possible, especially when subject is not cooperative.
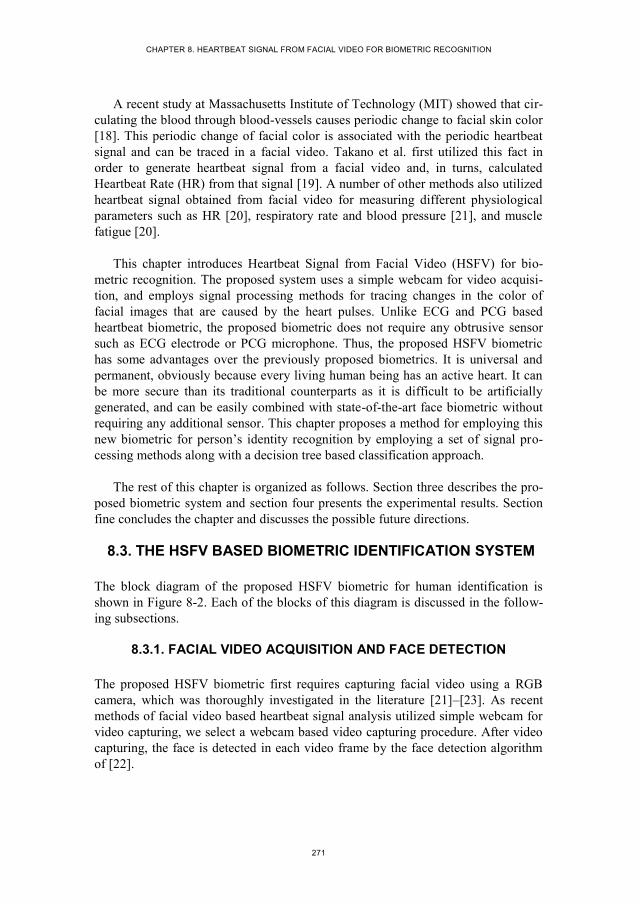
CHAPTER 8. HEARTBEAT SIGNAL FROM FACIAL VIDEO FOR BIOMETRIC RECOGNITION
271
A recent study at Massachusetts Institute of Technology (MIT) showed that cir-
culating the blood through blood-vessels causes periodic change to facial skin color
[18]. This periodic change of facial color is associated with the periodic heartbeat
signal and can be traced in a facial video. Takano et al. first utilized this fact in
order to generate heartbeat signal from a facial video and, in turns, calculated
Heartbeat Rate (HR) from that signal [19]. A number of other methods also utilized
heartbeat signal obtained from facial video for measuring different physiological
parameters such as HR [20], respiratory rate and blood pressure [21], and muscle
fatigue [20].
This chapter introduces Heartbeat Signal from Facial Video (HSFV) for bio-
metric recognition. The proposed system uses a simple webcam for video acquisi-
tion, and employs signal processing methods for tracing changes in the color of
facial images that are caused by the heart pulses. Unlike ECG and PCG based
heartbeat biometric, the proposed biometric does not require any obtrusive sensor
such as ECG electrode or PCG microphone. Thus, the proposed HSFV biometric
has some advantages over the previously proposed biometrics. It is universal and
permanent, obviously because every living human being has an active heart. It can
be more secure than its traditional counterparts as it is difficult to be artificially
generated, and can be easily combined with state-of-the-art face biometric without
requiring any additional sensor. This chapter proposes a method for employing this
new biometric for person’s identity recognition by employing a set of signal pro-
cessing methods along with a decision tree based classification approach.
The rest of this chapter is organized as follows. Section three describes the pro-
posed biometric system and section four presents the experimental results. Section
fine concludes the chapter and discusses the possible future directions.
8.3. THE HSFV BASED BIOMETRIC IDENTIFICATION SYSTEM
The block diagram of the proposed HSFV biometric for human identification is
shown in Figure 8-2. Each of the blocks of this diagram is discussed in the follow-
ing subsections.
8.3.1. FACIAL VIDEO ACQUISITION AND FACE DETECTION
The proposed HSFV biometric first requires capturing facial video using a RGB
camera, which was thoroughly investigated in the literature [21]–[23]. As recent
methods of facial video based heartbeat signal analysis utilized simple webcam for
video capturing, we select a webcam based video capturing procedure. After video
capturing, the face is detected in each video frame by the face detection algorithm
of [22].
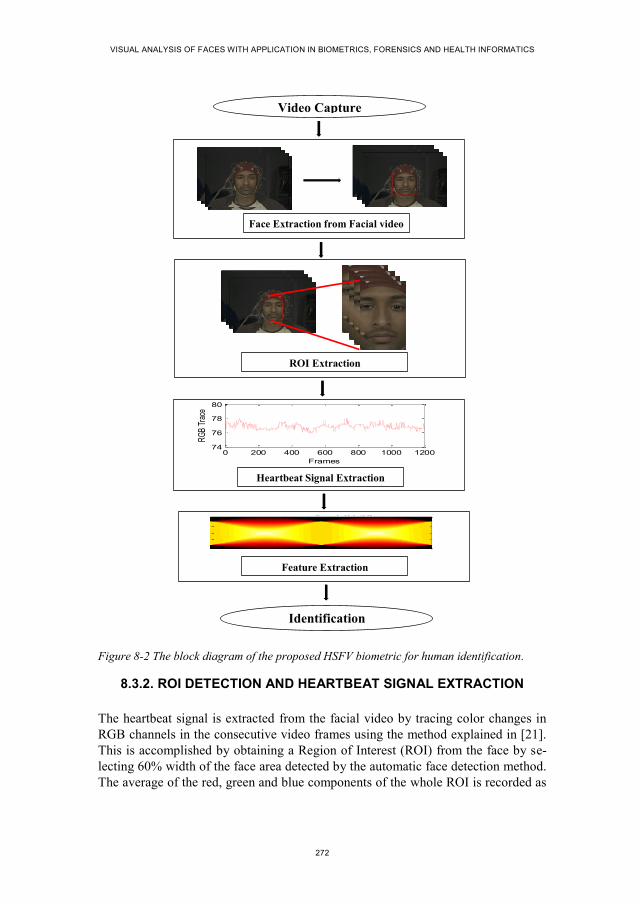
VISUAL ANALYSIS OF FACES WITH APPLICATION IN BIOMETRICS, FORENSICS AND HEALTH INFORMATICS
272
Figure 8-2 The block diagram of the proposed HSFV biometric for human identification.
8.3.2. ROI DETECTION AND HEARTBEAT SIGNAL EXTRACTION
The heartbeat signal is extracted from the facial video by tracing color changes in
RGB channels in the consecutive video frames using the method explained in [21].
This is accomplished by obtaining a Region of Interest (ROI) from the face by se-
lecting 60% width of the face area detected by the automatic face detection method.
The average of the red, green and blue components of the whole ROI is recorded as
0 200 400 600 800 1000 120074
76
78
80
Frames
RG
B Tr
ace
Heartbeat signal from RGB traces
Radon Image: R()[f(x,y)]
(degrees)
x
0 20 40 60 80 100 120 140 160 180
-2000
-1000
0
1000
2000
Face Extraction from Facial video
ROI Extraction
Heartbeat Signal Extraction
Video Capture
Feature Extraction
Identification

CHAPTER 8. HEARTBEAT SIGNAL FROM FACIAL VIDEO FOR BIOMETRIC RECOGNITION
273
the RGB traces of that frame. In order to obtain a heartbeat signal from a facial
video, the statistical mean of these three RGB traces of each frame is calculated and
recoded for each frame of the video.
The heartbeat signal obtained from such a video looks noisy and imprecise
compared to the heartbeat signal obtained by ECG, for example that in Figure 8-1.
This is due to the effect of external lighting, voluntary head-motion, and the act of
blood as a damper to the heart pumping pressure to be transferred from the middle
of the chest (where the heart is located) to the face. Thus, we employ a denoising
filter by detecting the peak in the extracted heart signal and discarding the outlying
RGB traces. The effect of the denoising operation on a noisy heartbeat signal ob-
tained from RGB traces is depicted in Figure 8-3. The signal is then transferred to
the feature extraction module.
Figure 8-3 A heartbeat signal containing outliers (top) and its corresponding signal obtained after employing a denoising filter (bottom).
8.3.3. FEATURE EXTRACTION
We have extracted our features from radon images, as these images are shown in
the ECG based system of [7] to produce proper results. To generate such images we
need a waterfall diagram which can be generated by replicating the heartbeat signal
obtained from a facial video. The number of the replication equals to the number of
the frames in the video. Figure 8-4 depicts an example of a waterfall diagram ob-
tained from the heartbeat signal of Figure 8-3. From the figure, it can be seen that
the heartbeat signal is replicated and concatenated in the second dimension of the
signal in order to generate the waterfall diagram for a 20 seconds long video cap-
tured in a 60 frames per second setting. In order to facilitate the depiction on the
figure we employ only 64 times replication of the heartbeat signal in Figure 8-4.
The diagram acts as an input to a transformation module in order to extract the fea-
tures.

VISUAL ANALYSIS OF FACES WITH APPLICATION IN BIOMETRICS, FORENSICS AND HEALTH INFORMATICS
274
The features used in the proposed system are obtained by applying a method
called Radon transform [24] to the generated waterfall diagram. Radon transform is
an integral transform computing projections of an image matrix along specified
directions and widely used to reconstruct images from medical CT scan. A projec-
tion of a two-dimensional image is a set of line integrals. Assume 𝑓(𝑥, 𝑦) is a two-
dimensional image expressing image intensity in the (𝑥, 𝑦) coordinates. The Radon
transform (𝑅) of the image, 𝑅(𝜃)[𝑓(𝑥, 𝑦)], can be defined as follows:
𝑅(𝜃)[𝑓(𝑥, 𝑦)] = ∫ 𝑓(�́� cos 𝜃 − �́� sin 𝜃, �́� sin 𝜃 − �́� cos 𝜃) 𝑑�́�∞
−∞ (1)
where 𝜃 is the angle formed by the distance vector of a line from the line integral
with the relevant axis in the Radon space, and
[�́��́�
] = [cos 𝜃 sin 𝜃
− sin 𝜃 cos 𝜃] [
𝑥𝑦] (2)
When we apply Radon transform on the waterfall diagram of HSFV a two-
dimensional Radon image is obtained, which contains the Radon coefficients for
each angle (𝜃) given in an experimental setting. An example Radon image obtained
by employing Radon transform on the waterfall diagram of Figure 8-4 is shown in
Figure 8-5.
Figure 8-4 Waterfall diagram obtained from an extracted heartbeat signal of a given video.
In order to extract features for authentication, we employ a pairwise distance
method between every possible pairs of pixels in the transformed image. We use the
well-known distance metric of Minkowski to measure the pairwise distance for a
𝑚 × 𝑛-pixels of the Radon image 𝑅 by:
d𝑠𝑡 = √∑ |𝑅𝑠𝑖 − 𝑅𝑡𝑖|𝑝𝑛
𝑖=1
𝑝 (3)
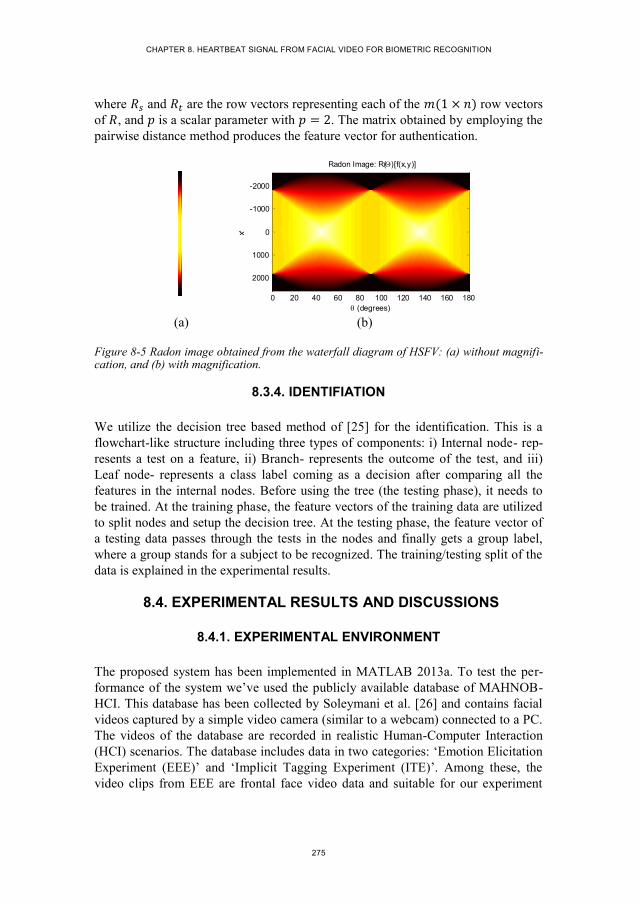
CHAPTER 8. HEARTBEAT SIGNAL FROM FACIAL VIDEO FOR BIOMETRIC RECOGNITION
275
where 𝑅𝑠 and 𝑅𝑡 are the row vectors representing each of the 𝑚(1 × 𝑛) row vectors
of 𝑅, and 𝑝 is a scalar parameter with 𝑝 = 2. The matrix obtained by employing the
pairwise distance method produces the feature vector for authentication.
(a) (b)
Figure 8-5 Radon image obtained from the waterfall diagram of HSFV: (a) without magnifi-cation, and (b) with magnification.
8.3.4. IDENTIFIATION
We utilize the decision tree based method of [25] for the identification. This is a
flowchart-like structure including three types of components: i) Internal node- rep-
resents a test on a feature, ii) Branch- represents the outcome of the test, and iii)
Leaf node- represents a class label coming as a decision after comparing all the
features in the internal nodes. Before using the tree (the testing phase), it needs to
be trained. At the training phase, the feature vectors of the training data are utilized
to split nodes and setup the decision tree. At the testing phase, the feature vector of
a testing data passes through the tests in the nodes and finally gets a group label,
where a group stands for a subject to be recognized. The training/testing split of the
data is explained in the experimental results.
8.4. EXPERIMENTAL RESULTS AND DISCUSSIONS
8.4.1. EXPERIMENTAL ENVIRONMENT
The proposed system has been implemented in MATLAB 2013a. To test the per-
formance of the system we’ve used the publicly available database of MAHNOB-
HCI. This database has been collected by Soleymani et al. [26] and contains facial
videos captured by a simple video camera (similar to a webcam) connected to a PC.
The videos of the database are recorded in realistic Human-Computer Interaction
(HCI) scenarios. The database includes data in two categories: ‘Emotion Elicitation
Experiment (EEE)’ and ‘Implicit Tagging Experiment (ITE)’. Among these, the
video clips from EEE are frontal face video data and suitable for our experiment
Radon Image: R()[f(x,y)]
(degrees)
x
0 20 40 60 80 100 120 140 160 180
-2000
-1000
0
1000
2000

VISUAL ANALYSIS OF FACES WITH APPLICATION IN BIOMETRICS, FORENSICS AND HEALTH INFORMATICS
276
[20], [27]. Thus, we select the EEE video clips from MAHNOB-HCI database as
the captured facial videos for our biometric identification system. Snapshots of
some video clips from MAHNOB-HCI database are shown in Figure 8-6. The data-
base composes of 3810 facial videos from 30 subjects. However, not all of these
videos are suitable for our experiment. This is because of short duration, data file
missing, small number of samples for some subjects to divide these into training
and testing set, occluded face (forehead) in some videos, and lack of subject’s con-
sent. Thus, we selected 351 videos suitable for our experiment. These videos are
captured from 18 subjects (16-20 videos for each subject). We used the first 20
seconds of each video for testing and 80 percent of the total data for training in a
single-fold experiment.
Figure 8-6 Snapshots of some facial video clips from MAHNOB-HCI EEE database [26].
8.4.2. PERFORMANCE EVALUATION
After developing the decision tree from the training data, we generated the authen-
tication results from the testing data. The features of each test subject obtained from
the HSFV were compared in the decision tree to find the best match from the train-
ing set. The authentication results of 18 subjects (denoted with the prefix ‘S-’) from
the experimental database are shown in a confusion matrix (row matrix) at Table
8-1. The true positive detections are shown in the first diagonal of the matrix, false
positive detections are in the columns, and false negative detections are in the rows.
From the results it is observed that a good number of true positive identifications
were achieved for most of the subjects.
The performance of the proposed HSFV biometric was evaluated by the pa-
rameters defined by Jain et al. in [28], which are False Positive Identification Rate
(FPIR) and False Negative Identification Rate (FNIR). The FPIR refers to the prob-
ability of a test sample falsely identified as a subject. If TP = True Positive, TN =
True Negative, FP = False Positive, and FN = False Negative identifications among
𝑁 number of trials in an experiment, then the FPIR is defined as:
𝐹𝑃𝐼𝑅 =1
𝑁∑
𝐹𝑃
𝑇𝑃+𝑇𝑁+𝐹𝑃+𝐹𝑁
𝑁𝑛=1 (4)
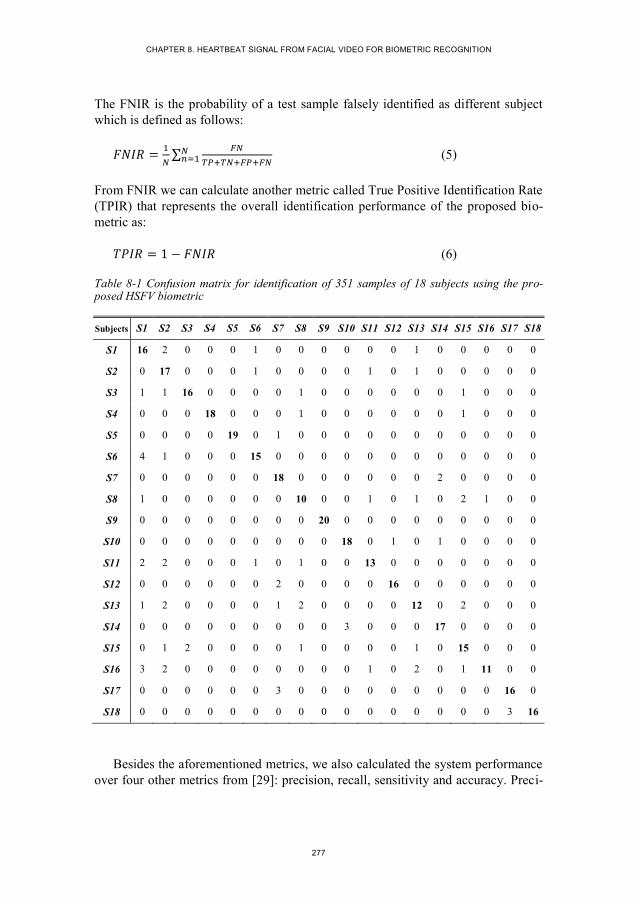
CHAPTER 8. HEARTBEAT SIGNAL FROM FACIAL VIDEO FOR BIOMETRIC RECOGNITION
277
The FNIR is the probability of a test sample falsely identified as different subject
which is defined as follows:
𝐹𝑁𝐼𝑅 =1
𝑁∑
𝐹𝑁
𝑇𝑃+𝑇𝑁+𝐹𝑃+𝐹𝑁
𝑁𝑛=1 (5)
From FNIR we can calculate another metric called True Positive Identification Rate
(TPIR) that represents the overall identification performance of the proposed bio-
metric as:
𝑇𝑃𝐼𝑅 = 1 − 𝐹𝑁𝐼𝑅 (6)
Table 8-1 Confusion matrix for identification of 351 samples of 18 subjects using the pro-posed HSFV biometric
Subjects S1 S2 S3 S4 S5 S6 S7 S8 S9 S10 S11 S12 S13 S14 S15 S16 S17 S18
S1 16 2 0 0 0 1 0 0 0 0 0 0 1 0 0 0 0 0
S2 0 17 0 0 0 1 0 0 0 0 1 0 1 0 0 0 0 0
S3 1 1 16 0 0 0 0 1 0 0 0 0 0 0 1 0 0 0
S4 0 0 0 18 0 0 0 1 0 0 0 0 0 0 1 0 0 0
S5 0 0 0 0 19 0 1 0 0 0 0 0 0 0 0 0 0 0
S6 4 1 0 0 0 15 0 0 0 0 0 0 0 0 0 0 0 0
S7 0 0 0 0 0 0 18 0 0 0 0 0 0 2 0 0 0 0
S8 1 0 0 0 0 0 0 10 0 0 1 0 1 0 2 1 0 0
S9 0 0 0 0 0 0 0 0 20 0 0 0 0 0 0 0 0 0
S10 0 0 0 0 0 0 0 0 0 18 0 1 0 1 0 0 0 0
S11 2 2 0 0 0 1 0 1 0 0 13 0 0 0 0 0 0 0
S12 0 0 0 0 0 0 2 0 0 0 0 16 0 0 0 0 0 0
S13 1 2 0 0 0 0 1 2 0 0 0 0 12 0 2 0 0 0
S14 0 0 0 0 0 0 0 0 0 3 0 0 0 17 0 0 0 0
S15 0 1 2 0 0 0 0 1 0 0 0 0 1 0 15 0 0 0
S16 3 2 0 0 0 0 0 0 0 0 1 0 2 0 1 11 0 0
S17 0 0 0 0 0 0 3 0 0 0 0 0 0 0 0 0 16 0
S18 0 0 0 0 0 0 0 0 0 0 0 0 0 0 0 0 3 16
Besides the aforementioned metrics, we also calculated the system performance
over four other metrics from [29]: precision, recall, sensitivity and accuracy. Preci-

VISUAL ANALYSIS OF FACES WITH APPLICATION IN BIOMETRICS, FORENSICS AND HEALTH INFORMATICS
278
sion and recall metrics present the ratio of correctly identified positive samples with
total number of identification and total number of positive samples in the experi-
ment, respectively. The formulations of these two metrics are:
𝑃𝑟𝑒𝑐𝑖𝑠𝑖𝑜𝑛 =1
𝑁∑
𝑇𝑃
𝑇𝑃+𝐹𝑃
𝑁𝑛=1 (7)
𝑅𝑒𝑐𝑎𝑙𝑙 =1
𝑁∑
𝑇𝑃
𝑇𝑃+𝐹𝑁
𝑁𝑛=1 (8)
Specificity presents the ratio of correctly identified negative samples with total
number of negative samples and sensitivity presents the ratio of correctly identified
positive and negative samples with total number of positive and negative samples.
The mathematical formulations of these two metrics are:
𝑆𝑝𝑒𝑐𝑖𝑓𝑖𝑐𝑖𝑡𝑦 =1
𝑁∑
𝑇𝑁
𝑇𝑁+𝐹𝑃
𝑁𝑛=1 (9)
𝑆𝑒𝑛𝑠𝑖𝑡𝑖𝑣𝑖𝑡𝑦 =1
𝑁∑
𝑇𝑃+𝑇𝑁
𝑇𝑃+𝑇𝑁+𝐹𝑃+𝐹𝑁
𝑁𝑛=1 (10)
Table 8-2 summarized the overall system performance in the standard terms
mentioned above. From the results it is observed that the proposed HSFV biometric
can effectively identify the subjects with a high accuracy.
Table 8-2 Performance of the proposed HSFV biometric based authentication system
Parameters Results
FPIR 1.28%
FNIR 1.30%
TPIR 98.70%
Precision rate 80.86%
Recall rate 80.63%
Specificity 98.63%
Sensitivity 97.42%
One significant point can be noted from the results that the TPIR and precision
rate have a big difference in values. This is because the true positive and true nega-
tive trials and successes are significantly different in numbers and the system
achieved high rate of true negative authentication as indicated by specificity and
sensitivity metrics. This implies that the proposed biometric, though is of high po-

CHAPTER 8. HEARTBEAT SIGNAL FROM FACIAL VIDEO FOR BIOMETRIC RECOGNITION
279
tential may need improvement in both the feature extraction and the matching score
calculation.
To the best of our knowledge, this chapter is the first to use HSFV as a bio-
metric, thus, there is not any other similar systems in the literature to compare the
proposed system against. Though touch based ECG [12] and PCG [14] biometrics
obtained more than 90% accuracy on some local databases, we think their direct
comparison against our system is biased towards their favor, as they use obtrusive
touch-based sensors, which provide precise measurement of heartbeat signals, while
we, using our touch-free sensor (webcam), get only estimations of those heartbeat
signals that are obtained by touch based sensors. This means that it makes sense if
our touch-free system, at least in this initial step of its development, does not out-
perform those touch-based systems.
The observed results of the touch-free HSFV definitely showed the potential of
the proposed system in human identification and it clearly paves the way for devel-
oping identification systems based on heartbeat rate without a need for touch based
sensors. Reporting the results on a publicly available standard database is expected
to make the future studies comparable to this work.
8.5. CONCLUSIONS AND FUTURE DIRECTIONS
This chapter proposed heartbeat signal measured from facial video as a new bio-
metric trait for person authentication for the first time. Feature extraction from the
HSFV was accomplished by employing Radon transform on a waterfall model of
the replicated HSFV. The pairwise Minkowski distances were obtained from the
Radon image as the features. The authentication was accomplished by a decision
tree based supervised approach. The proposed biometric along with its authentica-
tion system demonstrated its potential in biometric recognition. However, a number
of issues need to be studied and addressed before utilizing this biometric in practi-
cal systems. For example, it is necessary to determine the effective length of a facial
video viable to be captured for authentication in a practical scenario. Fusing face
and HSFV together for authentication may produce interesting results by handling
the face spoofing. Processing time, feature optimization to reduce the difference
between precision and acceptance rate, and investigating different metrics for calcu-
lating the matching score are also necessary to be investigated. The potential of the
HSFV as a soft biometric can also be studied. Furthermore, it is interesting to study
the performance of this biometric under different emotional status when heartbeat
signals are expected to change. These could be future directions for extending the
current work.
VISUAL ANALYSIS OF FACES WITH APPLICATION IN BIOMETRICS, FORENSICS AND HEALTH INFORMATICS
280
8.6. REFERENCES
[1] A. K. Jain and A. Ross, “Introduction to Biometrics,” in Handbook of Biomet-
rics, A. K. Jain, P. Flynn, and A. A. Ross, Eds. Springer US, 2008, pp. 1–22.
[2] C. Hegde, S. Manu, P. Deepa Shenoy, K. R. Venugopal, and L. M. Patnaik,
“Secure Authentication using Image Processing and Visual Cryptography for
Banking Applications,” in 16th International Conference on Advanced Compu-
ting and Communications, 2008. ADCOM 2008, 2008, pp. 65–72.
[3] K. A. Nixon, V. Aimale, and R. K. Rowe, “Spoof Detection Schemes,” in
Handbook of Biometrics, A. K. Jain, P. Flynn, and A. A. Ross, Eds. Springer
US, 2008, pp. 403–423.
[4] B. Phibbs, The Human Heart: A Basic Guide to Heart Disease. Lippincott
Williams & Wilkins, 2007.
[5] L. Biel, O. Pettersson, L. Philipson, and P. Wide, “ECG analysis: a new ap-
proach in human identification,” IEEE Trans. Instrum. Meas., vol. 50, no. 3,
pp. 808–812, Jun. 2001.
[6] N. Venkatesh and S. Jayaraman, “Human Electrocardiogram for Biometrics
Using DTW and FLDA,” in 2010 20th International Conference on Pattern
Recognition (ICPR), 2010, pp. 3838–3841.
[7] C. Hegde, H. R. Prabhu, D. S. Sagar, P. D. Shenoy, K. R. Venugopal, and L.
M. Patnaik, “Heartbeat biometrics for human authentication,” Signal Image
Video Process., vol. 5, no. 4, pp. 485–493, Nov. 2011.
[8] Y. N. Singh, “Evaluation of Electrocardiogram for Biometric Authentication,”
J. Inf. Secur., vol. 03, no. 01, pp. 39–48, 2012.
[9] W. C. Tan, H. M. Yeap, K. J. Chee, and D. A. Ramli, “Towards Real Time
Implementation of Sparse Representation Classifier (SRC) Based Heartbeat
Biometric System,” in Computational Problems in Engineering, N. Mastorakis
and V. Mladenov, Eds. Springer International Publishing, 2014, pp. 189–202.
[10] C. Hegde, H. R. Prabhu, D. S. Sagar, P. D. Shenoy, K. R. Venugopal, and L.
M. Patnaik, “Statistical Analysis for Human Authentication Using ECG
Waves,” in Information Intelligence, Systems, Technology and Management, S.
Dua, S. Sahni, and D. P. Goyal, Eds. Springer Berlin Heidelberg, 2011, pp.
287–298.
[11] N. Belgacem, A. Nait-Ali, R. Fournier, and F. Bereksi-Reguig, “ECG Based
Human Authentication Using Wavelets and Random Forests,” Int. J. Cryptogr.
Inf. Secur., vol. 2, no. 3, pp. 1–11, Jun. 2012.
[12] M. Nawal and G. N. Purohit, “ECG Based Human Authentication: A Review,”
Int. J. Emerg. Eng. Res. Technol., vol. 2, no. 3, pp. 178–185, Jun. 2014.

CHAPTER 8. HEARTBEAT SIGNAL FROM FACIAL VIDEO FOR BIOMETRIC RECOGNITION
281
[13] F. Beritelli and S. Serrano, “Biometric Identification Based on Frequency
Analysis of Cardiac Sounds,” IEEE Trans. Inf. Forensics Secur., vol. 2, no. 3,
pp. 596–604, Sep. 2007.
[14] K. Phua, J. Chen, T. H. Dat, and L. Shue, “Heart sound as a biometric,” Pat-
tern Recognit., vol. 41, no. 3, pp. 906–919, Mar. 2008.
[15] S. Z. Fatemian, F. Agrafioti, and D. Hatzinakos, “HeartID: Cardiac biometric
recognition,” in 2010 Fourth IEEE International Conference on Biometrics:
Theory Applications and Systems (BTAS), 2010, pp. 1–5.
[16] Z. Zhao, Q. Shen, and F. Ren, “Heart Sound Biometric System Based on Mar-
ginal Spectrum Analysis,” Sensors, vol. 13, no. 2, pp. 2530–2551, Feb. 2013.
[17] F. Beritelli and A. Spadaccini, “Human Identity Verification based on Heart
Sounds: Recent Advances and Future Directions,” ArXiv11054058 Cs Stat,
May 2011.
[18] H.-Y. Wu, M. Rubinstein, E. Shih, J. Guttag, F. Durand, and W. Freeman,
“Eulerian Video Magnification for Revealing Subtle Changes in the World,”
ACM Trans Graph, vol. 31, no. 4, pp. 65:1–65:8, Jul. 2012.
[19] C. Takano and Y. Ohta, “Heart rate measurement based on a time-lapse im-
age,” Med. Eng. Phys., vol. 29, no. 8, pp. 853–857, Oct. 2007.
[20] M. A. Haque, R. Irani, K. Nasrollahi, and T. B. Moeslund, “Physiological Pa-
rameters Measurement from Facial Video,” IEEE Trans. Image Process., p.
(Submitted), Sep. 2014.
[21] M.-Z. Poh, D. J. McDuff, and R. W. Picard, “Advancements in Noncontact,
Multiparameter Physiological Measurements Using a Webcam,” IEEE Trans.
Biomed. Eng., vol. 58, no. 1, pp. 7–11, Jan. 2011.
[22] M. A. Haque, K. Nasrollahi, and T. B. Moeslund, “Real-time acquisition of
high quality face sequences from an active pan-tilt-zoom camera,” in 10th
IEEE International Conference on Advanced Video and Signal Based Surveil-
lance (AVSS), 2013, pp. 443–448.
[23] M. A. Haque, K. Nasrollahi, and T. B. Moeslund, “Constructing Facial Expres-
sion Log from Video Sequences using Face Quality Assessment,” in 9th Inter-
national Conference on Computer Vision Theory and Applications (VISAPP),
2014, pp. 1–8.
[24] P. G. T. Herman, “Basic Concepts of Reconstruction Algorithms,” in Funda-
mentals of Computerized Tomography, Springer London, 2009, pp. 101–124.
[25] R. O. Duda, P. E. Hart, and D. G. Stork, Pattern Classification, 2 edition. New
York: Wiley-Interscience, 2000.

VISUAL ANALYSIS OF FACES WITH APPLICATION IN BIOMETRICS, FORENSICS AND HEALTH INFORMATICS
282
[26] M. Soleymani, J. Lichtenauer, T. Pun, and M. Pantic, “A Multimodal Database
for Affect Recognition and Implicit Tagging,” IEEE Trans. Affect. Comput.,
vol. 3, no. 1, pp. 42–55, Jan. 2012.
[27] X. Li, J. Chen, G. Zhao, and M. Pietikainen, “Remote Heart Rate Measurement
From Face Videos Under Realistic Situations,” in IEEE Conference on Com-
puter Vision and Pattern Recognition (CVPR), 2014, pp. 4321–4328.
[28] P. A. K. Jain, D. A. A. Ross, and D. K. Nandakumar, “Introduction,” in Intro-
duction to Biometrics, Springer US, 2011, pp. 1–49.
[29] D. L. Olson and D. Delen, “Performance Evaluation for Predictive Modeling,”
in Advanced Data Mining Techniques, Springer Berlin Heidelberg, 2008, pp.
137–147.

283
CHAPTER 9. CAN CONACT-FREE
MEASUREMENT OF HEARTBEAT
SIGNAL BE USED IN FORENSICS?
Mohammad Ahsanul Haque, Kamal Nasrollahi, and Thomas B. Moeslund
This paper has been published in the
Proceedings of the 23rd
European Signal Processing Conference (EUSIPCO)
pp. 774-778, 2015
© 2015 IEEE
The layout has been revised.


285
9.1. ABSTRACT
Biometrics and soft biometrics characteristics are of great importance in forensics
applications for identifying criminals and law enforcement. Developing new bio-
metrics and soft biometrics are therefore of interest of many applications, among
them forensics. Heartbeat signals have been previously used as biometrics, but they
have been measured using contact-based sensors. This chapter extracts heartbeat
signals, using a contact-free method by a simple webcam. The extracted signals in
this case are not as precise as those that can be extracted using contact-based sen-
sors. However, the contact-free extracted heartbeat signals are shown in this chap-
ter to have some potential to be used as soft biometrics. Promising experimental
results on a public database have shown that utilizing these signals can improve the
accuracy of spoofing detection in a face recognition system.
9.2. INTRODUCTION
Forensic science deals with techniques used in criminal scene investigation for
collecting information and its interpretation for the purpose of answering questions
related to a crime in a court of law [1]. Such information is usually related to the
human body or behavioral characteristics that can (or help to) reveal the identity of
criminal(s). Such characteristics are extracted either from traces that are left in the
crime scene, like DNA, handwritings, and fingerprints [2], or devices like cam-eras
and microphones, if any, that have been recording visual and audio signals in the
scene during the crime. Recorded visual signals as well as audio signals can be of
great help as many different characteristics can be extracted from them, characteris-
tics that can directly be used for identification (bio-metrics), or can help the identi-
fication process (soft biometrics).
Forensics investigations have long been utilizing such human characteristics.
For example, the importance of DNA in [3], fingerprint in [4], facial images and its
related soft bio-metrics in [5], [6], gait in [7] have been discussed for forensics ap-
plications. However, most of these biometric/soft biometric traits exhibit disad-
vantages in regards to accuracy, spoofing and/or unobtrusiveness. For example,
fingerprint can be forged to breach the identification system, gait can be imitated,
and facial image can be used in absence of the person. Thus, further investigations
for new biometric traits are of interest of many applications. Human heartbeat sig-
nal is one of such emerging biometric traits.
Human heart is a muscular organ that works as a circulatory blood pump. When
blood is pumped by the heart, some electrical and acoustic changes occur in and
around the heart in the body, which is known as heartbeat signal [8]. Heartbeat
signal can be obtained by Electrocardiogram (ECG) using electrical changes and
Phonocardiogram (PCG) using acoustic changes. Both ECG and PCG heartbeat

VISUAL ANALYSIS OF FACES WITH APPLICATION IN BIOMETRICS, FORENSICS AND HEALTH INFORMATICS
286
signals have al-ready been used as biometrics for human identity verification in the
literature. A review of such important ECG-based approaches can be obtained from
[9]. On the other hand, a re-view of the important PCG-based identification meth-
ods can be found in [10]. The common drawback of all of the above mentioned
ECG and PCG based methods for identity verification is the requirement of using
obtrusive (contact-based) sensors for the acquisition of ECG or PCG signals from a
subject. In another words, for obtaining heart signals using ECG and PCG the re-
quired sensors need to be directly installed on subject’s body, which is obviously
not always possible. There-fore, after an introductory work in [11] for heartbeat
signal based human authentication, in this chapter we look at contact-free meas-
urement of the Heartbeat Signal from Facial Videos (HSFV) and investigate its
distinctiveness potential in forensics. It is shown in this chapter that such signals
have distinctive features, however, their distinctiveness capability are not that high
to use them as biometrics. Instead, it is shown that they can help improving the
detection accuracy of a face spoofing detection algorithm in face recognition sys-
tem, and hence can be used as a soft biometric in forensics applications, for exam-
ple, with video-based face recognition algorithms.
Figure 9-1 The block diagram of the proposed system.
The proposed system obtains HSFV signals from video sequences that are cap-
tured by a simple webcam, by tracing changes in the color of facial images that are
caused by the heart pulses. Then, it extracts some distinctive features from these
signals. Unlike ECG and PCG based heartbeat biometric, the proposed HSFV soft
biometric does not require any obtrusive sensor such as ECG electrode or PCG
microphone. It is universal and permanent, obviously because every living human
being has an active heart. It can be more secure than its traditional counterparts as it
is difficult to be artificially generated, and can be easily combined with state-of-the-
art face biometric without requiring any additional sensor.
The rest of this chapter is organized as follows: the proposed system for detect-
ing spoofing attacks in a face recognition system and its sub-blocks (including the

CHAPTER 9. CAN CONACT-FREE MEASUREMENT OF HEARTBEAT SIGNAL BE USED IN FORENSICS?
287
heartbeat signals measurement and feature extraction) are explained in the next
section. The experimental results are given in section four. Finally the chapter is
concluded in section five.
9.3. THE PROPOSED SYSTEM
The block diagram of the proposed system is shown in Figure 9-1. Each of these
sub-blocks of the system is described in the following subsections.
9.3.1. FACIAL VIDEO ACQUISITION
The first step is capturing the facial video using a RGB cam-era, which is thorough-
ly investigated in the literature [12–14]. As recent methods of facial video based
heartbeat signal analysis utilized simple webcam for video capturing, we select a
webcam based video capturing procedure.
9.3.2. FACE DETECTION
Face detection is accomplished by the well-known Haar-like features based Viola
and Jones method of [15]. The face region is expressed by a rectangular bounding
box in each video frames.
9.3.3. REGION OF INTEREST (ROI) SELECTION
As the face area detected by the automatic face detection method comprises some
of the surrounding areas of the face including face boundary, it is necessary to ex-
clude the sur-rounding area to retain merely the area containing facial skin. This is
accomplished by obtaining a Region of Interest (ROI) from the face by selecting
60% width of the face area detected by the automatic face detection method.
9.3.4. HEARTBEAT SIGNAL EXTRACTION
The heartbeat signal is extracted from the facial video by tracing color changes in
RGB channels in the consecutive video frames. The average of the red, green and
blue components of the whole ROI is recorded as the RGB traces of that frame. In
order to obtain a heartbeat signal from a facial video, the statistical mean of these
three RGB traces of each frame is calculated and recoded for each frame of the
video. The resulting signal represents the heartbeat signal.
The heartbeat signal obtained from facial video by following the aforemen-
tioned approach is, however, noisy and imprecise. This is due to the effect of exter-
nal lighting, voluntary head-motion, induced noise by the capturing system and the
act of blood as a damper to the heart pumping pressure to be transferred from the

VISUAL ANALYSIS OF FACES WITH APPLICATION IN BIOMETRICS, FORENSICS AND HEALTH INFORMATICS
288
middle of the chest (where the heart is located) to the face. Thus, we employ a de-
noising filter by detecting the peak in the extracted heart signal and discarding the
out-lying RGB traces. The effect of the de-noising operation on a noisy heartbeat
signal obtained from RGB traces is depicted in Figure 9-2. The signal is then passed
through a Hodrick-Prescott filter [16] with a smoothing parameter (value = 2 in our
case) in order to decompose it into trend and cyclic components. As heartbeat is a
periodic vibration due to the heart pulse, we assume that the trend component com-
prises the noise in the heartbeat signal induced by voluntary head-motion. Thus, we
obtain the denoised heart-beat signal from the cyclic component.
Figure 9-2 An example of heartbeat signal before (left) and after (right) employing a de-noising filter. On the x-axis is the frame number and on the y-axis is the RGB trace.
9.3.5. FEATURE EXTRACTION
The feature extraction from the denoised HSFV is accomplished by employing a
decomposition method called Complete Ensemble Empirical Mode Decomposition
with Adaptive Noise (CEEMDAN) from [17]. The CEEMDAN decom-poses the
HSFB into a small number of modes called Intrinsic Mode Functions (IMFs). The
number of IMFs can vary, but not less than 6 in this case. Thus, we considered first
6 IMFs. An example of first 6 IMFs for a HSFV in the case of a real face are shown
in Figure 9-3. We then calculated some spectral features of the original HSFV and
each of the 6 IMFs for feature extraction. The extracted features from the one di-
mensional HSFV are the statistical mean and variance of the spectral energy, pow-
er, low-energy, gravity, entropy, roll-off, flux, zero-ratio as stated in [18–21] for
one dimensional audio signal. As a whole, we extracted a feature vector of 112
elements for each facial video.
9.3.6. SPOOFING ATTACK DETECTION
We employ the Support Vector Machines of [22], with a tangent hyperbolic kernel
function, as the classifier to discriminate between real facial video and spoofing
attack.

CHAPTER 9. CAN CONACT-FREE MEASUREMENT OF HEARTBEAT SIGNAL BE USED IN FORENSICS?
289
Figure 9-3 An example of first 6 IMFs with obtained for a HSFV of a real face.
9.4. EXPERIMENTAL RESULTS AND DISCUSSIONS
9.4.1. EXPERIMENTAL ENVIRONMENT
The performance of spoofing detection using the HSFV was evaluated in a system
implemented in a combination of MAT-LAB and C++ environment by following
the methodology of the previous section. We used the publicly available PRINT-
ATTACK database [23] for spoofing attack detection. This database was collected
by Anjos et al. and contains facial videos (each about 10 seconds long) captured by
a simple webcam. The videos of the database are recorded in three scenarios. These
are: video of real face, video of printed face held by operator’s hand, video of print-
ed face held by a fixed support. All these videos were then categorized into three
sets: train, devel, and test. The details are given in Table 9-1. However, some of
these videos are too dark to automatically detect face and extract heart signal. Thus,
we discarded 2 videos from the train set and 4 videos from the devel set. The rest of
the videos were used in the experiment.

VISUAL ANALYSIS OF FACES WITH APPLICATION IN BIOMETRICS, FORENSICS AND HEALTH INFORMATICS
290
9.4.2. PERFORMANCE EVALUATION
A spoofing detection system exhibits two types of errors: accepting a spoofed face
and rejecting a real face. First error is measured by False Acceptance Rate (FAR)
and the second one is measured by False Rejection Rate (FRR). The performance
can be depicted on a Receiver Operating Characteristics (ROC) graph where FAR
and FRR are plotted against a threshold to determine the membership in true groups
of real access and spoofed access. The ROC of the different combinations of da-
tasets, after the training using train set, is shown in Figure 9-4. From the results it is
observed that the Equal Error Rates (EER), where FAR and FRR curves intersect,
are different for different settings. When a printed face was shown in front of the
camera by holding it in a fixed place the periodic variation in the heart signal of a
real face can be discriminated with higher accuracy as shown in Figure 9-4(a) and
(d). But, when the printed face was held by hand, the hand shaking behavior affects
the result. However, the results show that HSFV can retrieve the difference between
real face and print attack moderately accurately.
Table 9-1 The Numbers of videos in different groups of the PRINT-ATTACK database [23]
Type train devel test Total
Real face 60 60 80 200
Printed face in hand 30 30 40 100
Printed face in a support 30 30 40 100
Total 120 120 160 400
9.4.3. PERFORMANCE COMPARISON
We compare the performance of the HSFV with the baseline results for the test set
of the PRINT-ATTACK database provided in [23]. The results are shown in Table
9-2.
From the results it is observed that the HSFV alone cannot outperform the base-
line approach. However, the experiment reveals that the HSFV is able to unveil
some clues between real face and printed face shown to a biometric system, and can
be a potential soft biometric to be used along with other features to achieve a doable
result in face spoofing detection. This notion is shown in the last three rows of
Table 9-2, where the features extracted from HSFV is fused with four background
features (maximum, minimum, average and standard deviation of the signal ob-
tained from the video frames background by following [23]), hereafter referred as
BG. We employ a score-level fusion of probability estimates of classifier outputs

CHAPTER 9. CAN CONACT-FREE MEASUREMENT OF HEARTBEAT SIGNAL BE USED IN FORENSICS?
291
obtained for HSFV and BG features. We observe that the fusion of HSFV and BG
features improves the performance in face spoofing detection. One significant point
to mention is that when BG features were fused with HSFV features in score-level,
the spoofing detection system showed reduced performance than the baseline as
indicated by the third-last row of Table 9-2. We believe that this is because of sensi-
tivity of HSFV to the periodic noise induced by the camera capturing system.
Table 9-2 Performance of HSFV in spoofing detection in comparison to a baseline for PRINT-ATTACK database [23]
Type test-dataset
HSFV (fixed) 66,10
HSFV (hand) 66,10
HSFV (all) 61,39
Baseline (fixed) 77,94
Baseline (hand) 85,47
Baseline (all) 82,05
HSFV (fixed)+BG 75,64
HSFV (hand)+BG 91,03
HSFV (all)+BG 85,90
9.4.4. DISCUSSIONS ABOUT HSFV AS A SOFT BIOMETRIC FOR FORENSIC INVESTIGATIONS
Face recognition systems need to be robust against spoofing attacks. As printed face
spoofing attack is very common in this regard, we investigate the potential of HSFV
as a soft biometric for printed face spoofing attack detection in a face recognition
system. Though from the results it is observed that the HSFV alone cannot provide
very high accuracy, it is able to unveil some clues between real face and printed
face shown to a biometric system. When HSFV was fused with some other features
(BG features in our experiment), the results were considerably improved in most of
the cases. Thus, we can infer that the HSFV carries some distinctive features and
can be considered as a soft biometric. Hence, one could answer the question raised
by the chapter by a Yes answer, i.e., heartbeat signals extracted from facial images
have some distinctive properties and might be useful for forensics applications.

VISUAL ANALYSIS OF FACES WITH APPLICATION IN BIOMETRICS, FORENSICS AND HEALTH INFORMATICS
292
Figure 9-4 ROC curves for employing the HSFV based spoofing detection on different com-binations of the experimental datasets.
9.5. CONCLUSIONS
This chapter investigated the potential of the heartbeat signal from facial video as a
new soft biometric. To do that, the distinctive properties that are carried in a heart-
beat signal have been utilized to improve the accuracy of spoofing attack detection
in a face recognition system. A description of the procedure of heartbeat signal
extraction from facial video was provided and experimental results were generated
by using a publicly available database for printed face spoofing attack detection in a
face recognition system. The experimental results revealed that the contact-free
measured heartbeat signal has the potential to be used as a soft biometric.
9.6. REFERENCES
[1] D. Meuwly and R. Veldhuis, “Forensic biometrics: From two communities to
one discipline,” in Biometrics Special Interest Group (BIOSIG), 2012 BIOSIG
- Proceedings of the International Conference of the, Sept 2012, pp. 1–12.
[2] A. Swaminathan, M. Wu, and K.J.R. Liu, “Digital image forensics via intrin-
sic fingerprints,” Information Forensics and Security, IEEE Transactions on,
vol. 3, no. 1, pp. 101–117, March 2008.
[3] D. Ehrlich et al., “Mems-based systems for dna sequencing and forensics,” in
Sensors, Proceedings of IEEE, vol. 1, pp. 448–449, 2002.

CHAPTER 9. CAN CONACT-FREE MEASUREMENT OF HEARTBEAT SIGNAL BE USED IN FORENSICS?
293
[4] W.S. Lin, S.K. Tjoa, H.V. Zhao, and K.J.R. Liu, “Digital image source coder
forensics via intrinsic fingerprints,” Information Forensics and Security, IEEE
Transactions on, vol. 4, no. 3, pp. 460–475, Sept 2009.
[5] A.K. Jain, B. Klare, and U. Park, “Face matching and retrieval in forensics
applications,” MultiMedia, IEEE, vol. 19, no. 1, pp. 20–20, Jan 2012.
[6] J.E. Lee, A.K. Jain, and R. Jin, “Scars, marks and tattoos (smt): Soft biometric
for suspect and victim identification,” in Biometrics Symposium, 2008. BSYM
’08, pp. 1–8, 2008.
[7] H. Iwama, D. Muramatsu, Y. Makihara, and Y. Yagi, “Gait-based person-
verification system for forensics,” in Biometrics: Theory, Applications and
Systems (BTAS), 2012 IEEE Fifth International Conference on, pp. 113–120,
2012.
[8] B. Phibbs, The Human Heart: A Basic Guide to Heart Disease, Medicine Se-
ries. Lippincott Williams & Wilkins, 2007.
[9] M. Nawal and G.N. Purohit, “Ecg based human authentication: A review,” Int.
J. Emerg. Eng. Res. Technol., vol. 2, no. 3, pp. 178–185, Jun 2014.
[10] F. Beritelli and A. Spadaccini, “Human identity verification based on heart
sounds: Recent advances and future directions,” CoRR, vol. abs/1105.4058,
2011.
[11] M.A. Haque, K. Nasrollahi, and T.B. Moeslund, “Heartbeat signal from facial
video for biometric recognition,” in 19th Scandinavian Conference on Image
Analysis (SCIA), Lecture Notes in Computer Science, pp. 1–12. Springer,
2015.
[12] M.A. Haque, K. Nasrollahi, and T.B. Moeslund, “Real-time acquisition of
high quality face sequences from an active pan-tilt-zoom camera,” in Ad-
vanced Video and Signal Based Surveillance (AVSS), 2013 10th IEEE Interna-
tional Conference on, Aug 2013, pp. 443–448.
[13] M.A. Haque, K. Nasrollahi, and T.B. Moeslund, “Constructing facial expres-
sion log from video sequences using face quality assessment,” in 9th Interna-
tional Conference on Computer Vision Theory and Applications (VISAPP),
2014, pp. 1–8.
[14] M.A. Haque, K. Nasrollahi, and T.B. Moeslund, “Quality-aware estimation of
facial landmarks in video sequences,” in IEEE Winter Conference on Applica-
tions of Computer Vision. IEEE, 2015, pp. 678–685.
[15] P. Viola and M.J. Jones, “Robust real-time face detection,” International
Journal of Computer Vision, vol. 57, no. 2, pp. 137–154, 2004.

VISUAL ANALYSIS OF FACES WITH APPLICATION IN BIOMETRICS, FORENSICS AND HEALTH INFORMATICS
294
[16] R.J. Hodrick and E.C. Prescott, “Postwar u.s. business cycles: An empirical
investigation,” Journal of Money, Credit and Banking, vol. 29, no. 1, pp. 1–
16, February 1997.
[17] M.E. Torres, M.A. Colominas, G. Schlotthauer, and P. Flandrin, “A complete
ensemble empirical mode de-composition with adaptive noise,” in Acoustics,
Speech and Signal Processing (ICASSP), 2011 IEEE International Conference
on, May 2011, pp. 4144–4147.
[18] M.A. Haque and J.M. Kim, “An analysis of content-based classification of
audio signals using a fuzzy c-means algorithm,” Multimedia Tools and Appli-
cations, vol. 63, no. 1, pp. 77–92, 2013.
[19] N.T.T. Nguyen, M.A. Haque, C.H. Kim, and J.M. Kim, “Audio segmentation
and classification using a tempo-rally weighted fuzzy c-means algorithm,” in
Advances in Neural Networks ISNN 2011, vol. 6676 of Lecture Notes in Com-
puter Science, pp. 447–456. Springer Berlin Heidelberg, 2011.
[20] M.A. Haque and J.M. Kim, “An enhanced fuzzy c-means algorithm for audio
segmentation and classification,” Multimedia Tools and Applications, vol. 63,
no. 2, pp. 485–500, 2013.
[21] M.A. Haque, S. Cho, and J.M. Kim, “Primitive audio genre classification: an
investigation of feature vector optimization,” International Information Insti-
tute (Tokyo). Information, vol. 15, no. 5, pp. 1875–1887, 2012.
[22] C. Cortes, and V. Vapnik, “Support-vector networks,” Mach. Learn., vol. 20,
no. 3, pp. 273–297, Sept. 1995.
[23] A. Anjos and S. Marcel, “Counter-measures to photo attacks in face recogni-
tion: A public database and a baseline,” in Biometrics (IJCB), 2011 Interna-
tional Joint Conference on, Oct 2011, pp. 1–7.

295
CHAPTER 10. CONTACT-FREE
HEARTBEAT SIGNAL FOR HUMAN
IDENTIFICATION AND FORENSICS
Kamal Nasrollahi, Mohammad Ahsanul Haque, Ramin Irani, and Thomas B.
Moeslund
This paper has been submitted (under review) as a book chapter in the
Biometric in Forensic Sciences
© 2016 Standard
The layout has been revised.


297
10.1. ABSTRACT
The heartbeat signal, which is one of the physiological signals, is of great im-
portance in many real-world applications, for example, in patient monitoring and
biometric recognition. The traditional methods for measuring such this signal use
contact-based sensors that need to be installed on the subject’s body. Though it
might be possible to use touch-based sensors in applications like patient monitor-
ing, it won’t be that easy to use them in identification and forensics applications,
especially if subjects are not cooperative. To deal with this problem, recently com-
puter vision techniques have been developed for contact-free extraction of the
heartbeat signal. We have recently used the contact-free measured heartbeat signal,
for bio-metric recognition, and have obtained promising results, indicating the
importance of these signals for biometrics recognition and also for forensics appli-
cations. The importance of heartbeat signal, its contact-based and contact-free
extraction methods, and the results of its employment for identification purposes,
including our very recent achievements, are reviewed in this chapter.
10.2. INTRODUCTION
Forensic science deals with collecting and analyzing information from a crime sce-
ne for the purpose of answering questions related to the crime in a court of law. The
main goal of answering such questions is identifying criminal(s) committing the
crime. Therefore, any information that can help identifying criminals can be useful.
Such information can be collected from different sources. One such a source, which
has a long history in forensics, is based on human biometrics, i.e., human body or
behavioral characteristics that can identify a person, for example, DNA [1], finger-
prints [2], [3], and facial images [4]. Besides human biometrics, there is another
closely related group of human features/characteristics that cannot identify a per-
son, but can help the identification process. These are known as soft biometrics, for
instance, gender, weight, height, gait, race, and tattoo.
The human face, which is of interest of this chapter, is not only used as a bio-
metric, but also as a source for many soft biometrics, such as gender, ethnicity, and
facial marks and scars [5], [6], [8]. These soft biometrics have proven great values
for forensics applications in identification scenarios in unconstrained environments
wherein commercial face recognition systems are challenged by wild imaging con-
ditions, such as off frontal face pose and occluded/covered face images [7], [8]. The
mentioned facial soft-biometrics are mostly based on the physical fea-
tures/characteristics of the human. In this chapter, we look into heartbeat signal
which is a physiological feature/characteristic of the human that similar to the men-
tioned physical ones can be extracted from facial images in a contact-free way,
thanks to the recent advances in computer vision algorithms. The heartbeat signal is
one of the physiological signals that is generated by the cardiovascular system of

VISUAL ANALYSIS OF FACES WITH APPLICATION IN BIOMETRICS, FORENSICS AND HEALTH INFORMATICS
298
the human body. The physiological signals have been used for different purposes in
computer vision applications. For example, in [9] electromyogram, electrocardio-
gram, skin conductivity and respiration changes and in [10] electrocardiogram, skin
temperature, skin conductivity, and respiration have been used for emotion recogni-
tion in different scenarios. In [11] physiological signals have been used for improv-
ing communication skills of children suffering from Autism Spectrum Disorder in a
virtual reality environment. In [12], [13], and [14] these signals have been used for
stress monitoring. Based on the results of our recent work, which are reviewed here,
the heartbeat signal shows promising results to be used as a soft biometric.
The rest of this chapter is organized as follows: first, the measurements of
heartbeat signal using both contact-based and contact-free methods are explained in
the next section. Then, employing these signals for identification purposes is dis-
cussed in section four. Finally, the chapter is concluded in section five.
10.3. MEASUREMENT OF HEARTBEAT SIGNAL
The heartbeat signal can be measured in two different ways: contact-based and
contact-free. These methods are explained in the following subsections.
10.3.1. CONTACT-BASED MEASUREMENT OF HEARTBEAT SIGNAL
The heartbeat signal can be recorded in two different ways using the contact-based
sensors:
By monitoring electrical changes of muscles during heart functioning, by a
method that is known as Electrocardiogram which records ECG signals.
By listening to the heart sounds during its functioning, by a method that is
known as Phonocardiogram which records PCG signals.
The main problem of the above mentioned methods is obviously the need for the
sensors to be in contact (touch) with the subject’s body. Depending on the applica-
tion of the measured heartbeat signal, this requirement may have different conse-
quences, for example, for:
Constant monitoring of patient, having such sensors on the body may
cause some skin irritation.
Biometric recognition, the subjects might not be cooperative to wear the
sensors properly.
Therefore, contact-free measurement of heartbeat signals can be of great ad-
vantage in many applications. Thanks to the recent advances in computer vision
techniques, this has been possible recently to measure heartbeat signals using a

CHAPTER 10. CONTACT-FREE HEARTBEAT SIGNAL FOR HUMAN IDENTIFICATION AND FORENSICS
299
simple webcam. Methods developed for this purpose are reviewed in the following
subsection.
10.3.2. CONTACT-FREE MEASUREMENT OF HEARTBEAT SIGNAL
The computer vision techniques developed for heartbeat measurement mostly uti-
lize facial images. The reason for this goes back to this fact that heart pulses gener-
ate some periodic changes on the face, as well as other parts of the human body.
How-ever, since the human face is mostly visible, it is usually this part of the body
that has been chosen by the researchers to extract the heartbeats from. The periodic
changes that are caused by the heartbeat on the face are of two types:
Changes in head motion which is a result of periodic flow of the blood
through the arteries and the veins for delivering oxygenated blood to the
body cells.
Changes in skin color which is a result of having a specific amount of
blood under the skin in specific periods of time.
None of these two types of changes are visible to the human eyes, but they can
be revealed by computer vision techniques, like Eulerian magnification of [16] and
[17]. The computer vision techniques developed for heartbeat measurement are
divided into two groups, depending on the source (motion or color) they utilize for
the measurement. These two types of methods are reviewed in the following sub-
sections.
10.3.2.1 Motion for Contact-Free Extraction of Heartbeat Signal
The first motion-based contract-free computer vision method was just recently re-
leased by [18]. This system utilizes the fact that periodic heart pules, through aorta
and carotid arteries, produce periodic subtle motions on the head/face which can be
detected from a facial video. To do that, in [18] some stable facial points, known as
good features to track, are detected and tracked over time. The features they track
are located on the forehead area and the region between the mouth and then nose
are as these areas are less affected by internal facial expressions and their moments
should thus be from another source, i.e., heart pules. Tracking these facial points’
results in a set of trajectories, which are first filtered by a Butterworth filter to re-
move the irrelevant frequencies. The periodic components of these trajectories are
then extracted by PCA and considered as the heartbeat rate. Their system has been
tested on video sequences of 18 subjects. Each video was of resolution of 1280x720
pixels, at a frame rate of 30 with duration of 70-90 seconds.
To obtain the periodicity of the results of the PCA (applied to the trajectories),
in [18] a Fast Fourier Transform (FFT) has been applied to the obtained trajectories
from the good features to track points. Then, a percentage of the total spectral pow-

VISUAL ANALYSIS OF FACES WITH APPLICATION IN BIOMETRICS, FORENSICS AND HEALTH INFORMATICS
300
er of the signal accounted for by the frequency with the maximal power and its first
harmonic is used to define the heartbeat rate of the subject [18]. Though this pro-
duces reasonable results when the subjects are facing the camera, it fails when there
are other sources of motion on the face. Such sources of motion can be for instance,
changes in facial expressions and involuntary head motion. It is shown in [19] that
such motions makes the results of [18] far from correct. The main reason is because
the system in [18] uses the frequency with the maximal power as the first harmonic
when it estimates the heartbeat rate. However, such an assumption may not always
be true, specifically when the facial expression is changing [19]. To deal with these
problems [19] has detected good features to track Figure 10-1(right) from the facial
regions shown in Figure 10-1(left).
Figure 10-1 The facial regions (yellow areas in the left image) that have been used for de-tecting good feature to track (blue dots in the right image) for generating motion trajectories in [19].
Then, [19] tracks the good features to track to generate motion trajectories of
these features. Then, it replaces the FFT with a Discrete Cosine Transform (DCT),
and has employed a moving average filter before the Butterworth filter of [18].
Figure 10-2 shows the effect of the moving average filter employed in [19] for re-
ducing the noise (resulting from different sources, e.g., motion of the head due to
facial expression) in the signal that has been used for estimating the heartbeat rate.
Experimental results in [19] show that the above mentioned simple changes
have improved the performance of [19] compared to [18] in estimating the heartbeat
signal, specifically, when there are changes in facial expressions of the subjects.
The system in [19] has been tested on 32 video sequences of five subjects in differ-
ent facial expressions and poses with duration about 60 seconds.
To the best of our knowledge, the above two motion based systems are the only
two methods available in the literature for contact-free measurement of the heart-
beat rate using motion of the facial features. It should be noted that these systems
do not report their performance/accuracy on estimating the heartbeat signal, but do
so only for the heartbeat rate. The estimation of heartbeat signals are mostly report-
ed in the color based systems which are reported in the next subsection.

CHAPTER 10. CONTACT-FREE HEARTBEAT SIGNAL FOR HUMAN IDENTIFICATION AND FORENSICS
301
Figure 10-2 The original signal (red) vs. the moving averaged one (blue) used in [19] for estimating the heartbeat rate. On x and y-axis are the time (in seconds) and the amplitude of a facial point (from (good features to track)) that has been tracked, respectively.
10.3.2.2 Color for Contact-Free Extraction of Heartbeat Signal
Using expensive imaging techniques for utilizing color of facial (generally skin)
regions for the purpose of estimating physiological signal has been around for dec-
ades. However, the interest in this field was boosted when the system of [20] re-
ported its results on video sequences captured by simple webcams. In this work,
[20], Independent Component Analysis (ICA) has been applied to the RGB separat-
ed color channels of facial images, which are tracked over time, to extract the peri-
odic components of these channels. The assumption here is that periodic blood
circulation makes subtle periodic changes to the skin color, which can be revealed
by Eulerian magnification of [16]. Having included a tracker in their system, they
have measured heartbeat signals of multiple people at the same time [20]. Further-
more, it has been discussed in [20] that this method is tolerant towards motion of
the subject during the experiment as it is based on the color of the skin. They have
reported the results of their systems on 12 subjects facing a webcam that was about
0.5 meters away in an indoor environment. Shortly after in [21] it was shown that
besides heartbeat, the methods of [20] can be used for measuring other physiologi-
cal signals, like respiratory rate.

VISUAL ANALYSIS OF FACES WITH APPLICATION IN BIOMETRICS, FORENSICS AND HEALTH INFORMATICS
302
The interesting results of the above systems motivated others to work on the
weakness of those systems, which had been tested only in constrained conditions.
Specifically,
In [22], it has been discussed the methods of [20] and [21] are not that
efficient when the subject is moving (questioning the claimed motion
tolerance of [20] and [21] ) or when the lightning is changing, like in
an outdoor environment. To compensate for these they have performed
a registration prior to calculating the heartbeat signals. They have test-
ed their system in an outdoor environment in which the heartbeat sig-
nals are computed for subjects driving their vehicles.
In [23] auto-regressive modelling and pole cancellation have been used
to reduce the effect of the aliased frequency components that may
worsen the performance of a contact-free color based system for meas-
uring physiological signals. They have reported their experimental re-
sults on patients that are under monitor in a hospital.
In [24] normalized least mean square adaptive filtering has been used
to reduce effect of changes in the illumination in a system that tracks
changes in color values of 66 facial landmarks. They reported their ex-
perimental results on the large facial database of MAHNOB-HCI [25]
which is publicly available. The re-ported results show that the system
of [24] outperforms the previously published contact-free methods for
heartbeat measurement including the color-based meth-ods of [20] and
[21] and the motion-based of [18].
10.4. USING HEARTBEAT SIGNAL FOR IDENTIFICATION PURPOSES
Considering the fact the heartbeat signals can be obtained using the two different
methods explained in the previous section, different identification methods have
been developed. These are reviewed in the following subsections.
10.4.1. HUMAN IDENTIFICATION USING CONTACT-BASED HEARTBEAT SIGNAL
The heartbeat signals obtained by contact-based sensors (in both ECG and PCG
forms) have been used for identification purposes for more than a decade. Here we
only review those methods that have used ECG signals as they are more common
than PCG ones for identification.
There are many different methods for human identification using ECG signals:
[27]-[44], to mention a few. These systems have either extracted some features
from the heart signal or have used the signal directly for identification. For exam-

CHAPTER 10. CONTACT-FREE HEARTBEAT SIGNAL FOR HUMAN IDENTIFICATION AND FORENSICS
303
ple, it has been discussed in [27] that the heart signal (in an ECG form) composes
of three parts: a P wave, a QRS complex, and a T wave (Figure 10-3). These three
parts and their related key points (P, Q, R, S, and T, known as fiducial points) are
then found and used to calculate features that are used for identification, like the
amplitude of the peaks or valleys of these point, the onsets and offsets of the waves,
and the duration of each part of the signal from each point to the next. Similar fea-
tures have been combined in [29] with radius curvature of different parts of the
signal. It is discussed in [38] that one could ultimately extract many fiducial points
from an ECG signal, but not all of them are equally efficient for identification.
Figure 10-3 A typical ECG signal in which the important key points of the signal are labeled.
In [30], [31], [35], [37], and [39] it has been discussed that fiducial points detec-
tion based methods are very sensitive to the proper detection of the signal bounda-
ries, which is not always possible. To deal with this, in:
[30] the ECG signals have directly been used for identification in a
Principal Component Analysis (PCA) algorithm.
[31] the ECG signal has been first divided into some segments and then
the coefficients of the Discrete Cosine Transform (DCT) of the auto-
correlation of these segments have been obtained for the identification.
[35] a ZivMerhav cross parsing method based on the entropy of the
ECG signal has been used.
[37], [40], [43] the shape and morphology of the heartbeat signal has
been directly used as feature for identification.
VISUAL ANALYSIS OF FACES WITH APPLICATION IN BIOMETRICS, FORENSICS AND HEALTH INFORMATICS
304
[39] sparse representation of the ECG signal has been used for identifi-
cation.
[33], [34], [36] frequency analysis methods have been applied to ECG
signals for identification purposes. For example, in [33] and [36] wave-
let transformation has been used and it is discussed that it is more ef-
fective against noise and outliers.
10.4.2. HUMAN IDENTIFICATION USING CONTACT-FREE HEARTBEAT SIGNAL
The above mentioned systems use contact-based (touch-based) sensors for measur-
ing heartbeat signals. These sensors provide accurate, however sensitive to noise,
measurements. Furthermore, they suffer from a major problem: these sensors need
to be in contact with the body of the subject of interest. As mentioned before, this is
not always practical, especially in identification context if subjects are not coopera-
tive. To deal with this, we in [45] have developed an identification system that uses
the heartbeat signals that are extracted using the contact-free technique of [21]. To
the best of our knowledge this is the first system that uses the contact-free heart-
beat signals for identification purposes. In this section we review the details of this
system and its findings.
Having obtained the heartbeat signals, in form of RGB traces, from facial imag-
es using the method of [21] in [45] first a denoising filter is employed to reduce the
effect of the external sources of noise, like changes in the lightning and head mo-
tions. To do that, the peak of the measured heartbeat signal is found and used to
discard the outlying RGB traces. Then, the features that are used for the identifica-
tion are extracted from this denoised signal. Following [26] the features that are
used for identification in [45] are based on Radon images obtained from the RGB
traces. To produce such images from the RGB traces, in [45] first the tracked RGB
traces are replicated to the same number as the number of the frames that is availa-
ble in the video sequence that is used for the identification, to generate a waterfall
diagram. Figure 10-4 shows an example of such a waterfall diagram obtained for a
contact-free measured heartbeat signal.
The Radon image, which contains the features that are going to be used for the
recognition in [45], is then generated from the waterfall by applying a Radon trans-
form to the waterfall diagram. Figure 10-5 shows the obtained Radon image from
the waterfall diagram of Figure 10-4. The discriminative features that are used for
identification purposes from such a Radon image are simply the distance between
every two possible pixels of the image.
The experimental results in [45] on a subset of the large facial database of
MAHNOB-HCI [25] shown in Table 10-1 indicate that the features extracted from

CHAPTER 10. CONTACT-FREE HEARTBEAT SIGNAL FOR HUMAN IDENTIFICATION AND FORENSICS
305
the Radon images of the heartbeat signals that were collected using a contact-free
computer vision technique carries some distinctive properties.
Figure 10-4 A contact-free measured heartbeat signals (on the top) and its waterfall diagram (on the bottom).

VISUAL ANALYSIS OF FACES WITH APPLICATION IN BIOMETRICS, FORENSICS AND HEALTH INFORMATICS
306
Figure 10-5 The Radon image obtained from the waterfall diagram of Figure 10-4. The discriminative features for the identification purposes are extracted from such Radon images [45]. The image on the right is the zoomed version of the one on the left.
Table 10-1 The identification results using distance features obtained from Radon images of contact-free measured heartbeat signals from [45] on a subset of MAHNOB-HCI [25] con-taining 351 video sequences of 18 subjects
Measured Parameter Results
False positive identification rate 1.28 %
False negative identification rate 1.30%
True positive identification rate 98.70 %
Precision rate 80.86%
Recall rate 80.63%
Specificity 98.63%
Sensitivity 97.42%
10.5. DISCUSSIONS AND CONCLUSIONS
If the heartbeat signals are going to be used for identification purposes, they should
serve as a biometric or a soft-biometric. A biometric signal should have some spe-
cific characteristics, among others, it needs to be:
CHAPTER 10. CONTACT-FREE HEARTBEAT SIGNAL FOR HUMAN IDENTIFICATION AND FORENSICS
307
Collectible, i.e., the signal should be extractable. The ECG-based heartbeat
signal is obviously collectible, though one needs to install ECG sensors on
the body of subjects, which is not always easy, especially when subjects
are not cooperative.
Universal, i.e., everyone should have an instance of this signal. An ECG
heartbeat signal is also universal as every living human has a beating heart.
This also high-lights another advantage of heartbeat signal which liveness.
Many of the other biometrics, like face, iris, and fingerprints, can be
spoofed by printed versions of the signal, and thus need to be accompanied
by a liveness detection algorithm. Heartbeat signal however does not need
liveness detection methods [35] and is difficult to disguise [29].
Unique, i.e., instances of the signal should be different from one subject to
an-other.
Permanent, i.e., the signal should not change over time [15].
Regardless of the method used for obtaining the heartbeat signal (contact-free or
contact-based), such a signal is collectible (according to the discussions in the pre-
vious sections) and obviously universal. The identification systems that have used
the contact-based sensors (like ECG), [27]-[44] have almost all reported recognition
accuracies that are more than 90% on datasets of different sizes from 20 people in
[27] to about 100 subjects in the others. The lowest recognition rate, 76.9 %, has
been reported in [34]. The results here are however reported on a dataset of 269
subjects for which the ECG signals have been collected in different sessions. Some
of the sessions are from the same day and some are form different days. If both the
training and the testing samples are from the same day (but still different sessions)
the system report 99% recognition rate, but when the training and testing data is
coming from different sessions recorded in different days, the recognition rate drops
to 76.9% for the rank-1 recognition, but still as high as 93.5% for rank-15 recogni-
tion. This indicates that an ECG based heartbeat signal might be considered as a
biometric, though there is not that much study on the permanent dimensions of such
signals for the identification purposes, reporting their results on very large data-
bases.
On the other hands, due to the measurement techniques that contact-free meth-
ods provide for obtaining the heartbeat signals, the discriminative properties of
contact-free obtained heartbeat signals is not as high as their peer contact-based
ones. However, it is evident from the results of our recent work, which was re-
viewed in the previous section, that such signals have some discriminative proper-
ties that can be utilized for helping identification systems. In another words, a con-
tact-free obtained heartbeat signal has the potential to be used as soft-biometric.
To conclude, the contact-free heartbeat signals seem to have promising applica-
tions in forensics scenarios. First of all, because according to the above discussions
they seem to carry some distinguishing features, which can be used for identifica-

VISUAL ANALYSIS OF FACES WITH APPLICATION IN BIOMETRICS, FORENSICS AND HEALTH INFORMATICS
308
tion purposes. Furthermore, according to the discussion presented in [18] the mo-
tion based methods, which do not necessarily need to extract these signals from a
skin region, can extract the heartbeat data from the hairs of the head, or even from a
masked face. This will be of great help in many forensics scenarios, if one could
extract a biometric or even a soft-biometric from a masked face because in many
such scenarios the criminals are wearing a mask to hide their identity from, among
others, surveillance cameras.
10.6. REFERENCES
[1] Ehrlich, D., Carey, L., Chiou, J., Desmarais, S., El-Difrawy, S., Koutny, L.,
Lam, R., Matsu-daira, P., Mckenna, B., Mitnik-Gankin, L., ONeil, T., No-
votny, M., Srivastava, A., Streechon, P., and Timp, W.: MEMS-based systems
for DNA sequencing and forensics. In: Sensors, Proceedings of IEEE, vol. 1,
pp. 448-449, 2002.
[2] Lin, W.S., Tjoa, S.K., Zhao, H.V., Liu, K.J.R.: Digital image source coder
forensics via intrinsic fingerprints. In: Information Forensics and Security,
IEEE Transactions on, vol. 4, no. 3, pp. 460-475, 2009.
[3] Roussev, V.: Hashing and data fingerprinting in digital forensics. In: Security
and Privacy, IEEE, vol. 8, no. 2, pp. 49-55, 2009.
[4] Peacock, C., Goode A, and Brett A.: Automatic forensic face recognition from
digital images. In: Science and Justice, vol. 44, no. 1, pp. 29-34, 2004.
[5] Jain, A.K. and Unsang P.: Facial marks: soft biometric for face recognition.
In: Image Processing (ICIP) 16th IEEE International Conference on, pp. 37-
40, 2009.
[6] Unsang, P. and Jain, A.K.: Face matching and retrieval uses soft biometrics.
In: Information Forensics and Security, IEEE Transactions, vol. no. 3, pp.
406-415, 2010.
[7] Jain, A.K., Klare, B., Unsang P.: Face recognition: Some challenges in foren-
sics. In: Automatic Face Gesture Recognition and Workshops (FG 2011),
2011 IEEE International Confer-ence on, pp. 726-733, 2011.
[8] Han, H., Otto, C., Liu, X., and Jain, A.: Demographic estimation from face
images: human vs. machine performance. In: Pattern Analysis and Machine
Intelligence, IEEE Transactions on, vol. PP, no. 99, 2014.
[9] Wagner, J., Jonghwa K., Andre, E.:From physiological signals to emotions:
implementing and comparing selected methods for feature extraction and clas-
sification. In: Multimedia and Expo, IEEE International Conference on, pp.
940-943, 2005.

CHAPTER 10. CONTACT-FREE HEARTBEAT SIGNAL FOR HUMAN IDENTIFICATION AND FORENSICS
309
[10] Li, Lan and Chen, Jihua: Emotion Recognition Using Physiological Signals.
In: Advances in Artificial Reality and Tele-Existence, Lecture Notes in Com-
puter Science, Springer, vol. 4282, pp. 437-446, 2006.
[11] Kuriakose, S. and Sarkar, N. and Lahiri, U.: A step towards an intelligent Hu-
man Computer Interaction: Physiology-based affect-recognizer. In: Intelligent
Human Computer Interaction (IHCI), 4th International Conference on, pp. 1-6,
2012.
[12] Liao, W., Zhang, W., Zhu, Z., and Ji, Q.: A real-time human stress monitoring
system using dynamic Bayesian network. In: Computer Vision and Pattern
Recognition - Workshops, IEEE Computer Society Conference on, 2005.
[13] Zhai J., Barreto A.: Stress detection in computer users through non-invasive
monitoring of physiological signals. In: Biomedical sciences instrumentation,
vol. 42, pp: 495-500, 2006.
[14] Barreto, A., Zhai, J., and Adjouadi, M.: Non-intrusive physiological monitor-
ing for automated stress detection in human-computer interaction. In: Human-
Computer Interaction, Lecture Notes in Computer Science, Springer, vol.
4796, pp. 29-38, 2007.
[15] Van de Haar, H., Van Greunen, D., and Pottas, D.: The characteristics of a
biometric. In: Information Security for South Africa, 2013.
[16] Liu, C., Torralba, A., Freeman, W.T., and Durand, F., and Adelson, E.H.:
Motion magnification. In: ACM Trans. Graph, vol. 24, no. 3, pp. 519-526,
2005.
[17] Wu, H.Y., Rubinstein, M. Shih, E., Guttag, J., Durand, F., and William T.F.:
Eulerian video magnification for revealing subtle changes in the world. In:
ACM Transactions on Graphics, proceedings of SIGGRAPH, vol. 31, no. 4,
2012.
[18] Balakrishnan, G., Durand, F., and Guttag, J.: Detecting pulse from head mo-
tions in video. In: Computer Vision and Pattern Recognition (CVPR), IEEE
Conference on, 3430-3437, 2013.
[19] Irani, R., Nasrollahi, K., and Moeslund, T. B.: Improved pulse detection from
head motions using DCT. In: Computer Vision Theory and Applications, 9th
International Conference on, vol. 3, pp. 118-124, 2014.
[20] Poh, M.Z., McDuff, D.J., and Picard, R.: Non-contact, automated cardiac
pulse measurements using video imaging and blind source separation. In: Opt.
Express 18, pp. 10762-10774, 2010.
[21] Poh, M.Z., McDuff, D.J., and Picard, R.: Advancements in noncontact, mul-
tiparameter physiological measurements using a webcam. In: IEEE Transac-
tion on on Biomedical Engineering, vol. 58, pp. 7-11, 2011.

VISUAL ANALYSIS OF FACES WITH APPLICATION IN BIOMETRICS, FORENSICS AND HEALTH INFORMATICS
310
[22] Sarkar, A., Abbott, A.L., and Doerzaph, Z.: Assessment of psychophysiologi-
cal characteristics using heart rate from naturalistic face video data. In: Bio-
metrics (IJCB), IEEE Interna-tional Joint Conference on, 2014.
[23] Tarassenko, L., Villarroel, M., Guazzi, A., Jorge, J., Clifton, D.A., and Pugh,
C.: Non-contact video-based vital sign monitoring using ambient light and au-
toregressive models. In: Physiol Meas vol. 35, pp. 807-831, 2014.
[24] Li, X., Chen, J., Zhao, G., and Pietikainen, M.: Remote heart rate measure-
ment from face videos under realistic situations. In: Computer Vision and Pat-
tern Recognition (CVPR), IEEE Conference on, pp. 4264-4271, 2014.
[25] Soleymani, M., Lichtenauer, J., Pun, T., and Pantic, M.: A multimodal data-
base for affect recognition and implicit tagging. In: IEEE Transactions on Af-
fective Computing, vol. 3, no. 1, pp. 42-55, 2012.
[26] Hegde, C., Prabhu, H. R., Sagar, D. S., Shenoy, P. D., Venugopal, K. R., and
Patnaik, L. M.: Heartbeat biometrics for human authentication. In: Signal Im-
age Video Process., vol. 5, no. 4, pp. 485-493, Nov. 2011.
[27] Biel, L., Pettersson, O., Philipson, L., and Wide, P.: ECG analysis: a new ap-
proach in human identification. In: Instrumentation and Measurement, IEEE
Transactions on, vol. 50, no. 3, pp, 808-812, 2001.
[28] Hoekema, R., Uijen, G.J.H., and van Oosterom, A.: Geometrical aspects of the
interindividual variability of multilead ECG recordings. In: Biomedical Engi-
neering, IEEE Transactions on, vol. 48, no. 5, pp. 551-559, 2001.
[29] Israel, S.A., Irvine, J.M., Cheng A., Wiederhold, M.D., Wiederhold, B.K.:
ECG to identify individuals. In: Pattern Recognition, vol. 38, no. 1, pp. 133-
142, 2005.
[30] Wang, Y., Plataniotis, K.N., Hatzinakos, D.: Integrating analytic and appear-
ance attributes for human identification from ECG signals, In: Biometric Con-
sortium Conference, Biometrics Symposium: Special Session on Research at
the, 2006.
[31] Plataniotis, K.N., Hatzinakos, D., Lee, J.K.M.: ECG biometric recognition
without fiducial detection. In: Biometric Consortium Conference, Biometrics
Symposium: Special Session on Research at the, 2006.
[32] Singh, Y.N., Gupta, P.: ECG to individual identification, Biometrics: Theory,
Applications and Systems, 2nd IEEE International Conference on, 2008.
[33] Fatemian, S.Z., Hatzinakos, D.: A new ECG feature extractor for biometric
recognition. In: Digital Signal Processing, 2009 16th International Conference
on, 2009.
[34] Odinaka, I., Po-Hsiang, L., Kaplan, A.D., O’Sullivan, J.A., Sirevaag, E.J.,
Kristjansson, S.D., and Sheffield, A.K., Rohrbaugh, J.W.: ECG biometrics: A
CHAPTER 10. CONTACT-FREE HEARTBEAT SIGNAL FOR HUMAN IDENTIFICATION AND FORENSICS
311
robust short-time frequency analysis. In: Information Forensics and Security
(WIFS), IEEE International Workshop on, 2010.
[35] Coutinho, D.P., Fred, A.L.N., Figueiredo, M.A.T.: One-lead ECG-based per-
sonal identification using Ziv-Merhav cross parsing. In: Pattern Recognition
(ICPR), 20th International Conference on, pp. 3858-3861, 2010.
[36] Can, Y., Coimbra, M.T., Kumar, B.V.K.V.: Investigation of human identifica-
tion using two-lead Electrocardiogram (ECG) signals. In: Biometrics: Theory
Applications and Systems (BTAS), Fourth IEEE International Conference on,
2010.
[37] Islam, M.S., Alajlan, N., Bazi, Y., and Hichri, H.S.: HBS: A novel biometric
feature based on heartbeat morphology. In: Information Technology in Bio-
medicine, IEEE Transactions on, vol. 16, no. 3, pp. 445-453, 2012.
[38] Tantawi, M., Revett, K., Tolba, M.F., Salem, A.: A novel feature set for de-
ployment in ECG based biometrics. In: Computer Engineering Systems
(ICCES), 7th International Conference on, pp. 186-191, 2012.
[39] Wang, J., She, M., Nahavandi, S., Kouzani, A.: Human identification from
ECG signals via sparse representation of local segments, Signal Processing
Letters, IEEE, vol. 20, no. 10, pp. 937-940, 2013.
[40] Fratini, A., Sansone, M., Bifulco, P., Romano, M., Pepino, A., Cesarelli, M.,
and D’Addio, G.: Individual identification using electrocardiogram morpholo-
gy. In: Medical Measurements and Applications Proceedings (MeMeA), 2013
IEEE International Symposium on, pp. 107-110, 2013.
[41] Rabhi, E., Lachiri, Z.: Biometric personal identification system using the ECG
signal. In: Computing in Cardiology Conference (CinC), pp. 507-510, 2013.
[42] Ming, L., Xin, L.: Verification based ECG biometrics with cardiac irregular
conditions using heartbeat level and segment level information fusion. In:
Acoustics, Speech and Signal Processing (ICASSP), IEEE International Con-
ference on, pp. 3769-3773, 2014.
[43] Lourenco, A., Carreiras, C., Silva, H., Fred, A.: ECG biometrics: A template
selection approach. In: Medical Measurements and Applications (MeMeA),
IEEE International Symposium on, 2014.
[44] Nomura, R., Ishikawa, Y., Umeda, T., Takata, M., Kamo, H., Joe, K.: Biomet-
rics authentication based on chaotic heartbeat waveform, In: Biomedical Engi-
neering International Conference (BMEiCON), 2014.
[45] Haque, M.A., Nasrollahi, K., and Moeslund, T.B.: Heartbeat signal from facial
video for biometric recognition. In: 19th Scandinavian Conference on Image
Analysis, Proceedings of, 2015.

VISUAL ANALYSIS OF FACES WITH APPLICATION IN BIOMETRICS, FORENSICS AND HEALTH INFORMATICS
312

313
PART VI
DECISION SUPPORT SYSTEM FOR
HEALTHCARE

315
CHAPTER 11. CONSTRUCTING FACIAL
EXPRESSION LOG FROM VIDEO
SEQUENCES USING FACE QUALITY
ASSESSMENT
Mohammad Ahsanul Haque, Kamal Nasrollahi, and Thomas B. Moeslund
This paper has been published in the
Proceedings of the 9th
International Conference on Computer Vision Theory and
Applications (VISAPP)
pp. 517-525, 2014
© 2014 IEEE
The layout has been revised.


317
11.1. ABSTRACT
Facial expression logs from long video sequences effectively provide the opportuni-
ty to analyse facial expression changes for medical diagnosis, behaviour analysis,
and smart home management. Generating facial expression log involves expression
recognition from each frame of a video. However, expression recognition perfor-
mance greatly depends on the quality of the face image in the video. When a facial
video is captured, it can be subjected to problems like low resolution, pose varia-
tion, low brightness, and motion blur. Thus, this chapter proposes a system for
constructing facial expression log by employing a face quality assessment method
and investigates its influence on the representations of facial expression logs of
long video sequences. A framework is defined to incorporate face quality assess-
ment with facial expression recognition and logging system. While assessing the
face quality a face-completeness metric is used along with some other state-of-the-
art metrics. Instead of discarding all of the low quality faces from a video sequence,
a windowing approach has been applied to select best quality faces in regular in-
tervals. Experimental results show a good agreement between the expression logs
generated from all face frames and the expression logs generated by selecting best
faces in regular intervals.
11.2. INTRODUCTION
Facial analysis systems now-a-days have been employed in many applications in-
cluding surveillance, medical diagnosis, biometrics, expression recognition and
social cue analysis (Cheng, 2012). Among these, expression recognition received
remarkable attention in last few decades after an early attempt to automatically
analyse facial expressions by (Suwa, 1978).
In general, human facial expression can express emotion, intension, cognitive
processes, pain level, and other inter- or intrapersonal meanings (Tian, 2011). For
example, Figure 11-1 depicts five emotion-specified facial expressions (neutral,
anger, happy, surprise, and sad) of a person’s image from a database of (Kanade,
2000). When facial expression conveys emotion and cognitive processes, facial
expression recognition and analysis systems find their applications in medical diag-
nosis for diseases like delirium and dementia, social behaviour analysis in meeting
rooms, offices or classrooms, and smart home management (Bonner, 2008, Busso,
2007, Dong, 2010, Doody, 2013, Russell, 1987). However these applications often
require analysis of facial expressions acquired from videos in a long time-span. A
facial expression log from long video sequences can effectively provide this oppor-
tunity to analyse facial expression changes in a long time-span. Examples of facial
expression logs for four basic expressions found in an example video sequence are
shown in Figure 11-2, where facial expression intensities (0-100), assessed by an
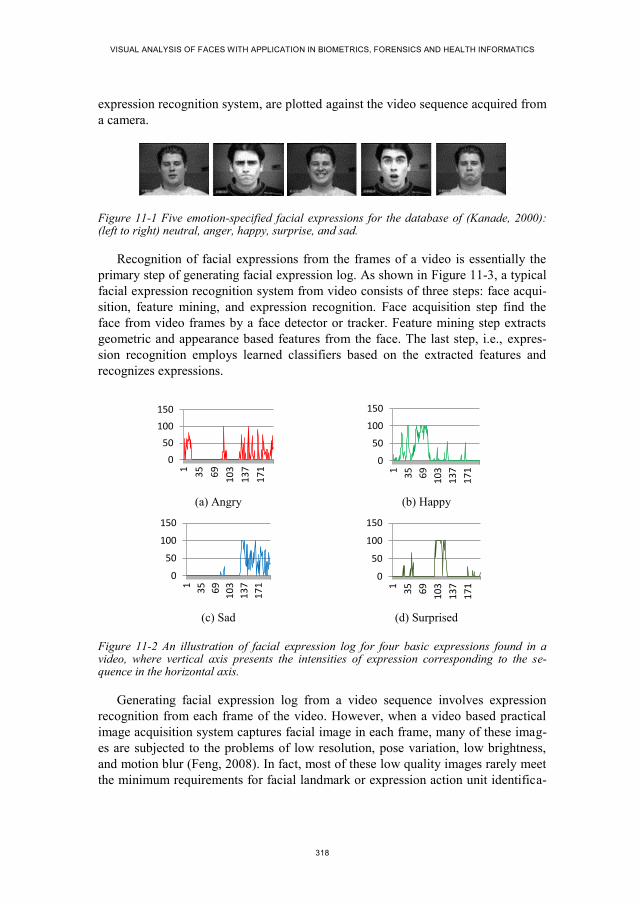
VISUAL ANALYSIS OF FACES WITH APPLICATION IN BIOMETRICS, FORENSICS AND HEALTH INFORMATICS
318
expression recognition system, are plotted against the video sequence acquired from
a camera.
Figure 11-1 Five emotion-specified facial expressions for the database of (Kanade, 2000): (left to right) neutral, anger, happy, surprise, and sad.
Recognition of facial expressions from the frames of a video is essentially the
primary step of generating facial expression log. As shown in Figure 11-3, a typical
facial expression recognition system from video consists of three steps: face acqui-
sition, feature mining, and expression recognition. Face acquisition step find the
face from video frames by a face detector or tracker. Feature mining step extracts
geometric and appearance based features from the face. The last step, i.e., expres-
sion recognition employs learned classifiers based on the extracted features and
recognizes expressions.
(a) Angry (b) Happy
(c) Sad (d) Surprised
Figure 11-2 An illustration of facial expression log for four basic expressions found in a video, where vertical axis presents the intensities of expression corresponding to the se-quence in the horizontal axis.
Generating facial expression log from a video sequence involves expression
recognition from each frame of the video. However, when a video based practical
image acquisition system captures facial image in each frame, many of these imag-
es are subjected to the problems of low resolution, pose variation, low brightness,
and motion blur (Feng, 2008). In fact, most of these low quality images rarely meet
the minimum requirements for facial landmark or expression action unit identifica-
0
50
100
150
1
35
69
10
3
13
7
17
1
0
50
100
150
1
35
69
10
3
13
7
17
1
0
50
100
150
1
35
69
10
3
13
7
17
1
0
50
100
150
1
35
69
10
3
13
7
17
1

ERROR! NO TEXT OF SPECIFIED STYLE IN DOCUMENT.. ERROR! NO TEXT OF SPECIFIED STYLE IN DOCUMENT.
319
tion. For example, a face region with size 96x128 pixels or 69x93 pixels can be
used for expression recognition. However, a face region with size 48x64 pixels,
24x32 pixels, or less is not likely to be used for expression recognition (Tian,
2011). This state of affairs can often be observed in scenarios where facial expres-
sion log is used from a patient’s video for medical diagnosis, or from classroom
video for social cue analysis. Extracting features for expression recognition from a
low quality face image often ends up with erroneous outcome and wastage of valu-
able computation resource.
Figure 11-3 Steps of a typical facial expression recognition system.
In order to get rid of the problem of low quality facial image processing, a face
quality assessment technique can be employed to select the qualified faces from a
video. As shown in Figure 11-4, a typical face quality assessment method consists
of three steps: video frame acquisition, face detection in the video frames using a
face detector or tracker, face quality assessment by measuring face quality metrics
(Mohammad, 2013). Face quality assessment in video before further application
reduces significant amount of disqualified faces and keeps the best faces for subse-
quent processing. Thus, in this chapter, we propose a facial expression log construc-
tion system by employing face quality assessment and investigate the influence of
Face Quality Assessment (FQA) on the representation of facial expression logs of
long video sequences.
The rest of the chapter is organized as follows: Section three presents the state-
of-the-art and Section four describes the proposed approach. Section five states the
experimental environment and results. Section six concludes the chapter.
11.3. STATE-OF-THE-ARTS
The first step of facial expression recognition is facial image acquisition, which is
accomplished by employing a face detector or tracker. Real-time face detection
from video was a very difficult problem before the introduction of Haar-like feature
based Viola and Jones object detection framework (Viola, 2001). Lee et al. and
Ahmed et al. proposed two face detection methods based on saliency map (Lee,
2011, Ahmad, 2012). However, these methods, including the Viola and Jones one,
Face acquisition
from video
Feature min-
ing
Expression
Recognition

VISUAL ANALYSIS OF FACES WITH APPLICATION IN BIOMETRICS, FORENSICS AND HEALTH INFORMATICS
320
merely work real-time for low resolution images. Thus, few methods address the
issues of high resolution face image acquisition by employing high resolution cam-
era or pan-tilt-zoom camera (Chang, 2012, Dinh, 2011). On the other hand, some
methods addressed the problem by speeding up the face detection procedure in a
high resolution image (Mustafa, 2007, 2009). When a face is detected in a video
frame, instead of detecting the face in further frames of that video clip, it can be
tracked. Methods for tracking face in video frames from still cameras and active
pan-tilt-zoom cameras are proposed in (Corcoran, 2007) and (Dhillon, 2009, and
Dinh, 2009), respectively.
Figure 11-4 Steps of a typical facial image acquisition system with face quality
measure.
A number of methods proposed for face quality assessment and/or face logging.
Nasrollahi et al. proposed a face quality assessment system in video sequences by
using four quality metrics: resolution, brightness, sharpness, and pose (Nasrollahi,
2008). Mohammad et al. utilized face quality assessment while capturing video
sequences from an active pan-tilt-zoom camera (Mohammad, 2013). In (Axnick,
2009, Wong, 2011), two face quality assessment methods have been proposed in
order to improve face recognition performance. Instead of using threshold based
quality metrics, (Axnick, 2009) used a multi-layer perceptron neural network with a
face recognition method and a training database. The neural network learns effec-
tive face features from the training database and checks these features from the
experimental faces to detect qualified candidates for face recognition. On the other
hand, Wong et al. used a multi-step procedure with some probabilistic features to
detect qualified faces (Wong, 2011). Nasrollahi et al. explicitly addressed posterity
facial logging problem by building sequences of increasing quality face images
from a video sequence (Nasrollahi, 2009). They employed a method which uses a
fuzzy combination of primitive quality measures instead of a linear combination.
This method was further improved in (Bagdanov, 2012) by incorporating multi-
target tracking capability along with a multi-pose face detection method.
A number of complete facial expression recognition methods have been pro-
posed in the literature. Most of the methods, however, merely attempt to recognize
Further Pro-
cessing
Images from
Video Frames
Face Detection from
the Frames
Face Quality Assessment and
Selecting Best Faces

ERROR! NO TEXT OF SPECIFIED STYLE IN DOCUMENT.. ERROR! NO TEXT OF SPECIFIED STYLE IN DOCUMENT.
321
few most frequently occurred expressions such as angry, sad, happy, and surprise
(Tian, 2011). In order to recognize facial expressions, some methods merely used
geometric features (Cohn, 2009), some methods merely used appearance features
(Bartlett, 2006), and some methods used both (Wen, 2003). While classifying the
expressions from the extracted features, most of the well-known classifiers have
been tested in the literature. These include neural network (NN), support vector
machines (SVM), linear discriminant analysis (LDA), K-nearest neighbour (KNN),
and hidden Markov models (HMM) (Tian, 2011).
11.4. THE PROPOSED APPROACH
A typical facial expression logging system from video consists of four steps: face
acquisition, feature mining, expression recognition, and log construction. On the
other hand, a typical FQA method in video consists of three steps: video frame
acquisition, face detection in the video frames using a face detector or tracker, FQA
by measuring face quality metrics. However, as discussed in introduction section,
the performance of feature mining and expression recognition highly depends on
the quality of the face region in video frames. Thus, in this chapter, we proposed an
approach to combine a face quality assessment method with a facial expression
logging system. The overall idea of combining these two approaches into one is
depicted in Figure 11-5. Before passing the face region of video frames to the fea-
ture extraction module, the FQA module discards the non-qualified faces. The ar-
chitecture of the proposed system is depicted in Figure 11-6 and described in the
following subsections.
Figure 11-5 Face quality is assessed before feature extraction is attempted for ex-
pression recognition.
11.4.1. FACE DETECTION MODULE
This module is responsible to detect face in the image frames. The well-known
Viola and Jones face detection approach has been employed from (Viola, 2001).
This method utilizes so called Haar-like features in a linear combination of some
weak classifiers to form a strong classifier to perform a face and non-face classifica-
tion by using an adaptive boosting method. In order to speed up the detection pro-
cess an evolutionary pruning method from (Jun-Su, 2008) is employed to form
Face de-
tection
Feature
extraction
Expression
recognition
Face quality
assessment

VISUAL ANALYSIS OF FACES WITH APPLICATION IN BIOMETRICS, FORENSICS AND HEALTH INFORMATICS
322
strong classifiers using fewer classifiers. In the implementation of the proposed
approach, the face detector was empirically configured using the following con-
stants:
Minimum search window size: 40x40 pixels in the initial camera frames
The scale change step: 10% per iteration
Merging factor: 2 overlapping detections
The face detection module continuously runs and tries to detect face in the video
frames. Once a face is detected, it is passed to the Face Quality Assessment (FQA)
module.
11.4.2. FACE QUALITY ASSESSMENT MODULE
FQA module is responsible to assess the quality of the extracted faces. Four param-
eters that can effectively determine the face quality have been selected in (Nasrol-
lahi, 2008) for surveillance applications. These parameters are: out-of-plan face
rotation (pose), sharpness, brightness, and resolution. All these metrics have re-
markable influence in expression recognition. However, the difference between a
typical surveillance application and an expression logging system entails explora-
tion of some other face quality metrics. For example, face completeness can be an
important measure for face quality assessment before expression recognition. This
is because features for expression recognition are extracted from different compo-
nents of a face, more specifically from eyes and mouth. If a facial image doesn’t
clearly contain these components, it is difficult to measure expressions. Thus, we
calculate a face completeness parameter, along with four other parameters from
(Nasrollah, 2008), by detecting the presence of the eyes and the mouth in a facial
image. A normalized score is obtained in the range of [0:1] for each quality param-
eter and a linear combination of scores has been utilized to generate single score.
The basic calculation process of some FQA parameters is described in (Mo-
hammad, 2013). We, however, include a short description below for the readers’
interest by incorporating necessary changes to fit these mathematical models with
the requirement of constructing facial expression log.
Pose estimation - Least out-of-plan rotated face: The face ROI (Region of
Interest) is first converted into a binary image and the center of mass is cal-
culated using:
A
jiibx
n
i
m
j
m
,1 1
(1)

ERROR! NO TEXT OF SPECIFIED STYLE IN DOCUMENT.. ERROR! NO TEXT OF SPECIFIED STYLE IN DOCUMENT.
323
A
jijby
n
i
m
j
m
,1 1
(2)
Figure 11-6 The block diagram of the proposed facial expression log construction
system with face quality assessment.
Frames from
Camera
Face Detection from
the Frames
Face Detection
Extracted Faces from the
Tracked Area
Selecting & Storing
Best Faces after FQA
Face Quality Assessment (FQA)
Feature extraction from
the qualified faces
Expression recognition
using extracted features
Facial Expression Recognition
Facial expression log
Camera capture

VISUAL ANALYSIS OF FACES WITH APPLICATION IN BIOMETRICS, FORENSICS AND HEALTH INFORMATICS
324
Then, the geometric center of face region is detected and the distance be-
tween the center of region and the center of mass is calculated by:
22 )()( mcmc yyxxDist (3)
Finally the normalized score is calculated by:
Dist
DistP Th
Pose
(4)
Where mm yx ,
is the center of mass, b is the binary face image, m is the
width, n is the height, A is the area of the image, x1, x2 and y1, y2 are the
boundary coordinates of the face, and DistTh is an empirical threshold used in
(Mohammad, 2013).
Sharpness: Sharpness of a face image can be affected by motion blur or an
unfocused capture. This can be measured by:
yxlowAyxAabsSharp ,, (5)
Sharpness’s associated score is calculated by:
Th
SharpSharp
SharpP
(6)
Where, lowA(x,y) is the low-pass filtered counterpart of the image A(x,y),
and SharpTh is an empirical threshold used in (Mohammad, 2013).
Brightness: This parameter measures whether a face image is too dark to
use. It is calculated by the average value of the illumination component of all
pixels in an image. Thus, the brightness of a frame is calculated by (6),
where I(i,j) is the intensity of pixels in the face image.
nm
jiIBright
n
i
m
j
*
,1 1
(7)
Brightness’s associated score is calculated by:
Th
BrightBright
BrightP
(8)

ERROR! NO TEXT OF SPECIFIED STYLE IN DOCUMENT.. ERROR! NO TEXT OF SPECIFIED STYLE IN DOCUMENT.
325
Where, BrightTh is an empirical threshold used in (Mohammad, 2013).
Image size or resolution: Depending upon the application, face images with
higher resolution may yield better results than lower resolution faces
(Axnick, 2009, Long, 2011). The score for image resolution is calculated by
(10), where w is image width, h is image height, Widthth and Heightth are two
thresholds for expected face height and width, respectively. From the study
of (Nasrollahi, 2008), we selected the values of the thresholds 50 and 60, re-
spectively.
thth
SizeHeight
h
Width
wP ,1min
(9)
Face completeness: This parameter measures whether the key face compo-
nents for expression recognition can be detected automatically from the face.
In this study, we selected eyes and mouth region as the key components of
face and obtain the score using the following rule:
leidentifiabarecomponentsif
leidentifiabnotarecomponentsifssCompleteneP ,1
,0 (10)
The final single score for each face is calculated by linearly combining the
abovementioned 5 quality parameters with empirically assigned weight factor, as
shown in (10):
4
1
4
1
i i
i ii
Score
w
PwQuality
(11)
Where, wi are the weight associated with Pi, and Pi are the score values for the pa-
rameters pose, sharpness, brightness, resolution, and completeness consecutively.
Finally, the best quality faces are selected by observing the QualityScore. The detail
procedure of selection the best faces for expression logging is described in the fol-
lowing section.
11.4.3. FACIAL EXPRESSION RECOGNITION AND LOGGING
This module recognizes facial expressions from consecutive video frames and plots
the expression intensities against time in separate graphs for different expressions.
In this chapter, we use an off-the-shelf expression recognition technique from (Ku-
blbeck, 2006), which is implemented in SHORE library (Fraunhofer IIS, 2013). An
appearance based modified census transformation is used in this method for face
detection and expression intensity measurement. In fact, the eye-region, nose-region

VISUAL ANALYSIS OF FACES WITH APPLICATION IN BIOMETRICS, FORENSICS AND HEALTH INFORMATICS
326
and mouth region represent the expression variation in face appearance, as shown in
Figure 11-6. Changes in patterns of these regions are obtained by employing the
transformation. Four frequently occurred expressions are measured by this system:
angry, happy, sad, and surprize.
The next step after expression recognition is the construction of facial expres-
sion log. Four graphs are created for four expressions from a video sequence. As
generating expression log from the faces of consecutive frames of a video suffers
significantly due to erroneous expression recognition from low quality faces from
the video frames, generating log by merely using the high quality faces can be a
solution. However, discarding low quality face frames from video generate discon-
tinuity in the expression log, especially if a large number of consecutive face frames
contain low quality face. Thus, we employed a windowing approach in order to
ensure continuity of the expression log while assuring an acceptable similarity with
the expression log from all faces and expression log from qualified faces. The ap-
proach works by selecting the best face among n consecutive faces, where n is the
window size indicating the number of video frames in each window. When plotting
the expression intensities into the corresponding graphs of the expressions, instead
of plotting values for all face frames, the proposed approach merely plots the value
for the best face frame in each window. The effect of discarding the expression
intensity score for other frames of the window is shown in the experimental result
section.
11.5. EXPERIMENTAL RESULTS
11.5.1. EXPERIMENTAL ENVIRONMENT
The underlying algorithms of the experimental system were implemented in a com-
bination of Visual C++ and Matlab environments. As the existing online datasets
merely contain images or videos of good quality faces rather than mixing of good
and bad quality faces, to evaluate the performance of the proposed approach we
recorded several video sequences from different subjects by using a camera setup.
Faces were extracted from the frames of 8 experimental video clips (named as, Sq1,
Sq2, Sq3, Sq4, Sq5, Sq6, Sq7, and Sq8) having 1671 video frames, out of which 950
frames contain detectable faces with different facial expressions.
Face quality assessment and expression recognition were performed to generate
the results. Four basic expressions were used for recognition: happy, angry, sad, and
surprise. Two types of facial expression logs were generated: first type shows the
facial expression intensities of each face frames of video (Type1), and the other
type shows the facial expression intensities of the best faces in each consecutive
window with n-frames of the video (Type2). In order to compare Type1 and Type2
representations, we calculate normalized maximum cross-correlation magnitudes of

ERROR! NO TEXT OF SPECIFIED STYLE IN DOCUMENT.. ERROR! NO TEXT OF SPECIFIED STYLE IN DOCUMENT.
327
both graphs for each expression (Briechle, 2001). Higher magnitude implies more
similarity between the graphs.
11.5.2. PERFORMANCE EVALUATION
The experimental video clips were passed through the face detection module and
face quality metrics were calculated after detecting faces. As an example, Figure
11-7 shows the QualityScore for each face frames of the video sequence Sq1, where
the score is plotted against the video frame index. From the figure it is observed that
some of the faces may exhibit poor quality score as low as 40%. If these low quality
faces are sent to the expression recognition module the recognition performance
will be significantly suffered.
Figure 11-7 Face quality score calculated by the FQA module for 200 face frame of
experimental video sequence Sq1.
Facial expression recognition module measures the intensity of each facial ex-
pression for each face of the frames of a video, and then facial expression logs were
generated. Figure 11-8 illustrates two types of expression logs for the experimental
video sequence Sq1, where the window size n was set to 3 for selecting best faces.
The graphs at the left of each rows of Figure 11-8 present the Type1 graph and the
graphs at the right presents corresponding Type2 graph. When we visually analysed
and compared Type1 and Type2 graphs, we observed temporal similarity between
these two facial expression logs from the same video sequence due to the applica-
tion of windowing approach.
In order to formalize this observation, we showed a normalized maximum cross-
correlation magnitude similarity measure between these two representations of the
0
0,1
0,2
0,3
0,4
0,5
0,6
0,7
0,8
0,9
1
13
25
37
49
61
73
85
97
10
9
12
1
13
3
14
5
15
7
16
9
18
1
19
3
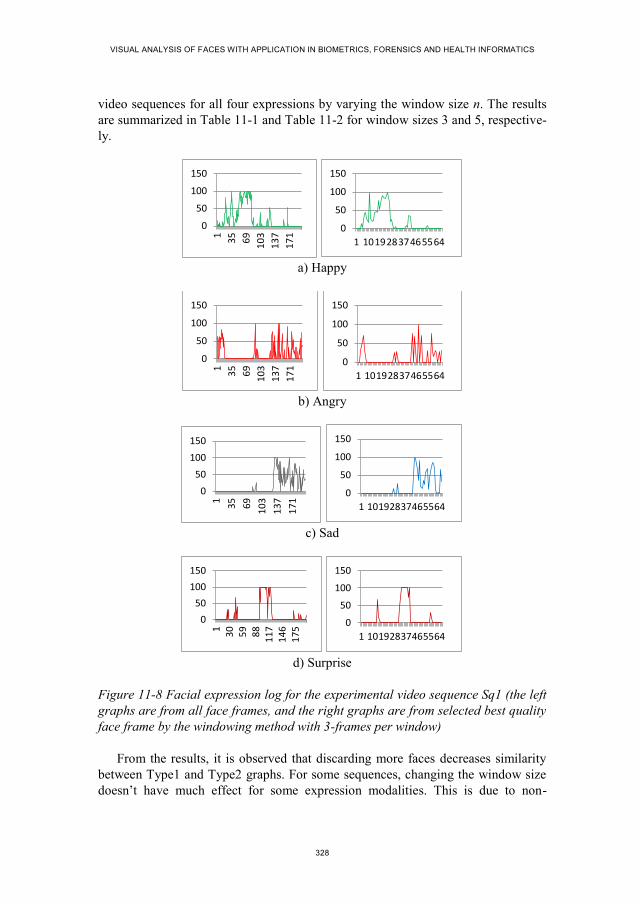
VISUAL ANALYSIS OF FACES WITH APPLICATION IN BIOMETRICS, FORENSICS AND HEALTH INFORMATICS
328
video sequences for all four expressions by varying the window size n. The results
are summarized in Table 11-1 and Table 11-2 for window sizes 3 and 5, respective-
ly.
a) Happy
b) Angry
c) Sad
d) Surprise
Figure 11-8 Facial expression log for the experimental video sequence Sq1 (the left
graphs are from all face frames, and the right graphs are from selected best quality
face frame by the windowing method with 3-frames per window)
From the results, it is observed that discarding more faces decreases similarity
between Type1 and Type2 graphs. For some sequences, changing the window size
doesn’t have much effect for some expression modalities. This is due to non-
0
50
100
150
1
35
69
10
3
13
7
17
1
0
50
100
150
1 10192837465564
0
50
100
150
1
35
69
10
3
13
7
17
1
0
50
100
150
1 10192837465564
0
50
100
150
1
35
69
10
3
13
7
17
1
0
50
100
150
1 10192837465564
0
50
100
150
13
05
98
81
17
14
61
75
0
50
100
150
1 10192837465564

ERROR! NO TEXT OF SPECIFIED STYLE IN DOCUMENT.. ERROR! NO TEXT OF SPECIFIED STYLE IN DOCUMENT.
329
variable expression in these video sequences. However, in order to keep agreement
with other modalities, the window size should be kept same. For example, in Sq3
the results for the expressions of happiness, sadness and surprise aren’t affected
much by the change of window size. Moreover, some expression exhibited very
high dissimilarity even for a very small window size. This is because the expression
in that video sequence changed very rapidly, and thus discarding face frame dis-
cards expression intensity values too. On the other hand, discarding more faces by
setting a higher window size reduces the computational power consumption geo-
metrically. Thus, the window size should be defined depending upon the applica-
tion the expression log is going to be used.
Table 11-1 Similarity between Type1 and Type2 graphs, when window size is 3 (higher value implies more similarity).
Angry Happy Sad Surprise Average
Sq1 0.60 0.94 0.80 0.90 0.81
Sq2 0.81 0.97 1.00 0.77 0.89
Sq3 0.70 0.99 1.00 1.00 0.92
Sq4 0.52 0.97 1.00 1.00 0.87
Sq5 0.62 0.99 1.00 1.00 0.90
Average similarity for n=3 0.88
Table 11-2 Similarity between Type1 and Type2 graphs, when window size is 5 (higher value implies more similarity).
Angry Happy Sad Surprise Average
Sq1 0.31 0.54 0.49 0.53 0.47
Sq2 0.44 0.50 1.00 0.46 0.60
Sq3 0.57 1.00 1.00 1.00 0.89
Sq4 1.00 0.46 1.00 1.00 0.86
Sq5 1.00 0.46 1.00 1.00 0.86
Average similarity for n=5 0.73

VISUAL ANALYSIS OF FACES WITH APPLICATION IN BIOMETRICS, FORENSICS AND HEALTH INFORMATICS
330
11.6. CONCLUSIONS
This chapter proposed a facial expression log construction system by employing
face quality assessment and investigated the influence of face quality assessment on
the representation of facial expression logs of long video sequences. A step by step
procedure was defined to incorporate face quality assessment with facial expression
recognition system and finally the facial expression logs were generated. Instead of
discarding all of the low quality faces, a windowing approach was applied to select
best quality faces in a regular interval. Experimental results shows a good agree-
ment between expression logs generated from all face frames and expression logs
generated by selecting best faces in a regular interval.
As the future works, we will analyse the face quality assessment metrics indi-
vidually and their impact on facial expression recognition. In the construction of
facial expression log, a formal model needs to define by addressing the questions
such as how to address discontinuity of face frame while making the log, how to
improve face quality assessment, how to select optimum window size for discarding
non-qualified face frames, how to include motion information for missing face
frames while generating face log.
11.7. REFERENCES
[1] Ahmed, E. L., Rara, H., Farag, A., and Womble, P., 2012. “Face Detection at a
distance using saliency maps,” IEEE Conf. on Computer Vision and Pattern
Recogntion Workshops, pp. 31-36.
[2] Axnick, K., Jarvis, R., and Ng, K. C., 2009. “Using Face Quality Ratings to
Improve Real-Time Face Recognition,” Proc. of the 3rd
Pacific Rim Symposi-
um on Advances in Image and Video Technology, pp. 13-24.
[3] Bagdanov, A. D., and Bimbo, A. D., 2012. “Posterity Logging of Face Image-
ry for Video Surveillance,” IEEE MultiMedia, vol. 19, no. 4, pp. 48-59.
[4] Barlett, M., Littlewort, G., Frank, M., Lainscsek, C., Fasel, I., and Movellan,
J., 2006. “Fully Automatic Facial Action Recognition in Spontaneous Behav-
ior,” 7th
Int. COnf. on Automatic Face and Gesture Recogntion, pp. 223-230.
[5] Bonner, M. J. et al., 2008. “Social Functioning and Facial Expression Recog-
nition in Survivors of Pediatric Brain Tumors”, Journal of Pediatric Psychol-
ogy, vol. 33, no. 10, pp. 1142-1152, 2008.
[6] Briechle, K., and Hanebeck, U. D., 2001. “Template Matching using Fast
Normalized Cross Correlation,” Proc. of SPIE Aero Sense Symposium, vol.
43-87, pp. 1-8.

ERROR! NO TEXT OF SPECIFIED STYLE IN DOCUMENT.. ERROR! NO TEXT OF SPECIFIED STYLE IN DOCUMENT.
331
[7] Busso, C., Narayanan, S. S., 2007. “Interrelation between Speech and Facial
Gestures in Emotional Utterances: A single subject study”, IEEE Trans. On
Audio, Speech and Language Processing, pp. 1-16.
[8] Cheng, X., Lakemond, R., Fookes, C., and Sridharan, S., 2012. “Efficient
Real-Time Face Detection For High Resolution Surveillance Applications,”
Proc. Of the 6th
Int. Conf. on Signal Processing and Communication Systems,
pp.1-6.
[9] Cohn, J., Kreuz, T., Yang, Y., Nguyen, M., Padilla, M., Zhou, F., and Fernan-
do, D., 2009, “Detecting depression from facial action and vocal prosody,”
Proc. of the Int. Conf. on Affective Computing and Intelligent Interaction.
[10] Corcoran, P., Steingerg, E., Bigioi, P., and Brimbarean, A., 2007. “Real-Time
Face Tracking in a Digital Image Acquisition Device,” European Patent No.
EP 2 052 349 B1, pp. 25.
[11] Dhillon, P. S., 2009. “Robust Real-Time Face Tracking Using an Active Cam-
era,” Advances in Intellignet and Soft Computing: Computational Intelligences
in Security for Information Systems, vol. 63, pp. 179-186.
[12] Dinh, T., Yu, Q., and Medioni, G., 2009. “Real Time Tracking using an Ac-
tive Pan-Tilt-Zoom network Camera,” Proc. of the Int. Conf. on Intelligent
Robots and Systems, pp. 3786-3793.
[13] Dinh, T. B., Vo, N., and Medioni, G., 2011. “High Resolution Face Sequences
from a PTZ Network Camera,” Proc. of the IEEE Int. Conf. on Automatic
Face & Gesture Recognition and Workshops, pp. 531-538.
[14] Dong, G., and Lu, S., 2010. “The relation of expression recognition and affec-
tive experience in facial expression processing: an event-related potential
study,” Psychology Research and Behavior Management, vol. 3, pp. 65-74.
[15] Doody, R. S., Stevens, J. C., Beck, C., et al. 2013, “Practice parameter: Man-
agement of dementia (an evidence-based review): Report of the quality stand-
ards subcommittee of the American Academy of Neurology,” Neurology, pp.
1-15.
[16] Fang, S. et al., 2008. “Automated Diagnosis of Fetal Alcohol Syndrome Using
3D Facial Image Analysis,” Orthodontics & Craniofacial Research, vol. 11,
no. 3, pp. 162-171.
[17] Fraunhofer IIS, 2013. “Sophisticated High-speed Object Recognition Engine,”
www.iis.fraunhofer.de/shore.
[18] Jun-Su, J., and Jong-Hwan, K., “Fast and Robust face Detection using Evolu-
tionary Prunning,” IEEE Trans. On Evolutionary Computation, vol. 12, no. 5,
pp. 562-571, 2008.

VISUAL ANALYSIS OF FACES WITH APPLICATION IN BIOMETRICS, FORENSICS AND HEALTH INFORMATICS
332
[19] Kanade, T., Cohn, J., Tian, Y. L., 2000. “Comprehensive database for facial
expression analysis,” Proc. of the Int. Conf. on Face and Gesture Recognition,
pp. 46-53.
[20] Kublbeck, C., and Ernst, A., 2006. “Face detection and tracking in video se-
quences using the modified census transformation,” Image and Vision Compu-
ting, vol. 24, no. 6, pp. 564-572.
[21] Lee, Y. B., and Lee, S., 2011. “Robust Face Detection Based on Knowledge
Directed Specification of Bottom-Up Saliency,” ETRI Journal, vol. 33, no. 4,
pp. 600-610.
[22] Mohammad, A. H., Nasrollahi, K., and Moeslund, T. B., 2013. “Real-Time
Acquisition of High Quality Face Sequences From an Active Pan-Tilt-Zoom
Camera,” Proc. of the Int. Conf. on Advanced Video and Surveillance Systems,
pp. 1-6.
[23] Mustafah, Y. M., Shan, T., Azman, A. W., Bigdeli, A., and Lovell, B. C.,
2007. “Real-Time Face Detection and Tracking for High Resolution Smart
Camera System,” Proc. Of the 9th
Biennial Conf. on Digital Image Computing
Techniques and Applications, pp. 387-393.
[24] Mustafah, Y. M., Bigdeli, A., Azman, A. W., and Lovell, B. C., 2009. “Face
Detection System Design for Real-Time High Resolution Smart Camera,”
Proc. Of the 3rd
ACM/IEEE Int. Conf. on Distributed Smart Cameras, pp. 1-6.
[25] Nasrollahi, K., and Moeslund, T. B., 2008. “Face Quality Assessment System
in Video Sequences,” 1st European Workshop on Biometrics and Identity
Management, Springer-LNCS, vol. 5372, pp. 10-18.
[26] Nasrollahi, K., and Moeslund, T. B., 2009. “Complete face logs for video
sequences using face quality measures,” IET Signal Porcessing, vol. 3, no. 4.
Pp. 289-300, DOI 10.1049/iet-spr.2008.0172.
[27] Russell, A. J., and Fehr, B., 1987, “Relativity in the Perception of Emotion in
Facial Expressions” Journal of Experimental Psychology, vol. 116, no.3, pp.
223-237.
[28] Suwa, M., Sugie, N., and Fujimora, K., 1978. “A preliminary note on pattern
recognition of human emotional expression,” Proc. of the Int. Joint Conf. on
Pattern Recognition, pp. 408-410.
[29] Tian, Y., Kanade, T., and Cohn, J. F., 2011. “Facial Experssion Recognition,”
Handbook of Face Recognition, Chapter 19, pp. 487-519.
[30] Viola, P., and Jones, M., 2001 “Robust real-time face detection,” Proc. Of the
8th
IEEE Int. Conf. on Computer Vision, pp. 747.
[31] Wen, Z., and Huang, T., 2003. “Capturing subtle facial motions in 3D face
tracking,” Proc. of the Int. Conf. on Computer Vision.

ERROR! NO TEXT OF SPECIFIED STYLE IN DOCUMENT.. ERROR! NO TEXT OF SPECIFIED STYLE IN DOCUMENT.
333
[32] Wong, Y., Chen, S., Mau, S., Sanderson, C., and Lovell, B. C., 2011. “Patch-
based Probabilistic Image Quality Assessment for Face Selection and Im-
proved Video-based Face Recognition,” Proc. of the IEEE Conf. on Computer
Vision and Pattern Recognition Workshops, pp. 74-81.

MO
HA
MM
AD
AH
SAN
UL H
AQ
UE
VISUA
L AN
ALYSIS O
F FAC
ES WITH
APPLIC
ATION
IN
BIO
METR
ICS, FO
REN
SICS A
ND
HEA
LTH IN
FOR
MATIC
S
ISSN (online): 2246-1248ISBN (online): 978-87-7112-562-7