Aalborg Universitet Revitalizing the “civic” and “ethnic” distinction...
41
Aalborg Universitet Revitalizing the “civic” and “ethnic” distinction Larsen, Christian Albrekt Published in: Nations and Nationalism DOI (link to publication from Publisher): 10.1111/nana.12345 Publication date: 2017 Document Version Early version, also known as pre-print Link to publication from Aalborg University Citation for published version (APA): Larsen, C. A. (2017). Revitalizing the “civic” and “ethnic” distinction: Perceptions of nationhood across two dimensions, 44 countries and two decades . Nations and Nationalism, 23(4), 970-993. DOI: 10.1111/nana.12345 General rights Copyright and moral rights for the publications made accessible in the public portal are retained by the authors and/or other copyright owners and it is a condition of accessing publications that users recognise and abide by the legal requirements associated with these rights. ? Users may download and print one copy of any publication from the public portal for the purpose of private study or research. ? You may not further distribute the material or use it for any profit-making activity or commercial gain ? You may freely distribute the URL identifying the publication in the public portal ? Take down policy If you believe that this document breaches copyright please contact us at [email protected] providing details, and we will remove access to the work immediately and investigate your claim. Downloaded from vbn.aau.dk on: maj 29, 2018
Transcript of Aalborg Universitet Revitalizing the “civic” and “ethnic” distinction...

Aalborg Universitet
Revitalizing the “civic” and “ethnic” distinction
Larsen, Christian Albrekt
Published in:Nations and Nationalism
DOI (link to publication from Publisher):10.1111/nana.12345
Publication date:2017
Document VersionEarly version, also known as pre-print
Link to publication from Aalborg University
Citation for published version (APA):Larsen, C. A. (2017). Revitalizing the “civic” and “ethnic” distinction: Perceptions of nationhood across twodimensions, 44 countries and two decades . Nations and Nationalism, 23(4), 970-993. DOI: 10.1111/nana.12345
General rightsCopyright and moral rights for the publications made accessible in the public portal are retained by the authors and/or other copyright ownersand it is a condition of accessing publications that users recognise and abide by the legal requirements associated with these rights.
? Users may download and print one copy of any publication from the public portal for the purpose of private study or research. ? You may not further distribute the material or use it for any profit-making activity or commercial gain ? You may freely distribute the URL identifying the publication in the public portal ?
Take down policyIf you believe that this document breaches copyright please contact us at [email protected] providing details, and we will remove access tothe work immediately and investigate your claim.
Downloaded from vbn.aau.dk on: maj 29, 2018
1
Revitalizing the “civic” and “ethnic” distinction Perceptions of nationhood across two dimensions, 44 countries and two decades
Christian Albrekt Larsen,
Centre for Comparative Welfare Studies (ccws.dk),
Aalborg University, Denmark
** Forthcoming in “Nations and nationalism”
Abstract:
This article describes how contemporary publics think about the nation along Kohn’s classic distinction
between “civic” and “ethnic” nationalism. The article makes three contributes to the existing literature. Firstly,
it introduces a new statistical tool, multi-classification-analysis, to establish and analyse the two-dimensional
structure found in this and previous studies. Secondly, it derives at an alternative interpretation with a first
dimension distinguishing the level of mobilization of nationalist attitudes and a second dimension
distinguishing the relative emphasis given to civic and ethnic elements. Thirdly, it demonstrates how this setup
can be used to describe differences within countries, across countries and across time using all three rounds of
ISSP data on national identity. The descriptions demonstrate a move toward mobilized ethnic nationalism in
Eastern Europe while a stable non-mobilised civic nationalism prevails in many West European countries;
despite the rise of new-right wing parties.
Keyword: Nationalism, perceptions of nationhood, Hans Kohn, civic, ethnic, ISSP

2
Introduction
The distinction between “ethnic” and “civic” perceptions of nationhood has been pivotal for scholarly
work on nationalism (Kohn 1961[1944]). Arnason e.g. argues that “In the whole literature on nation
and nationalism, it would be hard to find a more seminal work than Hans Kohn’s ‘Idea of
Nationalism’ (Arnason 2006: 46). Kohn’s distinction had its roots in Meineke’s (1970[1907])
distinction between “staatsnation” (state nation) and “kulturnation” (culture nation). At the same time,
scholars of nationalism have also heavily criticised the dominance of this distinction. It has been
argued that the distinction is conceptually unclear, too simple to capture the complex nature of
perceptions of nationhood and of little relevance for contemporary attitudes to migration. This article
sets out to revitalize the application of this classic distinction by means of a new method to interpret
the existing data.
Kohn’s basic argument was that in Western Europe (his examples were France, the UK, The
Netherlands and Switzerland) the borders of the state were settled prior to the rise of nationalism,
which created a strong focus on the new democratic procedures that could legitimize the existing
state. Nationalism therefore contained a narrative about turning oppressed inhabitants into citizens.
In a less positive interpretation, Tilly calls it a “state-led nationalism” where “rulers who spoke in a
nation’s name successfully demanded that citizens identify themselves with that nation and
subordinate other interests to those of the state” (Tilly 1994:133). In contrast, the borders in Eastern
Europe were settled after the rise of nationalism, which created a strong focus on the ethnic/cultural
dimension of nationhood. Tilly calls it “state-seeking nationalism” where “representative of some
population that currently did not have collective control of a state claimed an autonomous political
status, or even a separate state, on the ground that the population had a distinct, coherent cultural
identity” (Tilly 1994:133). Kohn used the terms “Western” and “Eastern” both to denote the
geographic locations of the various ideas of the nation (Kohn drew the line between the area west of
the Rhine and the areas east of the Rhine) and to denote two different ideal types of perceptions of
nationhood.
The seminal historical work of Kohn has been followed by an important literature about the
conceptual and empirical soundness of this distinction and its application on contemporary nation
states (Nielsen 1996, Hjerm 2003, Janmaat 2006, Jones, Smith 2001a, Jones, Smith 2001b, Kaufmann
1999, Kuzio 2002a, Reeskens, Hooghe 2010, Shulman 2002, Kymlicka 2000b, e.g. Ceobanu,
Escandell 2008). Conceptually one of the key questions has been whether the distinction should be
used as a dichotomy, a continuum or a two dimensional space. Empirically one of the key questions
has been, which variables actually measure “ethnic” and “civic”. The article contributes to this
standing debate. In the first section, the article addresses some of the major conceptual problems with
Kohn’s distinction. The second section introduces the data material and previous problems with its
interpretation. In the third section multi-classification-analysis (MCA) is introduced as a new and
effective tool to establish and interpret a two-dimensional space of perceptions of nationhood. The
fourth section provides the interpretation of the established two-dimension space and its four

3
quadrants. The next sections use this setup to describe difference within four countries (section five),
across the latest available data from 44 countries (section six) and across time for 30 countries (section
seven). The main finding, a new interpretation of the two dimensional structure, is summarized in the
conclusion.
The pitfalls of the ethnic civic distinction
Kohn’s distinction between “civic” and “ethnic” is at the surface simple and convincing but still
contains a number of pitfalls. Firstly, it is widely agreed that the use of the term ethnic is problematic.
The problem is that ethnic is not easily defined and Kymlicka (2000b) rightly argues that perceptions
of nationhood are typically formed around broader cultural markers, i.e. often it is shared norms,
values and customs and not common ancestors that is believed to be crucial. And if common ancestors
are believed to be crucial, it is typically because it is seen as the best guarantee for maintaining
common values and norms. Thus, conceptually it is difficult to keep cultural and ethnic markers apart,
which makes Meincke’s old term “kulturnation” more precise. Kohn’s himself actually seems to be
well aware of the social construction of ethnic; “Modern nationalities, however, are mixtures of
different, and sometimes even very distant, races. … Few is any nationalities can at present claim
anything approaching common descent“ (Kohn 1944:14). The term “civic” is also somewhat
problematic. If positively defined as state power legitimized through public participation in
democratic procedures, the term gets normative connotations. Thus, Kohn has been accused of
distinguishing between a “bad” and “good” kind of nationalism, which could be influenced by his
own life story. Kohn was born in the Austro-Hungarian Empire (1891), prisoner of war in Russia
after the First World War and ended his life as a college teacher in the free US. Again Meincke’s term
“staatsnation” seems more precise and neutral. “Political community” is another possibility.
Secondly, most contemporary scholars find it useful to replace Kohn’s dichotomy with either
1) a continuum from “civic/Western/political” at the one end to “ethnic/Eastern/cultural” at the other
or 2) a two dimensional solution. Those in favour of a continuum often cite Anthony Smith for the
argument in his seminal 1991 book that “… every nationalism contains civic and ethnic elements in
varying degrees and different forms. Sometimes civic and territorial elements predominate; at other
times it is the ethnic and vernacular components that are emphasized” (Smith 1991:13). However,
most empirical studies, this one included, find a two dimensional structure in perceptions of
nationhood. This has led to the argument that empirically the “civic”/“political” and
“ethnic”/“cultural” parts of perceptions of nationhood do not seem to be mutual exclusive
phenomenon (Jones, Smith 2001a, Reeskens, Hooghe 2010, Jones, Smith 2001b, Janmaat 2006,
Kunovich 2009). However, the previous studies are troubled by a weak conceptualisation of what is
means to be high/high or low/low on the two dimensions (though see Bonikowski, DiMaggio 2016
on the American case, and Larsen 2016 on the Danish case). The article will derive at an interpretation
where the second dimension distinguishes between “civic” at the one end and “ethnic” at the other,
i.e. a one-dimensional continuum.
4
Thirdly, it can naturally be questioned whether inhabitants of a given nation state share a
common perception of nationhood or rather have a number of competing stories of nationhood.
Especially scholars working on the American case have documented that a number of competing
narratives about nationhood are present within the American public (Smith 2003, Bonikowski,
DiMaggio 2016). The obvious answer is that Kohn refers to the dominant perception of nationhood.
Kohn argues that “The character of no people is fixed once and forever. Every people participates in
the entire spiritual world of humanity and its richness; no human trait is missing in any people. But
in different peoples different characteristics, abilities and tendencies receive a different emphasis. It
is not the possession of definite traits which defines a people, but the tendency to accentuate them”
(1944:30). Kohn did have some substantive arguments for expecting some perceptions of nationhood
to dominate. He. e.g. argued that “the growth of nationalism is the process of integration of the masses
of the people into a common political form” (1944:4). Tilly is a bit more specific; “states did
commonly adopt programs of normative indoctrination designed to homogenize there subject
populations and to activate there national commitments” (Tilly 1994:138). The national school
system that promotes a standardised language and a common understanding of the history of the
nation state is the clearest example. This “program of normative indoctrination” sometimes even
include nationwide religious schooling. Other important programmes of normative indoctrination are
military service, ministries of culture and state financed public mass media institutions. However,
even with such institutions in place, one can find important within-country variation in perceptions
of nationhood (see section five). Furthermore, perceptions of nationhood are often formed in
opposition to each other, i.e. one narrative only makes sense with a counter-narrative present. In
Kohn’s own work “civic” helps to define “ethnic” and the other way around. In the two-dimensional
framework below, it will be shown how ideal typical ideas in each of the four quadrants help to define
each other.
Fourthly, and most profoundly, Kohn provided a historical account connected to the
geopolitical realities of the 18th and 19th century that might not be valid in the 20th or 21th century.
The nature of the “birth” of a given nation state might create better opportunities for some perceptions
of nationhood than for others. However, history seems to have falsified any idea of a deterministic
link between dominant perceptions of nationhood around the formation of a given nation state and
contemporary perceptions of nationhood. Germany is a point in case. The archetypical “kulturnation”
seems in most aspects to have become a “statenation” (see below). Kohn’s other archetypical Eastern
nation states also undergo profound changes after the break down of the Soviet Union (e.g. Ceobanu,
Escandell 2008, Shulman 2002, Kuzio 2002b). Using the ISSP data material from 1995, including 15
countries, Shulman (2002) concluded that the covered Eastern European countries were much more
“civic” than expected. Schulman did not have longitudinal data and did warn about making firm
conclusion based on a single cross-cut. But the available empirical evidence led to the argument that
the Eastern countries might have overcome their “ethnic” nationalism of the past. Such a development
would support the “optimistic” argument that modernization, i.e. economic development and
democratization, has a capacity to replace “ethnic” with “civic” nationalism (but see empirical results
below). In contrast to the optimism on behalf of the Eastern European countries, it has been feared

5
that the rise of new-right-wing parties in Western Europe within the last two decades indicate a shift
towards more “ethnic” nationhood perceptions. The election of Donald Trump and UK’s decision to
leave the European Union has led sweeping statements about the rise of national conservatism on a
global scale. While there is a large literature on public attitudes toward migration and migrants,
especially in Western Europe, little is known about changes in the more fundamental perceptions of
nationhood. Bail’s work on migration experiences and perceptions of nationhood is an exception (Bail
2008). However, Bail did not describe changes over time and his inductive country-classification
based on fuzzy-set analyses did not relate to the conceptual discussions about “ethnic” and “civic”.
This article is to our knowledge the first to describe (potential) changes in nationhood perception over
time using the full ISSP-dataset (see below).
How to measure dimensions in perceptions of nationhood?
The majority of cross-national empirical studies of the “ethnic-civic” distinction have used the ISSP-
module on national identity (International Social Survey Program, www.issp.org). This is for good
reasons as it is the most comprehensive dataset on perceptions of nationhood. The module was fielded
in 23 nation states in 1995, 33 in 2003 and 33 in 2013. In each nation state a representative sample of
adult (18 years old and above) have been asked a common set of standard survey items. Most studies
use the seven ISSP-items where respondents are asked what it means to be truly American, Russian,
Dutch etc. The argument is that the criteria used to construct the (imagined) boundary between those
inside and outside the nation are pivotal for the underlying perceptions of nationhood. This approach
follows what has been labelled the boom in boundary studies within sociology (Wimmer 2008). The
specific ISSP-question had the following introduction “Some people say that the following things are
important for being truly [nationality]. Others say they are not important. How important do you think
each of the following is…”. The respondent was then asked about:
1) to have been born in [country].
2) to have [country] citizenship.
3) to have lived in [country] for most of one's life.
4) to be able to speak [country language].
5) to be a [dominant religion].
6) to respect [country nationality] political institutions and laws.

6
7) to feel [country nationality].
Part of the inconclusiveness of the previous studies is caused by a confusion about which of these
items respectively measure “political community / civic / Western” and “cultural community /ethnic
/ Eastern”. One solution is to choose indicators deductively. Schulman (2002) e.g. choose “born” (1),
“citizenship” (2), “lived” (3), “laws” (6) and “feel” (7) to reflect “civic” and “language” (4) and
“religion” (5) to reflect “ethnic”. Another approach is to inductively look for dimensions in the
responses of citizens. Here previous studies of the 1995 data derives at a two dimensional solution,
where “born” (1), citizenship” (2), “lived”(3) and “religion” (5) form the first dimension and “laws”
(6), “feel” (7) and “language” (4) forms the second dimension (Jones, Smith 2001a, Jones, Smith
2001b). Previous studies of the 2003 data derives at a similar solution for the second dimension and
a close to similar solution for the first dimension (though “citizenship” is left out of the first dimension
and an additional item added in 2003 about ancestry was included) (Reeskens, Hooghe 2010: 589).
The interpretation of these dimensions differs. Reeskens and Hooghe use the label “ethnic”
(dimension 1) and “civic” (dimension 2), whereas Jones & Smith argue that the dimensions cut across
the “civic-ethnic” divide (they especially find it problematic to include “language” (4) in “civic” and
“citizenship” (2) in “ethnic”. Thus, in a review Janmart argues that “a number of items… could have
been interpreted differently by the respondents, which makes it difficult to assign meaning to
underlying dimensions in the data” (Janmaat 2006:58). Furthermore, the interpretation is (perceived
to be) troubled by the fact that it has proved difficult to find a relationship between what these studies
labelled the “ethnic-dimension” and negative attitudes to migration/migrants and between what these
studies labelled the “civic-dimension” and positive attitudes to migration/migrants (Janmaat 2006).
It has also proved difficult to link proudness measures (also measured in the ISSP-survey), the
boundary measures and xenophobic attitudes more broadly (e.g. Hjerm 2003). All in all this leaves
an uncertainty about the interpretation, which e.g. leads Ceobanu & Escandell (2008) to replace the
ethnic-civic distinction with four alternative dimensions, Jannmaat (2006) to supplement the ISSP
data with Eurobarometer data, Bail to apply fuzzy-set techniques (2008) and Wrigth to test alternative
rank order measures to distinguish “ethnic” and “civic” elements in perceptions of nationhood among
Americans (2011). The solution suggested by this article is to apply MCA (se next section), which
comes with a number of advantages when dimensions are to be interpreted.
The article makes use of the full ISSP dataset on national identity except South Africa in 2013
(due to a difference in response category of the used items) and the sample of Palestinian citizens in
Israel (due to their exclusion from citizenship in practise). Thus, the Israeli sample only contains the
non-Palestinian population. Furthermore, in all countries the article only uses the answers from
respondents where both parents had citizenship in the country. Thus, it is a description of how “the
natives” imagine the national community. The ISSP data are not suitable to describe the national
perceptions of the “migrants” due to high drop-out rates and self-selection of the most assimilated
migrants. ISSP provides data from 44 countries. 15 countries conducted the national identity model
7
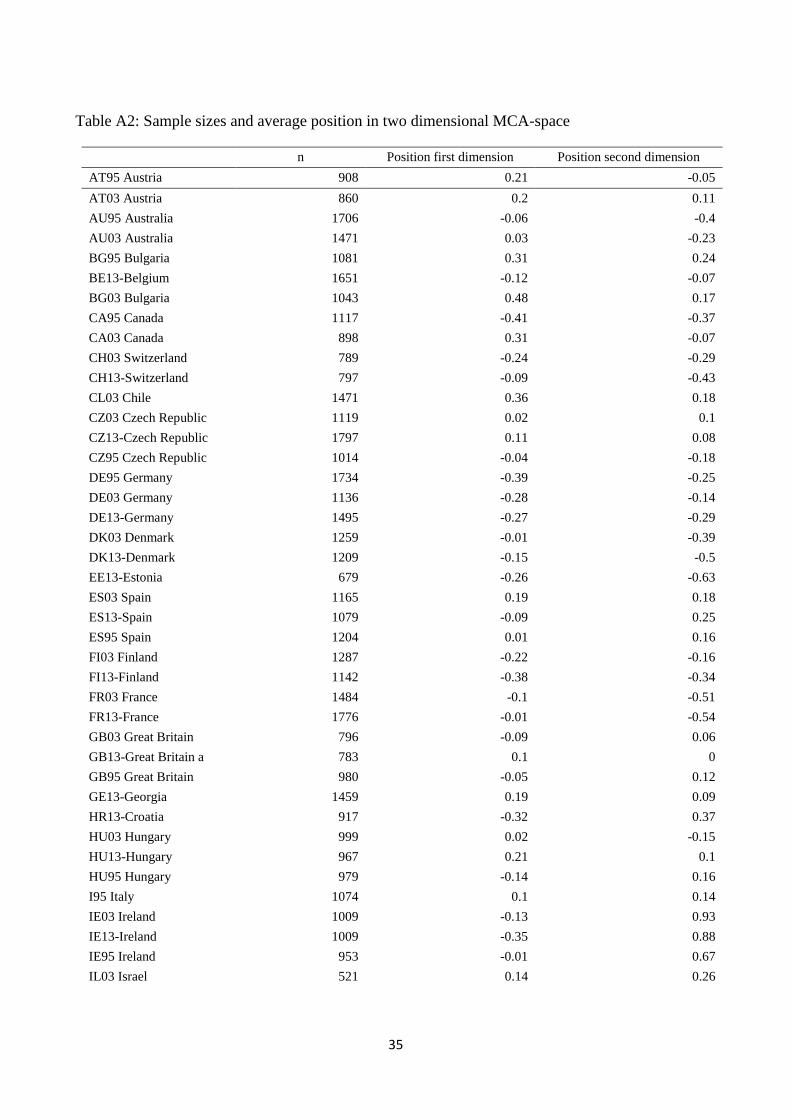
in all three waves, 15 countries conducted two waves and 14 countries conducted one wave. Thus, in
all the data include 88 national samples including 104,605 respondents (see online appendix Table
A2 for sample sizes and see www.issp.org for more information). The ISSP data is not a random
sample of countries around the world. There is an overrepresentation of European countries, which
is of importance for the inferences that can be made from the data material. However, the European
countries are of special interest as they were the point of departure for Kohn’s historical work and the
strand of literature that followed (see Bail 2008 for a good overview of the many previous focused
comparisons between a few European countries).
Multi correspondence analysis
This article contributes with a better interpretation of the two-dimensional structure that has been
found in the previous studies of the ISSP-data. It does so by means of MCA, which is part of the
broader methodology labelled geometric data analyses (Clausen 1998, Le Roux, Rouanet 2004,
Husson, Lê & Pagès 2017). The article uses the MCA COREM procedure in SPAD (version 7.3). It
is a method developed to describe relationships among categorical variables in large tables. Thus, in
contrast to traditional factor analysis, MCA has no assumption about the distributions. Each category
of variables is treated as a separate data point. The method was most famously applied in Bourdieu’s
“The distinction” and the article shares the premise that human thinking often take place in a field or
social space where positions are contrasted against each other (Bourdieu 1986, see also Le Roux et
al. 2007). The basic point is that thinking about nationhood is done in a context of competing
narratives. This is the case both in the historical process of nation state formation and in contemporary
public discussions fueled by increased immigration. One of the main advantages of MCA is the ability
to visualize these “spaces” in low dimensional maps.
In the first step of MCA, the relevant variables are chosen. The article follow the previous
literature and use the seven items introduced above. These so-called active variables are used to
establish the relevant “space”. The respondents could answer the questions using the following
categories “very important”, “fairly important”, “not very important”, “not important at all” and
“can’t choose”. The answers are recoded into “very/fairly important” (marked by a “+” in Figure 1)
and “not very/not all important” (marked by – in Figure 1). i The share answering “very/fairly
important” in each country sample is found in online appendix Table A1. This grouping was done in
order to avoid categories with few answers, in our case very few respondents used the category “not
important at all”, as MCA spaces are known to be sensitive to outliers (Clausen 1998:23). This leaves
us with a table with 128 cells (2 x 2 x 2 x 2 x 2 x 2 matrix) that include 14 categories or so-called
modalities. Based on so-called row profiles and column profiles, MCA calculates the chi-square
distances between the categories. This is the so-called cloud of modalities. In the same way chi-square
distances can be established for each individuals. This is the so-called cloud of individuals.
8
In the second step of MCA, the relevant number of dimensions is chosen. The weighted sums
of the chi-square distances are minimized by means of principal component analysis, which as in
classic factor analysis produce a number of dimensions with eigenvalues. There are no fixed rules
when it comes to choosing the number of dimensions but in line with previous studies and the so-
called “elbow criterion” a two-dimensional solution is chosen (Clausen 1998). The eigenvalue of the
first dimension is 0.34 (x-axis), explaining 33 percent of the inertia within the data, and the eigenvalue
of the second is 0.15 (y-axis), explaining 15 percent of the inertia. Figure 1 shows the derived two-
dimensional space (or cloud of modalities). Categories located close to each other indicate that these
answers tend to go together.
In the third step of MCA, the dimensions and clustering of categories should be given a
substantial interpretation. MCA calculates each variable’s contribution to each dimension, which is
useful for the interpretation of the dimensions as in classic factor analysis. “Born” (1) and “lived” (3)
deliver the highest contribution (cumulated contribution at 20.3 for each) to the formation of the first
dimension. However, “citizenship” (2) (cumulated contribution at 19.1) and “feeling” (7) (cumulated
contribution a 13.1) also delivers a clear contribution to establish this dimension, which has been a
puzzle in previous studies. Our suggestion is to interpret the first dimension as a matter of more or
less mobilization rather than a matter of degree of ethnic nationalism (see further interpretation
below). The dimension will be labelled, the “mobilization”ii “Law” (6) delivers by far the highest
contribution (45.5) to the formation of the second dimension.iii However, “born” (1) (cumulated
contribution 16.8) and “language” (4) (cumulated contribution at 13.4) also contributed to the
dimension. Therefore, the article suggests that it is not simply a matter of degree of “civicness” but
rather a dimension that distinguish between the weighting of civic versus ethnic (see below). The
second dimension will be “civic-ethnic”.
The MCA-analysis largely replicates what is found with other techniques in previous studies
(close to identical to the solution with six multidimensional indicators provided by Kunovich
2009:580) but as discussed above the substantial interpretation of these dimensions have troubled
previous studies. MCA comes with the advantage that so-called supplementary variables can easily
be added. These variables do not actively shape the constructed space but the position of the
categories of the supplementary variables ease the interpretation of the dimensions and the clustering.
The added additional variables are importance of family background (item added in 2003), feeling of
national belonging, feeling of proudness about the nation, attitudes to the size of migration, attitudes
to whether migrants should assimilate and preference for given priority to national programs and
films in TV, see online appendix Table A3 for exact wording of the included supplementary variables.
Thus, the article advances the field by using these supplementary categories in the substantive
interpretation of dimensions and clustering. This is done in the next section.

9
Figure 1. Two dimensional space. Position of 14 modalities of active variables
In a fourth step, the established MCA space is used to describe within-country variation
(section five) and describe across-country variation (section six), which also help to underpin the
interpretation of the space. Finally, the setup is used to describe across-time-across-country variation
(section seven). The method is based on the bold assumption that survey items carry the same
meaning across countries and across time.iv The aim is to provide an overview, which can function
as a point of departure for more detailed national studies. The estimated exact position of each country
”Ethnic”
”Civic”
”Non-mobilised” ”Mobilised”
10
can be found in the online appendix Table A2. The significant ellipses for six selected countries are
depicted in Figure A1 in online appendix (at 0.05 level). An overlap in ellipses indicates that one
cannot distinction the country-position from each other. As ISSP provides large national samples, the
confidence ellipses of countries are narrow. Thus, in order to reduce complexity, the confidences
ellipses have not been included in the shown figures.v All the described changes in country-positions
are significant. The article cannot give a substantial explanation for the position of each country but
will deliver a first descriptive overview.
The interpretation of the two dimensions of perceptions of nationhood
The substantive interpretation of the dimensions and the clustering is crucial but complex. The first
dimension is suggested to distinguish between those who in general find these criteria important,
located to the right in Figure 1, and those who in general find these criteria less important, located to
the left in Figure 1. Though the importance assigned to be born in the country and have lived most of
the life in the country (see above) contributed the most to this dimension, it is not simply an “ethnic”
dimension. Our interpretation is that it is a matter of more or less nationalism, in any form. It is
probably so that mobilization of nationalism is typically fuelled by “ethnic” markers; it is indeed
difficult to fuel strong nationalistic attitudes based on ideas of democratic citizenship. The
”verfassungspatriotismus” (constitutional patriotism) suggested by Habermas, and most vividly
practices in Americans’ celebration of the constitution, is seldom enough to fuel nationalistic feelings.
However, once nationalistic attitudes are mobilized, it is easy to imagine that the mobilized begin to
assign importance both to ethnic and civic elements. Therefore it is not so puzzling that those who
find it important to have lived most of the life in the country also tend to find it important to have
citizenship in order to a truly e.g. American. This is what is indicated by the low distance between
these two categories in right side of Figure 1. And the other way around. Among the non-mobilised,
it is not so puzzling that those who do not find it important to have lived most of one’s life in the
country neither find citizenship very important in order to be e.g. truly French. The second dimension
is, as already mentioned, suggested to distinguish “civic” and “ethnic”; or in more neutral terms
between the relative weight respectively given to the political or cultural (imagined) community. The
“civic” minded, high on the vertical axis, find it unimportant to have been born in the country, to have
lived in the country most of the life and belong to the dominant religion but find it highly important
to respect the laws. The “ethnic” minded, low on the vertical axis, find it unimportant the respect the
law, speak the language and feel national but find it important to belong to the dominant religion and
be born in the country. Turning to the supplementary variables and the four established quadrants,
one can further elaborate on this interpretation. Figure 2 shows how the categories of the
supplementary variables are located in the established space (axes values are changed in order to
make the figure more readable).

11
Figure 2. Two dimensional space. Position of supplementary variables
The lower right quadrant
Those in the lower right quadrant distinguish themselves by finding it important to belong to the
dominant religion in the country, to have been born in the country and to have lived most of one’s
life in the country in order to be “really” French, American, Turkish etc. This is the mobilized ethnic
nationalistic segment. Those answering “very proud” of their national identity tend to be located in
the lower right quadrant. Those in the lower right quadrant also tend to answer that migration should
be “decreased a lot” and agree in the statement that national television should give preference to
national films and programs. Finally, they also find it important to have family background in the
country in order to be a real member. This support the interpretation that the lower right quadrant is
a national conservative segment. In the established space of individuals, the MCA-analysis locates
34 per cent of the respondents in the dataset in this quadrant. The unification of Germany in 1871
was by Kohn used as the classic example of perceptions of nationhood with a strong focus on a
mobilised cultural community within an unsettled political community. For national conservatives,
the nation is not an imagined community (in contrast to the point of departure of this article). It is a
historical given cultural community on which the political rule rests. Therefore immigration from
”Ethnic”
”Civic”
”Non-mobilised” ”Mobilised”

12
cultural distant areas is easily seen as a challenge for upholding a nation. This is the basic national
conservative idea that many contemporary new-right-wing parties share (Kitschelt, McGann 1997).
What to do with already present immigrations is not easily answered within national conservatism.
One solution is full cultural assimilation but the classic answer is segregation (McGarry, O'leary
2013).
The upper left quadrant
Those located in the upper left quadrant distinguish themselves by taking more or less the opposite
position as the “national conservatives”. They find most of the criteria unimportant; especially the
criteria about been born in the country, to have lived most of one’s life in the country and to belong
to the dominant religion. Helped by the inclusion of supplementary variable those in the upper left
quadrant also tend to answer that they only fell “somewhat” proud of the nation (not “very proud” as
those in the lower right quadrant) and feel “close” to the nation (not “very close” as those in the upper
left quadrant) . They tend to disagree with the statement that national TV stations should give priority
to national programs and they find family background to be unimportant for being a real member.
Finally, they answer, on average, that immigration should “remain the same” or “increase a little”.
This indicate a distancing from the mobilised ethnic nationalism, which Kohn historically associated
with French secularism. The French revolution in 1789 was used as the classic example of a nation
defined primarily by the democratic nature of the state. Everybody that adhered to the slogan of
“liberty, equality and fraternity” was imagined to belong to the new French nation (Brubaker 1992).
In relation to the current debate about immigration, especially in Western Europe, the classic
republican idea is that migrants should only assimilate to the existing national democratic political
community (Tilly would say the state) ( McGarry, O'leary 2013). Therefor the upper left quadrant
could be “republicanism”. The MCA-analysis locates 24 per cent of all respondents in this quadrant.
The upper right quadrant
Those located in the upper-right quadrant distinguish themselves by finding it important that members
respect the law, speak the language, and feel national. This indicates a mobilization of nationalist
attitudes but with an emphasis on civic aspects. Those in the upper right quadrant tend to answer that
they feel “very close” to the country and that migration should “decrease a little”. They also
distinguish themselves by answering that “it is better if groups adapt and blend into the larger
society”. This segment is not well described by Kohn’s ethnic civic dichotomy exemplified with the
French and German nation building process. However, the American nation building process provides
a historical exemplification of the mobilization of nationalistic attitudes with a civic dominance. The
notion of an American melting pot is according to Kymlicka, a clear example of a nationalistic nation
building project with a strong emphasis on assimilation of migrants and natives; with Canada as the
neighbouring contrasting, more multicultural, case (2000a). Within national liberal thinking,
13
migration flows are not seen as problematic as in the thinking of national conservatives but still there
is a nation building process that cannot be taken granted. Migrants are not asked to assimilate into an
old authentic culture but are asked to be willing to assimilate into the state and nation that are to come
(McGarry, O'leary 2013). Thus, national liberalism tends to be forward looking with a strong demand
for assimilation. Therefor this segment is labelled “national liberalism”. The MCA-analyse locates
25 per cent of all respondents in this quadrant.
The lower left quadrant
The segment in the lower left quadrant generally finds the criteria unimportant but is at the same time
dominated by ethnic nation perceptions. It is the most challenging quadrant to interpret. Kohn’s old
distinction provides little help as he seemed unable to imagine a non-mobilized ethnic nationalism.
Empirically, those located in the lower left quadrant distinguish themselves by especially finding it
unimportant to be able to speak the language, feel national and respect the law. The supplementary
variables added in Figure 2 provides some further insight into this segment. Those located here
distinguish themselves by being “not proud at all” or “not very proud” of their nationality. Many also
answer that they do not feel “close at all” or “not very close” to the nation. They also distinguish
themselves by answering that migration should be “increased a lot” and that it is better for a society
“if groups maintain their distinct customs and traditions”. This point to a somewhat fundamental
distancing from nationalistic attitudes that cannot be found in the French secular tradition. In lack of
a better term it will be labelled “de-constructivism”. The question is what could underpin such a
segment, which in the empirical analysis is not insignificant. The MCA-analyses locates 18 per cent
of all respondents in this quadrant. A part of this de-constructivism could be rooted in socialist
thinking, where the bourgeois nation state (including their liberal democracies celebrated by
republicans and national liberals) is seen as a tool to control the working classes. In a more
contemporary form what Böss’s labels radical multiculturalists (2006) also promote a kind of
deconstructivism. The radical multiculturalists reject the basic idea that some people have a special
privilege to a certain territory and question the idea of a national cultural and political community.
Parekh (2002) e.g. sees liberal democracy as a Western value that oppresses authentic local cultures.
This quest for maintenance of local authentic cultures bears a resemblance to the segregation
suggested by hard-core national conservatives. However, widespread “deconstructivism” is unlikely
to raise from intellectual left-wing theoretical discussions. The most obvious origin of such attitudes
are collective memories of violence attached to mobilized nationalism; which tend to be national
conservative. As we shall see, Japan exemplify a case with widespread deconstructivism.
The within-country-variation in perceptions of nationhood
The largest pitfall in the application of Kohn’s framework is maybe the tendency to neglect the within-
country variation in perceptions of nationhood. Therefore we will provide a brief description of within

14
country variation before country positions are described. The within variation is shown by the average
position of the voters of major parties (four per cent or above in the last general election, based on
the sample), see Figure 3. It is embedded in the MCA-logic that positions need to be interpreted in a
relational manner. Figure 3 shows the variation in four countries, which below will be shown to be
some of the most stable examples of countries dominated by respectively “republicanism”, “national
liberalism”, “national conservatism” and “deconstructivism”. For exemplifications are chosen
Sweden (2013), the US (2013) and Japan (2013), which throughout three ISSP waves are located in
the same quadrant (see below). The Philippines is located in the lower-right quadrant throughout three
ISSP waves (see below) but does unfortunately not hold information on political preferences. Neither
does the Polish data and the Bulgarian data from 2003. These two latter countries were in two waves
located in the lower-right quadrant (see below). Therefor Bulgarian data from 1995, which does
include party preference, will be used.
15
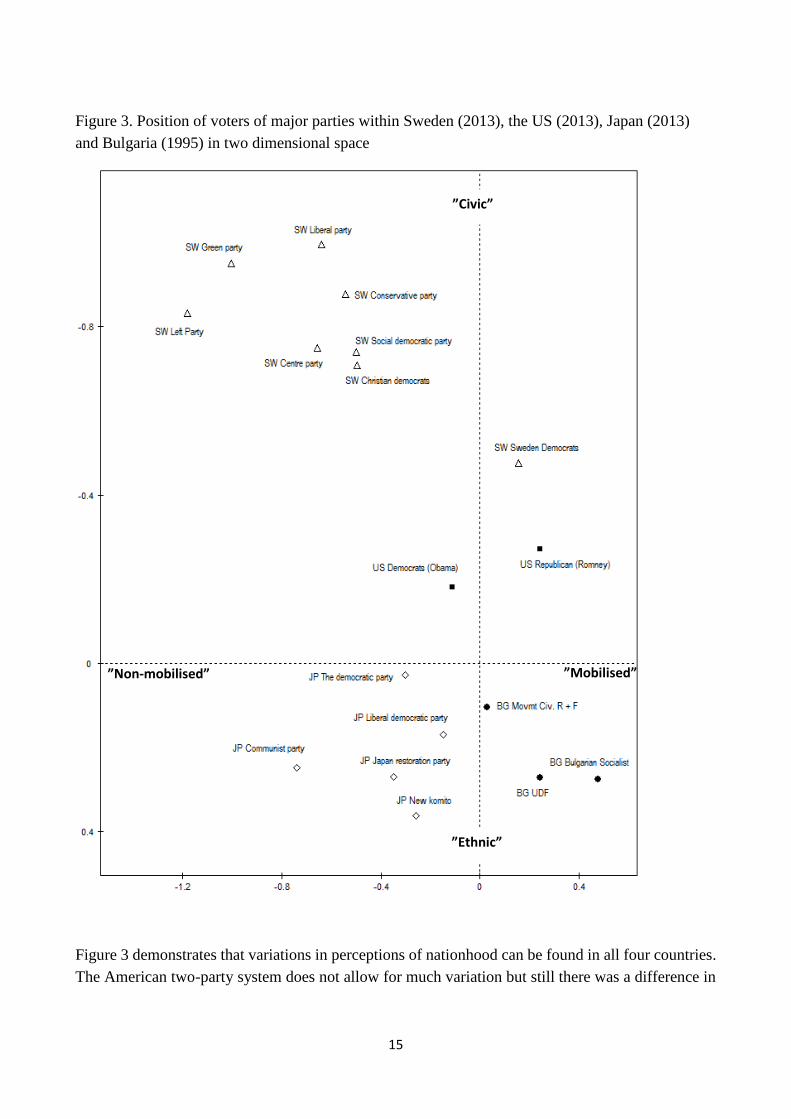
Figure 3. Position of voters of major parties within Sweden (2013), the US (2013), Japan (2013)
and Bulgaria (1995) in two dimensional space
Figure 3 demonstrates that variations in perceptions of nationhood can be found in all four countries.
The American two-party system does not allow for much variation but still there was a difference in
”Ethnic”
”Civic”
”Non-mobilised” ”Mobilised”

16
the average positioning of the Democratic voters (voted for Obama in 2012) and the Republican
voters (voted for Romney in 2012). Both voter groups are by comparative standards “civic-minded”
but the Republican voters were more mobilized the democrats, i.e. the former tended to find the
criteria more important. The location close to the centre indicates that voters of the two parties include
a mix of people with various nationhood perceptions (see Bonikowski, DiMaggio 2016 for a more
detailed account of the within-country variation in the US). Nevertheless, by international standards
there is a stronger emphasis on national liberal perceptions of nationhood in the US than in most other
countries (see below). The multiparty system in the three other countries allows for more variation
across voters of different political parties.
One average Sweden distinguish herself as the most clear-cut example of a country with a
civic mind public that find the criteria rather unimportant in order to be truly Swedish (see below).
However, still one finds internal variations. In Sweden in 2013, the voters of the Green party and the
Left party are more “republican” than are the voters of the Swedish Christian Democratic party and
the Social Democratic party. The electorate of the Swedish democrats, the new right-wing party, is
clearly more mobilized than are the electorate of the mainstream Swedish parties. The voters of the
new-right party also give more emphasis to ethnic elements, which cause a heated internal political
discussion about the rise of national conservatism. However, by international standards the electorate
of the Swedish new-right wing party can hardly be classified as national conservative.
Japan is stably located in the lower-left quadrant, which could come as a surprise. Japan is an
extremely ethnic homogeneous country with a long intellectual tradition for studying, and even
promoting, the authentic Japanese culture, the so-called “nihonjinron” (Burgess 2007, Yoshino 1992,
Befu 2001). However, this historical experience with national conservatism combined with a
somewhat unsettled relationship with democracy provides an explanation for the position in the lower
left quadrant. Symbolically the deconstructivism is reflected in the absence of a national army and
the absence the national hymn at sport event. vi Again, this average position comes with internal
variation. In Japan in 2013, the tension was between the voters of the communist party, which are
highly sceptical about any notion of Japanese culture and the more “republican” voters of the
Democratic party and the more “national conservative” voters of the Restoration party and New
Komito.
Finally, Bulgaria is an example of within country variation in a country located in the lower
right national conservative quadrant. In Bulgaria in 1995, the tension was between the more national
conservative voters of the Bulgarian communist party and the more republican voters of the
Movement for rights and Freedoms. This point to the well-known fact that many of the Eastern
European communist parties turned national conservative after the breakdown of the Soviet Union.
Thus, left-wing ideologies are by no means a guarantee for the promotion of anti-national rhetoric.
Whether one should study this within-country-variation or the between country variation
depends on research interest. However, the large strength of the ISSP-data is the ability to study the
between country variation, which was at the centre of Kohn’s historical analyses. Therefore the next
17
section describes the average position of all the publics included in the ISSP-survey. If there is any
merit in Kohn’s comparative approach, one should as a minimum expect across-country variation.
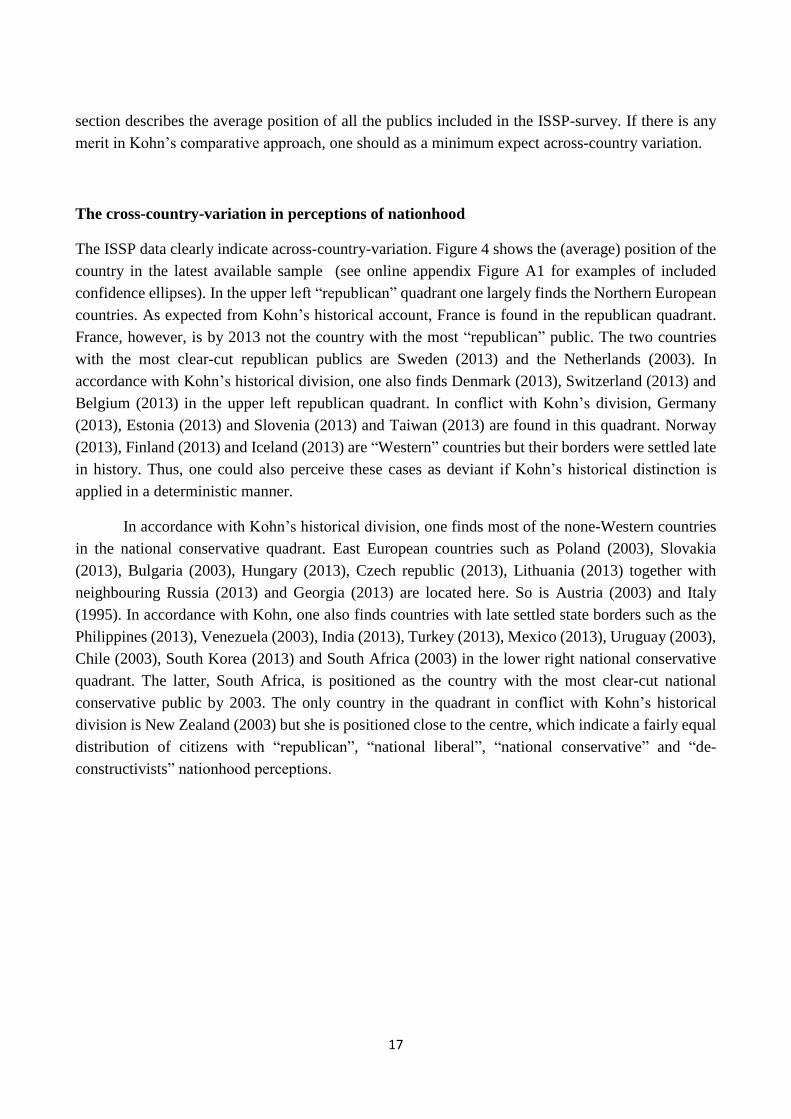
The cross-country-variation in perceptions of nationhood
The ISSP data clearly indicate across-country-variation. Figure 4 shows the (average) position of the
country in the latest available sample (see online appendix Figure A1 for examples of included
confidence ellipses). In the upper left “republican” quadrant one largely finds the Northern European
countries. As expected from Kohn’s historical account, France is found in the republican quadrant.
France, however, is by 2013 not the country with the most “republican” public. The two countries
with the most clear-cut republican publics are Sweden (2013) and the Netherlands (2003). In
accordance with Kohn’s historical division, one also finds Denmark (2013), Switzerland (2013) and
Belgium (2013) in the upper left republican quadrant. In conflict with Kohn’s division, Germany
(2013), Estonia (2013) and Slovenia (2013) and Taiwan (2013) are found in this quadrant. Norway
(2013), Finland (2013) and Iceland (2013) are “Western” countries but their borders were settled late
in history. Thus, one could also perceive these cases as deviant if Kohn’s historical distinction is
applied in a deterministic manner.
In accordance with Kohn’s historical division, one finds most of the none-Western countries
in the national conservative quadrant. East European countries such as Poland (2003), Slovakia
(2013), Bulgaria (2003), Hungary (2013), Czech republic (2013), Lithuania (2013) together with
neighbouring Russia (2013) and Georgia (2013) are located here. So is Austria (2003) and Italy
(1995). In accordance with Kohn, one also finds countries with late settled state borders such as the
Philippines (2013), Venezuela (2003), India (2013), Turkey (2013), Mexico (2013), Uruguay (2003),
Chile (2003), South Korea (2013) and South Africa (2003) in the lower right national conservative
quadrant. The latter, South Africa, is positioned as the country with the most clear-cut national
conservative public by 2003. The only country in the quadrant in conflict with Kohn’s historical
division is New Zealand (2003) but she is positioned close to the centre, which indicate a fairly equal
distribution of citizens with “republican”, “national liberal”, “national conservative” and “de-
constructivists” nationhood perceptions.

18
Figure 4. Latest available position of country in two dimensional space. N=44
”Ethnic”
”Civic”
”Non-mobilised” ”Mobilised”
19
Finally, one finds the positions of countries that cannot easily be handled by Kohn’s dichotomy. In
the upper right national liberal quadrant, one finds the settler societies such as Australia (2003), the
US (2013) and Canada (2003) together with Portugal (2013) and Latvia (2013). UK (2013) is located
at the border between the national conservative and national liberal quadrant. Again, the location near
the centre indicates that most of these countries have large groups of citizens located in the other
segments. Nevertheless, it fits the historical account that the mobilised civic nationalism is particular
widespread in settler societies. The lower left quadrant can neither be handled by Kohn’s dichotomy.
In Ireland (2013), Israel (2013), Croatia (2013), Spain (2013) and Japan (2013) there is an
overrepresentation of citizens that find the criteria unimportant but still are dominated by ethnic
nationhood perceptions. Our interpretation is that is primarily has to do with collective memories of
violence attached to mobilised nationalism, this would explain indication of low-mobilization, and a
somewhat unsettled democratic political system, this would explain the absence of civic elements.
The main conclusion of these empirical findings is not that Kohn’s historical account for the
birth of nations has a predictive power. In the next section it will be demonstrated that countries are
by no means locked into a fixed position. The main contributions are that Kohn’s distinction still
makes analytical sense and that the applied MCA-method enables a meaningful classification that
allows cross-country comparisons.
The changes in country position over the last two decades
It is not the aim of this article to explain these time trends in any detail but a simply description of
changes can provide an important base for judging the soundness of the assumed historical stability
sometimes assigned to Kohn’s distinction. The country-trajectories from 1995 to 2013 are shown in
Figure 5 and those from either 1995 to 2003 or from 2003 to 2013 are shown in Figure 6.

20
Figure 5. Country trajectories from 1995 to 2013. N= 15 (end point marked full)
TW-Taiwan, HR-Croatia, CZ-Czech Republic, 'DK-Denmark, EE-Estonia, FI-Finland, FR-France, GE-Georgia, DE-
Germany, HU-Hungary, IS-Iceland, IN-India, IE-Ireland, IL-Israel, JP-Japan, KR-Korea (South), LV-Latvia, LT-
Lithuania, MX-Mexico, BE13-Belgium, NO-Norway, PH-Philippines, PT-Portugal, RU-Russia, SK-Slovak Republic,
SI-Slovenia, ES-Spain, SE-Sweden, CH-Switzerland, TR-Turkey, GB-Great Britain, US-United States, I- Italy, AU
Australia, PL Poland, BG Bulgaria, CA Canada, NL Netherlands, NZ New Zealand, AT Austria, CL Chile, VE Venezuela,
ZA South Africa, UY Uruguay.
”Ethnic”
”Civic”
”Non-mobilised” ”Mobilised”
21
Of the 13 countries located in the “republican quadrant” in Figure 4, the ISSP data enables us to trace
ten countries across time. Three of the four countries can be traced from 1995 to 2013 (see Figure 5).
Sweden, Norway and Germany were placed in the quadrant in all three waves. Norway and German
with very similar positions, whereas Sweden became even more republican. Slovenia was located
directly at the border between the upper left and right quadrant in 1995 and moves towards
republicanism. Five of the six countries in the upper left republican quadrant in Figure 4, that can be
traced over two waves (see Figure 6), were also earlier positioned in this quadrant. That goes for the
Netherlands, Denmark, France, Switzerland and Finland. Thus, despite the rise of new-right wing
parties in all of these countries and worries about immigration, it has not fundamentally altered
perceptions of nationhood; at least until 2013. Finally, Taiwan (2013) entered the upper left
republican quadrant from a position at the border of the lower left de-constructivist quadrant (2003).
Of the 21 countries located in the lower right national conservative quadrant in Figure 4, the
ISSP data enables us to trace 11 cases back in time. Of the six countries that can be traced from 1995
to 2013 (see Figure 5) only the Philippines were found in the quadrant in 1995. Russia derived from
a position in the lower left quadrant in 1995. The same did Hungary. The Czech and Slovak republics
arrived from a position in the upper left quadrant in 1995; the latter with a position in the lower-left
quadrant in 2003. Thus, the data indicate a movement (back) towards national conservatism rather
than a fixed of overrepresentation of national conservatives in Eastern Europe. The UK experienced
a move towards national liberalism but is positioned close to the middle. For the five countries that
can be traced over two waves (see Figure 6), Bulgaria and Poland had in both samples an
overrepresentation of national conservatives; Poland with a move towards even more national
conservatism. New Zealand arrived from a republican position in 1995 and Austria arrived from a
national liberal position in 1995. Thus, these two countries experienced a move towards national
conservatism but the position close to the middle should be kept in mind. Finally, South Korea arrived
from a position at the lower left quadrant in 2003.

22
Figure 6. Country trajectories from 1995 to 2003 and between 2003 to 2013. N=15 (end point marked
full)
See Figure 6 for country labels.
”Ethnic”
”Civic”
”Non-mobilised” ”Mobilised”

23
The five countries located in the national liberal quadrant in Figure 4 can all be traced back in time.
Only the US was found in this quadrant in all three samples. Thus, the US is the most clear-cut
example of having a public with an overrepresentation of national liberals. Latvia was in the quadrant
in 1995 but not in 2003. Australia (2003) and Canada (1995) arrived from a position in the upper left
republican quadrant in in 1995. Finally, Portugal (2013) arrived from a position in the national
conservative quadrant (2003). Especially, the changes in perceptions of nationhood among
Canadians are remarkable. In 1995, Canada had on overrepresentation of republicans, which
positioned the country together with the Netherlands and Sweden; the three countries that have
experimented the most with so-called “multicultural policies” (Koopmans 2005). In 1995, only 52
per cent of Canadians found it important to have been born in the country, only 55 per cent found it
important to have lived most of one’s life in Canada and only 26 found it important to be Christian.
In 2003, the shares had increased to 82 per cent, 83 per cent and 54 per cent (see Appendix Table
A1). This Canadian retreat from “republicanism” is also described in national studies. Wong & Guo
e.g. describe how the Canadian multicultural “civic” policies of the 1990s were replaced with more
“integrative” policies of the 2000s (2015:4).
Of the five countries located in the lower right de-constructivist quadrant in Figure 4, four can
be traced back in time. Japan and Ireland are in all three waves (see Figure 5) located in this quadrant,
which point to the possibility of having a stable situation where the public tend to find the seven
criteria unimportant and at the same time lean towards ethnic nationhood perceptions. Spain (2013)
is located closer to the middle in all three waves. Israel can be traced from 2003 to 2013 (see Figure
6), which indication a shift towards a lower level of mobilization of nationalism.vii
Conclusion
The article has revitalized one of the most enduring distinctions within studies of nationalism. Despite
all the pitfalls of Kohn’s distinction between “ethnic” and “civic” nationalism, the article argues that
it points to some very basic insights, which continue to be of relevance for contemporary analyses of
perceptions of nationhood. When narratives about nationhood are constructed, the rulers and the ruled
continue to rely on identities that can be connected to the political community around the governing
of the state and/or identities that can be connected to cultural communities around shared language,
religion, food, arts etc. The puzzling fact is that survey researchers have had such a hard time
distinguishing between ethnic and civic dimensions in nationhood perceptions. The article
contributed with a new statistical tool, the MCA-analysis, which led to an alternative interpretation
of the two dimensions found in this and previous studies using the ISSP-data on national identity. In
line with the MCA philosophy, the interpretation of dimensions was established in an interplay
between active and supplementary variables and contextual knowledge. The article suggests that the
first dimension distinguishes between the degree of mobilization of nationalist attitudes while the
24
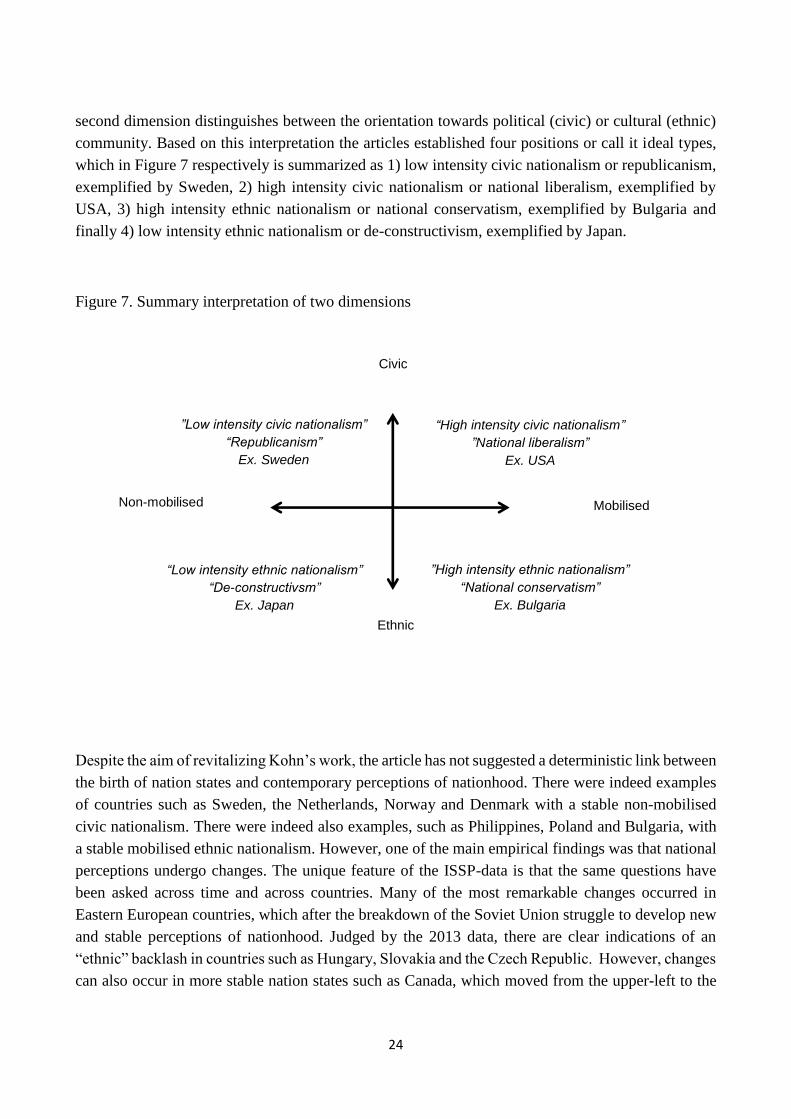
second dimension distinguishes between the orientation towards political (civic) or cultural (ethnic)
community. Based on this interpretation the articles established four positions or call it ideal types,
which in Figure 7 respectively is summarized as 1) low intensity civic nationalism or republicanism,
exemplified by Sweden, 2) high intensity civic nationalism or national liberalism, exemplified by
USA, 3) high intensity ethnic nationalism or national conservatism, exemplified by Bulgaria and
finally 4) low intensity ethnic nationalism or de-constructivism, exemplified by Japan.
Figure 7. Summary interpretation of two dimensions
Despite the aim of revitalizing Kohn’s work, the article has not suggested a deterministic link between
the birth of nation states and contemporary perceptions of nationhood. There were indeed examples
of countries such as Sweden, the Netherlands, Norway and Denmark with a stable non-mobilised
civic nationalism. There were indeed also examples, such as Philippines, Poland and Bulgaria, with
a stable mobilised ethnic nationalism. However, one of the main empirical findings was that national
perceptions undergo changes. The unique feature of the ISSP-data is that the same questions have
been asked across time and across countries. Many of the most remarkable changes occurred in
Eastern European countries, which after the breakdown of the Soviet Union struggle to develop new
and stable perceptions of nationhood. Judged by the 2013 data, there are clear indications of an
“ethnic” backlash in countries such as Hungary, Slovakia and the Czech Republic. However, changes
can also occur in more stable nation states such as Canada, which moved from the upper-left to the
Non-mobilised
Mobilised
Ethnic
Civic
“High intensity civic nationalism”
”National liberalism”
Ex. USA
”High intensity ethnic nationalism”
“National conservatism”
Ex. Bulgaria
”Low intensity civic nationalism”
“Republicanism”
Ex. Sweden
“Low intensity ethnic nationalism”
“De-constructivsm”
Ex. Japan
25
upper left quadrant. The article does not systematically explain changes over time, which is left to
future studies. However, it is clear from the simple descriptive results that it will be hard to find any
overreaching logic in the time trends. There is no indication of a global move toward national
conservatism, as is sometimes stated in public debated, or a global move toward republicanism, as is
e.g. implied in Joopke’s study of citizenship policies in Western countries (2005). On the contrary,
contemporary nation states seems to be in a constant internal dispute about the content of the imagined
national community, which within the last two decades have pushed countries in different directions.

26
End notes
i “Can’t choose” are treated as missing (list wise deleted).
ii The cumulated contributions for the other variables to the first dimensions are “religion”, 10.7, “language”,
10.5 and “law”, 6.0.
iiiiii The cumulated contributions for the other variables to the second dimensions are “born”, 16.8,
“language”, 13.4, “fell”, 10.4, “religion”, 8.6, “lived”, 5.1 and ”citizenship”, 0.2.
iv A single of the previous studies did empirically study the assumption of homogeneity of dimensions
(Reeskens, Hooghe 2010). Using confirmatory factor analysis it found a presence of somewhat deviant cases
(religion e.g. having larger impact on the “ethnic” dimension in Israel). In contrast to confirmatory factor
analysis, the MCA analysis does not have tests for homogeneity in dimensions. However, the two dimensional
solution for each sample has been inspected and they largely conform to the “average solution” found in Figure
1.
v Furthermore, SPAD has the limitation that confidence ellipses can only be calculated on dataset with below
40.000 cases. Therefore Figure A1 in online appendix is based on the space produced by the six included
countries and not the full sample.
vi Another interpretation would be that the ISSP items simply do not capture the special Japanese national
conservatism. The argument could be that it is so strong that it takes more than being born in the country to
be really Japanese. However, even on item about ancestors, added in 2003, the Japanese seem moderate. In
2013, 63 per cent found in important to have Japanese ancestors, which is around the average of 64 per cent
in the whole sample.
vii As Israel is known for extreme national conservatism this interpretation will probably be challenged. One
reasons for Israel being located more the left is that many assign little importance to being born in the
country, at least compared to countries located in the national conservative quadrant. 67 per cent and 57 per
cent of Israeli found it important respectively in 2013 and 2003 (see Appendix Table A1). The obvious
explanation is that Israel has a very special history, where bringing bearer of the Jewish culture around the
world back to Israel is part of the national conservative narrative of nationhood. However, the changed

27
position of Israel indicated by the ISSP-data is caused by lower importance given to all seven criteria (see
Appendix Table A1). This indicates a real shift away from national conservatism, which call for more
detailed national studies.

28
References
Arnason, J.P. 2006, "Nations and nationalisms: Between general theory and comparative history",
The Sage Handbook of Nations and Nationalism, , pp. 44-56.
Bail, C.A. 2008, "The configuration of symbolic boundaries against immigrants in Europe",
American Sociological Review, vol. 73, no. 1, pp. 37-59.
Befu, H. 2001, Hegemony of homogeneity: an anthropological analysis of" Nihonjinron", Trans
Pacific Press.
Bonikowski, B. & DiMaggio, P. 2016, "Varieties of American popular nationalism", American
Sociological Review, , pp. 0003122416663683.
Böss, M. 2006, Forsvar for nationen: nationalstaten under globaliseringen, Aarhus
universitetsforlag.
Bourdieu, P. 1986, Distinction - A Social Critique of The Judgement of Taste, Routledge, London.
Brubaker, R. 1992, Citizenship and nationhood in France and Germany, Cambridge Univ Press.
Burgess, C. 2007, "Multicultural Japan? Discourse and the ‘myth’of homogeneity", Japan Focus,
vol. 24.
Ceobanu, A.M. & Escandell, X. 2008, "East is West? National feelings and anti-immigrant
sentiment in Europe", Social science research, vol. 37, no. 4, pp. 1147-1170.
Clausen, S.E. 1998, Applied correspondence analysis: An introduction, Sage.
Hjerm, M. 2003, "National sentiments in eastern and western Europe", Nationalities Papers, vol.
31, no. 4, pp. 413-429.
Husson, F., Lê, S. & Pagès, J. 2017, Exploratory multivariate analysis by example using R, CRC
press.
Janmaat, J.G. 2006, "Popular conceptions of nationhood in old and new European member states:
Partial support for the ethnic-civic framework", Ethnic and Racial Studies, vol. 29, no. 1, pp.
50-78.
Jones, F.L. & Smith, P. 2001a, "Diversity and commonality in national identities: an exploratory
analysis of cross-national patterns", Journal of Sociology, vol. 37, no. 1, pp. 45-63.

29
Jones, F.L. & Smith, P. 2001b, "Individual and Societal Bases of National Identity. A Comparative
Multi‐Level Analysis", European Sociological Review, vol. 17, no. 2, pp. 103-118.
Joppke, C. 2005, "Exclusion in the Liberal State The Case of Immigration and Citizenship Policy",
European journal of social theory, vol. 8, no. 1, pp. 43-61.
Kaufmann, E. 1999, "American exceptionalism reconsidered: Anglo-Saxon ethnogenesis in the
“universal” nation, 1776–1850", Journal of American Studies, vol. 33, no. 03, pp. 437-457.
Kitschelt, H. & McGann, A.J. 1997, The radical right in Western Europe: A comparative analysis,
University of Michigan Press.
Kohn, H. 1961, The idea of nationalism: A study in its origins and background, Transaction
Publishers.
Koopmans, R. 2005, Contested citizenship: Immigration and cultural diversity in Europe, U of
Minnesota Press.
Kunovich, R.M. 2009, "The sources and consequences of national identification", American
Sociological Review, vol. 74, no. 4, pp. 573-593.
Kuzio, T. 2002a, "The myth of the civic state: a critical survey of Hans Kohn's framework for
understanding nationalism", Ethnic and Racial studies, vol. 25, no. 1, pp. 20-39.
Kuzio, T. 2002b, "The myth of the civic state: a critical survey of Hans Kohn's framework for
understanding nationalism", Ethnic and Racial studies, vol. 25, no. 1, pp. 20-39.
Kymlicka, W. 2000a, "American Multiculturalism and the Nations within", Political theory and the
rights of indigenous peoples, vol. 216, pp. 229.
Kymlicka, W. 2000b, "Nation-building and minority rights: comparing West and East", Journal of
ethnic and Migration Studies, vol. 26, no. 2, pp. 183-212.
Larsen, C.A. 2016, Den danske republik. Foranderinger i danskernes nationale forestillinger, Hans
Reitzel, København.
Le Roux, B. & Rouanet, H. 2004, Geometric Data Analysis - From Correspondance Analysis to
Structured Data Analysis, Kluwer Academic Publishers, Dordrecht, The Netherlands.
Le Roux, B., Rouanet, H., Savage, M. & Warde, A. 2007, "Class and Cultural Division in the UK",
CRESC Working Paper Series, vol. Working Paper No. 40.

30
McGarry, J. & O'leary, B. 2013, The politics of ethnic conflict regulation: Case studies of
protracted ethnic conflicts, Routledge.
Meinecke, F. 1970, "Cosmopolitanism and the National State, trans", Robert B.Kimer (Princeton,
1970), vol. 10.
Nielsen, K. 1996, "Cultural nationalism, neither ethnic nor civic", Philosophical ForumWiley, , pp.
42.
Parekh, B.C. 2002, Rethinking multiculturalism: Cultural diversity and political theory, Harvard
University Press.
Reeskens, T. & Hooghe, M. 2010, "Beyond the civic–ethnic dichotomy: investigating the structure
of citizenship concepts across thirty‐three countries", Nations and Nationalism, vol. 16, no. 4,
pp. 579-597.
Shulman, S. 2002, "Challenging the civic/ethnic and West/East dichotomies in the study of
nationalism", Comparative Political Studies, vol. 35, no. 5, pp. 554-585.
Smith, A.D. 1991, National identity, University of Nevada Press.
Smith, R.M. 2003, Stories of peoplehood: The politics and morals of political membership,
Cambridge University Press, Cambridge.
Tilly, C. 1994, "States and nationalism in Europe 1492–1992", Theory and Society, vol. 23, no. 1,
pp. 131-146.
Wimmer, A. 2008, "Elementary strategies of ethnic boundary making", Ethnic and racial studies,
vol. 31, no. 6, pp. 1025-1055.
Wong, L. & Guo, S. 2015, "Revisiting Multiculturalism in Canada" in Revisiting Multiculturalism
in Canada Springer, , pp. 1-14.
Wright, M. 2011, "Diversity and the imagined community: Immigrant diversity and conceptions of
national identity", Political Psychology, vol. 32, no. 5, pp. 837-862.
Yoshino, K. 1992, Cultural nationalism in contemporary Japan: A sociological enquiry,
Psychology Press.

31
Online appendix:

32
Table A1: Share answering that the criteria is “very important” or “fairly important for being a real
national (active variables in MCA-analyses)
…to have
been born
in
[country]
… to have
[country]
citizenship
… to
have lived
in
[country]
for most
of one's
life
… to be
able to
speak
[country
language]
… to be a
[dominant
religion]
… to
respect
[country
nationality
] political
institutions
and laws
… to feel
[country
nationality
]
AT95 Austria 75 92 81 93 56 92 93
AT03 Austria 81 93 80 92 56 88 91
AU95 Australia 64 91 66 90 33 95 95
AU03 Australia 71 91 72 92 37 91 95
BE13-Belgium 74 87 80 87 18 89 84
BG95 Bulgaria 88 89 82 90 72 87 96
BG03 Bulgaria 90 89 89 95 77 91 99
CA95 Canada 52 88 55 79 26 93 86
CA03 Canada 82 96 83 93 54 97 92
CH03 Switzerland 58 82 68 93 41 96 78
CH13-Switzerland 61 84 73 96 32 96 88
CL03 Chile 90 92 91 87 54 91 96
CZ95 Czech Republic 71 83 81 95 22 85 93
CZ03 Czech Republic 79 87 83 93 28 80 90
CZ13-Czech Republic 85 91 82 96 29 82 90
DE95 Germany 54 81 66 89 30 91 76
DE03 Germany 64 82 69 94 29 89 76
DE13-Germany 60 84 70 94 25 93 77
DK03 Denmark 69 85 73 97 33 96 90
DK13-Denmark 61 84 69 95 25 96 90
EE13-Estonia 54 82 61 96 14 91 97
ES95 Spain 78 83 83 82 47 88 89
ES03 Spain 89 89 88 84 44 92 89
ES13-Spain 79 82 82 91 35 79 82
FI03 Finland 70 85 65 86 24 88 87
FI13-Finland 60 80 61 85 22 94 84
FR03 France 63 86 71 95 18 96 93
FR13-France 67 90 72 97 19 98 94
GB95 Great Britain 80 88 77 89 36 88 80
GB03 Great Britain 76 88 74 91 35 87 80
GB13-Great Britain 82 90 83 97 32 89 83
GE13-Georgia 69 81 82 93 80 87 95
HR13-Croatia 64 79 65 84 56 72 83
HU95 Hungary 69 76 76 97 36 64 99
HU03 Hungary 72 78 77 96 43 86 97

33
HU13-Hungary 82 88 84 95 46 83 96
I95 Italy 78 83 85 86 53 88 92
IE95 Ireland 87 93 83 43 55 88 96
IE03 Ireland 87 93 79 39 59 80 89
IE13-Ireland 85 90 76 37 33 76 86
IL03 Israel 67 84 83 89 83 85 89
IL13-Israel 57 76 78 77 70 80 81
IN13-India 94 95 77 63 62 89 89
IS13-Iceland 59 92 66 94 28 89 93
JP95 Japan 69 84 69 71 27 72 89
JP03 Japan 77 87 74 78 25 68 88
JP13-Japan 70 87 68 76 21 72 87
KR03 Korea (South) 81 88 69 88 41 78 92
KR13-Korea (South) 82 90 71 87 46 83 93
LT13-Lithuania 79 92 81 96 59 81 90
LV95 Latvia 74 81 82 91 38 94 97
LV03 Latvia 76 80 81 91 25 84 91
LV13-Latvia 78 85 86 92 27 86 92
MX13-Mexico 85 87 84 84 58 80 88
NL95 Netherlands 53 78 60 96 8 85 83
NL03 Netherlands 50 83 57 98 13 94 84
NO95 Norway 64 90 72 96 22 97 91
NO03 Norway 67 91 73 97 21 97 86
NO13-Norway 64 92 73 98 22 98 90
NZ95 New Zealand 76 87 74 88 30 89 91
NZ03 New Zealand 87 92 81 92 38 87 93
PH95 Philippines 96 96 92 93 83 89 95
PH03 Philippines 96 96 90 96 85 91 97
PH13-Philippines 96 96 93 95 86 90 96
PL95 Poland 82 88 83 92 53 86 97
PL03 Poland 88 91 83 95 75 82 97
PT03 Portugal 92 93 89 95 66 92 94
PT13-Portugal 81 91 82 96 37 90 95
RU95 Russia 72 80 80 82 40 86 94
RU03 Russia 85 87 85 84 59 83 92
RU13-Russia 88 90 87 88 74 86 91
SE95 Sweden 54 87 63 96 18 99 88
SE03 Sweden 51 85 57 96 18 97 85
SE13-Sweden 42 82 48 94 10 97 81
SI95 Slovenia 72 84 77 95 35 87 92
SI13-Slovenia 58 76 63 89 23 80 85
SK95 Slovakia 66 86 77 93 27 88 95
SK03 Slovakia 59 70 64 86 50 67 74
SK13-Slovak Republic 86 91 85 96 54 77 90

34
TR13-Turkey 85 89 82 87 89 86 79
TW03 Taiwan 66 80 74 59 26 92 92
TW13-Taiwan 62 80 73 73 19 91 96
US95 United States 71 94 74 93 55 93 87
US03 United States 80 97 83 97 68 96 94
US13-United States 69 94 70 93 45 93 86
UY03 Uruguay 89 88 90 86 29 87 97
VE03 Venezuela 97 97 98 96 72 93 99
ZA03 South Africa 92 94 87 89 79 80 88
35
Table A2: Sample sizes and average position in two dimensional MCA-space
n Position first dimension Position second dimension
AT95 Austria 908 0.21 -0.05
AT03 Austria 860 0.2 0.11
AU95 Australia 1706 -0.06 -0.4
AU03 Australia 1471 0.03 -0.23
BG95 Bulgaria 1081 0.31 0.24
BE13-Belgium 1651 -0.12 -0.07
BG03 Bulgaria 1043 0.48 0.17
CA95 Canada 1117 -0.41 -0.37
CA03 Canada 898 0.31 -0.07
CH03 Switzerland 789 -0.24 -0.29
CH13-Switzerland 797 -0.09 -0.43
CL03 Chile 1471 0.36 0.18
CZ03 Czech Republic 1119 0.02 0.1
CZ13-Czech Republic 1797 0.11 0.08
CZ95 Czech Republic 1014 -0.04 -0.18
DE95 Germany 1734 -0.39 -0.25
DE03 Germany 1136 -0.28 -0.14
DE13-Germany 1495 -0.27 -0.29
DK03 Denmark 1259 -0.01 -0.39
DK13-Denmark 1209 -0.15 -0.5
EE13-Estonia 679 -0.26 -0.63
ES03 Spain 1165 0.19 0.18
ES13-Spain 1079 -0.09 0.25
ES95 Spain 1204 0.01 0.16
FI03 Finland 1287 -0.22 -0.16
FI13-Finland 1142 -0.38 -0.34
FR03 France 1484 -0.1 -0.51
FR13-France 1776 -0.01 -0.54
GB03 Great Britain 796 -0.09 0.06
GB13-Great Britain a 783 0.1 0
GB95 Great Britain 980 -0.05 0.12
GE13-Georgia 1459 0.19 0.09
HR13-Croatia 917 -0.32 0.37
HU03 Hungary 999 0.02 -0.15
HU13-Hungary 967 0.21 0.1
HU95 Hungary 979 -0.14 0.16
I95 Italy 1074 0.1 0.14
IE03 Ireland 1009 -0.13 0.93
IE13-Ireland 1009 -0.35 0.88
IE95 Ireland 953 -0.01 0.67
IL03 Israel 521 0.14 0.26

36
IL13-Israel 571 -0.25 0.37
IN13-India 1453 0.13 0.56
IS13-Iceland 965 -0.12 -0.4
JP03 Japan 1055 -0.24 0.42
JP13-Japan 1193 -0.34 0.27
JP95 Japan 1205 -0.36 0.32
KR03 Korea (South) 1310 -0.05 0.2
KR13-Korea (South) 1272 0.05 0.16
LT13-Lithuania 1126 0.19 0.21
LV03 Latvia 606 -0.09 -0.03
LV13-Latvia 677 0.05 -0.04
LV95 Latvia 651 0.07 -0.24
MX13-Mexico 973 0.12 0.43
NL03 Netherlands 1637 -0.39 -0.66
NL95 Netherlands 1918 -0.49 -0.43
NO03 Norway 1339 -0.05 -0.42
NO13-Norway 1358 -0.02 -0.52
NO95 Norway 1381 -0.04 -0.5
NZ03 New Zealand 788 0.19 0.06
NZ95 New Zealand 800 -0.04 -0.09
PH03 Philippines 1189 0.62 0.31
PH13-Philippines 1183 0.63 0.35
PH95 Philippines 1185 0.59 0.4
PL03 Poland 1258 0.39 0.31
PL95 Poland 1544 0.22 0.08
PT03 Portugal 1462 0.45 0.17
PT13-Portugal 933 0.21 -0.12
RU03 Russia 2264 0.17 0.35
RU13-Russia 1472 0.32 0.38
RU95 Russia 1551 -0.08 0.06
SE03 Sweden 1004 -0.34 -0.66
SE13-Sweden 922 -0.57 -0.79
SE95 Sweden 1112 -0.24 -0.67
SI13-Slovenia 944 -0.44 -0.15
SI95 Slovenia 931 -0.01 -0.14
SK13-Slovak Republic 1100 0.21 0.35
SK95 Slovakia 2414 -0.26 0.04
TR13-Turkey 1610 0.22 0.56
TW03 Taiwan 2001 -0.34 0.03
TW13-Taiwan 1896 -0.3 -0.23
US03 United States 1064 0.41 -0.06
US13-United States 1043 0.02 -0.17
US95 United States 1215 0.11 -0.1
UY03 Uruguay 991 0.18 0.09

37
VE03 Venezuela 1035 0.66 0.23
ZA03 South Africa 2187 0.37 0.6

38
Table A3: List of supplementary variables in MCA analyses
Some people say that the following things are important for being truly [NATIONALITY]1. Others say
they are
not important. How important do you think each of the following is... to have [COUNTRY
NATIONALITY] ancestry
1. Very important.
2. Fairly important.
3. Not very important.
4. Not important at all.
How proud are you of being [COUNTRY NATIONALITY]?
1. Very proud.
2. Somewhat proud.
3. Not very proud.
4. Not proud at all.
How close do you feel to you country
1. Very close.
2. Close.
3. Not very close.
4. Not close at all.
How much do you agree or disagree with the following statements? Television should give preference to
[COUNTRY] films and programmes
1. Agree strongly.
2. Agree.
3. Neither agree nor disagree.
4. Disagree.
5. Disagree strongly.
Some people say that it is better for a country if different racial and ethnic groups maintain their distinct
customs and traditions. Others say that it is better if these groups adapt and blend into the larger society.
Which of these views comes closer to your own?
1. It is better for society if groups maintain their distinct customs and traditions.
2. It is better if groups adapt and blend into the larger society.
Do you think the number of immigrants to [COUNTRY] nowadays should be...
1. Increased a lot.
2. Increased a little.
3. Remain the same.
4. Reduced a little.
5. Reduced a lot.
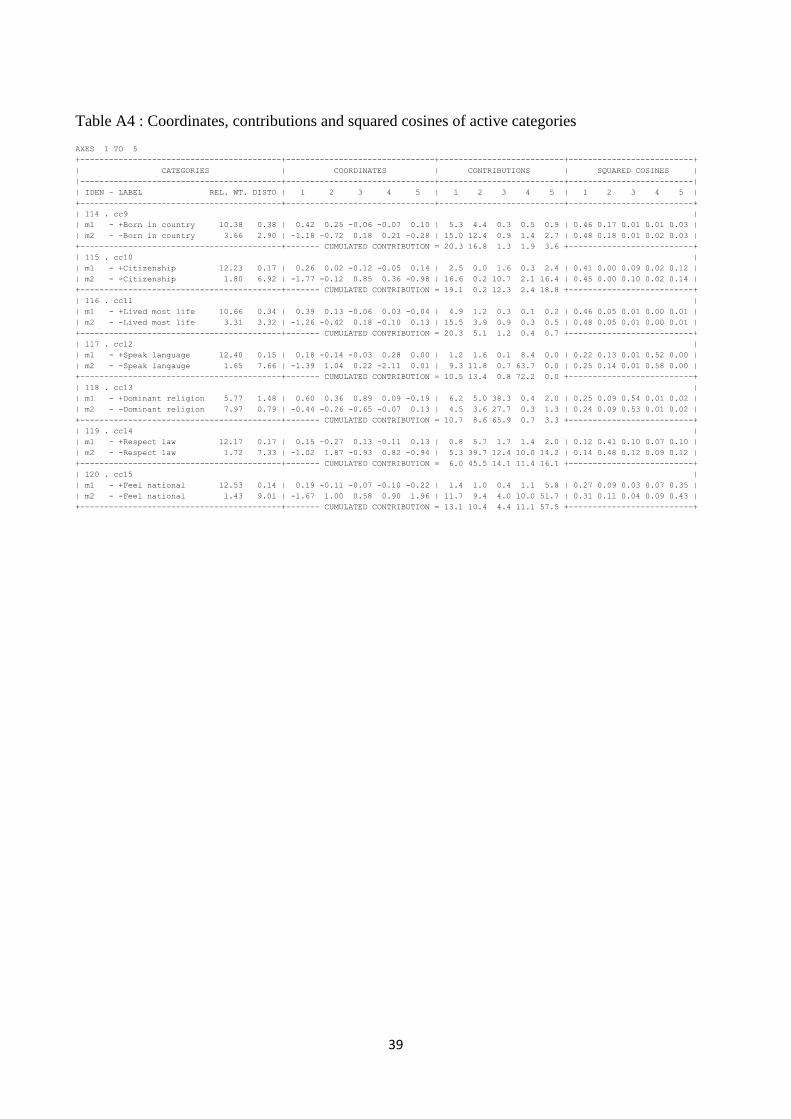
39
Table A4 : Coordinates, contributions and squared cosines of active categories
AXES 1 TO 5
+------------------------------------------+-------------------------------+--------------------------+--------------------------+
| CATEGORIES | COORDINATES | CONTRIBUTIONS | SQUARED COSINES |
|------------------------------------------+-------------------------------+--------------------------+--------------------------|
| IDEN - LABEL REL. WT. DISTO | 1 2 3 4 5 | 1 2 3 4 5 | 1 2 3 4 5 |
+------------------------------------------+-------------------------------+--------------------------+--------------------------+
| 114 . cc9 |
| m1 - +Born in country 10.38 0.38 | 0.42 0.25 -0.06 -0.07 0.10 | 5.3 4.4 0.3 0.5 0.9 | 0.46 0.17 0.01 0.01 0.03 |
| m2 - -Born in country 3.66 2.90 | -1.18 -0.72 0.18 0.21 -0.28 | 15.0 12.4 0.9 1.4 2.7 | 0.48 0.18 0.01 0.02 0.03 |
+------------------------------------------+------- CUMULATED CONTRIBUTION = 20.3 16.8 1.3 1.9 3.6 +--------------------------+
| 115 . cc10 |
| m1 - +Citizenship 12.23 0.17 | 0.26 0.02 -0.12 -0.05 0.14 | 2.5 0.0 1.6 0.3 2.4 | 0.41 0.00 0.09 0.02 0.12 |
| m2 - -Citizenship 1.80 6.92 | -1.77 -0.12 0.85 0.36 -0.98 | 16.6 0.2 10.7 2.1 16.4 | 0.45 0.00 0.10 0.02 0.14 |
+------------------------------------------+------- CUMULATED CONTRIBUTION = 19.1 0.2 12.3 2.4 18.8 +--------------------------+
| 116 . cc11 |
| m1 - +Lived most life 10.66 0.34 | 0.39 0.13 -0.06 0.03 -0.04 | 4.9 1.2 0.3 0.1 0.2 | 0.46 0.05 0.01 0.00 0.01 |
| m2 - -Lived most life 3.31 3.32 | -1.26 -0.42 0.18 -0.10 0.13 | 15.5 3.9 0.9 0.3 0.5 | 0.48 0.05 0.01 0.00 0.01 |
+------------------------------------------+------- CUMULATED CONTRIBUTION = 20.3 5.1 1.2 0.4 0.7 +--------------------------+
| 117 . cc12 |
| m1 - +Speak language 12.40 0.15 | 0.18 -0.14 -0.03 0.28 0.00 | 1.2 1.6 0.1 8.4 0.0 | 0.22 0.13 0.01 0.52 0.00 |
| m2 - -Speak langauge 1.65 7.66 | -1.39 1.04 0.22 -2.11 0.01 | 9.3 11.8 0.7 63.7 0.0 | 0.25 0.14 0.01 0.58 0.00 |
+------------------------------------------+------- CUMULATED CONTRIBUTION = 10.5 13.4 0.8 72.2 0.0 +--------------------------+
| 118 . cc13 |
| m1 - +Dominant religion 5.77 1.48 | 0.60 0.36 0.89 0.09 -0.19 | 6.2 5.0 38.3 0.4 2.0 | 0.25 0.09 0.54 0.01 0.02 |
| m2 - -Dominant religion 7.97 0.79 | -0.44 -0.26 -0.65 -0.07 0.13 | 4.5 3.6 27.7 0.3 1.3 | 0.24 0.09 0.53 0.01 0.02 |
+------------------------------------------+------- CUMULATED CONTRIBUTION = 10.7 8.6 65.9 0.7 3.3 +--------------------------+
| 119 . cc14 |
| m1 - +Respect law 12.17 0.17 | 0.15 -0.27 0.13 -0.11 0.13 | 0.8 5.7 1.7 1.4 2.0 | 0.12 0.41 0.10 0.07 0.10 |
| m2 - -Respect law 1.72 7.33 | -1.02 1.87 -0.93 0.82 -0.94 | 5.3 39.7 12.4 10.0 14.2 | 0.14 0.48 0.12 0.09 0.12 |
+------------------------------------------+------- CUMULATED CONTRIBUTION = 6.0 45.5 14.1 11.4 16.1 +--------------------------+
| 120 . cc15 |
| m1 - +Feel national 12.53 0.14 | 0.19 -0.11 -0.07 -0.10 -0.22 | 1.4 1.0 0.4 1.1 5.8 | 0.27 0.09 0.03 0.07 0.35 |
| m2 - -Feel national 1.43 9.01 | -1.67 1.00 0.58 0.90 1.96 | 11.7 9.4 4.0 10.0 51.7 | 0.31 0.11 0.04 0.09 0.43 |
+------------------------------------------+------- CUMULATED CONTRIBUTION = 13.1 10.4 4.4 11.1 57.5 +--------------------------+

40
Figure A1. Country trajectories from 1995 to 2013 for six selected countries. Including confidence
ellipses at 0.05 level.
”Ethnic”
”Civic”
”Non-mobilised”
”Mobilised”