Aalborg Universitet LUCIA - A Tool for Land Use Change ...
13
Aalborg Universitet LUCIA - A Tool for Land Use Change Impact Analysis Hansen, Henning Sten Published in: ScanGIS '2007 Publication date: 2007 Document Version Publisher's PDF, also known as Version of record Link to publication from Aalborg University Citation for published version (APA): Hansen, H. S. (2007). LUCIA - A Tool for Land Use Change Impact Analysis. In J. T. Bjørke, & H. Tveite (Eds.), ScanGIS '2007: Proceedings of the 11th Scandinavian Research Conference on Geographical Information Science (pp. 157-168). ScanGIS. General rights Copyright and moral rights for the publications made accessible in the public portal are retained by the authors and/or other copyright owners and it is a condition of accessing publications that users recognise and abide by the legal requirements associated with these rights. - Users may download and print one copy of any publication from the public portal for the purpose of private study or research. - You may not further distribute the material or use it for any profit-making activity or commercial gain - You may freely distribute the URL identifying the publication in the public portal - Take down policy If you believe that this document breaches copyright please contact us at [email protected] providing details, and we will remove access to the work immediately and investigate your claim. Downloaded from vbn.aau.dk on: April 02, 2022
Transcript of Aalborg Universitet LUCIA - A Tool for Land Use Change ...

Aalborg Universitet
LUCIA - A Tool for Land Use Change Impact Analysis
Hansen, Henning Sten
Published in:ScanGIS '2007
Publication date:2007
Document VersionPublisher's PDF, also known as Version of record
Link to publication from Aalborg University
Citation for published version (APA):Hansen, H. S. (2007). LUCIA - A Tool for Land Use Change Impact Analysis. In J. T. Bjørke, & H. Tveite (Eds.),ScanGIS '2007: Proceedings of the 11th Scandinavian Research Conference on Geographical InformationScience (pp. 157-168). ScanGIS.
General rightsCopyright and moral rights for the publications made accessible in the public portal are retained by the authors and/or other copyright ownersand it is a condition of accessing publications that users recognise and abide by the legal requirements associated with these rights.
- Users may download and print one copy of any publication from the public portal for the purpose of private study or research. - You may not further distribute the material or use it for any profit-making activity or commercial gain - You may freely distribute the URL identifying the publication in the public portal -
Take down policyIf you believe that this document breaches copyright please contact us at [email protected] providing details, and we will remove access tothe work immediately and investigate your claim.
Downloaded from vbn.aau.dk on: April 02, 2022

LUCIA – A Tool for Land Use Change Impact Analysis
Henning Sten Hansen
National Environmental Research Institute & Aalborg University
Frederiksborgvej 399
DK-4000 Roskilde
Phone : +45 46 30 18 07
Fax : +45 46 30 12 12
Abstract. Land use and land cover changes have significant impact on the
environment and accordingly this topic has gained increasing political
awareness during the last decade. Using modelling and simulation, we can
increase our understanding of the land-use system and reduce uncertainty
concerning decisions. The current paper describes the development of a grid
based land-use simulation model – LUCIA - facilitating the decision-making
process through an adaptive and transparent modelling system. Accordingly,
user friendliness and processing speed have been given top priority in the
design and implementation of the system.
1 Introduction
Land use and land cover changes have significant impact on the environment and
accordingly this topic has gained increasing political awareness during the last decade
Thus the European Union has carried out two land cover mapping projects (CORINE)
in the years 1990 and 2000. Besides a CORINE-2006 land cover mapping is currently
under construction.. Spatial planning can be used as an instrument to coordinate
socio-economic development by preventing environmental problems and
simultaneously protecting the natural environment and the cultural environment.
Furthermore, EU has agreed on two initiatives on spatial development and planning.
ESDP - the European Spatial Development Perspective [1] deals with the general
principles for land use changes, whereas the Recommendation on Integrated Coastal
Zone Management [2] focuses on the development of the European coastal zones. The
challenge for planning is to ensure the efficient use of limited land resources and to
contribute to balanced regional business development and balanced use of resources,
including natural and landscape resources, soil, water and air. This can be
accomplished through for example involving all stakeholders and politicians from an
early stage in the planning process, and by developing tools for assessing the
consequences for various planning initiatives – here under setting up scenarios for
finding the best balance between different interests.
157
Using modelling and simulation, we can reduce uncertainty and increase our
understanding of the land-use system. Spatial planning is a future-oriented activity,
strongly conditioned by the past and present, and the planners need to enhance their
analytical, problem solving and decision making capabilities. With the help of land-
use models, it can facilitate scenario building and provide an important aid in the
decision making process. During the last few years several land-use modelling
systems have been developed, but the models are not available for general use.
The aim with the current project has been to develop a land-use simulation model
facilitating the decision process including the public participation phase concerning
regional development plans – particularly in the coastal zone. Consequently, the
model needs to be adaptive and extensible to include changes required by the spatial
planners, the local politicians and the wide range of stakeholders. Furthermore it must
be easy to explain the model and how the results are the outcome of the various
driving forces
The paper is divided into 5 parts. After the introduction follows a discussion of
land-use modelling and a conceptual description of the current model. Then in the
next section follows a description of the implementation and calibration of the model.
To illustrate the potential use of the model the next-to-last section presents some
example scenarios. The paper ends with some conclusions and an outline for
subsequent work.
2 Land-use dynamics and modelling
Land-use changes are complex interactions between the human society and the bio-
physical environment, and setting up a reliable model is a huge challenge. Models of
land-use change can address two separate questions: a) where are land-use changes
likely to take place – i.e. the location of change); b) and at what rates are changes
likely to progress – i.e. the quantity of change [3]. A prerequisite to the development
of realistic land-use simulation models is the identification of the most important
drivers of change, and how to represent these drivers in a model. The determinants of
land-use change can be divided into two main categories: a) the bio-physical drivers,
and b) the socio-economic drivers. The bio-physical drivers consist of various
characteristics and processes concerning the natural environment such as: topography,
soil types, drainage patterns, climate and availability of natural resources. Usually, the
bio-physical drivers do not cause land-use change. However they do cause land cover
change, which subsequently may affect land-use decisions. The socio-economic
drivers comprise factors such as: population change, industrial structure, economic
development, technological change, policies and legislation, spatial interaction, etc.
158 Proceedings, ScanGIS’2007
2.1 Model definition
Basically the current model simulates future land-use patterns based on socio-
economic drivers at two distinct levels [4], and the land-use types are divided into
three categories, similarly to for example the MOLAND model [5] [6]. The most
important category is the active land-use types, which are forced by the demands
generated externally. Another category is the passive land-use types, which are not
driven by an external demand, but on the other hand enter into the calculations,
because they can disappear by being transformed into one of the active land-uses. The
final category is the static land-uses, which cannot be transformed into one of the
active land-uses, but will nevertheless affect the land-use simulation by attracting or
repelling land-use transformation within their vicinity.
The overriding driving forces are basically population growth and economic
growth. However, in the current project related to the coastal zone particular emphasis
must be put on growth in recreational activities – particularly the expansion of
summer cottage areas. These drivers represent what we call macro-level drivers, and
they are modelled externally to our model in various sector models, and basically
define the demand for land from each active land-use type.
At the micro level, we deal with drivers often used in various land-use modelling
efforts. The first element to consider is obviously the suitability of each grid cell – i.e.
how the specific characteristics of each cell can support a given land-use. The next
element to consider is accessibility – i.e. access to the transportation network. Some
activities like shopping require better accessibility than for example recreational
activities. Often the latter activity even feels attracted to areas with low accessibility
due to for example lower noise levels in such areas. The third element to involve in
the model is the neighbouring effect, which represents the attractive or repulsive
effects of various land-uses within the neighbourhood. It is generally well known that
some land-use types for example private service (shopping) tends to cluster, whereas
others – e.g. recreation and industry tend to repel each other. However cells, which
are more remote, will have a smaller effect. Within the model we refer to this effect
by the term proximity. The fourth micro level driver for urban development can be
summarised in the term attractiveness. Generally, bigger cities are considered more
attractive due the wide supply of services and jobs, but even within cities some
neighbourhoods are considered more attractive than others, and this kind of
attractiveness can even change over time. These four headline factors – suitability,
accessibility, proximity and attractiveness - define the basic preconditions for the cells
ability to support a given land-use, and are in some degree fixed, although the
accessibility can be changed by for example improving the infrastructure. Policy
making at national and local level have a strong influence on land-use – particularly
policies that have a spatial manifestation like creation of conservation areas or
designation of areas for subsidised development [7]. However even more general
legislation like the EU Common Agricultural Policy has a strong indirect influence on
the spatial development in the rural areas. However, the current version of the model
does only involve policies and legislation with an explicit spatial aim under the
headline Zoning. Based on these principles we can set up a conceptual model for our
land-use simulation model.
Hansen 159

The current model applies a cell-based modelling technique, relying on the general
principles for multi-criteria evaluation, whereas the native CA approach is
disregarded. The transition potential is calculated in two steps. First by combining the
factors in the form of a weighted linear combination, and next the constraints,
consisting of Boolean maps only containing excluded and permitted areas, are created
and multiplied with the factor expression.
PL(t+1) = CL1(t) * CL
2 * … CLn * ( wL
i * FLi )
where
P = Transition potential
C = Constraints (0 or 1)
F = Factors (values between 0.0 and 1.0)
w = individual weight factor between 0 and 1
L = land-use type
The model can easily be adapted and extended by adding more factors or constraints.
Initially w is set to 1.0 for all factors, but during calibration the value of w can be
lowered to obtain a better agreement between the simulated land use and the real
land-use for historical years.
Figure 1. Principles of the LUCIA land-use simulation model.
The factors (Suitability, Accessibility, Proximity and Attractiveness) have
dimensionless values between 0.0 and 1.0, whereas the constraints (Zoning) have
binary values – 0 or 1. By combining the factors and constraints for each active land-
use type (L), we can estimate for each cell the transition potential (P) for changing the
land-use from one type to another. Additionally, we need to incorporate the spatial
distribution of the socio-economic drivers. The number of cell values to be changed
160 Proceedings, ScanGIS’2007

during the iterations is determined by the external drivers. Once the transition
potential has been calculated for all active land-uses the cell transformation process
can start. The cell changes starts with the cell having the highest transition potential
and this process proceeds downwards until the predetermined number of cell changes
for each active land-use category has been reached. This way of doing is in
accordance with von Thünen’s assumption, that (in equilibrium) land is devoted to the
use that generates the highest potential profitability [7].
2.2 The macro level driver data
The socio-economic drivers at the macro level (regional level) comprise factors such
as: population change, industrial structure, economic development, technological
change, policies and legislation. However, these conceptual drivers must be converted
into demand for land for all the active land-use types, and this process is not
straightforward at all. Generally we will expect that a growing population will
increase the demand for residential purposes, and this is usually correct. But what
about a static and even declining population – will this situation free cells from
residential to other purposes? Not necessarily. Within the case area the number of
people fell marginally from 134447 to 134228, but nevertheless the number of cells
with residential land-use increased with 30 cells from 7693 to 7723! This reflects the
so-called thinning out effect, where each dwelling unit houses fewer and fewer
people.
Thus the demand for more space for residential purposes should not only consider
population growth but also this thinning out effect. Similarly, the relationships
between economic growth and the demand for land for industry and service facilities
are not easy to resolve. The economic growth will normally require bigger factories,
but often the production processes become more effective, or the factory moves from
a central location (often near the harbour) to a new location at the urban fringe and
near motorway junctions. This requires new space for industrial purposes, but at the
same time frees their original central location for other purposes – often residential. A
parallel process can be observed for many service facilities. The economic growth in
the current study is based on the regional economic growth index from Denmark
Statistics. It is available from 1993 and forward. The index figures for 1990 – 1992
are estimated from linear extrapolation.
3 Implementation
Cellular automata (CA) is an obvious way to take spatial interaction into account
and CA based models have been a very popular way of implementing dynamic land-
use models. Basically, cellular automata models determine the number of cells to be
changed in the next time step endogenously based on the transition rules defined.
However the pure CA approach is not appropriate for land-use simulation, and
therefore more recent CA models are based on constraint cellular automata being
driven by external forces [8], [9].
Hansen 161
The current model applies a cell-based modelling technique, but the native CA
approach is disregarded. The transition potential is calculated in two steps. First by
combining the factors in the form of a weighted linear combination, and next the
constraints, consisting of Boolean maps only containing excluded and permitted
areas, are created and multiplied with the factor expression. The proximity effect is
calculated using a circular neighbourhood of 1000 meter.
An earlier version of the model [4] was implemented in ArcGIS Spatial Analyst
9.2 using Map Algebra and the Python scripting language. Although this model was
appealing due to the adaptability and transparency of the model, one serious
bottleneck was the really slow simulation performance. However using land-use
simulations in an operational context with decision makers and probably even
stakeholders requires high speed simulations. Therefore the simulation environment is
separated from the GIS software and a modelling application is developed. This new
so-called LUCIA (Land Use Change Impact Analysis) is developed using the Delphi
7 development suite. The simulation speed is strongly improved. The execution time
is reduced with 98 – 99% compared with the ArcGIS solution! Before being used in
LUCIA the original raster data sets has to be converted to ASCII raster format. The
current implementation of LUCIA uses a format which is similar to ASCII rasters
exported from ArcGIS Spatial Analyst. This format facilitates the import and export
of data between LUCIA and one of the most used commercial raster analysis and
modelling packages.
LUCIA is a complete user friendly framework for doing land use change impact
analysis by organising data into projects each containing several alternate scenarios
corresponding to different socio-economic drivers and planning regulations. The user
interface facilitates the comparison of the alternatives, and a general impression of the
GUI can be obtained from figure 2.
The application have facilities for model validation using various Kappa statistics
[10], several analysis tasks supporting the calculation of different spatial indicators –
like cross tabulation, zone analysis, cross classification map, distance analysis, and
fragmentation index.
Finally, LUCIA has multiple visualisation possibilities for comparing the land-use
of two different years, comparing two land-use scenarios and showing and animation
of simulated land-use scenarios. The animation can be controlled by the user, who can
start, pause, stop and zoom the animation. The animation facility is furthermore
equipped with the possibility to define the animation speed. This visualisation and
mapping part is developed using the CartoVCL component library
(http://www.cartoworld.com/cartovcl.htm) facilitating the management and
visualisation of ESRI shape-files, MapInfo MIF and raster images. The visualisation
part in LUCIA is mainly based on the raster component.
162 Proceedings, ScanGIS’2007
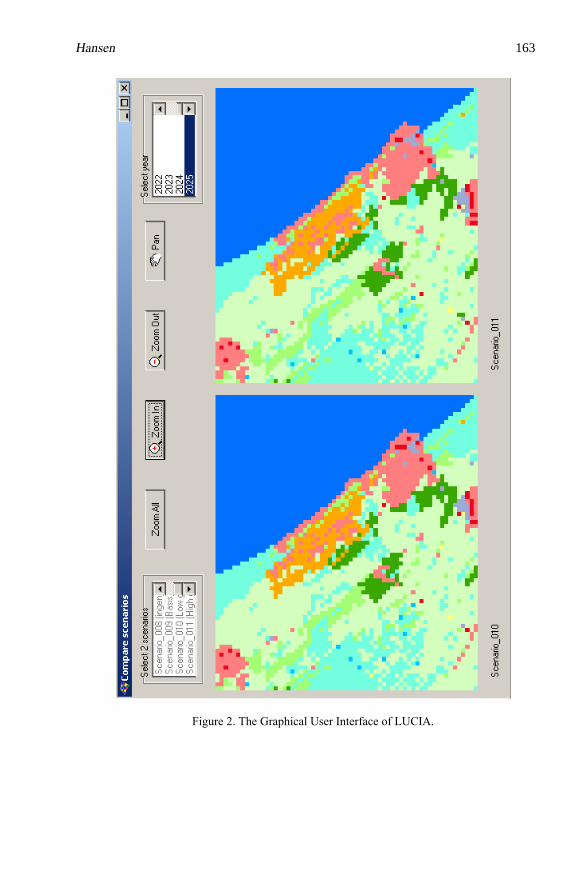
Figure 2. The Graphical User Interface of LUCIA.
Hansen 163
4 Results
The model is tested in the Northern most part of Denmark and contains 594883
grid cells, and using a powerful PC it takes about ten seconds per year to calculate a
land-use simulation, and this speed is really fast. Before doing any simulation of
future land-use patterns, the validation of the model has to be checked. This is done
through the calibration process. After this validation has been carried out satisfactory,
we can use the model for simulating future land-use patterns based on prescribed
driving forces at the macro level, and defined spatial zoning at the micro level.
However, we should keep in mind that the result can only be considered reliable, if
future land-use changes are determined by the same processes as the calibration
period.
4.1 Calibration
Having developed the land-use simulation model, the next step is to calibrate the
model in order to make the model trustworthy. Validating land-use simulation models
is most often done by comparing model results for a historic period with the actual
land-use changes, which have taken place within this period. The calibration period
must be long enough to the underlying processes in the system having time to
manifest them in a representative way. To do this we need land-use maps with some
years between and the corresponding drivers for the same year span. However, the
calibration period is often limited by the availability of data. Concerning detailed
land-use maps we have Corine land cover for the years 1990 and 2000, whereas the
land-use data for built-up areas are available through the Building and Housing
register from the late seventies and onward.
According to the Building and Housing register, 3077 new buildings were built in
the period from 1991 to 2000, but only 1450 of these new buildings were built outside
existing built-up areas represented by 100-meter grid cells. Following the criteria for
defining built-up areas the new buildings created 30 new residential cells, 33 new
industry cells, 30 new service cells and 87 new summerhouse cells. The declining
land-use categories were recreation with 98 cells, arable land with 20 cells, and semi-
nature with 49 cells. However these are net numbers covering up transformation
between the active land-use types.
During the same period the population figures for the case area decreased from
137158 to 136521. The case area is formed by three new municipalities (Hjørring,
Frederikshavn and Læsø), and the population in Hjørring increased from 67405 in
1990 to 68479 in 2000. Consequently the population has fallen substantially for the
two other municipalities. The population in Frederikshavn fell from 67241 in 1990 to
65749 in 2000. For Læsø, which is an island the situation has been negative for
several years, and for the calibration period the population fell from 2512 to 2293 –
corresponding to nearly 9%!
164 Proceedings, ScanGIS’2007

The number of cells changed during the calibration period is in accordance with
the observed number. This is not surprising because the quantification of the demands
for land for the various active land-use types is defined to be in accordance with the
observed development. The spatial distribution of the simulated land-use changes
does not reflect the observed patterns for the calibration period. A better result is
obtained through trial and error processing, where we adjusted the weights for most
factors. Visual inspection reveals many similarities between the simulated land-use
pattern for year 2000 and the real land-use pattern, and the Kappa index varies
between 0.84 and 0.77 for different simulations. You will never be able to simulate a
true land-use pattern, but the purpose with the calibration process is to make a
simulation having the same properties and overall land-use pattern as the calibration
year.
4.2 Example scenario
The world is full of uncertainly, and the dynamic processes of land-use are
interdependent and complex. It is possible, however, to make statements about the
expected outcomes with a reasonable level of certainty. Scenario testing can bring the
complexity into focus and provide a better knowledge base for decisions. Scenarios
can also help to incorporate a long-term view and to illustrate and explain issues to
stakeholders and the general public during the planning process. Below the LUCIA
modelling framework is illustrated by a 20 years land-use simulation for Northern
Jutland.
The Danish Government decided to expand the summer cottage zone – giving
room for between 6000 and 8000 new summer cottages. This decision has been rather
controversial, due to concern for the nature and environment. However, the decision
is taken and the new zones defined. We have then set up two scenarios for future
land-use changes in the light of the new expanded summer cottage zones. The
simulation period is 2005 to 2025. The first (base) scenario is based on the following
assumptions: population development as defined by Denmark Statistics, regional
economic growth as defined by Denmark Statistics and a development in the number
of summer cottages as an average of the period 1990 – 2005. Additionally, the new
summer cottage zones have been added.
Besides to the Government has decided to double the Danish forest area during the
coming 50 years. The aim of the Danish afforestation programme is to increase its
share of the total land area from about 11% to 20-25 percent during the next 80-100
years. The Danish Parliament set up this goal in 1989. According to the National
Afforestation Programme the new forests shall contribute to protect the ground water,
increase the biodiversity, reduce the greenhouse effect, and support outdoor life,
besides the ordinary production of tree.
Doubling the forest during the next 80 – 100 years requires a large effort. Within
the case area in Northern Jutland the forest area amounted to 1206 hectares in 1990.
This figure corresponds to 1206 100-metre cells. Using 80 years as the doubling time
will require that 15 hectares of land will be converted every year – in average.
Hansen 165

Figure 3. Land-use (monitored) in part of Northern Jutland in 2005.
Figure 4. Land-use (simulated) in part of Northern Jutland in 2025.
Figure 5. Land-use legend.
166 Proceedings, ScanGIS’2007
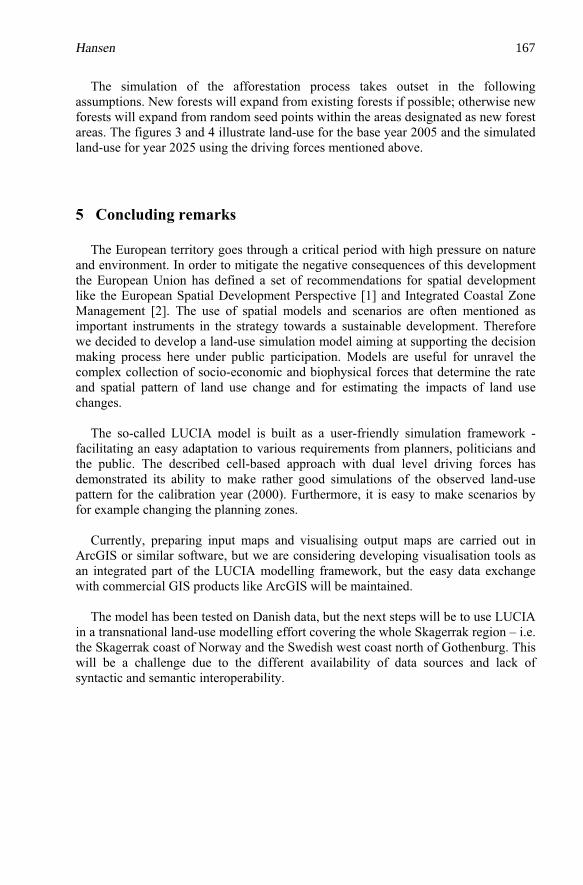
The simulation of the afforestation process takes outset in the following
assumptions. New forests will expand from existing forests if possible; otherwise new
forests will expand from random seed points within the areas designated as new forest
areas. The figures 3 and 4 illustrate land-use for the base year 2005 and the simulated
land-use for year 2025 using the driving forces mentioned above.
5 Concluding remarks
The European territory goes through a critical period with high pressure on nature
and environment. In order to mitigate the negative consequences of this development
the European Union has defined a set of recommendations for spatial development
like the European Spatial Development Perspective [1] and Integrated Coastal Zone
Management [2]. The use of spatial models and scenarios are often mentioned as
important instruments in the strategy towards a sustainable development. Therefore
we decided to develop a land-use simulation model aiming at supporting the decision
making process here under public participation. Models are useful for unravel the
complex collection of socio-economic and biophysical forces that determine the rate
and spatial pattern of land use change and for estimating the impacts of land use
changes.
The so-called LUCIA model is built as a user-friendly simulation framework -
facilitating an easy adaptation to various requirements from planners, politicians and
the public. The described cell-based approach with dual level driving forces has
demonstrated its ability to make rather good simulations of the observed land-use
pattern for the calibration year (2000). Furthermore, it is easy to make scenarios by
for example changing the planning zones.
Currently, preparing input maps and visualising output maps are carried out in
ArcGIS or similar software, but we are considering developing visualisation tools as
an integrated part of the LUCIA modelling framework, but the easy data exchange
with commercial GIS products like ArcGIS will be maintained.
The model has been tested on Danish data, but the next steps will be to use LUCIA
in a transnational land-use modelling effort covering the whole Skagerrak region – i.e.
the Skagerrak coast of Norway and the Swedish west coast north of Gothenburg. This
will be a challenge due to the different availability of data sources and lack of
syntactic and semantic interoperability.
Hansen 167
References
1. COM. ESDP – The European Spatial Development Perspective. (1999)
2. COM. Communication from the Commission to the Council and the European Parliament
on integrated Coastal Zone Management: A Strategy for Europe. (2000)
3. Veldkamp, A. and Lambin, E.F. Predicting land-use change. Editorial. Agriculture
Ecosystems and Environment, vol. 85, pp. 1 – 6. (2001).
4. Hansen, H.S. (2007). An adaptive land-use simulation model for integrated coastal zone
planning. Lecture Notes in Geoinformation and Cartography (in press)
5. Barredo J.I., Kasanko, M., McCormick, N. and Lavalle, C. Modelling dynamic spatial
processes: Simulation of urban future scenarios through cellular automata. Landscape and
Urban Planning, vol. 64, pp. 145-160. (2003)
6. Engelen, G., White, R. and Uljee, I. (2002). The MURBANDY and MOLAND models for
Dublin. Final report, RIKS.
7. Verburg, P.H., van Eck, R., Nijs, T. Dijst, M. and Schot, P.. Determinants of land-use
change patterns in the Netherlands. Environment and Planning B, vol 31, pp. 125 – 150.
(2004)
8. White, R., Engelen, G and Uljee, I. The use of constrained cellular automata for high
resolution modelling of urban land-use dynamics. Environment and Planning B, vol. 24, pp.
323 – 343. (1997)
9. White, R. and Engelen, G. High resolution integrated modelling of the spatial dynamics of
urban and regional systems. Computers Environment and Urban Systems, vol. 24, 383 –
400. (2000)
10.Visser, H. The Map Comparison Kit – methods, software and applications. RIVM report
550002005/2004.Bilthoven.
168 Proceedings, ScanGIS’2007