![How to lay mulch for your landscape in los angeles california[1]](https://static.fdocuments.in/doc/165x107/556d1a5dd8b42a540c8b4901/how-to-lay-mulch-for-your-landscape-in-los-angeles-california1.jpg)
How to lay mulch for your landscape in los angeles california[1]

LANDSCAPE ANALYSIS
LOS ANGELES | PAGE 1

LANDSCAPE ANALYSIS
LOS ANGELES | PAGE 2
Acknowledgements This report was prepared by Susan G. Komen® (Komen), the world’s largest breast cancer organization, and John Snow, Inc. (JSI), a mission-driven national and international public health research and consulting organization dedicated to advancing the health of individuals and communities. The development of this report was made possible thanks to funding from the Fund II Foundation and Merck.
Komen expresses our deepest gratitude to the resilient and powerful women who shared their journeys, their everyday experiences of racism, their trials and tribulations navigating and negotiating health systems, and the simple pleasures in life from which they draw strength to keep going and care for one another. We hope the findings synthesized in this report will uplift the human stories behind breast cancer inequities and persuade decision makers to take action and lay the foundation for systems that better serve Black women. We write these findings in honor of the Black women who did not survive their cancer journeys, and the countless Black lives lost to pervasive structural racism.
We are grateful to the independent consultants, partners, community-based organizations, and local Komen Affiliates around the U.S. for their support in recruitment and outreach. We are also grateful to the academic experts, researchers, and practitioners who provided guidance on data collection tools, data sources, and frameworks for this metropolitan area. They are:
� Kara Adams, CEO, Hidden Treasure Cancer Foundation
� Tiffany Bradshaw, MBA, Owner, Bradshaw & Co. Marketing, Branding & PR
� Shannon Brooks, Executive Coordinator, Antelope Valley Partners for Health
� Aneidra Carrion, MPH, Mission Manager, Susan G. Komen® Los Angeles
� Michelle Fluke, MBA, CEO, Antelope Valley Partners for Health
� DeVera H. Heard, Ph.D., Principal/Administrator (retired), Santa Ana Unified School District and Komen OC Board of Directors
� Dennis R. Holmes, MD, FACS, Breast Cancer Surgeon, Good Samaritan Hospital and Interim Director, Margie Petersen Breast Center, St. John’s Health Center & John Wayne Cancer Institute
� James Johnson, Medical Imaging Director, Watts Healthcare
� Diane Masseth Jones, Acting CEO, YWCA North Orange County
� Arnedra Jordan, MPA, Public Health and Policy Consultant, Susan G. Komen® Los Angeles
� Dana Knoll, MBA, VP Programs, Watts Health Care
� Virginia Martin, Support Group Leader, Sisters Breast Cancer Survivor Network
� Catherine Patterson, MA, MPH, Director, Women’s Health Services, Alta Med Health Services
� Allyson Sonenshine, JD, Founding Director, Orange County Women’s Health Project
� Jay Vadgama, PhD, Vice President for Research and Health Affairs, Charles R. Drew University of Medicine and Science

LANDSCAPE ANALYSIS
LOS ANGELES | PAGE 3
Komen Team: Kim M. Johnson, MD; Stephanie Birkey Reffey, PhD; Kari Wojtanik, PhD; Kristen Hobbs, MPH; Theresa Spitzer Smith, PhD; Danielle Hosein, MPH; Jennifer Edwards, PhD; and Ashley Dedmon, MPH.
JSI Team: Naima Cozier, MSPH; Chanel Richmond; Tajan Braithwaite Renderos, MPH; Karuna S. Chibber, DrPH; Naomi Clemmons, MPH; Julia Cohen; Terry Greene, MPH; Kiely Houston, MSPH; Tracey Kirui; Sneha Mehta; Aisha Moore, MPH; Oluwatunmise Olowojoba; Alison Salomon, MPH, MCRP; Erin Shigekawa, MPH; and Tea Slater.
Suggested Citation:
Susan G. Komen. (2021, August 4). Closing the Breast Cancer Gap: A Roadmap to Save the Lives of Black Women in America, Los Angeles, CA. https://www.komen.org/wp-content/uploads/AAHEI_Los-Angeles-Landscape-Analysis-Report.pdf

LANDSCAPE ANALYSIS
LOS ANGELES | PAGE 4
Table of Contents Acknowledgements ........................................................................................................................... 2
Executive Summary ........................................................................................................................... 5
Background and Purpose ................................................................................................................... 5 About This Report ................................................................................................................................................. 5 Key Findings ........................................................................................................................................................... 6 Recommendations ................................................................................................................................................ 7
Introduction ...................................................................................................................................... 8 Project Objectives ............................................................................................................................................... 10
Methods ....................................................................................................................................... 122 Qualitative Data .................................................................................................................................................. 17 Policy Data ........................................................................................................................................................... 19
Section 1 Findings: Burden of Breast Cancer .................................................................................. 200 Demographics .................................................................................................................................................... 200 Breast Cancer Disease Burden in the Los Angeles MTA .................................................................................... 211 Community Member Perspectives across the Breast Cancer Care Continuum ................................................ 266
Screening .................................................................................................................................................... 266 Diagnosis .................................................................................................................................................... 311 Treatment .................................................................................................................................................. 322 Survivorship ................................................................................................................................................ 358
Residential Segregation ....................................................................................................................................... 39 Personally Mediated Racism ............................................................................................................................. 411 Health Disparities .............................................................................................................................................. 422 Access to Health Services ................................................................................................................................. 444 Social and Economic Vulnerability ...................................................................................................................... 47
Policy Context ................................................................................................................................. 51 The Patient Protection and Affordable Care Act (ACA) ....................................................................................... 51 National Breast and Cervical Cancer Early Detection Program (NBCCEDP) and Breast and Cervical Cancer Treatment Program (BCCTP) ............................................................................................................................. 533 Source: Breast and Cervical Cancer Treatment Program (BCCTP), California Department of Health Care Services, 2020. ................................................................................................................................................... 543 Flexibility in the Medicaid Program via Medicaid Waivers ............................................................................... 544 Cancer Plan for California .................................................................................................................................. 544
Discussion and Conclusion ............................................................................................................. 566
Recommendations .......................................................................................................................... 59 Micro-Level Strategies ......................................................................................................................................... 60 Mezzo-Level Strategies ...................................................................................................................................... 633 Macro-Level Strategies ...................................................................................................................................... 655
Appendix A. Map Measures .......................................................................................................... 677
Appendix B. Abbreviations & Glossary .......................................................................................... 688
Appendix C. Focus Group Guides .................................................................................................. 733
References .................................................................................................................................... 977
LANDSCAPE ANALYSIS
LOS ANGELES | PAGE 5
Executive Summary About Susan G. Komen
Susan G. Komen® (subsequently referred to as “Komen”) is the world’s leading nonprofit breast cancer organization, working to save lives by meeting the most critical needs in communities and investing in breakthrough research to prevent and cure breast cancer.
Background and Purpose Breast cancer is the most common cancer diagnosed among women in the United States and is the second leading cause of death among women after lung cancer with women having a one in eight chance of developing breast cancer over the course of their lifetimes. With the increasing availability of screening mammography screening, earlier detection and improvements in breast cancer treatment, the overall breast cancer mortality rate among women in the U.S. has declined by 41% from 1989 through 2018 (American Cancer Society, 2019a). However, these trends vary by race and ethnicity.
Research shows that despite recent scientific advancements, there are widespread disparities in breast cancer statistics between Black and white women. Among Black women, breast cancer is the most common type of cancer and the second leading cause of cancer death (American Cancer Society, 2019b). Breast cancer mortality is about 40 percent higher in Black women than in white women. Furthermore, although breast cancer survival in Black women has increased over time, survival rates remain lower than among white women (Howlander et al., 2020)
About This Report In 2015, in partnership with Fund II Foundation, Komen launched the African American Health Equity Initiative (AAHEI), now known as Stand for H.E.R., to improve breast health equity for Black women. The AAHEI aims to reduce breast cancer disparities in Black women starting in the 10 U.S. metropolitan areas (referred to throughout this report as MTAs or metro) where the inequities are greatest: Atlanta, GA; Chicago, IL; Dallas-Fort Worth, TX; Houston, TX; Los Angeles, CA; Memphis, TN; Philadelphia, PA; St. Louis, MO; Virginia Beach, VA; and Washington, D.C.
Komen engaged John Snow, Inc. (JSI), a public health research and consulting organization, to conduct a landscape analysis in each MTA. The main purpose of each landscape analysis was to understand the underlying causes of breast cancer inequities across the care continuum among Black women, with a focus on systemic and social determinants of health.
The methods involved a literature scan, compiling quantitative data, reviewing federal and state policies, and collecting qualitative data from community members and providers to prepare a landscape analysis report for each of the 10 MTAs.
This study does not attempt to establish causality between underlying risk factors and breast cancer outcomes.

LANDSCAPE ANALYSIS
LOS ANGELES | PAGE 6
Rather, the analysis aims to:
1) elevate key findings regarding the underlying causes for breast cancer inequities across the care continuum among Black women, and
2) offer insights that can inform strategic discussions about strengths, gaps, challenges, and opportunities to promote breast health equity and create community- and systems-level change.
Key Findings
� Throughout the Los Angeles MTA, Black women are more likely to die from breast cancer than their white counterparts, even though the incidence rates are comparable and often lower among Black women compared to white women. In both counties for which data are available, Black women die from breast cancer at a higher rate than do white women who live in the same place.
� In the Los Angeles MTA, Black women receive mammograms less frequently than their white counterparts, and therefore are diagnosed with breast cancer at a later stage when treatment options are more limited.
� A closer look at the data suggests that there is a trend in terms of late-stage incidence rates comparing Black to white women. In Los Angeles and Orange County, the late-stage incidence rates are higher among Black women.
� Overall, a study of breast cancer disease burden measures suggests that throughout the Los Angeles MTA, Black women are more likely to die from breast cancer than their white counterparts, even though they are diagnosed with the disease at lower rates. This pattern is evident in Orange County, where the breast cancer incidence rate among Black women is lower than that of white women, at 110.8 for Black women and 131.8 for white women.
� Decades of discriminatory practices have led to striking segregation in the Los Angeles MTA. The Los Angeles MTA is segregated across a number of dimensions, including race and socioeconomic factors, creating stark contrasts by geography. Approximately 6.1 million people of color live in the Los Angeles MTA, comprising 46 percent of the region’s total population. More than 85 percent of the 928,000 Black women who live in the Los Angeles MTA reside in Los Angeles County.
� That being said, both counties in the MTA have low percentages of Black residents. In addition to the MTA not having many Black residents, both of the counties in the MTA are internally racially segregated. Counties’ internal segregation can be measured using the Black/white dissimilarity index to assess the extent to which there may be residential.
� The stories of Black women, breast cancer survivors and undiagnosed, convey their experience of fear and shame, racism, quality of mammograms and access to screening.
� Finally, patients who are interested in alternative treatment but are not granted their preferred treatment from their provider are lost in the continuum of care, a finding which emerged from our qualitative data.
� Overall, the data suggest breast health inequities among Black women in the Los Angeles MTA could be explained by economic vulnerability driven by institutionalized racism and disparities in access and quality of care.

LANDSCAPE ANALYSIS
LOS ANGELES | PAGE 7
Recommendations The following strategies, research, and interventions are recommended to better understand and address the complexity of the root causes of breast cancer inequities in the Los Angeles MTA (full details provided in the recommendations section of this report). The recommendations follow a systems framework:
� the micro level (the level at which patients and providers interact), � the mezzo level (the level at which systems interact), and � the macro level (the policy level).
Micro-Level Strategies
� Increase access to culturally responsive patient navigators. � Develop education and programming to better serve Black women in treatment. � Implement implicit bias trainings for providers, administrators and health care staff. � Increase education about family health history in the community to identify high-risk families
and offer genetic counseling and testing and breast cancer screening to meet the need.
Mezzo-Level Strategies
� Increase access to integrated care to improve the breast cancer care experience. � Support Quality Improvement (QI) initiatives along the breast cancer continuum of care. � Implement a culturally relevant health promotion campaign intended to increase knowledge of
screening guidelines. � Support a community-based participatory applied research project to explore how to support
breast cancer patients experiencing mental strain. � Support a community-based participatory research project to identify and implement strategies
for culturally relevant survivorship support.
Macro-Level Strategies
� Conduct a root cause analysis relating to delays in breast cancer diagnosis. � Support financial assistance programs. � Support efforts to develop guidelines and policies that address disproportionate breast cancer
mortality among Black women, including increased genetic counseling and testing services.
This landscape analysis report conveys comprehensive issues facing Black women in this MTA. These recommendations are intended to be a call to action for all community-based organizations, policymakers, hospitals, healthcare providers, faith-based organizations, civic leaders and citizens. The recommendations are offered as evidence-informed strategies to reduce breast cancer disparities among Black women.

LANDSCAPE ANALYSIS
LOS ANGELES | PAGE 8
About Susan G. Komen Susan G. Komen® (subsequently referred to as “Komen”) is the world’s leading nonprofit breast cancer organization, working to save lives by meeting the most critical needs in communities and investing in breakthrough research to prevent and cure breast cancer. Komen has an unmatched, comprehensive 360-degree approach to fighting this disease across all fronts and supporting millions of people in the U.S. and in countries worldwide. Komen advocates for patients, drives research breakthroughs, improves access to high-quality care, offers direct patient support and empowers people with trustworthy information. Founded by Nancy G. Brinker, who promised her sister, Susan G. Komen, that she would end the disease that claimed Suzy’s life, Komen remains committed to supporting those affected by breast cancer today, while tirelessly searching for tomorrow’s cures.
Introduction Breast cancer is the most common cancer diagnosed among women in the U.S. and is the second leading cause of death among women after lung cancer. Women in the U.S. have a one in eight chance of developing breast cancer over the course of their lifetimes. With the increasing availability of screening mammography screening, earlier detection, and improvements in breast cancer treatment, the overall breast cancer mortality rate among women in the U.S. declined by 41 percent over the last 30 years (American Cancer Society, 2021).
However, these trends vary by race and ethnicity. Research shows that despite recent scientific advancements, there are widespread racial health disparities in breast cancer comparing Black women to white women.
Black women are, on average, 40 percent more likely to die of the disease as compared to white women (Howlader et al., 2018). The five-year breast cancer survival rate for Black women is 83 percent as compared to 92 percent for white women (Howlader et al., 2020).
However, overall breast cancer incidence among Black women is lower than among white women. However, from 2013-2017 for women younger than 40, incidence is higher among non-Hispanic Black women than non-Hispanic white women (No one et al., 2017). , the incidence rates are higher among Black women under age 40 (where incidence is the number of new cases that develop in a specific time period) (American Cancer Society, 2020). Black women are also more likely than white women to be diagnosed with aggressive breast cancers, such as Triple-negative Breast Cancer (TNBC) and inflammatory breast cancer and are more likely to be diagnosed at a later stage, when treatments are limited, costly, and the prognosis is poor (American Cancer Society, 2019; Williams et al., 2016).
Through the Stand for H.E.R. Equity Initiative Komen seeks to improve breast health equity by reducing late stage diagnosis and morality for Black women in the 10 U.S. metropolitan areas (referred to throughout this report as MTAs or metro) where Black breast cancer disparities are the greatest.
These MTAs include Atlanta, GA; Chicago, IL; Dallas-Fort Worth, TX; Houston, TX; Los Angeles, CA; Memphis, TN; Philadelphia, PA; St. Louis, MO; Virginia Beach, VA; and Washington, D.C.

LANDSCAPE ANALYSIS
LOS ANGELES | PAGE 9
As part of the Stand for H.E.R., Komen engaged JSI, a public health research and consulting organization, to conduct a landscape analysis in each MTA to better understand the underlying causes of breast cancer inequities across the care continuum among Black women. Findings from each landscape analysis report serve to inform the design and implementation of Komen’s long-term and cross-sector collaborative efforts as well as serve as a call to action for all community-based organizations, policymakers, hospitals, healthcare providers, faith-based organizations, civic leaders and citizens to engage in evidence-informed strategies to reduce breast cancer disparities among Black women.

LANDSCAPE ANALYSIS
LOS ANGELES | PAGE 10
Project Objectives The specific objectives of the landscape analysis are:
� To understand breast cancer disease burden in each MTA by describing breast cancer measures (incidence, in situ incidence, late-stage diagnosis and mortality) and other key health metrics (such as life expectancy and age-adjusted mortality), comparing Black to white women, per data availability.1
� To describe systemic barriers, including adverse SDOH, and other socioeconomic and contextual factors that may contribute to breast cancer inequities, comparing counties within each MTA.
� To explore community members’ perspectives regarding their experiences with breast cancer screening and treatment, and their perceptions regarding barriers/facilitators to obtaining care, factors contributing to breast cancer inequities, and suggestions for advancing breast health equity.
� To explore health care provider perspectives regarding individual, community, and health systems factors contributing to breast cancer inequity, along with their recommendations for system-level change.
� To identify policy, systems, and environmental (PSE) level strategies that may help to mitigate breast cancer inequities and achieve Komen’s goals of improving breast health equity.
This report summarizes findings from the analysis conducted for the Los Angeles MTA. The report begins with a discussion of methods used, followed by guiding frameworks and key findings from the literature scan that informed all aspects of the project. The subsequent sections review key findings pertaining to the project objectives as stated above. Findings are organized into two sections: Section 1 describes the breast cancer disease burden in the MTA through secondary data and community member perspectives. Section 2 explores the systemic barriers and underlying root causes, including experiences of racism and adverse SDOH that may be driving breast cancer inequities. The final section includes recommendations to reduce breast cancer disparities and advance breast health equity.
Given the goals and methods traditionally used in a landscape analysis project, the study’s intent is not to provide conclusive evidence or to establish causality between particular factors and breast cancer outcomes among Black women. Rather, the study aims to:
1) elevate key findings regarding the underlying causes for breast cancer inequities across the care continuum among Black women, and
1 As defined in the Abbreviations & Glossary, these terms are defined as follows: Incidence is defined as the number of new cases of a disease that develop in a specific time period; In situ means a condition where abnormal cells are found in the milk ducts or lobules of the breast, but not in the surrounding breast tissue. In situ means "in place;” Late-stage diagnosis indicates that breast cancer has spread beyond the breast to lymph nodes, surrounding tissue or other organs in the body (most often the bones, lungs, liver or brain).

LANDSCAPE ANALYSIS
LOS ANGELES | PAGE 11
2) offer insights that can inform strategic discussions about strengths, gaps, challenges, and opportunities to promote breast health equity and create community- and systems-level change.
These recommendations are intended to be a call to action for all community-based organizations, policymakers, hospitals, healthcare providers, faith-based organizations, civic leaders and citizens. The recommendations are offered as evidence-informed interventions to reduce breast cancer disparities among Black women.

LANDSCAPE ANALYSIS
LOS ANGELES | PAGE 12
Methods The methods include a literature scan, compiling quantitative data, reviewing federal and state policies, and collecting qualitative data from community members and healthcare providers to prepare this landscape analysis report.
This study defines the Los Angeles MTA in accordance with the US Office of Management and Budget’s 2015 definition of central counties in the Los Angeles-Long Beach-Anaheim metropolitan statistical area (MSA). This area encompasses the city of Los Angeles and comprises Los Angeles County and Orange County in California (Office of Management and Budget, 2010; U.S. Census Bureau). Data are generally unavailable at the MSA-level of geographic specificity, so researchers collected and analyzed data at the county level (a sub-MSA unit) for most indicators. State- and national-level data (both super-MSA units of measure) were collected for measures related to breast cancer disease burden to provide additional points of comparison.
TABLE 1. LOS ANGELES METRO AREA DATA METHODS AND SOURCES
Demographics
Subcategory Indicator Source
Population Total Population American Community Survey 2013-2017 5-Year Estimates (US Census Bureau)
Sex Percent of Population that is Male
American Community Survey 2013-2017 5-Year Estimates (US Census Bureau)
Sex Percent of Population that is Female
American Community Survey 2013-2017 5-Year Estimates (US Census Bureau)
Age Percent of Population that is Under Age 18
American Community Survey 2013-2017 5-Year Estimates (US Census Bureau)
Subcategory Indicator Source
Age Percent of Population that is Age 18-64
American Community Survey 2013-2017 5-Year Estimates (US Census Bureau)
Age Percent of Population that is Over Age 65
American Community Survey 2013-2017 5-Year Estimates (US Census Bureau)
Race Percent of Population that is White
American Community Survey 2013-2017 5-Year Estimates (US Census Bureau)
Race Percent of Population that is Black
American Community Survey 2013-2017 5-Year Estimates (US Census Bureau)
Race Percent of Population that is Asian
American Community Survey 2013-2017 5-Year Estimates (US Census Bureau)
Race Percent of Population that is American Indian or Alaska Native
American Community Survey 2013-2017 5-Year Estimates (US Census Bureau)
Race Percent of Population that is Native Hawaiian or Other Pacific Islander
American Community Survey 2013-2017 5-Year Estimates (US Census Bureau)
Race Percent of Population that is Some Other Race
American Community Survey 2013-2017 5-Year Estimates (US Census Bureau)
Race Percent of Population that is Two or more Races
American Community Survey 2013-2017 5-Year Estimates (US Census Bureau)

LANDSCAPE ANALYSIS
LOS ANGELES | PAGE 13
Race Percent of Population that is Hispanic/Latino
American Community Survey 2013-2017 5-Year Estimates (US Census Bureau)
Race Percent of Population that is White not Hispanic
American Community Survey 2013-2017 5-Year Estimates (US Census Bureau)
Race Percent of Population that is Minority Race
American Community Survey 2013-2017 5-Year Estimates (US Census Bureau)
Target Population Number of Black Women over age 45
American Community Survey 2013-2017 5-Year Estimates (US Census Bureau)
Social Determinants of Health
Subcategory Indicator Source Social Vulnerability Social Vulnerability Index Score 2016 Social Vulnerability Index (US Centers for Disease
Control and Prevention)
Economic Security
Percent of Population that is Uninsured
American Community Survey 2013-2017 5-Year Estimates (US Census Bureau)
Economic Security
Percent of Population Below 200% FPL
American Community Survey 2013-2017 5-Year Estimates (US Census Bureau)
Economic Security
Percent of Black Women over age 45 who live Below Poverty Level
American Community Survey 2013-2017 5-Year Estimates (US Census Bureau)
Food Security Location of Food Deserts 2019 Food Access Research Atlas (US Department of Agriculture, Economic Research Service)
Food Security Percent of Population that is Food Insecure 2019 County Health Rankings (County Health Rankings)
Food Security Percent of Total Population with Limited Access to Healthy Foods
2019 County Health Rankings (County Health Rankings)
Food Security Percent of Black Households Receiving SNAP/EBT
American Community Survey 2013-2017 5-Year Estimates (US Census Bureau)
Subcategory Indicator Source
Education Percent of Population over age 25 that has High School Degree or Higher
American Community Survey 2013-2017 5-Year Estimates (US Census Bureau)
Education Percent of Population over age 25 that has Bachelor's Degree or Higher
American Community Survey 2013-2017 5-Year Estimates (US Census Bureau)
Education Percent of Black Women over age 25 without a High School Degree
American Community Survey 2013-2017 5-Year Estimates (US Census Bureau)
Transportation Percent of Households without a Vehicle
American Community Survey 2013-2017 5-Year Estimates (US Census Bureau)
Transportation Percent of Total Population Commuting more than 45 Minutes to Work
American Community Survey 2013-2017 5-Year Estimates (US Census Bureau)
Transportation Percent of Total Population that Commutes to Work using Public Transportation
American Community Survey 2013-2017 5-Year Estimates (US Census Bureau)
transportation Percent of Population Commuting to Work by Foot/Bike/Other
American Community Survey 2013-2017 5-Year Estimates (US Census Bureau)

LANDSCAPE ANALYSIS
LOS ANGELES | PAGE 14
housing stability Percent of Households that are Housing-Cost Burdened
2016 Comprehensive Housing Affordability Strategy dataset (US Department of Housing and Urban Development)
housing stability Proportional Change in Population with a Bachelor's Degree or Higher
American Community Survey 2013-2017 5-Year Estimates (US Census Bureau); American Community Survey 2008-2012 5-Year Estimates (US Census Bureau
housing stability Percent Change in Median Household Income
American Community Survey 2013-2017 5-Year Estimates (US Census Bureau); American Community Survey 2008-2012 5-Year Estimates (US Census Bureau
segregation Black/White Dissimilarity Index Score 2019 County Health Rankings (County Health Rankings)
racism Location of Redlining 2019 Mapping Inequality Project (University of Richmond)
racism
Number of Hate Crimes Committed with a Race/Ethnicity/Ancestry Bias Motivation
2017 Hate Crime Statistics (Federal Bureau of Investigation, Uniform Crime Reporting)
racism Number of Fair Housing Act Cases Filed with a Race Basis
Fair Housing Act Cases dataset (US Department of Housing and Urban Development, Office of Fair Housing and Equal Opportunity)
racism Number of Black residents Killed by Police The Counted Database (The Guardian)
Health and Wellness Subcategory Indicator Source
Quality of Life County Health Rankings Percentile 2019 County Health Rankings (County Health Rankings)
Quality of Life Percent of Adults Reporting "Fair" or "Poor" Health 2019 County Health Rankings (County Health Rankings)
Quality of Life Average Number of Poor Physical Health Days 2019 County Health Rankings (County Health Rankings)
Subcategory Indicator Source
Quality of Life Average Number of Poor Mental Health Days 2019 County Health Rankings (County Health Rankings)
Quality of Life Life Expectancy 2019 County Health Rankings (County Health Rankings)
Quality of Life Life Expectancy for Whites 2019 County Health Rankings (County Health Rankings)
Quality of Life Life Expectancy for Blacks 2019 County Health Rankings (County Health Rankings)
Quality of Life Premature Age-Adjusted Mortality 2019 County Health Rankings (County Health Rankings)
Quality of Life Premature Age-Adjusted Mortality for Whites 2019 County Health Rankings (County Health Rankings)
Quality of Life Premature Age-Adjusted Mortality for Blacks 2019 County Health Rankings (County Health Rankings)
Health Behaviors Percent of Adults who are Obese 2019 County Health Rankings (County Health Rankings)
Health Behaviors Percent of Adults who Drink Excessively 2019 County Health Rankings (County Health Rankings)
Health Behaviors Percent of Adults who are Physically Inactive 2019 County Health Rankings (County Health Rankings)
Health Systems

LANDSCAPE ANALYSIS
LOS ANGELES | PAGE 15
Subcategory Indicator Source
Primary Care Percent of Total Population that is Medically Underserved
HRSA Data Warehouse (US Department of Health and Human Services, Health Resources & Services Administration)
Primary Care Number of PCPs 2019 County Health Rankings (County Health Rankings)
Primary Care Persons per PCP 2019 County Health Rankings (County Health Rankings)
Primary Care Number of "Other" PCPs 2019 County Health Rankings (County Health Rankings)
Primary Care Persons per "Other" PCP 2019 County Health Rankings (County Health Rankings)
Primary Care Number of Private PCPs HRSA Data Warehouse (US Department of Health and Human Services, Health Resources & Services Administration)
Primary Care Location of FQHCs HRSA Data Warehouse (US Department of Health and Human Services, Health Resources & Services Administration)
Primary Care Location of Hospitals HRSA Data Warehouse (US Department of Health and Human Services, Health Resources & Services Administration)
Cancer Care Location of Comprehensive Cancer Centers National Cancer Institute
Cancer Care Location of Screening mammography Facilities American College of Radiology
Cancer Care Location of Treatment Facilities American College of Surgeons; Association of Community Cancer Centers
Cancer Care Location of NCORP Sites National Cancer Institute
Cancer Care Number of Mobile Screening mammography Centers Google search
Cancer Care Number of Private Oncologists Docstop and Healthgrades Cancer Support Number of Cancer Coalitions 2015 Affiliate profile files and Google search
Cancer Support Number of Survivor/Support Groups 2015 Affiliate profile files and Google search
Breast Cancer Disease Burden Subcategory Indicator Source
Prevalence Prevalence 2017 State Cancer Profiles (US Centers for Disease Control and Prevention; National Institutes of Health)
Incidence Age-Adjusted Incidence Rate 2012-2016 State Cancer Profiles (US Centers for Disease Control and Prevention; National Institutes of Health)
Incidence 5-year Incidence Rate Trend Direction
2012-2016 State Cancer Profiles (US Centers for Disease Control and Prevention; National Institutes of Health)
Incidence Age-Adjusted Incidence Rate for White Women
2012-2016 State Cancer Profiles (US Centers for Disease Control and Prevention; National Institutes of Health)
Incidence 5-year Incidence Rate Trend Direction for White Women
2012-2016 State Cancer Profiles (US Centers for Disease Control and Prevention; National Institutes of Health)
Incidence Age-Adjusted Incidence Rate for Black Women
2012-2016 State Cancer Profiles (US Centers for Disease Control and Prevention; National Institutes of Health)
Incidence 5-year Incidence Rate Trend Direction for Black Women
2012-2016 State Cancer Profiles (US Centers for Disease Control and Prevention; National Institutes of Health)
In Situ Incidence Age-Adjusted In Situ Incidence Rate
2012-2016 State Cancer Profiles (US Centers for Disease Control and Prevention; National Institutes of Health)
In Situ Incidence 5-year In Situ Incidence Rate Trend Direction
2012-2016 State Cancer Profiles (US Centers for Disease Control and Prevention; National Institutes of Health)

LANDSCAPE ANALYSIS
LOS ANGELES | PAGE 16
In Situ Incidence Age-Adjusted In Situ Incidence Rate for White Women
2012-2016 State Cancer Profiles (US Centers for Disease Control and Prevention; National Institutes of Health)
In Situ Incidence 5-year In Situ Incidence Rate Trend Direction for White Women
2012-2016 State Cancer Profiles (US Centers for Disease Control and Prevention; National Institutes of Health)
In Situ Incidence Age-Adjusted In Situ Incidence Rate for Black Women
2012-2016 State Cancer Profiles (US Centers for Disease Control and Prevention; National Institutes of Health)
In Situ Incidence 5-year In Situ Incidence Rate Trend Direction for Black Women
2012-2016 State Cancer Profiles (US Centers for Disease Control and Prevention; National Institutes of Health)
Late-Stage Incidence
Age-Adjusted Late-Stage Incidence Rate
2012-2016 State Cancer Profiles (US Centers for Disease Control and Prevention; National Institutes of Health)
Late-Stage Incidence
Average Count of Cases that are Late-Stage
2012-2016 State Cancer Profiles (US Centers for Disease Control and Prevention; National Institutes of Health)
Late- Stage Incidence
Age-Adjusted Late-Stage Incidence Rate for White Women
2012-2016 State Cancer Profiles (US Centers for Disease Control and Prevention; National Institutes of Health)
Late-Stage Incidence
Average Count of Cases that are Late-Stage for White Women
2012-2016 State Cancer Profiles (US Centers for Disease Control and Prevention; National Institutes of Health)
Late-Stage Incidence
Age-Adjusted Late-Stage Incidence Rate for Black Women
2012-2016 State Cancer Profiles (US Centers for Disease Control and Prevention; National Institutes of Health)
Late-Stage Incidence
Average Count of Cases that are Late-Stage for Black Women
2012-2016 State Cancer Profiles (US Centers for Disease Control and Prevention; National Institutes of Health)
Mortality Age-Adjusted Mortality Rate 2012-2016 State Cancer Profiles (US Centers for Disease Control and Prevention; National Institutes of Health)
Subcategory Indicator Source
Mortality 5-year Mortality Rate Trend Direction
2012-2016 State Cancer Profiles (US Centers for Disease Control and Prevention; National Institutes of Health)
Mortality Age-Adjusted Mortality Rate for White Women
2012-2016 State Cancer Profiles (US Centers for Disease Control and Prevention; National Institutes of Health)
Mortality 5-year Mortality Rate Trend Direction for White Women
2012-2016 State Cancer Profiles (US Centers for Disease Control and Prevention; National Institutes of Health)
Mortality Age-Adjusted Mortality Rate for Black Women
2012-2016 State Cancer Profiles (US Centers for Disease Control and Prevention; National Institutes of Health)
Mortality 5-year Mortality Rate Trend Direction for Black Women
2012-2016 State Cancer Profiles (US Centers for Disease Control and Prevention; National Institutes of Health)
Mammography Percent of Women Getting Mammograms
2017 County Level Modeled Estimate Combining BRFSS and NHIS (US Centers for Disease Control and Prevention; State Cancer Profiles; National Institutes of Health)

LANDSCAPE ANALYSIS
LOS ANGELES | PAGE 17
Qualitative Data In the Los Angeles MTA, a total of six focus groups were conducted among 56 community members. Three individual interviews were held with provider interviews were conducted.
Table 2 summarizes the demographic characteristics of 54 focus group participants, representing both breast cancer survivors and the undiagnosed. Among breast cancer survivors, the majority were above 65 years of age, utilized private insurance (57%), and had been diagnosed with stage 2 breast cancer (50%). Undiagnosed women of all ages participated, with the majority reporting access to private insurance (48%). Non-provider participants were Black. Demographics were not collected for community health navigators, patient navigators or clinical providers.
TABLE 2. LOS ANGELES METRO AREA QUALITATIVE DATA COLLECTION
Variable Name Breast Cancer Survivors (n=14)
Undiagnosed Women (n=40)
Age
18-24 years 0.0% 2.5% 25- 34 years 0.0% 15.0% 35-44 years 0.0% 17.5% 45-54 years 7.1% 17.5% 55-64 years 28.6% 25.0% 65-74 years 57.1% 15.0% 75 and above 7.1% 7.5%
Zip Codes Breast Cancer Survivors (n=14)
Undiagnosed Women (n=40)
90002 7.1% 2.5% 90003 14.3% 0.0% 90013 0.0% 2.5% 90043 7.1% 2.5% 90059 0.0% 2.5% 90220 0.0% 2.5% 90221 7.1% 0.0% 90247 0.0% 2.5% 90250 7.1% 2.5% 90302 0.0% 2.5% 90680 7.1% 5.0% 90703 0.0% 2.5%

LANDSCAPE ANALYSIS
LOS ANGELES | PAGE 18
90710 7.1% 0.0% 90746 14.3% 0.0% 90807 7.1% 0.0% 91003 0.0% 2.5% 92647 0.0% 2.5% 92663 7.1% 0.0% 92677 0.0% 5.0% 92704 0.0% 5.0% 92708 7.1% 2.5%
Insurance Status Breast Cancer Survivors (n=14)
Undiagnosed Women (n=40)
I don't have health insurance 0.0% 2.5% Medicaid 0.0% 27.5% Medicare 35.7% 20.0% Military Healthcare 7.1% 2.5% Private Insurance 57.1% 47.5% Through my parents 0.0% 0.0% Not sure 0.0% 0.0%
Ever Been Screened for Breast Cancer
Breast Cancer Survivors (n=14)
Undiagnosed Women (n=40)
Yes 100.0% 7.5% No 0.0% 92.5%
Type of Breast Cancer Screening or Assessment
Breast Cancer Survivors (n=14)
Undiagnosed Women (n=40)
Clinical breast exam 50.0% 50.0% Mammogram 100.0% 72.5% 3D Mammogram 14.3% 5.0% Breast self-exam 21.4% 22.5% Other 7.1% 0.0%
Stage of Breast Cancer Diagnosis Breast Cancer Survivors (n=14)
Undiagnosed Women (n=40)
Stage 0 7.1% N/A Stage 1 28.6% N/A Stage 2 50.0% N/A Stage 3 0.0% N/A Stage 4 0.0% N/A

LANDSCAPE ANALYSIS
LOS ANGELES | PAGE 19
Policy Data The analysis involved a review of federal and state policies that affect health care access, cost, and utilization, as well as policies most relevant to the breast cancer clinical continuum of care, including breast cancer screening, diagnosis and treatment. Key policy sources were searched, such as Kaiser Family Foundation, the Centers for Disease Control and Prevention (CDC), and the American Cancer Society to identify relevant federal policies.
At the state level, the study examined whether California had adopted an expanded Medicaid program, whether these states had adopted a Medicaid waiver (Section 1115 of the Social Security Act) that could restrict access to Medicaid and its services (e.g., work requirements), and any of their rules related to the NBCCEDP (e.g., eligibility requirements) and the state Breast and Cervical Cancer Treatment Program (BCCTP). Additionally, this landscape analysis examined their state cancer plans to discern whether relevant actions or recommendations might impact breast cancer screening, detection, and treatment. The main sources for this type of information included state department of health or state Medicaid resources (e.g., Medicaid eligibility, state NBCCEDP eligibility), and policy-focused organizations or think tank materials (e.g., Kaiser Family Foundation, state-level organizations).

LANDSCAPE ANALYSIS
LOS ANGELES | PAGE 20
Section 1 Findings: Burden of Breast Cancer Section 1 describes the breast cancer disease burden in the Los Angeles MTA using secondary data, as well as relevant findings from the qualitative data. The Los Angeles metropolitan area (MTA) is a two-county region in California that is centered around the city of Los Angeles. The MTA is home to 13.3 million people, and its population is 54 percent white and 7 percent Black (see Table 3 – Los Angeles Metro Area Demographics).
Demographics TABLE 3. LOS ANGELES METRO AREA DEMOGRAPHICS
Gender
Male 49% Female 51%
Age
Under Age 18 23% Age 18-64 65% Over Age 65 13%
Race/Ethnicity
White 54% Black 7% Asian 16% American Indian or Alaska Native 1% Native Hawaiian or Other Pacific Islander 0% Some Other Race 19% Two or More Races 4% Hispanic/Latino 45% White not Hispanic 30% Minority Race 46%
Number of Black Women Over Age 45 201,536 Total Population 13,261,538
Gender
TABLE 4. LOS ANGELES METRO AREA COUNTY DEMOGRAPHICS
County Total Population Percent of Total Population That Is
Female Percent of Total
Population That Is Black
Number of Black Women Over Age 45
Los Angeles 10,105,722 51% 8% 191,493
Orange 3,155,816 51% 2% 10,043
Source: American Community Survey 2013-2017 5-Year Estimates (US Census Bureau)

LANDSCAPE ANALYSIS
LOS ANGELES | PAGE 21
More than 76 percent of all residents of the Los Angeles MTA (10.1 million people) live in Los Angeles County, CA (see Table 4 – Los Angeles MTA County Demographics), with the remaining 24 percent of the region’s population residing in Orange County, CA (3.2 million people). In Los Angeles County, 8 percent of the total population is Black, which is about 808,000 people. In Orange County, only 2 percent of the total population is Black, which is about 63,000 people. The number of Black women over age 45 is noted for both counties in the MTA because this Census-designated delineation best aligns with breast cancer metrics (e.g., percentage of women over age 40 who have received a screening mammogram in the last two years). There are 191,493 Black women over age 45 in Los Angeles County and 10,043 Black women over age 45 in Orange County.
Breast Cancer Disease Burden in the Los Angeles MTA Breast cancer disease burden in the Los Angeles MTA is highly dependent on two factors: where a person lives (e.g., the county in which they reside) and their race (e.g., whether they are Black or white). In the Los Angeles MTA, the likelihood of receiving a breast cancer diagnosis, the stage of diagnosis, and the likelihood of death from the disease vary along geographic and racial lines.
A helpful measure for breast cancer disease burden is prevalence, or the proportion of the population that has the disease at a given time. It is important to note that prevalence is measured in multiple ways depending on the time period of interest, and this report uses age-adjusted complete prevalence, which represents the proportion of people alive on a certain day who have been diagnosed with breast cancer, regardless of when the diagnosis was made (National Cancer Institute, 2020). Prevalence statistics are only available at the state level. In California, the complete prevalence age-adjusted percentage is 1.63. The prevalence in California is comparable to the national percentage of 1.69.
Breast cancer indicators for other measures are available at the county level. Tables 5-8 describe the breast cancer disease burden in the MTA. Data on breast cancer incidence rates, in situ incidence rates, late-stage incidence rates, and mortality rates are all expressed in terms of number of new cases, or number of deaths per 100,000 individuals per year. Screening mammography rates, shown in Table 9, are represented as the percentage of women over the age of 40 that have had a screening mammogram in the last two years.

LANDSCAPE ANALYSIS
LOS ANGELES | PAGE 22
TABLE 5. LOS ANGELES METRO AREA BREAST CANCER INCIDENCE RATE (PER 100,000)
Age-Adjusted Incidence
Rate 5-Year
Incidence Rate Trend Direction
Age-Adjusted Incidence Rate for White
Women
5-Year Incidence
Rate Trend Direction for
White Women
Age-Adjusted Incidence Rate for
Black Women
5-Year Incidence
Rate Trend Direction for
Black Women
Los Angeles 116.0 falling 118.6 falling 122.9 stable Orange 124.0 stable 131.8 stable 110.8 stable California 118.3 * 125.8 * 125.7 *
National 124.2 stable 126.1 stable 124.0 stable Source: 2012-2016 State Cancer Profiles (US Centers for Disease Control and Prevention; National Institutes of Health)
The breast cancer incidence rate in Los Angeles County is 116.0 new cases per 100,000 individuals per year. In Orange County, there are 124.0 new cases per 100,000 individuals per year (See Table 5 – Los Angeles MTA Breast Cancer Incidence Rate). Orange County’s incidence rate is higher than the state average of 118.3, but hovers around the national average of 124.2. In Los Angeles County, incidence rates are higher among Black women than white women, but in Orange County, incidence rates are higher for white women than Black women. Incidence rates for Black women in both counties are lower than the state and national incidence rates for Black women of 125.7 and 124.0, respectively.
TABLE 6. LOS ANGELES METRO AREA BREAST CANCER IN SITU INCIDENCE RATE (PER 100,000)
Age-Adjusted In Situ
Incidence Rate
5-Year In Situ Incidence Rate
Trend Direction
Age-Adjusted In Situ
Incidence Rate for White Women
5-Year In Situ Incidence Rate
Trend Direction
for White Women
Age-Adjusted In Situ
Incidence Rate for Black Women
5-Year In Situ Incidence Rate Trend Direction
for Black Women
Los Angeles 26.2 stable 25.0 stable 29.7 rising Orange 28.4 stable 28.9 stable 25.1 stable California 28.4 * 27.6 * 29.5 *
National 28.3 stable 29.7 stable 31.8 stable
Source: 2012-2016 State Cancer Profiles (US Centers for Disease Control and Prevention; National Institutes of Health) High rates of in situ breast cancer may indicate greater trend in incidence yet are more likely to be indicators that women are being screened in a timely fashion in order to catch this early pre-invasive stage of disease when it can be treated most successfully. The in situ incidence rate for Black women in Los Angeles County is higher than it is for white women in the county, at 29.7 and 25.0, respectively (See

LANDSCAPE ANALYSIS
LOS ANGELES | PAGE 23
Table 6 – Los Angeles MTA Breast Cancer In Situ Incidence Rate). The in situ incidence rate for all women in Orange County is 28.4, which is comparable to the state and national in situ incidence rates of 28.4 and 28.3, respectively.
TABLE 7. LOS ANGELES METRO AREA LATE-STAGE BREAST CANCER INCIDENCE RATE (PER 100,000)
Age-Adjusted
Late-Stage Incidence
Rate
Average Count of
Cases That Are Late-
Stage
Age-Adjusted Late-Stage
Incidence Rate for White Women
Average Count of Cases That
Are Late-Stage
for White Women
Age-Adjusted Late-Stage
Incidence Rate for Black Women
Average Count of Cases That Are
Late-Stage
for Black Women
Los Angeles 41.1 2260.0 42.1 1607.0 48.6 275.0 Orange 40.6 723.0 43.2 576.0 46.2 16.0 California 41.6 8827.0 42.8 6810.0 49.0 687.0
National 41.0 78641.0 41.4 62240.0 51.0 11590.0 Source: 2012-2016 State Cancer Profiles (US Centers for Disease Control and Prevention; National Institutes of Health)
Los Angeles County has a higher late-stage incidence rate than Orange County, at 41.1 in Los Angeles County compared to 40.6 in Orange County (see Table 7 – Los Angeles MTA Late-Stage Breast Cancer Incidence Rate). In both counties, late-stage incidence rates are higher for Black women than white women. The disparity is largest in Los Angeles County, where the late-stage incidence rate is 48.6 for Black women and 42.1 for white women.

LANDSCAPE ANALYSIS
LOS ANGELES | PAGE 24
MAP 1. LOS ANGELES METRO AREA LATE-STAGE BREAST CANCER CASES Map 1 (Los Angeles MTA Late-Stage Breast Cancer Cases) shows the concentration of women who receive a late-stage breast cancer diagnosis annually. There is a high density of late-stage breast cancer diagnoses in both counties, with most of the Black women receiving late-stage breast cancer diagnoses in Los Angeles County.
TABLE 8. BREAST CANCER MORTALITY
Age-Adjusted Mortality
Rate
5-Year Mortality Rate
Trend Direction
Age-Adjusted Mortality Rate
for White Women
5-Year Mortality Rate
Trend Direction for
White Women
Age-Adjusted Mortality Rate
for Black Women
5-Year Mortality Rate Trend
Direction for Black Women
Los Angeles 20.0 falling 20.4 falling 30.9 falling Orange 19.0 falling 20.5 falling 28.9 stable California 18.5 * 21.2 * 30.1 *
National 20.6 falling 20.1 falling 28.1 falling Sources: 2012-2016 State Cancer Profiles (US Centers for Disease Control and Prevention; National Institutes of Health); 2017 County Level Modeled Estimate Combining BRFSS and NHIS (US Centers for Disease Control and Prevention; State Cancer Profiles; National Institutes of Health)
The breast cancer mortality rate in Los Angeles County is 20.0 deaths per 100,000 individuals, and the breast cancer mortality rate in Orange County is 19.0 deaths per 100,000 individuals (see Table 8 – Breast Cancer Mortality). The breast cancer mortality rate is significantly higher for Black women than white women in both counties. In Los Angeles County, the age-adjusted mortality rate for Black women is 30.9, yet it is just 20.4 for white women. In Orange County, the age-adjusted mortality rate is 28.9 for Black women and 20.5 for white women.
Source: 2012-2016 State Cancer Profiles (US Centers for Disease Control and Prevention; National Institutes of Health)

LANDSCAPE ANALYSIS
LOS ANGELES | PAGE 25
MAP 2. LOS ANGELES METRO AREA AFRICAN AMERICAN BREAST CANCER MORTALITY RATES As seen in Map 2 (Los Angeles MTA African American Breast Cancer Mortality Rates), the number of Black breast cancer deaths is higher in Los Angeles County than Orange County, at 31 deaths per 100,000 African Americans in Los Angeles County and 29 deaths per 100,000 Black residents in Orange County.
It is striking that Black women in Orange County have much higher age-adjusted breast cancer mortality rates than white women in Orange County, given the relatively moderate incidence rate among Black women in Orange County compared to white women (see Table 5 – Los
Angeles MTA Breast Cancer Incidence Rate) and the county’s relatively high mammography rate (see Table 9 - Los Angeles MTA Screening mammography Rates).
TABLE 9. LOS ANGELES METRO AREA SCREENING MAMMOGRAPHY RATES (AMONG ALL WOMEN OVER AGE 40)
Percent of Women Getting Mammograms Los Angeles 68%
Orange 78%
California 75%
National 73%
Source: 2012-2016 State Cancer Profiles (US Centers for Disease Control and Prevention; National Institutes of Health)
The percentage of women receiving a screening mammogram is 68 percent in Los Angeles County and 78 percent in Orange County (Table 9 – Los Angeles MTA Screening mammography Rates). The percentage of women receiving a screening mammogram in Los Angeles County is lower than the state and national averages of 75 percent and 73 percent, respectively. Racially disaggregated mammography rates are not available at the county-level, but these data are available at the state-level.
Overall, a study of breast cancer disease burden measures suggest that throughout the Los Angeles MTA, Black women are more likely to die from breast cancer than their white counterparts, even though they are diagnosed with the disease at lower rates. This pattern is evident in Orange County, where the
Source: 2012-2016 State Cancer Profiles (US Centers for Disease Control and Prevention; National Institutes of Health)

LANDSCAPE ANALYSIS
LOS ANGELES | PAGE 26
breast cancer incidence rate among Black women is lower than that of white women, at 110.8 for African American women and 131.8 for white women (see Table 5 – Los Angeles MTA Breast Cancer Incidence Rate) and their overall mammography rate is higher than Los Angeles County, at 78 percent (compared to 68 percent), (see Table 9 - Los Angeles MTA Screening mammography Rates), yet mortality rate is much higher for Black women in Orange County compared to white women in 28.9 deaths per 100,000 Black women and 20.5 deaths per 100,000 white women.
Research from other parts of the country may shed light on why the observed patterns exist. A study in South Carolina, for example, found that while the breast cancer incidence rate was higher for European-American or Caucasian women compared to Black women (124 versus 118.5 per 100,000 women), the breast cancer mortality rate was higher for Black women (29.8 versus 21.3 per 100,000 women; Samson, Porter, Hurley, Adams, & Eberth, 2016). Tammemagi et al, examined a cohort from a large health system in Detroit, Michigan, for 10 years (n=906, with 264 Black women and 642 white women; Tammemagi et al., 2005). The authors found that Black breast cancer patients experienced more recurrence of their cancer, more cancer progression, and worse all-cause breast cancer and competing-causes survival. Compared to white women, Black women had shorter overall survival (Hazard Ratio=1.34, 95% CI: 1.11, 1.62).
Community Member Perspectives across the Breast Cancer Care Continuum This section summarizes perspectives from community members and health care providers collected through focus group discussions and interviews, which provide additional insights at each phase of the breast cancer continuum of care in the Los Angeles MTA. Based on a review of the quantitative findings, priority counties for qualitative data collection in the Los Angeles MTA were identified: Los Angeles County and Orange County. JSI hosted focus groups in South Los Angeles, Orange County, and the Antelope Valley in North Los Angeles County. The themes shared below represent the perspectives of community members from these priority counties, not the entire Los Angeles MTA.
Screening There are different screening guidelines for those at average risk and for those at higher risk. Recommendations for those at higher risk also vary from one organization or professional society to another. There is some inconsistency for screening recommendations among organizations for those at higher risk (Komen 2021a). Black women receive mammograms at a higher rate than white women in all counties that constitute the Los Angeles MTA. Focus group participants’ perspectives give some indication of the experiences of Black women seeking and obtaining breast cancer screening.
Screening Guidelines. Overall, community members were aware of the screening guidelines from the American Cancer Society indicating that mammograms begin at 40. There was a sentiment from both providers and participants that there is confusion around how guidelines have changed over the years including at what age women should start screening, and how often thereafter.
“I think the standard was 40 or 45 before you get a screening, or anything. If it's not in your family, you just go and say, "Okay, that sounds good to me." But you never know, and sometimes [screening guidelines] might even say 50. Because I think they changed the guidelines. It was 50 and now it's 40.” – Survivor

LANDSCAPE ANALYSIS
LOS ANGELES | PAGE 27
“I don't know, to be honest, what age are you even supposed to screen. Nobody really talks about that. You're supposed to go to the Doctor and you hope that you will or you pray that you have a good doctor, that'll be like, okay, I see you're 40. It's time to start having your mammograms. But other than that, I don't know. I know if I feel a lump or if I see any type of oozing then say something, I'm supposed to do breast self cares and stuff. But as far as when you should do those things, I really don't know.” – Undiagnosed
“I think people think it's when you're, you know, older, so I mean if you're a 20-year-old, you might think old is 40, or 50, or 60, but I think definitely somebody that's under 40 is definitely not even on their radar. I mean sometimes younger people, they don't even feel like they need healthcare, so thinking that they need screening is totally not even on their radar.” – Undiagnosed
“I think people are confused. I mean with all the changes that have happened in like the last four years it feels like different screening guidelines are coming out and I think that is engendering mistrust in the community because they don't feel empowered because they don't know. The screening guidelines and they feel like they're always changing. I get that question every single time I talk somewhere. They're like, "Oh, these screening guidelines keep changing. What are they now?" And I think a lot of people just feel like that medical field doesn't know what they're doing. Like I'm just going to wait for them to figure it out before I go get my screening mammogram because they can't make up their minds.” – Provider
“The Black women I have interacted with are no different from the Hispanic women or the Caucasian women I've interacted with, which means, everyone is confused. They've heard three different things from media, doctors, their neighbors and they're just completely confused. I think that is a description of just about everybody. Unless they've had breast cancer in their family and then those Black women like Caucasian women and Hispanic women are pretty self-educated about this.” – Provider
“Hispanic women and Black women tend to develop breast cancer younger, almost a decade younger, than their Caucasian or white European ancestry counterparts. Which means, one of the things that has been totally lost in a debate about screening mammography and when it starts is any recognition of differences by ethnicity of when risk really develops for women. That's frustrating. A debate about whether women should start screening at 40, 45 or 50 is looking toward a bit all comers, but with Black and Hispanic women developed disease 10 years younger, we are not doing them a service by delaying the start of their mammographic screening.” - Provider

LANDSCAPE ANALYSIS
LOS ANGELES | PAGE 28
Screening access. Undiagnosed women in the Antelope Valley noted that free screening programs are available, however, there is a lack of awareness of the existence of these programs, and difficulty with transportation in their area specifically for lower income, undiagnosed women.
“Would be great to have mobile units that can move across especially the High Desert because it's a large but a small town. So if we have mobile units that would do screening, that can be mobile to go to Palm Road, Little Rock, and Lancaster, Rosemont where maybe some of the homeless are stationed.” – Undiagnosed
“Here the buses kind of take long. You miss one bus, you have to wait an hour. Where in LA the bus runs every 15 minutes so every 25 minutes. So it's totally different from AV to LA. And it's more expensive. So to get from here to if you're going to LA, to go to an appointment and on the bus is more expensive versus going somewhere here locally.” – Undiagnosed
“People who maybe don't have insurance or don't have a good relationship with a primary care doctor also just don't have the means or the resources to know what's available to them. So free screenings they're just not aware of that. They don't know where to go and because no one's in their face saying, "Oh, you need to get this done and here's where you can go get it done." It's just not happening. I always tell people at the community events that it's critical that they have a relationship with a doctor. I don't care who it is. It can be your OB, it can be your internal medicine doctor. You need to have a relationship with a doctor to remind you to go get this done. But a lot of people don't have primary care physicians” – Provider
“I think there are free screening programs, but I don't think they're publicized widely enough like in the communities. … It's not widely known like what insurance covers. So that's a huge deal. If there were some kind of website that says if in general you have this insurance, then you can go to these places. Like some kind of database that's easily accessible because that's not really clear. Or if maybe it was mandated, I know this is outside the scope of Komen, but maybe if it was mandated that no matter who you were, you could go to any facility and have your screening mammogram covered. Like if they're some kind of state subsidized program where you go to any facility at any point and your screening mammogram would be covered.” - Provider
Fear and Shame. Women noted fear is a major barrier to screening for breast cancer, including not wanting to discuss cancer. Some women noted that a lack of information regarding family history of cancer is barrier to women making an informed decision about breast cancer screening.
“For me, it's just that dreaded screening mammogram. I've heard so many horror stories in my community about it that it's like, no way, I'm not doing that. Just the way it was always presented, was just devastating.” - Undiagnosed

LANDSCAPE ANALYSIS
LOS ANGELES | PAGE 29
“They're afraid to go. If they go, they're going to maybe perhaps get diagnosed, especially if it runs in their family. They have family members that had it or have passed away from it. They had the surgery for it and had breasts removed. They don't want to go to get it because they don't want to hear it.” – Undiagnosed
“We don't talk among ourselves. I have to tell you, my relatives, my ancestors, they never shared what illnesses they had. I would never have known that an aunt or whomever had breast cancer or anything else. That was not a topic of discussion, and God forbid they had cancer, the big C. Never”. – Undiagnosed
“As African American women, it has to start somewhere, and so maybe it'll start with us, and even with my children, we have started trying to find out, what are the illnesses in our family? Who is it that we know? What are some of their symptoms that they had?” - Undiagnosed
“I want to say that because of our culture, the word cancer for a lot of Black people is taboo. You don't even say the word. A girlfriend of mine mentioned that her mother almost snapped at her, and said, "Don't you ever tell anybody that there's cancer in our family." Black people typically do not want to talk about cancer.” - Survivor
Quality of Mammograms. While mammograms are readily available, a couple of women expressed concerns with the quality of these screenings at facilities in areas that are low income or public facilities.
“Then you hear about people that don't have medical insurance, maybe have Medi-Cal. Okay. Which not every doctor's going to take. So therefore, are they going to ever get a breast MRI realistically? Probably not. I had to beg for one, and like I said, I was paying good money for my insurance.” – Survivor
“In terms of quality of care, thee VA wasn't up to par. I had a friend who went to a VA clinic and had a screening mammogram. Six months later she decided to go to Kaiser which was her plan and that's when she was diagnosed with stage two cancer. That got me thinking, the quality of care is not the same.” – Survivor

LANDSCAPE ANALYSIS
LOS ANGELES | PAGE 30
Time. Undiagnosed women and providers noted that time is often a barrier to regular screening, and that their roles in the home and in society often impede their ability to put their health and routine screenings first.
“There are so many things in a woman's daily life that they are dealing with. Oftentimes, we become secondary. We place ourselves last, I've got to keep kids there, I've got bills to pay. I've got this, I've got that. When do I have time?...But how do we sit down to help her to address the fact that if you're not taken care of, with all these things that you have in your daily life, what will happen? I've heard too many women say to me honey, “I've got this to do, I've got that to do. I don't have time for another problem.”. A lot of doctors don't understand this. If you don't come back if you don't follow up, there's a reason.” – Undiagnosed
“My mother died from breast cancer. We got to take the time not to be so busy, to where we don't take care of ourselves. And then a lot of stuff is not as easy and convenient for us at the same time” – Undiagnosed
“Detriments to the screening I would say are just people not thinking about it or life getting in the way. So, one of the very common deterrents to getting screened that I hear across races, not just in black women is just, you know, "Oh, I was busy with life." Like I was working or taking care of my parents or my kids or my spouse and I just forgot, or I missed that year” – Provider
Institutional racism. Providers and undiagnosed women all noted that historic distrust of the healthcare system due to race.
“I would say from my experience, in my family, like our older generation don't go to the hospital because they fear they won’t come back. Like even just through my research in how the government studies us and the things that they've given us and the viruses, like there's a lot of mistrust of the medical field when it comes to the black experience and how we've been experimented on with our knowledge and without our knowledge. And so that would keep me from going there because like my grandma she... My grandma goes to the doctor now and more so because I'll be like grandma, let's go get this checked. And I go with her to be that advocate and that support.” – Undiagnosed
“Historically, I mean, there's so many and I don't know how much has been done from the medical providers that side to address that mistrust. And I think it's preventing people from feeling like they have an ally in the medical system where they can go for preventive care or go as soon as something happens because there's this mistrust like, I don't know exactly what you're going to do to me. You don't feel a part of the cause you don't feel a part of the movement against cancer. And I think that's why a lot of black communities have their own movements against cancer. Like our community is against it, but they don't feel a part of the global fight against cancer.” – Providers

LANDSCAPE ANALYSIS
LOS ANGELES | PAGE 31
“Black women may have had some hesitations about engaging in medical care and screening for some pretty real-world reasons. There is some mistrust in some parts of the Black community for medical studies and medical practice due to pretty horrific things that have happened between communities and the medical profession. Programs that I've seen that have started to tackle this problem really have to be from within those communities themselves. Coming from outside that community and trying to tackle that problem doesn't address or doesn't successfully address some of those very real trust issues. That's a gross overstatement. I realize there are plenty of Black women who do not feel that way, but it's a cultural theme that can't be ignored and shouldn't be ignored.” - Providers
Access to follow-up screening. Survivors and undiagnosed women noted the challenges with getting referrals to follow-up screening after initial mammograms.
“Well, before I was diagnosed, I had my screening mammogram that January and got my letter in February saying that the screening mammogram did not detect cancer, everything came out good. In March I went through something really traumatic, stressful at work and about a week or two later, my chest started burning like firecrackers or some exploding on it. So, I called my doctor and I told her. She was like, "No. Didn't you get your letter, you just had your screening mammogram, everything's fine." I said, "Look, I pay attention to my body. Something's going on. So, my doctor said, "Okay, I know you. You're not going to leave it alone until I check you." She sent me for a biopsy." – Survivor
“I think that's part of the issue is that we don't get diagnosed in a timely manner or maybe that first screening mammogram maybe should've sent us to the next step the ultrasound, because of the denseness of our breasts, I don't think a lot of that was considered. Now we all victims of that, I think that maybe we didn't get enough further diagnosis, because the medical doctors weren't being sensitive enough to what we bring to the table as African American women that we are not made the same way as the Caucasian or the Asians or whoever you are doing, we have a different body type and that needs to be taken into consideration.” - Undiagnosed
Diagnosis Delayed Diagnosis. Survivors shared that, despite yearly mammograms, they found masses on her own and experience of not being referred for additional testing earlier on.
“My mom died at 53 of breast cancer and my grandfather was diagnosed with breast cancer at 40 years old. He only did radiation and lived to be 89 and as a result of family history I had been doing mammograms since my thirties. I woke up one day and I found

LANDSCAPE ANALYSIS
LOS ANGELES | PAGE 32
my nipple was indented. I went back to the clinic who gave me my screening mammogram the year before. They did the biopsy and was diagnosed.” – Survivor
“That’s what we hear, and I think that's part of the issue is that we don't get diagnosed in a timely manner or maybe that first screening mammogram maybe should've sent us to the next step the ultrasound, because of the denseness of our breasts, I don't think a lot of that was considered. Now we are all victims of that, I think that maybe we didn't get enough further diagnosis, because the medical doctors weren't being sensitive enough to what we need.” – Survivor
Treatment
Fear. Many participants described how fear, denial, and stigma led to unwillingness to get treatment once cancer was found.
“My mom died at forty-three and it was because of her lack of knowledge. Therefore, going to the doctor and scared all the way through. I found out when she was in stage four and by then I knew what breast cancer was, as a child, I didn't. I remember at 17, she had me feel her breast, she said there was a lump. If I'm 17, I know nothing about breast cancer, fast forward it all the way to twenty-three. She raised up her shirt and it was outside her breast eating up everything. She never got treated for it. That's when I had to step in and have her go get treated but then everyone looked at me like how you let it get this far? So, she had fear of going to the doctors because one doctor gave her the wrong medicine before.” – Undiagnosed
Alternative Treatment. Providers described how women avoiding treatment or prioritizing other options for treatment served as a barrier to timely, quality care. Providers in particular noted that they have encountered women who believe that other treatment options outside of the standard of care are best for them, and that because of this disconnect, they don’t remain in treatment.
“The patients ones who want something so outside of a standard of care don’t come back. They come all the way through the door, and they just decide I don't want to do this and they don't come back. Some have said “I want an antibiotic to treat my cancer.” and I say, "I can't give you an antibiotic to treat your cancer. It's not going to treat your cancer." They don't come back. I want this type of surgery. Like I want a lumpectomy when the cancer is 15 centimeters. Like I can't do a lumpectomy that's not safe for you. I can't physically do that. They don't come back. It's these types of... and those are all real examples that I'm giving you.” – Provider
“I had a cousin that passed away last year from breast cancer. She chose not to get treatment. She wanted to go the holistic way. She thought that was the way to do it, to go the holistic way and it killed her. Then there was another lady that said to me, "Well,

LANDSCAPE ANALYSIS
LOS ANGELES | PAGE 33
the reason why you have breast cancer is because you thought yourself, you thought it. And that's why it happened. What you should do is just take baking soda and lemon juice." - Survivor
Mental strain. Survivors described the mental strain on newly diagnosed women, which spoke to the overall need to address the mental health needs of women who have been diagnosed with breast cancer such as anxiety, stress, and depression. This stress is often compounded for Black women whose breast cancer journey is frequently coupled with a need to self-advocate within the health care system.
“Let me do my own homework. Let me be an advocate for myself. Let me go seek somewhere where I feel that I can get the help that I need." That stresses you out. It affected my blood pressure, emotionally, physically, and everything. But I had to keep on keeping on because I wasn't going to give up. But all that is emotional pain, psychologically and everything.” – Survivor
“Sometimes you're so busy taking care of everything, whether it's your family, yourself, your survival, it's that you really don't have the time to take for yourself because cancer is time consuming. It's expensive, it's psychologically draining. It's physically draining. It's not something I'd ever volunteer for.” - Survivor
“Then when they do find out... I've known a couple ladies, they keep putting it off, "I'll get treated, I'll get treated."- Survivor
Navigators. Survivors noted the critical importance of navigators and care plans to guide Black women through the continuum of care, helping them to understand their options and resources, and providing the critical support, especially for those who do not have familial support.
“We did a survivorship care plans and I think that often times cancer is so foreign, it's important to have somebody to kind of break it down, so that the person gets a clear understanding of what kind of they have, the stage, and most importantly, what are the next steps for survival, what are the side effects of this particular treatment versus this particular treatment, cancer is not an exact science. Most people take what the doctor tells you and they think it's gospel. There are options and those options have side effects. Those drugs that you take have side effects. People need to know what to expect so that if they can't deal with it, there might be alternatives because there usually are in some cases. And just knowing what to expect I think is really important. So I think a navigator is critical if you don't have it on your own, I think it should be provided. That's how strongly I feel about it” – Survivor
Insurance barriers. Providers noted disparities in provider and treatment options for those with varying types of insurance. In Antelope Valley specifically, there are limited health system options that

LANDSCAPE ANALYSIS
LOS ANGELES | PAGE 34
complicate access to care. Additionally, Providers pondered the access to the most scientifically advanced treatment options was impacted by race or type of medical institution.
“A lot of these barriers are kind of built within our system and you can look at these as very good for race. So, for example, costs, you mentioned costs. Some institutions don't accept certain insurances, which are more, you know, there's a predisposition I guess of maybe the Black community having a lower socioeconomic status in insurances that are not covered or not accepted by certain institutions. And so, in that way, it's not weeding out black people is just like, "Okay, we don't accept these insurances." And oh, it just so happens that many black people have this type of insurance. So cost is an issue. It's a barrier.” – Provider
“Medi-Cal changed their policy so that patients get enrolled into Medi-Cal HMO and my institution does not contract with the majority of Medi-Cal HMOs. So even if a patient has Medi-Cal, the state of California automatically enrolls most of those patients into managed care plans and then they're limited on who they can see.” – Provider
Quality of Care. Survivors correlated quality of care to your race, being insured, and where you accessed care. How much information a provider shared was also a determinant of how the survivors perceived the quality of care.
“One of my boss's friends was diagnosed with breast cancer. I'm telling you within three weeks she had her surgery, and her treatment was moving fast. For others it could be months for some people to actually get to the point of surgery. I think that lapse is really critical. I had to beg for treatment after I was diagnosed. I got diagnosed in October. I had my surgery in November. I started chemo in December, but after the surgery, I had two beg, just to see a pathology report. I think that if I was white, I probably would have got those answers much quicker than me having to call the doctor to beg for it and have to wait weeks to get answers. And I'm a person with medical insurance, I was paying good money for my medical insurance. Then you hear about people that don't have medical insurance, maybe have Medi-Cal, which not every doctor's going to take.” – Survivor
“I like to give patients an overview of all the possible treatments and then tell them the pros and cons of each treatment when they're eligible for two different treatments. So, say for me for surgery, a patient could be eligible for a lumpectomy or a mastectomy. What I'll do is I'll walk them through each of those options and the pros and cons for that specific person in terms of getting one treatment over the other. Like for you, these are the pros and cons of a lumpectomy. These are the pros and cons of a mastectomy. You're eligible for reconstruction. This is how this would affect your recovery. Then I give them survival data. So, it's been proven that lumpectomy and radiation is equivalent in survival to mastectomy and so most of the time there's, if they're eligible for both, there's not a survival difference between either one they choose and I try to ascertain

LANDSCAPE ANALYSIS
LOS ANGELES | PAGE 35
their personal goals, their life goals, their goals for their care, what's important to them.” – Provider
“I would be interested to know what type of clinical setting the majority or there's a trend where African American patients are being treated because there is a disparity in care between academic centers, community centers, private hospitals, like all of the actual institution that's giving the treatment and may not be. Maybe I'm being optimistic here, but it may not necessarily be racism as access to care that is on the forefront of advances and breakthroughs” – Provider
Personally Mediated Racism. Survivors and provider shared personal experience of implicit bias, racism, and discrimination while accessing treatment.
“Yes, there's racism. You feel it. You second guess if you're getting the better treatment or if you're not being offered reconstruction, when another patient would have absolutely been offered reconstruction. I've experienced it as a patient, but I have not seen it on the medical side.” – Provider
Survivorship Survivor Support Resources. Survivors and providers noted the critical role that support resources play along the breast cancer continuum of care. Community members reported that they were connected to survivor groups that met their educational and spiritual needs, and how these were often groups of Black women.
“I know that when I went to the support group, a lot of us had Kaiser, so we were all just talking about our doctors and hearing them say, "So, I'm not crazy. I'm not the only one having this." So that's why I always tell people, get in a support group. Well, that's something else. Kaiser, I went to their, and it was all white folks. They're talking about taking trips and buying Mercedes, I couldn't relate to nothing and people talking about, my daughter found this group ... And then I got with them, we have down to earth people, we all try to work and pay our bills and take care of our kids and grandkids. And we were open and honest with each other.” – Survivor
“The best thing for that are local support groups. I think that's what helps patients stay in treatment. Like, so you have to take this medication that's really not fun to take. I have patients who stick with that. The most are the ones who have other people going through it that they can see. And I do see that at the community level. Like there are patients who are so committed to completing their surveillance program and they encourage the others to stick with it also. There's a lot of power in those community-based support groups, definitely. And I think that helps.” - Provider
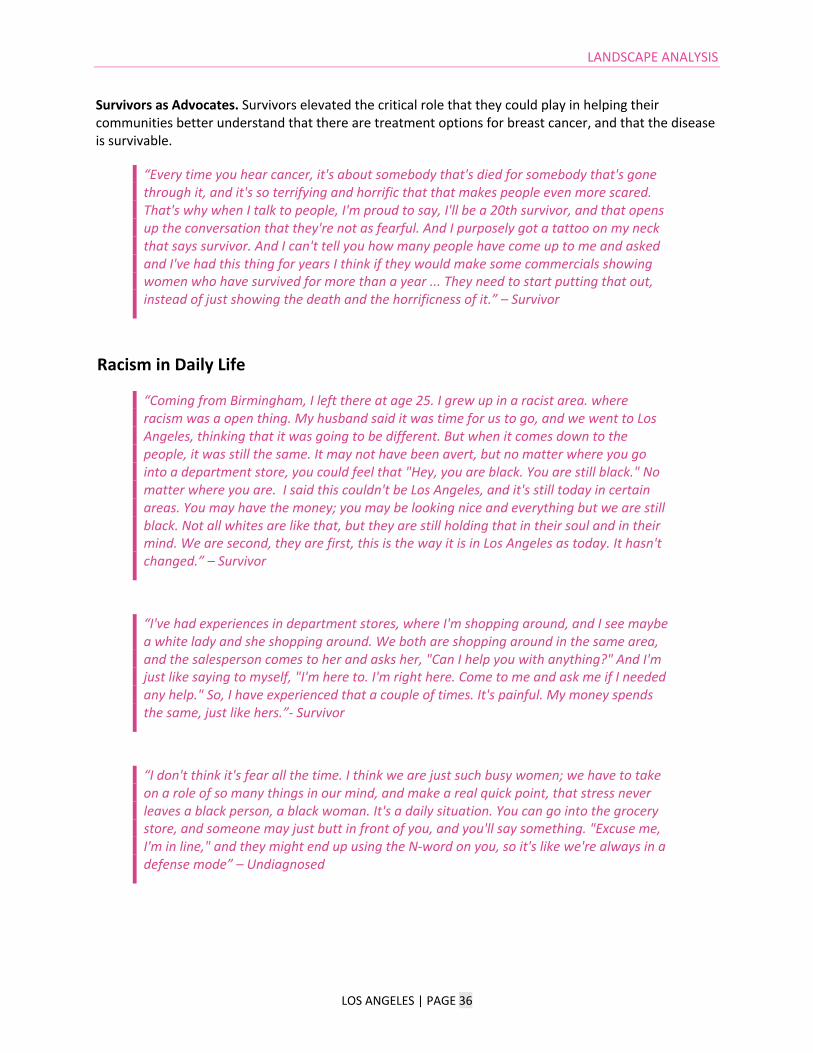
LANDSCAPE ANALYSIS
LOS ANGELES | PAGE 36
Survivors as Advocates. Survivors elevated the critical role that they could play in helping their communities better understand that there are treatment options for breast cancer, and that the disease is survivable.
“Every time you hear cancer, it's about somebody that's died for somebody that's gone through it, and it's so terrifying and horrific that that makes people even more scared. That's why when I talk to people, I'm proud to say, I'll be a 20th survivor, and that opens up the conversation that they're not as fearful. And I purposely got a tattoo on my neck that says survivor. And I can't tell you how many people have come up to me and asked and I've had this thing for years I think if they would make some commercials showing women who have survived for more than a year ... They need to start putting that out, instead of just showing the death and the horrificness of it.” – Survivor
Racism in Daily Life
“Coming from Birmingham, I left there at age 25. I grew up in a racist area. where racism was a open thing. My husband said it was time for us to go, and we went to Los Angeles, thinking that it was going to be different. But when it comes down to the people, it was still the same. It may not have been avert, but no matter where you go into a department store, you could feel that "Hey, you are black. You are still black." No matter where you are. I said this couldn't be Los Angeles, and it's still today in certain areas. You may have the money; you may be looking nice and everything but we are still black. Not all whites are like that, but they are still holding that in their soul and in their mind. We are second, they are first, this is the way it is in Los Angeles as today. It hasn't changed.” – Survivor
“I've had experiences in department stores, where I'm shopping around, and I see maybe a white lady and she shopping around. We both are shopping around in the same area, and the salesperson comes to her and asks her, "Can I help you with anything?" And I'm just like saying to myself, "I'm here to. I'm right here. Come to me and ask me if I needed any help." So, I have experienced that a couple of times. It's painful. My money spends the same, just like hers.”- Survivor
“I don't think it's fear all the time. I think we are just such busy women; we have to take on a role of so many things in our mind, and make a real quick point, that stress never leaves a black person, a black woman. It's a daily situation. You can go into the grocery store, and someone may just butt in front of you, and you'll say something. "Excuse me, I'm in line," and they might end up using the N-word on you, so it's like we're always in a defense mode” – Undiagnosed

LANDSCAPE ANALYSIS
LOS ANGELES | PAGE 37
Social Determinants of Health
Access to Insurance Quality.
“Within the Black community, because a lot of us are here, because we're all professionals and we had access to a better quality of care maybe than someone that was not professional and had to go through the system. That is one thing that maybe has drawn more of us to Orange County. You came, because you got a better job, you in education.” – Survivor
“I think what it has to do with is that, like she was saying, certain types of insurance, if you've got Medicare, your kind of way down here and the system is just so overloaded with people. It's not enough providers to accommodate all these people.” – Undiagnosed
“Insurance definitely plays a role. But it is interesting because if people are looking at you as you walk in the door, they're assuming that you may have one type of insurance when you actually have better health insurance. So that does kind of speak to that issue as well. So, if the minute I walk in before I present you with my insurance information you've already decided that this is what I have. So, you're going to treat me a certain way, that's different. But I think insurance definitely plays a huge role in the type of care.” – Undiagnosed
“When I started my process, I had great insurance and my doctors, well he's at Cedar Sinai, he has his office on Third Street. When I lost that insurance, I had to go to his office downtown LA. It was a stark difference in how I was treated. Even when I called to go back on to the Third Street office, I couldn't go to the Third Street office, waiting for the surgery. I've had several surgeries with great insurance and not so great insurance, the process was longer. The need was just the same and just as great, but it was still longer. So, there's definitely a difference in how people are treated. Not just colors but in your class, based on the class you're in.” – Undiagnosed
“I think it's also the clinic style treatment that they give to African Americans and the people here that are maybe on Medicare. I mean where they have to, they're overbooked. So, you go for nine o'clock and probably you don't get treated until 11:30 and 12.” – Undiagnosed

LANDSCAPE ANALYSIS
LOS ANGELES | PAGE 38
Transportation.
“Here the buses kind of take long. You miss one bus; you have to wait an hour. Where in LA the bus runs every 15 minutes so every 25 minutes. So, it's totally different from AV to LA. And it's more expensive. So, to get from here to if you're going to LA, to go to an appointment and on the bus is more expensive versus going somewhere here locally.” – Undiagnosed
Food Deserts.
“My great grandmother, she used to always go to food banks. d. But if I don't have transportation or I don't have ways to get there, that becomes a hindrance, and out here, you don't have fresh food available at where we should. Like they create these food deserts, and they know what they're doing. And they limit our access. And I think that's one of the hardest things, is not only are we targeted mentally, emotionally, spiritually, like physically, like we have all these barriers that were created.” – Undiagnosed

LANDSCAPE ANALYSIS
LOS ANGELES | PAGE 39
Section 2 Findings: Systemic and Social Determinants of Health Section 2 explores the systemic and SDOH that may drive breast cancer inequities. The set of factors explored in this section—residential segregation, economic vulnerability, experiences of racism, SDOH—were informed by consultations with Komen’s Stand for H.E.R. team, academic experts (see Acknowledgements for details), findings from the literature scan, and principles in the guiding frameworks.
Residential Segregation The Los Angeles MTA is segregated across several dimensions, including race and socioeconomic factors, creating stark contrasts by geography. Approximately 6.1 million people of color live in the Los Angeles MTA, comprising 46 percentof the region’s total population (see “Minority Race” in Table 3). More than 85 percent of the 928K Black residents who live in the Los Angeles MTA reside in Los Angeles County (see Tables 3 and 4). That being said, both counties in the MTA have low percentages of Black residents. As stated above, Los Angeles County has a population that is 8 percent Black, and Orange County has a population that is just 2 percent Black (see Map 3 and Table 25 in the Appendix).
MAP 3. LOS ANGELES METRO AREA AFRICAN AMERICAN POPULATION In addition to the MTA not having many Black residents, both of the counties in the MTA are internally racially segregated. Counties’ internal segregation can be measured using the Black/white dissimilarity index to assess the extent to which there may be residential segregation (see Map 4- Los Angeles MTA Residential Segregation). Index scores range from 0 to 100 and correspond to the percentage of people within a racial group who would need to relocate in order for a county to achieve
integration. Zero indicates complete integration of the two races and one hundred indicates complete segregation of the two races. For example, a score of 35 means that 35 percent of whites within a particular county would need to move to a different neighborhood within the county in order to achieve racial integration.
Source: American Community Survey 2013-2017 5-Year Estimates (US Census Bureau)

LANDSCAPE ANALYSIS
LOS ANGELES | PAGE 40
Counties’ internal segregation can be measured using the Black/white dissimilarity index to assess the extent to which there may be residential segregation (see Map 4). Index scores range from 0 to 100 and correspond to the percentage of people within a racial group who would need to relocate in order for a county to achieve integration. Zero indicates complete integration of the two races and 100 indicates complete segregation of the two races. For example, a score of 35 means that 35 percent of whites within a particular county would need to move to a different neighborhood within the county in order to achieve racial integration.
MAP 4. LOS ANGELES METRO AREA RESIDENTIAL SEGREGATION As seen in Map 4, Orange County has a Black/white dissimilarity index score of 58, indicating that it is highly segregated. Los Angeles County has a Black/white dissimilarity index score of 48, indicating that the racial distribution of residents is slightly more even but still quite segregated.
Source: 2019 County Health Rankings (County Health Rankings)

LANDSCAPE ANALYSIS
LOS ANGELES | PAGE 41
MAP 5. LOS ANGELES METRO AREA REDLINING
An example of institutionalized racism is redlining – the practice of identifying and systematically discriminating against neighborhoods based on their racial makeup (Map 5; Source: 2019 Mapping Inequality Project, University of Richmond). Between 1933 and 1954, Home Owners’ Loan Corporation (HOLC) field agents with the federal government assigned grades to neighborhoods ranging from A to D, best to hazardous respectively. The practice is commonly called redlining because designated hazardous areas assigned a D grade were
marked in red. Banks and other mortgage lenders used these grades to inform their lending practices and policies throughout the patterns of residential segregation that are visible today across the Los Angeles MTA are the direct result of systemic racism. As defined and discussed at the beginning of this report, racism occurs across three levels: institutionalized or structural (differential access to goods, opportunities, and power), personally mediated (prejudice about others’ abilities and motives), and internalized (self-devaluation based upon race). Although measures of racism are limited, some quantitative data that can serve as a proxy for racism are available for the Los Angeles MTA.
Officials declared large sections of Los Angeles County “hazardous” because Black residents lived in these neighborhoods. In so doing, the government excluded these individuals and communities from investment and resources. Areas of advantage (where whites lived) became more advantaged, and areas of disadvantage (where people of color lived) became more disadvantaged (Rothstein, 2017). Redlining set up feedback loops, as the more advantaged white population moved into white areas, thereby making them even more advantaged and whiter. For this reason, the level of segregation that currently exists between Blacks and whites in Los Angeles County (see racial segregation section above) can be traced – at least in part – to redlining.
Personally Mediated Racism As defined and discussed at the beginning of this report, racism occurs across three levels: institutionalized or structural (differential access to goods, opportunities and power), personally mediated (prejudice about others’ abilities and motives), and internalized (self-devaluation based upon race). Although measures of racism are limited, some quantitative data that can serve as a proxy for racism are available for the Los Angeles MTA.
Data suggest that in addition to institutionalized racism, Black residents in the MTA experience several forms of personally mediated racism (U.S. Department of Housing and Urban Development, 2019; U.S. Department of Justice Federal Bureau of Investigation, 2017). As seen in Table 10 – Los Angeles MTA

LANDSCAPE ANALYSIS
LOS ANGELES | PAGE 42
Racism, Los Angeles County reports data that highlight the levels of racism in the county. In 2016 and 2017, 206 Black residents were killed by the police (See Table 10 – Los Angeles MTA Racism). Further, there were 1,029 hate crimes committed with a racial bias motivation in 2015, and 23 Fair Housing Act cases filed with a racial basis since 2006.
TABLE 10. LOS ANGELES METRO AREA RACISM
County Number of Black residents Killed by Police
Number of Hate Crimes Committed with a
Race/Ethnicity/ Ancestry Bias Motivation
Number of Fair Housing Act Cases Filed with a Race
Basis
Los Angeles 23 206 1,029
Orange 2 28 142
Source: 2017 Hate Crime Statistics (Federal Bureau of Investigation, Uniform Crime Reporting); Fair Housing Act Cases, 2009-2019 dataset (US Department of Housing and Urban Development, Office of Fair Housing and Equal Opportunity); The Counted Database, 2015-2016 dataset (The Guardian)
Health Disparities Data suggest that there are significant disparities in the Los Angeles MTA in terms of overall health and wellbeing. In Los Angeles County, 19 percent of adults report having “fair” or “poor” health, which is about 1,920,087 individuals. (Table 11 – Los Angeles MTA Health and Wellbeing). Further, residents in Los Angeles County report having 3.7 poor physical health days per month on average, and 3.6 poor mental health days per month on average.
TABLE 11. LOS ANGELES METRO AREA HEALTH AND WELLBEING
County County Health Rankings Percentile
Percent of Adults Reporting "Fair" or
"Poor" Health Average Number of Poor Physical Health
Days per Month Average Number of Poor Mental Health
Days per Month
Los Angeles 40% 19% 3.7 3.6 Orange 9% 15% 3.5 3.3 Source: 2019 County Health Rankings (County Health Rankings)
FIGURE 2. COUNTY HEALTH RANKINGS MODEL The County Health Rankings (CHR) similarly highlight county-level differences in health and wellbeing across the MTA. CHR are derived from over 30 measures of health-related outcomes and factors to give an overall health ranking of a county compared to other counties in the same state (See Figure 2). Orange County ranks in the top 9 percent of all counties in California, but Los Angeles County is in the 40th percentile (see Table 11 – Los Angeles MTA Health and Wellbeing).

LANDSCAPE ANALYSIS
LOS ANGELES | PAGE 43
Despite differences in CHR, Los Angeles County and Orange County report similar rates of obesity among adults, as well as percentage of adults who drink excessively and percentage of adults who are physically inactive. Los Angeles County has 21 percent of adults who are obese and 17 percent of adults who are physically inactive, compared to 20 percent of adults who are obese and 16 percent of adults who are physically inactive in Orange County. Both counties have 17 percent of adults who drink excessively (Table 12 – Los Angeles MTA Health Behaviors).
TABLE 12. LOS ANGELES METRO AREA HEALTH BEHAVIORS
County Percent of Adults Who Are Obese
Percent of Adults Who Drink Excessively Percent of Adults Who Are
Physically Inactive Los Angeles 21% 17% 17% Orange 20% 17% 16% Source: 2019 County Health Rankings (County Health Rankings)
TABLE 13. LOS ANGELES METRO AREA LIFE EXPECTANCY County Life Expectancy Life Expectancy for Whites Life Expectancy for Blacks
Los Angeles 82 82 76 Orange 83 82 81 Source: 2019 County Health Rankings (County Health Rankings)
Life expectancy in the MTA is comparable in both counties, at 82 years in Los Angeles County and 83 years in Orange County (Table 13 – Los Angeles MTA Life Expectancy). However, there is a notable disparity between life expectancy among Blacks and whites in Los Angeles County. The life expectancy for white residents is 82 years, while it is only 76 years for Black residents.
TABLE 14. LOS ANGELES METRO AREA: AGE-ADJUSTED PREMATURE MORTALITY RATE (PER 100,000)

LANDSCAPE ANALYSIS
LOS ANGELES | PAGE 44
County Premature Age-Adjusted Mortality Premature Age-Adjusted
Mortality for Whites Premature Age-Adjusted Mortality for Blacks
Los Angeles 260 278 495 Orange 214 247 314 Source: 2019 County Health Rankings (County Health Rankings)
Premature age-adjusted mortality measures the number of deaths per 100,000 among people under age 75. The disparity between age-adjusted mortality among Blacks and whites in both counties is striking. It is largest in Los Angeles County, where the age-adjusted premature mortality rate is 495 for Blacks and 278 for whites (Table 14 – Los Angeles MTA Age-Adjusted Premature Mortality Rate). The disparity also exists in Orange County, where the age-adjusted premature mortality rate is 314 for Blacks and 247 for whites.
Access to Health Services Data suggest that there are disparities in the health system in the MTA, including in health care facilities and the proportion of the population that is medically underserved. According to the Health Resources and Services Administration (HRSA), Medically Underserved Areas/Populations are areas or populations designated by HRSA as having too few primary care providers, high infant mortality, high poverty or a high elderly population. In Los Angeles County, 29 percent of the population is medically underserved, compared to 18 percent in Orange County (Table 15 – Los Angeles MTA Health Systems). This represents about 2,930,659 people in Los Angeles County and 568,047 people in Orange County.
TABLE 15. LOS ANGELES METRO AREA HEALTH SYSTEMS
County Percent of Total
Population That Is Medically
Underserved
Number of PCPs
Persons per PCP
Number of "Other" PCPs
Persons per "Other" PCP
Number of Private
PCPs
Number of Private
Oncologists
Los Angeles 29% 7,333 1,383 54 1.847 972 8 Orange 18% 3,072 1,033 53 1,887 300 9 Sources: 2019 County Health Rankings (County Health Rankings); HRSA Data Warehouse, 2019 dataset (US Department of Health and Human Services, Health Resources & Services Administration); 2019 Docstop web search; 2019 Healthgrades web search

LANDSCAPE ANALYSIS
LOS ANGELES | PAGE 45
MAP 6. HEALTH SYSTEMS IN THE LOS ANGELES METRO AREA The health systems map (Map 6) shows the concentration of health care facilities across the MTA. Most resources are centered around the city of Los Angeles. There is one comprehensive cancer center in Orange County, with the rest in Los Angeles County. Treatment facilities are scattered between Los Angeles County and Orange County, as are Federally Qualified Health Centers, hospitals, and mammography facilities. However, there are differential concentrations of health care facilities within the counties. Almost all of the health care facilities are in southern Los Angeles County and northern Orange County, with very sparse access to health care facilities in northern Los Angeles County and southeastern Orange County.
It is also important to note that the counties in which people reside are not necessarily the same as the counties in which people receive care. Due to migratory patterns, including where residents are employed and how far they are willing to travel to receive quality care, people may travel to other counties or parts of counties to access health services.
Given the area’s high levels of segregation, health care disparities in the Los Angeles MTA should be examined through the lens of residential segregation and its systemic and long-term adverse impacts on the breast cancer continuum of care. A research study, using national data, examined whether racial and ethnic health care disparities were associated with residential segregation. The authors concluded that disparities in health care use are related both to a person’s racial and ethnic identity and their community’s racial and ethnic composition. Thus, the authors suggest that both individual and community-level strategies are required to address health care disparities (Gaskin, Dinwiddie, Chan, & McCleary, 2012). Other studies have shown how systematic disinvestment in communities makes it harder to attract health care systems, providers, and specialists (Andrasfay, Himmelstein, & Querin, 2019; White, Haas, & Williams, 2012). Further, research in other parts of the country have shown how facilities serving racial and ethnic minority populations tend to have poorer quality of care as compared to facilities predominantly serving white women (Ansell et al., 2009; Curtis et al., 2008; Daly & Olopade, 2015; Nurgalieva et al., 2013). This includes having fewer dedicated breast imaging specialists, and/or other specialists who are more likely to provide detailed information on risk and risk reductions options, as compared to primary care practitioners. Reduced quality of care also includes facility and staffing
Source: HRSA Data Warehouse, 2019 dataset (US Department of Health and Human Services, Health Resources & Services Administration); Comprehensive Cancer Centers and NCI National Community Oncology Research Program (NCORP) sites, 2019 dataset (National Cancer Institute); Mammography facilities, 2019 dataset (American College of Radiology); Treatment facilities, 2019 dataset (American College of Surgeons; Association of Community Cancer Centers)
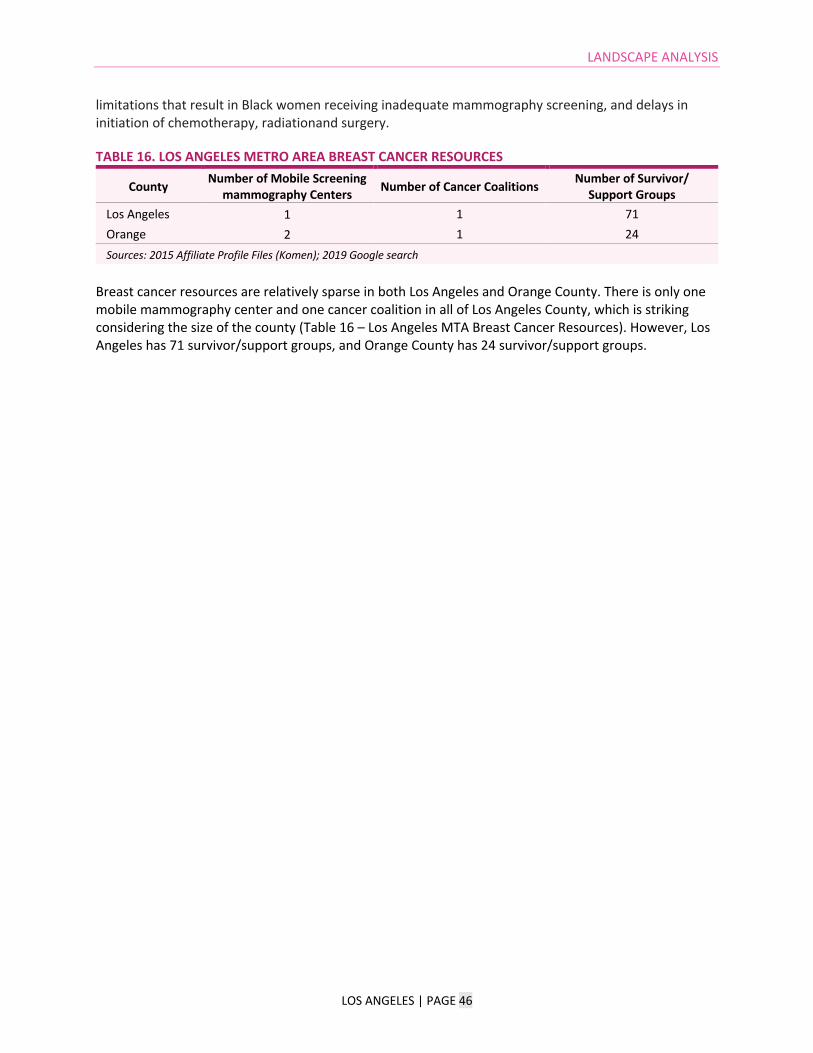
LANDSCAPE ANALYSIS
LOS ANGELES | PAGE 46
limitations that result in Black women receiving inadequate mammography screening, and delays in initiation of chemotherapy, radiationand surgery.
TABLE 16. LOS ANGELES METRO AREA BREAST CANCER RESOURCES
County Number of Mobile Screening mammography Centers Number of Cancer Coalitions Number of Survivor/
Support Groups Los Angeles 1 1 71 Orange 2 1 24 Sources: 2015 Affiliate Profile Files (Komen); 2019 Google search
Breast cancer resources are relatively sparse in both Los Angeles and Orange County. There is only one mobile mammography center and one cancer coalition in all of Los Angeles County, which is striking considering the size of the county (Table 16 – Los Angeles MTA Breast Cancer Resources). However, Los Angeles has 71 survivor/support groups, and Orange County has 24 survivor/support groups.

LANDSCAPE ANALYSIS
LOS ANGELES | PAGE 47
Social and Economic Vulnerability Social determinants affect health outcomes – such as breast cancer – for individuals and communities. These play out not just across individual lifetimes, but generationally. Disadvantages compound in certain communities, which exacerbates and cements a wide range of negative outcomes and existing burdens, including with regard to health (Cozier et al., 2009; Institute of Medicine of the National Academies, 2011). The Social Vulnerability Index (SVI) of each county can be seen in Map 7 (Los Angeles MTA Social Vulnerability). The SVI is calculated by the CDC, and a county’s score “refers to the resilience of communities when confronted by external stresses on human health, stresses such as natural or human-caused disasters, or disease outbreaks” (e.g., such as hurricanes, fires, and COVID-19). Scores range from 0.0 to 1.0, with scores closer to 1.0 indicating greater vulnerability. Los Angeles County has quite a high SVI score at 0.79, with Orange County having a SVI score of 0.44. Individual factors influencing a county’s SVI can be parsed by looking at specific indicators.
MAP 7. LOS ANGELES METRO AREA SOCIAL VULNERABILITY Los Angeles County reports a high percentage of the population below 200 percent of the Federal Poverty Line (FPL) in the MTA, at 38 percent , which is about 3,840,174 people. (Table 17 – Los Angeles MTA Economic Security). Los Angeles County also has a high percentage of Black women over age 45 who live below the FPL, at 20 percent. In addition, 13 percent of Los Angeles County’s residents are uninsured, which is about 1,313,744 people. Orange County has relatively higher economic security, with 9 percent of its population uninsured, 28 percent of its population below 200 percent of the FLP, and 12 percentof Black women who live below the poverty level.
TABLE 17. LOS ANGELES METRO AREA ECONOMIC SECURITY
County Percent of Population That Is Uninsured Percent of Population
Below 200% FPL Percent of Black Women Over
Age 45 Who Live Below Poverty Level
Los Angeles 13% 38% 20%
Orange 9% 28% 12%
Source: American Community Survey 2013-2017 5-Year Estimates (US Census Bureau)
Source: 2016 Social Vulnerability Index (US Centers for Disease Control and Prevention)

LANDSCAPE ANALYSIS
LOS ANGELES | PAGE 48
MAP 8. LOS ANGELES METRO AREA HOUSING-COST BURDEN With regard to food security in the Los Angeles MTA, Los Angeles County reports that 15 percent of Black households receive SNAP/EBT (Table 18 – Los Angeles MTA Food Security). The county also reports that 11 percentof its population is food insecure, yet only 2 percentof its total population has limited access to healthy foods. In Orange County, only 1 percent of the total population has limited access to healthy foods, yet 10 percent of the total population is food insecure, and 10 percent of Black households receive SNAP/EBT.
TABLE 18. LOS ANGELES METRO AREA FOOD SECURITY
County Percent of Population That Is Food Insecure
Percent of Total Population With Limited Access to
Healthy Foods Percent of Black Households
Receiving SNAP/EBT Los Angeles 11% 2% 15%
Orange 10% 1% 10%
Sources: 2019 County Health Rankings (County Health Rankings); American Community Survey 2013-2017 5-Year Estimates (US Census Bureau)
With regard to food security in the Los Angeles MTA, Los Angeles County reports that 15 percent of Black households receive SNAP/EBT (Table 18 – Los Angeles MTA Food Security). The county also reports that 11 percent of its population is food insecure, yet only 2 percent of its total population has limited access to healthy foods. In Orange County, only 1 percentof the total population has limited access to healthy foods, yet 10 percent of the total population is food insecure, and 10 percent of Black households receive SNAP/EBT.
Source: 2016 Comprehensive Housing Affordability Strategy dataset (US Department of Housing and Urban Development)

LANDSCAPE ANALYSIS
LOS ANGELES | PAGE 49
MAP 9. FOOD DESERTS IN THE LOS ANGELES METRO AREA Map 9 (Food Deserts in the Los Angeles MTA) defines food deserts as low income, low access food desert designated by the census tract. There are large food deserts in the MTA in northern Los Angeles County. There are also smaller food deserts in southeast Los Angeles County, the north side of the city of Los Angeles, and one in northern Orange County.
TABLE 19. LOS ANGELES METRO AREA TRANSPORTATION
County Percent of Households Without a Vehicle
Percent of Total Population That
Commutes More Than 45 Minutes to Work
Percent of Total Population That
Commutes to Work Using Public Transit
Percent of Total Population That
Commutes to Work by Foot/Bike/Other
Los Angeles 9% 24% 6% 5% Orange 5% 17% 2% 4% Source: American Community Survey 2013-2017 5-Year Estimates (US Census Bureau)
Los Angeles County is home to a large city, yet many of its residents own a car and do not rely on public transport or walking/biking. Specifically, only 9 percent of households do not have a vehicle, 6 percent of the total population commutes to work using public transport, and 5 percent of the total population commutes to work by foot or bike (Table 19 – Los Angeles MTA Transportation). Further, 24 percent of the population, or 2,425,373 people, commute more than 45 minutes to work. In Orange County, only 5 percent of households do not have a vehicle, 2 percent of the population uses public transport to get to work, and 4 percent commute by foot or bike.
Source: 2019 Food Research Atlas (US Department of Agriculture, Economic Research Service)

LANDSCAPE ANALYSIS
LOS ANGELES | PAGE 50
TABLE 20. LOS ANGELES METRO AREA EDUCATION
County Percent of Population Over Age 25 That Has a High School
Degree or Higher Percent of Population Over
Age 25 That Has a bachelor’s degree or Higher
Percent of Black Women Over Age 25 Without a High School
Degree Los Angeles 78% 31% 11%
Orange 85% 39% 6%
Source: American Community Survey 2013-2017 5-Year Estimates (US Census Bureau)
In Orange County, 85 percent of the population over age 25 has a high school degree or higher, and 39 percentof the population over age 25 has a bachelor’s degree or higher (Table 20 – Los Angeles MTA Education). In Los Angeles, 78 percentof the population over age 25 has a high school degree or higher, and 31 percent of the population over age 25 has a bachelor’s degree or higher. However, in Los Angeles, 11 percent of Black women over age 25 do not have a high school degree.
TABLE 21. LOS ANGELES METRO AREA GENTRIFICATION
County Proportional Change in Population With a Bachelor's Degree or Higher Percent Change in Median Household Income
Los Angeles 2% 9% Orange 3% 8% Sources: American Community Survey 2013-2017 5-Year Estimates (US Census Bureau); American Community Survey 2008-2012 5-Year Estimates (US Census Bureau)
Gentrification is another measure connected to educational attainment. The percent change in median household income is 9 percent in Los Angeles and 8 percent in Orange County (Table 21 – Los Angeles MTA Gentrification). The proportional change in population with a bachelor’s degree or higher is relatively small in both Los Angeles and Orange County, at 2 percent proportional change in Los Angeles and 3 percent in Orange County.

LANDSCAPE ANALYSIS
LOS ANGELES | PAGE 51
Policy Context This section examines key policies relating to access and coverage for breast cancer screening, diagnosis and treatment. The main policies and programs relevant are the Patient Protection and Affordable Care Act (ACA), including Medicaid expansion, the National Breast and Cervical Cancer Early Detection Program (NBCCEDP), and the Breast and Cervical Cancer Prevention and Treatment Act (BCCPTA).
The Patient Protection and Affordable Care Act (ACA) The ACA was signed into law in 2010, enacting broad health reforms across the nation, most notably expanding health insurance coverage and enacting consumer protections. The provisions of the law that are most relevant to women seeking breast cancer-related services are the preventive services mandate, the provision that bars insurers from denying coverage based on pre-existing conditions (such as a previous diagnosis of breast cancer), and the state-by-state option to expand eligibility for Medicaid.
� Preventive Services Mandate. The preventive services mandate requires that almost all private health insurance plans cover certain preventive services without patient cost sharing. This mandate does not apply to grandfathered plans or policies, a very minor share of plans in existence prior to the passage of the Affordable Care Act on March 23, 2010, that have not undergone major changes to benefits. These preventive services are determined by guidelines from expert clinical entities, including the US Preventive Services Task Force (USPSTF) and the Health Resources and Services Administration (HRSA). In accordance with these guidelines, plans must provide coverage for mammograms beginning at age 40 without cost sharing. For women at high risk of breast cancer, plans must also cover genetic screening and preventive medication for breast cancer (The Henry J. Kaiser Family Foundation, 2015).
� Pre-Existing Conditions Protections. Per the ACA and effective as of 2014, health insurers
cannot deny coverage to an individual or charge more for coverage due to a pre-existing condition. For example, insurers cannot discriminate based on a previous or current breast cancer diagnosis or other health condition. Additionally, health insurers cannot refuse to provide coverage for treatment and other services related to a pre-existing condition (U.S. Department of Health & Human Services, 2017).
� Medicaid Expansion. Under the ACA, states have the option to expand their Medicaid program to individuals with incomes of up to 138 percent of the federal poverty level (FPL). California expanded its Medicaid program upon the passage of the ACA, and therefore the expansion went into effect in 2014. California’s Medicaid program is specifically titled Medi-Cal. The expanded Medicaid program is available to adults with or without children with incomes up to 138 percent of the FPL (DHCS, 2019).

LANDSCAPE ANALYSIS
LOS ANGELES | PAGE 52
Figure 3. Trends of Uninsured Rates for the Nonelderly
The expansion of Medicaid has predictably increased the number of people who have health coverage. See Figure 3 below for trends of uninsured rates for the nonelderly in California (2013-2017) comparing rates among Black and white residents. There is an overall downward trend of uninsured rates for both Blacks whites in California, but an inequity in uninsured rates remains between the groups. The percentage of uninsured, nonelderly white residents in California has decreased from 12 percent in 2013 to 5 percent in 2017. For Blacks, it has decreased from 16 percent in 2013 to 6 percent in 2017, still, however, remaining higher for Black residents than white residents.
As displayed in Table 17 (Los Angeles MTA Economic Security), the 5-year American Community Survey estimates for the average uninsured rate in the Los Angeles MTA is 11 percent (with a high of 13 percent in Los Angeles County and a low of 9 percent in Orange County).
As of October 2019, there were an estimated 3,809,900 adults in the expansion population in California (The Henry J. Kaiser Family Foundation, 2019). From 2013 to 2017, the total uninsured rate in California (not disaggregated by race) decreased from 19 percent to 8 percent. This decrease can be compared to the national uninsured rate drop from 17 percent to 10 percent over the same time period. (The Henry J. Kaiser Family Foundation, 2019).
Recent research indicates that the uninsured rate among nonelderly adults has decreased for all racial/ethnic groups with larger decreases among non- Hispanic Black and Hispanic groups compared to non-Hispanic Whites. The coverage disparities have narrowed compared to before the ACA, but disparities in coverage by race and ethnicity remain (Artiga et al., 2020). Regarding screening, research

LANDSCAPE ANALYSIS
LOS ANGELES | PAGE 53
suggests that states that expanded their Medicaid program eligibility standards have improved cancer screening rates compared to states that did not, and that early adoption of the Medicaid expansion is associated with greater improvements in screening (Fedewa et al., 2019; Swift, 2019). Some studies suggest it is possible that the racial disparity in mammograms has been closed or reversed (Fazeli Dehkordy et al., 2019).
National Breast and Cervical Cancer Early Detection Program (NBCCEDP) and Breast and Cervical Cancer Treatment Program (BCCTP)
In California, the program is called Every Woman Counts Program (EWC); women living in California, who are 40 to 64 years old, at or below 200 percent of the FPL, and uninsured or underinsured are eligible for this program (California Department of Health Care Services, 2020).
During the five-year period of July 2014 to June 2019, the NBCCEDP in California served 107,952 women for both breast and cervical cancer screening and detection services. Specific to breast cancer in California, 100,287 women received a screening mammogram over this five-year period, and 70,218 women received breast cancer screening and diagnostic services. Note that each category provides a unique count of women receiving services, but women may be counted in multiple categories. Thus, the distinct category figures listed are not unduplicated women receiving services. (Centers for Disease Control and Prevention, 2020).
In California, women who are diagnosed (either through the EWC or through another means) may be eligible for treatment through the ICCBP Medicaid if they meet certain requirements.
TABLES 22. OVERVIEW OF SCREENING SERVICES FOR CALIFORNIA RESIDENTS Program BREAST AND CERVICAL CANCER SERVICES (Screening Focus)
Age “Routinely” for women 40 and above, any age for women experiencing symptoms/warning signs of breast cancer.
Insurance status Have no other health insurance including Medi-Cal or Medicare. Or, have health insurance with a copayment or deductible that one cannot afford.
Program Services Mammograms, Pap tests, Pap & HPV co-testing, follow-up tests
Source: Every Woman Counts, California Department of Health Care Services, 2020.
The varying levels of eligibility for BCCTP recan facilitate women’s access to services (e.g., eligible regardless of screening location or provider) or can impede a woman’s access to services (e.g., requirements that NBCCEDP fund screening costs). If a woman is diagnosed with breast or cervical cancer, she is then eligible to receive Medicaid services. If a provider deems that she is free of cancer and does not require further treatment (and if she is not eligible for Medicaid through some other means), her Medicaid enrollment will end.90

LANDSCAPE ANALYSIS
LOS ANGELES | PAGE 54
TABLES 23. OVERVIEW OF TREATMENT SERVICES FOR CALIFORNIA RESIDENTS Program MEDICAID FOR BREAST AND CERVICAL CANCER (Treatment Focus)
Age Under age 45
Insurance status Have no other health insurance including Medi-Cal or Medicare. Or, have health insurance with a copayment or deductible that one cannot afford.
Program Services Breast and cervical cancer treatment and services related to cancer diagnosis. If approved for federal BCCTP, a person may receive full scope Medi-Cal coverage which is not limited to breast and cervical cancer treatment and services. Prosthetic bras are covered if a prescription is written by a doctor and taken to a Durable Medical Equipment (DME) supply facility that accepts Medi-Cal.
Source: Breast and Cervical Cancer Treatment Program (BCCTP), California Department of Health Care Services, 2020. Flexibility in the Medicaid Program via Medicaid Waivers One aspect of flexibility in the Medicaid program is a state’s option to apply for Medicaid “waivers” in the state’s administration of the program. These waivers allow states to “waive” some of the typical federal requirements in order to pilot new approaches (subject to approval from the Centers for Medicare and Medicaid Services [CMS]) (National Conference of State Legislatures, 2018).
The Trump administration has promoted work requirements through Medicaid waivers which have previously not been approved (Brooks, Roygardner, & Artiga, 2019). Several states have applied to enact work requirements, meaning that Medicaid eligible enrollees would have to report working a certain number of hours or involvement in a volunteer role, in school or in time spent looking for a job. Their Medicaid coverage would be contingent on meeting these requirements. Enrollees can also be exempt from these requirements for other reasons including being pregnant, medically frail, being a full-time student, and other reasons (and they must renew their exemptions annually).
Work requirements in Medicaid are a widely criticized strategy that constrict access to Medicaid coverage, do not reach their purported goal of increasing work among Medicaid enrollees, and likely harm health by limiting access to insurance coverage (Cauley Narain & Zimmerman, 2019). In California, there are no work requirements for Medicaid eligibility. Furthermore, most adults enrolled in Medicaid are already working. In California, 64 percent of adults are working full or part-time (KFF, 2017). Among adult Medicaid enrollees who work full-time, most of them work in low-paying jobs and in sectors that do not tend to offer employer-sponsored insurance.
Cancer Plan for California The California Cancer Plan was issued by the California Dialogue on Cancer (CDOC), which is made up of cancer control stakeholders across the state. The five-year plan lays out two objectives to improve

LANDSCAPE ANALYSIS
LOS ANGELES | PAGE 55
breast cancer outcomes, with various strategies aimed at meeting those objectives. The two objectives are:
1. By 2015, increase the prevalence of women 40 years and older who report having both a screening mammogram and a clinical breast exam (CBE) within the prior two years from a baseline prevalence of 79.1 percent to 85 percent
2. By 2015, increase the proportion of early-stage diagnoses of breast cancer among all women by 20 percent, from the baseline proportion of 69 percent to 89 percent.
Later in the plan, the authors also included a specific cancer-site objective of reducing the mortality rate of female breast cancer by 10 percent by 2015. The strategies to achieve these objectives include increasing funds spent on breast cancer screening outreach and public education messages, improving screening in women with higher likelihood of late-stage diagnoses, and supporting patient navigation services. While none of these strategies explicitly speak to the racial disparities in breast cancer diagnoses and treatment, they underlie some of the strategies that may work to reduce some of these disparities. By offering services such as patient navigation, health systems can mitigate some of the inequities in care by ensuring that Black women receive the needed resources and enhanced access to care.
State Laws Impacting the Breast Cancer Community � Oral Parity. California has passed legislation that ensures patient cost-sharing for oral
chemotherapy treatments are no less favorable than the patient cost-sharing for intravenous chemotherapy treatments.

LANDSCAPE ANALYSIS
LOS ANGELES | PAGE 56
Discussion and Conclusion The landscape analysis sought to understand the underlying causes for breast cancer inequities across the care continuum among Black women in the Los Angeles MTA, with a focus on systemic issues and SDOH. The data on breast cancer disease burden comparing counties to one another, and by race, indicate that breast cancer inequity may be greatest for Black women living in Los Angeles County and Orange County.
Breast Cancer Disease Burden
Both Los Angeles and Orange counties report higher late-stage incidence rates among Black women as well as higher mortality rates compared to white women. In both counties a racial disparity in mortality rates persists among Black women and white women as shown in Table 8. Nearly a 10-point difference exists between age-adjusted mortality rate for Black women and white women in Los Angeles County (30.9 and 20.4 respectively). Potentially related to the disparity seen in Los Angeles County is the percent of women getting mammograms (Table 9). In Los Angeles County 68 percent of women over the age of 40 years old are getting mammograms. This is lower than both the state and national rates (75 percent and 73 percent, respectively). A lower rate in screening and higher mortality rate in Los Angeles County creates a call for programming that increases access to screening for women, specifically Black women.
Quality of Care
Fear of painful screening mammograms was noted as a barrier to screening for some women. Also, shame associated with a diagnosis was stated as another reason for not pursuing a screening mammogram. This is consistent with the literature. For example, Daly and Olopade (2015) noted that the research literature has found a link between fears of a potential cancer diagnosis and delayed follow-up diagnosis and care (Daly & Olopade, 2015).
Furthermore, there are barriers plaguing access to genetic counseling and testing services in the Black community. These services are valuable for those with a family health history of cancers to determine whether or not genetic mutations known to cause increased risk for breast and other cancers (such as mutations in BRCA1/BRCA2 genes) are present. One of the root causes of the genetic testing disparity is the lack of knowledge and communication of genetic testing in the Black community. Blacks do not participate in genetic testing at the same rate as European Americans (Huang et al. 2014). Implicit racial bias is associated with negative markers of communication among minority patients and may contribute to racial disparities in processes of care related to genetic services (Schaa et al., 2015).
Data from the qualitative study reveal that there is confusion about screening guidelines and that differences in recommendations make it difficult to know when to start screening. Community members and providers shared that they have some familiarity with the guidelines, but the guidelines have recently changed, and community members are uncertain of some of the nuances of the guidelines. In particular, the recommendation for what age to begin screening is not consistent among friends, family members, or providers as expressed by participants.
In addition to screening guidelines from important national task forces and professional academies, variation at state levels can add to the confusion among patients, community members, and providers.

LANDSCAPE ANALYSIS
LOS ANGELES | PAGE 57
For example, the state-level National Breast and Cervical Cancer Early Detection Program and Breast and Cervical Cancer Treatment Programs also vary in their screening mammogram recommendations by age, eligibility, and program details, which may lead to confusion among patients and/or providers. This could contribute to a lack of clarity among women about screening guidelines and for which services they may receive coverage. This in turn may impact trust or mistrust of their providers and the healthcare system.
Social Determinants of Health
Findings from the policy review show that the uninsured rate has decreased statewide with the expansion of Medicaid, however, disparities among racial and ethnic groups persist. Even with insurance, Black women still experience poorer breast cancer outcomes compared to White women. For example, one study reported that among Black breast cancer patients, a woman’s insurance type was a significant predictor of mistrust of the medical establishment. The study showed that Black women with Medicaid expressed greater mistrust and suspicion compared to Black women with private insurance or a combination of private insurance and Medicare (Sutton et al., 2019).
Data on systemic issues and SDOH along with qualitative data collected from community members suggest that breast health inequities among Black women in the Los Angeles MTA could largely be explained by five factors: 1) fear, shame, and lack of information, which together influence care seeking and adherence, 2) awareness of quality screening and care that is accessible—transportation was a noted barrier, 3) strong navigation programs that can guide Black women through the continuum of care, 4) social support and relationships with providers to facilitate better treatment adherence, and 5) racism, microaggressions, and health care discrimination being correlated with a lack of trust in the health care system and providers deepening retention issues.
A systematic review by Jones et al. (2014) found that factors contributing to delays in breast cancer diagnosis and care among Black women include a fear of cancer treatments, fear of being abandoned by one’s partner, taboo and stigma (C. E. Jones et al., 2014). While the study was conducted by researchers in the UK, most research included in the review was performed in the U.S.
Survivor and undiagnosed Black women’s stories convey their experience of poor quality of care, racism, microaggressions, and health care discrimination, an already-established and still-pervasive finding in this study. Surprisingly, the lack of awareness about accessible screening programs was a key finding expressed by women, patient navigators and providers alike. Finally, the challenge of retaining patients experiencing mental strain emerged as a more novel finding in the qualitative data portion of this study that warrants further investigation.
Breast cancer inequities across the care continuum in the Los Angeles MTA persist due to lack of consistent screening information, poor navigation, experiencing personally mediated racism in health care settings, as well as other barriers such as time and transportation limitations. Taken together, these factors severely reduce the quality-of-care Black women receive across the cancer care continuum. This study confirms the existence of many well-understood barriers across the care continuum facing Black women.

LANDSCAPE ANALYSIS
LOS ANGELES | PAGE 58
Many of these factors have existing dedicated resources supporting the mitigation of these barriers. However, this study also highlights novel barriers and adds nuance to existing barriers across the care continuum that warrant further research, intervention, and new policies that Komen can support. These issues uncovered in Los Angeles and Orange counties include: 1) lack of information that is consistent and reliable around breast cancer screening, 2) fear and shame related to breast cancer screening and diagnoses, 3) need for patient navigator programs, 4) tendency to lose patients to follow-up who experience mental strain during their cancer journey, 5) patient-provider communication and trust issues, and 6) lack of survivorship groups that are culturally relevant.

LANDSCAPE ANALYSIS
LOS ANGELES | PAGE 59
Recommendations Komen’s Stand for H.E.R. is a substantial undertaking to dismantle the systems that perpetuate the growing breast cancer inequities experienced by Black women. Findings from the Los Angeles MTA landscape analysis suggest that the work ahead requires interventions at multiple levels of the system: the micro level (the level at which patients and providers interact), the mezzo level (the level at which systems interact), and the macro level (the policy level).
This framework reveals that the health system is multidimensional, ever-changing, and has the potential to facilitate or impede population health. For most, the lasting impression of the health system begins at the micro level – where providers and patients interact. As Black women progress along the breast cancer continuum of care, they encounter other microsystems, and the complexity of their experience increases. Access to and quality of these microsystems vary, and there is a need for these systems to interact and relate in a manner that centers on the experiences of Black women. When multiple microsystems intersect, the mezzo system is formed and the health experience becomes more complicated, particularly if there is no navigation assistance or care coordination. System functionality at the micro and mezzo levels is directed by policies and resources within and beyond the organization – the macro level.
The following recommendations apply this systems framework and address specific changes, strategies, or interventions at the micro, mezzo and macro levels. These recommendations are intended to work in concert and not as discrete changes. Recommendations acknowledge that the systems and their components are relational, non-linear and dynamic. Thus, suggested strategies and interventions should be coordinated with communities, in keeping with Komen’s collaborative approach to advance breast health equity for Blacks. This provides a mechanism for community/stakeholder engagement and recognizes the informal and formal systems and networks of social support that are accessed by Black women.

LANDSCAPE ANALYSIS
LOS ANGELES | PAGE 60
Micro-Level Strategies Increase access to culturally responsive patient navigators.
The data on breast cancer inequity in this study indicate that breast cancer inequity may be greatest in Los Angeles County. This county is reporting high late-stage incidence rates among Black women as well as higher mortality rates compared to white women. There is a clear disparity in late-stage incidence, between Black and white women, and a disparity in breast cancer mortality among Black women reporting higher rates than their white counterparts across both counties in the MTA where data is available (see Table 7 and Table 8).
As noted earlier in the report, Black women exercising decision-making and/or practicing self-advocacy within the health care setting were ignored or met with disapproval. For some women, experiences of not being listened to by their providers led to delays in treatment and deepening mistrust. Historical injustices inflicted by the health care system and continued personally mediated provider biases exacerbate barriers to care. Given the importance of patient-provider communication and the ability of providers to exercise cultural sensitivity, the role of patient navigators as “translators” during health care visits, and as a “support systems” after the visit is essential. Patient navigators are important members of the clinical care team. They offer expertise in navigating the health care system; and can offer resources to help integrate clinical care with mental health and related support. According to focus group participants, Black patient navigators were highlighted as particularly valued resources. Black patient navigators, more likely to reflect the lived experience of Black breast cancer patients, may serve as a key conduit between patients and their providers. They are also valuable to provide necessary referrals to support services, such as transportation assistance. Navigators offer crucial perspectives and enable more culturally relevant care.
Evidence indicates that patient navigation can be effective in improving mammography screening (Baik, Gallo, & Wells, 2016; Scheitler, Shimkhada, Ko, Glenn, & Ponce, 2018). One study reported that a patient navigation program improved timely care and compliance with breast cancer treatment. (Castaldi, Safadjou, Elrafei, & McNelis, 2017).
Komen Stand for H.E.R. should continue to build and support a network of culturally responsive, trained patient navigators who represent the Black community. This includes increasing the number of navigators and assuring they are geographically accessible. This investment could also support the development of comprehensive patient resource materials that are helpful and widely available, so that patients and caregivers don’t have to do extensive research or ask a friend to find needed resources. This was found to be problematic irrespective of socioeconomic and education status in this study. These navigators could also coordinate more support groups that are culturally competent and even virtually accessible for women who might not be able to meet in person, particularly in Los Angeles County.
Develop education and programming to better serve Black women in treatment.
Findings from this study indicate that providers often encounter women who favor alternative treatment plans rather than the standard recommended care plans. Therefore, the Stand for H.E.R. should develop materials and messaging about treatment. The materials should be culturally appropriate and encourage that women be advocates for their health, but also heed provider

LANDSCAPE ANALYSIS
LOS ANGELES | PAGE 61
recommendations. The materials should also provide reliable information about complementary treatments as this is something Black women in the Los Angeles MTA are interested in. The breast cancer community can support innovative outreach education and awareness campaigns with community stakeholders in places that reach a wider audience like supermarkets and other less frequently used avenues.
Implement implicit bias trainings for providers, administrators and health care staff.
Data suggest that in addition to institutionalized racism, Black residents in the Los Angeles MTA experience several forms of personally mediated racism (U.S. Department of Housing and Urban Development, 2019; U.S. Department of Justice Federal Bureau of Investigation, 2017). As seen in Table 10, Los Angeles County, reports the highest number of race-based incidents, including the highest numbers of Fair Housing Act cases and highest number of Blacks killed by police by a significant margin at 1,029 cases and 23 people. Qualitative findings from this study indicate that historic distrust of the health care system, as well as family and personal experiences of implicit bias, racism, and discrimination both generally and in the health care system impact quality of care received for Black women.
Therefore, the breast cancer community should support racial equity trainings for providers. The exact focus of the training could include: 1) basics of implicit bias, 2) challenging racial/ethnic stereotypes using results from this study as stimulus for case examples and content, 3) improving empathic communication skills related to cancer diagnosis and treatment, and 4) cultural humility.
Increase education about family health history to identify high-risk families and offer genetic counseling and testing to meet the need.
Individuals who have first-degree family members with a history of disease may benefit from genetic testing which may lead to early screening and early detection, implementing preventive actions, participating in research trials, and even accessing interventions that could slow or prevent disease progression. However, several studies show that Black women are less likely to have genetic testing.
Various studies assessed the reasons why people of diverse ancestry take advantage of genetic testing in such small numbers. For example, a study conducted by Glenn et al. from 2004 to 2006 revealed that among Black Asian, and Latina women, a leading reason why these women did not undergo a BRCA gene test was lack of awareness of the availability of this service (Glenn et al., 2012). In addition, health care providers may not obtain family history information from non-White women at the same rates as White women (Murff et al. 2005). Lower rates of discussing family history of breast cancer with Black women may further translate into reduced rates of referring these women to genetic counseling.
In Georgia, the screening mammography rate for Black women over the age of 40 is 79.4 percent, compared to 72 percent of white women in the same age range. While Black women are getting screened at high rates, the breast cancer mortality rate is higher for Black women than white women in most counties in the MTA where data is available for both demographics (see Table 8). The qualitative findings indicate community uncertainty of the appropriate age for screening with some saying 50-years-old is the appropriate age for a first screening mammogram. Other community members shared concerns about Black women in their 30s receiving breast cancer diagnosis before the recommended screening ages. This underscores the value of genetic counseling and testing for those at increased hereditary risk for breast cancer.
LANDSCAPE ANALYSIS
LOS ANGELES | PAGE 62
The breast cancer community has an opportunity to support a health promotion campaign that amplifies the need to discuss family health history so that families may make decisions about their healthcare; to educate about the role genetic testing and counseling can play in overall healthcare; and to provide information on accessing trusted providers of testing and counseling services. While these services are often covered by insurance, a program is needed to provide services to the under- and uninsured families. This campaign should be rigorously evaluated, and if done effectively should demonstrate significant increases in awareness and uptake among Black women and their families around these programs and contribute to the growing body of research evidence about the genetic drivers of breast cancer in Black women.

LANDSCAPE ANALYSIS
LOS ANGELES | PAGE 63
Mezzo-Level Strategies Increase access to integrated care to improve the breast cancer care experience.
Particular aspects of the breast cancer continuum that warrant further investigation and intervention include the availability of accessible, high-quality screening, low cost or free diagnostic mechanisms, and various treatment options for Black women. This can also include exploring partnerships with FQHCs. The integration of oncological, primary care, and mental health services is valuable. Overweight and obese women are represented among the increased incidence rate for breast cancer after menopause. Reducing a woman’s risk for breast cancer through routine primary care and help improve weight-related risk. Additionally, the breast cancer experience is characterized by an increased toll on mental health. Poor mental health also increases stress, a risk factor for breast cancer. Therefore, the integration of mental health services along the breast cancer care continuum is also important.
Support Quality Improvement (QI) initiatives along the breast cancer continuum of care.
Quality improvement (QI) initiatives employ qualitative and quantitative methods to enhance the effectiveness of interventions, programs, and policies. Institutionalizing a commitment to quality improvement supports continuous learning and refinement in ways that ensure limited resources are used optimally and service delivery objectives (e.g., quality care) are achieved. The Stand for H.E.R. project may want to support QI initiatives in the major health systems in the MTA, especially in cities that have large Black populations.
To help combat potential system-level discriminatory practices, additional QI measures are warranted to maintain and build upon. This may include monitoring progress relating to treatment adherence, assessing care experiences, and reducing time to diagnosis among Black women. Komen and partners may want to support QI initiatives in the major health systems in the Chicago MTA, especially in counties that are largely Black. These efforts have been helping improve the quality of care, often perceived by community residents, and confirmed by providers, as varying across health systems and of worse quality among institutions that serve under-insured or Medicaid populations. Komen and partners could consider ways to support QI initiatives in non-hospital and non-health system care settings (in addition to hospital and health system settings), such as federally qualified health centers that are more accessible to priority populations.
Implement a culturally relevant health promotion campaign intended to increase knowledge of screening guidelines.
Health care facilities and breast cancer resources are concentrated in the city of Los Angeles (see map 6 and Table 16). However, given the lack of information around screening mammograms in the Los Angeles MTA found in this study, Komen Stand for H.E.R. may want to support a health promotion campaign that is intended to ensure Black women know that free screening mammograms are available, when to access them and how to access them. This campaign should be rigorously evaluated, and if done effectively should demonstrate increases in awareness among undiagnosed Black women around these programs. Furthermore, we recommend that Komen encourage major treatment centers in Los Angeles and Orange Counties particularly in Northern Los Angeles County, provide free clinical visits so women can better access mammograms as our findings indicate that transportation and location create barriers to getting screened.

LANDSCAPE ANALYSIS
LOS ANGELES | PAGE 64
Support a community-based participatory applied research project to explore how to support breast cancer patients experiencing mental strain.
Komen Stand for H.E.R. can support a community-based participatory applied research project that seeks to identify the kind of infrastructure that needs to be built to ensure that cancer treatment systems are equipped to deal with unique challenges presented by patients who experience mental strain. Mental strain experienced by diagnosed breast cancer patients as explained by study participants interferes with remaining in the care continuum for successful treatment. CBPR focuses on social, structural, and physical environmental inequities through active involvement of community members, organizational representatives, and researchers in all aspects of the research process. Therefore, the recommended CBPR project should be an interdisciplinary research team composed of cancer research specialists, behavioral health specialists, patients, navigators and select community service providers. According to Holkup et. al, the strength of this research approach is that partners contribute their expertise to enhance understanding of a given phenomenon and integrate the knowledge gained with action to benefit the community involved (Holkup, Tripp-Reimer, Salois, & Weinert, 2004). Furthermore, this research framework empowers people by considering them agents who can investigate their own situations. The community input makes the project credible, enhancing its usefulness by aligning it with what the community perceives as social and health goals, and in so doing helps dismantle the lack of trust communities may have in relation to research.
Support a community-based participatory research project to identify and implement strategies for culturally relevant survivorship support.
Findings from this study indicate that there is a lack of robust survivorship support that is relevant to Black women in the area. Survivors reported experiencing survivorship support groups that they did not connect with. Most breast cancer resources in the MTA are concentrated in Los Angeles County, particularly in the form of breast cancer support groups (71 groups are in Los Angeles) (see Table 16). Orange County has the fewer number of resources with only 24 support groups.
Therefore, the breast cancer community can partner with a few major treatment cancer centers in Los Angeles and Orange counties to conduct research with community stakeholders, including cancer research specialists, survivors, navigators, and select community service providers to gather their perspectives and actionable insights.

LANDSCAPE ANALYSIS
LOS ANGELES | PAGE 65
Macro-Level Strategies Conduct a root cause analysis relating to delays in breast cancer diagnosis.
In Los Angeles County, where the majority of the Black women in the MTA reside, Black-white disparity in mortality rates is noteworthy when examined alongside with qualitative data findings in this study, underscoring that Black women experience diagnosis delays as well as discriminatory treatment care (see Tables 6 and 8). This points to some failures in the diagnosis and treatment phases of the breast cancer continuum of care. For these reasons, Komen’s Stand for H.E.R. project may want to invest in a root cause analysis (RCA) process to identify the contributing factors and underlying causes of diagnosis delays and sub-optimal care, as well as the key leverage points where intervention would have a significant impact on reducing breast cancer inequities. By conducting an RCA, stakeholders, including non-health stakeholders, can begin to understand the complexity of this issue in their community. Komen’s Stand for H.E.R. may want to invite breast cancer survivors, community-led efforts (e.g., workers’ unions, non-profits, food banks, community health centers, women’s organizations, environmental justice organization etc.), and research centers with long-standing academic-community partnerships to participate in the RCA process. The RCA includes an action planning process to determine how to intervene on key leverage points identified through the RCA. Additionally, the RCA process can spur innovative ideas and strategies guided by best practices for addressing the factors and underlying causes that impact breast cancer mortality inequities in Los Angeles County. Once complete, Stand for H.E.R. may want to engage in partnerships with the RCA stakeholders and provide grants to implement the RCA action plan among these organizations’ respective members and networks.
Support financial assistance programs.
The breast cancer community can prioritize advocating for health system financial assistance programs to meet deductibles for high-deductible health plans or cost sharing for underinsured women. Nonprofit health systems offer such financial assistance programs through grant funding and other mechanisms. These funds could be leveraged for further reach. Some charitable programs require yearly eligibility applications that are hard to navigate in the midst of cancer care; especially for those with limited literacy and competing demands for their time due to family and work. If bolstered, the application processes should be eased and tailored to more fully relieve the financial burden that women experience.
Support efforts to develop guidelines and policies that address disproportionate breast cancer mortality among Black women, including increased genetic counseling and testing services.
Black women experience higher rates of death from breast cancer due to a combination of factors including barriers to early diagnosis, the aggressive nature of certain breast cancers that are more prevalent in Black women (TNBC, for example), and systemic healthcare challenges.
The breast cancer community should re-examine breast cancer screening and clinical care guidelines with a racial equity lens, and develop strategies (e.g., new guidelines, policies, practices) that aim to address the multi-level influences that lead to breast health disparities. Black women are at higher risk of dying from breast cancer, which is influenced by social determinants of health, but also in part because Black women get more aggressive breast cancer at earlier ages, so in part driven by heredity. Such efforts would allow us to move beyond the “one-size-fits-all” approach to breast cancer screening, diagnosis and treatment to a more personalized approach based on individuals’ risk, social inequalities

LANDSCAPE ANALYSIS
LOS ANGELES | PAGE 66
and other factors that drive disparities. In collaboration with patient advocates and the community, the resulting strategies, which may include new guidelines, policies, and practices would provide health care providers with a better framework for delivering patient care, may help overcome the implicit bias of some HCPs and could be used to inform and/or monitor quality improvement initiatives.
As an example, breast cancer risk is one area that warrants further investigation, particularly with regard to differences in risk factors by race/ethnicity, that could inform more personalized strategies for breast cancer screening and treatment. In March 2018, the American College of Radiology (ACR) and the Society of Breast Imaging (SBI) recommended that all women, especially Black women (and those of Ashkenazi Jewish descent), have a breast cancer risk assessment no later than age 30 so those at higher risk can be identified and their screenings and breast health care be appropriately modified. The societies also made recommendations for modifications to the screening approach for women with specific risk factors and/or at higher risk of developing breast cancer; modifications included changes to the age at which screening should start, as well as the frequency and modality (mammography, ultrasound, MRI, etc.) of screening.
Adopting a risk-based approach to breast cancer screening and treatment would benefit from additional research to better understand risk through an equity lens to inform the development of better risk assessment tools. Related strategies to consider include increasing access to genetic counseling and testing, integrated healthcare, and partnering across multiple providers to ensure personal risk for breast cancer is determined early. Additionally, public policy changes will be required to ensure evidence-based recommendations for screening and treatment will be covered by health insurance plans with little to no cost to the patient. Changes in guidelines, policies and practices could facilitate a risk-based approach to screening and treatment that could decrease the number of Black women who present with later-stage breast cancers and reduce disparities in breast cancer mortality.
This landscape analysis report conveys comprehensive issues facing Black in the Stand for H.E.R. MTAs. These recommendations are intended to be a call to action for all community-based organizations, policymakers, hospitals, healthcare providers, faith-based organizations, civic leaders and citizens. The recommendations are offered as evidence-informed strategies to start reducing breast cancer disparities among Blacks.

LANDSCAPE ANALYSIS
LOS ANGELES | PAGE 67
Appendix A. Map Measures TABLE 25. LOS ANGELES METRO AREA TABLE MAPS
County Map 3: Percent of Population that is
Black Map 7: Social
Vulnerability Index Score
Map 8: Percent of Households that are
Housing-Cost Burdened
Map 4: Residential Segregation Score
Los Angeles 8% 0.79 47% 58
Orange 2% 0.44 42% 46
Sources: American Community Survey 2013-2017 5-Year Estimates (US Census Bureau); 2016 Social Vulnerability Index (US Centers for Disease Control and Prevention); 2016 Comprehensive Housing Affordability Strategy dataset (US Department of Housing and Urban Development); 2019 County Health Rankings (County Health Rankings)

LANDSCAPE ANALYSIS
LOS ANGELES | PAGE 68
Appendix B. Abbreviations & Glossary Age-adjusted rates: A weighted average of the age-specific (crude) rates, where the weights are the proportions of persons in the corresponding age groups of a standard population. The potential confounding effect of age is reduced when comparing age-adjusted rates computed using the same standard population. Rates are expressed as the number per 100,000. The age-adjusted rates that appear in this report were calculated by State Cancer Profiles (SCP) using the National Cancer Institute’s Surveillance, Epidemiology, and End Results (SEER) Program data and methods. (National Cancer Institute).
Allostatic load: The “wear and tear” on the body and brain that results from chronic or repeated stress.
Black/white dissimilarity index: A measure of residential segregation that illustrates the evenness with which two mutually exclusive groups (in this case, Blacks, and whites) are distributed across the geographic units (in this case, census tracts) that make up a larger geographic entity (in this case, counties). Calculated by County Health Rankings (CHR) using the Index of Dissimilarity formula and data from American Community Survey (ACS) 5-year. Scores range from 0-100 and scores closer to 100 indicate greater segregation. CHR only calculates this measure for counties with at least 100 Black residents (County Health Rankings, 2020e).
Breast cancer stage: An approach to classify and describe cancer’s spread or growth in the body. There are various approaches to staging. Health care providers commonly use “TNM” to assess the stage, which stands for:
• Tumor: size and location of tumor • Node: whether the tumor has spread to the lymph nodes • Metastasis: whether the cancer has spread to other parts of the body and to what extent.
Clinical breast examination: A physical exam that a provider performs to check the breasts and underarms for any concerns (e.g., lumps).
Collective impact: A cross-sector approach to solving complex issues on a large scale that offers a unique way of working wherein whole systems – health departments, government, businesses, CBOs, and participants with lived experiences make a unified effort to collectively address the issue from multiple angles. (Kania & Kramer, 2011).
Confidence Interval (CI): Statisticians use a confidence interval to express the degree of uncertainty associated with a sample statistic (e.g., mean, median or other measure). It is usually presented with a probability statement.
Continuum of Care: The clinical continuum of care for breast cancer includes all aspects of screening, detection, diagnosis, treatment, and follow-up.
County Heath Rankings (CHR) percentile: A measure calculated by JSI using the following formula: CHR (numerator) divided by the number of counties in the state (denominator). CHRs are determined through an intra-state, weighted variable process (County Health Rankings, 2016).

LANDSCAPE ANALYSIS
LOS ANGELES | PAGE 69
Diagnostic screening mammogram: A screening mammogram used to further examine breast cancer symptoms (e.g., a lump) or an abnormal result from a screening mammogram or clinical breast exam using two or more views of the breast.
Fair Housing Act cases: The Fair Housing Act (Title VIII of the 1968 Civil Rights Act) prohibits most discrimination in housing transactions based on federally recognized bases (race, religion, familial status, etc.) Individuals in the US can bring cases to the Office of Fair Housing and Equal Opportunity (FHEO) within the Department of Housing and Urban Development. If there is a reason to believe discrimination occurred, the case will go through a legal settlement process to be resolved.
Federal poverty level (FPL): A measure of income that the US Department of Health and Human Services (HHS) releases annually. The FPL is used to determine eligibility for some benefits and programs, such as Medicaid, and cost subsidies on the health insurance Marketplace. The 2020 FPL is $26,200 for a family of four, and $12,760 for an individual. The data that appear in this report were calculated by the US Census Bureau and indicates the percentage of the population whose annual income is less than twice the 2017 FPL (i.e. 200% FPL). In 2017, the FPL was $24,600 for a family of four and $12,060 for an individual. (Office of the Assistant Secretary for Planning and Evaluation).
Food deserts: Areas defined by the US Department of Agriculture as urban census tracts that are low income and have low access to fresh food within a one mile radius. (U.S. Department of Agriculture Economic Research Service, 2019).
Gentrification: The process whereby a neighborhood or community’s characteristics change as more affluent residents and businesses move into an area and displace less affluent residents, often people of color.
Hate crime with a race/ethnicity/ancestry bias motivation: A criminal offense against a person or property that was motivated in whole or in part by the offender’s bias against a person’s race/ethnicity/ancestry. The FBI collects this data using self-reported data from municipalities and universities. The data included in this report are from 2017. Crimes committed in municipalities that cross county lines are counted for all of the counties in which the municipality is located. (U.S. Department of Justice Federal Bureau of Investigation, 2017).
Hazard ratio: Hazard ratio: A measure of how often a health event occurs over time in one group compared to another group. Cancer research often uses hazard ratios to compare a group of patients receiving a cancer treatment to a control group (receiving another treatment or placebo). A hazard ratio of 1 signifies no difference in survival between the groups; a hazard survival less than one or greater than one signifies that survival in one of the groups was better than the other (National Cancer Institute).
Health equity: Equity is the absence of unjust or avoidable differences among groups of people, whether defined demographically, socially, economically or by some other means. Health equity means that every person has a fair opportunity to attain their highest level of health and that no individual should be disadvantaged from reaching this potential.
Housing-cost burden: A measure to indicate the proportion of renters and homeowners that spend 30 percent or more of their total income on housing. Calculated by the US Department of Housing and Urban Development using the Consolidated Housing Affordability Strategy dataset and the following formula: number of renters and homeowners who spend 30 percent or more of their total income on

LANDSCAPE ANALYSIS
LOS ANGELES | PAGE 70
housing (numerator) divided by the total number of households (denominator) (Office of Policy Development and Research (PD&R), 2019).
In situ carcinoma: A condition where abnormal cells are found in the milk ducts or lobules of the breast, but not in the surrounding breast tissue. In situ means "in place" (Susan G. Komen, 2020).
Incidence: The number of new cases of a disease that develop in a specific time period. The breast cancer incidence rates that appear in this report were calculated by SCP using data from the Centers for Disease Control and Prevention (CDC) and SEER, and the following formula: the number of individuals in an area who were diagnosed with breast cancer during a one-year period (numerator) divided by the total number of individuals living in that area (denominator). Incidence rates are expressed in terms of number of cases per 100,000 individuals per year. (National Cancer Institute).
Internalized racism: Refers to when members of the stigmatized race devalue themselves and their race, doubt their abilities, reject their ancestry, and culture and have a sense of hopelessness and resignation to subjugation by other races. (C. P. Jones, 2000).
Invasive breast cancer: Breast cancer is considered invasive when it has spread from its original location into the surrounding breast tissue, and potentially into other parts of the body, such as the lymph nodes.
Jim Crow: Jim Crow refers to a set of laws enacted by 21 states in the southern U.S. and the District of Columbia to enforce and uphold racial segregation. These laws were in place following the civil war and banned by the US Civil Rights Act in 1964 (Krieger et al., 2017).
Jim Crow effect: In the 2017 paper by Krieger, Jahn, and Waterman, the authors describe the Jim Crow effect on breast cancer as an association with higher odds of estrogen receptor negative breast cancer only among Black women in the study (not white women) with the strongest effect observed for Black women born prior to 1965 (Krieger et al., 2017).
Late-stage diagnosis: Cancer that is diagnosed once it has spread beyond the breast to lymph nodes, surrounding tissue or other organs in the body (most often the bones, lungs, liver or brain). The late-stage diagnosis rates that appear in this report are age-adjusted and calculated by SCP as described above (see “incidence” and “age-adjusted”) (National Cancer Institute).
Magnetic resonance imaging (MRI): An imaging technique that provides detailed pictures of organs or soft tissue (including the breast). A breast MRI tends to be used for higher-risk women and may also be used during diagnosis.
Mammogram or mammography: An imaging technique that creates an x-ray image of the breast. Mammograms can be used in a screening phase (e.g., to check for abnormalities in otherwise healthy individuals) or to further examine abnormalities.
Medically underserved: Areas or populations designated by the Health Resources and Services Administration (HRSA) as having too few primary care providers, high infant mortality, high poverty or a high elderly populations. (Health Resources & Services Administration).
Mortality rate: A measure of death calculated by the National Cancer Institute using SEER and National Vital Statistics System (NVSS) data. Calculated by SCP using the following formula: the number of individuals in an area who died during a one-year period (numerator) divided by the total number of

LANDSCAPE ANALYSIS
LOS ANGELES | PAGE 71
individuals living in that area (denominator). Expressed in terms of number of deaths per 100,000 individuals per year. (National Cancer Institute).
Odds Ratio (OR): A measure of association between exposure and an outcome. The OR stands for the odds that an outcome will occur given a particular exposure, compared to the odds of the outcome occurring in the absence of that exposure. (Gordis, 2000).
Percent of adults who are obese: A self-report measure calculated by CHR using the following formula: number of adults over age 20 whose BMI (Body Mass Index) is greater than or equal to 30 (numerator) divided by the total population (denominator) (County Health Rankings, 2020a).
Percent of population that is food insecure: A measure defined by CHR as the percentage of the population “with a lack of access, at times, to enough food for an active, healthy life, or uncertain availability of nutritionally adequate foods.” Calculated by CHR using the Core Food Insecurity Model (County Health Rankings, 2020b).
Percent of population with limited access to healthy foods: A measure calculated by CHR using the following formula: population that is low income and does not live within one mile of a grocery store (numerator) divided by the total population (denominator) (County Health Rankings, 2020c).
Personally mediated racism: Refers to assumptions about others’ abilities, motives, and intentions, resulting in intentional and/or unintentional actions taken towards others due to their race. This includes maintaining structural barriers and subscribing to harmful societal norms, and manifests as “everyday avoidance,” disrespect, suspicion and dehumanization (e.g., hate crimes, police brutality) (C. P. Jones, 2000).
Premature mortality rate: A measure of premature death calculated by CHR using the following formula: the number of deaths that occurred among people under age 75 (numerator) divided by the aggregate population under age 75 (denominator). Expressed as the number of deaths under age 75 per 100,000 people. CHR uses data from the National Center for Health Statistics (NCHS) and the NVSS to calculate this measure. (County Health Rankings, 2020d).
Prevalence: A measure of the proportion of the population that has a condition within a particular timeframe. The prevalence data that appear in this report are the SCP’s “Complete Prevalence Age-Adjusted Percents” for each state in 2017. These statistics were calculated by SCP using estimates derived from state-specific cancer mortality and survival data using a statistical package called MIAMOD (Mortality-Incidence Analysis MODEL). Cancer survival models are derived from SEER Program data and adjusted to represent state-specific survival. (National Cancer Institute).
Redlining: This unethical practice systematically restricts access to resources and services (e.g., mortgages, insurance loans, housing) based on the race or ethnicity of individuals and communities.
Social determinants of health (SDOH): The conditions in the places where people live, learn, work, and play that affect a wide range of health risks and outcomes. Examples include, but are not limited to, educational attainment, transportation access, housing security, income, wealth and experiences of racism.

LANDSCAPE ANALYSIS
LOS ANGELES | PAGE 72
Structural racism: The system in which policies, institutional practices, and cultural representations work together, often in reinforcing ways to create and perpetuate racial inequity. Structural racism manifests as differential access to goods, services, conditions, opportunities and access to power.
Social Vulnerability Index (SVI): A measure of the exposure of a population to social vulnerabilities that limit their ability to withstand adverse impacts from multiple stressors to which they are exposed. The SVI is calculated by the CDC using the ACS 5-year report data for 15 social factors (e.g., lack of vehicle access, crowded housing). Scores range from 0.0 to 1.0, with scores closer to 1.0 indicating greater vulnerability (Agency for Toxic Substances and Disease Registry, 2018).
Supplemental Nutrition Assistance Program/Electronic Benefit Transfer (SNAP/EBT): SNAP is a federal benefits program that provides eligible, low-income individuals and families with funds to purchase eligible food in authorized retail food stores via an Electronic Benefits Transfer card.
Triple-negative breast cancer: A type of breast cancer that is estrogen receptor-negative, progesterone receptor-negative and human epidermal growth factor receptor 2 (HER2)-negative.
Ultrasound (sonogram): A diagnostic test that creates images of tissues and organs. A breast ultrasound is typically used after an abnormal screening mammogram, clinical breast exam or breast MRI result.
White flight: The departure of white people from places (such as neighborhoods or schools) increasingly or predominantly populated by people of color. (Merriam-Webster).

LANDSCAPE ANALYSIS
LOS ANGELES | PAGE 73
Appendix C. Focus Group Guides
African-American Health Equity Initiative: From Education to Impact Landscape Analysis Provider Interview Tool
Step 1: Introduction of project and confidentiality Thank you for speaking with us today. Before we start, I am going to explain the purpose of the interview and then I can answer any questions you may have and we can start the discussion. I am____________ and joining me is my colleague____________. We are from JSI, a mission-driven public health research and consulting organization dedicated to advancing the health of individuals and communities in the United States and globally. JSI is working with Susan G. Komen®, a leading breast cancer foundation, to understand the reasons behind the differences in breast cancer [late-stage] diagnosis and mortality among African-American women across 11 US metropolitan areas. Research has found that African-American women are less likely to be diagnosed early, when breast cancer is more treatable, as compared to white women and other races. African-American women are also less likely than other women with breast cancer to survive the disease. This is true across the country, and the gap is highest in these 11 major metropolitan areas. [insert name of metro] is among them. Komen wants to work to bridge this gap in access and use of high-quality breast health care for African-American women. They have launched this program to better understand why differences exist and sees this as an opportunity to take action to change these conditions, and to do so they need to learn from you. Komen has asked JSI to help gather this information from community members and providers to better understand how understand how to reduce late-stage breast cancer diagnosis and mortality in the African-American community. These discussions allow us to gather information from different groups to better understand what steps can be taken to improve conditions in communities so that African-American women have the same ability to get the care and support they need if they do get breast cancer. Today we hope to learn from you about your knowledge and experiences with breast cancer screening, diagnosis and treatment. We are also interested in learning what you know about the practices of providers in the metropolitan area. How data will be used, privacy and confidentiality Your participation in this interview/ focus group is completely voluntary and all information you share will be kept confidential and will not be associated to you by name. At no time should you feel you have to answer a question. We will be taking notes and, with your permission, we will be recording this interview so we can engage in a conversation with you and not miss any of the details. These notes and

LANDSCAPE ANALYSIS
LOS ANGELES | PAGE 74
the recording will be kept in a secure location in our offices and only the project team will have access to these materials. The information will be aggregated, analyzed, and reported to Susan G. Komen. Is it okay to record the interview/focus group? Any questions or concerns for us before we begin? Provider Background
1. Please tell me about your practice? How long have you been in practice? Tell me about the populations you serve (race/ethnicity, age etc.)? What are your specialty areas, if any?
Health Equity Data Review
2. What do you think is driving the disproportionately high rates of late stage cancer diagnosis among African-American women in [insert name of metro]? Does this information surprise you?
PROBES TO USE AS NECESSARY:
a. Explore the influence of:
1. Ethnicity and nationality 2. Socio-economic status 3. Social determinants of Health 4. Comorbidities such as obesity, hypertension, and diabetes 5. Faith practices 6. Family dynamics (getting at spousal and familial support) 7. Trust/mistrust of the medical system 8. Historical, institutional racism 9. Access to care, including specialists 10. Financial cost and time of follow-up testing and diagnosis 11. Financial cost of treatment and time for treatment 12. Quality of screening and diagnosis for African-American women 13. Racism, bias, segregation and the inability to get the care they need
3. What do you think is driving higher rates of breast cancer deaths among African-American women in [insert name of metro]? Does this information surprise you?
PROBES TO USE AS NECESSARY:
a. Explore the influence of: 1. Factors other than late stage diagnosis 2. Access to care including specialists 3. Ethnicity and nationality 4. Socio-economic status 5. Social determinants of Health 6. Comorbidities such as obesity, hypertension, and diabetes 7. Faith practices 8. Family dynamics (getting at spousal and familial support) 9. Trust/mistrust of the medical system

LANDSCAPE ANALYSIS
LOS ANGELES | PAGE 75
10. Historical, institutional racism 11. Access to care, including specialists 12. Financial cost and time of follow-up testing and diagnosis 13. Financial cost of treatment and time for treatment 14. Quality of screening and diagnosis for African-American women 15. Racism, bias, segregation and the inability to get the care they need
Screening & Diagnosis
4. Which screening guidelines do you use with your patients?
PROBES TO USE AS NECESSARY:
a. What screening recommendations do you give to your African-American patients? How often do you share screening guidelines?
b. How does it differ, if at all, from other types of patients?
c. Do you routinely have conversations with your patients about risk factors for breast cancer? With younger, African-American patients? If so, does this information influence your recommendations for screening?
5. What factors promote (or encourage) regular screening among African-American women?
PROBES TO USE AS NECESSARY:
a. Explore the influence of: 1. Providers, staff: temperament, cultural competency, kind, respectful 2. Special programs and services that are culturally competent 3. Services meeting women where they are/mobile services 4. Process and systems: forms, wait time, referrals, timely, follow-up 5. Overall environment: location, privacy, welcoming, feels safe 6. Accessibility: easy to reach, timely 7. Other factors in the community
6. What are the barriers or factors that may prevent African-American women from getting screened regularly?
PROBES TO USE AS NECESSARY:
a. Explore the influence of 1. Provider and staff: temperament, cultural competency, kind, respectful 2. Process and systems: forms, wait time, referrals, timely, follow-up 3. Overall environment: location, privacy, welcoming, feels safe 4. Accessibility: easy to reach, timely 5. Comprehensives: are they receiving the basics + cutting edge 6. Competing priorities 7. Social determinants of health

LANDSCAPE ANALYSIS
LOS ANGELES | PAGE 76
8. Racism, bias, segregation i.Can you tell me a little more about the relationship between the African-
American community and your hospital/practice? ii.We have looked at the secondary publicly available data and we see
disparities in [insert key findings for metro]. Can you help us explain these data?
Treatment
7. Please describe your process and strategies for getting African-American women who have been diagnosed with breast cancer linked to and retained in treatment?
PROBES TO USE AS NECESSARY:
a. Do you refer to a specialist? How do you support second opinions? ASK ONLY IF PCP b. How do you engage the patient in the decision-making process?
c. How do they handle/address questions from the patient and/or family about treatment options?
d. Do you consider the cost of various treatment options in your decision? If yes, does that include a conversation with the patient/family about the options and costs?
e. How do you approach the topic of clinical trials?
8. What are the factors that make it easier for African-American patients to be connected to and retained in treatment?
PROBES TO USE AS NECESSARY:
a. Explore the influence of 1. Providers, staff: temperament, cultural competency, kind, respectful, bias, discrimination 2. Process and systems: forms, wait time, referrals, timely, scheduling, follow-up 3. Overall environment: location, privacy, welcoming, feels safe 4. Accessibility: easy to reach, timely 5. Comprehensives: are they receiving the basics + cutting edge 6. Social Determinants of Health 7. Faith practices 8. Family dynamics (getting at spousal and familial support) 9. Trust/mistrust of the medical system 10. Access to care, including specialists 11. Financial Cost of Treatment and Time for Treatment
LANDSCAPE ANALYSIS
LOS ANGELES | PAGE 77
9. What are the barriers that hinder African-American women from being connected to and retained in treatment?
PROBES TO USE AS NECESSARY:
a. Explore the influence of 1. Providers, staff: temperament, cultural competency, kind, respectful, bias, discrimination 2. Process and systems: forms, wait time, referrals, timely, scheduling, follow-up 3. Overall environment: location, privacy, welcoming, feels safe 4. Accessibility: easy to reach, timely 5. Comprehensives: are they receiving the basics + cutting edge 6. Social Determinants of Health 7. Faith practices 8. Family dynamics (getting at spousal and familial support) 9. Trust/mistrust of the medical system 10. Access to care, including specialists 11. Financial Cost of Treatment and Time for Treatment
10. What may make African-American women choose not to seek treatment even if they have health insurance and available providers?
PROBES TO USE AS NECESSARY:
a. Explore the influence of 1. Providers, staff: temperament, cultural competency, kind, respectful, bias, discrimination 2. Process and systems: forms, wait time, referrals, timely, follow-up, scheduling, 3. Overall environment: location, privacy, welcoming, feels safe 4. Accessibility: easy to reach, timely 5. Comprehensives: are they receiving the basics + cutting edge 6. Social Determinants of Health 7. Faith practices 8. Family dynamics (getting at spousal and familial support) 9. Trust/mistrust of the medical system
10. Fear of pain, losing hair, etc. 11. Access to care, including specialists 12. Financial Cost of Treatment and Time for Treatment
Survivorship
11. What types of support services, if any, are African-American women breast cancer survivors directly referred to?
PROBES TO USE AS NECESSARY:
a. How adequate are the levels of support and services?

LANDSCAPE ANALYSIS
LOS ANGELES | PAGE 78
b. What about access to a full complement of integrative approaches to cancer treatment and survivorship including Acupuncture, Reiki, nutrition support, mindfulness-based stress reduction, meditation, therapist etc.?
Komen Strategies
12. What are the existing resources in place to leverage and reduce breast cancer disparities among African-American women in [insert name of metro]?
13. Anything else you would like to share with us?

LANDSCAPE ANALYSIS
LOS ANGELES | PAGE 79
African-American Health Equity Initiative: From Education to Impact Landscape Analysis
Breast Cancer Survivor Focus Group Guide Step 1: Introduction of project and confidentiality Thank you for joining us today. Before we start, we want to point out a few things: Snacks, restrooms, and other guidelines. [Discuss guidelines for participating and point out room exit, bathroom, and snacks.] My name is____________ and this is my colleague____________. We are from JSI, a mission-driven public health research and consulting organization dedicated to advancing the health of individuals and communities in the United States and globally. Before we begin, I am going to explain the purpose of the group discussion. I will then answer any questions you have, and then we will start the discussion. Does that sound ok? JSI is working with Susan G. Komen, a leading breast cancer foundation, to understand the reasons behind the differences in breast cancer [late-stage] diagnosis and mortality among African-American women across 11 US metropolitan areas. Research has found that African-American women are less likely to be diagnosed early, when breast cancer is more treatable, as compared to white women and other races. African-American women may also be less likely than other women with breast cancer to survive the disease. This is true across the country, and the gap is highest in these 11 major metropolitan areas -- [insert name of metro] is among them. Komen wants to work to bridge this gap in access and use of high-quality breast health care for African-American women. They have launched this program to understand better why differences exist. They want to hear from you about your experiences and stories from your community. Komen has asked JSI to help gather this information from community members to help them plan and support the programming needed to change these conditions. This project involves talking with residents and community leaders from [insert name of metro] to understand better how to reduce late-stage breast cancer diagnosis and mortality in the African-American community. These discussions allow us to gather information from different groups to better understand what steps can be taken so that African-American women have the same ability to get the care and support they need if they do get breast cancer. Today we hope to learn from you about your knowledge and experiences with breast cancer. We recognize that this is a very personal and sensitive topic and that some questions may trigger past experiences that may or may not be pleasant. We will share local support resource and the Komen helpline after the session. We intend to make you feel as comfortable as possible discussing these topics. However, if you decide you no longer want to participate at any point, you may leave at any time. We will begin with some general questions about your life experience and cancer journey with treatment including from treatment to follow-up care, your experience at your medical facility, the resources that were/are available to you, and any challenges or barriers you may have faced in accessing these resources/services.

LANDSCAPE ANALYSIS
LOS ANGELES | PAGE 80
How data will be used, privacy and confidentiality Your participation in this focus group is completely voluntary, and all information you share will be kept confidential. At no time should you feel you have to answer a question. We will begin with some general questions about your general knowledge of breast cancer. Then we will move to more specific questions. This discussion should last no longer than 90 minutes, about an hour and a half. We encourage you to share your thoughts and opinions openly and freely. But, please also be respectful of other participants’ opinions. There are many women in the room, and we will all have different opinions. We don’t all have to agree, but we do want to hear everyone’s opinions. We will do our best to make sure everyone gets a turn to voice their opinion. We will not write down or record names. Nothing you say will be associated with you by name. Your identity will be kept confidential at all times, and your responses will be anonymous. We will be taking notes, and, with your permission, we will be recording this interview so we can engage in a conversation with you and not miss any of the details. These notes and the recording will be kept in a secure location in our offices, and only the project team will have access to these materials. We also request that you do not disclose another participant’s comments and/or identity outside of the focus group. We want to respect each other’s privacy and confidentiality. After the focus groups are complete, we will write up a report summarizing the main ideas and some quotes and share with Komen to support their effort to improve breast cancer prevention and treatment. Our original notes and this recording will then be deleted. No one directly involved in your care (providers, service providers, etc.) will have access to the data. Does anyone object to being recorded? At the end of the session, we will provide you with $30 gift cards in appreciation of the time you have taken out of your busy day to be part of this discussion. Are there any questions about what I’ve just said, why we’re here, or what we are going to do today? Step 3: Answer Questions from Participants Step 4: Confirm Consent to Participate Based on what we just shared, we want to confirm that each of you consents or agrees to participate in today’s conversation. Please read and sign the consent form that is being distributed to say “YES” if you understand and wish to participate or “No” if you do not wish to participate, and you are free to leave before we begin. Are there any other questions? Step 5: Answer Questions (if needed) Step 6: Turn on the Recorder Step 7: Begin Discussion with Questions Below
1. Let us go around the room. How long have you lived in [insert name of metro], what is one favorite thing about this area? Racial Discrimination

LANDSCAPE ANALYSIS
LOS ANGELES | PAGE 81
As we mentioned earlier, Komen wants to understand the reasons behind the differences in breast cancer diagnosis and mortality among African-American women. An important aspect for us to discuss is your experiences with racism in your community and workplace and how racial discrimination affects the health of African-American women. 2. Please tell me about a time you have been discriminated against because of your race? Think about where you live, work, socialize, and your experiences in seeking health care?
PROBES TO USE AS NECESSARY:
a. Where have you faced discrimination because of your race?
1. Healthcare system 2. Transportation 3. Work 4. Housing 5. Education/School 6. General profiling (e.g., grocery store, mall, police, etc.)
b. Have you ever been prevented from moving into a neighborhood because the landlord/realtor refused to sell or rent you a house or apartment? If yes, please tell me more.
c. Have you ever moved into a neighborhood where neighbors made life difficult for you or your family? If yes, please tell me more.
d. Have you ever been fired from a job because of your race? If yes, please tell me more.
e. Have you ever been denied a promotion because of your race? If yes, please tell me more.
f. Have you ever not been hired for a job because of your race?
g. While seeing a doctor, has there been a time you felt that assumptions were made about you? Tell me more. What made you feel this was happening?
h. Is there anything that happens in the doctor office’s that makes you feel different- the doctor or staff’s behavior, things they say or do, or how they look at you?
3. How has discrimination or racism affected your health?
PROBES TO USE AS NECESSARY:
a. Prevented you from getting healthcare or treatment?
b. Affected the quality of care you received?
c. Has discrimination affected the timeliness of the care you received?

LANDSCAPE ANALYSIS
LOS ANGELES | PAGE 82
Screening Thank you for sharing these experiences. Now we will move to the section of the discussion that focuses on breast cancer.
4. Before being diagnosed with breast cancer, had you received clinical breast exams? Screening mammography? If yes, what motivated you to get screened?
PROBES TO USE AS NECESSARY
a. Explore factors behind screening (family history, following guidelines, provider’s advice, community outreach programs, the experience of other women in their social network) and awareness that early screening can catch breast cancer when it might be easier to treat.
b. Do you feel you were aware of the signs and symptoms that one might have breast cancer? Why or why not? What factors led to this awareness? [Note: there often aren’t signs as well as the common signs of unusual discharge or a lump]
5. How was the experience of being screened for breast cancer?
PROBES TO USE AS NECESSARY
a. What options were offered to you?
b. How did you feel throughout the process? 1. Were there times you felt uncomfortable or unable to access screening? 2. Did you feel you had enough time to ask questions and/or absorb
information? 3. Did you feel you were treated with less courtesy or respect than other
people? 4. Did you feel you received poorer service than other patients? 5. Did you feel the provider or the staff acted as if they think you are not
smart? 6. Did you feel the provider or staff acted as if they are afraid of you? 7. Did you feel threatened or harassed?
c. How old were you the first time you were screened? How often did you go after
your first time?
d. Explore the influence of 1. Providers, staff: temperament, cultural competency, kind, respectful 2. Process and systems: forms, wait time, referrals, timely, follow-up 3. Overall environment: location, privacy, welcoming, feels safe 4. Accessibility: easy to reach, timely
e. Assess comprehensives and quality of care.

LANDSCAPE ANALYSIS
LOS ANGELES | PAGE 83
Diagnosis and Treatment
6. What was the process of being diagnosed with cancer like? We would like 1 or 2 volunteers to tell us about their experience of being diagnosed, and then we will have a chance to discuss together.
PROBES TO USE AS NECESSARY
a. How was your breast cancer found?
b. What diagnostic procedures did you have/were you offered?
c. As best you can remember, how long did it take to get a diagnosis? What were the challenges?
d. How did you select a provider/care team?
e. Were you referred to a breast oncologist? Breast surgeon? Who provided your
treatment?
f. For those who wanted a second opinion, what was that experience like?
g. Tell us about how a care and treatment plan was developed? 1. To what extent were you offered choices and provided opportunities to discuss these options with your providers?
2. Did you feel comfortable to ask questions?
h. What type of counseling and support was offered? [Include navigation to treatment services]
1. Were the associated costs, insurance coverage, co-pays, etc. discussed with you? Were you offered or referred to a financial assistant? If so, when (at what stage of the process)?
i. How did you feel throughout the process?
1. Did you feel you had enough time to ask questions and/or absorb information? 2. Did you feel you were treated with less courtesy or respect than other people? 3. Did you feel you received poorer service than other patients? 4. Did you feel the provider or the staff acted as if they think you are not smart? 5. Did you feel the provider or staff acted as if they are afraid of you? 6. Did you feel threatened or harassed?
7. Was hormonal therapy (e.g. Tamoxifen, Arimidex, Femara, Aromasin) part of your treatment?
If so, was five years or ten years prescribed?

LANDSCAPE ANALYSIS
LOS ANGELES | PAGE 84
a. PROBE: Were you able to stay on hormonal therapy for the recommended length of time? Why or why not? (they may still be on it)
b. PROBE: Did you ever skip a dose or cut the pills in half? If so, why or why not?
c. PROBE: What were the challenges?
8. Please share some of the factors in the decision to start treatment based on your personal experience or the experience of other African-American women, you know.
Facilitator Note: Collect information on the understanding of the different types of breast cancers, and that treatment may be different for each type.
PROBES TO USE AS NECESSARY
a. Who was involved in the decision to start treatment?
1. Partner 2. Family 3. Friends 4. Pastor /Clergy
b. Was the decision-making process different for different types of treatment (chemotherapy, surgery, radiation)?
c. What may make it difficult for an African-American woman in your area to start and continue the full course of breast cancer treatment if they need it?
d. What would facilitate the completion of the full course of treatment (for
example, a full course of chemotherapy)?
1. Family considerations: Caretaking responsibilities, spousal support 2. Personal/life: Scheduling, time off from work, meeting family responsibilities 3. Fears: Concerns about the procedure, concerns about side effects of treatment 4. Faith Practices: Spiritual/religious beliefs 5. Accessibility: Insurance, easy to reach, distance, affordable costs/co-pays, time off from work 6. Process and systems: Forms, wait time, referrals, timely, follow-up 7. Providers and staff: Temperament, cultural competency, kind, respectful, perceived racism, perceived trust and respect, bias, provider hostility, mistrust about the health system, no relationships with providers 8. Overall environment: Location, privacy, welcoming, feels safe
9. What factors may lead to delays in starting treatment or not completing treatment even if someone has access?
PROBES TO USE AS NECESSARY

LANDSCAPE ANALYSIS
LOS ANGELES | PAGE 85
a. What factors may contribute to a delay in starting treatment? Ending treatment early/discontinuing treatment?
1. Family considerations: Caretaking responsibilities, spousal support 2. Personal/life: Scheduling, time off from work, meeting family responsibilities 3. Fears: Concerns about the procedure, concerns about side effects of treatment 4. Faith Practices: Spiritual/religious beliefs 5. Accessibility: Insurance, easy to reach, distance, affordable costs/co-pays, time off from work 6. Process and systems: Forms, wait time, referrals, timely, follow-up 7. Providers and staff: Temperament, cultural competency, kind, respectful, perceived racism, perceived trust and respect, bias, provider hostility, mistrust about the health system, no relationships with providers 8. Overall environment: Location, privacy, welcoming, feels safe
10. Were you offered complementary or integrative medicine options to help with treatment, such as acupuncture, Reiki, nutritional support, etc.?
PROBES TO USE AS NECESSARY
a. If used, were these options used to complement traditional cancer treatment, or instead of?
b. If used, were these options recommended? If so, by whom?
c. If used, how were the services beneficial?
d. If they were not beneficial, why not?
11. How would you rate the quality of your breast cancer treatment from one to five, one being the lowest and five the highest quality? What does five look like?
PROBES TO USE AS NECESSARY
a. How did you decide where to seek treatment? What were your options?
b. Did your provider/care team specialize in breast cancer, or did they treat all kinds of cancers?
c. What have you heard or yourself experienced about African-American patients’ experiences within the healthcare system?
d. Have you received access to a full team of providers (i.e. including a PCP, radiation oncologist, medical oncologist, surgeon/surgical oncologist, plastic surgeon (reconstruction), dietitian, social worker, receptionist/scheduler/front desk staff, chaplain/other religious contact, new patient coordinator, Program RN, patient navigator)?
1. Which members of your cancer team did you feel most comfortable seeing?
2. What is it about that provider that makes you feel comfortable?
LANDSCAPE ANALYSIS
LOS ANGELES | PAGE 86
3. Did you have any uncomfortable experiences? What made you uncomfortable?
4. Which members do you wish you could have had greater interaction with and why?
5. Did you feel you had enough time to ask questions and/or absorb information?
e. Were there times when you felt challenged or unable to access the medical care
you felt you needed? Why? Survivorship Facilitator Note: Please be sensitive to anyone in the room who may be living with metastatic breast cancer.
12. How would you describe your experience(s) with care for those of you who have transitioned from being a patient in treatment to post-treatment?
PROBES TO USE AS NECESSARY
a. How has your care been coordinated between your oncology team and your primary care provider? Did you receive a survivorship care plan? Was this helpful? b. Have you had adequate support to address your emotional/social, health, and economic needs as a cancer survivor?
c. What support has your family needed? When? At diagnosis? After treatment?
d. Have you made any lifestyle changes as a result of your experience as a cancer
survivor?
e. Have you sought additional support from fellow survivors (i.e., support groups)?
13. What resources were available to you and your family from your cancer treatment medical facility, another healthcare organization, or any other community organization following your treatment?
PROBES TO USE AS NECESSARY
a. What type of resources were available to you (e.g., financial, stress management/healthy living, emotional, spiritual resources)?
1. How did you come to know about these? Did you have to ask? 2. Did you access these resources or have adequate support for doing so?
b. Do women have access to a full complement of holistic approaches to cancer treatment and survivorship such as acupuncture, reiki, nutrition support, mindfulness-based stress reduction, meditation, therapist, etc.?
1. If used, how were the services beneficial?

LANDSCAPE ANALYSIS
LOS ANGELES | PAGE 87
2. If they were not beneficial, why not?
c. Were there times when you felt challenged or unable to access the support, information, or resources you felt you needed? Why?
1. Would it be useful to have learned about these resources sooner than you did?
2. At what point would the services have been more useful? 3. Was there a cost/fee to access any of the resources/information?
14. What else might be helpful to you or other African-American women cancer survivors and their families?
Step 8: Thank you for your participation.

LANDSCAPE ANALYSIS
LOS ANGELES | PAGE 88
African-American Health Equity Initiative: From Education to Impact Landscape Analysis
Breast Cancer Survivor Focus Group Guide Step 1: Introduction of project and confidentiality Thank you for joining us today. Before we start, we want to point out a few things: Snacks, restrooms, and other guidelines. [Discuss guidelines for participating and point out room exit, bathroom, and snacks.] My name is____________ and this is my colleague____________. We are from JSI, a mission-driven public health research and consulting organization dedicated to advancing the health of individuals and communities in the United States and globally. Before we begin, I am going to explain the purpose of the group discussion. I will then answer any questions you have, and then we will start the discussion. Does that sound ok? JSI is working with Susan G. Komen, a leading breast cancer foundation, to understand the reasons behind the differences in breast cancer [late-stage] diagnosis and mortality among African-American women across 11 US metropolitan areas. Research has found that African-American women are less likely to be diagnosed early, when breast cancer is more treatable, as compared to white women and other races. African-American women may also be less likely than other women with breast cancer to survive the disease. This is true across the country, and the gap is highest in these 11 major metropolitan areas -- [insert name of metro] is among them. Komen wants to work to bridge this gap in access and use of high-quality breast health care for African-American women. They have launched this program to understand better why differences exist. They want to hear from you about your experiences and stories from your community. Komen has asked JSI to help gather this information from community members to help them plan and support the programming needed to change these conditions. This project involves talking with residents and community leaders from [insert name of metro] to understand better how to reduce late-stage breast cancer diagnosis and mortality in the African-American community. These discussions allow us to gather information from different groups to better understand what steps can be taken so that African-American women have the same ability to get the care and support they need if they do get breast cancer. Today we hope to learn from you about your knowledge and experiences with breast cancer. We recognize that this is a very personal and sensitive topic and that some questions may trigger past experiences that may or may not be pleasant. We will share local support resource and the Komen helpline after the session. We intend to make you feel as comfortable as possible discussing these topics. However, if you decide you no longer want to participate at any point, you may leave at any time. We will begin with some general questions about your life experience and cancer journey with treatment including from treatment to follow-up care, your experience at your medical facility, the resources that were/are available to you, and any challenges or barriers you may have faced in accessing these resources/services.
How data will be used, privacy and confidentiality Your participation in this focus group is completely voluntary, and all information you share will be kept confidential. At no time should you feel you have to answer a question. We will begin with some general questions about your general knowledge of breast cancer. Then we will move to more specific questions. This discussion should last no longer than 90 minutes, about an hour and a half.

LANDSCAPE ANALYSIS
LOS ANGELES | PAGE 89
We encourage you to share your thoughts and opinions openly and freely. But, please also be respectful of other participants’ opinions. There are many women in the room, and we will all have different opinions. We don’t all have to agree, but we do want to hear everyone’s opinions. We will do our best to make sure everyone gets a turn to voice their opinion. We will not write down or record names. Nothing you say will be associated with you by name. Your identity will be kept confidential at all times, and your responses will be anonymous. We will be taking notes, and, with your permission, we will be recording this interview so we can engage in a conversation with you and not miss any of the details. These notes and the recording will be kept in a secure location in our offices, and only the project team will have access to these materials. We also request that you do not disclose another participant’s comments and/or identity outside of the focus group. We want to respect each other’s privacy and confidentiality. After the focus groups are complete, we will write up a report summarizing the main ideas and some quotes and share with Komen to support their effort to improve breast cancer prevention and treatment. Our original notes and this recording will then be deleted. No one directly involved in your care (providers, service providers, etc.) will have access to the data. Does anyone object to being recorded? At the end of the session, we will provide you with $30 gift cards in appreciation of the time you have taken out of your busy day to be part of this discussion. Are there any questions about what I’ve just said, why we’re here, or what we are going to do today? Step 3: Answer Questions from Participants Step 4: Confirm Consent to Participate Based on what we just shared, we want to confirm that each of you consents or agrees to participate in today’s conversation. Please read and sign the consent form that is being distributed to say “YES” if you understand and wish to participate or “No” if you do not wish to participate, and you are free to leave before we begin. Are there any other questions? Step 5: Answer Questions (if needed) Step 6: Turn on the Recorder Step 7: Begin Discussion with Questions Below
1. Let us go around the room. How long have you lived in [insert name of metro], what is one favorite thing about this area?[Text Wrapping Break] on
As we mentioned earlier, Komen wants to understand the reasons behind the differences in breast cancer diagnosis and mortality among African-American women. An important aspect for us to discuss is your experiences with racism in your community and workplace and how racial discrimination affects the health of African-American women.

LANDSCAPE ANALYSIS
LOS ANGELES | PAGE 90
2. Please tell me about a time you have been discriminated against because of your race? Think about where you live, work, socialize, and your experiences in seeking health care?
PROBES TO USE AS NECESSARY:
a. Where have you faced discrimination because of your race?
1. Healthcare system 2. Transportation 3. Work 4. Housing 5. Education/School 6. General profiling (e.g., grocery store, mall, police, etc.)
b. Have you ever been prevented from moving into a neighborhood because the landlord/realtor refused to sell or rent you a house or apartment? If yes, please tell me more.
c. Have you ever moved into a neighborhood where neighbors made life difficult for you or your family? If yes, please tell me more.
d. Have you ever been fired from a job because of your race? If yes, please tell me more.
e. Have you ever been denied a promotion because of your race? If yes, please tell me more.
f. Have you ever not been hired for a job because of your race?
g. While seeing a doctor, has there been a time you felt that assumptions were made about you? Tell me more. What made you feel this was happening?
h. Is there anything that happens in the doctor office’s that makes you feel different- the doctor or staff’s behavior, things they say or do, or how they look at you?
3. How has discrimination or racism affected your health?
PROBES TO USE AS NECESSARY:
a. Prevented you from getting healthcare or treatment?
b. Affected the quality of care you received?
c. Has discrimination affected the timeliness of the care you received? Thank you for sharing these experiences. Now we will move to the section of the discussion that focuses on breast cancer.

LANDSCAPE ANALYSIS
LOS ANGELES | PAGE 91
4. Before being diagnosed with breast cancer, had you received clinical breast exams? Screening mammography? If yes, what motivated you to get screened?
PROBES TO USE AS NECESSARY
a. Explore factors behind screening (family history, following guidelines, provider’s advice, community outreach programs, the experience of other women in their social network) and awareness that early screening can catch breast cancer when it might be easier to treat.
b. Do you feel you were aware of the signs and symptoms that one might have breast cancer? Why or why not? What factors led to this awareness? [Note: there often aren’t signs as well as the common signs of unusual discharge or a lump]
5. How was the experience of being screened for breast cancer?
PROBES TO USE AS NECESSARY
a. What options were offered to you?
b. How did you feel throughout the process? 1. Were there times you felt uncomfortable or unable to access screening? 2. Did you feel you had enough time to ask questions and/or absorb
information? 3. Did you feel you were treated with less courtesy or respect than other
people? 4. Did you feel you received poorer service than other patients? 5. Did you feel the provider or the staff acted as if they think you are not
smart? 6. Did you feel the provider or staff acted as if they are afraid of you? 7. Did you feel threatened or harassed?
c. How old were you the first time you were screened? How often did you go after
your first time?
d. Explore the influence of 1. Providers, staff: temperament, cultural competency, kind, respectful 2. Process and systems: forms, wait time, referrals, timely, follow-up 3. Overall environment: location, privacy, welcoming, feels safe 4. Accessibility: easy to reach, timely
e. Assess comprehensives and quality of care.
Diagnosis and Treatment
6. What was the process of being diagnosed with cancer like? We would like 1 or 2 volunteers to tell us about their experience of being diagnosed, and then we will have a chance to discuss together.
PROBES TO USE AS NECESSARY

LANDSCAPE ANALYSIS
LOS ANGELES | PAGE 92
a. How was your breast cancer found?
b. What diagnostic procedures did you have/were you offered?
c. As best you can remember, how long did it take to get a diagnosis? What were
the challenges?
d. How did you select a provider/care team?
e. Were you referred to a breast oncologist? Breast surgeon? Who provided your treatment?
f. For those who wanted a second opinion, what was that experience like?
g. Tell us about how a care and treatment plan was developed?
1. To what extent were you offered choices and provided opportunities to discuss these options with your providers?
2. Did you feel comfortable to ask questions?
h. What type of counseling and support was offered? [Include navigation to treatment services]
1. Were the associated costs, insurance coverage, co-pays, etc. discussed with you? Were you offered or referred to a financial assistant? If so, when (at what stage of the process)?
i. How did you feel throughout the process?
1. Did you feel you had enough time to ask questions and/or absorb information? 2. Did you feel you were treated with less courtesy or respect than other people? 3. Did you feel you received poorer service than other patients? 4. Did you feel the provider or the staff acted as if they think you are not smart? 5. Did you feel the provider or staff acted as if they are afraid of you? 6. Did you feel threatened or harassed?
7. Was hormonal therapy (e.g. Tamoxifen, Arimidex, Femara, Aromasin) part of your treatment?
If so, was five years or ten years prescribed?
a. PROBE: Were you able to stay on hormonal therapy for the recommended length of time? Why or why not? (they may still be on it)
b. PROBE: Did you ever skip a dose or cut the pills in half? If so, why or why not?
c. PROBE: What were the challenges?
8. Please share some of the factors in the decision to start treatment based on your personal experience or the experience of other African-American women, you know.

LANDSCAPE ANALYSIS
LOS ANGELES | PAGE 93
Facilitator Note: Collect information on the understanding of the different types of breast cancers, and that treatment may be different for each type.
PROBES TO USE AS NECESSARY
a. Who was involved in the decision to start treatment?
1. Partner 2. Family 3. Friends 4. Pastor /Clergy
b. Was the decision-making process different for different types of treatment (chemotherapy, surgery, radiation)?
c. What may make it difficult for an African-American woman in your area to start and continue the full course of breast cancer treatment if they need it?
d. What would facilitate the completion of the full course of treatment (for
example, a full course of chemotherapy)?
1. Family considerations: Caretaking responsibilities, spousal support 2. Personal/life: Scheduling, time off from work, meeting family responsibilities 3. Fears: Concerns about the procedure, concerns about side effects of treatment 4. Faith Practices: Spiritual/religious beliefs 5. Accessibility: Insurance, easy to reach, distance, affordable costs/co-pays, time off from work 6. Process and systems: Forms, wait time, referrals, timely, follow-up 7. Providers and staff: Temperament, cultural competency, kind, respectful, perceived racism, perceived trust and respect, bias, provider hostility, mistrust about the health system, no relationships with providers 8. Overall environment: Location, privacy, welcoming, feels safe
9. What factors may lead to delays in starting treatment or not completing treatment even if someone has access?
PROBES TO USE AS NECESSARY
a. What factors may contribute to a delay in starting treatment? Ending treatment early/discontinuing treatment?
1. Family considerations: Caretaking responsibilities, spousal support 2. Personal/life: Scheduling, time off from work, meeting family responsibilities 3. Fears: Concerns about the procedure, concerns about side effects of treatment 4. Faith Practices: Spiritual/religious beliefs 5. Accessibility: Insurance, easy to reach, distance, affordable costs/co-pays, time off from work 6. Process and systems: Forms, wait time, referrals, timely, follow-up

LANDSCAPE ANALYSIS
LOS ANGELES | PAGE 94
7. Providers and staff: Temperament, cultural competency, kind, respectful, perceived racism, perceived trust and respect, bias, provider hostility, mistrust about the health system, no relationships with providers 8. Overall environment: Location, privacy, welcoming, feels safe
10. Were you offered complementary or integrative medicine options to help with treatment, such as acupuncture, Reiki, nutritional support, etc.?
PROBES TO USE AS NECESSARY
a. If used, were these options used to complement traditional cancer treatment, or instead of?
b. If used, were these options recommended? If so, by whom?
c. If used, how were the services beneficial?
d. If they were not beneficial, why not?
11. How would you rate the quality of your breast cancer treatment from one to five, one being the lowest and five the highest quality? What does five look like?
PROBES TO USE AS NECESSARY
a. How did you decide where to seek treatment? What were your options?
b. Did your provider/care team specialize in breast cancer, or did they treat all kinds of cancers?
c. What have you heard or yourself experienced about African-American patients’ experiences within the healthcare system?
d. Have you received access to a full team of providers (i.e. including a PCP, radiation oncologist, medical oncologist, surgeon/surgical oncologist, plastic surgeon (reconstruction), dietitian, social worker, receptionist/scheduler/front desk staff, chaplain/other religious contact, new patient coordinator, Program RN, patient navigator)?
1. Which members of your cancer team did you feel most comfortable seeing?
2. What is it about that provider that makes you feel comfortable? 3. Did you have any uncomfortable experiences? What made you
uncomfortable? 4. Which members do you wish you could have had greater interaction
with and why? 5. Did you feel you had enough time to ask questions and/or absorb
information?
e. Were there times when you felt challenged or unable to access the medical care you felt you needed? Why?

LANDSCAPE ANALYSIS
LOS ANGELES | PAGE 95
Survivorship Facilitator Note: Please be sensitive to anyone in the room who may be living with metastatic breast cancer.
12. How would you describe your experience(s) with care for those of you who have transitioned from being a patient in treatment to post-treatment?
PROBES TO USE AS NECESSARY
a. How has your care been coordinated between your oncology team and your primary care provider? Did you receive a survivorship care plan? Was this helpful? b. Have you had adequate support to address your emotional/social, health, and economic needs as a cancer survivor?
c. What support has your family needed? When? At diagnosis? After treatment?
d. Have you made any lifestyle changes as a result of your experience as a cancer
survivor?
e. Have you sought additional support from fellow survivors (i.e., support groups)?
13. What resources were available to you and your family from your cancer treatment medical facility, another healthcare organization, or any other community organization following your treatment?
PROBES TO USE AS NECESSARY
a. What type of resources were available to you (e.g., financial, stress management/healthy living, emotional, spiritual resources)?
1. How did you come to know about these? Did you have to ask? 2. Did you access these resources or have adequate support for doing so?
b. Do women have access to a full complement of holistic approaches to cancer treatment and survivorship such as acupuncture, reiki, nutrition support, mindfulness-based stress reduction, meditation, therapist, etc.?
1. If used, how were the services beneficial? 2. If they were not beneficial, why not?
c. Were there times when you felt challenged or unable to access the support, information, or resources you felt you needed? Why?
1. Would it be useful to have learned about these resources sooner than you did?
2. At what point would the services have been more useful? 3. Was there a cost/fee to access any of the resources/information?

LANDSCAPE ANALYSIS
LOS ANGELES | PAGE 96
14. What else might be helpful to you or other African-American women cancer survivors and their families?
Step 8: Thank you for your participation.

LANDSCAPE ANALYSIS
LOS ANGELES | PAGE 97
References Acevedo-Garcia, D., Lochner, K. A., Osypuk, T. L., & Subramanian, S. V. (2003). Future directions in
residential segregation and health research: a multilevel approach. Am J Public Health, 93(2), 215-221. doi:10.2105/ajph.93.2.215
Agency for Toxic Substances and Disease Registry. (2018). CDC's Social Vulnerability Index: What is the SVI? Retrieved from https://svi.cdc.gov/
American Cancer Society. Breast Cancer. Retrieved from https://www.cancer.org/cancer/breast-cancer.html
American Cancer Society. (2019a). Breast Cancer Facts & Figures 2019-2020. Retrieved from https://www.cancer.org/content/dam/cancer-org/research/cancer-facts-and-statistics/breast-cancer-facts-and-figures/breast-cancer-facts-and-figures-2019-2020.pdf
American Cancer Society. (2019b). Cancer Facts & Figures for African Americans, 2019-2020. Retrieved from https://www.cancer.org/content/dam/cancer-org/research/cancer-facts-and-statistics/cancer-facts-and-figures-for-african-americans/cancer-facts-and-figures-for-african-americans-2019-2021.pdf
American Cancer Society. (2020). Cancer Facts & Figures 2020. Retrieved from https://www.cancer.org/content/dam/cancer-org/research/cancer-facts-and-statistics/annual-cancer-facts-and-figures/2020/cancer-facts-and-figures-2020.pdf
American Cancer Society. (2021). Cancer Facts and Figures 2021. Atlanta, GA: American Cancer Society.
Andrasfay, T., Himmelstein, G., & Querin, F. (2019). Medical Redlining: Demographic and local area characteristics associated with hospital closure in U.S. cities. Retrieved from http://paa2019.populationassociation.org/uploads/190116
Ansell, D., Grabler, P., Whitman, S., Ferrans, C., Burgess-Bishop, J., Murray, L. R., . . . Marcus, E. (2009). A community effort to reduce the black/white breast cancer mortality disparity in Chicago. Cancer Causes Control, 20(9), 1681-1688. doi:10.1007/s10552-009-9419-7
Artiga, S., & Hinton, E. (2018). Beyond Health Care: The Role of Social Determinants in Promoting Health and Health Equity. The Henry J. Kaiser Family Foundation. Retrieved from https://www.kff.org/disparities-policy/issue-brief/beyond-health-care-the-role-of-social-determinants-in-promoting-health-and-health-equity/
Bailey, Z. D., Krieger, N., Agénor, M., Graves, J., Linos, N., & Bassett, M. T. (2017). Structural racism and health inequities in the USA: evidence and interventions. The Lancet, 389(10077), 1453-1463. doi:10.1016/S0140-6736(17)30569-X
Bauer, M. S., Damschroder, L., Hagedorn, H., Smith, J., & Kilbourne, A. M. (2015). An introduction to implementation science for the non-specialist. BMC Psychol, 3, 32. doi:10.1186/s40359-015-0089-9

LANDSCAPE ANALYSIS
LOS ANGELES | PAGE 98
Berchick, E. R., Barnett, J. C., & Upton, R. D. (2019). Health Insurance Coverage in the United States: 2018. Retrieved from https://www.census.gov/library/publications/2019/demo/p60-267.html
Bravo, M. A., Anthopolos, R., Bell, M. L., & Miranda, M. L. (2016). Racial isolation and exposure to airborne particulate matter and ozone in understudied US populations: Environmental justice applications of downscaled numerical model output. Environ Int, 92-93, 247-255. doi:10.1016/j.envint.2016.04.008
Brooks, T., Roygardner, L., & Artiga, S. (2019). Medicaid and CHIP Eligibility, Enrollment, and Cost Sharing Policies as of January 2019: Findings from a 50-State Survey. Retrieved from http://files.kff.org/attachment/Report-Medicaid-and-CHIP-Eligibility-Enrollment-Renewal-and-Cost-Sharing-Policies-as-of-January-2019
Buchmueller, T. C., & Levy, H. G. (2020). The ACA's Impact On Racial And Ethnic Disparities In Health Insurance Coverage And Access To Care. Health Affairs (Millwood), 39(3), 395-402. doi:10.1377/hlthaff.2019.01394
Cauley Narain, K. D., & Zimmerman, F. J. (2019). Medicaid work requirements: a really bad idea for increasing employment. Journal of Epidemiology and Community Health, 73(1), 1. doi:10.1136/jech-2018-210714
Centers for Disease Control and Prevention. National Breast and Cervical Cancer Early Detection Program (NBCCEDP). Retrieved from https://www.cdc.gov/cancer/nbccedp/index.htm
Centers for Disease Control and Prevention. (2020). Georgia | Five-Year Summary: July 2014 to June 2019. National Breast and Cervical Cancer Early Detection Program (NBCCEDP). Retrieved from https://www.cdc.gov/cancer/nbccedp/data/summaries/georgia.htm
Centers for Disease Control and Prevention (2019). Social Determinants of Health. Retrieved from www.cdc.gov/nchhstp/socialdeterminants/index.html.
Centers for Medicare & Medicaid Services. 1115 Community Engagement Initiative. Retrieved from https://www.medicaid.gov/medicaid/section-1115-demonstrations/1115-community-engagement-initiative/index.html
Centers for Medicare & Medicaid Services. Affordable Care Act (ACA). Retrieved from https://www.healthcare.gov/glossary/affordable-care-act/
Centers for Medicare & Medicaid Services. High Deductible Health Plan (HDHP). Retrieved from https://www.healthcare.gov/glossary/high-deductible-health-plan/
Centers for Medicare & Medicaid Services. (2020). Georgia Pathways to Coverage. Retrieved from https://www.medicaid.gov/Medicaid-CHIP-Program-Information/By-Topics/Waivers/1115/downloads/ga/ga-pathways-to-coverage-ca.pdf
Collins, C. A., & Williams, D. R. (1999). Segregation and Mortality: The Deadly Effects of Racism? Sociological Forum, 14(3), 495-523. doi:10.1023/A:1021403820451

LANDSCAPE ANALYSIS
LOS ANGELES | PAGE 99
County Health Rankings. (2016). County Health Rankings Model. Retrieved from https://www.countyhealthrankings.org/resources/county-health-rankings-model
County Health Rankings. (2020a). Adult Obesity. Retrieved from: https://www.countyhealthrankings.org/explore-health-rankings/measures-data-sources/county-health-rankings-model/health-factors/health-behaviors/diet-exercise/adult-obesity
County Health Rankings. (2020b). Food Insecurity. Retrieved from: https://www.countyhealthrankings.org/explore-health-rankings/measures-data-sources/county-health-rankings-model/health-factors/health-behaviors/diet-exercise/food-insecurity
County Health Rankings. (2020c). Limited Access to Healthy Foods*. Retrieved from: https://www.countyhealthrankings.org/explore-health-rankings/measures-data-sources/county-health-rankings-model/health-factors/health-behaviors/diet-exercise/limited-access-to-healthy-foods
County Health Rankings. (2020d). Premature age-adjusted mortality*. Retrieved from: https://www.countyhealthrankings.org/explore-health-rankings/measures-data-sources/county-health-rankings-model/health-outcomes/length-of-life/premature-age-adjusted-mortality
County Health Rankings. (2020e). Residential Segregation - Black/White*. Retrieved from: https://www.countyhealthrankings.org/explore-health-rankings/measures-data-sources/county-health-rankings-model/health-factors/social-and-economic-factors/family-social-support/residential-segregation-blackwhite
Cozier, Y. C., Wise, L. A., Palmer, J. R., & Rosenberg, L. (2009). Perceived racism in relation to weight change in the Black Women's Health Study. Ann Epidemiol, 19(6), 379-387. doi:10.1016/j.annepidem.2009.01.008
Curtis, E., Quale, C., Haggstrom, D., & Smith-Bindman, R. (2008). Racial and ethnic differences in breast cancer survival: how much is explained by screening, tumor severity, biology, treatment, comorbidities, and demographics? Cancer, 112(1), 171-180. doi:10.1002/cncr.23131
Daly, B., & Olopade, O. I. (2015). A perfect storm: How tumor biology, genomics, and health care delivery patterns collide to create a racial survival disparity in breast cancer and proposed interventions for change. A Cancer Journal for Clinicians, 65(3), 221-238. doi:10.3322/caac.21271
Dietze, E. C., Sistrunk, C., Miranda-Carboni, G., O'Regan, R., & Seewaldt, V. L. (2015). Triple-negative breast cancer in African-American women: disparities versus biology. Nature Reviews Cancer, 15(4), 248-254. doi:10.1038/nrc3896
Elshof, LE, Schmidt, MK, Rutgers, EJT, van Leeuwen, FE, Wesseling, J, Schaapveld, M. (2017). Cause-specific mortality in a population-based cohort of 9799 women treated for ductal carcinoma in situ. Ann. Surg. 2017;267:952–958. doi: 10.1097/SLA.0000000000002239. [PMC free article] [PubMed] [CrossRef] [Google Scholar]
Fazeli Dehkordy, S., Fendrick, A. M., Bell, S., Kamdar, N., Kobernik, E., Dalton, V. K., & Carlos, R. C. (2019). Breast Screening Utilization and Cost Sharing Among Employed Insured Women Following the

LANDSCAPE ANALYSIS
LOS ANGELES | PAGE 100
Affordable Care Act: Impact of Race and Income. Journal of Women's Health (Larchmont). doi:10.1089/jwh.2018.7403
Fedewa, S. A., Yabroff, K. R., Smith, R. A., Goding Sauer, A., Han, X., & Jemal, A. (2019). Changes in Breast and Colorectal Cancer Screening After Medicaid Expansion Under the Affordable Care Act. Am J Prev Med, 57(1), 3-12. doi:10.1016/j.amepre.2019.02.015
Felitti, V. J., Anda, R. F., Nordenberg, D., Williamson, D. F., Spitz, A. M., Edwards, V., . . . Marks, J. S. (1998). Relationship of childhood abuse and household dysfunction to many of the leading causes of death in adults. The Adverse Childhood Experiences (ACE) Study. Am J Prev Med, 14(4), 245-258.
Fisher, ER, Dignam, J, Tan-Chiu, E, Costantino, J, Fisher, B, Paik, S, et al. (1999). Pathologic findings from the National Surgical Adjuvant Breast Project (NSABP) eight-year update of Protocol B-17: intraductal carcinoma. Cancer. 1999;86:429–438. doi: 10.1002/(SICI)1097-0142(19990801)86:3<429::AID-CNCR11>3.0.CO;2-Y. [PubMed] [CrossRef] [Google Scholar]
Ford, D., Easton, D., Bishop, D., Narod, S., & Golgar, D. (1994). Risks of cancer in BRCA1-mutation carriers. Breast Cancer Linkage Consortium. Lancet. 1994 343:692-5. PMID: 7907678
Gallups, S. F., Connolly, M. C., Bender, C. M., & Rosenzweig, M. Q. (2018). Predictors of Adherence and Treatment Delays among African American Women Recommended to Receive Breast Cancer Chemotherapy. Womens Health Issues, 28(6), 553-558. doi:10.1016/j.whi.2018.08.001
Garfield, R., Orgera, K., & Damico, A. (2020). The Coverage Gap: Uninsured Poor Adults in States that Do Not Expand Medicaid. The Henry J. Kaiser Family Foundation. Retrieved from https://www.kff.org/medicaid/issue-brief/the-coverage-gap-uninsured-poor-adults-in-states-that-do-not-expand-medicaid/
Garfield, R., Rudowitz, R., Orgera, K., & Damico, A. (2019). Understanding the Intersection of Medicaid and Work: What Does the Data Say? Retrieved from https://www.kff.org/medicaid/issue-brief/understanding-the-intersection-of-medicaid-and-work-what-does-the-data-say/
Gaskin, D. J., Dinwiddie, G. Y., Chan, K. S., & McCleary, R. (2012). Residential segregation and disparities in health care services utilization. Med Care Res Rev, 69(2), 158-175. doi:10.1177/1077558711420263
Georgia Cancer Control Consortium. (2014). Georgia Cancer Plan 2014-2019.
Gordis, L. (2000). Epidemiology: W.B. Saunders.
Green, A. K., Aviki, E. M., Matsoukas, K., Patil, S., Korenstein, D., & Blinder, V. (2018). Racial disparities in chemotherapy administration for early-stage breast cancer: a systematic review and meta-analysis. Breast Cancer Res Treat, 172(2), 247-263. doi:10.1007/s10549-018-4909-5
Gupta, V., Haque, I., Chakraborty, J., Graff, S., Banerjee, S., & Banerjee, S. K. (2018). Racial disparity in breast cancer: can it be mattered for prognosis and therapy. J Cell Commun Signal, 12(1), 119-132. doi:10.1007/s12079-017-0416-4

LANDSCAPE ANALYSIS
LOS ANGELES | PAGE 101
Halpern, M. T., & Holden, D. J. (2012). Disparities in timeliness of care for U.S. Medicare patients diagnosed with cancer. Current Oncology, 19(6), e404-413. doi:10.3747/co.19.1073
Hawley, S. T., Fagerlin, A., Janz, N. K., & Katz, S. J. (2008). Racial/ethnic disparities in knowledge about risks and benefits of breast cancer treatment: does it matter where you go? Health Serv Res, 43(4), 1366-1387. doi:10.1111/j.1475-6773.2008.00843.x
Health Resources & Services Administration. MUA Find. Retrieved from: https://data.hrsa.gov/tools/shortage-area/mua-find
Hill, J. O., & Peters, J. C. (1998). Environmental contributions to the obesity epidemic. Science, 280(5368), 1371-1374. doi:10.1126/science.280.5368.1371
Hoffman, H. J., LaVerda, N. L., Levine, P. H., Young, H. A., Alexander, L. M., Patierno, S. R., & District of Columbia Citywide Patient Navigator Research Program Research, G. (2011). Having health insurance does not eliminate race/ethnicity-associated delays in breast cancer diagnosis in the District of Columbia. Cancer, 117(16), 3824-3832. doi:10.1002/cncr.25970
Holkup, P. A., Tripp-Reimer, T., Salois, E. M., & Weinert, C. (2004). Community-based participatory research: an approach to intervention research with a Native American community. ANS. Advances in nursing science, 27(3), 162-175. doi:10.1097/00012272-200407000-00002
Houterman, S., Janssen-Heijnen, M. L., Verheij, C. D., Louwman, W. J., Vreugdenhil, G., van der Sangen, M. J., & Coebergh, J. W. (2004). Comorbidity has negligible impact on treatment and complications but influences survival in breast cancer patients. British Journal of Cancer, 90(12), 2332-2337. doi:10.1038/sj.bjc.6601844
Howlader N, Noone AM, Krapcho M, et al. (2020). Cancer Statistics Review, 1975-2017. Table 4.13: Cancer of the female breast (invasive): 5-year relative and period survival by race, diagnosis year, age and stage at diagnosis. National Cancer Institute. Bethesda, MD. Accessed on April 27, 2020. https://seer.cancer.gov/csr/1975_2017/, 2020.
Howlader N, Noone AM, Krapcho M, Miller D, Brest A, Yu M, Ruhl J, Tatalovich Z, Mariotto A, Lewis DR, Chen HS, Feuer EJ, Cronin KA (Eds). (2020). SEER Cancer Statistics Review, 1975-2017, National Cancer Institute. Bethesda, MD, https://seer.cancer.gov/csr/1975_2017/, based on November 2019 SEER data submission, posted to the SEER web site, April 2020.
Huang, H., Apouey, B., & Andrews, J. (2014) Racial and Ethnic Disparities in Awareness of Cancer Genetic Testing Among Online Users: Internet Use, Health Knowledge, and Socio-Demographic Correlates. Journal of Consumer Health on the Internet 18:1, pages 15-30.
Institute of Medicine Committee on Prevention of Obesity in Children & Youth. (2005). The National Academies Collection: Reports funded by National Institutes of Health. In J. P. Koplan, C. T. Liverman, & V. I. Kraak (Eds.), Preventing Childhood Obesity: Health in the Balance. Washington (DC): National Academies Press (US). National Academy of Sciences.
Institute of Medicine Committee on Understanding and Eliminating Racial Ethnic Disparities in Health Care. (2003). In B. D. Smedley, A. Y. Stith, & A. R. Nelson (Eds.), Unequal Treatment: Confronting

LANDSCAPE ANALYSIS
LOS ANGELES | PAGE 102
Racial and Ethnic Disparities in Health Care. Washington (DC): National Academies Press (US) Copyright 2002 by the National Academy of Sciences. All rights reserved.
Institute of Medicine of the National Academies. (2011). Breast Cancer and the Environment: A Life Course Approach. Retrieved from http://www.nationalacademies.org/hmd/~/media/Files/Report%20Files/2011/Breast-Cancer-Environment/BreastCancerReportbrief_2.pdf
Jones, C. P. (2000). Levels of racism: a theoretic framework and a gardener's tale. Am J Public Health, 90(8), 1212-1215. doi:10.2105/ajph.90.8.1212
Kania, J., & Kramer, M. (2011). Collective Impact. Stanford Social Innovation Review, 9.
King, K. E., Morenoff, J. D., & House, J. S. (2011). Neighborhood context and social disparities in cumulative biological risk factors. Psychosom Med, 73(7), 572-579. doi:10.1097/PSY.0b013e318227b062
Ko, D., Andreopoulou, E., & Moo, T.-A. (2016). Is Race a Prognostically Significant Factor in Survival Outcomes for Breast Cancer Among Caucasian and African- American Women? Clinics in Surgery, 1.
Kramer, M. R., & Hogue, C. R. (2009). Is segregation bad for your health? Epidemiol Rev, 31, 178-194. doi:10.1093/epirev/mxp001
Krieger, N. (2014). Discrimination and health inequities. Int J Health Serv, 44(4), 643-710. doi:10.2190/HS.44.4.b
Krieger, N., Jahn, J. L., & Waterman, P. D. (2017). Jim Crow and estrogen-receptor-negative breast cancer: US-born black and white non-Hispanic women, 1992-2012. Cancer Causes Control, 28(1), 49-59. doi:10.1007/s10552-016-0834-2
Krueger, R. A., & Casey, M. A. (2015). Focus groups : a practical guide for applied research.
Kumanyika, S. K., Van Horn, L., Bowen, D., Perri, M. G., Rolls, B. J., Czajkowski, S. M., & Schron, E. (2000). Maintenance of dietary behavior change. Health Psychol, 19(1s), 42-56. doi:10.1037/0278-6133.19.suppl1.42
Kwate, N. O. A., Valdimarsdottir, H. B., Guevarra, J. S., & Bovbjerg, D. H. (2003). Experiences of racist events are associated with negative health consequences for African American women. Journal of the National Medical Association, 95(6), 450-460.
Landrine, H., & Corral, I. (2009). Separate and unequal: residential segregation and black health disparities. Ethn Dis, 19(2), 179-184.
Lee, N. C., & Wolitski, R. (2016). Tools to Promote Gender Responsiveness in HIV Prevention Programs for Women and Girls. Retrieved from https://www.womenshealth.gov/blog/gender-responsiveness-hiv

LANDSCAPE ANALYSIS
LOS ANGELES | PAGE 103
Masi, C. M., & Gehlert, S. (2009). Perceptions of breast cancer treatment among African-American women and men: implications for interventions. J Gen Intern Med, 24(3), 408-414. doi:10.1007/s11606-008-0868-6
McLeroy, K. R., Bibeau, D., Steckler, A., & Glanz, K. (1988). An ecological perspective on health promotion programs. Health Educ Q, 15(4), 351-377. doi:10.1177/109019818801500401
Mendez, D. D., Hogan, V. K., & Culhane, J. F. (2014). Institutional racism, neighborhood factors, stress, and preterm birth. Ethnicity & Health, 19(5), 479-499. doi:10.1080/13557858.2013.846300
Merkin, S. S., Basurto-Davila, R., Karlamangla, A., Bird, C. E., Lurie, N., Escarce, J., & Seeman, T. (2009). Neighborhoods and cumulative biological risk profiles by race/ethnicity in a national sample of U.S. adults: NHANES III. Ann Epidemiol, 19(3), 194-201. doi:10.1016/j.annepidem.2008.12.006
Merriam-Webster. White Flight. Merriam-Webster Dictionary. Retrieved from https://www.merriam-webster.com/dictionary/white%20flight
Miller, S., & Wherry, L. R. State Level Mortality Estimates Based on Miller et al. 2019 NBER Working Paper 26081. Retrieved from http://www-personal.umich.edu/~mille/ACAMortality_ByState.pdf
Morrow M, & Katz, SJ (2015). Addressing overtreatment in DCIS: what should physicians do now? J. Natl. Cancer Inst. 2015;107:djv290. doi: 10.1093/jnci/djv290. [PubMed] [CrossRef] [Google Scholar]
Nagel, G., Wedding, U., Rohrig, B., & Katenkamp, D. (2004). The impact of comorbidity on the survival of postmenopausal women with breast cancer. J Cancer Res Clin Oncol, 130(11), 664-670. doi:10.1007/s00432-004-0594-3
National Cancer Institute (2021). BRCA gene Mutations: Cancer risk and genetic testing fact sheet. (2020, November 19). Retrieved April 16, 2021, from https://www.cancer.gov/about-cancer/causes-prevention/genetics/brca-fact-sheet#what-are-brca1-and-brca
National Cancer Institute. (2020). Measures of Cancer Prevalence. Retrieved from https://surveillance.cancer.gov/prevalence/measures.html
National Cancer Institute (2017). The Genetics of Cancer. (2017, October 12). https://www.cancer.gov/about-cancer/causes-prevention/genetics#ui-id-4
National Cancer Institute. Hazard Ratio. NCI Dictionary of Cancer Terms. Retrieved from https://www.cancer.gov/publications/dictionaries/cancer-terms/def/hazard-ratio
National Cancer Institute. SEER*Stat Tutorials: Calculating Age-adjusted Rates. Retrieved from https://seer.cancer.gov/seerstat/tutorials/aarates/definition.html
National Cancer Institute. State Cancer Profiles: Death Rates Table. Retrieved from: https://statecancerprofiles.cancer.gov/deathrates/index.php
National Cancer Institute. State Cancer Profiles: Incidence Rates Table. Retrieved from: https://statecancerprofiles.cancer.gov/incidencerates/index.php

LANDSCAPE ANALYSIS
LOS ANGELES | PAGE 104
National Cancer Institute. State Cancer Profiles: Prevalence Table. Retrieved from: https://statecancerprofiles.cancer.gov/prevalence/index.php
National Conference of State Legislatures. (2018). Medicaid Waivers in the States | Seven FAQs. Retrieved from https://www.ncsl.org/research/health/medicaid-waivers-in-the-states-seven-faqs.aspx
Newman, L. A. (2017). Breast Cancer Disparities: Socioeconomic Factors versus Biology. Ann Surg Oncol, 24(10), 2869-2875. doi:10.1245/s10434-017-5977-1
Newschaffer, C. J., Bush, T. L., & Penberthy, L. T. (1997). Comorbidity measurement in elderly female breast cancer patients with administrative and medical records data. J Clin Epidemiol, 50(6), 725-733. doi:10.1016/s0895-4356(97)00050-4
Noone AM, Howlader N, Krapcho M, et al. (editors). SEER Cancer Statistics Review, 1975-2017. Table 4.18. Cancer of the female breast (invasive): Age-adjusted rates and trends by race/ethnicity, 2013-2017. National Cancer Institute. Bethesda, MD. Accessed on April 27, 2020. http://seer.cancer.gov/csr/1975_2017/, 2020.
Nurgalieva, Z. Z., Franzini, L., Morgan, R. O., Vernon, S. W., Liu, C. C., & Du, X. L. (2013). Impact of timing of adjuvant chemotherapy initiation and completion after surgery on racial disparities in survival among women with breast cancer. Medical Oncology, 30(1), 419. doi:10.1007/s12032-012-0419-1
Office of Policy Development and Research (PD&R). (2019). Consolidated Planning/CHAS Data. Retrieved from: https://www.huduser.gov/portal/datasets/cp.html
Office of the Assistant Secretary for Planning and Evaluation. Prior HHS Poverty Guidelines and Federal Register References. Retrieved from https://aspe.hhs.gov/prior-hhs-poverty-guidelines-and-federal-register-references
Padamsee, T. J., Meadows, R., & Hils, M. (2018). Layers of information: interacting constraints on breast cancer risk-management by high-risk African American women. Ethnicity & Health, 1-24. doi:10.1080/13557858.2018.1562053
Phillips, S. P. (2005). Defining and measuring gender: A social determinant of health whose time has come. Int J Equity Health, 4(1), 11. doi:10.1186/1475-9276-4-11
Richards, L., & Morse, J. M. (2013). Readme First For a User's Guide to Qualitative Methods. Los Angeles: Sage.
Rothstein, R. (2017). The Color of Law: A Forgotten History of How Our Government Segregated America (First edition. ed.). New York ; London: Liveright Publishing Corporation, a division of W.W. Norton & Company.
Russ, S. A., Larson, K., Tullis, E., & Halfon, N. (2014). A lifecourse approach to health development: implications for the maternal and child health research agenda. Matern Child Health J, 18(2), 497-510. doi:10.1007/s10995-013-1284-z

LANDSCAPE ANALYSIS
LOS ANGELES | PAGE 105
Samson, M. E., Porter, N. G., Hurley, D. M., Adams, S. A., & Eberth, J. M. (2016). Disparities in Breast Cancer Incidence, Mortality, and Quality of Care among African American and European American Women in South Carolina. South Med J, 109(1), 24-30. doi:10.14423/smj.0000000000000396
Satariano, W. A. (1992). Comorbidity and functional status in older women with breast cancer: implications for screening, treatment, and prognosis. J Gerontol, 47 Spec No, 24-31.
Satariano, W. A. (1993). Aging, comorbidity, and breast cancer survival: an epidemiologic view. Adv Exp Med Biol, 330, 1-11. doi:10.1007/978-1-4615-2926-2_1
Satariano, W. A., & Ragland, D. R. (1994). The effect of comorbidity on 3-year survival of women with primary breast cancer. Annals of Internal Medicine, 120(2), 104-110. doi:10.7326/0003-4819-120-2-199401150-00002
Savigny, D. d., Adam, T., & Alliance for Health Policy and Systems Research, W. H. O. (2009). Systems Thinking for Health Systems Strengthening. W. H. Organization (Ed.). Retrieved from https://www.who.int/alliance-hpsr/resources/9789241563895/en/
Schaa, KL, Roter, DL, Biesecker, BB, Cooper, LA, & Erby, LH. (2015). Genetic counselors' implicit racial attitudes and their relationship to communication. Health Psychol. 2015;34(2):111-119. doi:10.1037/hea0000155
Siddharth S, Sharma D. (2018). Racial Disparity and Triple-Negative Breast Cancer in African American Women: A Multifaceted Affair between Obesity, Biology, and Socioeconomic Determinants. Cancers (Basel). 2018;10(12):514. Published 2018 Dec 14. doi:10.3390/cancers10120514
Silber, J. H., Rosenbaum, P. R., Ross, R. N., Reiter, J. G., Niknam, B. A., Hill, A. S., . . . Fox, K. R. (2018). Disparities in Breast Cancer Survival by Socioeconomic Status Despite Medicare and Medicaid Insurance. Milbank Q, 96(4), 706-754. doi:10.1111/1468-0009.12355
Strauss, A., & Corbin, J. (1998). Basics of qualitative research: Techniques and procedures for developing grounded theory, 2nd ed. Thousand Oaks, CA, US: Sage Publications, Inc.
Susan G. Komen. Expansion of Eligibility for the Breast and Cervical Cancer Prevention and Treatment Act (BCCPTA). Issues to Monitor. Retrieved from https://ww5.komen.org/Issues-to-Monitor.aspx#expansion
Susan G. Komen. (2021). Comparing breast cancer screening rates among different groups. Retrieved from https://ww5.komen.org/BreastCancer/RacialEthnicIssuesinScreening.html?ecid=social:285
Susan G. Komen (2021a). Breast cancer screening for women at higher risk. Retrieved from https://www.komen.org/breast-cancer/screening/when-to-screen/high-risk-women/
Susan G. Komen (2021b). Facts and statistics references. Retrieved from https://www.komen.org/breast-cancer/facts-statistics/references/
Susan G. Komen (2021c). Triple negative breast cancer. Retrieved from https://www.komen.org/breast-cancer/diagnosis/triple-negative/

LANDSCAPE ANALYSIS
LOS ANGELES | PAGE 106
Susan G. Komen. (2020). Breast Cancer Glossary. Retrieved from https://ww5.komen.org/BreastCancer/Glossary.html
Sutton, A. L., He, J., Edmonds, M. C., & Sheppard, V. B. (2019). Medical Mistrust in Black Breast Cancer Patients: Acknowledging the Roles of the Trustor and the Trustee. Journal of Cancer Education, 34(3), 600-607. doi:10.1007/s13187-018-1347-3
Swift, D. (2019). Cancer Screening Improved With ACA's Medicaid Expansion. Retrieved from https://www.medpagetoday.com/publichealthpolicy/publichealth/79984
Tammemagi, C. M., Nerenz, D., Neslund-Dudas, C., Feldkamp, C., & Nathanson, D. (2005). Comorbidity and survival disparities among black and white patients with breast cancer. Journal of the American Medical Association, 294(14), 1765-1772. doi:10.1001/jama.294.14.1765
Taplin, S. H., Anhang Price, R., Edwards, H. M., Foster, M. K., Breslau, E. S., Chollette, V., . . . Zapka, J. (2012). Introduction: Understanding and influencing multilevel factors across the cancer care continuum. J Natl Cancer Inst Monogr, 2012(44), 2-10. doi:10.1093/jncimonographs/lgs008
Taylor, T. R., Williams, C. D., Makambi, K. H., Mouton, C., Harrell, J. P., Cozier, Y., . . . Adams-Campbell, L. L. (2007). Racial discrimination and breast cancer incidence in US Black women: the Black Women's Health Study. Am J Epidemiol, 166(1), 46-54. doi:10.1093/aje/kwm056
The Aspen Institute. (2016). Glossary for Understanding the Dismantling Structural Racism/Promoting Racial Equity Analysis. Retrieved from https://assets.aspeninstitute.org/content/uploads/files/content/docs/rcc/RCC-Structural-Racism-Glossary.pdf
The Henry J. Kaiser Family Foundation. (2015). Preventive Services Covered by Private Health Plans under the Affordable Care Act. Retrieved from https://www.kff.org/health-reform/fact-sheet/preventive-services-covered-by-private-health-plans/
The Henry J. Kaiser Family Foundation. (2020). Status of State Medicaid Expansion Decisions: Interactive Map. Retrieved from https://www.kff.org/medicaid/issue-brief/status-of-state-medicaid-expansion-decisions-interactive-map/
Thurston, H., Bell, J. F., & Induni, M. (2018). Community-level Adverse Experiences and Emotional Regulation in Children and Adolescents. J Pediatr Nurs, 42, 25-33. doi:10.1016/j.pedn.2018.06.008
U.S. Department of Agriculture Economic Research Service. (2019). Food Access Research Analysis. Retrieved from https://www.ers.usda.gov/data-products/food-access-research-atlas/
U.S. Department of Health & Human Services. (2017). Pre-Existing Conditions. Retrieved from https://www.hhs.gov/healthcare/about-the-aca/pre-existing-conditions/index.html#
U.S. Department of Housing and Urban Development. (2019). Fair Housing Act Cases Filed by Year and State. Retrieved from: https://catalog.data.gov/dataset/fair-housing-act-cases-filed-by-year-and-state

LANDSCAPE ANALYSIS
LOS ANGELES | PAGE 107
U.S. Department of Justice Federal Bureau of Investigation. (2017). 2017 Hate Crime Statistics. Retrieved from https://ucr.fbi.gov/hate-crime/2017
Van Siejen, M., Lips, E., Thompson, A., Nik-Zainal, S., Futreal, A., Hwang, E., Verschuur, E., Lane, J., Jonkers, J., Rea, D., Wesseling, J. (2019). Ductal carcinoma in situ: to treat or not to treat, that is the question. British Journal of Cancer, 121(4), 285–292. doi: 10.1038/s41416-019-0478-6.
Wharam, J. F., Zhang, F., Lu, C. Y., Wagner, A. K., Nekhlyudov, L., Earle, C. C., . . . Ross-Degnan, D. (2018). Breast Cancer Diagnosis and Treatment After High-Deductible Insurance Enrollment. Journal of Clinical Oncology, 36(11), 1121-1127. doi:10.1200/jco.2017.75.2501
Wharam, J. F., Zhang, F., Wallace, J., Lu, C., Earle, C., Soumerai, S. B., . . . Ross-Degnan, D. (2019). Vulnerable And Less Vulnerable Women In High-Deductible Health Plans Experienced Delayed Breast Cancer Care. Health Affairs (Millwood), 38(3), 408-415. doi:10.1377/hlthaff.2018.05026
White, K., Haas, J. S., & Williams, D. R. (2012). Elucidating the role of place in health care disparities: the example of racial/ethnic residential segregation. Health Serv Res, 47(3 Pt 2), 1278-1299. doi:10.1111/j.1475-6773.2012.01410.x
Williams, D. R., & Collins, C. (2001). Racial residential segregation: a fundamental cause of racial disparities in health. Public Health Reports, 116(5), 404-416. doi:10.1093/phr/116.5.404
Williams, D. R., Lawrence, J. A., Davis, B. A., & Vu, C. (2019). Understanding how discrimination can affect health. Health Serv Res, 54, 1374-1388. doi:10.1111/1475-6773.13222
Williams, D. R., & Mohammed, S. A. (2013). Racism and Health I: Pathways and Scientific Evidence. Am Behav Sci, 57(8). doi:10.1177/0002764213487340
Williams, D. R., Mohammed, S. A., & Shields, A. E. (2016). Understanding and effectively addressing breast cancer in African American women: Unpacking the social context. Cancer, 122(14), 2138-2149. doi:10.1002/cncr.29935
World Health Organization. About Social Determinants of Health. Retrieved from https://www.who.int/social_determinants/sdh_definition/en/
Yancik, R., Wesley, M. N., Ries, L. A., Havlik, R. J., Edwards, B. K., & Yates, J. W. (2001). Effect of age and comorbidity in postmenopausal breast cancer patients aged 55 years and older. Journal of the American Medical Association, 285(7), 885-892. doi:10.1001/jama.285.7.885