añada ollege ata ashboard Manual - Cañada College Canada... · Data Dashboard Advisory Group Data...
15
Cañada College Data Dashboard Manual May 2014
Transcript of añada ollege ata ashboard Manual - Cañada College Canada... · Data Dashboard Advisory Group Data...

Cañada College Data Dashboard Manual
May 2014
Table of Contents Development of the Data Dashboard....................................................................................................... 3
Background/History ............................................................................................................................. 3
Purpose ............................................................................................................................................... 3
The short- and long-term outcomes are: .......................................................................................... 3
Why is a Data Dashboard important? ............................................................................................... 3
What’s in the Data Dashboard System ................................................................................................. 3
Data Dashboard Advisory Group .......................................................................................................... 4
Timeline .............................................................................................................................................. 4
Cañada College Educational Master Plan ............................................................................................. 5
Completion Objective 2.12:.............................................................................................................. 5
SMCCD Data Dashboard .......................................................................................................................... 6
Login ................................................................................................................................................... 6
Ready For the Adventure? ....................................................................................................................... 8
Limitations........................................................................................................................................... 8
Data Dashboard....................................................................................................................................... 9
“Overview” Tab ................................................................................................................................... 9
“Enrollment” Tab ............................................................................................................................... 10
“Retention” Tab ................................................................................................................................. 11
“Success” Tab .................................................................................................................................... 12
“Student Cohort Reports” Tab ........................................................................................................... 13
“Awarded Degree and Certificate” Tab .............................................................................................. 14
“Student Persistence” Tab ................................................................................................................. 15

Development of the Data Dashboard
Background/History There has been an increasing need for end users (faculty, staff and administrators) to have the ability to
create their own data reports for program review, planning and decision-making. There are so many
demands made on the college research offices, it is critical for others to be able to obtain data to answer
their questions without having to wait in a queue for the researcher to “get to their request”.
There have been efforts by IT in SMCCCD to provide this type of service (five or six years ago), however,
there was a lack of support for the concept. This attitude has definitely changed, and all six vice-
presidents as well as the three research offices, stating such a data dashboard is essential in getting
work completed for enrollment management, accreditation, planning and decision-making. In addition,
over the past decade, the tools available to allow this type of self-service report creation have become
much more user friendly so it can be used by everyone on campus.
Purpose The purpose of the project is to increase data democracy at the district and colleges to provide a user-
friendly analytical data toolset or system with which to analyze institutional data. In addition, faculty,
staff, and administrators can use this toolset or system to generate information that supports their
work--data on people’s fingertips.
The short- and long-term outcomes are:
(a) create a data toolset/system
(b) train faculty, staff, and administrators to use this system
(c) cultivate/support data democracy and culture of inquiry
Why is a Data Dashboard important?
It can improve decision-making, evaluate strategic priorities, support accreditation, assess student
success services, appraise program effectiveness, and support program review.
What’s in the Data Dashboard System Institutional Overview
Enrollment
Gender, ethnicity, age, division, department, program subject, course, section, student
type, educational goal, unit load, high school, total units earned, CTE course, basic skills
courses, GE courses, transfer courses
Achievement
Course Retention
Course Success
Cohort Study
Persistence
Degree/Certificate Awarded

Data Dashboard Advisory Group Data Dashboard Advisory Group is composed of VPI, VPSS, Dean of Planning, Research, and Institutional
Effectiveness from three colleges, ITS from the District (Director Edgar Coronel and CTO Eric Raznick) to
support this effort. The charge of this Advisory Group is to:
Establish milestone and key timeline
Budget
Test and improve the system
Timeline
September and October 2013:
o Conversation with colleges and IT
o Evaluate options for development
o Develop proposal
o Establish Timeline and Budget
November and December 2013:
o Project kickoff
o Develop Data Dashboard draft version
o Researchers and IT data validation
January-March 2014
o Researchers and IT continue data validation
o IT demonstrated validated version of Data Dashboard to Data Dashboard Advisory Group
April-May 2014 (Spring 2014):
o PRIE trains administrators and key faculty to pilot run the system before people can get
access to the system
o Receive feedback
o Continues fine tune the system
Summer 2014:
o PRIE design training program for the system
Fall 2014:
o PRIE continue monthly training to administrators and key faculty to pilot run the system,
especially program review leaders both instructional and student services areas before
people can get access to the system
Spring 2015:
o Kick off and open access to all administrators, faculty, and staff to use this system including
training
o Data Dashboard training monthly to support program review and other project
o Continues fine tune the system
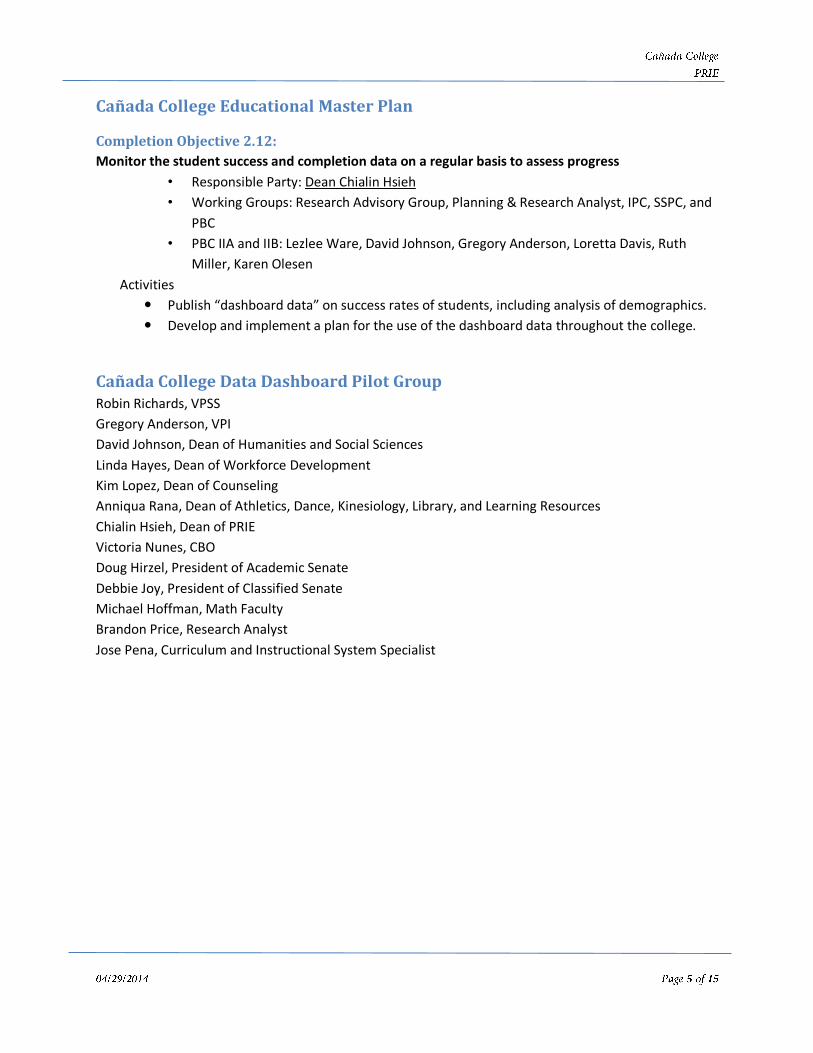
Cañada College Educational Master Plan
Completion Objective 2.12:
Monitor the student success and completion data on a regular basis to assess progress
• Responsible Party: Dean Chialin Hsieh
• Working Groups: Research Advisory Group, Planning & Research Analyst, IPC, SSPC, and
PBC
• PBC IIA and IIB: Lezlee Ware, David Johnson, Gregory Anderson, Loretta Davis, Ruth
Miller, Karen Olesen
Activities
Publish “dashboard data” on success rates of students, including analysis of demographics.
Develop and implement a plan for the use of the dashboard data throughout the college.
Cañada College Data Dashboard Pilot Group Robin Richards, VPSS
Gregory Anderson, VPI
David Johnson, Dean of Humanities and Social Sciences
Linda Hayes, Dean of Workforce Development
Kim Lopez, Dean of Counseling
Anniqua Rana, Dean of Athletics, Dance, Kinesiology, Library, and Learning Resources
Chialin Hsieh, Dean of PRIE
Victoria Nunes, CBO
Doug Hirzel, President of Academic Senate
Debbie Joy, President of Classified Senate
Michael Hoffman, Math Faculty
Brandon Price, Research Analyst
Jose Pena, Curriculum and Instructional System Specialist

SMCCD Data Dashboard
Login http://smccd.edu/portal/
Click on Banner
Click on Argos

Log in and password:
Your network user name (last name and first name initial. i.e., hsiehc) and password
Open “DSS” Folder by clicking the + sign
Open “Dashboard_Project” by clicking the + sign
Then Click on “Student Dashboard”
Then Click on “Run Dashboard”

Ready For the Adventure?
Limitations
Several limitations for the Data Dashboard:
1. Slow so please be patient!
2. At this point, PC only (not work for Mac)
3. On campus only (cannot run this system from home)
4. Faculty/staff computer only (not work on student lab)
5. Access will be granted by attending the Data Dashboard Training

Data Dashboard
“Overview” Tab 1. Click the drop down on Comparison Method: Spring to Spring, Fall to Fall, or all terms
2. Select term: Spring 2014
3. Select Campus: select Cañada College by unchecking the box.
4. Click “Begin Analysis”
5. Click on the black line in the headcount
6. Select Chart Dimension: Ethnicity
1
2
1
2
3
4
5
6
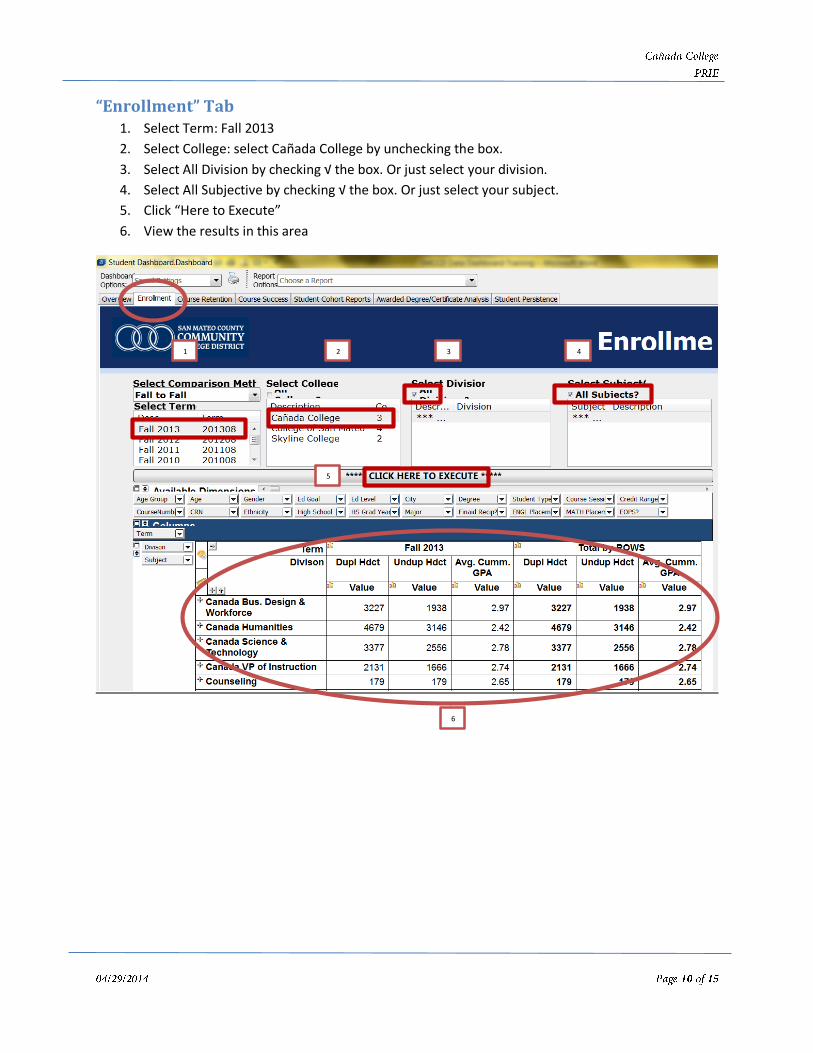
“Enrollment” Tab 1. Select Term: Fall 2013
2. Select College: select Cañada College by unchecking the box.
3. Select All Division by checking √ the box. Or just select your division.
4. Select All Subjective by checking √ the box. Or just select your subject.
5. Click “Here to Execute”
6. View the results in this area
1 2 3 4
5
6

“Retention” Tab 1. Select Term: Fall 2013
2. Select College: select Cañada College by unchecking the box.
3. Select Science and Technology Division.
4. Select All Subjective by checking √ the box. Or just select your subject.
5. Click “Here to Execute”
6. View the results in this area
7. Click the + sign to view more data
1 2 3 4
5
6

“Success” Tab 1. Select Term: Fall 2013
2. Select College: select Cañada College by unchecking the box.
3. Select Business, Design & Workforce Division.
4. Select All Subjective by checking √ the box. Or just select your subject.
5. Click “Here to Execute”
6. View the results in this area
7. Click the + sign to view more data
1 2 3 4
5
6

“Student Cohort Reports” Tab 1. Select Start Term: Fall 2010; End Term: Summer 2014
The rest keeps as is (Gender, Age Range, and Ethnicity)
2. Select College: select Cañada College by unchecking the box.
3. Course One:
Select Subject: ENGL; Select Course: ENGL 826; Section: as is; Click on “Show Column One”
4. Course Two:
Select Subject: ENGL; Select Course: ENGL 836; Section: as is; Click on “Show Column Two”
5. Course Three:
Select Subject: ENGL; Select Course: ENGL 100; Section: as is; Click on “Show Column Two”
6. Degrees & Certificates: Click on “Show Degree/Cert Data”
7. View the results in this area.
1 2
3 4 5
6
7
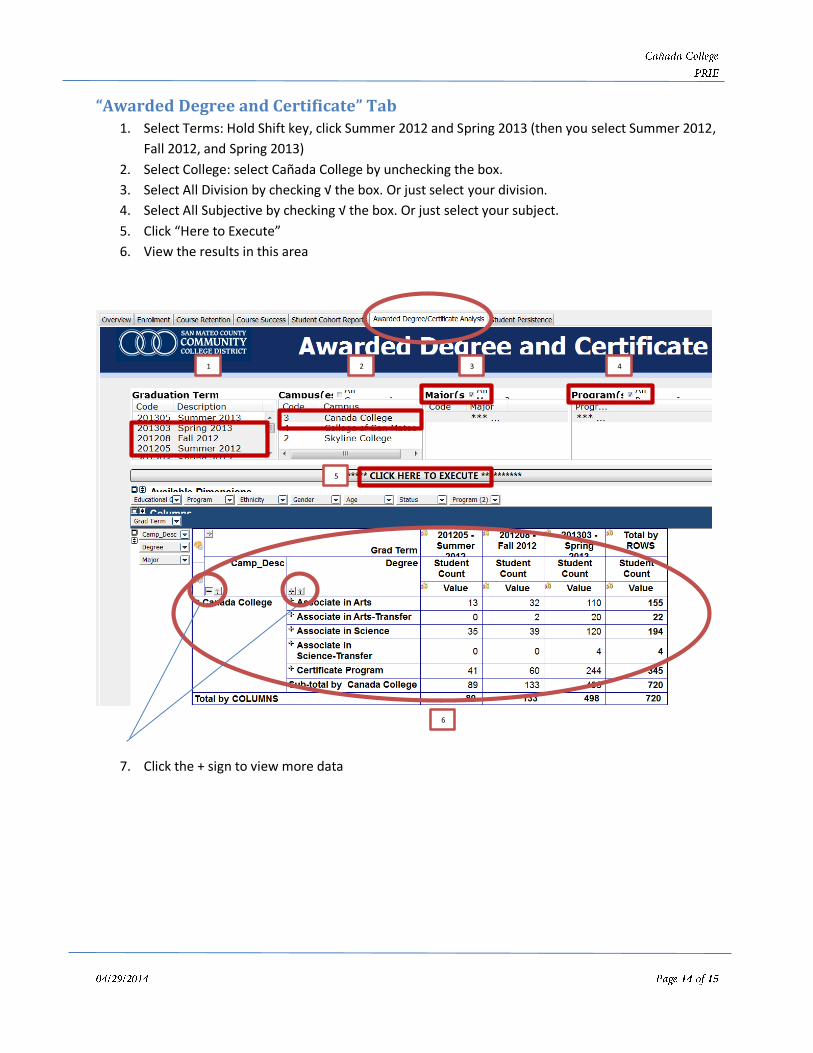
“Awarded Degree and Certificate” Tab 1. Select Terms: Hold Shift key, click Summer 2012 and Spring 2013 (then you select Summer 2012,
Fall 2012, and Spring 2013)
2. Select College: select Cañada College by unchecking the box.
3. Select All Division by checking √ the box. Or just select your division.
4. Select All Subjective by checking √ the box. Or just select your subject.
5. Click “Here to Execute”
6. View the results in this area
7. Click the + sign to view more data
1 2 3 4
5
6

“Student Persistence” Tab 1. Select Term one: Fall 2012; Select Term Two: Fall 2013
Set the Credit Cutoff as is.
2. Select College: select Cañada College by unchecking the box.
3. Select All Division by checking √ the box. Or just select your division.
4. Select All Subjective by checking √ the box. Or just select your subject.
5. Click “Here to Execute”
6. View the results in this area
1. Select Term one: Fall 2013; Select Term Two: Spring 2014
Set the Credit Cutoff as is.
2. The rest follow above steps (2 through 6).
1 2 3 4
5
6
1 2 3 4