AA GRI 2013
41
Annual Sustainability Report Fiscal Year 2013 (July 1, 2012 - June 30, 2013) Mastering the Art of Airports 2013
-
Upload
steven-p-shultz-ms -
Category
Documents
-
view
179 -
download
2
Transcript of AA GRI 2013

Annual Sustainability ReportFiscal Year 2013 (July 1, 2012 - June 30, 2013)
Mastering the Art of Airports
2013

SUSTAINABILITY REPORT
i.
Message From Our President/CEO 1
Message From Our Board Chair 3
Our Sustainability Story 4
Organizational Profile 6
Our Performance 8
Business Performance 8
Environmental Performance 10
Social Performance 15
Our Employees 15
Our Customers 17
Our Community 19
Our Reporting 23
GRI Index 24
Charts & Tables 30
Our Awards 38
Table of Contents
SUSTAINABILITY REPORTMESSAGE
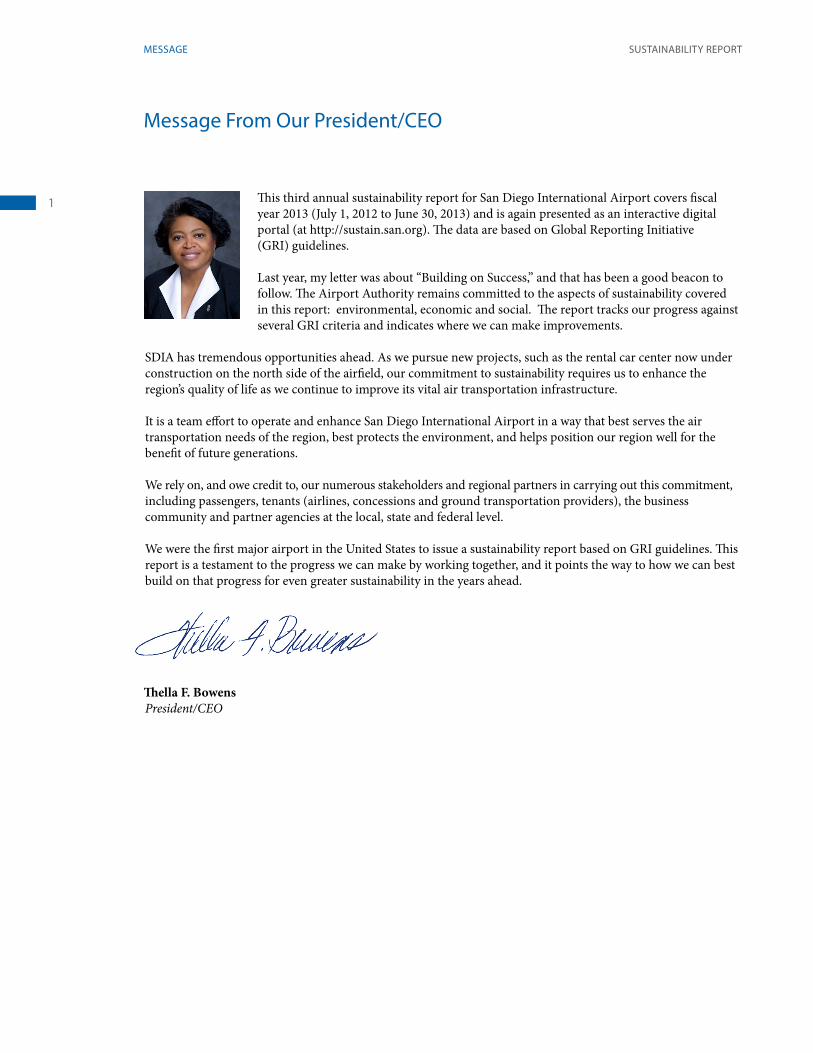
1 This third annual sustainability report for San Diego International Airport covers fiscal year 2013 (July 1, 2012 to June 30, 2013) and is again presented as an interactive digital portal (at http://sustain.san.org). The data are based on Global Reporting Initiative (GRI) guidelines.
Last year, my letter was about “Building on Success,” and that has been a good beacon to follow. The Airport Authority remains committed to the aspects of sustainability covered in this report: environmental, economic and social. The report tracks our progress against several GRI criteria and indicates where we can make improvements.
SDIA has tremendous opportunities ahead. As we pursue new projects, such as the rental car center now under construction on the north side of the airfield, our commitment to sustainability requires us to enhance the region’s quality of life as we continue to improve its vital air transportation infrastructure.
It is a team effort to operate and enhance San Diego International Airport in a way that best serves the air transportation needs of the region, best protects the environment, and helps position our region well for the benefit of future generations.
We rely on, and owe credit to, our numerous stakeholders and regional partners in carrying out this commitment, including passengers, tenants (airlines, concessions and ground transportation providers), the business community and partner agencies at the local, state and federal level.
We were the first major airport in the United States to issue a sustainability report based on GRI guidelines. This report is a testament to the progress we can make by working together, and it points the way to how we can best build on that progress for even greater sustainability in the years ahead.
Thella F. BowensPresident/CEO
Message From Our President/CEO

SUSTAINABILITY REPORTMESSAGE
3 Welcome to our third annual sustainability report, covering fiscal year 2013. I’m pleased to report that the cumulative effect of many individual efforts in the areas of social, environmental and financial sustainability is profound.
The fiscal year was dominated by construction activity related to The Green Build Terminal 2 expansion project, the largest construction project in the history of San Diego Interna-tional Airport. As The Green Build neared completion, it rose as a powerful symbol of the Airport Authority’s commitment to sustainability. On the environmental front, it was designed from start to finish to achieve LEED (Leadership in Energy and Environmental
Design) certification of at least the silver level.
The Airport Authority used The Green Build to enhance social and economic sustainability in the region, with a strong focus on involving local and small businesses in the project. At peak construction, the project generated 1,000 jobs on site. And out of $467.5 million in Green Build construction opportunities, $415.2 million (88.8%) went to local businesses, while $117.6 million went to small businesses and $57.5 million went to historically unrepresented businesses.
On the financial front, in FY 2013 we made progress in keeping The Green Build on schedule and under budget. In fact, at completion the project came in on time and $45 million under budget. Also in FY 2013, the second bond sale for The Green Build obtained a favorable 3.92% interest rate, which is expected to bring big savings over the 30-year life of the bonds.
This fiscal prudence had ripple effects, including maximizing the Airport Authority’s financial reserves, reducing borrowing costs, and allowing us to proceed with this important project even in a down economy—creating jobs and economic benefit when the region needed those most.
The self-sufficient nature of airport finances contributes to the financial sustainability of the Airport Authority. With no direct taxing authority and diminishing funding from Federal sources such as the FAA, our revenues instead come from money earned at the airport – from fees paid by our tenants (airlines, concessions, ground transportation providers) and travelers. These earnings are then reinvested at SDIA for ongoing airport improvements. In other words, we don’t make a profit – we make a better airport.
Our commitment to sustainability is evident in all we do at the Airport Authority. In 2012, we became the first airport in the country to issue an annual sustainability report based on Global Reporting Initiative standards, and with this year’s report we are proud to once again track our performance against those standards. As stated in our mission statement, we must – and will – continue to operate in a manner that promotes the region’s prosperity and protects its quality of life.
Robert H. GleasonBoard Chair
Message From Our Board Chair

SUSTAINABILITY REPORTOUR SUSTAINABILITY STORY
4
Our Sustainability Story
Sustainability to us is a straightforward directive: operate San Diego International Airport (SDIA) in a way that serves the needs of our customers and region both today and in the future.
Spend some time at SDIA and what comes into view is a bustling facility and a team of professionals guided by a deep commitment to sustainability across all our operations.
In 2012, we became the first major airport in the United States to publish an annual sustainability report based on the guidelines of the Global Report-ing Initiative (GRI). Our fiscal year 2011 report, published on June 26, 2012 and covering July 1, 2010–June 30, 2011, made a commitment to continue reporting and furthering sustainability efforts at SDIA. We are building on that commitment in what is now our third report covering fiscal year 2013 (July 1, 2012–June 30, 2013).
We have again focused the report on three categories of precious resources central to the GRI process:
• Economic resources we depend on to stay in business • Environmental resources we depend on to live • Social resources we depend on to thrive, including: – Employee resources we depend on to function – Community resources we depend on for
mutual benefit – Customer resources we depend on to support
us as we serve them
The Airport Authority works to sustain these fundamental resources through the pursuit of five organizational strategies:
• Enhance the financial position of the Airport Authority
• Operate our airport in a safe, secure, environ-mentally sound, effective and efficient manner
• Achieve the highest level of internal and external customer satisfaction
• Be a trusted and highly responsive regional agency
• Ensure the highest level of employee satisfaction
In this and future sustainability reports, you will see how we are addressing each of these areas and moving toward a more sustainable future for SDIA.
In times past, many organizations used precious resources without a sense of limits, without keen knowledge that those resources could be jeopardized or even lost. It’s a new world today, a closer, more interconnected world with an acute sense of limits and strains on many of our resources. Doing busi-ness today is not about depleting resources, or even minimizing the rate at which they are depleted. Doing business today is about sustaining resources.
In several areas, we have made great progress. In oth-ers, there is room to do more.
Airports help make our world smaller—more inter-connected. In doing so, it is our belief that airports also have a great responsibility to respect precious resources…and to be increasingly more sustainable.

SUSTAINABILITY REPORT
5
OUR SUSTAINABILITY STORY
Spotlight On: Sustainability PolicyThe Airport Authority adopted one of the first sus-tainability policies for a major airport in the U.S. This formalized the Airport Authority’s commitment to an environmentally sustainable future for the airport and the region. The policy in full:
Adopted by Resolution No. 2008-0013 dated February 7, 2008
Sustainability has emerged as a global environmental theme and a major business imperative for the 21st Century, dramatically influencing regional thinking and policy making. It is essential for the Airport Au-thority to become a known benchmark and respected role model for best sustainable practices in the San Diego region and the aviation industry. Sustainabil-ity is consistent with and vigorously reinforces the Airport Authority’s Mission Statement: to operate San Diego’s air transportation gateways in a manner that promotes the region’s prosperity and protects its quality of life.
The Board recognizes the need for the Airport Au-thority to be a sustainable organization and endorses the four sustainability elements of Economic Viability (E), Operational Excellence (O), Natural Resource Conservation (N) and Social Responsibility (S) (EONS) to guide and implement the Airport Author-ity’s sustainable practices. These four elements have been put forth within the aviation industry as the core precepts for a holistic approach to airport sustainabil-ity. Incorporating the EONS elements into the Airport Authority’s business practices, policies and programs will ensure sustainability is fully deployed across the Airport Authority’s operational and business func-tions.
By setting forth this policy, the Board commits the Airport Authority to these sustainable practices:
(1) Affirm commitment to regulatory compliance, pollution prevention, continuous improvement and transparency in environmental perfor-mance
(2) Actively participate in local and regional sus-tainability partnerships and strongly encourage and promote sustainable practices both in the aviation industry and the region
(3) Review and evaluate all new programs and projects in terms of addressing all four Sustain-ability Elements (EONS), in a balanced, holistic and measurable approach
(4) Analyze the life cycle operating costs and im-pacts of our facilities, operations and services, using a Total Cost of Ownership approach to determine project feasibility and economic sustainability
(5) Adopt the standards set forth by the United States Green Building Council (USGBC); Leadership in Energy and Environmental Design (LEED) as guiding criteria for achiev-ing sustainable design in the development and remodeling of airport facilities
(6) Apply EONS and LEED criteria as a significant factor when reviewing tenant development/re-development projects and provide incentives to encourage sustainable design features
(7) Develop language within all new leases, agree-ments and contracts that supports the Airport Authority’s sustainability initiatives
(8) Require the Airport Authority’s lessees and con-tractors to comply with the terms and condi-tions of their agreements pertaining to sustain-ability
(9) Establish a work environment that maximizes our employee assets and stimulates an atmo-sphere of innovation, productivity, pride, and a personal commitment to sustainability
(10) Take a leadership role in sustainability initia-tives that strengthen the social well-being and community relationships with visitors, airport stakeholders and the public we serve.

SUSTAINABILITY REPORTOUR SUSTAINABILITY STORY
6
Organizational Profile
About San Diego County Regional Airport AuthorityThe San Diego County Regional Airport Authority was created on January 1, 2003, as an independent agency to manage the day-to-day operations of San Diego International Airport and address the region’s long-term air transportation needs.
The legislation that created the Airport Authority mandates three main responsibilities:
• Operate San Diego International Airport• Plan for the future air transportation needs
of the region• Serve as the region’s Airport Land Use Commis-
sion—and ensure the adoption of land use plans that protect public health and safety surrounding all 16 of the county’s airports
The Airport Authority is governed by an appointed Board of nine voting members (eight male members and one female member in FY 2013) with three ad-ditional non-voting members serving ex-officio (two male members and one female member in FY 2013) who represent all areas of San Diego County. Three members serve as the Executive Committee. The Board regularly convenes on matters connected to
its state-mandated mission to effectively manage and operate San Diego International Airport and address the region’s long-term air transportation needs.
Several standing committees of the Board have been formed to better address key policy areas and develop items for consideration by the full Board. They also hold regular public meetings and include:
• Executive Committee• Executive Personnel and Compensation
Committee• Finance Committee• Audit Committee• Capital Improvement Program Oversight
Committee
In FY 2013, President/CEO Thella F. Bowens was responsible for management oversight of the Airport Authority, the annual budget and a staff of ap-proximately 346 aviation professionals. The Airport Authority Board Chair does not serve as an executive officer within the organization’s management.
During the reporting period there have been no significant changes regarding the size, structure or ownership of San Diego County Regional Airport Authority or San Diego International Airport.

SUSTAINABILITY REPORTOUR SUSTAINABILITY STORY
7
About San Diego International AirportFor more than 80 years, San Diego International Air-port has served the air transportation needs of the San Diego region. The airport’s total operation sits on 661 acres just two miles northwest of San Diego’s thriving downtown. Its ocean-close location on Harbor Drive is roughly bounded by Interstate 5 to the east, Liberty Station to the west, Marine Corps Recruit Depot to the north and San Diego Bay to the south. The airport has a single primary runway, which is 9,401 feet long. On average, 40,000–50,000 passengers a day pass through the airport, which accommodates more than 500 daily arrivals and departures, the vast majority of which are for passenger service.
In fiscal year 2013, 20 passenger carriers and three cargo carriers served the airport, which had 41 gates for jet aircraft in Terminals 1 and 2 and four gates for regional planes in the Commuter Terminal.
Southwest Airlines, the largest carrier, accounted for approximately 37 percent of the passenger volume in fiscal year 2013.

SUSTAINABILITY REPORTOUR BUSINESS PERFORMANCE
8
Our Business Performance
Our Goal: Enhance the Financial Position of the Airport Authority
Many San Diegans are unaware of what it takes to keep SDIA serving the region as an economic pow-erhouse, generating jobs and billions of dollars in annual economic benefit. Like all commercial airports in the U.S., SDIA is different than most transportation infrastructure, where the majority of investments are funded by taxpayer dollars.
Rather, America’s airports are largely self-sustaining and do not drain precious local tax dollars away from other important government services. SDIA is largely funded by those who use it. The vast majority of its revenues come from:
• Fees paid by passengers using SDIA, including Passenger Facility Charges paid when passengers buy airline tickets
• Landing fees, space rental fees and security charges paid by the airlines serving SDIA
• Parking charges • Sales of food, goods and services (such as shoe
shine and currency exchange) at the airport
Like all commercial airports in the U.S., SDIA also receives some revenues from the following sources:
• Federal funding – In the form of grants that help pay for airport construction and others projects.
• Bond financing – Major improvement projects at SDIA are funded with bonds repaid from user fees listed above. For example, The Green Build improvements at SDIA were financed through two bond offerings. Fortunately, due to prudent financial management by the Airport Authority and market conditions, these bond offerings gar-nered exceptionally low interest rates, saving tens of millions of dollars. In 2010, the largest bond sale in SDIA’s history —$572.6 million—secured an interest rate of 4.38 percent. Such a favor-able interest rate is projected to save more than $40 million dollars over the 30-year term of the bonds.
Spotlight On: Evolving Models of Airport Funding
In these recent years of economic uncertainty, budgets have tightened at all levels of government and the airline industry has continued to struggle toward profitability. This means traditional funding sources for SDIA have become more unpredictable. Prudent financial management, therefore, requires the Airport Authority to be on the lookout for new and enhanced ways to generate revenue and reinforce the airport’s self-sufficiency.
That includes more revenue from expanded parking facilities and more concessions, as well as new air service. It also includes innovative development and management approaches like funding by third-party developers. This allows construction of essential
Significant Financial Assistance Received from Government*
*Not reported in FY 2011.**FAA Airport Improvement Program***Transportation Security Administration
Type FY2012 FY 2013
Voluntary Airport Low Emis-sions Program (VALE)** $2.0 million $1.5 million
Airfield Improvements** $8.4 million $10.4 million
Quieter Home Program** $9.0 million $13.2 million
Law Enforcement Officer (LEO) Reimbursement*** $197,000 $292,000
Baggage Handling System*** $7.8 million $3.8 million
Build America Bonds Rebate*** $5.0 million $4.8 million
Total $32.4 million $34 million

SUSTAINABILITY REPORT
9
OUR BUSINESS PERFORMANCE
Direct Economic Value Generated (Revenues) and Distributed (Expenses)
Revenues FY 2011 FY 2012 Restated*** FY 2013
Operating Revenues $144,006,851 $153,549,960 $177,497,814
Interest Income $6,408,130 $5,491,516 $4,140,068
Total Revenues $150,414,981 $159,041,476 $181,637,882
Expenses
Operating Costs $128,712,874 $126,464,767 $130,327,564
Employee Wages and Benefits $38,266,477 $37,236,513 $38,092,464
Interest Expense $4,392,903 $2,026,692 $16,530,425
Tax Payments to Government $0 $0 $0
Community Investments* $0 $0 $0
Total Expenses $171,372,254 $165,727,972 $184,950,453
Economic Value Retained* ($20,957,273) ($6,686,496) ($3,312,571)
Economic Value Retained (with other revenue sources and expenses**) $46,894,748 $58,633,211 $66,174,802
*Federal regulations require Federal Aviation Administration and Department of Transportation funds to airports to be used only for capital and operating costs of the airport, the local airport system and/or other facilities owned and operated by the airport that are directly related to the air transportation of passengers or cargo. However, the Airport Authority does support the community in several significant ways, including sponsorships for a variety of community organizations, an annual United Way employee fundraising drive and youth education programs, among other initiatives.
**Other revenues include passenger facility charges, customer facility charges, Quieter Home Program grant revenue and capital grant contributions. Other expenses include Quieter Home Program expenses.
***Restated during the year ended June 30, 2013, the Airport Authority implemented GASB Statement No. 65 early. As a result, the cumulative effect on beginning net position and the change in net position, as well as certain asset accounts and operating accounts, have been restated from previoiusly issued financial statements to reflect the Airport Authority’s write-off of unamortized debt insurance costs.
facilities without relying on SDIA’s bonding capacity or financial reserves.
There will likely be other innovations identified to generate the revenues SDIA needs. But as air-port funding models evolve, one thing will remain unchanged: the Airport Authority’s commitment to enhancing SDIA’s role as a largely self-sufficient economic powerhouse for the region.
Spotlight On: Major Bond Sale Receives Significantly Low Borrowing Cost
In fiscal year 2013, San Diego County Regional Air-port Authority completed a major bond sale for San Diego International Airport, issuing $379.6 million in Senior Airport Revenue Bonds. Proceeds provided the remaining debt funding necessary to complete The Green Build Terminal 2 expansion program and a variety of projects in the FY 2013 – FY 2017 Capital Improvement Program (CIP) for the airport.
The Airport Authority was able to secure a signifi-cantly low all-in borrowing cost of 3.92% for the bonds, which is a lower long-term rate than any other airport in the nation in the same rating class.
It is estimated that accessing the market at such a favorable interest rate will save the Airport Author-ity more than $71 million in reduced debt service cost over the 30-year term of the bonds, compared to forecast. The bond sale proved very popular, with strong demand from both retail and institutional investors; $58 million of the bonds were sold to retail investors, and 69 different institutional investors participated in the sale.
“Such favorable terms for this bond sale was good news for the Airport Authority and the region, and it’s the result of strong financial policies and manage-ment strategies,” said Thella F. Bowens, President and CEO of the Airport Authority. “Completion of bond funding strengthened our financial plan for The Green Build and our CIP, which benefit the entire region through jobs and economic investment.”
The bond sale’s favorable circumstances were due to several factors, including the Airport Authority’s careful timing of market entry for the sale, pricing during a time when rates were more attractive, and strong credit ratings for Airport Authority bonds from the nation’s top three ratings agencies: Fitch Ratings, Moody’s Investor Services and Standard & Poor’s.

SUSTAINABILITY REPORTOUR ENVIRONMENTAL PERFORMANCE
10
Our Environmental Performance
Our Goal: Operate Our Airport in a Safe, Secure, Environmentally Sound, Effective and Efficient Manner
The Airport Authority is committed to building and operating sustainably, and strives to protect the wide variety of natural resources that exist at the airport’s unique location on the shores of San Diego Bay. Here we look at our efforts in several important areas con-cerning our natural environment:
• Waste reduction and recycling • Water conservation • Energy conservation • Air quality • Sustainable building methods • Noise considerations
Waste Reduction and RecyclingEach day, we’re making strides to reduce the amount of waste generated at the airport, while increasing what is recycled. The airport implemented a single-stream recycling program in 2002. This directly con-tributed to an increase in recycled waste from 107 tons in 2002 to more than 1,052 tons in fiscal year 2013.
Reducing waste has also become part of our regular business operations. For instance:
• Recycled paper is used throughout the Airport Authority offices.
• Internal newsletters and most external news-letters—previously printed and mailed by the thousands—are now produced and distributed electronically.
• Annual reports are produced electronically.
The Airport Authority was named Recycler of the Year for the ninth time by the City of San Diego at the 21st Annual Waste Reduction and Recycling Awards in fiscal year 2013.
Water ConservationWater is a precious resource, especially in arid Southern California. We’ve taken important steps to reduce the airport’s water usage through measures including:
• Satellite water-tracking system – This state-of-the-art system collects and analyzes data from more than 18,000 weather stations to determine the airport’s watering needs. This saves approxi-mately nine million gallons of water each year.
• Xeriscaping – Environmentally friendly land-scaping is being used at the airport, including a variety of indigenous and drought-tolerant plants, shrubs and ground cover.
• Low-flow fixtures – Replacement of 1.5-gallon-per-flush urinals with 0.125-gallon-per-flush units saves approximately 15 million gallons of water annually.
Waste by TypeAll values listed in standard tons
FY 2011 FY 2012 FY 2013
Non-Hazardous 10,379 32,598 6,337
Hazardous* 80.2 173 213
Total 10,819.2 32,771 6,550
*All hazardous waste is handled by a certified hazardous waste contractor and disposed of in accordance with pertinent regulations.
Waste by Disposal MethodAll values listed in standard tons
Method FY 2011 FY 2012 FY 2013
Construction and Demo-lition Debris Recycling 5,150 27,276 1,199
Recycling 687 677 1,052
Landfill 4,902 4,645 4,086
Certified Hazardous Waste Disposal 80.2 173 213
Total Waste 10,819.2 32,771 6,550

SUSTAINABILITY REPORT
11
OUR ENVIRONMENTAL PERFORMANCE
In addition to water conservation, the airport has committed to preventing and reducing the discharge of polluted storm water into the surrounding environ-ment, especially given its location on the shore of San Diego Bay. The airport’s Storm Water Management Plan provides a roadmap for our efforts.
Energy ConservationThe airport is open 365 days a year, 24 hours a day, creating unique challenges as we seek to minimize the airport’s energy needs. Energy efficiency efforts include:
• Energy-efficient lighting has been installed in all operational areas of the airport, resulting in an-nual energy savings in excess of 2.3 million kWh, enough to power 300 homes for one year.
• Heating, ventilation and air conditioning (HVAC) systems in the terminals have been upgraded to reduce energy consumption.
• Escalators have been modernized to provide energy savings.
• Motion detector sensors have been installed in Airport Authority offices, so lights go off auto-matically.
Spotlight On: Energy Champion Recognition by San Diego Gas & Electric
The Airport Authority was honored by San Diego Gas & Electric (SDG&E) as an Energy Champion for its outstanding results in energy efficiency and conser-vation at the 8th Annual San Diego SDG&E Energy Showcase event. The Airport Authority worked with SDG&E to achieve savings of nearly 3.5 million kilo-watts of power in calendar year 2012.
Various sustainability initiatives at SDIA were highlighted for contributing to the energy savings, including:
Total Water WithdrawalWater drawn from the municipal water supply.
Represents increase of
26,504 m3/year over FY 2012.
*Note: Increase can be attributed to The Green Buildexpansion
FY 2011223,645 m3/year
FY 2012216,000 m3/year
FY 2013242,555 m3/year
12.3%
Shows reductions in energy requirements as a result of these initiatives.
Energy Saved Due to Conservation and E�ciency Improvements.
Initiatives to provide energy-e�cient or renewable energy based products and services
FY 201122,506 GJ
FY 201212,517 GJ
FY 201122,506 GJ
FY 20130 GJ
FY 2012612 GJ
Represents increase of
22,119.804 GJfrom the previous year.
*Most of the increase due to The Green Build
3614%*
39,399 GJ FY 2013
Reductions in Energy Requirements Due to Initiatives to Provide Energy-Efficient or Renewable Energy Based Products and Services
Energy Saved Due to Conservation and Efficiency Improvements
Shows reductions in energy requirements as a result of these initiatives.
Energy Saved Due to Conservation and E�ciency Improvements.
Initiatives to provide energy-e�cient or renewable energy based products and services
FY 201122,506 GJ
FY 201212,517 GJ
FY 201122,506 GJ
FY 20130 GJ
FY 2012612 GJ
Represents increase of
22,119.804 GJfrom the previous year.
*Most of the increase due to The Green Build
3614%*
39,399 GJ FY 2013

SUSTAINABILITY REPORT
12
OUR ENVIRONMENTAL PERFORMANCE
• Nearly $1 billion Green Build terminal expansion program, which sought a minimum of LEED® Silver certification from the United States Green Building Council
• 20 electric vehicle charging stations at SDIA • First LEED® Gold-certified airport Receiving &
Distribution Center in the world• Energy-saving LED airfield lights at the airport • Alternative-fuel Airport Authority vehicle fleet • Participation in SDG&E Retrocommissioning
(RCx) program to update older terminals and central plant at SDIA to enable performance on par with newly constructed Green Build facilities.
“We’re proud of the remarkable energy savings by our customers who have been recognized as En-ergy Champions this year,” said Caroline Winn, vice president of customer services for SDG&E. “The Airport Authority has set an excellent example that all SDG&E business customers can learn from to find new ways to save energy and money.”
Air QualityThe Airport Authority formally committed to reduc-ing greenhouse gas emissions at the airport in May 2008, entering into a landmark Memorandum of Understanding with the California Attorney General. Since that time, the Airport Authority has developed an Air Quality Management Plan, working closely with the Air Pollution Control District, County of San Diego, the California Air Resources Board and other local agencies to address air emissions. Some of the elements include:
• Fleet Conversions – Conversion to the use of zero or low emission fuels in all airport equipment, with the goal of complete conversion of all airside ground support equipment to alternative and cleaner fuels, including bio-diesel, compressed natural gas and electric, by 2015.
• Alternative-Fuel Vehicles Program – Conversion of Airport Authority fleet to alternative fuel by 2015. As of the end of fiscal year 2013, slightly more than one-third of the Airport Authority fleet was comprised of alternative fuel vehicles, including hy-brid, electric, compressed natural gas and dual-fuel vehicles. A new parking shuttle fleet, introduced in 2010, cut greenhouse gas emissions by 10 percent in fiscal year 2013.
• Ground Transportation Management Plan – Incentivizing conversion of all airport taxicabs and shuttles to electric, alternative fuel, hybrid or other non-polluting vehicles by 2017.
Spotlight On: Air Pollution Control Award for Green Taxi Initiative
San Diego International Airport’s “Green Taxi” initia-tive, made possible through a public-private partner-ship involving San Diego County Regional Airport Authority, the California Center for Sustainable Energy, Mossy Toyota, taxi operators and San Diego Metropolitan Transit System, won an Environmental Excellence Award from the Industrial Environmental Association (IEA).
Recognized in the category of “Air (Convention Pol-lutant Control),” the Green Taxi program launched in 2011 in an effort to bring hybrid vehicles to the taxi fleet serving the airport. The award was presented at IEA’s Annual Statewide Environmental Summit in San Diego.
In just one year, the Green Taxi program transitioned more than 30 percent of the airport’s taxi fleet to hybrids – 102 hybrids cabs out of approximately 300. The hybrid cabs represent a 64 percent reduction in greenhouse gas emissions over a Ford Crown Victo-ria, the typical taxi model. This initiative also repre-sents a total savings of $1.3 million in fuel costs each year, or an impressive $12,000/year for each hybrid taxi driver.
The partnership creates an incentive package to en-courage adoption of more fuel-efficient taxis through a combination of vehicle rebates, reduced taxi permit fees and a special financing and maintenance package.
We’ve had an overwhelmingly positive response to the program in just one year,” said Heather Shepard, program manager for California Center Sustainable Energy’s Airport Vehicle Rebate Program. “We an-ticipate that the program will continue to expand and bring more environmental benefits to the region.”

SUSTAINABILITY REPORT
13
OUR ENVIRONMENTAL PERFORMANCE
The California Center for Sustainable Energy ob-tained funding for the program from the state’s Reformulated Gasoline Settlement Fund to establish the rebate program to offset the higher purchase costs of hybrids.
Sustainable Building MethodsSustainability is at the heart of all new and planned construction at the airport.
In fiscal year 2013, the Airport Authority was in the final phase of the largest improvement program in the airport’s history—The Green Build—named in part for its sustainable features. The project was designed to achieve a minimum Leadership in Energy and Environmental Design (LEED) Silver certification, with the potential for Platinum, from the U.S. Green Building Council.
Through the end of fiscal year 2013, the construction team reused/recycled more than 54,000 tons of con-struction waste – more than 95 percent – diverting it from landfills. Design and construction incorporate “green” design principles, such as use of alternative energy sources, recycled materials and renewable resources, leading to decreased water usage and reduced energy consumption. Ninety-nine percent of construction material waste from the project is being recycled and reused on site.
The Airport Authority intends for all new construc-tion at the airport to be LEED-certified and includes that requirement in all relevant construction bid opportunities.
Spotlight On: LEED Gold for Receiving and Distribution Center – a World First
The Receiving and Distribution Center (RDC) at San Diego International Airport received LEED Gold certification from the United States Green Building Council (USGBC) for its wide range of sustainability features and benefits.
The RDC is the first newly built facility at SDIA to meet this level of environmental distinction and is the first LEED Gold-certified receiving and distribution facility in the world.
The RDC is a 23,000 square foot facility located on the north side of the airfield. Opened in December 2012, it is yet another example of the airport’s commitment to sustainability. The RDC helps reduce greenhouse gas emissions and water and energy consumption through a number of innovative measures.
Some of the RDC’s sustainable elements include:• Reducing delivery truck traffic on Harbor Drive
by 50-75 trips per day • Trucks delivering to the terminals are powered by
biodiesel created from recycled cooking oil from SDIA food & beverage operators
• Recycled construction waste – more than 95% of construction waste produced by the project was diverted from landfills via recycling or salvaging efforts
• Solar hot water system • Water-efficient plumbing utilizing 40% less
potable water
“This was a signature achievement for the RDC devel-oper and the Airport Authority,” said Thella F. Bow-ens, President/CEO of the Airport Authority. “We’re committed to incorporating significant sustainable features into each new construction project at SDIA and to working with airport partners to achieve the same level of commitment to sustainable building and operating practices. Recognition such as this helps raise awareness about the importance of utilizing green building principles.”
Funding for the RDC was made possible through a public-private partnership. This innovative model allowed the Airport Authority to acquire essential facilities without using its bonding capacity, as well as build the project more quickly than would have been possible using a traditional public works construction model. This was the first construction project in the airport’s history to utilize a public-private partner-ship. Project costs for the RDC were approximately $9.8 million. Noise ConsiderationsAirports create noise, and the airport has a depart-ment dedicated to reducing the impact of aircraft noise on the surrounding community. We do this through careful monitoring for compliance with local, state and federal regulations and through mitigation programs such as the Quieter Home Program, which sound-attenuates qualified homes in noise-impacted areas around the airport.

SUSTAINABILITY REPORT
14
OUR ENVIRONMENTAL PERFORMANCE
The airport has a curfew in place that restricts air-plane departures between the hours of 11:30 p.m. and 6:30 a.m. When a curfew violation occurs, the airport takes it seriously. Operators are required to appear before the Curfew Violation Review Panel, which de-cides whether or not the operator should be fined for the violation. Administrative fines range from $2,000 for the first violation to $10,000 for the third violation in a six-month compliance period. Fines are multi-plied by the number of violations during the previous six-month period, so the fines can escalate quickly for repeat violators.
In fiscal year 2013, 695 residents were living in areas affected by noise, a decrease of 19 percent over the prior year.
Spotlight On: Airport Noise Advisory Committee
The Airport Authority recognizes that neighbor-hoods surrounding the airport are affected by noise from aircraft operations. An Airport Noise Advisory
Committee, consisting of individuals from various organizations, residential areas and professional associations, was formed in 1981 under the San Diego Unified Port District, the previous operator of San Diego International Airport.
The committee—composed of 14 voting members—provides a forum for collaborative discussion of airport noise issues and other related matters. Committee members represent the following agencies, industries or interested groups:
• Commercial airline pilot • Military • Federal Aviation Administration • Greater Golden Hill Planning Board • Midway/Pacific Highway Corridor Community
Planning Group• Ocean Beach Planning Board • Peninsula Community Planning Board • Uptown Planners • City of San Diego • County of San Diego • At-large community member • Air carrier representative
Additionally, elected officials from the City, County and U.S. Congress (or their appointees) serve as ex-offi-cio (nonvoting) members of the committee, along with a representative of the Mission Beach Precise Planning Board.
People Residing in Areas Affected by Noise*
FY 2012 FY 2013
People 855 695
Decrease 11% 19%
*Not reported in FY 2011.

SUSTAINABILITY REPORTOUR SOCIAL PERFORMANCE
15
Our Social Performance
We measure our social performance as an organization in terms of three fundamental groups:
• Our employees• Our customers• Our community
Our EmployeesOur Goal: Ensure the Highest Level of Employee Satisfaction
Our employees are another precious resource with which we are entrusted; the airport wouldn’t exist without them. We always keep that top of mind, and constantly strive to maintain a positive work environ-ment that fosters personal growth and makes us an employer of choice.
Employee Health and SafetyThe health and safety of airport employees is im-portant to us. Healthy employees miss fewer days of work and have been shown to work more efficiently, contributing to the effectiveness of our organization.
The airport’s Wellness Program tries to make being healthy fun for employees. The program puts its focus on the top three chronic lifestyle issues: lack of exer-cise, poor diet and smoking.
In order to motivate employees to get involved, an incentive program awards points for every 30 minutes of continuous physical activity, completion of an an-nual physical and dental check-ups and volunteering in the community. Employees can then redeem their points for prizes. To make exercise convenient, we built an on-site fitness center where employees can engage in cardiovascular and strength training activi-ties during their workday.
Up to 25 percent of our workforce is represented on a formal Employee Safety Committee serving the entire Airport Authority (operating at the company level). The committee helps monitor and advise on occupa-tional health and safety programs.
In addition, the Airport Authority provides the following benefits to full-time employees:
• Life insurance • Health care • Disability/invalidity coverage • Maternity/paternity leave • Retirement provision • Family and medical leave
Training and DevelopmentEmployee training and development are critical to maintaining our position as a preferred employer and setting the stage for our talent to have long, successful careers at the Airport Authority.
Our career management program gives employees the opportunity to interview fellow employees who are currently in roles to which they aspire, so they can start to chart their path to success. The Airport Authority also hosts workshops throughout the year on topics such as how to update a resume and how to present oneself in an interview, so employees can pursue internal job openings and be competitive with outside applicants.
Following is a list of skills management and lifelong learning courses offered by the Airport Authority in fiscal year 2013.
1. Our Customer Story Strategic Engagement Learning Maps Sessions2. Leading at all Level Leadership Training Program
• Accountability• Fierce Conversations• Change Management• Innovation• Influencing Strategies• Managing Your Career• Political Acumen

SUSTAINABILITY REPORT
FY 2011 FY 2012 FY 2013
Male Female Total Male Female Total Male Female Total
Airport Authority
Employees
Full Time Permanent (indefinite)
207 145 352 208 154 362 197 149 346
Part-time permanent (indefinite)
0 0 0 0 0 0 0 0 0
Contract Workers
Full-time temporary
(fixed-term)277 84 321 1,479 43 1,522 3,564 43 3,607
Part-time temporary
(fixed-term)0 0 0 0 0 0 0 0 0
Total 444 229 673 1,687 197 1,884 3,761 192 3,953
Total Workforce by Employment and Contract Type*
16
OUR SOCIAL PERFORMANCE
3. SMART Goals Workshop4. Successful Program and Project Leadership Forum5. Office 2010 Training6. Beginning and Intermediate Spanish7. Career Management – Job Shadowing8. Project Management Training9. Lync Training10. Japan Airlines Training11. Mistake-Free Grammar & Proofreading Training12. WingSpan Journal Training – Performance
Management System13. Strategic Engagement Learning Maps Sessions
DiversityThe Airport Authority is committed to diversity in the workforce, and we view diversity as an integral part of our success.
We intermittently celebrate the diversity of our team with activities that honor and celebrate the cultural diversity of our employees. This is an ongoing focus area for the Airport Authority as we look toward the future. Employee EngagementEmployee engagement can make a big impact on the
effectiveness of an organization. Engagement refers to showing up for work not only physically but mentally, and bringing a commitment level to the job, generat-ing ideas and caring about the future direction of the business.
Mechanisms for employees to provide recommenda-tions or direction to the executive team and Airport Authority Board include annual employee perfor-mance reviews, monthly staff meetings, employee committee meetings and an ethics hotline and formal ethics reporting system.
Spotlight on: Airport Employees Pay it Forward
At the airport, we talk a lot about the importance of excellent customer service. But there are some stories that show just how seriously we take that commitment.
Take Mario Bagnasco. As an Airport Traffic Officer (ATO), Mario’s job is to facilitate the flow of traffic at the airport’s curb front, enforce parking codes and provide customer assistance. But he took that to the next level when a traveler arriving from India couldn’t get his debit card to work at an ATM.
FY 2011 FY 2012
Male 100% 100%
Female 100% 100%
*Includes only full-time employees.
Employees Receiving Regular Performance and Career Development Reviews*
Average Hours of Employee Training*
FY 2012 FY 2013
Hours** 8.69 8.25
*Not reported in FY 2011. Employee category N/A.**Does not include individual department trainings, conferences, online classes, seminars or any departmental training not run through the Authority’s Learning Management System.
*Increase in full-time temporary contract workers due to increase in contract staff related to The Green Build terminal development project.

SUSTAINABILITY REPORT
17
OUR SOCIAL PERFORMANCE
Mario let the passenger use his personal cell phone to call his bank, and when the passenger learned he couldn’t access his funds until the next day, Mario withdrew $100 from his own bank account and of-fered it to the passenger. This is just one reason why Mario was nominated to receive Employee of the Quarter. And as might have been expected, upon ac-cepting the award, Mario turned around and donated his award check to the United Way.
A different ATO stepped in to help Kyle, a young pas-senger who arrived at the airport to discover he had mistakenly booked his flight on the wrong day. He had no credit card, no cell phone and no cash, and his trip was three days away! When she learned of Kyle’s situation, the ATO gave him enough cash to cover a night’s hotel, dinner and shuttle to the hotel and back.
Kyle was safely reunited with his family the next day. They contacted the ATO, who would not accept reimbursement – she simply asked that Kyle and his mother pay it forward by assisting someone else in a time of need.
Now that’s taking customer service above and beyond the norm. Hats off to the airport’s caring and committed team!
Our CustomersOur Goal: Achieve the Highest Level of Internal and External Customer Satisfaction
Without customers, a business simply ceases to ex-ist, and most airports are self-sustaining business enterprises. Our customers are air travelers, airlines and those who serve them. They, too, are precious resources that, if unhappy, will take their business elsewhere. San Diego International Airport enjoys ex-ceptional customer satisfaction and mutually support-ive relationships with the airlines. Those sustain us!
Passenger SatisfactionThe airport takes customer satisfaction seriously, and we survey passengers in the terminals each quarter to see how we’re measuring up. Between 2008-2012,
we saw at least an 86 percent customer satisfaction rate, of which we’re extremely proud. But we’re always trying to improve! Even in the midst of all of the con-struction activity for The Green Build that potentially impacted travelers, our customer satisfaction rating only dipped slightly and was still much higher than most airports in the U.S.
Passenger AmenitiesTraveling can be stressful, but we want to make a pas-senger’s trip through the airport as easy and comfort-able as possible. We strive to do that through a wide variety of customer amenities ranging from flu shots to free Wi-Fi to rocking chairs to help soothe a weary traveler’s soul.
Spotlight On: Airport Ambassadors
Lost? Confused? Frazzled? Just look for a friendly face in a green polo shirt with “Airport Information” em-blazoned on the back. The airport’s Volunteer Airport Ambassadors—there are more than 350 of them— are trained to help passengers find their way at the airport. They can also provide courtesy cart service to the gates for passengers who need mobility assistance.
Customer Satisfaction Scores*
*The benchmark surveys were conducted quarterly by Phoenix Marketing International to assess customer satisfaction levels. A five-point scale was used where 1 is “very dissatisfied” and 5 is “very satisfied.” The following additional practices were also used to assess customer satisfaction:• Airport Service Quality Survey was conducted monthly in 200 airports
across 50 countries. The customer satisfaction scores compare other airports similar in size and scope
• Feedback from the Volunteer Airport Ambassadors program
FY 2011 FY 2012 FY 2013
Total 86% 86% 79%
Q1 (Jul.-Sep.) 87% 88% 79%
Q2 (Oct.-Dec.) 83% 87% 79%
Q3 (Jan.-Mar.) 85% 83% 77%
Q4 (Apr.-Jun.) 89% 86% 85%

SUSTAINABILITY REPORT
18
OUR SOCIAL PERFORMANCE
Airport Art San Diego County Regional Airport Authority recognizes the unique physical, social and economic contribution of the arts and culture. It is committed to the presentation and advancement of a wide variety of high quality art and culture programming that has ar-tistic merit, cultural interest and educational value; that positions the airport as a creative industry driver; and that promotes regional prosperity and quality of life. As such, the Authority Art Program policy earmarks for Board approval two percent of the amount of construc-tion costs of eligible projects in the Authority’s annual Capital Program and Airport Master Plan budgets to fund the Public Art Program.
The public art program is comprised of three compo-nents: temporary and rotating exhibits, public (perma-nent) art and a performance series, called “ă brève.”
Spotlight On: The Green Build Public Art
San Diego International Airport’s Green Build provides many amenities to passengers, but the airport is more than just a place to catch a plane. It’s the first thing people see when they land, or their last glimpse of the region as they leave. To that end, the Airport Authority has worked to ensure there is a positive atmosphere, and integrated vibrant artworks into the new expan-sion. During fiscal year 2013, the new art installations were well under way.
The Green Build public art budget was $6 million for new art commissions and $250,000 for a contingency that was used to move and store pieces from the Authority’s Legacy Collection during construction that were brought back and reinstalled (e.g., Sunlight Juxtaposed in the new ticket lobby).
The Green Build was a design/build project, so the Airport Authority brought artists onto the team at the beginning of the design/build process. This afforded a unique opportunity for the artists and architects to collaborate on building and design that would maxi-mize the reflection of the art installations.
Although the selected artists hail from around the world, much of the art at the airport focuses on the ideas of home and the San Diego environment. Those qualities in turn make the art unique to San Diego, and provide an atmosphere you won’t get anywhere else.
AirlinesSan Diego International Airport serves approximately 17-18 million passengers each year, with nonstop flights to 63 destinations as of the end of fiscal year 2013.
Connecting travelers to more nonstop destinations is one of our top priorities. In fiscal year 2013, the air-port introduced new flights to Japan, Mexico, Hawaii, Miami, Orlando, Boston, Portland, Colorado Springs, Boise, El Centro/Imperial, CA, Mammoth, CA, and Washington, DC.
New air service is critical to the region because of the economic benefit it brings. For instance, $2.3 billion is spent each year by visitors who arrive by air to San Diego. The estimated economic impact of our daily nonstop flight to London is $156 million annually. These flights mean real dollars to local businesses, and we are committed to expanding our air service.

SUSTAINABILITY REPORT
19
OUR SOCIAL PERFORMANCE
Spotlight On: Nonstop Destinations
International
Domestic
Our CommunityOur Goal: Be a Trusted and Highly Responsive Regional Agency
Every business needs to recognize that it is a commu-nity citizen and act accordingly. We know that com-munity goodwill is a precious resource…it is easily squandered and difficult to restore. We foster a strong relationship with the community that benefits from us through economic impact; that trusts us to provide safe access to the world; and whose support benefits us in so many ways.
Spotlight On: Airport’s Quieter Home Program Completes 2,000th Home
The San Diego County Regional Airport Authority and its Quieter Home Program (QHP) celebrated a major milestone in fiscal year 2013 with the renova-tion of their 2,000th home. The Quieter Home Pro-gram offers free sound attenuation for homes under the airport’s flight path, helping reduce the effects of airplane noise. QHP began its work in 2001 and is the largest single acoustic insulation program in the United States.
As of the end of fiscal year 2013, the Airport Au-thority has helped to reduce aircraft noise for 2,849 homeowners as a result of this program. All funding is provided by the FAA and the Airport Authority.
Community InvolvementThe airport is an integral part of the community, and we are involved in a wide range of community programs, groups and activities. Our employees are members of community and business organizations, and serve on local boards of directors and committees for various nonprofits.
1. Albuquerque, NM2. Atlanta, GA3. Austin, TX4. Baltimore, MD5. Bellingham, WA6. Boise, ID 7. Boston, MA8. Charlotte-Douglas, NC9. Chicago-Midway, IL10. Chicago-O’Hare, IL11. Cincinnati, OH/ Covington, KY12. Cleveland, OH13. Colorado Springs, CO14. Dallas/Fort Worth, TX15. Denver, CO16. Detroit, MI17. El Centro/Imperial, CA18. El Paso, TX19. Fresno, CA20. Honolulu/Oahu, HI21. Houston-Hobby, TX22. Houston-Interconti- nental, TX23. Kahului/Maui, HI24. Kansas City, MO25. Kauai, HI26. Las Vegas, NV
27. Los Angeles, CA28. Mammoth Lakes, CA29. Miami, FL30. Milwaukee, WI31. Minneapolis/St. Paul, MN32. Monterey, CA33. Nashville, TN34. New York-JFK, NY35. Newark, NJ36. Oakland, CA37. Omaha, NE38. Orlando, FL 39. Philadelphia, PA40. Phoenix, AZ41. Portland, OR42. Reno, NV43. Sacramento, CA44. Salt Lake City, UT45. San Antonio, TX46. San Francisco, CA47. San Jose Cabo, MX48. San Jose, CA49. Santa Rosa, CA50. eattle/Tacoma, WA51. St. Louis, MO52. Tucson, AZ53. Washington-Dulles, VA54. Washington-Reagan
1. Calgary, Canada 2. Guadalajara, Mexico 3. London-Heathrow, England 4. Los Cabos, Mexico5. Mexico City, Mexico
6. Puerto Vallarta, Mexico 7. Tokyo, Japan8. Toronto, Canada 9. Vancouver, Canada

SUSTAINABILITY REPORTSECTION TITLE
20
One of our passions is aviation education and helping children and young adults learn about the airport and how it works. We host a number of children’s tours throughout the year.
Spotlight On: Aviation Career Day
The San Diego County Regional Airport Authority hosted Project LIFT in fiscal year 2013, an Aviation Career Day at San Diego International Airport. Proj-ect LIFT—Leaders Inspiring Future Talent—was part of the Airport Minority Advisory Council (AMAC) 29th Annual Business Diversity Conference, which took place in San Diego June 8–11, 2013.
Project LIFT exposes high school and college stu-dents to aviation-related professionals, who compete for airport contracts, and design, build and operate the nation’s airports. Students heard details of San Diego International Airport’s Green Build expansion, and what it takes to excel in the airport and aviation industries.
Speakers included AMAC board members and executive staff, Airport Authority personnel, conces-sionaires, architects and local business owners. This event is part of AMAC’s Educational and Scholarship Program, designed to encourage minority and female students to explore careers in airport contracting and aviation.
The Airport Authority partnered with AMAC and the Center for Applied Competitive Technology at San Diego City College to host students at the airport, the San Diego Air & Space Technology Center’s low-speed wind tunnel and Miramar College’s Aviation Program. The forums, mentoring sessions and tours are designed to diversify and strengthen the future workforce in that national pool of aviation professionals.
Students from the following local high schools and colleges attended the event:
• Chula Vista High School • Eastlake High School • El Cajon Valley High School • Gompers Preparatory Academy • Grossmont Community College • Grossmont Union High School • High Tech High School • La Jolla High School • Mount Miguel High School • Patrick Henry High School • Poway High School Monte • San Diego Early Middle College • San Diego State University • University of California, San Diego • Vista High School
Public OutreachCommunication with the public is an important aspect of what we do at the airport, and we take this responsibility seriously. From traditional tools such as news releases and media conferences to extensive use of social media, our public outreach programs are award-winning and have been shown to raise aware-ness about what is happening at the airport.
The Authority established and adheres to a published set of guidelines when working with the media. In addition, the Marketing and Public Relations Depart-ment ensures ethical standards in the communica-tions field are followed by its consultants with the following verbiage in Requests for Proposals: “Con-tractor agrees to assign only competent personnel to perform Services according to the reasonable and customary standards of training and experience in the relevant field.”
Stakeholder EngagementThe airport’s stakeholders are diverse and varied, ranging from residents to local government to other transportation agencies to business leaders. We engage with these stakeholders in many different ways. Airport Authority Board Members and staff regularly confer and collaborate with a wide range of stakeholders, selected on the basis of our experience and understanding of which stakeholders are most affected by our operation:
Public• General public• Traveling public• Passengers • Other airport users• Airport-adjacent residents

SUSTAINABILITY REPORT
21
OUR SOCIAL PERFORMANCE
Organizational• Airport Authority Board• Airport Authority executive management• Airport Authority staff • Airport employees• Labor Unions• Volunteer Airport Ambassadors
Public Participation Committees• Airport Authority Advisory Committee• Art Advisory Committee• Airport Land Use Compatibility Plan Technical
Advisory Group• Airport Noise Advisory Committee
Tenants• Airlines• Other airport tenants• Concessions• Fixed-base operator• Fuel farm operator• USO• Rental car operators
Community-Based Groups• Peninsula Community Planning Board• Mission Hills Town Council• Little Italy Association• Friends of Downtown• San Diego County Hotel-Motel Association• P3 People for Progress• USS Midway Museum• Catfish Club
Businesses• Local/regional chambers of commerce• Small business community• Business partners• Business community• World Trade Center San Diego• Tourism community• Research and development community• Airport-adjacent businesses
Environmental Interest Groups• Nonprofit environmental groups• Grassroots citizen groups• Local and regional groups
Government: Local/Regional • City of San Diego• Other San Diego County cities• San Diego Metropolitan Transit System• Port of San Diego• Harbor Police• San Diego Association of Governments• San Diego Regional Economic Development
Corporation• County of San Diego• North County Transit District• Local/regional elected officials
Government: State• State of California• California Coastal Commission• California Department of Transportation• Other state regulatory agencies• State elected officials
Government: Federal• Federal Aviation Administration• Transportation Security Administration• Other federal agencies• Federal legislative bodies• U.S. Military• U.S. Marine Corps• U.S. Navy• Military families• Federal elected officials
Stakeholder InputStakeholders and other members of the public are welcome to address the Airport Authority Board during the public comment period at any of its public meetings. All Board, Board Committee and Advisory Committee meetings are open to the public, with public comment periods. Airport Authority Board member contact information is also available on the website at www.san.org.
For all major development projects, the Airport Authority follows state and federal Environmental Impact Report and Environmental Impact Statement guidelines, which include extensive public comment and public participation requirements.

SUSTAINABILITY REPORT
22
OUR SOCIAL PERFORMANCE
Spotlight On: Airport Authority Advisory Committee
The San Diego County Regional Airport Authority Act calls for the Airport Authority to form a citizen’s advisory committee to assist the Airport Authority Board in its responsibilities specific to the planning and development of airport facilities at San Diego International Airport.
The purpose of the Authority Advisory Committee is to serve as a sounding board and catalyst for the development of recommendations to the Airport Authority Board on issues for which the Airport Au-thority is responsible.
Other opportunities for stakeholders to provide rec-ommendations to the Airport Authority are through public tours, which allow the public the opportunity to interact with staff, and social media (i.e., Facebook and Twitter), which enable comments from the public and dialogue between the Airport Authority and the public.
Small Business DevelopmentSustainability at the airport is about more than just us. It’s also about the community and creating ways to support the growth of the San Diego region. The airport’s Small Business Development Department was created to ensure that local, small, historically underutilized, disabled veteran and emerging busi-nesses have every opportunity to do business with the airport.
In doing that, our aim has been to create an ongoing cycle of sustainability. By providing small and local businesses with opportunities to win contracts at the airport, we sustain them through payment for their work, and they in turn provide us with needed ser-vices to operate and sustain our business. Both parties provide jobs for local employees, who then purchase goods to support other local businesses. The cycle is ongoing.
Spotlight On: National Award for Work with Disadvantaged Business Enterprises
The San Diego County Regional Airport Authority was awarded the Airport Architectural, Engineering and Construction Award for The Green Build at the Airport Minority Advisory Council Awards during the council’s annual Airport Business Diversity Con-ference in fiscal year 2013.
The Airport Architectural, Engineering and Con-struction Award honors airports that have heavily involved Disadvantaged Business Enterprises for two or more years in an architectural, engineering or construction project.
“The Airport Authority Board is a big proponent of supporting the region’s small, local and underrepre-sented businesses, and has made this commitment a priority throughout The Green Build,” said Thella F. Bowens, President/CEO of the San Diego County Regional Airport Authority. “The Airport Authority has worked closely with its contractors to successfully enable participation of historically underrepresented businesses, and we’re extremely proud of the results.”
The Green Build created a role for 7,000 workers, including local, small, disadvantaged and minority-owned businesses. A positive outcome of the Air-port Authority’s aggressive small business outreach program was that more than $415 million in contracts were awarded to local businesses, with $118 million going to small businesses.
The Airport Authority maintains a website to make it easy for local and small businesses to register for upcoming contracting opportunities.

SUSTAINABILITY REPORTOUR REPORTING
23
Our Reporting
San Diego County Regional Airport Authority has consulted the Global Reporting Initiative’s (GRI) G3 guidelines in the production of this report. The index lists the economic, environmental and social criteria that the GRI guidelines suggest, as well as certain spe-cific criteria from the GRI Airport Operators Sector Supplement. The data contained in this report meets requirements for a GRI Level C rating. There are no changes or re-statements from previous reports.
Our BoundariesThe Airport Authority’s boundaries for the purposes of this sustainability report encompass the organiza-tion’s geographic jurisdiction (San Diego County) as determined by state law, as well as entities over which the Airport Authority exercises control or significant influence, both in and through its relationships with various entities. A summary of these boundaries fol-lows.
ControlThe San Diego County Regional Airport Authority exercises control over the Airport Authority and San Diego International Airport.
Significant InfluenceThe Airport Authority has significant influence over:
• Authority collective bargaining unit (union) • Airport retail tenants • Airport airline tenants • Airport cargo carrier tenants • Parking management service • Airport ground transportation service providers • Harbor Police Department • Aircraft rescue and firefighting/San Diego
Fire-Rescue Department • On-site services (e.g., janitorial, security) • Contractor and consultant services (e.g.,
construction, engineering, environmental, maintenance)
SUSTAINABILITY REPORTGRI INDEX
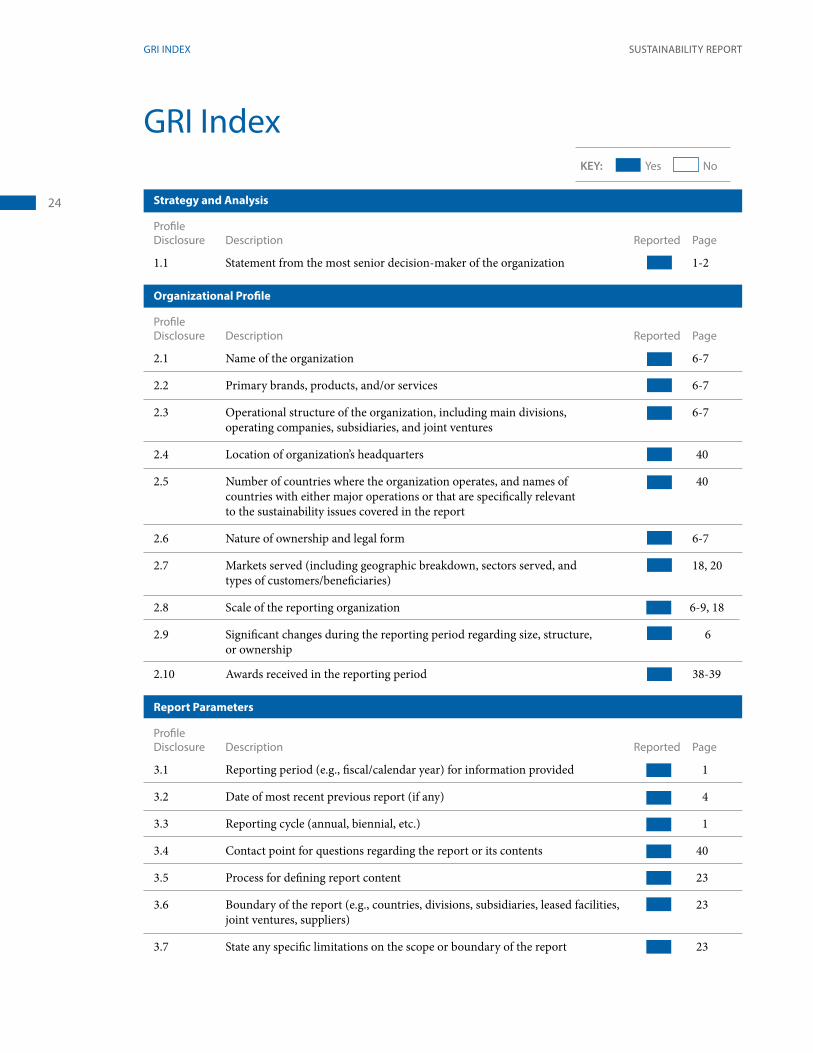
24 Strategy and Analysis
ProfileDisclosure Description Reported Page
1.1 Statement from the most senior decision-maker of the organization 1-2
Organizational Profile
ProfileDisclosure Description Reported Page
2.1 Name of the organization 6-7
2.2 Primary brands, products, and/or services 6-7
2.3 Operational structure of the organization, including main divisions, 6-7 operating companies, subsidiaries, and joint ventures
2.4 Location of organization’s headquarters 40
2.5 Number of countries where the organization operates, and names of 40 countries with either major operations or that are specifically relevant to the sustainability issues covered in the report
2.6 Nature of ownership and legal form 6-7
2.7 Markets served (including geographic breakdown, sectors served, and 18, 20 types of customers/beneficiaries)
2.8 Scale of the reporting organization 6-9, 18
2.9 Significant changes during the reporting period regarding size, structure, 6 or ownership
2.10 Awards received in the reporting period 38-39
Report Parameters
ProfileDisclosure Description Reported Page
3.1 Reporting period (e.g., fiscal/calendar year) for information provided 1
3.2 Date of most recent previous report (if any) 4
3.3 Reporting cycle (annual, biennial, etc.) 1
3.4 Contact point for questions regarding the report or its contents 40
3.5 Process for defining report content 23
3.6 Boundary of the report (e.g., countries, divisions, subsidiaries, leased facilities, 23 joint ventures, suppliers)
3.7 State any specific limitations on the scope or boundary of the report 23
YesKEY: No
GRI Index

SUSTAINABILITY REPORT
25
GRI INDEX
3.8 Basis for reporting on joint ventures, subsidiaries, leased facilities, 23 outsourced operations, and other entities that can significantly affect comparability from period to period and/or between organizations
3.10 Explanation of the effect of any re-statements of information provided in 23 earlier reports, and the reasons for such re-statement (e.g., mergers/acquisitions, change of base years/periods, nature of business, measurement methods)
3.11 Significant changes from previous reporting periods in the scope, boundary, 23 or measurement methods applied in the report
3.12 Table identifying the location of the Standard Disclosures in the report 24-25
Governance, Commitments, and Engagement
ProfileDisclosure Description Reported Page
4.1 Governance structure of the organization, including committees under the 6 highest governance body responsible for specific tasks, such as setting strategy or organizational oversight
4.2 Indicate whether the Chair of the highest governance body is also an 6 executive officer
4.3 For organizations that have a unitary board structure, state the number and 6 gender of members of the highest governance body that are independent and/or non-executive members
4.4 Mechanisms for shareholders and employees to provide recommendations or 15-21 direction to the highest governance body
4.14 List of stakeholder groups engaged by the organization 20-21
4.15 Basis for identification and selection of stakeholders with whom to engage 20-21
Economic Performance
PerformanceIndicator Description Reported Page
EC1 Direct economic value generated and distributed, including revenues, operating 9, 30 costs, employee compensation, donations and other community investments, retained earnings, and payments to capital providers and governments
EC2 Financial implications and other risks and opportunities for the organization’s activities due to climate change
EC3 Coverage of the organization’s defined benefit plan obligations
EC4 Significant financial assistance received from government 8, 30
EC5 Range of ratios of standard entry level wage by gender compared to local minimum wage at significant locations of operation
EC6 Policy, practices, and proportion of spending on locally-based suppliers at significant locations of operation
EC7 Procedures for local hiring and proportion of senior management hired from the local community at significant locations of operation
EC8 Development and impact of infrastructure investments and services provided primarily for public benefit through commercial, in-kind, or pro bono engagement
SUSTAINABILITY REPORT
26
GRI INDEX
EC9 Understanding and describing significant indirect economic impacts, including the extent of impacts
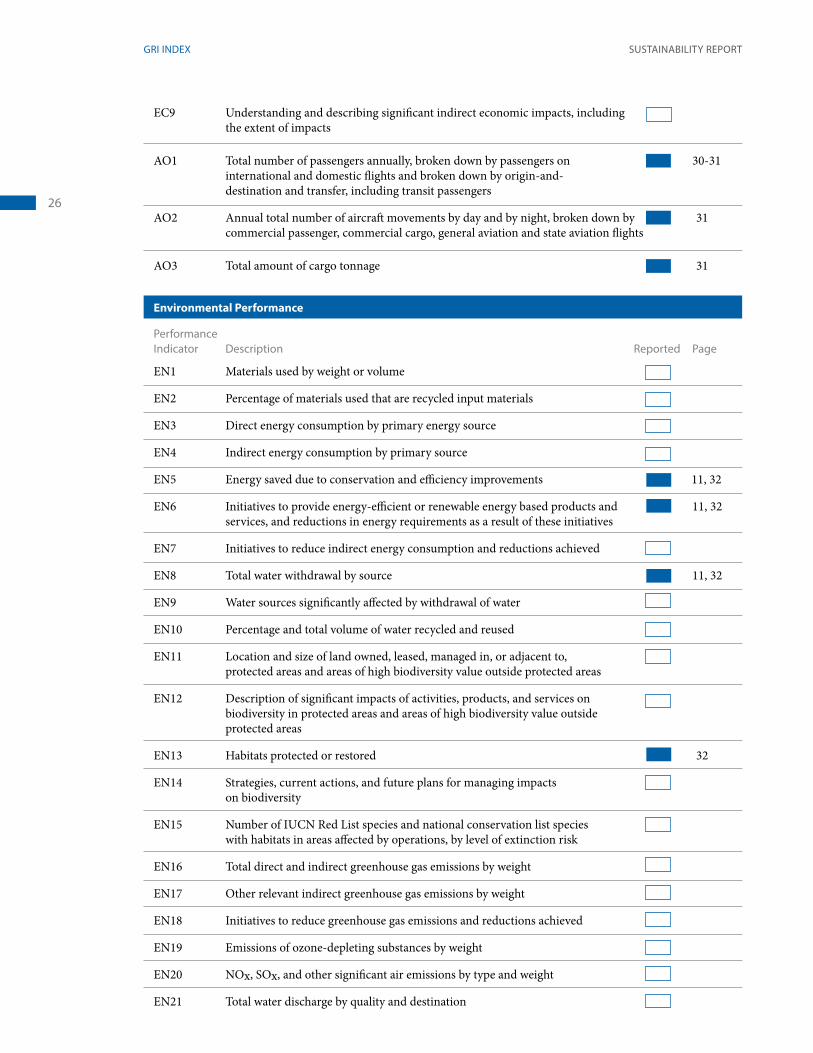
AO1 Total number of passengers annually, broken down by passengers on 30-31 international and domestic flights and broken down by origin-and- destination and transfer, including transit passengers
AO2 Annual total number of aircraft movements by day and by night, broken down by 31 commercial passenger, commercial cargo, general aviation and state aviation flights
AO3 Total amount of cargo tonnage 31
Environmental Performance
PerformanceIndicator Description Reported Page
EN1 Materials used by weight or volume
EN2 Percentage of materials used that are recycled input materials
EN3 Direct energy consumption by primary energy source
EN4 Indirect energy consumption by primary source
EN5 Energy saved due to conservation and efficiency improvements 11, 32
EN6 Initiatives to provide energy-efficient or renewable energy based products and 11, 32 services, and reductions in energy requirements as a result of these initiatives
EN7 Initiatives to reduce indirect energy consumption and reductions achieved
EN8 Total water withdrawal by source 11, 32
EN9 Water sources significantly affected by withdrawal of water
EN10 Percentage and total volume of water recycled and reused
EN11 Location and size of land owned, leased, managed in, or adjacent to, protected areas and areas of high biodiversity value outside protected areas
EN12 Description of significant impacts of activities, products, and services on biodiversity in protected areas and areas of high biodiversity value outside protected areas
EN13 Habitats protected or restored 32
EN14 Strategies, current actions, and future plans for managing impacts on biodiversity
EN15 Number of IUCN Red List species and national conservation list species with habitats in areas affected by operations, by level of extinction risk
EN16 Total direct and indirect greenhouse gas emissions by weight
EN17 Other relevant indirect greenhouse gas emissions by weight
EN18 Initiatives to reduce greenhouse gas emissions and reductions achieved
EN19 Emissions of ozone-depleting substances by weight
EN20 NOx, SOx, and other significant air emissions by type and weight
EN21 Total water discharge by quality and destination

SUSTAINABILITY REPORT
27
GRI INDEX
EN22 Total weight of waste by type and disposal method 10, 32
EN23 Total number and volume of significant spills 32
EN24 Weight of transported, imported, exported, or treated waste deemed hazardous under the terms of the Basel Convention Annex I, II, III, and VIII, and percentage of transported waste shipped internationally
EN25 Identity, size, protected status, and biodiversity value of water bodies and related habitats significantly affected by the reporting organization’s discharges of water and runoff
EN26 Initiatives to mitigate environmental impacts of products and services, and extent of impact mitigation
EN27 Percentage of products sold and their packaging materials that are reclaimed by category
EN28 Monetary value of significant fines and total number of non-monetary sanctions 33 for non-compliance with environmental laws and regulations EN29 Significant environmental impacts of transporting products and other goods and materials used for the organization’s operations, and transporting members of the workforce
EN30 Total environmental protection expenditures and investments by type
AO4 Quality of storm water by applicable regulatory standards 33
AO5 Ambient air quality levels according to pollutant concentrations in microgram per cubic meter (μg/m3) or parts per million (ppm) by regulatory regime
AO6 Aircraft and pavement de-icing/anti-icing fluid used and treated by m3 and/or 34 metric tonnes
AO7 Number and percentage change of people residing in areas affected by noise 14, 34
Social Performance
Performance Indicator Description Reported Page
LA1 Total workforce by employment type, employment contract, and region, broken 16, 34 down by gender
LA2 Total number and rate of employee turnover by age group, gender, and region 35
LA3 Benefits provided to full-time employees that are not provided to temporary 15 or part-time employees, by major operations
LA4 Percentage of employees covered by collective bargaining agreements 35
LA5 Minimum notice period(s) regarding significant operational changes, including whether it is specified in collective agreements
LA6 Percentage of total workforce represented in formal joint management-worker 15 health and safety committees that help monitor and advise on occupational health and safety programs
LA7 Rates of injury, occupational diseases, lost days, and absenteeism, and number 35 of work-related fatalities by region and by gender

SUSTAINABILITY REPORT
28
GRI INDEX
LA8 Education, training, counseling, prevention, and risk-control programs in place to assist workforce members, their families, or community members regarding serious diseases
LA9 Health and safety topics covered in formal agreements with trade unions
LA10 Average hours of training per year per employee by employee category 16, 36
LA11 Programs for skills management and lifelong learning that support the 15-16 continued employability of employees and assist them in managing career endings
LA12 Percentage of employees receiving regular performance and career development 16, 36 reviews, by gender
LA13 Composition of governance bodies and breakdown of employees per employee category according to gender, age group, minority group membership, and other indicators of diversity
LA14 Ratio of basic salary of women to men by employee category 36
LA15 Return to work and retention rates after parental leave, by gender
HR1 Percentage and total number of significant investment agreements and contracts that include clauses incorporating human rights concerns, or that have undergone human rights screening
HR2 Percentage of significant suppliers, contractors and other business partners that have undergone human rights screening, and actions taken
HR3 Total hours of employee training on policies and procedures concerning aspects of human rights that are relevant to operations, including the percentage of employees trained
HR4 Total number of incidents of discrimination and actions taken
HR5 Operations and significant suppliers identified in which the right to exercise freedom of association and collective bargaining may be violated or at significant risk, and actions taken to support these rights
HR6 Operations and significant suppliers identified as having significant risk for incidents of child labor, and measures taken to contribute to the effective abolition of child labor
HR7 Operations and significant suppliers identified as having significant risk for incidents of forced or compulsory labor, and measures to contribute to the elimination of all forms of forced or compulsory labor
HR8 Percentage of security personnel trained in the organization’s policies or 36 procedures concerning aspects of human rights that are relevant to operations
HR9 Total number of incidents of violations involving rights of indigenous people and actions taken
HR10 Percentage and total number of operations that have been subject to human rights reviews and/or impact assessments
HR11 Number of grievances related to human rights filed, addressed and resolved through formal grievance mechanisms
SO1 Nature, scope, and effectiveness of any programs and practices that assess and manage the impacts of operations on communities, including entering, operating, and exiting.

SUSTAINABILITY REPORT
29
GRI INDEX
SO2 Percentage and total number of business units analyzed for risks related to corruption
SO3 Percentage of employees trained in organization’s anti-corruption policies 36 and procedures
SO4 Actions taken in response to incidents of corruption 36
SO5 Public policy positions and participation in public policy development and lobbying
SO6 Total value of financial and in-kind contributions to political parties, 36 politicians, and related institutions by country
SO7 Total number of legal actions for anti-competitive behavior, anti-trust, and 37 monopoly practices and their outcomes
SO8 Monetary value of significant fines and total number of non-monetary 37 sanctions for non-compliance with laws and regulations
SO9 Operations with significant potential or actual negative impacts on local communities
SO10 Prevention and mitigation measures implemented in operations with significant potential or actual negative impacts on local communities
PR1 Life cycle stages in which health and safety impacts of products and services N/A are assessed for improvement, and percentage of significant products and services categories subject to such procedures
PR2 Total number of incidents of non-compliance with regulations and voluntary N/A codes concerning health and safety impacts of products and services during their life cycle, by type of outcomes
PR3 Type of product and service information required by procedures, and N/A percentage of significant products and services subject to such information requirements
PR4 Total number of incidents of non-compliance with regulations and voluntary N/A codes concerning product and service information and labeling, by type of outcomes
PR5 Practices related to customer satisfaction, including results of surveys 17, 37 measuring customer satisfaction
PR6 Programs for adherence to laws, standards, and voluntary codes related to 19 marketing communications, including advertising, promotion, and sponsorship
PR7 Total number of incidents of non-compliance with regulations and voluntary 37 codes concerning marketing communications, including advertising, promotion, and sponsorship by type of outcomes
PR8 Total number of substantiated complaints regarding breaches of customer privacy and losses of customer data
PR9 Monetary value of significant fines for non-compliance with laws and regulations concerning the provision and use of products and services
AO8 Number of persons physically or economically displaced, either voluntarily 37 or involuntarily, by the airport operator or on its behalf by a governmental or other entity, and compensation provided
AO9 Total annual number of wildlife strikes per 10,000 aircraft movements 37

SUSTAINABILITY REPORTCHARTS AND TABLES
30
Charts and Tables
Economic Performance
Passengers by Origin & Destination/Transfer*
FY 2011 FY 2012 FY 2013
Origin & Destination 16,023,558 16,161,485 16,184,146
Transfer 868,630 976,928 1,119,174
Total 16,892,188 17,138,413 17,303,320
* Arriving, departing and transit passengers not tracked.
Direct Economic Value Generated (Revenues) and Distributed (Expenses)
Revenues FY 2011 FY 2012*** FY 2013
Operating Revenues $144,006,851 $153,549,960 $177,497,814
Interest Income $6,408,130 $5,491,516 $4,140,068
Total Revenues $150,414,981 $159,041,476 $181,637,882
Expenses
Operating Costs $128,712,874 $126,464,767 $130,327,564
Employee Wages and Benefits $38,266,477 $37,236,513 $38,092,464
Interest Expense $4,392,903 $2,026,692 $16,530,425
Tax Payments to Government $0 $0 $0
Community Investments* $0 $0 $0
Total Expenses $171,372,254 $165,727,972 $184,950,453
Economic Value Retained* ($20,957,273) ($6,686,496) ($3,312,571)
Economic Value Retained (with other revenue sources and expenses**) $46,894,748 $58,633,211 $66,174,802
*Federal regulations require Federal Aviation Administration and Department of Transportation funds to airports to be used only for capital and operating costs of the airport, the local airport system and/or other facilities owned and operated by the airport that are directly related to the air transportation of passengers or cargo. However, the Airport Authority does support the community in several significant ways, including sponsorships for a variety of community organizations, an annual United Way employee fundraising drive and youth education programs, among other initiatives.
**Other revenues include passenger facility charges, customer facility charges, Quieter Home Program grant revenue and capital grant contributions. Other expenses include Quieter Home Program expenses.
***Restated during the year ended June 30, 2013, the Airport Authority implemented GASB Statement No. 65 early. As a result, the cumulative effect on beginning net position and the change in net position, as well as certain asset accounts and operating accounts, have been restated from previoiusly issued financial statements to reflect the Airport Authority’s write-off of unamortized debt insurance costs.
Type FY 2012 FY 2013
Voluntary Airport Low Emis-sions Program (VALE)** $2.0 million $1.5 million
Airfield Improvements** $8.4 million $10.4 million
Quieter Home Program** $9.0 million $13.2 million
Law Enforcement Officer (LEO) Reimbursement*** $197,000 $292,000
Baggage Handling System*** $7.8 million $3.8 million
Build America Bonds Rebate*** $5.0 million $4.8 million
Total $32.4 million $34.0 million
Significant Financial Assistance Received from Government*
*Not reported in FY 2011.**FAA Airport Improvement Program***Transportation Security Administration

SUSTAINABILITY REPORTCHARTS AND TABLES
31
Cargo TonnageAll values listed in metric tons
Domestic International Total
FY 2011 FY 2012 FY 2013 FY 2011 FY 2012 FY 2013 FY 2011 FY 2012 FY 2013
Cargo 101,377 121,692 132,398 2,195 4,413 6,362 103,572 126,105 138,760
Mail 15,109 15,722 13,692 N/A N/A N/A 15,109 15,722 13,692
Total 116,486 137,415 146,090 2,195 4,413 6,362 118,681 141,828 152,452
Annual Aircraft Movements*
Flight Category Day Night Total
FY 2011 FY 2012 FY 2013 FY 2011 FY 2012 FY 2013 FY 2011 FY 2012 FY 2013
Passenger 157,818 158,299 152,913 1,132 1,135 1,010 158,950 159,434 153,923
Cargo 5,408 5,378 22,361 1,044 1,038 911 6,452 6,416 23,272
General Aviation 19,038 10,119 9,560 ** ** ** 19,038 10,119 9,560
Military 702 657 567 ** ** ** 702 657 567
Total 182,966 174,453 185,401 2,176 2,173 1,921 185,142 176,626 187,322
*Day and night as defined by day = within departure curfew hours (6:30 a.m. – 11:30 p.m.) and night = outside departure curfew hours (11:30 p.m. – 6:30 a.m.)**Only the total is shown. Day and night were not tracked.
Passengers by International/Domestic
Domestic International Total
FY 2011 FY 2012 FY 2013 FY 2011 FY 2012 FY 2013 FY 2011 FY 2012 FY 2013
Arriving 8,237,311 8,296,206 8,460,959 212,265 266,732 276,658 8,449,576 8,562,938 8,737,617
Departing 8,247,416 8,323,734 8,425,210 195,196 251,741 278,141 8,442,612 8,575,475 8,703,351
Total 16,484,727 16,619,940 16,886,169 407,461 518,473 554,799 16,892,188 17,138,413 17,440,968

SUSTAINABILITY REPORT
32
CHARTS AND TABLES
Habitats Protected or RestoredValues listed in hectares*
Habitat FY 2011 FY 2012 FY 2013
Protected 8.19 8.19 8.19
Restored 0 0 0
* Hectare = 2.47 acres
*There have been some changes in the way the Airport Authority captures spill data. Numbers for FY 2012 are only for petroleum spills. In FY 2011, “trash” and other spills were included with petroleum. Going forward, pe-troleum spills are the types of “significant spills” which will be monitored. **Two separate fuel spills of 300 and 304 gallons represent 604 gallons of the total volume.
Significant Spills*
FY 2011 FY 2012 FY 2013
Number 68 36 63
Volume <47 gallons <66 gallons <663 gallons**
Waste by TypeAll values listed in standard tons
FY 2011 FY 2012 FY 2013
Non-Hazardous 10,379 32,598 6,337
Hazardous* 80.2 173 213
Total 10,819.2 32,771 6,550
*All hazardous waste is handled by a certified hazardous waste contractor and disposed of in accordance with pertinent regulations.
Waste by Disposal MethodAll values listed in standard tons
Method FY 2011 FY 2012 FY 2013
Construction and Demo-lition Debris Recycling 5,150 27,276 1,199
Recycling 687 677 1,052
Landfill 4,902 4,645 4,086
Certified Hazardous Waste Disposal 80.2 173 213
Total Waste 10,819.2 32,771 6,550
Environmental Performance
Energy Saved Due to Conservation and Efficiency Improvements
Shows reductions in energy requirements as a result of these initiatives.
Energy Saved Due to Conservation and E�ciency Improvements.
Initiatives to provide energy-e�cient or renewable energy based products and services
FY 201122,506 GJ
FY 201212,517 GJ
FY 201122,506 GJ
FY 20130 GJ
FY 2012612 GJ
Represents increase of
22,119.804 GJfrom the previous year.
*Most of the increase due to The Green Build
3614%*
39,399 GJ FY 2013
Reductions in Energy Requirements Due to Initiatives to Provide Energy-Efficient or Renewable Energy Based Products and Services
Water drawn from the municipal water supply.
Represents increase of
26,504 m3/year over FY 2012.
*Note: Increase can be attributed to The Green Buildexpansion
FY 2011223,645 m3/year
FY 2012216,000 m3/year
FY 2013242,555 m3/year
12.3%
Shows reductions in energy requirements as a result of these initiatives.
Energy Saved Due to Conservation and E�ciency Improvements.
Initiatives to provide energy-e�cient or renewable energy based products and services
FY 201122,506 GJ
FY 201212,517 GJ
FY 201122,506 GJ
FY 20130 GJ
FY 2012612 GJ
Represents increase of
22,119.804 GJfrom the previous year.
*Most of the increase due to The Green Build
3614%*
39,399 GJ FY 2013
Total Water Withdrawal

SUSTAINABILITY REPORTCHARTS AND TABLES
33
FY 2012 FY 2013
Monetary Value of Significant Fines $0 $0
Number of Non-monetary Sanctions 0 0
Monetary Value of Significant Fines and Total Number of Non-monetary Sanctions for Noncompliance with Environmental Laws and Regulations*
*Not reported in FY 2011.
Pollutant of Concern (units)
# Analy-
sesBench- mark Median Concentration* # of Exceedances
Exceedance Frequency (%)
FY 2011
FY 2012
FY 2013
FY 2011
FY 2012
FY 2013
FY 2011
FY 2012
FY 2013
Ammonia-N (mg/L) 20 2.14 1.20 1.98 4.48 2 9 17 10 45 85
BOD (mg/L) 20 30 1.20 21.6 74 0 7 14 0 35 70
COD (mg/L) 20 120 26.9 88 254 0 8 16 0 40 80
Specific Conductivity (μmhos/cm)
20 900 96.5 185.5 386 0 0 1 0 0 5
Oil & Grease (mg/L) 20 15 1 1.0 2.01 0 0 0 0 0 0
pH (pH unit) 20 6.0-9.0 7.19 6.77 6.4 0 0 0 0 0 0
TSS (mg/L) 20 100 6.5 9.5 60 0 0 4 0 0 20
Aluminum, Total (μg/L) 20 750 255 420 465 4 7 4 20 35 20
Copper, Total (μ/L) 20 14 49.5 155 346 20 20 20 100 100 100
Copper, Dissolved (μg/L) 20 14 21.5 120 267 13 18 19 65 90 95
Iron, Total (μg/L) 20 1,000 430 175 862 2 1 7 10 5 35
Lead, Total (μg/L) 20 82 2.15 3.95 7.8 0 0 0 0 0 0
Zinc, Total (μg/L) 20 120 78 330 534 6 16 18 30 80 90
Zinc, Dissolved (μg/L) 20 120 49.5 270 445 3 16 15 15 80 75
Ethylene Glycol (mg/L) 20 100 5 5 5 0 0 0 0 0 0
Quality of Storm Water by Applicable Regulatory Standards
* Half of the detection limit was used as the data point for statistical analysis of results that were not detected.
*Not reported in FY 2011.
People Residing in Areas Affected by Noise*
FY 2012 FY 2013
People 855 695
Decrease 11% 19%
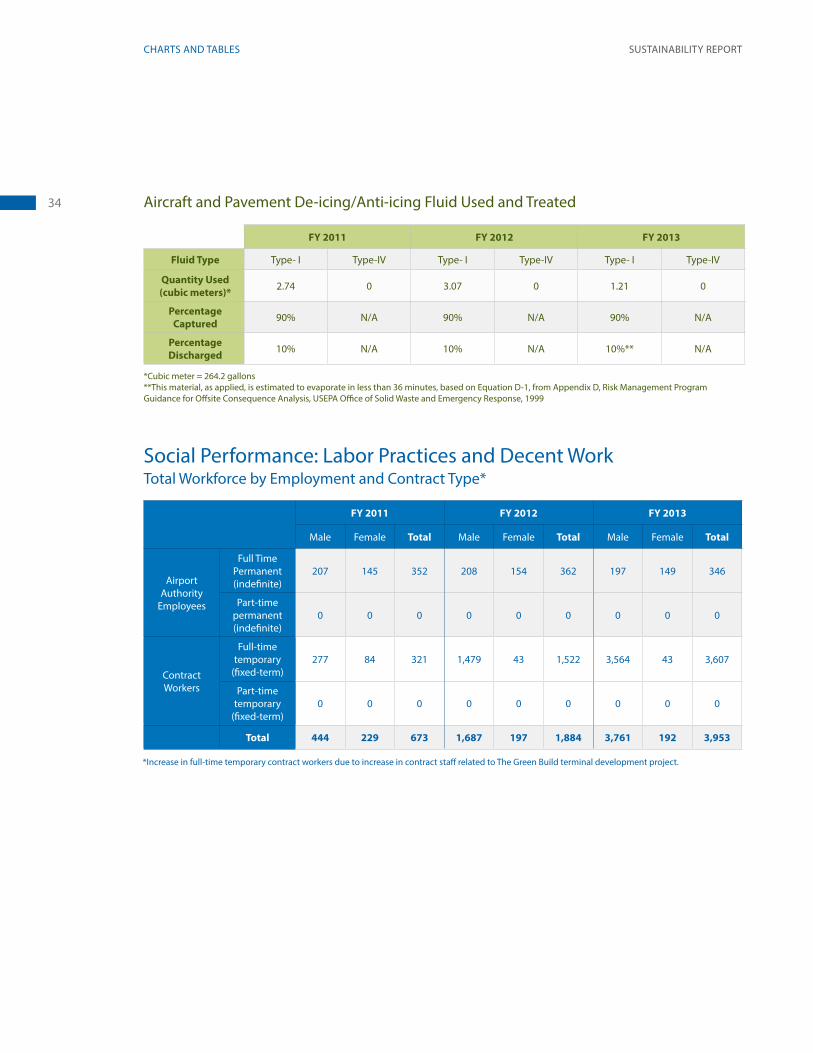
SUSTAINABILITY REPORTCHARTS AND TABLES
34 Aircraft and Pavement De-icing/Anti-icing Fluid Used and Treated
*Cubic meter = 264.2 gallons**This material, as applied, is estimated to evaporate in less than 36 minutes, based on Equation D-1, from Appendix D, Risk Management Program Guidance for Offsite Consequence Analysis, USEPA Office of Solid Waste and Emergency Response, 1999
FY 2011 FY 2012 FY 2013
Fluid Type Type- I Type-IV Type- I Type-IV Type- I Type-IV
Quantity Used (cubic meters)* 2.74 0 3.07 0 1.21 0
Percentage Captured 90% N/A 90% N/A 90% N/A
Percentage Discharged 10% N/A 10% N/A 10%** N/A
Social Performance: Labor Practices and Decent WorkTotal Workforce by Employment and Contract Type*
*Increase in full-time temporary contract workers due to increase in contract staff related to The Green Build terminal development project.
FY 2011 FY 2012 FY 2013
Male Female Total Male Female Total Male Female Total
Airport Authority
Employees
Full Time Permanent (indefinite)
207 145 352 208 154 362 197 149 346
Part-time permanent (indefinite)
0 0 0 0 0 0 0 0 0
Contract Workers
Full-time temporary
(fixed-term)277 84 321 1,479 43 1,522 3,564 43 3,607
Part-time temporary
(fixed-term)0 0 0 0 0 0 0 0 0
Total 444 229 673 1,687 197 1,884 3,761 192 3,953

SUSTAINABILITY REPORTSECTION TITLE
35 Total Workforce by Region
FY 2011 FY 2012 FY 2013
San Diego 673 1,884 3,039
Outside San Diego 0 0 914
Total 673 1,884 3,953
Employee Turnover by Age*
FY 2012 FY 2013
Age Number Rate Number Rate
<30 2 10% 0 0%
30-50 8 4.2% 9 5%
>50 8 4.6% 8 5%
*Not reported in FY 2011.
Employee Turnover by Gender*
FY 2012 FY 2013
Number Rate Number Rate
Male 12 5% 13 6.2%
Female 6 4% 4 1.5%
*Not reported in FY 2011.
Employee Turnover by Region*
FY 2012 FY 2013
Number Rate Number Rate
18 4.7% 17 6.2%
*Not reported in FY 2011. All employees based in San Diego.
Employees Covered by Collective Bargaining Agreements
FY 2011 FY 2012 FY 2013
Percentage 29% 27% 28%
Rates of Injury, Occupational Diseases, Lost Days and Absenteeism, and Number of Work-Related Fatalities*
FY 2011 FY 2012 FY 2013
Male Female Male Female Male Female
Injury Rate 2.105 2.631 1.578 2.104 1.459 2.104
Occupational Disease Rate 0 0 0 0 0 0
Lost Day Rate 0 .789 0 0 0 1.167
Absentee Rate N/A N/A N/A N/A N/A N/A
Work-Related Fatalities 0 0 0 0 0 0
*Calculated based on 200,000 hours worked. All employees are based in San Diego.

SUSTAINABILITY REPORTSECTION TITLE
36 Employees Receiving Regular Performance and Career Development Reviews*
FY 2011 FY 2012 FY 2013
Male 100% 100% 100%
Female 100% 100% 100%
*Includes only full-time employees.
Ratio of Basic Salary*
FY 2012 FY 2013
Male Female Male Female
Number Average Salary Number Average
Salary Ratio Number Average Salary Number Average
Salary Ratio
Employee 164 $66,404.82 137 $60,998.44 1.09 158 $68,504.42 133 $62,215.18 1.10
Manager 21 $105,951.16 9 $93,394.85 1.13 19 $107,382.36 8 $94,840.46 1.13
Director 17 $135,023.20 6 $142,107.93 0.95 14 $138,320.56 6 $147,539.85 0.94
VP/CEO 6 $195,305.49 2 $232,849.75 0.84 6 $184,609.69 2 $243,685.50 0.76
Total 208 154 197 149
*All employees are based in San Diego. Not reported in FY 2011. Excludes employees terminated in FY 2013
Social Performance: Human Rights
Social Performance: Society
Security Personnel Receiving Human Rights Training*
FY 2012 FY 2013
Percentage 22% 25%
*Not reported in FY 2011.
Employees Trained in Organization’s Anticorruption Policies and Procedures*
FY 2012 FY 2013
Percentage 10% 10%
*Ethics training reached 100% of employees in FY 2011. FY 2012 ethics training was provided to new hires and the executive team, President/CEO, General Counsel, Chief Auditor and Board Members.
Average Hours of Employee Training*
*Not reported in FY 2011. Employee category N/A.**Does not include individual department trainings, conferences, online classes, seminars or any departmental training not run through the Authority’s Learning Management System.
Financial and In-Kind Contributions to Political Parties, Politicians and Related Institutions*
FY 2012 FY 2013
Value $0 $0
*Not reported in FY 2011.
*Not reported in FY 2011.
Actions Taken in Response to Incidents of Corruption*
Actions FY 2012 FY 2013
Employees Dismissed or Disciplined for Corruption 0 0
Contracts with Business Partners Not Renewed Due to Violations Related
to Corruption0 0
Concluded Legal Cases Regarding Corrupt Practices Brought Against the
Organization or Its Employees 0 0
FY 2012 FY 2013
Hours** 8.69 8.25

SUSTAINABILITY REPORTSECTION TITLE
37
Social Performance: Product Responsibility
Customer Satisfaction Scores*
FY 2011 FY 2012 FY 2013
Total 86% 86% 81%
Q1 (Jul.-Sep.) 87% 88% 83%
Q2 (Oct.-Dec.) 83% 87% 86%
Q3 (Jan.-Mar.) 85% 83% 79%
Q4 (Apr.-Jun.) 89% 86% 75%
*The benchmark surveys were conducted quarterly by Phoenix Marketing International to assess customer satisfaction levels. A five-point scale was used where 1 is “very dissatisfied” and 5 is “very satisfied.” The following additional practices were also used to assess customer satisfaction:• Airport Service Quality Survey was conducted monthly in 200 airports
across 50 countries. The customer satisfaction scores compare other airports similar in size and scope
• Feedback from the Volunteer Airport Ambassadors program
FY 2012 FY 2013
Number of Incidents 0 0
Outcome N/A N/A
Incidents of Non-Compliance with Regulations and Voluntary Codes Concerning Marketing Communications*
*Not reported in FY 2011.
FY 2012 FY 2013
Number 0 0
Compensation Provided N/A N/A
Persons Physically or Economically Displaced by Airport Operator*
*Not reported in FY 2011.
Wildlife Strikes
FY 2011 FY 2012 FY 2013
Strikes* 0.08 1.23 1.75
*Annually, per 10,000 aircraft movements.
Monetary Value of Significant Fines and Number of Nonmonetary Sanctions for Non-Compliance with Laws and Regulations*
FY 2012 FY 2013
Monetary Value of Fines $0 $0
Number of Nonmonetary Sanctions 0 0
*Not reported in FY 2011.
Legal Actions for Anti-Competitive Behavior, Anti-Trust and Monopoly Practices*
FY 2012 FY 2013
Legal Actions 0 0
Outcome N/A N/A
*Not reported in FY 2011.

SUSTAINABILITY REPORTOUR AWARDS
38
Our Awards
During fiscal year 2013, the Airport Authority received a number of awards and recognition related to its sustainability efforts. The following list includes those received over the past three fiscal years.
Our Business• 2013 Routes Airport Marketing Awards Overall
Winner for the Americas• 2013 Economic Opportunity Award, San Diego
County Regional Airport Authority Leadership, from LEAD San Diego
• 2013 Airport Architectural, Engineering and Construction Award for The Green Build from the Airport Minority Advisory Council
• 2012 Achievement of Excellence in Procurement from the National Procurement Institute
• 2011 Golden Watchdog Award from the San Diego County Taxpayers Association for efficient use of public funds for the bond sale for The Green Build
• 2011 Achievement of Excellence in Procurement from the National Purchasing Institute
• 2011 Procurement Advocate of the Year from the San Diego County Hispanic Chamber of Com-merce
• 2011 Distinguished Budget Presentation Award from the Government Finance Officers Association of the United States
• 2011 Certification of Excellence Debt Policy from the Association of Public Treasurers of the United States and Canada
• 2011 Disadvantaged Business Enterprise Advo-cate and Partner Award from the Federal Aviation Administration
Our Environment• 2013 Recycler of the Year Award from the City of
San Diego • 2013 Leadership in Energy and Environmental
Design (LEED) Gold Certification for the Receiv-ing and Distribution Center from the United States Green Building Council (USGBC)
• 2012 Leadership in Energy and Environmental Design (LEED) Gold Certification for the rede-velopment of the Facilities Management Building from the United States Green Building Council (USGBC)
• 2012 Environmental Excellence Award in the category of “Air (Convention Pollutant Control)” for the Green Taxi program from the Industrial
Environmental Association (IEA) • 2012 Recycler of the Year Award from the City of
San Diego • 2011 Alonzo Award for Sustainable Business Prac-
tices from the Downtown San Diego Partnership for going above and beyond local, state and federal regulations in creating best practices in sustainabil-ity
• 2011 Recycler of the Year Award from the City of San Diego
• 2011 Outstanding Energy Project for “Install Airfield Signs, Taxiway Lights and Runway Guard Lights” from the American Society of Civil Engi-neers Region 9
• 2011 Airports Council International – North America Excellence in Airport Marketing and Communications Contest – 2nd Place for Creative Innovations/Technology – Least Tern Nest Counter on Website
• 2011 Outstanding Environmental Technical Report for the Ryan Aeronautical Historical American Buildings Survey and Interpretive Display/Website from the Association of Environmental Profession-als San Diego Chapter
Our Team• 2011 PR Professional of the Year, Diana Lucero,
from the Public Relations Society of America San Diego/Imperial Counties Chapter
• 2011 San Diego Metro Mover, Robert Gleason, Board Chair
• 2011 San Diego Metro Mover, Bob Silvas, Director, Small Business Development
Our Community• 2012 Gold SABRE Award in the Government
Agencies category for “The Green Build Takes Flight at San Diego International Airport” from The Holmes Report
• 2012 Edward L. Bernays Silver Mark of Excel-lence Award in Creative Tactics for “Construction Gets Creative: The Green Build Topping Out at San Diego International Airport” from the Public Relations Society of America San Diego/Imperial Counties Chapter
• 2012 Edward L. Bernays Silver Mark of Excellence Award in Press Conference for “Press Conference Gets Creative: The Green Build Topping Out at

SUSTAINABILITY REPORT
39
OUR AWARDS
San Diego International Airport” from the Public Relations Society of America San Diego/Imperial Counties Chapter
• 2012 Airports Council International – North America Excellence in Airport Marketing and Communications Contest – 1st place for Public Relations Campaigns – The Green Build Public Outreach
• 2012 Airports Council International – North America Excellence in Airport Marketing and Communications Contest – 1st place for Creative Innovations-Promotional Items – Junior Achieve-ment BizTown Mural
• 2012 Airports Council International – North America Excellence in Airport Marketing and Communications Contest – 2nd place for Airport Aviation and Education Programs – Triple Play Web Game
• 2011 Outstanding Public Owner from the Associ-ated General Contractors San Diego Chapter
• 2011 Award of the Organization from the Airport Minority Advisory Council for significant contri-butions toward the inclusion of historically under-represented businesses in contracting opportuni-ties
• 2011 Disadvantaged Business Enterprise Advo-cate and Partner Award from the Federal Aviation Administration
• 2011 Airports Council International – North America Excellence in Airport Marketing and Communications Contest – 2nd Place for Creative Innovations/Promotional Materials – Jet’s Fun Pack
• 2011 Silver Anvil from the Public Relations Society of America in the Community Relations – Govern-ment category for “The Green Build Takes Flight”
• 2011 PRWeek Honorable Mention in Public Sector Campaign of the Year for “The Green Build Takes Flight”
• 2011 PROTOS Award of Excellence in Community Relations/Institutional Programs for “The Green Build Takes Flight at San Diego International Air-port” from the Public Relations Society of America Orange County Chapter
• 2011 Edward L. Bernays Silver Mark of Excellence Award in Community Relations for “The Green Build Takes Flight” from the Public Relations Society of America San Diego/Imperial Counties Chapter
• 2011 Airports Council International – North America Excellence in Airport Marketing and Communications Contest – 2nd Place for Aviation Education & Tour Programs – Junior Achievement BizTown Mural
Our Customers • 2012 Award of Distinction in the Projects in Prog-
ress category from the Design Build Institute of America Western Pacific Region
• 2011 America’s Safest Airports by Travel + Leisure • 2011 Aviation Project of the Year from the Califor-
nia Transportation Foundation for the Taxiway C Rehabilitation project

SUSTAINABILITY REPORTSECTION TITLE
3225 North Harbor DriveSan Diego, CA 92101United States
P.O. Box 82776San Diego, CA 92138-2776United States Matt Harris Senior Director, Assets & Alliances Email: [email protected]: 619-400-2400


![AA OPAY 2013 Presentation[1]](https://static.fdocuments.in/doc/165x107/577cc69b1a28aba7119ea5c5/aa-opay-2013-presentation1.jpg)