AA British Insurance Premium Index– 2017 quarter...
26
AA British Insurance Premium Index © Automobile Association Insurance Services Limited 2017 Page 1 AA British Insurance Premium Index – 2017 quarter 1 27 April 2017 The AA British Insurance Premium Index (Index) has been tracking the quarterly movement of car and home insurance since 1994. It measures the five cheapest quotes for each 'customer' to provide an average or Shoparound index. Motor insurance premiums 2 Home insurance premiums 7 Index motor insurance trends since 1994 10 Index home insurance trends since 1994 11 Media contact Ian Crowder 01256 492 844 – [email protected] The information in the Index may only be used internally by the business (Internal Business Use) on the following terms. Internal Business Use means use of the information contained in the Index in reports and submissions – that do not carry advertising – in internal business activities. It specifically excludes any commercial use and exploitation including any use whereby the user obtains direct or indirect revenue, for example as part of any publishing activity, promotion, marketing or advertising. The AA copyright notice must be displayed on all such information. Press journalists may use the Index for editorial purposes without prior permission. Any use of the Index other than as above is not permitted without the prior written consent of the AA (contact details above). The AA excludes all implied warranties and conditions to the fullest extent permitted by law. The AA does not in any way warrant the accuracy or completeness of the Index, and by using the Index the user acknowledges that it is relying upon its own skill in determining its suitability for any general or specific purpose and accepts that the Index may not be error free. Automobile Association Insurance Services Limited is authorised and regulated by the Financial Conduct Authority (FCA).
Transcript of AA British Insurance Premium Index– 2017 quarter...
AA British Insurance Premium Index
© Automobile Association Insurance Services Limited 2017 Page 1
AA British Insurance Premium Index – 2017 quarter 1 27 April 2017
The AA British Insurance Premium Index (Index) has been tracking the quarterly movement of car and home insurance since 1994. It measures the five cheapest quotes for each 'customer' to provide an average or Shoparound index.
Motor insurance premiums 2
Home insurance premiums 7
Index motor insurance trends since 1994 10
Index home insurance trends since 1994 11
Media contact
Ian Crowder
01256 492 844 – [email protected]
The information in the Index may only be used internally by the business (Internal Business Use) on the following terms. Internal Business Use means use of the information contained in the Index in reports and submissions – that do not carry advertising – in internal business activities. It specifically excludes any commercial use and exploitation including any use whereby the user obtains direct or indirect revenue, for example as part of any publishing activity, promotion, marketing or advertising. The AA copyright notice must be displayed on all such information. Press journalists may use the Index for editorial purposes without prior permission.
Any use of the Index other than as above is not permitted without the prior written consent of the AA (contact details above).
The AA excludes all implied warranties and conditions to the fullest extent permitted by law. The AA does not in any way warrant the accuracy or completeness of the Index, and by using the Index the user acknowledges that it is relying upon its own skill in determining its suitability for any general or specific purpose and accepts that the Index may not be error free.
Automobile Association Insurance Services Limited is authorised and regulated by the Financial Conduct Authority (FCA).
AA British Insurance Premium Index
© Automobile Association Insurance Services Limited 2017 Page 2
Motor insurance premiums – 2017 quarter 1
Car insurance hikes inevitable thanks to government blunders, says AA
• Small premium increases over first quarter, but higher to come
• Discount rate cut and IPT rise will pile on premium misery
• Drivers aged 40–59 see premiums fall
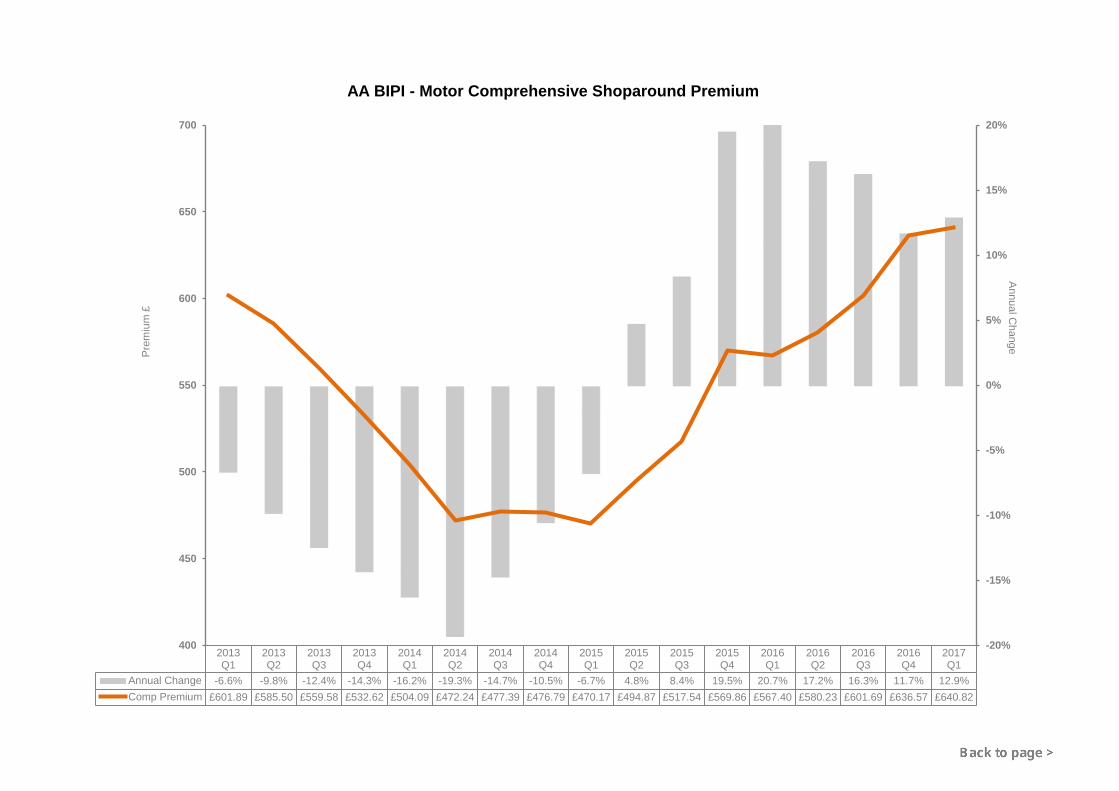
The acceleration in car insurance premiums last year should have stalled over the first quarter of 2017. But according to the latest AA British Insurance Premium Index, the Shoparound premium for a typical annual comprehensive car insurance policy rose by 0.7%, or £4.25, to £640.82. Drivers aged 40–59, however, did see their premiums fall.1
The rise is in part due to the shock government change to the so-called discount or Ogden rate. This rate governs the amount of injury compensation that is paid to victims of car crashes.
The ruling means that injury payouts by insurance companies will significantly increase, and so drive premiums higher. This especially affects those who already pay the most for their insurance – the youngest and oldest drivers – because of their greater likelihood of being involved in a car collision that results in injuries.
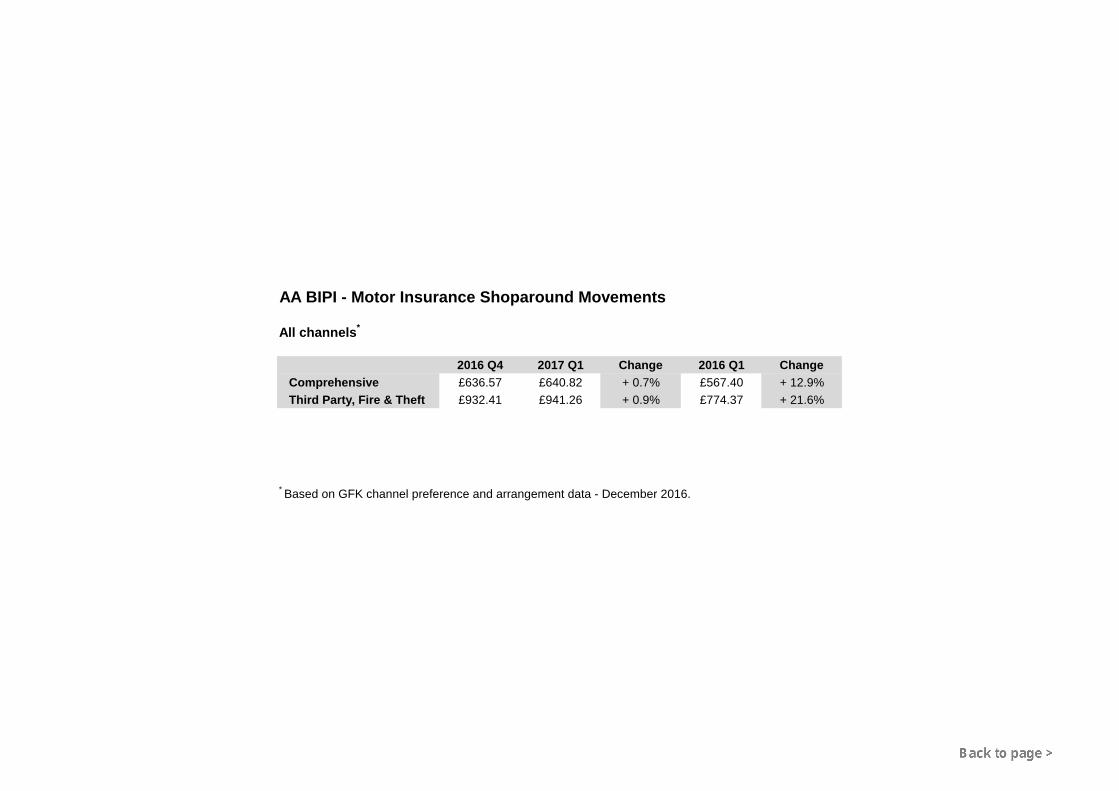
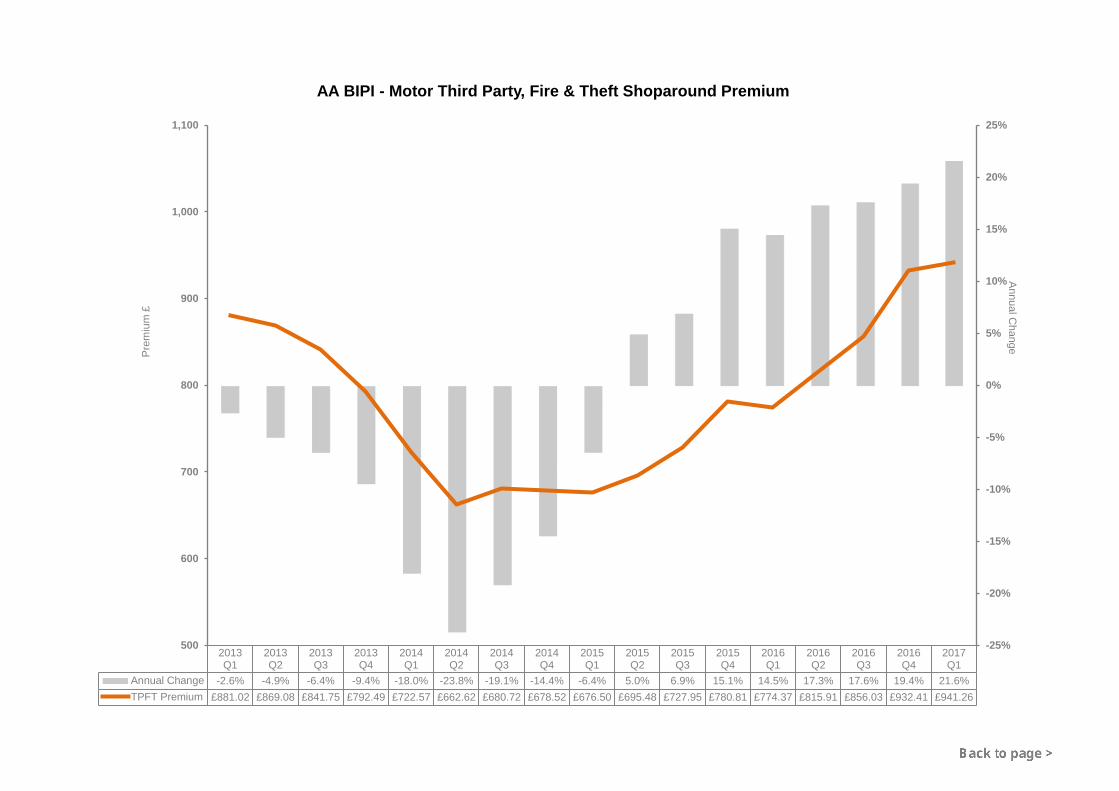
Over 12 months the Shoparound premium increased by 12.9%, or £73.42. Quotes for third party, fire and theft cover (mainly bought by young drivers with older cars) have risen by an eye-watering 21.6%.
Shoparound premium summary
2016 Q4 2017 Q1 Change 2016 Q1 Change
Comprehensive £636.57 £640.82 +0.7% £567.40 +12.9%
Third Party, Fire & Theft £932.41 £941.26 +0.9% £774.37 +21.6%
Third party, fire and theft cover appears to have a higher premium than comprehensive. This is because the basket of risks reflects the type of driver that buys such cover, typically young drivers.
Continued
1 The AA Shoparound index is an average of the five cheapest premiums, quoted from the broker, the direct market and price comparison sites, for each risk in a nationwide basket of risks representative of the insurance buying public. This method gives accurate quarterly price tracking.
AA British Insurance Premium Index
© Automobile Association Insurance Services Limited 2017 Page 3
Astonishing discount rate reduction
Michael Lloyd, director of AA Insurance, points out that if it were not for the discount rate change premiums would have remained stable or even fallen.
"The discount rate is the percentage sum applied to injury compensation payments that reflects the interest that could be earned by a claimant, if they were to invest their payout.
"It has been fixed at +2.5% since 2001, but with effect from 20 March it was slashed to -0.75%.
"So where injury compensation payments used to account for the assumed future investment return of 2.5%, following this decision claimants are being paid more money to allow for the negative investment rate now imposed.
"It has had an immediate effect on car insurance premiums because injuries already claimed for, but not yet paid, are affected by the rate change as well as new claims.
"It was an astonishing and unrealistic decision that didn't take account of where claimants are most likely to save their money. They are not going to put their money into government securities, on which the discount rate is calculated, and which have a negative interest return."
Because of the way the discount rate is applied young drivers will take the brunt. One analysis suggests that drivers aged 17–22, the ones who are most likely to be in a collision that injures others, could see their premiums rise by up to £1,000.2 On average premiums are expected to rise by around £50.
Fronting
The discount rate comes on top of rising car repair costs and the doubling of Insurance Premium Tax in just two years to 12% (from 1 June 2017), both of which contribute to upward pressure on premiums. 3
Continued
2 PwC estimate on the effects of the cut in the discount or Ogden rate.
3 Insurance Premium Tax rose from 6% to 9.5% from 1 November 2015. It rose to 10% from 1 September 2016, and will rise to 12% from 1 June 2017.
AA British Insurance Premium Index
© Automobile Association Insurance Services Limited 2017 Page 4
Recent research by the AA shows that nearly half of families with young drivers would resort to illegal attempts to attract a lower premium. One example is 'fronting', where a youngster is listed by an adult as a named or occasional driver, when in truth the young person drives the car most or all of the time.4
Even the Financial Ombudsman Service has recognised fronting is an issue. It published a case study earlier this year to warn of the possible consequences of an insurer withdrawing cover and not meeting a claim.
Whiplash injury claims
The last sustained period of car insurance rises was in 2010 when the Shoparound premium increased by just over 40% in 12 months, largely due to fast-rising whiplash injury claims.
Premiums then dropped on the expectation that new legislation to curb the activities of claims management companies would slow the number of claims. But that legislation has had only limited success. And now the Ministry of Justice has announced that it is shelving further reforms that could reduce the unacceptable flow of fraudulent claims.
"It means that the whiplash gravy train has the green light again, which is not good news for car insurance premiums," says Lloyd.
"The Index suggests that the first quarter is the calm before the storm. Although I don't expect to see premiums rise as sharply as they did over 2010 and 2011, there's no doubt that they will quickly climb again unless further IPT increases are curbed and the discount rate is reviewed."
Winners and losers – Shoparound by region
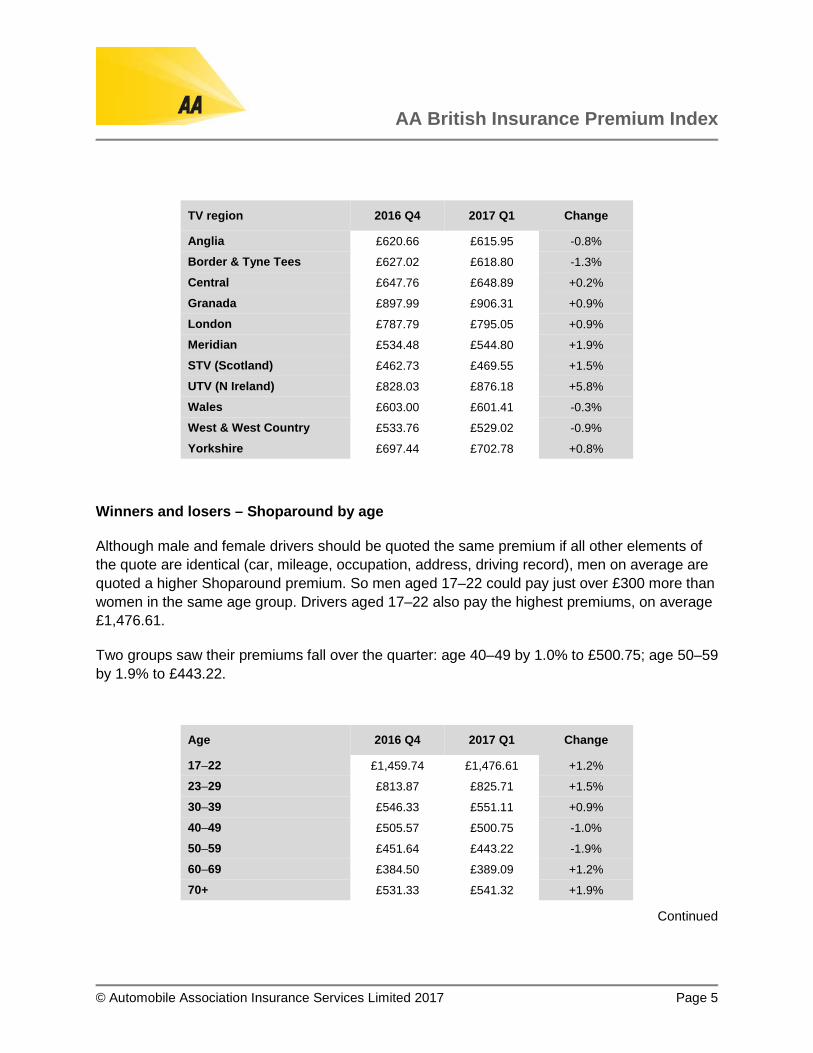
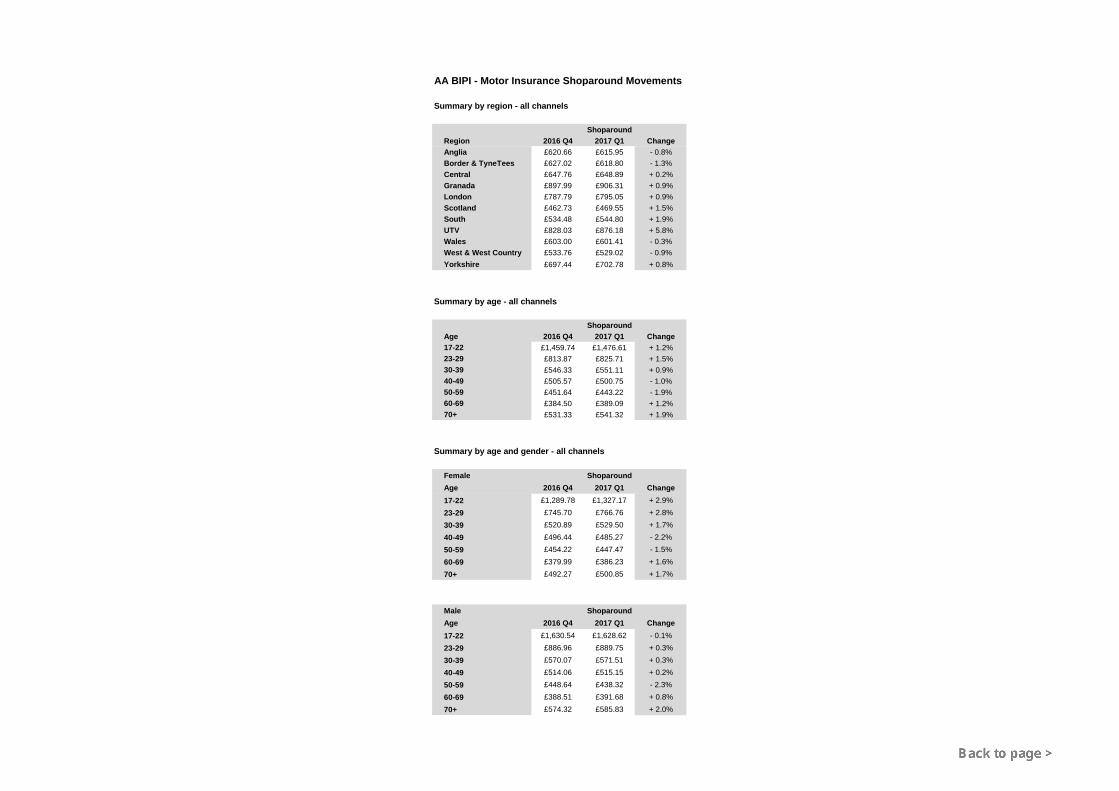
Four regions saw premiums fall over the quarter, the largest being Border and Tyne Tees where Shoparound premiums fell by 1.3%.
The highest rise was for Northern Ireland where the Shoparound premium jumped by 5.8%. On the UK mainland the biggest rise was for southern England (Meridian) at 1.9%. Despite a rise of 1.5%, Scotland remains by some measure the cheapest region to insure a car, with a Shoparound premium of £469.55. The north-west (Granada) is the costliest region to insure a car, at an average of £906.31.
Continued
4 Populus research among 19,317 AA Members, 15–22 November 2016. Populus is a member of the British Polling Council and abides by its rules.
AA British Insurance Premium Index
© Automobile Association Insurance Services Limited 2017 Page 5
TV region 2016 Q4 2017 Q1 Change
Anglia £620.66 £615.95 -0.8%
Border & Tyne Tees £627.02 £618.80 -1.3%
Central £647.76 £648.89 +0.2%
Granada £897.99 £906.31 +0.9%
London £787.79 £795.05 +0.9%
Meridian £534.48 £544.80 +1.9%
STV (Scotland) £462.73 £469.55 +1.5%
UTV (N Ireland) £828.03 £876.18 +5.8%
Wales £603.00 £601.41 -0.3%
West & West Country £533.76 £529.02 -0.9%
Yorkshire £697.44 £702.78 +0.8%
Winners and losers – Shoparound by age
Although male and female drivers should be quoted the same premium if all other elements of the quote are identical (car, mileage, occupation, address, driving record), men on average are quoted a higher Shoparound premium. So men aged 17–22 could pay just over £300 more than women in the same age group. Drivers aged 17–22 also pay the highest premiums, on average £1,476.61.
Two groups saw their premiums fall over the quarter: age 40–49 by 1.0% to £500.75; age 50–59 by 1.9% to £443.22.
Age 2016 Q4 2017 Q1 Change
17–22 £1,459.74 £1,476.61 +1.2%
23–29 £813.87 £825.71 +1.5%
30–39 £546.33 £551.11 +0.9%
40–49 £505.57 £500.75 -1.0%
50–59 £451.64 £443.22 -1.9%
60–69 £384.50 £389.09 +1.2%
70+ £531.33 £541.32 +1.9%
Continued
AA British Insurance Premium Index
© Automobile Association Insurance Services Limited 2017 Page 6
Motor insurance premiums – summary tables and charts 2017 Q1
Download the Index (Excel file) for motor insurance
2,800 risks for car insurance
AA British Insurance Premium Index – Motor insurance trends since 1994 (chart)
All channels combined
Motor insurance Shoparound premium movements (chart)
Motor insurance Shoparound premium movements (table)
Motor insurance Shoparound premium movements – region and age (tables)
Comprehensive insurance Shoparound premium trend (chart)
Third-party insurance Shoparound premium trend (chart)
AA British Insurance Premium Index
© Automobile Association Insurance Services Limited 2017 Page 7
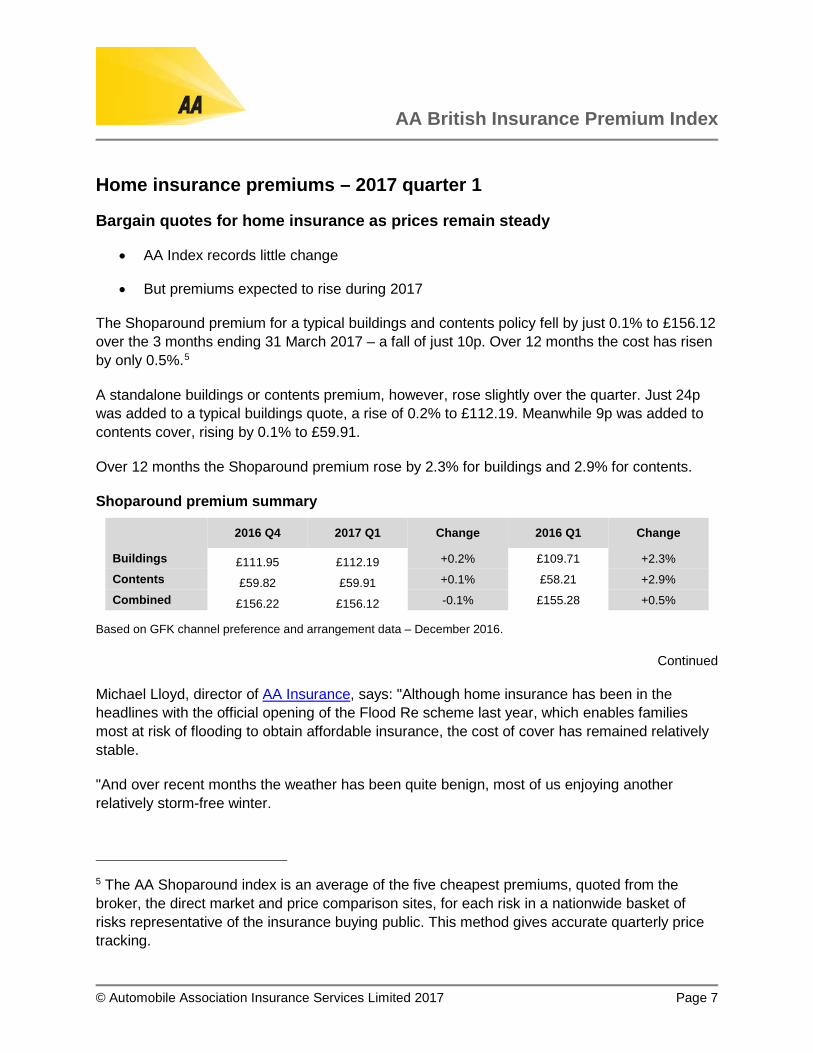
Home insurance premiums – 2017 quarter 1
Bargain quotes for home insurance as prices remain steady
• AA Index records little change
• But premiums expected to rise during 2017
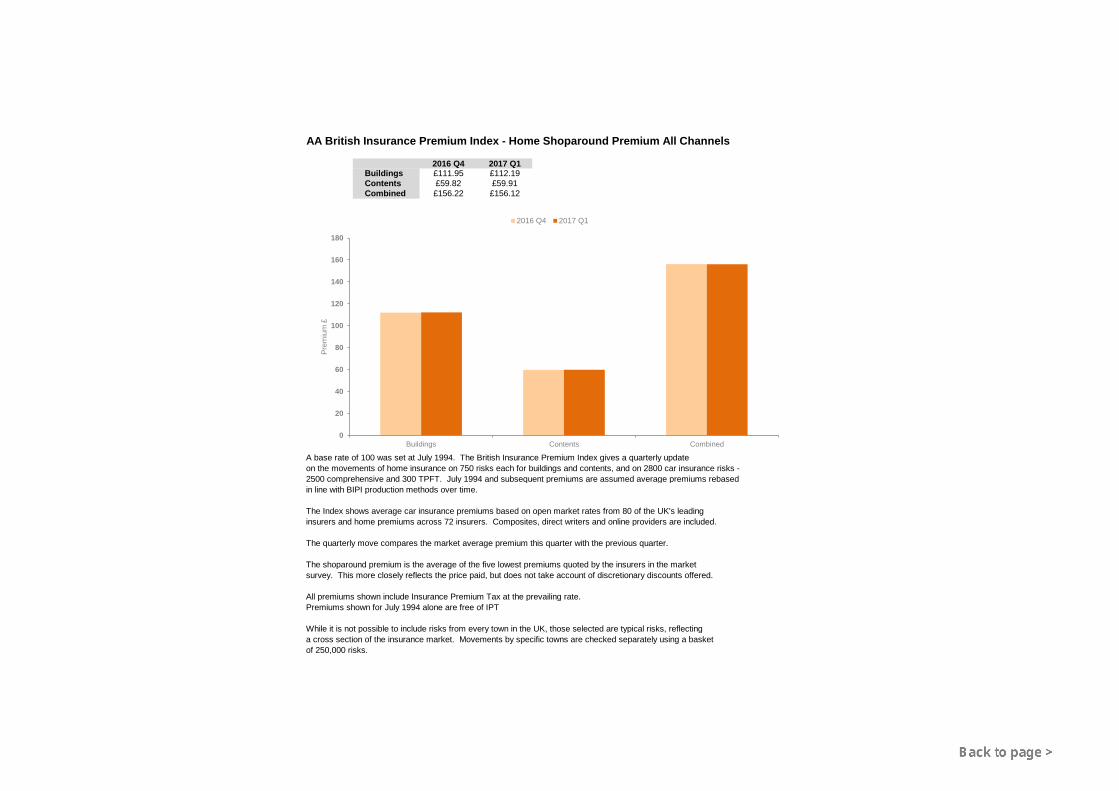
The Shoparound premium for a typical buildings and contents policy fell by just 0.1% to £156.12 over the 3 months ending 31 March 2017 – a fall of just 10p. Over 12 months the cost has risen by only 0.5%.5
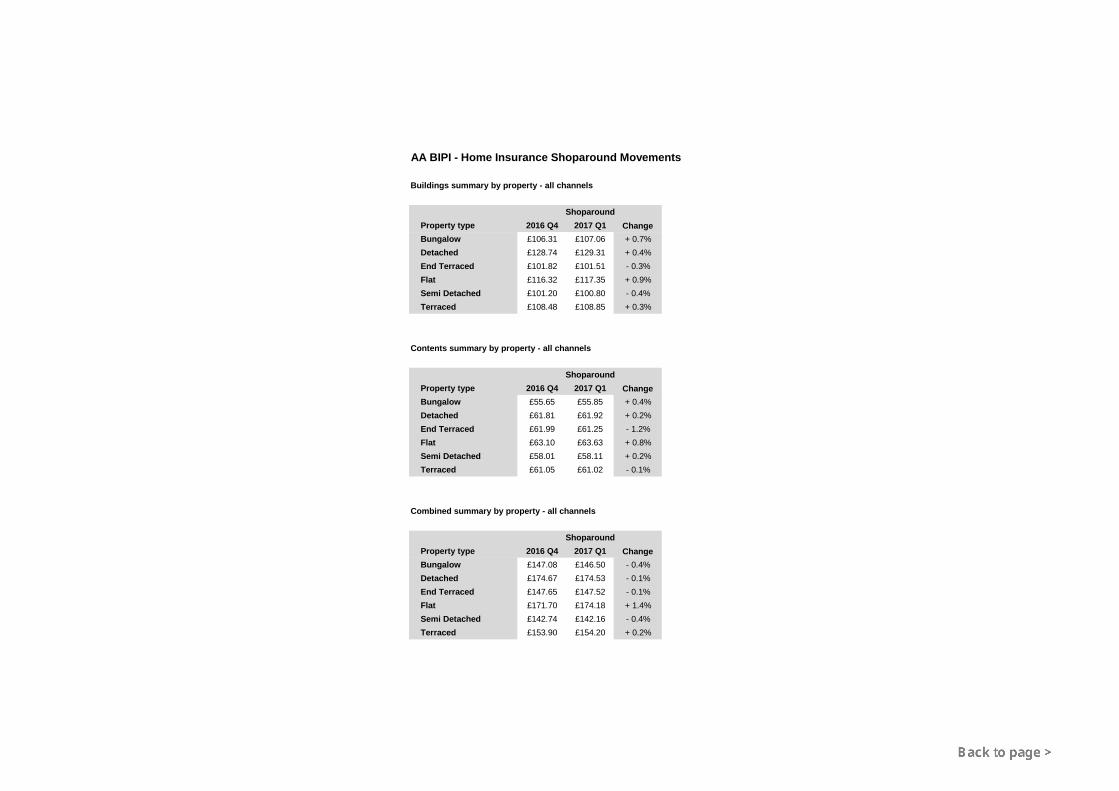
A standalone buildings or contents premium, however, rose slightly over the quarter. Just 24p was added to a typical buildings quote, a rise of 0.2% to £112.19. Meanwhile 9p was added to contents cover, rising by 0.1% to £59.91.
Over 12 months the Shoparound premium rose by 2.3% for buildings and 2.9% for contents.
Shoparound premium summary
2016 Q4 2017 Q1 Change 2016 Q1 Change
Buildings £111.95 £112.19 +0.2% £109.71 +2.3%
Contents £59.82 £59.91 +0.1% £58.21 +2.9%
Combined £156.22 £156.12 -0.1% £155.28 +0.5%
Based on GFK channel preference and arrangement data – December 2016.
Continued
Michael Lloyd, director of AA Insurance, says: "Although home insurance has been in the headlines with the official opening of the Flood Re scheme last year, which enables families most at risk of flooding to obtain affordable insurance, the cost of cover has remained relatively stable.
"And over recent months the weather has been quite benign, most of us enjoying another relatively storm-free winter.
5 The AA Shoparound index is an average of the five cheapest premiums, quoted from the broker, the direct market and price comparison sites, for each risk in a nationwide basket of risks representative of the insurance buying public. This method gives accurate quarterly price tracking.
AA British Insurance Premium Index
© Automobile Association Insurance Services Limited 2017 Page 8
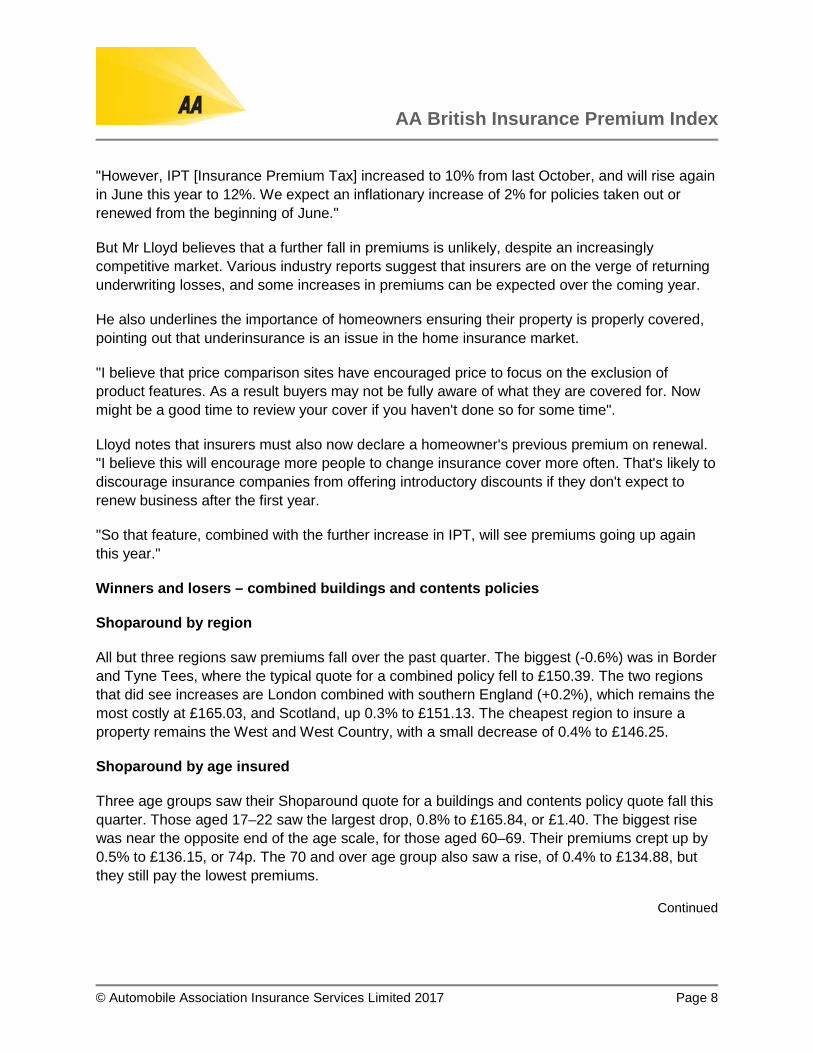
"However, IPT [Insurance Premium Tax] increased to 10% from last October, and will rise again in June this year to 12%. We expect an inflationary increase of 2% for policies taken out or renewed from the beginning of June."
But Mr Lloyd believes that a further fall in premiums is unlikely, despite an increasingly competitive market. Various industry reports suggest that insurers are on the verge of returning underwriting losses, and some increases in premiums can be expected over the coming year.
He also underlines the importance of homeowners ensuring their property is properly covered, pointing out that underinsurance is an issue in the home insurance market.
"I believe that price comparison sites have encouraged price to focus on the exclusion of product features. As a result buyers may not be fully aware of what they are covered for. Now might be a good time to review your cover if you haven't done so for some time".
Lloyd notes that insurers must also now declare a homeowner's previous premium on renewal. "I believe this will encourage more people to change insurance cover more often. That's likely to discourage insurance companies from offering introductory discounts if they don't expect to renew business after the first year.
"So that feature, combined with the further increase in IPT, will see premiums going up again this year."
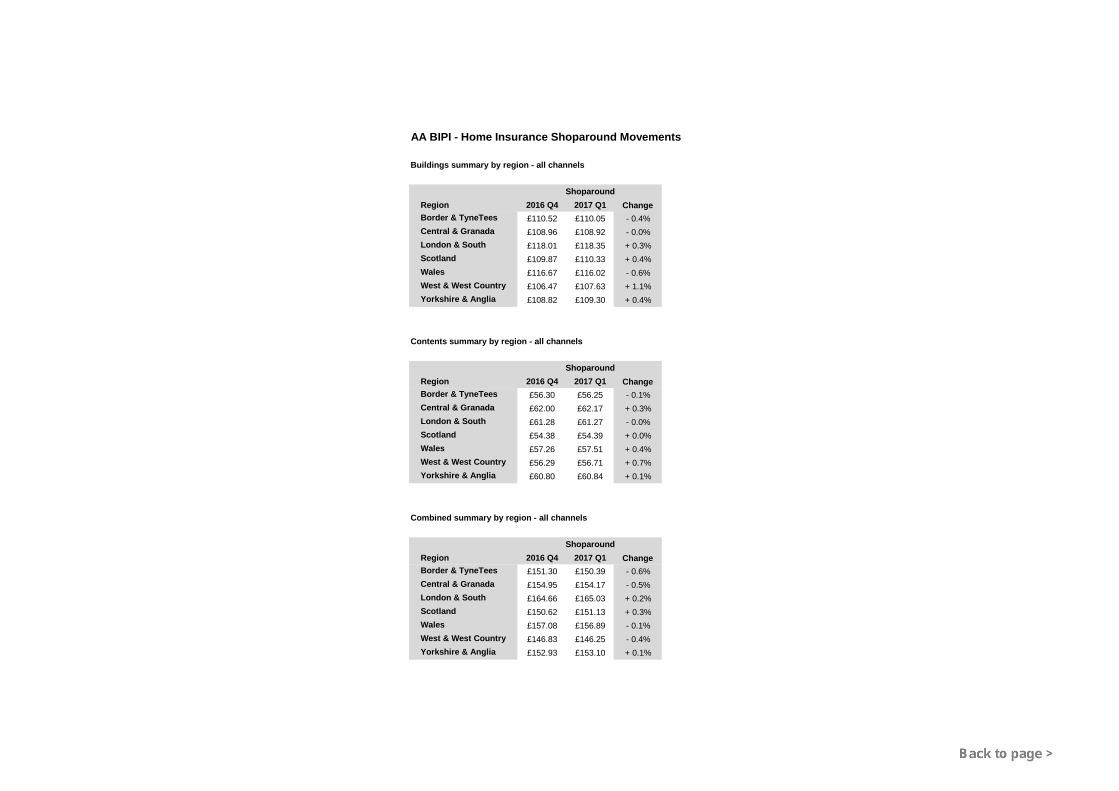
Winners and losers – combined buildings and contents policies
Shoparound by region
All but three regions saw premiums fall over the past quarter. The biggest (-0.6%) was in Border and Tyne Tees, where the typical quote for a combined policy fell to £150.39. The two regions that did see increases are London combined with southern England (+0.2%), which remains the most costly at £165.03, and Scotland, up 0.3% to £151.13. The cheapest region to insure a property remains the West and West Country, with a small decrease of 0.4% to £146.25.
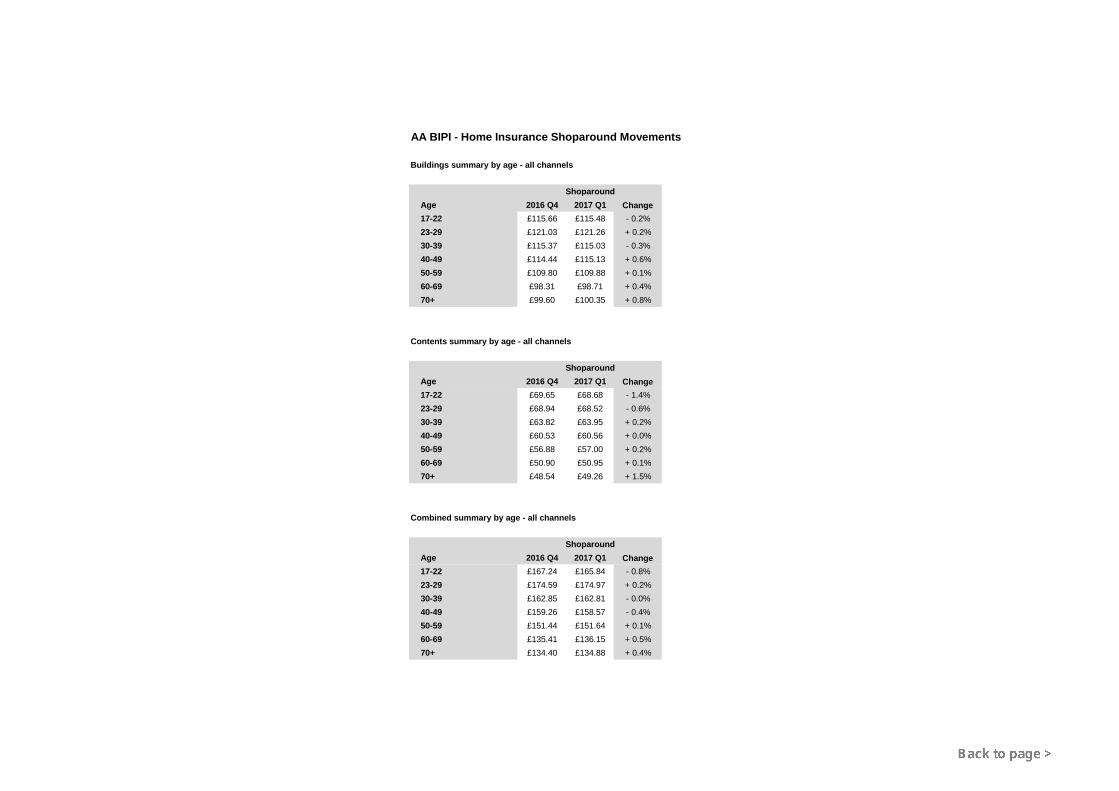
Shoparound by age insured
Three age groups saw their Shoparound quote for a buildings and contents policy quote fall this quarter. Those aged 17–22 saw the largest drop, 0.8% to £165.84, or £1.40. The biggest rise was near the opposite end of the age scale, for those aged 60–69. Their premiums crept up by 0.5% to £136.15, or 74p. The 70 and over age group also saw a rise, of 0.4% to £134.88, but they still pay the lowest premiums.
Continued
AA British Insurance Premium Index
© Automobile Association Insurance Services Limited 2017 Page 9
Home insurance premiums – summary tables and charts 2017 Q1
Download the Index (Excel file) for home insurance:
750 risks for home insurance
AA British Insurance Premium Index - Home insurance trends since 1994 (chart)
All channels combined
Home insurance Shoparound premium movements (chart)
Home insurance Shoparound premium movements (table)
Home insurance Shoparound premium movements – region (tables)
Home insurance Shoparound premium movements – age (tables)
Home insurance Shoparound premium movements – property type (tables)
Home insurance Shoparound premium movements – year built (tables)
Buildings insurance Shoparound premium trend (chart)
Contents insurance Shoparound premium trend (chart)
Buildings and contents insurance Shoparound premium trend (chart)
0
50
100
150
200
250
300
350
400
450
500
550
1994Q2
1995Q1
1995Q4
1996Q3
1997Q2
1998Q1
1998Q4
1999Q3
2000Q2
2001Q1
2001Q4
2002Q3
2003Q2
2004Q1
2004Q4
2005Q3
2006Q2
2007Q1
2007Q4
2008Q3
2009Q2
2010Q1
2010Q4
2011Q3
2012Q2
2013Q1
2013Q4
2014Q3
2015Q2
2016Q1
2016Q4
Inde
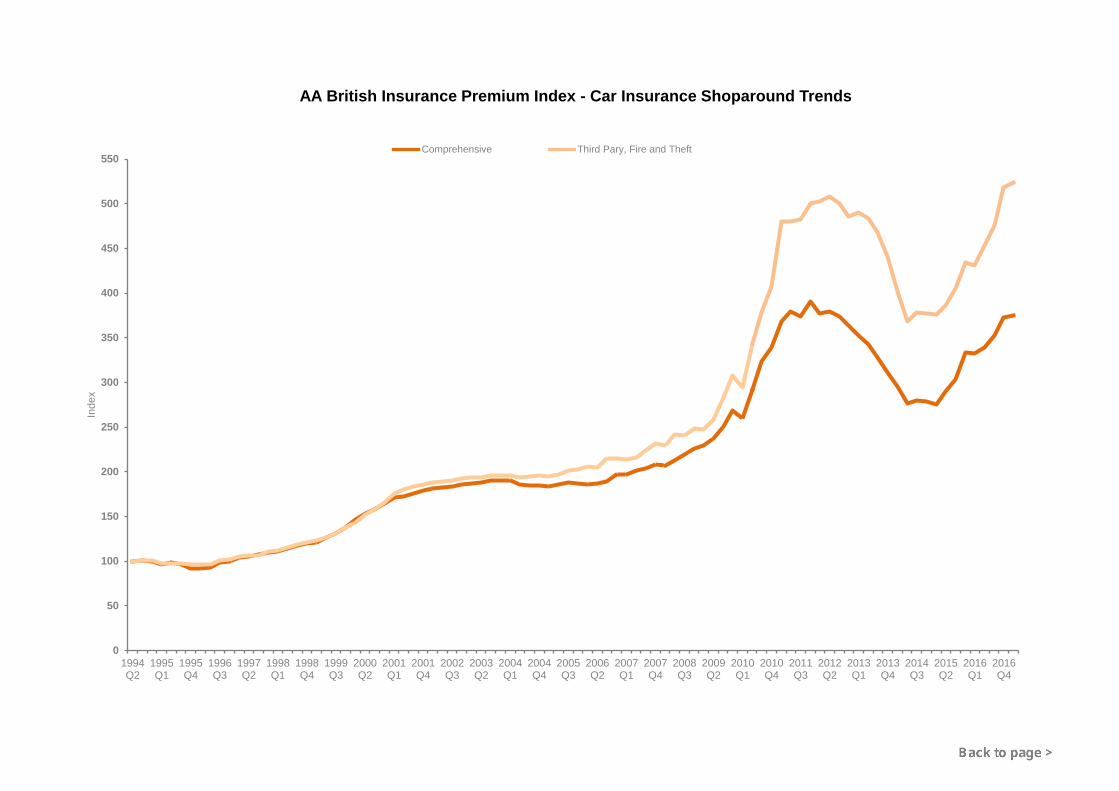
xAA British Insurance Premium Index - Car Insurance Shoparound Trends
Comprehensive Third Pary, Fire and Theft
0
50
100
150
1994Q2
1995Q1
1995Q4
1996Q3
1997Q2
1998Q1
1998Q4
1999Q3
2000Q2
2001Q1
2001Q4
2002Q3
2003Q2
2004Q1
2004Q4
2005Q3
2006Q2
2007Q1
2007Q4
2008Q3
2009Q2
2010Q1
2010Q4
2011Q3
2012Q2
2013Q1
2013Q4
2014Q3
2015Q2
2016Q1
2016Q4
Inde
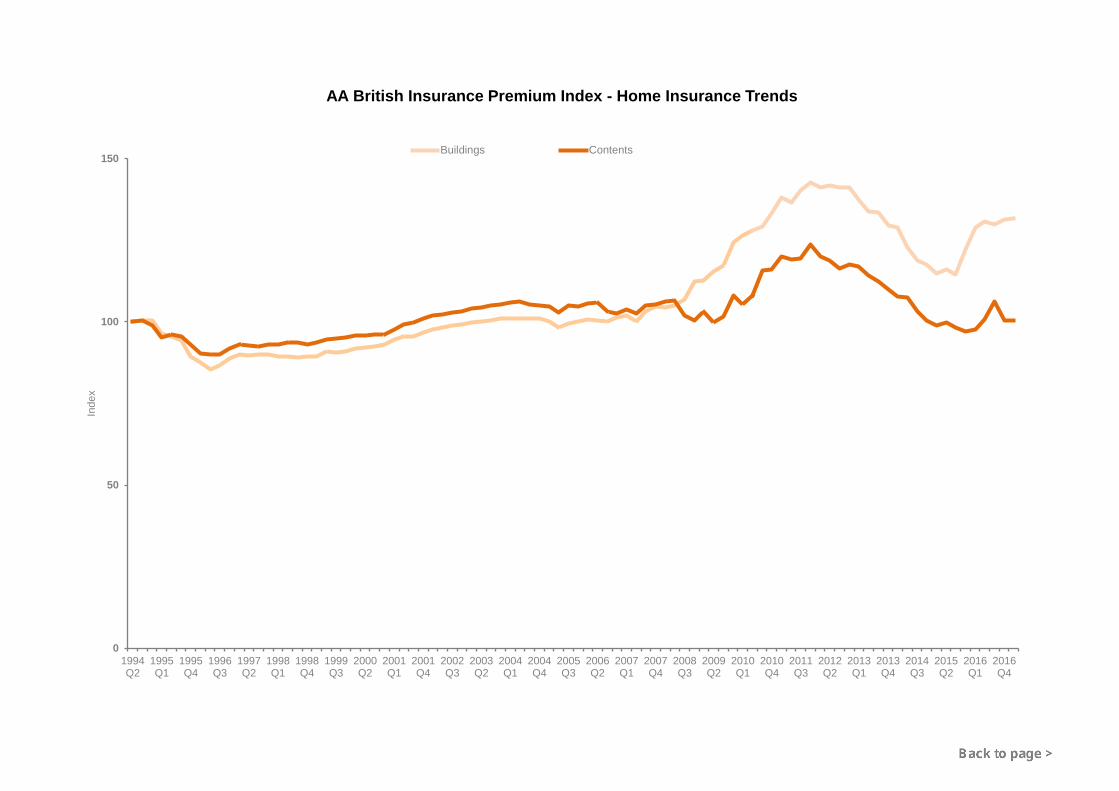
xAA British Insurance Premium Index - Home Insurance Trends
Buildings Contents
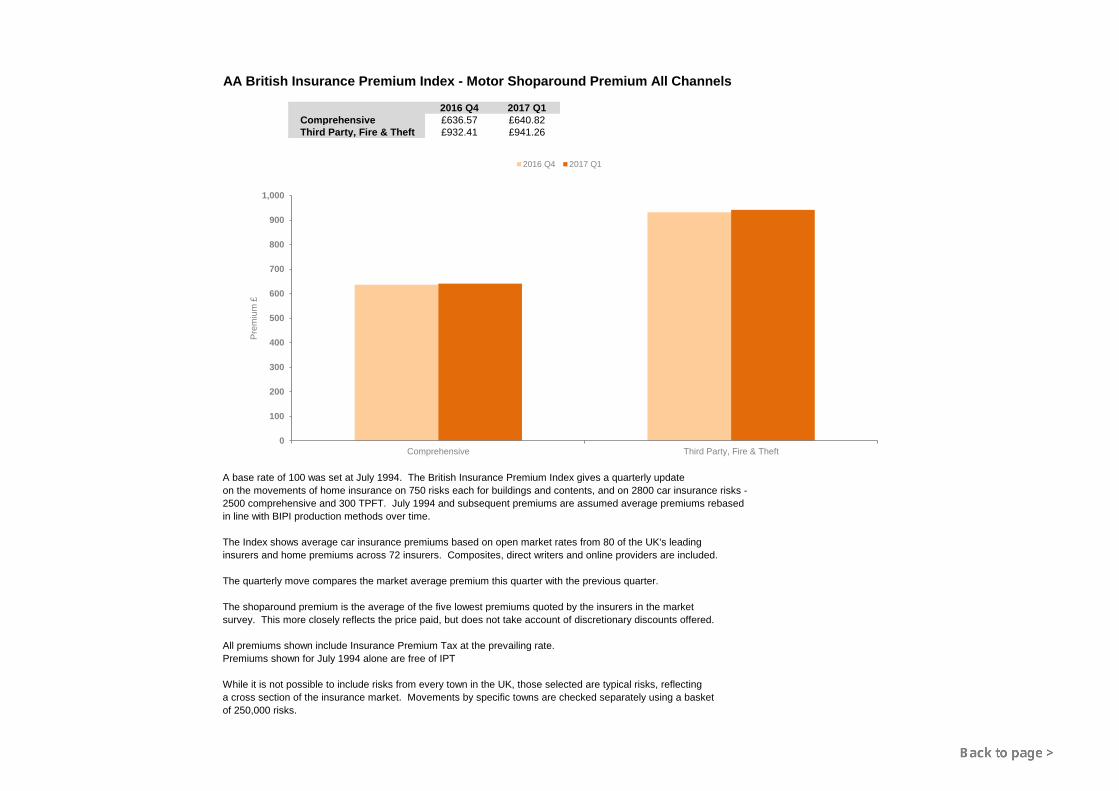
AA British Insurance Premium Index - Motor Shoparound Premium All Channels
2016 Q4 2017 Q1Comprehensive £636.57 £640.82Third Party, Fire & Theft £932.41 £941.26
A base rate of 100 was set at July 1994. The British Insurance Premium Index gives a quarterly update on the movements of home insurance on 750 risks each for buildings and contents, and on 2800 car insurance risks - 2500 comprehensive and 300 TPFT. July 1994 and subsequent premiums are assumed average premiums rebased in line with BIPI production methods over time.
The Index shows average car insurance premiums based on open market rates from 80 of the UK's leadinginsurers and home premiums across 72 insurers. Composites, direct writers and online providers are included.
The quarterly move compares the market average premium this quarter with the previous quarter.
The shoparound premium is the average of the five lowest premiums quoted by the insurers in the marketsurvey. This more closely reflects the price paid, but does not take account of discretionary discounts offered.
All premiums shown include Insurance Premium Tax at the prevailing rate.Premiums shown for July 1994 alone are free of IPT
While it is not possible to include risks from every town in the UK, those selected are typical risks, reflectinga cross section of the insurance market. Movements by specific towns are checked separately using a basketof 250,000 risks.
0
100
200
300
400
500
600
700
800
900
1,000
Comprehensive Third Party, Fire & Theft
Prem
ium
£
2016 Q4 2017 Q1
AA BIPI - Motor Insurance Shoparound Movements
All channels*
2016 Q4 2017 Q1 Change 2016 Q1 ChangeComprehensive £636.57 £640.82 + 0.7% £567.40 + 12.9%Third Party, Fire & Theft £932.41 £941.26 + 0.9% £774.37 + 21.6%
* Based on GFK channel preference and arrangement data - December 2016.
AA BIPI - Motor Insurance Shoparound Movements
Summary by region - all channels
ShoparoundRegion 2016 Q4 2017 Q1 ChangeAnglia £620.66 £615.95 - 0.8%Border & TyneTees £627.02 £618.80 - 1.3%Central £647.76 £648.89 + 0.2%Granada £897.99 £906.31 + 0.9%London £787.79 £795.05 + 0.9%Scotland £462.73 £469.55 + 1.5%South £534.48 £544.80 + 1.9%UTV £828.03 £876.18 + 5.8%Wales £603.00 £601.41 - 0.3%West & West Country £533.76 £529.02 - 0.9%Yorkshire £697.44 £702.78 + 0.8%
Summary by age - all channels
ShoparoundAge 2016 Q4 2017 Q1 Change17-22 £1,459.74 £1,476.61 + 1.2%23-29 £813.87 £825.71 + 1.5%30-39 £546.33 £551.11 + 0.9%40-49 £505.57 £500.75 - 1.0%50-59 £451.64 £443.22 - 1.9%60-69 £384.50 £389.09 + 1.2%70+ £531.33 £541.32 + 1.9%
Summary by age and gender - all channels
Female ShoparoundAge 2016 Q4 2017 Q1 Change17-22 £1,289.78 £1,327.17 + 2.9%23-29 £745.70 £766.76 + 2.8%30-39 £520.89 £529.50 + 1.7%40-49 £496.44 £485.27 - 2.2%50-59 £454.22 £447.47 - 1.5%60-69 £379.99 £386.23 + 1.6%70+ £492.27 £500.85 + 1.7%
Male ShoparoundAge 2016 Q4 2017 Q1 Change17-22 £1,630.54 £1,628.62 - 0.1%23-29 £886.96 £889.75 + 0.3%30-39 £570.07 £571.51 + 0.3%40-49 £514.06 £515.15 + 0.2%50-59 £448.64 £438.32 - 2.3%60-69 £388.51 £391.68 + 0.8%70+ £574.32 £585.83 + 2.0%
2013Q1
2013Q2
2013Q3
2013Q4
2014Q1
2014Q2
2014Q3
2014Q4
2015Q1
2015Q2
2015Q3
2015Q4
2016Q1
2016Q2
2016Q3
2016Q4
2017Q1
Annual Change -6.6% -9.8% -12.4% -14.3% -16.2% -19.3% -14.7% -10.5% -6.7% 4.8% 8.4% 19.5% 20.7% 17.2% 16.3% 11.7% 12.9%Comp Premium £601.89 £585.50 £559.58 £532.62 £504.09 £472.24 £477.39 £476.79 £470.17 £494.87 £517.54 £569.86 £567.40 £580.23 £601.69 £636.57 £640.82
-20%
-15%
-10%
-5%
0%
5%
10%
15%
20%
400
450
500
550
600
650
700Annual C
hange
Prem
ium
£
AA BIPI - Motor Comprehensive Shoparound Premium
2013Q1
2013Q2
2013Q3
2013Q4
2014Q1
2014Q2
2014Q3
2014Q4
2015Q1
2015Q2
2015Q3
2015Q4
2016Q1
2016Q2
2016Q3
2016Q4
2017Q1
Annual Change -2.6% -4.9% -6.4% -9.4% -18.0% -23.8% -19.1% -14.4% -6.4% 5.0% 6.9% 15.1% 14.5% 17.3% 17.6% 19.4% 21.6%TPFT Premium £881.02 £869.08 £841.75 £792.49 £722.57 £662.62 £680.72 £678.52 £676.50 £695.48 £727.95 £780.81 £774.37 £815.91 £856.03 £932.41 £941.26
-25%
-20%
-15%
-10%
-5%
0%
5%
10%
15%
20%
25%
500
600
700
800
900
1,000
1,100Annual C
hange
Prem
ium
£
AA BIPI - Motor Third Party, Fire & Theft Shoparound Premium
AA British Insurance Premium Index - Home Shoparound Premium All Channels
2016 Q4 2017 Q1Buildings £111.95 £112.19Contents £59.82 £59.91Combined £156.22 £156.12
A base rate of 100 was set at July 1994. The British Insurance Premium Index gives a quarterly update on the movements of home insurance on 750 risks each for buildings and contents, and on 2800 car insurance risks - 2500 comprehensive and 300 TPFT. July 1994 and subsequent premiums are assumed average premiums rebased in line with BIPI production methods over time.
The Index shows average car insurance premiums based on open market rates from 80 of the UK's leadinginsurers and home premiums across 72 insurers. Composites, direct writers and online providers are included.
The quarterly move compares the market average premium this quarter with the previous quarter.
The shoparound premium is the average of the five lowest premiums quoted by the insurers in the marketsurvey. This more closely reflects the price paid, but does not take account of discretionary discounts offered.
All premiums shown include Insurance Premium Tax at the prevailing rate.Premiums shown for July 1994 alone are free of IPT
While it is not possible to include risks from every town in the UK, those selected are typical risks, reflectinga cross section of the insurance market. Movements by specific towns are checked separately using a basketof 250,000 risks.
0
20
40
60
80
100
120
140
160
180
Buildings Contents Combined
Prem
ium
£
2016 Q4 2017 Q1
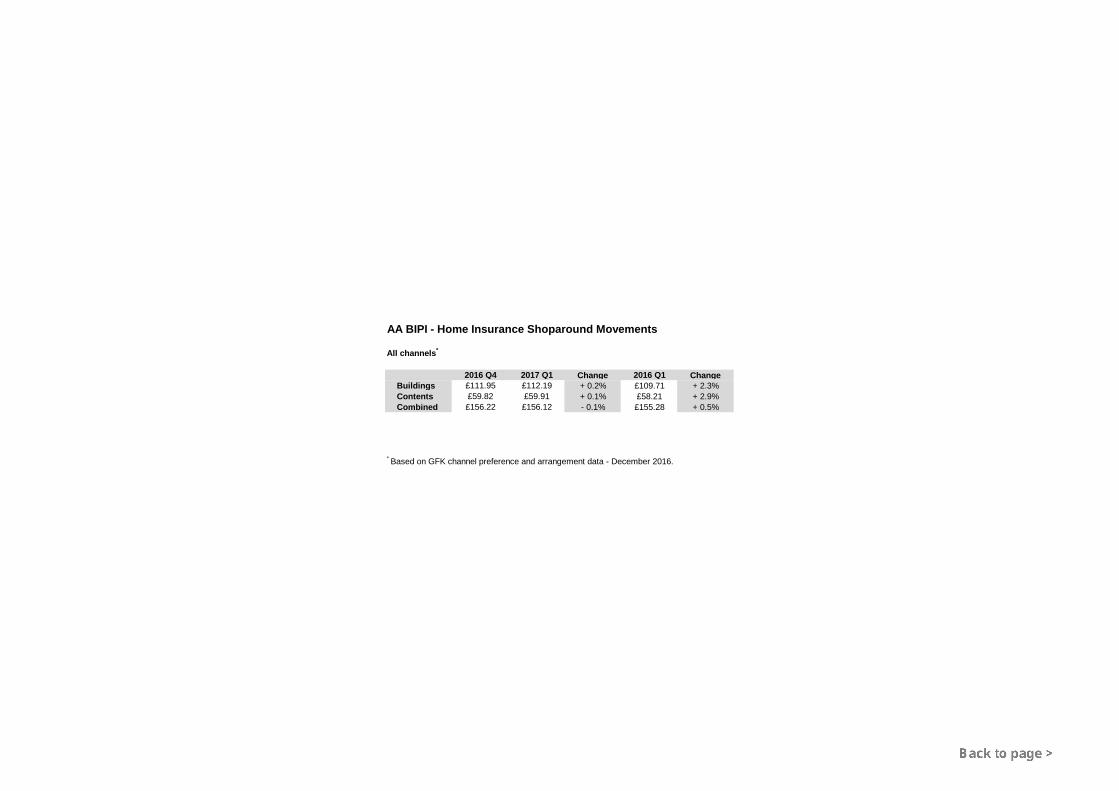
AA BIPI - Home Insurance Shoparound Movements
All channels*
2016 Q4 2017 Q1 Change 2016 Q1 ChangeBuildings £111.95 £112.19 + 0.2% £109.71 + 2.3%Contents £59.82 £59.91 + 0.1% £58.21 + 2.9%Combined £156.22 £156.12 - 0.1% £155.28 + 0.5%
* Based on GFK channel preference and arrangement data - December 2016.
AA BIPI - Home Insurance Shoparound Movements
Buildings summary by region - all channels
ShoparoundRegion 2016 Q4 2017 Q1 ChangeBorder & TyneTees £110.52 £110.05 - 0.4%Central & Granada £108.96 £108.92 - 0.0%London & South £118.01 £118.35 + 0.3%Scotland £109.87 £110.33 + 0.4%Wales £116.67 £116.02 - 0.6%West & West Country £106.47 £107.63 + 1.1%Yorkshire & Anglia £108.82 £109.30 + 0.4%
Contents summary by region - all channels
ShoparoundRegion 2016 Q4 2017 Q1 ChangeBorder & TyneTees £56.30 £56.25 - 0.1%Central & Granada £62.00 £62.17 + 0.3%London & South £61.28 £61.27 - 0.0%Scotland £54.38 £54.39 + 0.0%Wales £57.26 £57.51 + 0.4%West & West Country £56.29 £56.71 + 0.7%Yorkshire & Anglia £60.80 £60.84 + 0.1%
Combined summary by region - all channels
ShoparoundRegion 2016 Q4 2017 Q1 ChangeBorder & TyneTees £151.30 £150.39 - 0.6%Central & Granada £154.95 £154.17 - 0.5%London & South £164.66 £165.03 + 0.2%Scotland £150.62 £151.13 + 0.3%Wales £157.08 £156.89 - 0.1%West & West Country £146.83 £146.25 - 0.4%Yorkshire & Anglia £152.93 £153.10 + 0.1%
AA BIPI - Home Insurance Shoparound Movements
Buildings summary by age - all channels
ShoparoundAge 2016 Q4 2017 Q1 Change17-22 £115.66 £115.48 - 0.2%23-29 £121.03 £121.26 + 0.2%30-39 £115.37 £115.03 - 0.3%40-49 £114.44 £115.13 + 0.6%50-59 £109.80 £109.88 + 0.1%60-69 £98.31 £98.71 + 0.4%70+ £99.60 £100.35 + 0.8%
Contents summary by age - all channels
ShoparoundAge 2016 Q4 2017 Q1 Change17-22 £69.65 £68.68 - 1.4%23-29 £68.94 £68.52 - 0.6%30-39 £63.82 £63.95 + 0.2%40-49 £60.53 £60.56 + 0.0%50-59 £56.88 £57.00 + 0.2%60-69 £50.90 £50.95 + 0.1%70+ £48.54 £49.26 + 1.5%
Combined summary by age - all channels
ShoparoundAge 2016 Q4 2017 Q1 Change17-22 £167.24 £165.84 - 0.8%23-29 £174.59 £174.97 + 0.2%30-39 £162.85 £162.81 - 0.0%40-49 £159.26 £158.57 - 0.4%50-59 £151.44 £151.64 + 0.1%60-69 £135.41 £136.15 + 0.5%70+ £134.40 £134.88 + 0.4%
AA BIPI - Home Insurance Shoparound Movements
Buildings summary by property - all channels
ShoparoundProperty type 2016 Q4 2017 Q1 ChangeBungalow £106.31 £107.06 + 0.7%Detached £128.74 £129.31 + 0.4%End Terraced £101.82 £101.51 - 0.3%Flat £116.32 £117.35 + 0.9%Semi Detached £101.20 £100.80 - 0.4%Terraced £108.48 £108.85 + 0.3%
Contents summary by property - all channels
ShoparoundProperty type 2016 Q4 2017 Q1 ChangeBungalow £55.65 £55.85 + 0.4%Detached £61.81 £61.92 + 0.2%End Terraced £61.99 £61.25 - 1.2%Flat £63.10 £63.63 + 0.8%Semi Detached £58.01 £58.11 + 0.2%Terraced £61.05 £61.02 - 0.1%
Combined summary by property - all channels
ShoparoundProperty type 2016 Q4 2017 Q1 ChangeBungalow £147.08 £146.50 - 0.4%Detached £174.67 £174.53 - 0.1%End Terraced £147.65 £147.52 - 0.1%Flat £171.70 £174.18 + 1.4%Semi Detached £142.74 £142.16 - 0.4%Terraced £153.90 £154.20 + 0.2%
AA BIPI - Home Insurance Shoparound Movements
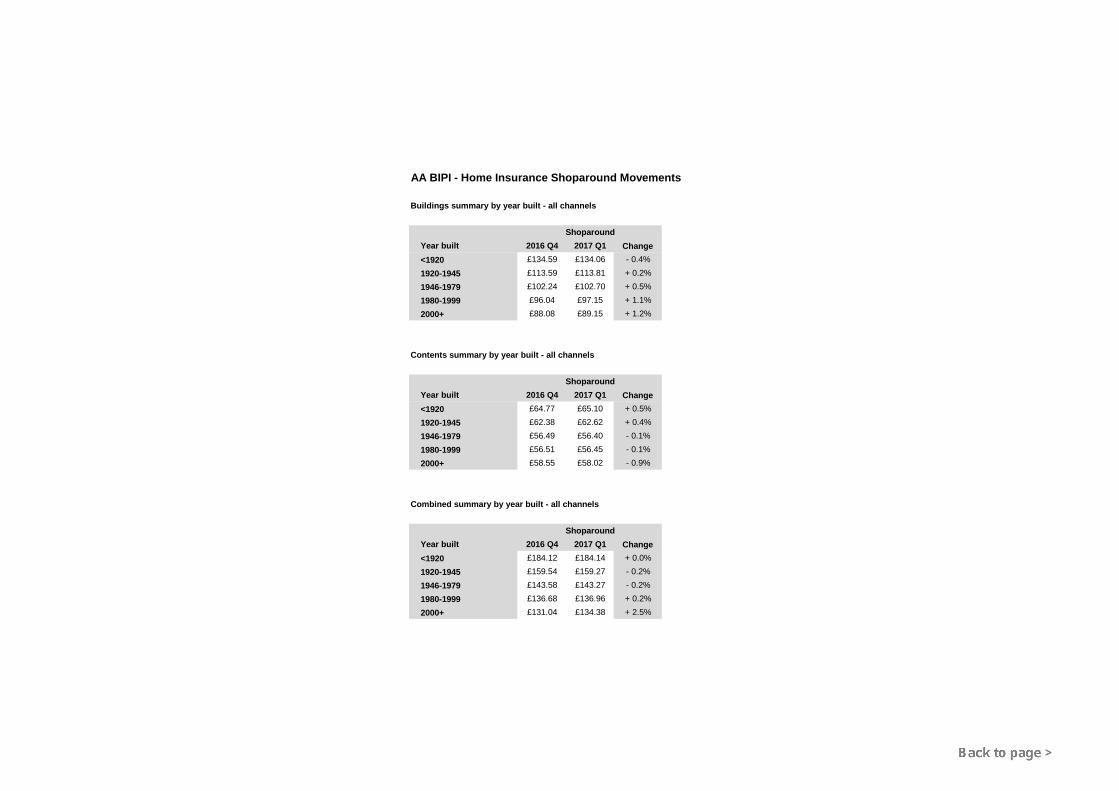
Buildings summary by year built - all channels
ShoparoundYear built 2016 Q4 2017 Q1 Change<1920 £134.59 £134.06 - 0.4%1920-1945 £113.59 £113.81 + 0.2%1946-1979 £102.24 £102.70 + 0.5%1980-1999 £96.04 £97.15 + 1.1%2000+ £88.08 £89.15 + 1.2%
Contents summary by year built - all channels
ShoparoundYear built 2016 Q4 2017 Q1 Change<1920 £64.77 £65.10 + 0.5%1920-1945 £62.38 £62.62 + 0.4%1946-1979 £56.49 £56.40 - 0.1%1980-1999 £56.51 £56.45 - 0.1%2000+ £58.55 £58.02 - 0.9%
Combined summary by year built - all channels
ShoparoundYear built 2016 Q4 2017 Q1 Change<1920 £184.12 £184.14 + 0.0%1920-1945 £159.54 £159.27 - 0.2%1946-1979 £143.58 £143.27 - 0.2%1980-1999 £136.68 £136.96 + 0.2%2000+ £131.04 £134.38 + 2.5%
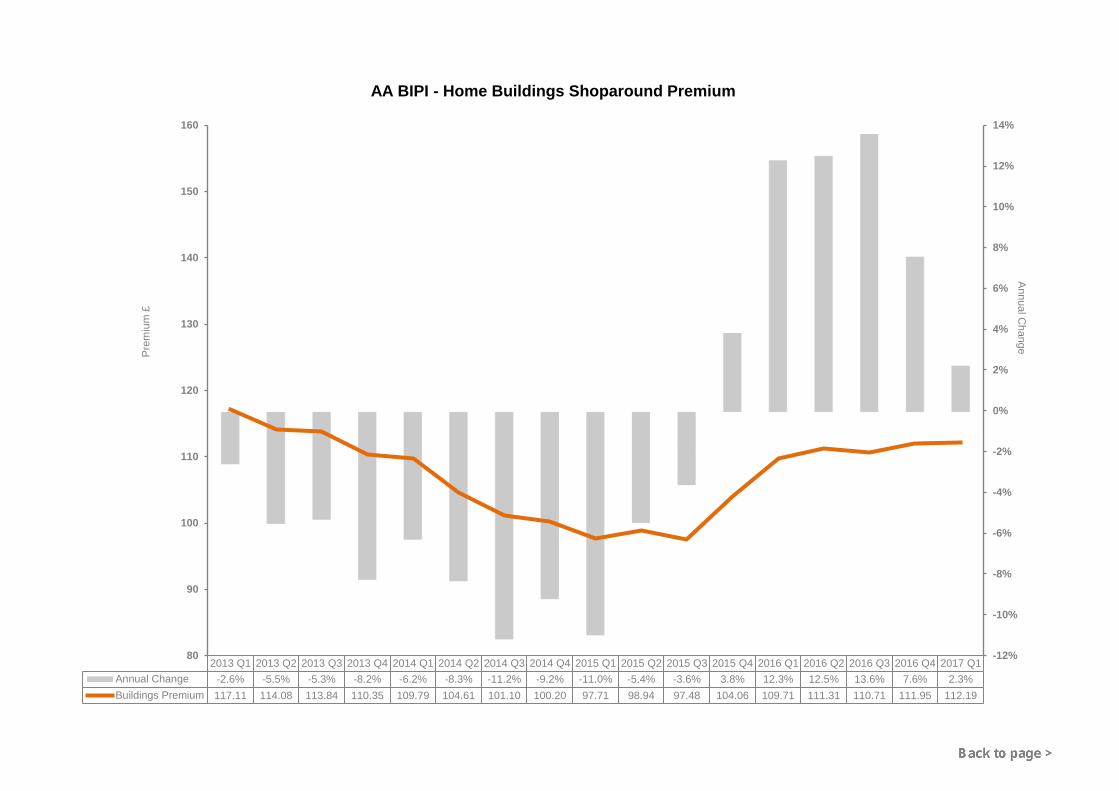
2013 Q1 2013 Q2 2013 Q3 2013 Q4 2014 Q1 2014 Q2 2014 Q3 2014 Q4 2015 Q1 2015 Q2 2015 Q3 2015 Q4 2016 Q1 2016 Q2 2016 Q3 2016 Q4 2017 Q1Annual Change -2.6% -5.5% -5.3% -8.2% -6.2% -8.3% -11.2% -9.2% -11.0% -5.4% -3.6% 3.8% 12.3% 12.5% 13.6% 7.6% 2.3%Buildings Premium 117.11 114.08 113.84 110.35 109.79 104.61 101.10 100.20 97.71 98.94 97.48 104.06 109.71 111.31 110.71 111.95 112.19
-12%
-10%
-8%
-6%
-4%
-2%
0%
2%
4%
6%
8%
10%
12%
14%
80
90
100
110
120
130
140
150
160
Annual Change
Prem
ium
£
AA BIPI - Home Buildings Shoparound Premium
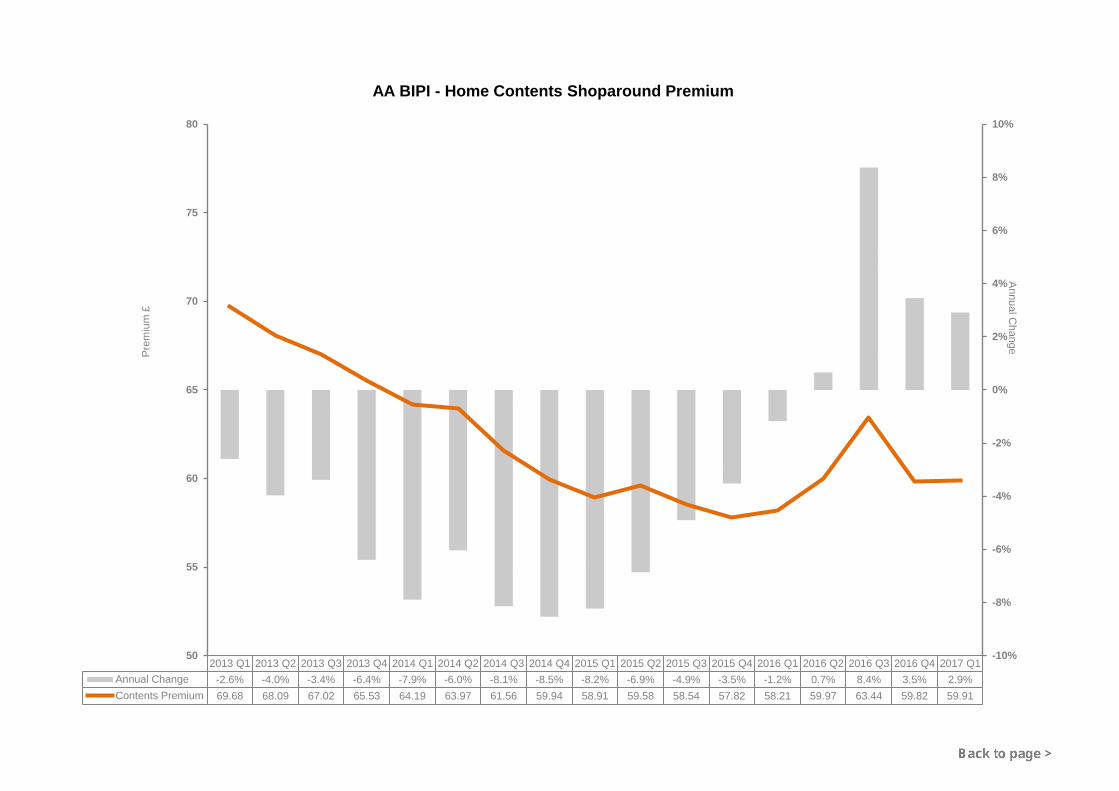
2013 Q1 2013 Q2 2013 Q3 2013 Q4 2014 Q1 2014 Q2 2014 Q3 2014 Q4 2015 Q1 2015 Q2 2015 Q3 2015 Q4 2016 Q1 2016 Q2 2016 Q3 2016 Q4 2017 Q1Annual Change -2.6% -4.0% -3.4% -6.4% -7.9% -6.0% -8.1% -8.5% -8.2% -6.9% -4.9% -3.5% -1.2% 0.7% 8.4% 3.5% 2.9%Contents Premium 69.68 68.09 67.02 65.53 64.19 63.97 61.56 59.94 58.91 59.58 58.54 57.82 58.21 59.97 63.44 59.82 59.91
-10%
-8%
-6%
-4%
-2%
0%
2%
4%
6%
8%
10%
50
55
60
65
70
75
80Annual C
hange
Prem
ium
£
AA BIPI - Home Contents Shoparound Premium
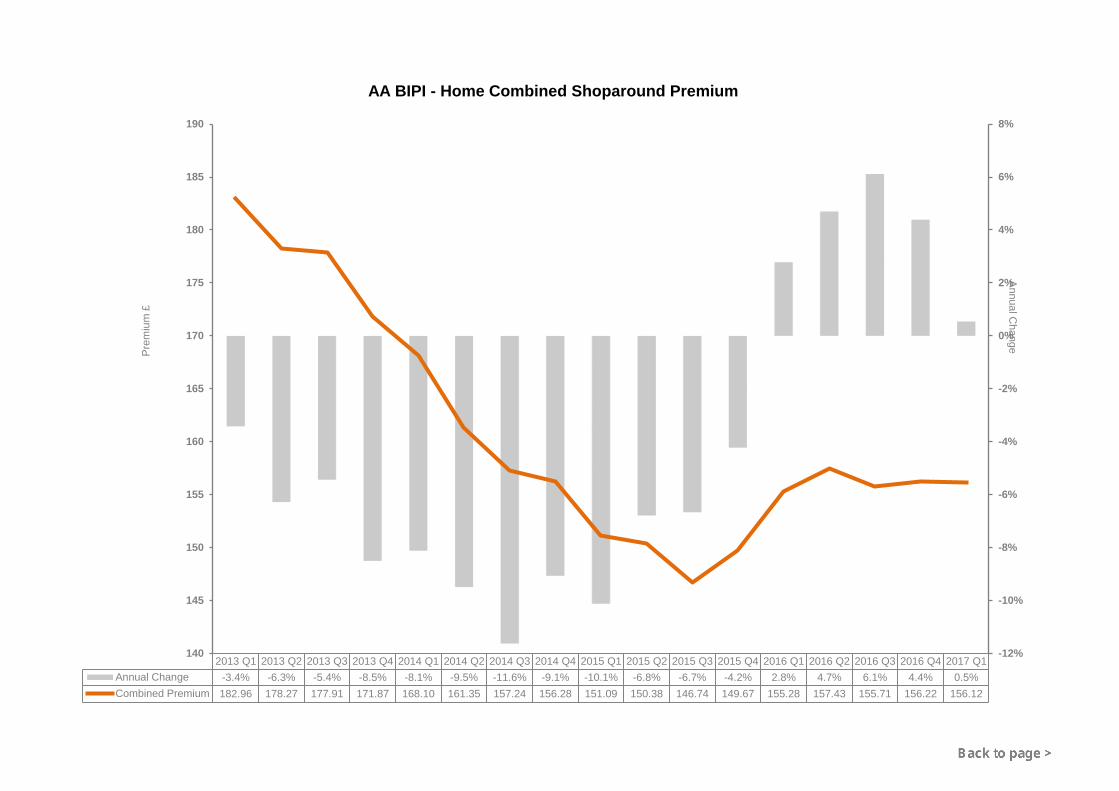
2013 Q1 2013 Q2 2013 Q3 2013 Q4 2014 Q1 2014 Q2 2014 Q3 2014 Q4 2015 Q1 2015 Q2 2015 Q3 2015 Q4 2016 Q1 2016 Q2 2016 Q3 2016 Q4 2017 Q1Annual Change -3.4% -6.3% -5.4% -8.5% -8.1% -9.5% -11.6% -9.1% -10.1% -6.8% -6.7% -4.2% 2.8% 4.7% 6.1% 4.4% 0.5%Combined Premium 182.96 178.27 177.91 171.87 168.10 161.35 157.24 156.28 151.09 150.38 146.74 149.67 155.28 157.43 155.71 156.22 156.12
-12%
-10%
-8%
-6%
-4%
-2%
0%
2%
4%
6%
8%
140
145
150
155
160
165
170
175
180
185
190Annual C
hange
Prem
ium
£
AA BIPI - Home Combined Shoparound Premium
AA BRITISH INSURANCE PREMIUM INDEX - 2017 Q1
Note: IPT at 2.5 per cent was introduced to premiums between July and October 1994IPT was increased to 4% on 1 April 1997 and then to 5% on 1 July 1999 and then to 6% on 4 January 2011 and then to 9.5% on 1 November 2015 and then 10% on1 October 2016Figures shown include IPT, whereas on July 1994 premiums IPT did not apply
Important NoteThe information contained in the British Insurance Premium Index (“Index”) is the AA copyright:
© Automobile Association Insurance Services Limited 2017. All rights reserved.
The information may only be used internally by the business (“Internal Business Use”) on the following terms.
Internal Business Use means use of the information contained in the Index in reports and submissions, that do not carry advertising, in internal business activities. It specifically excludes any commercial use and exploitation including any use whereby the user obtains direct or indirect revenue, for example as part of any publishing activity, promotion, marketing or advertising. The AA Copyright notice must be displayed on all such information.
Press journalists may use the Index for editorial purposes without prior permission.
Any use of the Index other than as above is not permitted without the prior written consent of the AA (details below).
AA excludes all implied warranties and conditions to the fullest extent permitted by law. AA does not in any way warrant the accuracy or completeness of the Index and by using the Index the user acknowledges that it is relying upon its own skill in determining its suitability for any general or specific purposeand accepts that the Index may not be error free.
Automobile Association Insurance Services Limited is an intermediary and is regulated by the Financial Conduct Authority.
For further information, please contact Ian Crowder, telephone 01256 492 844 or email [email protected].