A144 Sample Candidate Work and Commentaries€¦ · · 2018-02-27UNIT A144: SAMPLE CANDIDATE WORK...
74
TWENTY FIRST CENTURY SCIENCE SUITE UNIT A144: VERSION 1 SEPTEMBER 2011 www.gcse-science.com T SAMPLE CANDIDATE WORK AND MARKING COMMENTARIES
Transcript of A144 Sample Candidate Work and Commentaries€¦ · · 2018-02-27UNIT A144: SAMPLE CANDIDATE WORK...

TWENTY FIRST CENTURYSCIENCE SUITE
UNIT A144:
VERSION 1 SEPTEMBER 2011
www.gcse-science.com
T
SAMPLE CANDIDATE WORK AND MARKING
COMMENTARIES

3 WWW.GCSE-SCIENCE.COM
UNIT A144: SAMPLE CANDIDATE WORK AND MARKING COMMENTARIES
CONTENTS Specimen Case Study: Possible effects of air pollution on public health 4
News sheet for candidates 5 Example candidate work: Candidate 1 9 Example candidate work: Candidate 2 21 Example candidate work: Candidate 3 27 Marking commentaries 35
Specimen Practical Data Analysis: Air bladders on bladder wrack seaweed 42
Information for candidates 43 Information for teachers 45 Example candidate work: Candidate 1 49 Example candidate work: Candidate 2 57 Example candidate work: Candidate 3 61 Marking commentaries 65

WWW.GCSE-SCIENCE.COM 4
UNIT A144: SAMPLE CANDIDATE WORK AND MARKING COMMENTARIES
Specimen Case Study:
Possible effects of air pollution on public health

5 WWW.GCSE-SCIENCE.COM
UNIT A144: SAMPLE CANDIDATE WORK AND MARKING COMMENTARIES
For Assessment Submission in 201# GCSE TWENTY FIRST CENTURY SCIENCE SCIENCE A A144 Case Study Possible effects of air pollution on public health CONTROLLED ASSESSMENT NEWS SHEET FOR CANDIDATES
• To be issued to candidates at the start of the task. • This News Sheet contains some information about: Possible effects of air pollution
on public health. • The articles give information about some of the research which has been done on
Possible effects of air pollution on public health, and some of the opinions that have been published. The people who wrote the articles do not all agree.
• Read the articles and then choose a question about Possible effects of air pollution on public health for your Case Study.
• Your report must show clearly where your information has come from. • Your quality of written communication will be assessed. • The total number of marks for this Controlled Assessment task is 32. • This Controlled Assessment task is valid for submission in the June 201# examination
series only. This document consists of 4 pages. Any blank pages are indicated
Teachers are responsible for ensuring that assessment is carried out against the Controlled Assessment set for the relevant examination series (detailed above).
Assessment evidence produced that does not reflect the relevant examination series will not be accepted.
This assessment will be changed every year. Please check on OCR Interchange that you have the Controlled Assessment material valid for the appropriate assessment session.

WWW.GCSE-SCIENCE.COM 6
UNIT A144: SAMPLE CANDIDATE WORK AND MARKING COMMENTARIES
Air pollution and public health
Study proves the cause of asthma BBC News Website
Its hard to avoid pollutants in the air – you can’t just stop breathing! Air pollution has been linked with asthma for some time, but proof has always proved elusive. Now support for a direct link comes from a study of over 600 primary school children, which found that respiratory disorders got worse as air pollution increased.
advertisement Protect your health from urban smog!
Millions die each year across the World from breathing traffic fumes!
Driver, passenger or pedestrian, you can breathe cleaner air with Twenty-first century personal filters.
© iStockphoto.com / Dane Wirtzfield
The study spread over 3 years at the University of Groningen in the Netherlands. Results were published in The Lancet medical journal. Children, from town and country areas, kept diaries of asthma symptoms and tested their lung capacity three times a day. When air pollution was higher, these children were much more likely to suffer breathing problems.
When there were more particulates - bits larger than 10 micrometres - in the air, these children were up to 139% more likely to suffer. And when there were more of the pollutants that make up car exhaust fumes - black smoke, sulphur dioxide and nitrogen dioxide - they were up to 131% more likely to have such symptoms.
Researchers claimed that the length of the study, and its careful links to clinical symptoms, helped to prove a link where other studies could not.
Finding ways to reduce air pollution, such as low or zero emission vehicles, must be an important part of public health policy, the researchers said. The Government has tried to increase the use of diesel cars in Britain by lower fuel taxes. This is called a "green" policy because diesels make less carbon dioxide than petrol-powered engines - but they also emit far more of the particulates.
© iStockphoto.com / Christy Thompson
Keep your children safe on the way to school – the fine filter fabric catches particles and soaks up harmful gases. Buy now – www.21filter.com
Big 10% discount!
This appeared in a reader’s blog in response to the article:
It may be the coffin they carry you off in
but its the car that causes the “coff”!

7 WWW.GCSE-SCIENCE.COM
UNIT A144: SAMPLE CANDIDATE WORK AND MARKING COMMENTARIES
Carpets get the blame for asthma From a report published in July 2000
A recent report has blamed fitted carpets for a rise in asthma and other allergies.
Almost every house hold in the UK has some fitted carpets, compared to just 16% in France and 2% in Italy.
The report, based on carpet sales and studies of houses in the South, says that this could be one reason why the UK has the worst record in the world for asthma and allergies. "House dust mites like to live in dark and damp environments and we find a lot of them at the base of a carpet. When you consider that each one produces 20 particles of faeces each day, that is an awful lot in a house full of fitted carpets."
© OCR / Peter Nicolson
The allergen which causes conditions such as asthma is in the faeces. Up to 100,000 dust mites can live in just one square metre of carpet. They are very difficult to remove and can even resist the suction of vacuum cleaners.
The report has many sponsors, including the National Eczema Society, Action Against Allergy and the Women's Environmental Network.
Householders are advised to fit wood, laminate or linoleum floors, rather than carpets. "Where small children are concerned this simple act could save them from a life's suffering with allergies and breathlessness.", said a spokeswoman for the Network.
However, the claims were disputed by experts from the University of Cambridge who said that dust mites in beds were a more likely cause. "The danger with asthma is breathing in the allergen. Particles in a bed are easily spread into the air - just turning over in bed is enough."
School Science As 'Media Slave' Is Condemned
By The Association of British Drivers
Students in future will read newspaper coverage of air quality issues in science lessons which, if they mirror the errors of the past and present, will lead them to conclude that outdoor air quality is getting worse when the opposite is true as it's now better than at any time for hundreds of years and ten times better than the air quality in our homes.
Newspapers and TV news items, if allowed to set the agenda for lessons, will link car emissions with asthma causation, yet asthma cases have increased over a period of time when outdoor air pollution has declined (6). Those with medical knowledge point to the home and enzymes in house dust mite excreta
News flash – November 2004
Researchers in Denver, Colorado compared daily air pollution levels with asthma symptoms for children who were already known to have moderate to severe asthma. Symptoms were monitored over three winters because winter is the season when pollution levels are highest. The numbers of children studied in each year were 41, 63 and 43. They concluded that air pollution seemed to have no effect on asthma flare-ups or lung function.

WWW.GCSE-SCIENCE.COM 8
UNIT A144: SAMPLE CANDIDATE WORK AND MARKING COMMENTARIES
Should we worry about wheezes? By our health correspondent.
Breathe Easy When you breathe in, • you use muscles between
your ribs to lift the ribs up and outwards.
• The diaphragm moves down • this makes more space in
your chest and air moves into your lungs
• Tubes carry air into your lungs. They divide into smaller and smaller tubes.
• At the end of each tube is a tiny air-sac
• blood flows through capillaries round the air sacs,
• oxygen in the air dissolves in the blood and is carried round the body
• carbon dioxide waste from the body passes into the air in the sacs and is breathed out
When you breathe out, the ribs move down and the diaphragm moves up. Air is pushed out of the lungs.
Breathe difficult Asthma is a long-term health condition in which the tubes in the lungs become inflamed and narrow, making it difficult to breathe.
© iStockphoto.com / Daniel Fascia
A peak-flow meter to measure how well you can breathe Asthma is one of a group of allergic conditions, including eczema and hay fever, which often occur together. Symptoms are not present all the time, but can suddenly get worse – this is called an asthma attack.
Once somebody has asthma, attacks can be started by various “triggers” which set off the swelling of the air passages.
© “By permission of Oxford University Press”, pg28-29, (image) from “Twenty First Century Science: Entry Level textbook – 21st Century Science” by Science Education Group University of York edited by Nuffield Curriculum Centre (2006) Free permission, www.oup.com
References: BBC News website’, BBC News: Study 'proves' asthma cause, Friday 12 March 1999, http://news.bbc.co.uk/1/hi/health/295067.stm 3 Carpets get the blame for asthma © ‘BBC News website’, BBC News: Carpets blamed for asthma, Tuesday 11 July 2000, http://news.bbc.co.uk/1/hi/health/828622.stm Page 3 and 4 School Science As ‘Media Slave’ Is Condemned © The Association of British Drivers, http://www.abd.org.uk/pr/505.htm Page 5 Should we worry about wheezes? © “By permission of Oxford University Press”, pg28-29, (image) from “Twenty First Century Science: Entry Level textbook – 21st Century Science” by Science Education Group University of York edited by Nuffield Curriculum Centre (2006) Free permission, www.oup.com Page 6 How big a problem is asthma? © Asthma UK, For journalists: key facts & statistics, http://www.asthma.org.uk/news_media/media_resources/for_journalists_key.html
How big a problem is asthma? 5.4 million people in the UK now need treatment for asthma: • 1.1 million children (1 in 11 of the child population) • 4.3 million adults (1 in 12 of the adult population). There were 1,200 deaths from asthma in the UK in 2006 (40 were children aged 14 years or under). On average, 3 people per day or 1 person every 7 hours dies from asthma You can see that lots of people suffer from the effects of air pollution, sometimes very seriously. Do you have a question about air pollution and health that you would like to find out more about?

9 WWW.GCSE-SCIENCE.COM
UNIT A144: SAMPLE CANDIDATE WORK AND MARKING COMMENTARIES
Specimen Case Study: Possible effects of air pollution on public health
CANDIDATE 1

WWW.GCSE-SCIENCE.COM 10
UNIT A144: SAMPLE CANDIDATE WORK AND MARKING COMMENTARIES
Candidate 1
AArree tthhee rriissee iinn aasstthhmmaa aattttaacckkss
ccaauusseedd bbyy tthhee aaiirr ppoolllluuttiioonn??
Contents:
Page1 Title and contents
Page 2 Introduction
Pages 3 and 4 What is air pollution?
Pages 5 and 6 For’s of air pollution causing asthma
Pages 7 and 8 Against air pollution causing asthma
Pages 9 and 10 What can we do to improve air quality?
Page 10 conclusion

11 WWW.GCSE-SCIENCE.COM
UNIT A144: SAMPLE CANDIDATE WORK AND MARKING COMMENTARIES
IInnttrroodduuccttiioonn
I have been asked to do a Case Study on the subject of “Air Quality”. I was asked to think of a question in relation to the subject and the question I came up with is “Are the rise in Asthma Attacks
Caused by the Air Pollution Levels in the air?”
Firstly I will be finding out some background information about, what the air is made up of and what Asthma is. I will also be trying to find out whether the pollution levels in the air affects asthmatic
patients.
There will be two sides of the argument to whether the pollution levels causes the rise in more ill patients so I will be researching information from the internet, looking in science text books, using scientific knowledge and getting some useful articles and quotes
from scientist or doctors to back each side of the argument.
At the end of the Case Study I will conclude by giving me own opinion of what I think causes the rise in Asthma Attacks.
Resources:
www.twentyfirstcenturyscience.com www.bbc.co.uk
www.abd.ord.uk/asthma www.news.bbc.co.uk/1/hi/health/1099418.stm www.airquality.co.uk/archive/what_causes.php
Twenty first century science, text book.

WWW.GCSE-SCIENCE.COM 12
UNIT A144: SAMPLE CANDIDATE WORK AND MARKING COMMENTARIES
WWhhaatt iiss aaiirr PPoolllluuttiioonn??
When people think about air pollution they usually think about smog, acid rain and other forms of outdoor air pollution, but air
pollution can also exist inside homes and other buildings. Chemical substances and air pollutants arise from a wide variety of sources, although they are mainly a result of the combustion process. The
largest sources include motor vehicles and industry, cars and trucks. They pollute the air during manufacturing; oil refining and
distribution, refuelling Motor vehicles cause both primary and secondary pollution. Primary pollution is emitted directly into the atmosphere; secondary pollution results from chemical reactions
between pollutants in the atmosphere. The following are the major pollutants from motor vehicles: Ozone (O3), Particulate (PM) Nitrogen Oxides (NOx) Carbon monoxide (CO) Sulfur Dioxide
(SO2) Hazardous air pollutants (Toxics)
Pollutant Source What effect does it have?
Carbon monoxide A colorless, odourless, tasteless and relatively inet gas which slowly converts to carbon monoxide over a period of about a month.
• Vehicles burning petrol
• Domestic Fires
• Interferes with the ability of the blood to absorb and circulate oxygen
• Can affect people with heart conditions and can impair co-ordination and attention
• Causes headaches and vomiting
• Large amounts can kill Nitrogen dioxide A reddish, brown, pungent, acidic gas
• Vehicles burning diesel petrol
• Domestic fires • Power stations
burning fossil fuels • Major industry • Lightning
• Can lead to throat and lung infections
• Low level exposure can affect growth a cause damage to plants
• Contributes to the formation of hazes and smog

13 WWW.GCSE-SCIENCE.COM
UNIT A144: SAMPLE CANDIDATE WORK AND MARKING COMMENTARIES
There is no clear link between concentrations of air pollutants and people starting to get asthma, however, people who already have asthma have sensitive breathing tubes, so, anything that causes irritation or makes breathing harder, is likely to trigger an attack or make symptoms worse.
Things that can trigger asthma:
• Tree or gas pollen
• Animal skin flakes
• Dust mite droppings
• Air pollution
• Nuts shellfish
• Food additives
• Dusty material
Two people of different ages with asthma are interviewed about how there asthma affects them in their lives.
Elaine (14) – I use my inhaler before I go swimming, or when it is very cold. When I first noticed my asthma I use to feel very panicky and frightened because I feel as though I couldn’t breathe. But now I have an inhaler so it isn’t so bad.
Dave (27) – I had my first asthma attack when I was cross-country running at school. The doctor gave me an inhaler for more than a year: I gave up sports and was very miserable. Gradually I learnt that the inhaler could control my wheezing and I started to play football again. Now I drive an ambulance rushing round helping other people and my asthma seems to have almost faded away.
“The groups most affected by air pollution include children and the elderly. People with chronic diseases such as emphysema, heart disease and asthma are also more susceptible than the general population.” Quoted by Dr Nathan Rabinovitch.
WWW.GCSE-SCIENCE.COM 14
UNIT A144: SAMPLE CANDIDATE WORK AND MARKING COMMENTARIES
FFoorrss
Many people agree that the main reasons why the increase of asthma attacks are due to the atmospheric pollutants. The UK and
Ireland have the highest rates of asthma in the whole of the European, 13% of the UK adult population has asthma, says a new
report by the European Respiratory Society. The UK and Ireland has the highest death rate from respiratory diseases in the
European Union.
Friends of the Earth Society says that:
One of the most well-known health impacts of air pollution is an increase in asthma attacks. The incidence of asthma appears to have more than doubled in the last 15 years. Some of this increase may be due to changes in how doctors categorize asthma, but it is now widely accepted that the incidence of asthma has increased considerably. Asthma is the most common chronic disease of childhood with around 1 in 7 children affected.
Evidence of a link between pollution and asthma is certainly accumulating, but there is no proof yet of a causal relationship. What we do know, however, the problem is, is that pollution can aggravate asthma symptoms and can also trigger an asthma attack in people who are already asthmatic. There is evidence that use of asthma medication and hospital admissions diagnosed as asthma increase during severe pollution episodes.
The pollutants, which are of most concern in relation to asthma, are ozone, particulates and nitrogen oxides, (shown in the table on page 3). Mixtures of pollutants (secondary pollutants) may also be particularly damaging.
15 WWW.GCSE-SCIENCE.COM
UNIT A144: SAMPLE CANDIDATE WORK AND MARKING COMMENTARIES
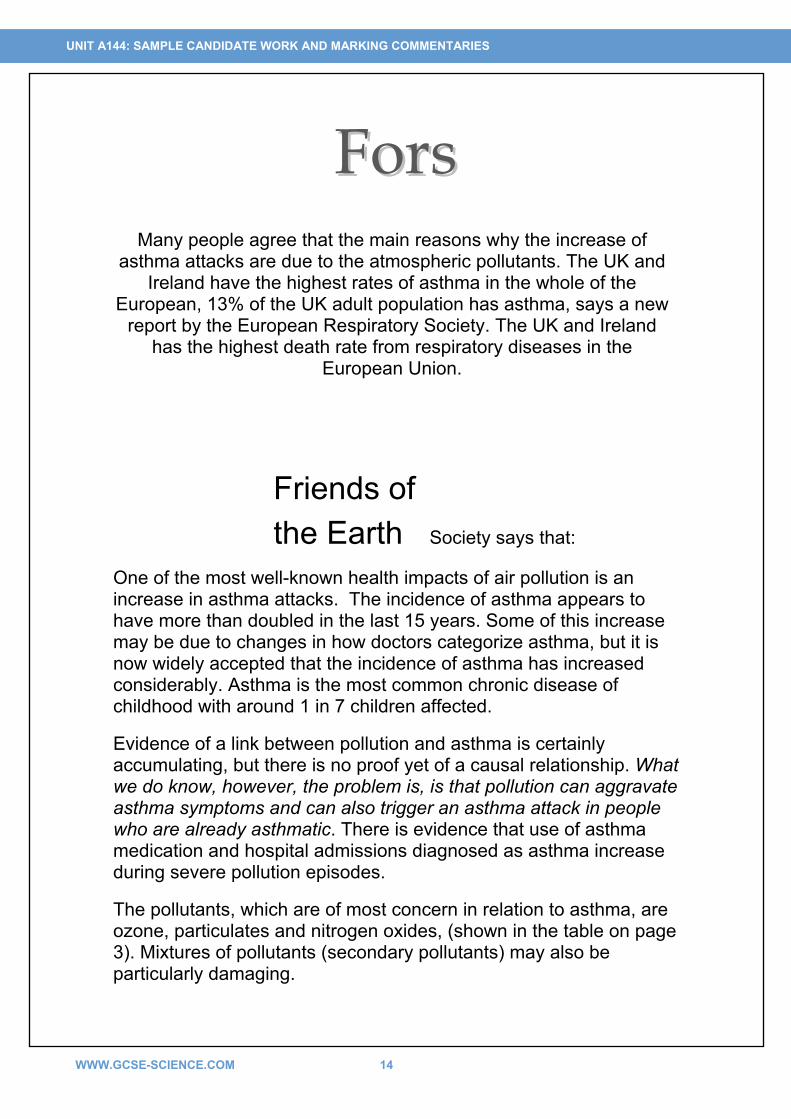
Particulates: Consistent correlation between particle levels and death rates. High levels of particulates have also been linked with increased hospital admissions and asthma attacks. Smaller particles can carry carcinogenic particles into the lungs.
Nitrogen dioxide: May aggravate asthma symptoms. Can cause a tightening of the chest and reduced lung function. Can make airways more sensitive to allergens such as house dust mite. By disrupting the body’s natural cleansing mechanisms nitrogen dioxide may increase the body’s susceptibility to viral infections.
There are several theories on how pollution might trigger asthma attacks. One is that ozone may damage the lining of the airways and allow other allergens, such as pollen or substances from house dust mite etc, to enter and thereby set up the allergic response.
Above is the percentage of each type of pollutant that is released into the atmosphere.
“It’s very clear that air pollution can make asthma worse, so if you live in a city with a lot of air pollution, chances are you will have worse asthma than if you lived in a cleaner environment.” – Dr Nathan Rabinovitch.
This evidence from the “friends of the earth” society and quotes by Dr. Rabinovitch proves that there is a correlation between the air pollution and the rise in asthma attacks.
1 CO
2 sulfer oxides
3 nitrogen oxides
4 VOM
5 particulates

WWW.GCSE-SCIENCE.COM 16
UNIT A144: SAMPLE CANDIDATE WORK AND MARKING COMMENTARIES
AAggaaiinnsstt Air pollution is not the only one suspected factor in the increased incidence of asthma. Many other factors, such as changes in domestic heating and ventilation, diet and exposure to cigarette smoke, have also been implicated.
Many people disagree that ir pollution is the reason why asthma attacks have risen. Some people believe that air pollution is not responsible and therefore are against the question.
“Air pollution does not cause asthma.”
“There is no correlation between levels of vehicle emissions and asthma incidence”
1995 department of Health Study on the causes of asthma – Dr Kenneth Calman Government chief Medical Officer.
Dr Martin Stern of the British Allergy foundation has categorically rejected that asthma is linked to outdoor air pollution. Instead, he links it to the household dust mite and its excreta. Modern living, with central heating, draught-free double-glazing, fitted carpets and poor diet plus lack of exercise provide the ideal environment for the dust mite and its effects on our respiratory system. The proportion of homes with fitted carpets in England, France and Italy is directly proportional to the incidence of asthma in each country.
Allergies are the biggest cause of asthma. Allergies are triggered by reaction of the immune system to allergens, which are materials of biological origin, specifically proteins. Common allergens are:
A Waste from house dust mites – 23% of American homes have
levels sufficient to cause asthma. B Particles from bacteria, fungi, plant fragments, pollen, mould,
etc. C Rubber in latex gloves, the dust from tyres and elsewhere.
17 WWW.GCSE-SCIENCE.COM
UNIT A144: SAMPLE CANDIDATE WORK AND MARKING COMMENTARIES
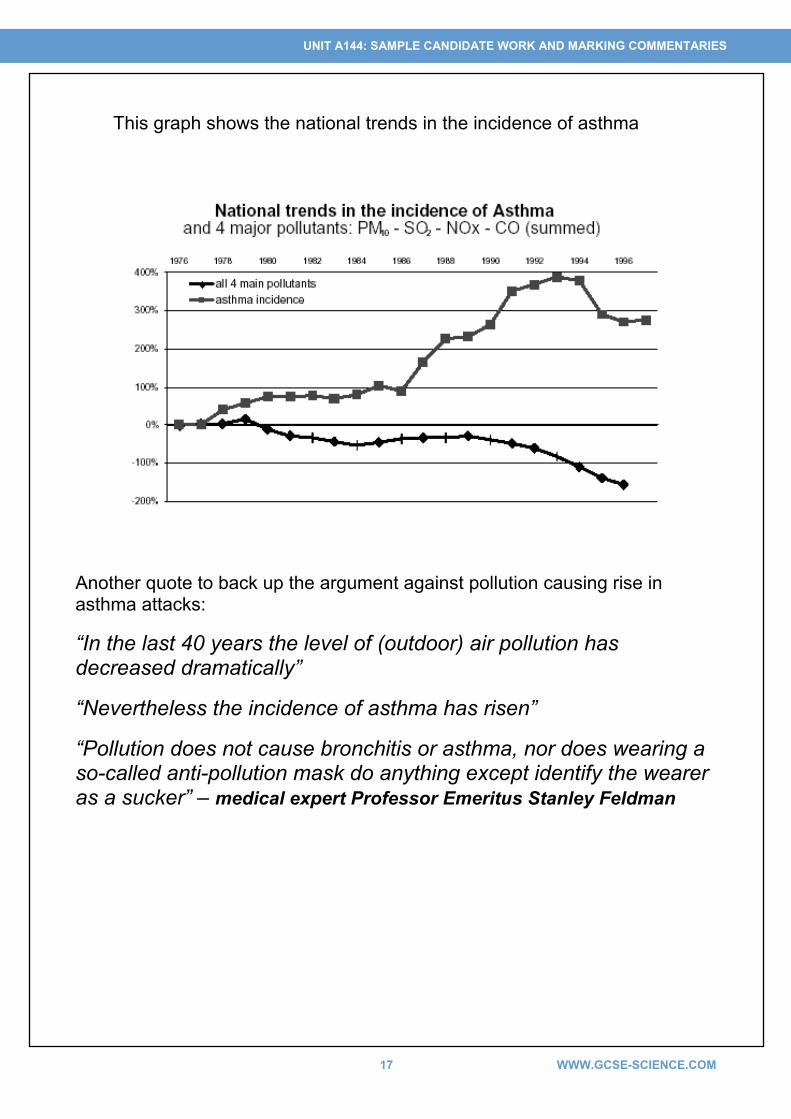
This graph shows the national trends in the incidence of asthma
Another quote to back up the argument against pollution causing rise in asthma attacks:
“In the last 40 years the level of (outdoor) air pollution has decreased dramatically”
“Nevertheless the incidence of asthma has risen”
“Pollution does not cause bronchitis or asthma, nor does wearing a so-called anti-pollution mask do anything except identify the wearer as a sucker” – medical expert Professor Emeritus Stanley Feldman

WWW.GCSE-SCIENCE.COM 18
UNIT A144: SAMPLE CANDIDATE WORK AND MARKING COMMENTARIES
WWhhaatt ccaann wwee ddoo ttoo iimmpprroovvee tthhee aaiirr qquuaalliittyy??
Air quality is very important for people’s health; it is vital that the air quality is clean as it can harm our bodies; people can do many things to improve air quality. When we think about air quality there are 3 main approaches available.
What can scientists and technologists do? Can technological development improve air quality?
What can governments do? Can regulation and taxes help control pollution?
What can individual people do? Are people prepared to change their life style if it improves air quality?
All 3 approaches are needed it we are to have good air quality for ourselves and for the future generations. Air pollution can be reduced in different ways. As vehicles causes the most air pollution it can be reduced by fitting a Catalytic Converter in the engine where it converts Carbon Monoxide + Oxygen produced to a safer gas which is Carbon Dioxide.
The chemical reactions that occur in catalytic converters are:
Carbon Monoxide + Oxygen = Carbon Dioxide
2CO + O2 = 2CO2
Hydrogen fuel cell engines are being developed, using hydrogen as fuel and reducing the amount of CO2 in the atmosphere.
Scientists can also remove almost all sulphur from power stations and chimney compounds from natural gas before it is used for power stations and domestic heating.

19 WWW.GCSE-SCIENCE.COM
UNIT A144: SAMPLE CANDIDATE WORK AND MARKING COMMENTARIES
Here are lists of things you can do to reduce air pollution: • Walk or ride a bike. • Ride public transit. • Obey the speed limit. • Replace your car’s air filter. • Look for the most efficient, lowest polluting model or even a zero-
polluting electric car. • Paint with a brush, not a sprayer. • Use a push or electric lawn-mower. • Choose air-friendly products.
There are many more ways to reduce air pollution; the list will go on forever. These are just a few examples.

WWW.GCSE-SCIENCE.COM 20
UNIT A144: SAMPLE CANDIDATE WORK AND MARKING COMMENTARIES
CCoonncclluussiioonn
From all the information I have collected about the causes of asthma, I have come to a conclusion. In my opinion, I think that air pollution is not highly responsible for the increase in asthma attacks because I agree with Dr Nathan Rabinovitch that air pollution makes asthma worse, air pollution is one of the main triggers however I don’t think that the death rates of asthma is caused by the air pollution, I also agree with Dr Martin Stern that allergies are the main cause of asthma. I believe that more indoor pollution such as particulates in the air and dust mites are the main reason for the rise in asthma attacks as also said by Dr Martin Stern. The graph showing the trends in the incidence of asthma shows that the 4 main pollutants do not cause more incidence of asthma. On the other hand, I disagree with “The Friends of the Earth Society” because they do not have enough evidence to prove that deaths of asthma are related to air pollution and their resources are slightly biast and are not very reliable as they have just used any information to back there argument. I would rather believe what a doctor or a scientist would say as they are more experienced and have scientific knowledge to support there views. I have also found out that asthmatic people are sensitive to breathing and different people are affected by asthma in different ways, some people are triggered by different things such as grass pollen, dust mite droppings and animal hair, so this tells us that not just air pollution causes the rise in asthma attacks. Scientific evidence such as graphs and quotes by scientists and doctors helps me to make this decision so therefore I am also against the question.

21 WWW.GCSE-SCIENCE.COM
UNIT A144: SAMPLE CANDIDATE WORK AND MARKING COMMENTARIES
Specimen Case Study: Possible effects of air pollution on public health
CANDIDATE 2

WWW.GCSE-SCIENCE.COM 22
UNIT A144: SAMPLE CANDIDATE WORK AND MARKING COMMENTARIES
Candidate 2
Can levels of pollution affect
a town’s tourism?
A case study for GCSE SCience

23 WWW.GCSE-SCIENCE.COM
UNIT A144: SAMPLE CANDIDATE WORK AND MARKING COMMENTARIES
Can levels of pollution affect
a town’s tourism? Towns like York depend on tourists in order for their businesses to survive, that’s why it is important for a town to be appealing to visitors.
What does tourism mean?
Noun: the business of providing services to tourists.
This means that towns have to not only make sure it has a varied type of businesses to please the tourists, such as shops and places to work, so that it stands out from other towns, but also to make sure its is a clean and pollutant free place from air pollution. That is why I have chosen the question “Can levels of pollution affects a towns tourism?” To see weather a town needs a competitive range of shops or a pollution free air to lure tourists to their towns. Pollutants can damage our health long and short term. People who have asthma can find that their symptoms become worse when there is pollution in the air, by chemicals from car fumes or factories giving off gases. Pollutants can come in many forms but mostly invisible in exception to smoke which is made up of tiny bits of solid called particulates which can get into sufferers lungs.

WWW.GCSE-SCIENCE.COM 24
UNIT A144: SAMPLE CANDIDATE WORK AND MARKING COMMENTARIES
Types of pollutants: Much of air pollution comes from cars, buses and lorries
Sulphur dioxide SO2 – causes acid rain Carbon monoxide CO – poisonous Nitrogen dioxide NO2 – acid rain and asthma Particulates – sort of soot, very small, causes lung problems Ozone O3 – irritates eyes and nose
Air pollution can consist of smog, acid rain and CFCs plus other outdoor pollution, but air pollution can also be found inside because of chemicals and wear away at rock and brick making it less stable which can lead to the collapse of buildings.
Pollution can be heavily congested in cities such as York. It can spread out as it is in such a small area. That is why pollution is found in cities rather than in the countryside.
Tourism is more in the cities though because of job opportunities and the range of shops. Even though the pollution levels are higher in cities than in the countryside.
Plants can die in the result of over exposure to pollution and can affect its growth.
Towns need beauty to attract tourists and if plants are being killed a town has no attraction to bring tourists to the town.
“Clean” smoke from dirty rubbish Recycle everything – improve the environment

25 WWW.GCSE-SCIENCE.COM
UNIT A144: SAMPLE CANDIDATE WORK AND MARKING COMMENTARIES
Pollution can also affect animals. To reduce the pollution levels, some things have been done, such as in Malasia after a forest fire that was caused by air pollution they started to take action in reducing the levels of air pollution and smog by cutting down on rubbish burning.
In the ZOOL newspaper from Malaysia in July 11th 2001
“First we cut down on home burning, this will reduce air pollution, and cut down on forest fires.”
In the same article, a Mr Mowaba says:
“Not only does asir pollution affect a countries economy, material and vegetation damage, but it also reduces tourism.”
This shows that some people agree that pollution affects a town’s tourism; by the way that air pollution can affect a towns beauty by killing plants and animals, and damaging buildings. So some people agree that with the question “Can pollution affect a towns tourism?” The PDEQ says: “Air pollution can affect tourism and the ability of businesses and institutions to recruit quality workers to save the problem” H Josef Hebert, Associated Press writer says: “The growing problem of polluted air in towns is disappointing tourists and keeping some away.”

WWW.GCSE-SCIENCE.COM 26
UNIT A144: SAMPLE CANDIDATE WORK AND MARKING COMMENTARIES
Some people that disagree with the question
“Can air pollution affect a towns tourism?” Francis Sherman – head of Europe’s tourist board “Pollution in no way affects a tourist’s decision to visit a place, it is clearly down to the level of facilities in a town” Air quality graphs of Edinburgh London and Oxford all show levels of pollution in the air In Edinburgh it shows – Carbon Monoxide
Nitric oxide Nitrogen oxide
Nitrogen dioxide
Sulphur dioxide
Mean particles
high low medium medium low high London, Westminster pollution levels Carbon Monoxide
Nitric oxide Nitrogen oxide
Nitrogen dioxide
Sulphur dioxide
Mean particles
medium high medium low low medium Oxford pollution levels Carbon Monoxide
Nitric oxide Nitrogen oxide
Nitrogen dioxide
Sulphur dioxide
Mean particles
low medium high low medium low This shows that pollution may be high in an area of high tourism, but this does not affect how many tourists that visit a town. As there is a high level interest in the town to overcome the level of pollution in the air. These points shows that pollution takes a big part in the tourism business as it affects how a town is perceived, in how clean and well presented it is, I beauty in plants and structural buildings to attract tourists and if this is affected think that pollution does affect a towns tourism as it shows here that a town needs by pollution, then this means that it affects a towns tourism. www.ask.co.uk/pollution/tourism
www.pdeq.com
www.zool/2001/pollution.com

27 WWW.GCSE-SCIENCE.COM
UNIT A144: SAMPLE CANDIDATE WORK AND MARKING COMMENTARIES
Specimen Case Study: Possible effects of air pollution on public health
CANDIDATE 3

WWW.GCSE-SCIENCE.COM 28
UNIT A144: SAMPLE CANDIDATE WORK AND MARKING COMMENTARIES
Candidate 3
AArree tthhee GGoovveerrnnmmeenntt
ddooiinngg eennoouugghh
ttoo rreedduuccee aaiirr ppoolllluuttiioonn??

29 WWW.GCSE-SCIENCE.COM
UNIT A144: SAMPLE CANDIDATE WORK AND MARKING COMMENTARIES
IInnttrroodduuccttiioonn:: Air pollution is the contamination of air by the discharge of harmful substances. Ever since primitive people began burning fuels air pollution has been an increasing problem. In my case study, I shall find out what can be done to reduce this problem, and whether the government should take more responsibility for it.
WWhhaatt iiss aaiirr ppoolllluuttiioonn?? Air consists of a mixture of gases –
Gas Percentage by volume
Nitrogen (N2) Oxygen (O2) Argon (Ar) Carbon Dioxide (CO2) Water vapour (H2O)
78 21 1
0.03 Variable 0 - 4
Air can be contaminated naturally, for example by pollen or dust blown up by winds, or by methane from ruminant animals or rotting vegetation. However, these natural pollutants have always been present. It is the extra pollutants added by human actions which are causing increasing concern. Air pollution can cause health problems including burning eyes and nose, itchy, irritated throat and breathing problems. Air pollution can trigger asthma attacks and may cause the onset of asthma in new patients. Above certain concentrations and exposure times, some air pollutants are extremely dangerous, causing severe injury or even death. Air pollution can also damage the environment and people’s properties. Trees, lakes and animals have been harmed by air pollution. The industrial revolution during the 18th Century began the large-scale burning of fuels as sources of energy. Power stations are huge sources of air pollution, as are road vehicles, ships, trains and aeroplanes.
WWW.GCSE-SCIENCE.COM 30
UNIT A144: SAMPLE CANDIDATE WORK AND MARKING COMMENTARIES
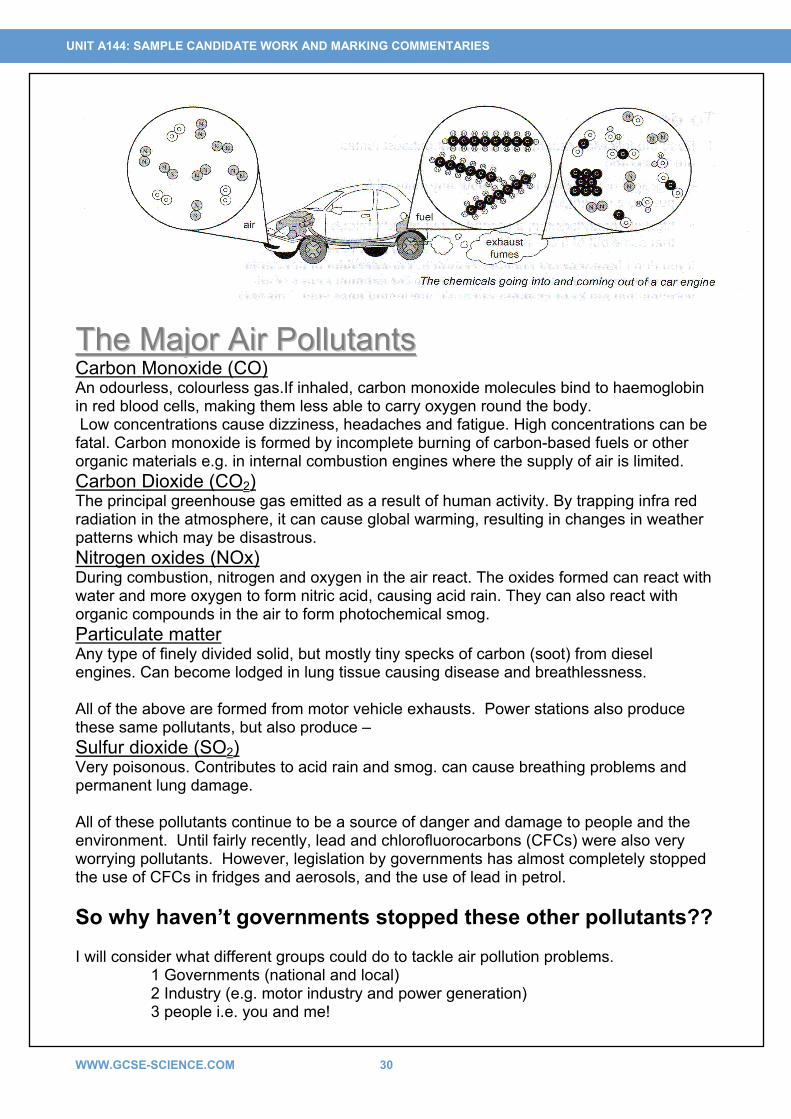
TThhee MMaajjoorr AAiirr PPoolllluuttaannttss Carbon Monoxide (CO) An odourless, colourless gas.If inhaled, carbon monoxide molecules bind to haemoglobin in red blood cells, making them less able to carry oxygen round the body. Low concentrations cause dizziness, headaches and fatigue. High concentrations can be fatal. Carbon monoxide is formed by incomplete burning of carbon-based fuels or other organic materials e.g. in internal combustion engines where the supply of air is limited. Carbon Dioxide (CO2) The principal greenhouse gas emitted as a result of human activity. By trapping infra red radiation in the atmosphere, it can cause global warming, resulting in changes in weather patterns which may be disastrous. Nitrogen oxides (NOx) During combustion, nitrogen and oxygen in the air react. The oxides formed can react with water and more oxygen to form nitric acid, causing acid rain. They can also react with organic compounds in the air to form photochemical smog. Particulate matter Any type of finely divided solid, but mostly tiny specks of carbon (soot) from diesel engines. Can become lodged in lung tissue causing disease and breathlessness. All of the above are formed from motor vehicle exhausts. Power stations also produce these same pollutants, but also produce – Sulfur dioxide (SO2) Very poisonous. Contributes to acid rain and smog. can cause breathing problems and permanent lung damage. All of these pollutants continue to be a source of danger and damage to people and the environment. Until fairly recently, lead and chlorofluorocarbons (CFCs) were also very worrying pollutants. However, legislation by governments has almost completely stopped the use of CFCs in fridges and aerosols, and the use of lead in petrol. So why haven’t governments stopped these other pollutants?? I will consider what different groups could do to tackle air pollution problems.
1 Governments (national and local) 2 Industry (e.g. motor industry and power generation) 3 people i.e. you and me!

31 WWW.GCSE-SCIENCE.COM
UNIT A144: SAMPLE CANDIDATE WORK AND MARKING COMMENTARIES
WWhhaatt ccaann ggoovveerrnnmmeenntt ddoo?? For vehicles to travel on the roads they must pay a Road Fund Licence Tax. The government has decided that the amount of tax will be linked to the amount of pollution caused by each vehicle.
Rating band
Amount of CO2 emitted Tax per year
A 0 – 100 £0.00 B 101 – 110 £20.00 C 111 – 120 £30.00 D 121 – 130 £90.00 E 131 – 140 £110.00 F 141 – 150 £125.00 G 151 – 165 £155.00 H 166 – 175 £180.00 I 176 – 185 £200.00 J 186 – 200 £235.00 K 201 – 225 £245.00 L 226 – 255 £425.00 M over 255 £435.00
The idea is that this tax will discourage people from using cars which burn a lot of fuel. However, the tax does not take notice of the number of miles driven, so it is not directly proportional to the amount of pollution caused. Also, the money raised does not go to research on ways of reducing pollution even further. This is a National Government action.
Some local councils have introduced “congestion charges” which make drivers pay to enter the busiest areas. This will reduce the amount of pollution in these areas where very high levels of pollution would otherwise happen.
GOVERNMENT ACTION
Ban cars from certain areas (pedestrian streets and shopping areas)
Congestion charges for driving in busiest areas
Trams/better public transport
Higher tax on more polluting vehicles
Raise fuel tax
MOT tests to make sure cars run efficiently

WWW.GCSE-SCIENCE.COM 32
UNIT A144: SAMPLE CANDIDATE WORK AND MARKING COMMENTARIES
WWhhaatt ccaann ccaarr mmaannuuffaaccttuurreerrss ddoo?? Higher fuel costs, taxes and public awareness have put pressure on car makers to design smaller, lighter, more fuel efficient cars and engines.
DEVELOPMENTS IN CAR TECHNOLOGY Although all of these things are under development, it is interesting to note how many manufacturers now offer “super-cars” designed for high speed, with very large engines that burn enormous amounts of fuel. In effect, these manufacturers are throwing the responsibility for choice back onto my third group – the consumers!
Electric cars / fuel cell / hydrogen technology
Remove traces of sulphur from fuels before use
Better engine design / lean burn engines which use less fuel Fit improved catalytic converters to
reduce pollution by CO or NOx

33 WWW.GCSE-SCIENCE.COM
UNIT A144: SAMPLE CANDIDATE WORK AND MARKING COMMENTARIES
WWhhaatt ccaann tthhee ccoonnssuummeerr ddoo?? (In other words, you and me!!) Some environmental groups want people to make dramatic changes in their life-style to reduce their energy demand (or “carbon footprint”). Since the effects of air pollution are diffuse and un-dramatic on a personal scale, it is unreasonable to expect people to abandon things they have grown used to. However, in Scotland there is a saying – “Mony a mickle maks a muckle”. In other words, a lot of little things added together can add up to a very big effect. If each person can do just a little to use less energy, the effect over the whole country would be very large. We use lots of energy keeping our homes warm in winter, and much air pollution comes from the power stations that generate this energy. Energy saving in the home reduces pollution (and saves you money!).
• Use energy saving light bulbs • turn off lights, TV etc when not needed • set your thermostat just a little bit lower • fit double glazing • install better loft insulation • insulate cavity walls
The government helps with some of these, for example by offering grants to help pay for better loft insulation. We can also help by small changes in life-style -
• Walk or ride a bike. • Use public transport. • Drive slower and avoid sudden changes of speed (reduces fuel consumption). • Buy the most efficient, lowest polluting car or even an electric car. • Service your car regularly to keep it efficient. • Use a push-along lawn-mower.

WWW.GCSE-SCIENCE.COM 34
UNIT A144: SAMPLE CANDIDATE WORK AND MARKING COMMENTARIES
CCoonncclluussiioonn:: All three groups are making efforts to reduce energy demand and air pollution, but all could do more. The changes I have listed in this case study would help a lot – if everyone knew about them and understood how important they are. Air quality in most developed countries is much better than 100 years ago. With better information and education, we could all help to make it better still.

35 WWW.GCSE-SCIENCE.COM
UNIT A144: SAMPLE CANDIDATE WORK AND MARKING COMMENTARIES
Specimen Case Study: Possible effects of air pollution on public health
MARKING COMMENTARIES

WWW.GCSE-SCIENCE.COM 36
UNIT A144: SAMPLE CANDIDATE WORK AND MARKING COMMENTARIES
CANDIDATE 1
Title of the work: Is the rise in asthma attacks caused by the air pollution? Marks awarded:
Strand 0 1 2 3 4 5 6 7 8 Mark
A(a) collecting information 3
A(b) evaluation and acknowledgement of sources
2
B science content 6
C(a) comparing views 5
C(b) conclusions and recommendations
6
General summary: A carefully structured and attractively presented study. There is a review of some of the key gases which contribute towards air pollution, and some information about asthma as a health condition, though both lack the detail required for the highest mark band. A conclusion is given and some suggestions for reducing air pollution are given, though conclusion and suggested actions are not clearly linked. The conclusion is linked to the evidence given, but this is rather limited in amount and sources are not fully acknowledged. Detailed commentary:
Strand Commentary Mark
A(a) Seven sources are listed and these cover a variety of different views and conflicting opinions. The information selected is relevant to the study, although there is very little supporting evidence for the views given.
3
A(b) Some of the web references are incomplete (home page only, rather than the pages where information was found) and dates are not given. A few quotations are indicated and linked to their source or author, but much of the information is not identified to any source.
2
B The basic scientific evidence needed to understand the issues involved is given. There is a fairly good level of detail about pollutant gases, their sources and effects, and the nature of asthma attacks is indicated. However, there is a lack of detail. The appropriate mark is certainly in the 5 – 6 mark band, and there is just sufficient to allow a match to 6 marks. Spelling and grammar are generally sound, although there are a number of mistakes. Technical and scientific terms are used correctly.
6

37 WWW.GCSE-SCIENCE.COM
UNIT A144: SAMPLE CANDIDATE WORK AND MARKING COMMENTARIES
C(a) Evidence and claims that air pollution causes asthma is collected and
separated from views that other agents are more important causes. There is some attempt to compare the views, but little evidence is offered about the qualifications or status of the various authors and the amount of supporting evidence for each claim is very limited. Different sources have not been compared for apparent reliability.
5
C(b) The conclusion is clear and is linked to the evidence given in the study, but is rather one-sided and does not fully consider the possibility that there are multiple causes of asthma. Some ways of reducing air pollution are given, but without any indication of why this might be a good thing, especially since the conclusion is that air pollution is not the major cause of asthma.
6
Total mark for the Case Study = 22

WWW.GCSE-SCIENCE.COM 38
UNIT A144: SAMPLE CANDIDATE WORK AND MARKING COMMENTARIES
CANDIDATE 2 Title of the work: Can levels of pollution affect a town’s tourism? Marks awarded:
Strand 0 1 2 3 4 5 6 7 8 Mark
A(a) collecting information 2
A(b) evaluation and acknowledgement of sources
2
B science content 3
C(a) comparing views 3
C(b) conclusions and recommendations
3
General summary: This candidate has chosen to look at an aspect of air pollution which is considerably different from the main thrust of the stimulus material in the news-sheet. Candidates should be allowed some freedom in selecting their question to answer, provided that the science core of the topic remains firmly within the field of “effects of air pollution”. However, in this case, tourism itself does not easily relate to relevant science within the specification, and the scientific aspects of air pollution are only fairly briefly dealt with, which limits the marks that can be awarded, particularly in strand B. Detailed commentary: Strand Commentary Mark
A(a) Only three sources are listed. Very little information is given about how pollution might affect tourism and the pieces of information which have been found are not linked in any coherent way. Little, if any, of the information in the news-sheet has been used.
2
A(b) Links to sources of information are few, and only at “site home page” level. Some direct quotes are indicated, though the sources and contexts are not given.
2
B Some major air pollutants are listed, with a brief mention of their principal effects. There is also a mention of effects causing damage to stonework in buildings and to plants, but no details are given. Whilst there is sufficient to merit consideration of the 3-4 mark band, the amount is so limited that 3 marks is the more appropriate award
3
C(a) There is some attempt to sort information “for” or “against” the effect of air quality, but the “no effect” argument is not well represented and there is no attempt to compare or evaluate any of the claims.
3

39 WWW.GCSE-SCIENCE.COM
UNIT A144: SAMPLE CANDIDATE WORK AND MARKING COMMENTARIES
C(b) There is a conclusion, although it is not clearly identified (it is important to
encourage candidates to clearly label key elements in their reports to ensure that they will be recognised and awarded credit). However, it is not clearly linked to the evidence given and there are no suggestions for actions to be taken.
3
Total mark for the Case Study = 13
WWW.GCSE-SCIENCE.COM 40
UNIT A144: SAMPLE CANDIDATE WORK AND MARKING COMMENTARIES
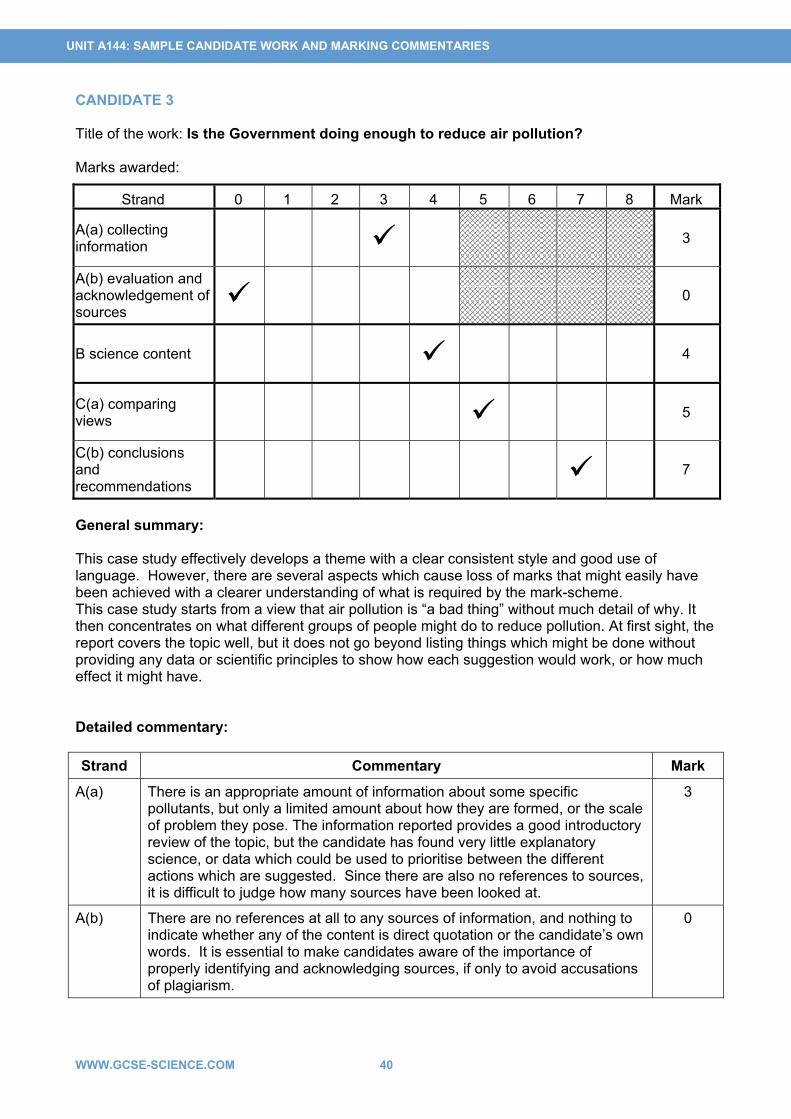
CANDIDATE 3 Title of the work: Is the Government doing enough to reduce air pollution? Marks awarded:
Strand 0 1 2 3 4 5 6 7 8 Mark
A(a) collecting information 3
A(b) evaluation and acknowledgement of sources
0
B science content 4
C(a) comparing views 5
C(b) conclusions and recommendations
7
General summary: This case study effectively develops a theme with a clear consistent style and good use of language. However, there are several aspects which cause loss of marks that might easily have been achieved with a clearer understanding of what is required by the mark-scheme. This case study starts from a view that air pollution is “a bad thing” without much detail of why. It then concentrates on what different groups of people might do to reduce pollution. At first sight, the report covers the topic well, but it does not go beyond listing things which might be done without providing any data or scientific principles to show how each suggestion would work, or how much effect it might have. Detailed commentary: Strand Commentary Mark
A(a) There is an appropriate amount of information about some specific pollutants, but only a limited amount about how they are formed, or the scale of problem they pose. The information reported provides a good introductory review of the topic, but the candidate has found very little explanatory science, or data which could be used to prioritise between the different actions which are suggested. Since there are also no references to sources, it is difficult to judge how many sources have been looked at.
3
A(b) There are no references at all to any sources of information, and nothing to indicate whether any of the content is direct quotation or the candidate’s own words. It is essential to make candidates aware of the importance of properly identifying and acknowledging sources, if only to avoid accusations of plagiarism.
0

41 WWW.GCSE-SCIENCE.COM
UNIT A144: SAMPLE CANDIDATE WORK AND MARKING COMMENTARIES
B Some major pollutants are identified with a brief indication of their effects.
However, there is nothing which allows a comparison of sources, or the magnitude of their effects. One or two effects of air pollution are mentioned, but with no explanation of how they occur. This is not more than a basic outline of key issues in the topic.
4
C(a) Because this study is essentially a review of a range of possible actions, rather than a comparison of opposing arguments, it does not easily match to the mark descriptors. However, there is a good deal about pollutants and an outline of some counter measures, so a little more than 4, but not a secure match to 6
5
C(b) Here the conclusion is that “more needs to be done” and a range of suggested actions is given, linked to different groups in the community.
7
Total mark for the Case Study = 19

WWW.GCSE-SCIENCE.COM 42
UNIT A144: SAMPLE CANDIDATE WORK AND MARKING COMMENTARIES
Specimen Practical Data Analysis:
Air bladders on bladder wrack seaweed

43 WWW.GCSE-SCIENCE.COM
UNIT A144: SAMPLE CANDIDATE WORK AND MARKING COMMENTARIES
For Assessment Submission in June 201# GCSE TWENTY FIRST CENTURY SCIENCE SCIENCE A A144 Practical Data Analysis Air bladders on bladder wrack seaweed CONTROLLED ASSESSMENT INFORMATION FOR CANDIDATES
• To be issued to candidates at the start of the task. • Your quality of written communication will be assessed. • The total number of marks for this Controlled Assessment task is 32. • This Controlled Assessment task is valid for submission in the June 201# examination series
only. • This document consists of 2 pages. Any blank pages are indicated.
Teachers are responsible for ensuring that assessment is carried out against the Controlled Assessment set for the relevant examination series (detailed above).
Assessment evidence produced that does not reflect the relevant examination series will not be accepted.
Turn over
This assessment will be changed every year. Please check on OCR Interchange that you have the Controlled Assessment material valid for the appropriate assessment session.
WWW.GCSE-SCIENCE.COM 44
UNIT A144: SAMPLE CANDIDATE WORK AND MARKING COMMENTARIES
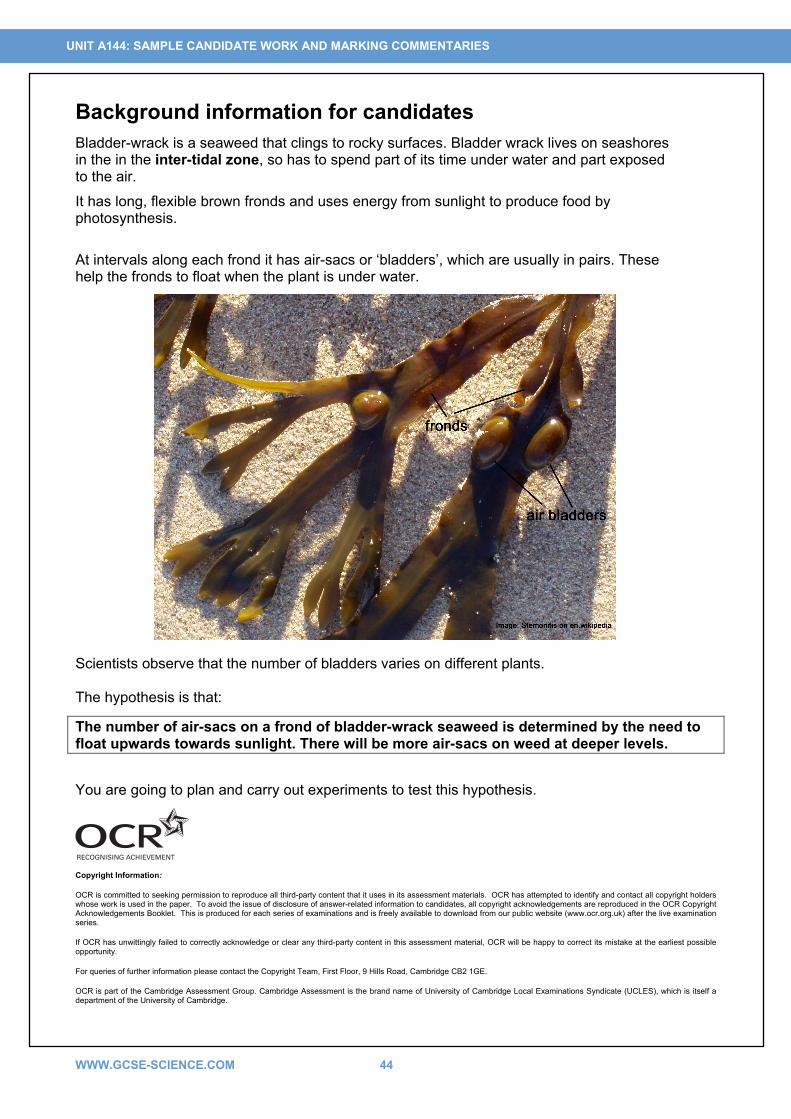
Background information for candidates Bladder-wrack is a seaweed that clings to rocky surfaces. Bladder wrack lives on seashores in the in the inter-tidal zone, so has to spend part of its time under water and part exposed to the air.
It has long, flexible brown fronds and uses energy from sunlight to produce food by photosynthesis.
At intervals along each frond it has air-sacs or ‘bladders’, which are usually in pairs. These help the fronds to float when the plant is under water. Scientists observe that the number of bladders varies on different plants. The hypothesis is that:
The number of air-sacs on a frond of bladder-wrack seaweed is determined by the need to float upwards towards sunlight. There will be more air-sacs on weed at deeper levels.
You are going to plan and carry out experiments to test this hypothesis.
Copyright Information:
OCR is committed to seeking permission to reproduce all third-party content that it uses in its assessment materials. OCR has attempted to identify and contact all copyright holders whose work is used in the paper. To avoid the issue of disclosure of answer-related information to candidates, all copyright acknowledgements are reproduced in the OCR Copyright Acknowledgements Booklet. This is produced for each series of examinations and is freely available to download from our public website (www.ocr.org.uk) after the live examination series.
If OCR has unwittingly failed to correctly acknowledge or clear any third-party content in this assessment material, OCR will be happy to correct its mistake at the earliest possible opportunity.
For queries of further information please contact the Copyright Team, First Floor, 9 Hills Road, Cambridge CB2 1GE.
OCR is part of the Cambridge Assessment Group. Cambridge Assessment is the brand name of University of Cambridge Local Examinations Syndicate (UCLES), which is itself a department of the University of Cambridge.

45 WWW.GCSE-SCIENCE.COM
UNIT A144: SAMPLE CANDIDATE WORK AND MARKING COMMENTARIES
For Assessment Submission in June 201#
GCSE TWENTY FIRST CENTURY SCIENCE SCIENCE A A144/INST Practical Data Analysis Air bladders on bladder wrack seaweed Second task title Third task title CONTROLLED ASSESSMENT INFORMATION FOR TEACHERS
• This document is confidential to teachers and must not be released to candidates. • For details of the level of control required for this assessment refer to Section 5 of the
specification. • There is one document provided for candidates for each Practical Data Analysis task:
Information for candidates provides an introduction to the task and should be issued to candidates at the start of the task.
• The total number of marks for this Controlled Assessment task is 32. • Internally assessed marks must be submitted by 15 May. • This Controlled Assessment task is valid for submission in the June 201# examination series
only. • This document consists of 4 pages. Any blank pages are indicated.
Teachers are responsible for ensuring that assessment is carried out against the Controlled Assessment set for the relevant examination series (detailed above).
Assessment evidence produced that does not reflect the relevant examination series will not be accepted.
This assessment will be changed every year. Please check on OCR Interchange that you have the Controlled Assessment material valid for the appropriate assessment session.

WWW.GCSE-SCIENCE.COM 46
UNIT A144: SAMPLE CANDIDATE WORK AND MARKING COMMENTARIES
Introduction This ‘Information for teachers’ is confidential and must not be released to candidates.
Three Practical Data Analysis tasks are available as part of the Controlled Assessment of Science A Unit A144 for submission in the June 201# examination series.
These tasks are not valid for submission in any other examination series.
The three Practical Data Analysis tasks which are available for submission in the June 201# examination series are:
• Air bladders on bladder wrack seaweed
Each candidate for Controlled Assessment in the June 201# examination series must present marks for one of these three Practical Data Analysis tasks, together with marks for one of the three Case Study tasks for the same year. All internally assessed marks must be submitted by 15 May.
The marked work of all candidates must be retained by the centre. Some of the work will be required for moderation.
General guidance for teachers These notes provide background information for the preparation of candidates for these tasks and advice on the assessment of the Practical Data Analysis report.
Reference should also be made to Section 5 of the specification for Science A and to the Guide for Controlled Assessment for GCSE Twenty First Century Science.
Task setting is under high control. Tasks are therefore set by OCR. Where appropriate, tasks may be contextualised by individual centres to take account of local circumstances, including availability of resources and the needs of candidates. However, assessments must be based on the published marking criteria (within Section 5 of the specification). If there is any doubt about whether a contextualised task still sufficiently matches the task and criteria, centres should seek confirmation from OCR that the task is still valid.
Preparation of candidates It is expected that before candidates attempt a Controlled Assessment task they will have received general preparation in their lessons. Learning activities to develop the relevant skills should have been provided and the broad requirements of the assessment made clear to candidates.
More specific details of practical techniques, the development of skills associated with these techniques, and possible methods and choice of equipment for the task should be covered when teaching the relevant part(s) of the specification, and must be completed prior to setting the task.
In addition, candidates will be expected to be familiar with the concepts and terminology of Ideas about Science. The Ideas about Science are described in detail in Appendix B of the specification.
Air bladders on bladder wrack seaweed
From their work for Module B3: Life on Earth, candidates will be familiar with the adaptation of organisms to their environment.
Assessment of the quality of written communication (QWC) The quality of written communication is assessed in Strand G of this Controlled Assessment task. Candidates should be advised that the quality of their written communication will be assessed. Further information about the assessment of QWC may be found in the specification.

47 WWW.GCSE-SCIENCE.COM
UNIT A144: SAMPLE CANDIDATE WORK AND MARKING COMMENTARIES
Risk assessment It is the centre’s responsibility to ensure the safety of all candidates. Teachers are responsible for making their own risk assessment for the task prior to candidates attempting the practical work, and for ensuring that appropriate health and safety procedures are carried out. However, teachers must not provide candidates with a risk assessment since this is included in the marking criteria for Strand D. If candidates require additional guidance on managing safety once the task has started then this will need to be reflected in the marks awarded.
Guidance on assessment All assessment of the Practical Data Analysis Controlled Assessment is based on the final report submitted by the candidates.
The marking procedure and marking criteria are described in detail within Section 5 of the specification. Marking decisions should be recorded on the respective cover sheets (available to download from www.ocr.org.uk and included in the Guide for Controlled Assessment for GCSE Twenty First Century Science). Candidates’ reports should be annotated to show how marks have been awarded in relation to the marking criteria.
Additional guidance on marking criteria Detailed guidance on applying the marking criteria will be found in the Guide for Controlled Assessment for GCSE Twenty First Century Science.
The following additional brief notes are applicable to specific Practical Data Analysis tasks and provide some clarification of what may be expected from candidates in some strands. However, all marking decisions must be consistent with the marking criteria.
Air bladders on bladder wrack seaweed
Strand D
Identification of suitable sampling sites, accurate measurement of distances and strategies for consistent counting will be important for success in this task. Considerations of safety will focus on careful observation of tide and wave movements and on care when working on wet and slippery surfaces.
Strand E
Complex processing might involve numerical methods rather than graphical presentation.
Strand G
Reference should be made to the appropriate science in Module 3: Life on Earth.
Quality of written communication is assessed in this strand.

WWW.GCSE-SCIENCE.COM 48
UNIT A144: SAMPLE CANDIDATE WORK AND MARKING COMMENTARIES
Guidance for technicians and teachers Candidates plan their own investigations and may therefore require access to other apparatus at the discretion of the centre.
Teachers are advised to check that the range of apparatus provided will enable candidates to plan and carry out appropriate experiments to collect valid data.
Air bladders on bladder wrack seaweed
It is important to follow both national and local authority guidelines for preliminary surveys of chosen sites, obtaining parental permission and insurance cover before deciding whether to use this particular data task. Tide timetables provide information about days when timing will be convenient. Candidates must be carefully instructed on rules for safe behaviour and on the need for suitable clothing, especially footwear. The best seaweed cover will be found on rocky surfaces (sheltered or of medium exposure), which are likely to be wet and slippery. Candidates should be taught how to recognise the target bladder wrack weed before work begins. The task should begin at least an hour before low water, to allow time for candidates to select their sites for measurement. The survey should be conducted beginning at or near the low water mark, and moving up the beach to keep well clear of the advancing tide.
Apparatus suggested
A selection of 30 cm rulers, metre rules, long tape reels (e.g. from the PE department) and balls of string which can be knotted at regular intervals should be available. Clip boards provide a convenient support for recording data.
49 WWW.GCSE-SCIENCE.COM
UNIT A144: SAMPLE CANDIDATE WORK AND MARKING COMMENTARIES
Specimen Practical Data Analysis: Air bladders on bladder wrack seaweed
CANDIDATE 1

WWW.GCSE-SCIENCE.COM 50
UNIT A144: SAMPLE CANDIDATE WORK AND MARKING COMMENTARIES
Candidate 1
Does the number of bladders on bladder-wrack seaweed change with depth?
Introduction: In this assessment, we will look at seaweed in the inter-tidal zone (between high and low water marks, the part of the beach which is sometimes covered by the tide and sometimes not) at Robin Hood’s Bay. We will count the bladders on bladder wrack seaweed plants to test the hypothesis – The number of air-sacs on a frond of bladder-wrack seaweed is determined by the need to float upwards towards sunlight. There will be more air-sacs on weed at deeper levels. Bladder wrack seaweed looks like this – The holdfast fixes the weed to a rock. The bumps at the tip of each frond are sex organs. Along the fronds are air-bladders, arranged in pairs. These make the seaweed float upwards so that it can get more light for photosynthesis.
Method: Bladder wrack does not have deep roots, so on sandy places it would just wash away. Instead, it has a “holdfast” foot which can cling to rocks. So, we need to look at rocky areas of beach rather than sandy ones. In order to test the theory, we need to measure plants at different depths below the high water mark. The high water mark is the best place to start from as high tide and low tide will vary on different days. We will start when the tide is as low as possible and gradually move up the beach. The weed grows on rocks but not on sand, so it will be necessary to search along the beach to find an area where it is rocky most of the way from high tide mark to low tide mark. It will be best if it slopes smoothly all the way, because we do not have a way of measuring how high we are, only how far from high tide and low tide. If we find big bumps or hollows, we will move sideways a bit to find a plant at about the right height. Before we went to the beach, we got our measuring equipment ready. We got a ball of string and tied a knot at every 10 metres. We used a metre ruler to measure out the first 10 metres, then measured the others by folding the string back alongside the first length we had marked. We also used a metre ruler to measure 50 cm lengths of frond on each plant. Where there wasn’t much weed, we counted two or three fronds on the same plant. Where there was a lot of weed we did one frond on each of three plants because this gave a sort of average.

51 WWW.GCSE-SCIENCE.COM
UNIT A144: SAMPLE CANDIDATE WORK AND MARKING COMMENTARIES
At each 10 metres, we found the longest piece of bladder-wrack seaweed we could find. We stretched it from the tip along a ruler and counted the number of bladders along the 50 cm length. We included all the side fronds, but not the receptacles (sex organs) at the ends. We took our own results, and added results from two other groups, so that we could have an average from three different transects of the beach. Safety: We will start at low tide so that we are moving away from the rising water. At the lower levels, rocks will be wet and slippery. Do not move too quickly or jump from rock to rock. Avoid big steps or hollows. Except when stretching the string, stay together. Only go on the section of the beach which is marked out for us, so that there is always a safe route back off the beach. Wear welly boots but remember they can be slippery. Results of air bladder counts:
Number of bladders Pupils’ results
ours (SM/BG) PT/DJ RB/WS total ave
Distance from high water mark (m) 1 2 3 1 2 3 1 2 3
10 2 2 1 2 1 2 2 0* 0* 12 1.3
20 6 8 6 4 4 6 19* 4 3 41 5.1
30 8 7 9 5 6 6 10 14 12 77 8.6
40 6 4 4 8 9 4 16 17 16 80 8.9
50 5 6 6 11 9 11 13 12 8 81 9.0
60 10 13 10 8 10 10 0 0 0 61 10.2
70 14 17 20 16 14 12 16 17 16 142 15.8
80 14 20 19 18 17 16 18 18 18 158 17.6
90 19 24 20 22 21 20 18 22 22 188 20.9 Most of the results are even numbers because the bladders are usually in pairs, one each side of the central rib of the frond. Some of the results were outliers and were not counted when we calculated the averages. These ones are shaded in the table -
shaded = no weed (sandy patch) shaded plus star = we think this was counted wrong.
Some of the other results seemed odd, but were included in the averages -
star and underline = might be wrong type of seaweed underline = there was a ridge of rock across the survey line so these samples were at a
higher level than the ones around them We shared data with these two other pairs because they were nearest to us on the beach so the slope of their beach was nearly the same as ours.
WWW.GCSE-SCIENCE.COM 52
UNIT A144: SAMPLE CANDIDATE WORK AND MARKING COMMENTARIES

53 WWW.GCSE-SCIENCE.COM
UNIT A144: SAMPLE CANDIDATE WORK AND MARKING COMMENTARIES
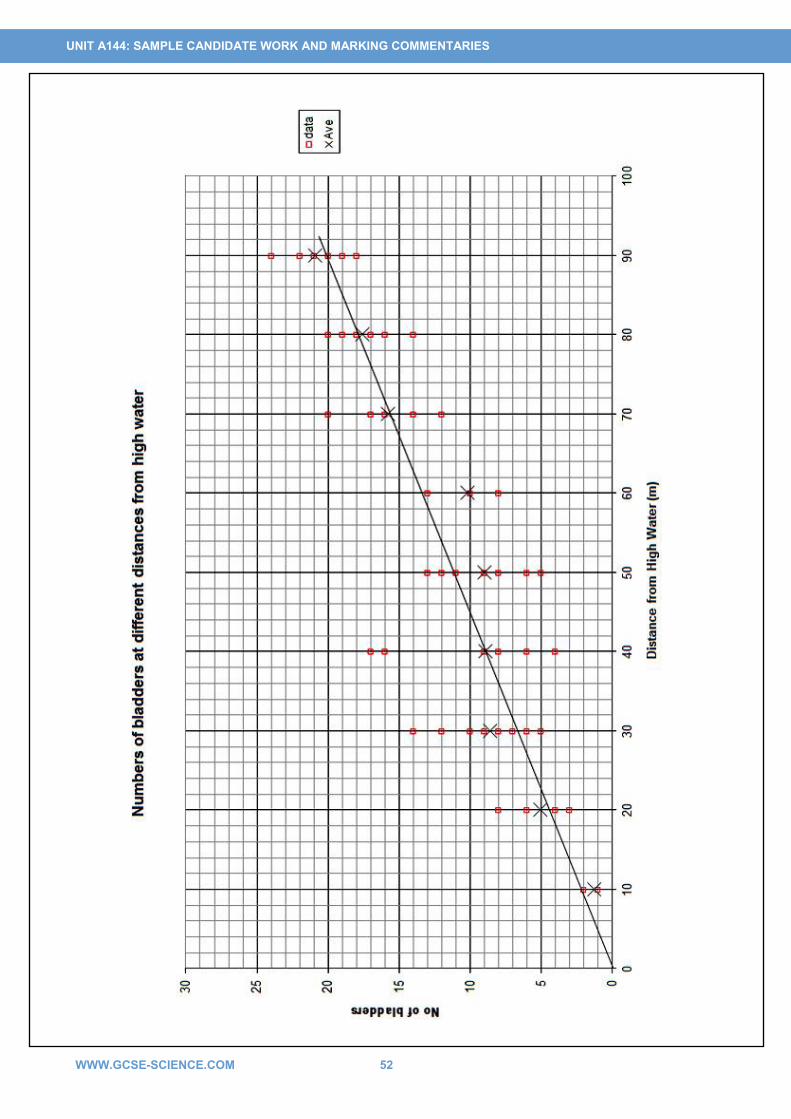
Interpretation of results – The graph shows all of the results we collected (except the 4 outliers we decided not to count). It also shows the average value for each distance down the beach. I have drawn a best-fit line to show the pattern which I believe is shown by these results. The best fit line passes through, or very close to the origin of the graph. It is a straight line, which shows that the number of bladders (per 30 cm of plant) is proportional to the distance from the high water line. The slope of my line shows an increase of one extra pair of air-bladder for every 9 metres further down the beach. Thus, the results do show that on this part of this beach, the number of bladders gets greater as the position of the weed is further down the beach. Results obtained by other groups in our class also showed the same trend. I think (see the evaluation) that it is an even better match to ‘the number of bladders is proportional to the depth below high water mark.’ We predicted that this might be what happened because the weed needs to be lifted to reach the light. At the upper shore, the bladder-wrack doesn’t get covered for water very long, but lower down, the seaweed gets covered with water for long periods of the day, so has to float to get maximum light for photosynthesis. I went on the internet to try to find whether other people had tested this theory. Several of the web-articles I found confirmed that more bladders are found at greater depths. However, I could not find any site which said this was due to a greater need to float up to the light. Most of the sites gave a different theory to explain this result. The more the weed is exposed to wave action, the more damage it suffers, leaving fewer bladders. Wave action is strongest at or near to the surface. On this theory, the change in number of bladders is explained because the weed at deeper levels is more protected from wave damage. According to this theory, all bladder wrack grows bladders, but the plants which are exposed by the tides suffer damage which reduces the number of bladders, so the higher up the beach, the fewer the bladders. Perhaps because of this damage, bladder wrack is not often found near the high tide limit (or the “splash zone” just above high tide). Instead, a species called spiral wrack is found and this does not have bladders. It may be that some of the results at 10 metres happened because they had confused spiral wrack with bladder-wrack by mistake. Here is information about some of the web-sites I looked at. What is written in italic print is a direct quotation cut-and-pasted from the web-site. All the sites were visited on 11th July 2010. 1: A Swedish web-site which refers to bladder –wrack in the Baltic sea. Aquascope 2000 is a
web-site set up by Tjärnö Marine Biological Laboratory, Strömstad, Sweden It provides information about marine topics for use by school pupils and teachers. Aquascope was sponsored by amongst others, KK-stiftelsen, World Wide Fund For Nature WWF and The Swedish Research Council Formas
http://www.vattenkikaren.gu.se/Fakta/arter/algae/phaeophy/fucuvesi/fucuve4e.html A quotation from this page: Bladder wrack that grows in areas that are exposed to powerful wave action can lack bladders. The plants have a tendency to be shorter, more slender and less branched.

WWW.GCSE-SCIENCE.COM 54
UNIT A144: SAMPLE CANDIDATE WORK AND MARKING COMMENTARIES
2: ARKive is a web-site based in Bristol. This quote comes from the ARKive site.
http://www.arkive.org/species/ARK/plants_and_algae/Fucus_vesiculosus/
Bladder wrack is a large olive-brown coloured seaweed, which attaches to rocks a small disc. The branching fronds, which grow up to 2m in length, have a midrib, and are covered with air bladders, which tend to occur in pairs on either side of the mid-rib. The appearance of bladder wrack varies depending on the conditions in which it occurs; in more sheltered areas there are many air bladders, whereas there are fewer in more exposed conditions. In very exposed areas, a form of bladder wrack may arise, which completely lacks bladders.
3: The Environmental Literacy Council is an American organisation in Washington DC which
provides support materials to teachers who are dealing with environmental topics. This reference gives detailed guidance for how to carry out beach surveys, but doesn’t say anything about different types of bladder wrack. http://www.enviroliteracy.org/article.php?id=1170&print=1
4: A US government sponsored site
The project was funded by the National Oceanic and Atmospheric Administration's Sanctuaries and Reserves Division via a cooperative agreement with Moss Landing Marine Laboratories in the fall of 1994 (completed June 1996), and is the first comprehensive site characterization for a designated national marine sanctuary to be produced for broad dissemination in an electronic format. This page lists species found at different levels in the inter-tidal zone: http://montereybay.noaa.gov/sitechar/roctab1.html
Evaluation: A good deal of the shore is covered with flat rocks, but even so it was difficult to find a place where the slope was quite smooth and steady and where there was weed on all the rocks. We looked at lots of places before we decided where to do our measurements. Because not all of the rock had seaweed on it, we sometimes had to move up or down or sideways a bit to find something. One set of results (for 60 metre) is missing because they couldn’t find any weed near that place. The results for 40 metres for two of our groups are very low numbers of bladders. We think this was because there was a ridge of higher rock at this part of the shore and so the plants were at a higher level than others around them. It would have been better if we could measure the vertical height rather than the horizontal distance from high tide. We did include these results, and the 40 metre average seems about right, because the third group got their samples where there was a dip and the weed was growing in a rock pool. The limit on our accuracy was the measuring distances. All our class did it with string from a ball. Each time we moved up the beach, we put one end of the string where we had measured last time, and stretched it up the beach to find the next place. We couldn’t always remember exactly where we ended last time, so after two goes, we got a small rock to mark the place each time.

55 WWW.GCSE-SCIENCE.COM
UNIT A144: SAMPLE CANDIDATE WORK AND MARKING COMMENTARIES
The beach does not slope smoothly, but is quite uneven. We think it would be much better to measure heights. I have found out that this can be done using a long rubber tube with a short glass tube at each end. This is nearly filled with water. When it is stretched out over a long distance, the water surface at each end will be at the same height. So, if you measure the height above the ground at each end, the difference between the two measurements tells you the difference in level of the ground at each place. We had noticed that between 40 and 60 metres, there was a fairly flat and level stretch of rock, so all of these readings were at about the same level. There were then a couple of steep drops, so that the next site (70 metres) was quite a lot lower. If we had been able to plot depth against number of bladders, I think we would have got an even better straight line. The results include ones from three different groups. Each group counted bladders on three weeds at each site. So we have nine results for each distance. Over the full set of nine, there is quite a lot of variation between the readings, as can be seen on the scatter-graph. However, if you look at the three results for any one group, the scatter (range) is usually quite small. This is because the three samples from one group were all growing very close together, but each group was working in a different place, so there was some difference between the environments. Even with this amount of scatter, it is clear that there is a trend towards greater numbers at greater depth. Remembering the shape of the shore, this would be even more clear if we had plotted depth rather than distance. The line on the graph could be either slightly higher or slightly lower, and it might not go exactly to the origin. Because we are dealing with living material and growth depends on many different factors, we would not expect an exact mathematical pattern, but I am confident that we have definitely shown a trend. We think that one result (RB/WS first result, 20 metres) was counted wrongly but don’t know why. The two zeroes at 10 metres might be because the wrong species of weed was tested, or might be because the weed there was very exposed to waves and wind. There wasn’t much bladder-wrack on this part of the beach. We did include these results in the average. The results for 40 metres vary more than any others. This was because two of the groups were working on a raised ridge at this site, and the other was in a rock pool in a dip in the rocks. We were very careful about counting the bladders. We made sure not to include the receptacles at the tip of fronds. Each of us counted the bladders than we compared and if we did not have the same number we counted them again together. I am confident that this data is enough to confirm the trend that we were looking for, although it does not help us to explain why this trend happens.

WWW.GCSE-SCIENCE.COM 56
UNIT A144: SAMPLE CANDIDATE WORK AND MARKING COMMENTARIES
Conclusion: The information on the web-sites supports our data because both show that the number of bladders gets greater the further down the beach you go. I am confident that there is a correlation between depth and number of bladders on the wave-exposed open sea shore which we surveyed. From our results I can say that the number of bladders is directly proportional to distance from high water, and this appears to be true across the whole of the inter-tidal zone, which was all that we were able to survey. We now have two theories to explain why this correlation exists. Firstly, it may be that the need to float upwards towards the light stimulates growth of more bladders. Bladder-wrack at the top of the shore doesn’t need these, as it is uncovered and exposed to the light for most of the day. The bladder-wrack that gets covered with water needs to float so that it can photosynthesise. We could extend our investigation by finding out the length of time the bladder-wrack was uncovered during the day, and plotting the number of bladders against this. The second theory is that the pounding of waves either inhibits growth of bladders, or might break them off. One web-site said that bladders increase the ‘drag’ of the waves and so plants with most bladders would be ripped off and lost, leaving only ones with fewer bladders on the exposed rocks. I don’t think that we can decide between these two theories on the evidence we have. It would be very interesting to count the bladders on bladder-wrack seaweed growing in sheltered places (coves, harbours, etc). If this weed in sheltered places shows the same change in number of bladders with depth, then that would support the “floating up to the light” theory. If the effect is NOT found in sheltered places, then that would suggest that the “wave damage” theory was most likely.

57 WWW.GCSE-SCIENCE.COM
UNIT A144: SAMPLE CANDIDATE WORK AND MARKING COMMENTARIES
Specimen Practical Data Analysis: Air bladders on bladder wrack seaweed
CANDIDATE 2

WWW.GCSE-SCIENCE.COM 58
UNIT A144: SAMPLE CANDIDATE WORK AND MARKING COMMENTARIES
Candidate 2
21st Century Science Data Analysis. INTRODUCTION: This work was completed on a field trip to Robin Hood’s Bay. Back in school, we were allowed to ‘swap and share’ data with two other groups. The first set of results is ours Planning: I decided to use a long ball of string to measure across the beach. I made an ink mark on it every 10 metres before we went on the trip. I decided to measure the seaweed for 30 cm long because that is the longest we could measure on our rulers and so would give most air bubbles.
Does the number of air bladders on bladder wrack seaweed
change with water depth?
Distance (m) 1st 2nd 3rd 1st 2nd 3rd 1st 2nd 3rd 10 2 3 4 1 3 1 0 0 0 20 3 6 3 6 8 5 9 7 6 30 11 12 6 8 7 9 13 14 10 40 13 6 15 0 1 3 0 0 0 50 6 7 5 3 6 4 0 0 0 60 9 7 5 10 18 9 8 7 22 70 5 14 12 25 17 20 0 0 0 80 13 13 15 24 20 19 10 11 16 90 13 14 12 28 18 20 9 11 15
I noticed that the further away from the cliffs the more air bubbles we found on the seaweed. My gradient of my line was that every 7m away from the cliff there was an increase of 1 air bubble. It showed me a positive correlation. The reason behind this could be that because the seaweed in the water had more air bladders because it was growing in the sun, so it had energy to photosynthsys. It could also be due to the water preassure as the further down in the water the bigger the preassure, this means that the seaweed has to fight against the water preassure to reach the light for photosynthesis to work so the air bladders keep the seaweed afloat.

59 WWW.GCSE-SCIENCE.COM
UNIT A144: SAMPLE CANDIDATE WORK AND MARKING COMMENTARIES

WWW.GCSE-SCIENCE.COM 60
UNIT A144: SAMPLE CANDIDATE WORK AND MARKING COMMENTARIES
Evaluation Overall I enjoyed getting our data, however I found that trying to find a piece of seaweed 30 cms long in the 10m radious was very hard. There was a lot of seaweed to get our results from but they weren’t long enough to record. If I was to do it again I would gather more results as I found that mine weren’t as reliable as I thought they were. I thought that they weren’t as reliable because at some distances there wasn’t any seaweed so I couldn’t get any results. I would do this because I could rely on them more and my graph would be better. I could also get a better line of best fit. We could also go to different beaches and compare the amount of air bladders on the seaweed to the beaches. The equipment I chose was very fiddley and at some point the string got wet so we couldn’t tell where the ink marks were supposed to be. I also found it very slippery as the further we got out to sea the thicker the seaweed was so the more chance there was that we could slip. This is a hazard! I concluded that my results weren’t as reliable as I thought there were but I enjoyed collecting the data.

61 WWW.GCSE-SCIENCE.COM
UNIT A144: SAMPLE CANDIDATE WORK AND MARKING COMMENTARIES
Specimen Practical Data Analysis: Air bladders on bladder wrack seaweed
CANDIDATE 3

WWW.GCSE-SCIENCE.COM 62
UNIT A144: SAMPLE CANDIDATE WORK AND MARKING COMMENTARIES
Candidate 3
Science Data Analysis Assessment The part of the sea shore which is covered at high tide, but exposed at low tide is called the inter-tidal zone. Anything that lives here has to be able to be covered with salt water for part of the time, and left out in the air to dry the rest of the time. We are going to study this zone at Robin Hood’s Bay. We will look at just one type of specially adapted seaweed, called bladder-wrack.
Bladder-wrack clings to rocky surfaces. It has long, flexible brown or green fronds and uses energy from sunlight to photosynthesise its food. At intervals along each frond it has air-sacs or “bladders”, usually in pairs. These help the fronds to float upwards towards the light when they are under water.
Plan of what to do: We will measure up the beach using string. We marked the string with a piece of red tape round it every 5 metres. The end of the string will be tied to a stick put in the sand at high tide mark (shown by a line of shingle). We will stretch the string down to the bottom of the beach. Then we can walk back one tape at a time and measure the weeds. In the end we can wind up the string because the bottom end is loose. We can measure the fronds of the weeds with a ruler, then one will count the bubbles and the other will write them down. We will wear rubber boots and yellow bibs for safety and be careful not to climb up big rocks. Our results: How far up beach bubbles on 1st frond bubbles on 2nd frond
5m 18 16 10m 18 16 15m 14 14 20m 12 14 25m 12 10 30m 8 10 40m 6 6

63 WWW.GCSE-SCIENCE.COM
UNIT A144: SAMPLE CANDIDATE WORK AND MARKING COMMENTARIES
We compared our results with people at the other end of the beach and I have put theirs on the graph as well. Conclusion: Our results were good and had the same shape as the ones from everybody else. This was because you can count the air-bubbles exactly, you can’t have half a bubble. But we couldn’t measure the distance so well because the string wasn’t really straight, it went up and down a bit over the different height rocks. In some of the places, e.g. 35 metres, there wasn’t any weed to measure, but this didn’t spoil the results because we remembered to leave a space on the graph where that number was missing. We wanted to count for half a metre of frond, but most of the weed wasn’t long enough, so we counted for one ruler-length (30cm). This gave us good enough numbers as you can see on the graph. All of our results give us a good smooth graph, so there are not any outliers, but the one at 5 metres was a bit less than we expected when we looked at the others.
20
15
10
5
0
air b
ubbl
es
0 10 20 30 40 metres from bottom of beach
our results
other results

WWW.GCSE-SCIENCE.COM 64
UNIT A144: SAMPLE CANDIDATE WORK AND MARKING COMMENTARIES
Testing the hypothesis: We started out to prove that: The number of air-sacs on a frond of bladder-wrack seaweed is determined by the need to float upwards towards sunlight. There will be more air-sacs on weed at deeper levels. When the tide is in, the weed which is nearest to the bottom of the beach will be deepest under the water. So our results prove the hypothesis. Weed needs photosynthesis to make its food, so it needs to float up near the daylight, not be at the bottom where the water is darker. We found that the results showed a steady pattern of more air-bubbles as we went further down the beach, as it says in the hypothesis. We could make bubble counts at other beaches, but everyone in the class got the same answer at different parts of this beach, so we think it is always true.

65 WWW.GCSE-SCIENCE.COM
UNIT A144: SAMPLE CANDIDATE WORK AND MARKING COMMENTARIES
Specimen Case Study: Possible effects of air pollution on public health
MARKING COMMENTARIES

WWW.GCSE-SCIENCE.COM 66
UNIT A144: SAMPLE CANDIDATE WORK AND MARKING COMMENTARIES
CANDIDATE 1 Title of the work: Does the number of bladders on bladder-wrack seaweed change with depth? Marks awarded:
Strand 0 1 2 3 4 5 6 7 8 Mark D choice of methods, techniques and equipment
7
E revealing patterns in data 8
F evaluation of data 7
G reviewing confidence in the hypothesis
7
General summary: A carefully structured and well-presented study. Appropriate methods were used to collect the data, with careful consideration of factors that could affect measurements. The data were displayed appropriately, and conclusions drawn which were supported by background science. Internet research revealed another possible explanation for fewer bladders towards the upper shore, and suggestions were made for both extending the original investigation and testing the alternative explanation that the number of bladders is related to degree of exposure. Detailed commentary: Strand Commentary Mark
D Techniques used to collect data are described. Repeats are made, and data are compared with those of other groups to consider reliability. There is some justification of the techniques used (in particular where distribution of seaweed meant the technique required modification) and equipment required, but this does not quite represent eight marks. The inclusion of a detailed risk assessment, with ways of minimising risk, takes the work into the 7-8 range, and means that seven marks were awarded.
7
E The data collected have been displayed appropriately in a graph, and the spread indicated clearly using range bars.
8
F Repeatability of results has been discussed, by comparisons of data within the group (and reproducibility across other groups), and outliers identified in data. Some reasons are suggested for outliers and inconsistent data (for which there is some scientific justification), along with reasons for the inclusion or exclusion of data. The level of response is just short of eight marks.
7

67 WWW.GCSE-SCIENCE.COM
UNIT A144: SAMPLE CANDIDATE WORK AND MARKING COMMENTARIES
G The extent to which data support the hypothesis has been explained using
relevant scientific knowledge. An alternative explanation for the data collected is provided (an effect of the degree of exposure of the shore on the numbers of bladders). Suggestions are made for both extending the original investigation (by exploring the relationship of immersion time against numbers of bladders), and further investigation, of numbers of bladders in seaweed on shores with differing degrees of exposure. The report is comprehensive, relevant and logically sequenced. Scientific terminology has been used effectively, and there are few grammatical errors.
7
Total mark for the Data Analysis = 29

WWW.GCSE-SCIENCE.COM 68
UNIT A144: SAMPLE CANDIDATE WORK AND MARKING COMMENTARIES
CANDIDATE 2 Title of the work: 21st Century Science Data Analysis Marks awarded:
Strand 0 1 2 3 4 5 6 7 8 Mark D choice of methods, techniques and equipment
2
E revealing patterns in data 4
F evaluation of data 3
G reviewing confidence in the hypothesis
3
General summary: The data analysis has been written up appropriately, with all aspects represented in the report, but there are major omissions in each. An outline of the experimental technique and equipment used are provided, with a limited comment on safe working. The data collected show some inconsistencies, and it is unclear from the script what the data displayed graphically represent. An attempt is made to relate the trends described by the candidate with the hypothesis provided (which has not been reproduced at the beginning of the report. There is limited scientific terminology, and spelling, in particular, is variable. Detailed commentary: Strand Commentary Mark
D The description of the method and apparatus used is limited, and in fact, does not state that air bladders are to be counted. A comment is made on a pertinent hazard, but this is made as part of the evaluation. The best match with the mark descriptors indicates the 1-2 mark band range (although aspects of the 3-4 mark range, i.e., repeats, have been carried out).
2
E The graph has been drawn with appropriate scales and labelling. Points have been mis-plotted, however (the nature of the data recorded in the graph is unclear; Moderator calculations suggest they are neither a mean of the nine values recorded, or of the first three (which may represent the candidate’s group’s data. Error bars have been drawn, but inaccurately. A maximum of four marks can therefore be awarded.
4

69 WWW.GCSE-SCIENCE.COM
UNIT A144: SAMPLE CANDIDATE WORK AND MARKING COMMENTARIES
F The candidate comments on the lack of reliability but with no reference to
the data, or specific data. Shaded areas in the table of data appear to relate to the identification of outliers, though these are not designated as such. There is enough, however, to put the candidate in the 3-4 mark band range. The emphasis in this strand is on the effects of limitations of techniques and equipment, and several references have been made to aspects of these.
3
G Comments are made on how the data collected relate to the hypothesis provided, using some reference to the appropriate science. There is little use of scientific terminology, and there are occasional errors in spelling, grammar and punctuation.
3
Total mark for the Data Analysis = 12
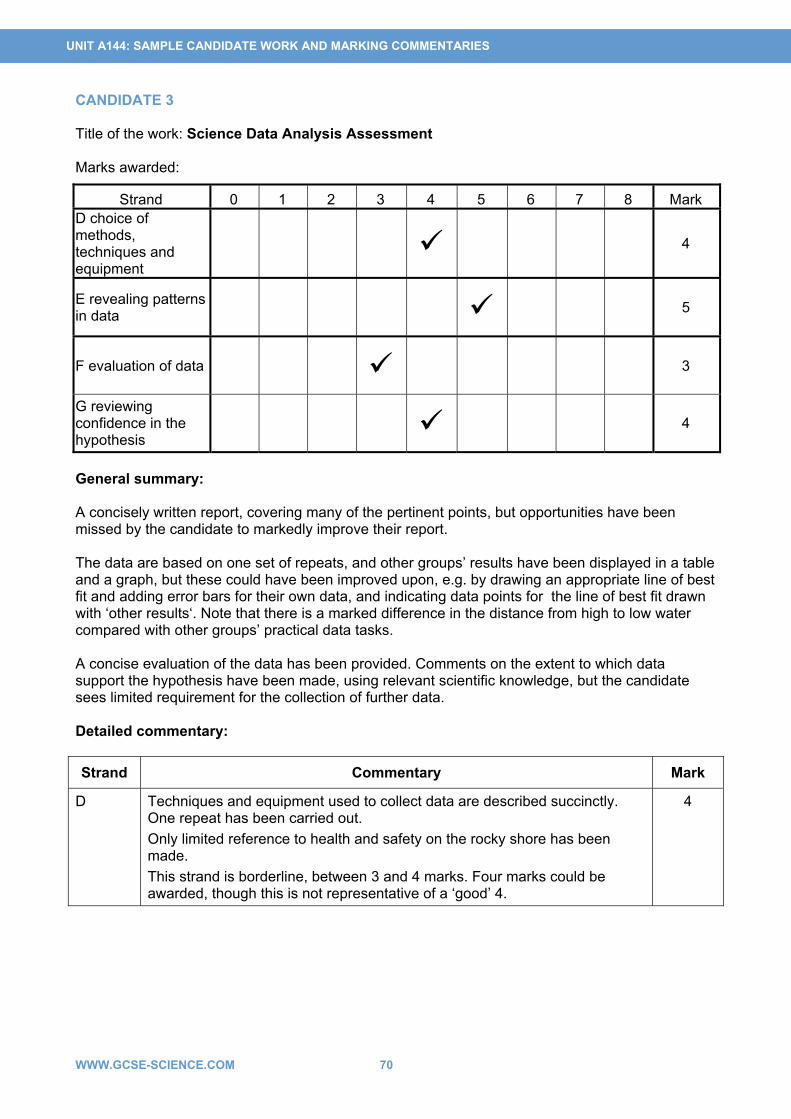
WWW.GCSE-SCIENCE.COM 70
UNIT A144: SAMPLE CANDIDATE WORK AND MARKING COMMENTARIES
CANDIDATE 3 Title of the work: Science Data Analysis Assessment Marks awarded:
Strand 0 1 2 3 4 5 6 7 8 Mark D choice of methods, techniques and equipment
4
E revealing patterns in data 5
F evaluation of data 3
G reviewing confidence in the hypothesis
4
General summary: A concisely written report, covering many of the pertinent points, but opportunities have been missed by the candidate to markedly improve their report. The data are based on one set of repeats, and other groups’ results have been displayed in a table and a graph, but these could have been improved upon, e.g. by drawing an appropriate line of best fit and adding error bars for their own data, and indicating data points for the line of best fit drawn with ‘other results‘. Note that there is a marked difference in the distance from high to low water compared with other groups’ practical data tasks. A concise evaluation of the data has been provided. Comments on the extent to which data support the hypothesis have been made, using relevant scientific knowledge, but the candidate sees limited requirement for the collection of further data. Detailed commentary:
Strand Commentary Mark
D Techniques and equipment used to collect data are described succinctly. One repeat has been carried out. Only limited reference to health and safety on the rocky shore has been made. This strand is borderline, between 3 and 4 marks. Four marks could be awarded, though this is not representative of a ‘good’ 4.
4

71 WWW.GCSE-SCIENCE.COM
UNIT A144: SAMPLE CANDIDATE WORK AND MARKING COMMENTARIES
E The graph has not been drawn on an appropriate grid.
Means calculated from the data collected have been displayed in a graph, though a line of best fit could have been used to indicate the trend in data. ‘Other results’ are also displayed as a separate line, though individual data points have not been shown. The independent variable, ‘how far up the beach’ is not a useful parameter to use as the position of low water mark varies with the time of day and at low tide, at spring and neap tides.
5
F The general pattern of results across the candidate’s and ‘other’ groups are cited as reasons for their accuracy, and the candidate comments on a lack of outliers (though has excluded data from the results that could have collected at 35 m, where there ‘wasn’t any weed to measure’ and referred to inconsistent results at the 5 m mark).
3
G The extent to which data support the hypothesis has been explained using relevant scientific knowledge (but perhaps the lesser requirement for air bladders on seaweed higher up the beach could have been explained). The suggestion of possible further investigation being carried out at other beaches has been made, but then negated by the fact that other groups observed similar trends, so ‘we think it is always true.’ The report is concise, relevant and logically sequenced. There is some use of scientific terminology, and there are few spelling, punctuation and grammatical errors. Note, however, that it is the science that is the limiting factor in the award of the marks in this strand.
4
Total mark for the Data Analysis = 16


GENERAL QUALIFICATIONSTelephone 01223 553998Facsimile 01223 552627
[email protected] Hills Road, Cambridge CB1 2EU
For staff training purposes and as part of our quality assurance programme your call may be recorded or monitored. © OCR 2011 Oxford Cambridge and RSA Examinations is a Company Limited by Guarantee. Registered in England. Registered office 1 Hills Road, Cambridge CB1 2EU. Registered company number 3484466. OCR is an exempt charity.
www.gcse-science.com