A year of fundamental change - Home - Northam
34
Transcript of A year of fundamental change - Home - Northam


A year of fundamental change
• Booysendal transaction consummated, growth path secured
• size – 103Moz, 14.5km strike length
• access from surface, with shallower growth prospects
• lower quartile cost profile
• Northam mine continues to generate strong cash flows
• Offtake agreement signed with Pilanesberg Platinum Mines – will facilitate mining flexibility.
• Exceptional PGM markets – sound fundamentals remain in placeExceptional PGM markets sound fundamentals remain in place
2
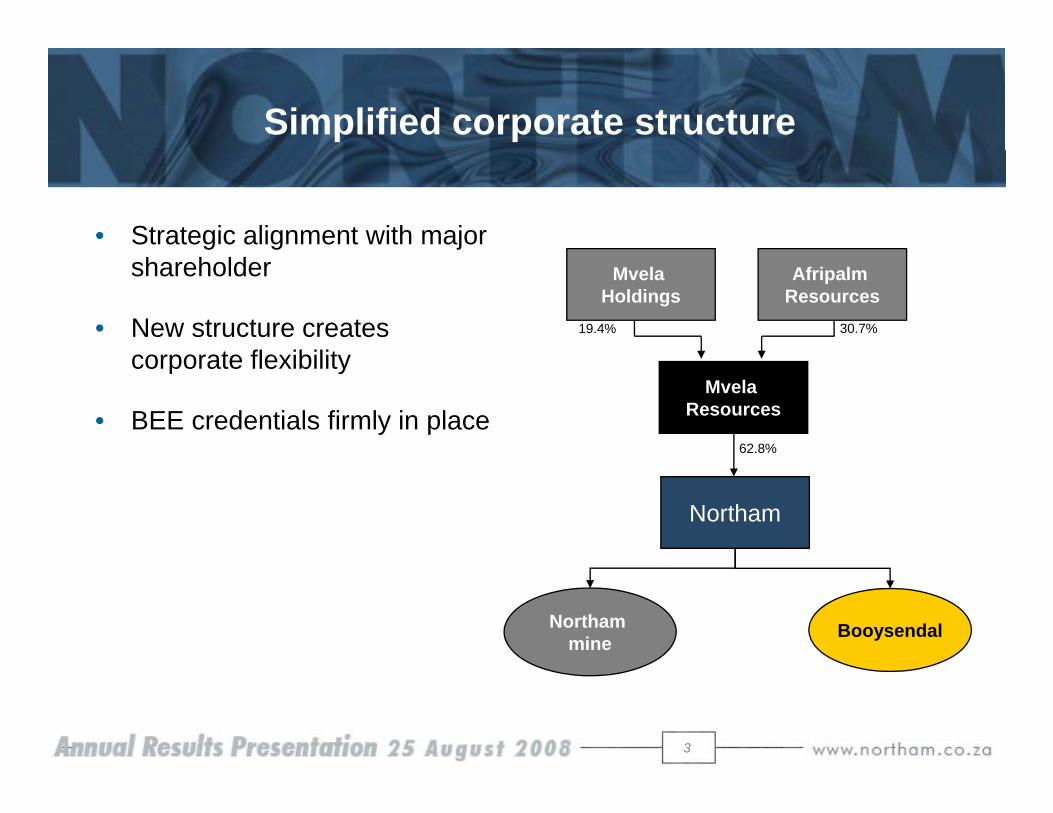
Simplified corporate structure
• Strategic alignment with major shareholder
• New structure creates corporate flexibility
Mvela Holdings
Afripalm Resources
19.4% 30.7%
corporate flexibility
• BEE credentials firmly in placeMvela
Resources
62.8%
Northam
Northam mine
Booysendal
3

Taking empowerment to the workplace
• EETF (Employee empowerment trust fund)• extensive consultation process with all unions• 4% of after tax profits allocated to trust
first payout after five years• first payout after five years• beneficiaries protected from share price volatility
Af fiR 000s After tax profitsR 000s
4
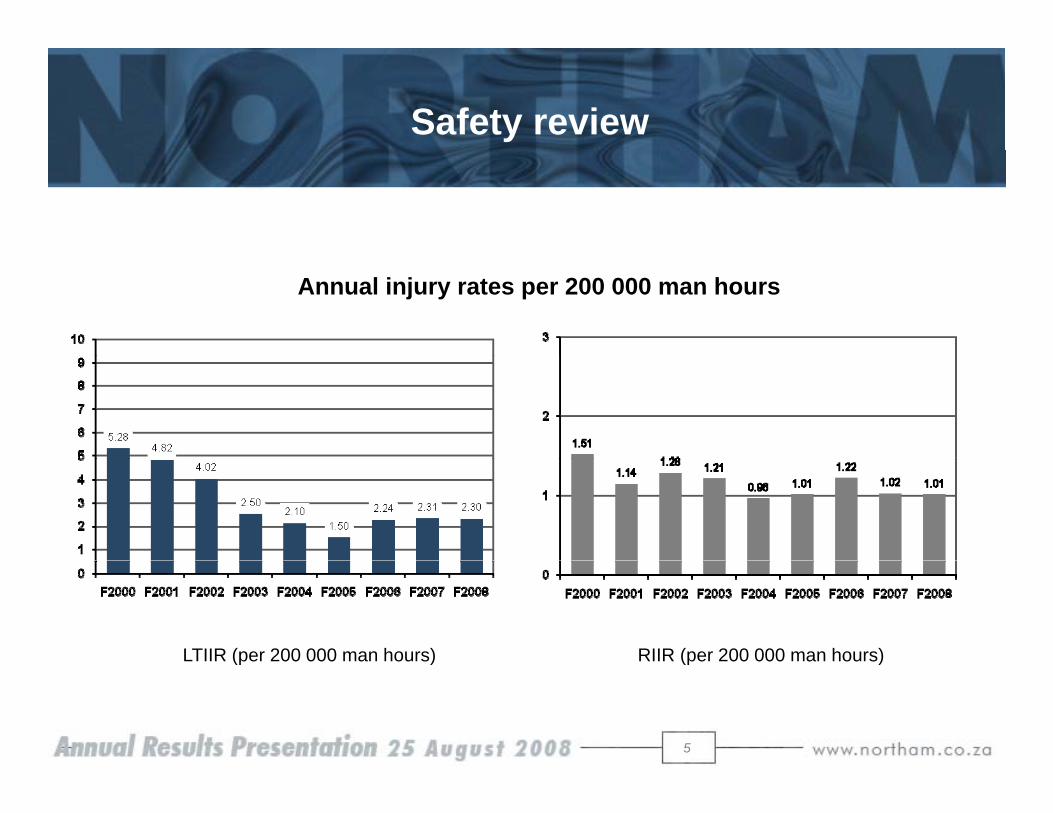
Safety review
Annual injury rates per 200 000 man hours
LTIIR (per 200 000 man hours) RIIR (per 200 000 man hours)
5
(p ) (p )

Positive performance in tough operating year
• 12.6% increase in after tax profits to R1.5 billion• 12.0% increase in headline earnings to 627 cents per share • Cash on hand of R1.5 billion
Final dividend of 185 cps (330 cps for the year)• Final dividend of 185 cps (330 cps for the year) • Strong balance sheet – no gearing
C h b lR 000s Cash balanceR 000s
6

Operating performance
F2008 F2007 Change
Total development metres 12 732 14 822 -14.1%
Merensky square metres 205 251 249 812 -17.8%
Merensky head grade (g/t) 5.6 5.6 -
UG2 square metres 158 294 146 698 7.9%
UG2 head grade (g/t) 4.4 4.4 -
Total square metres mined 363 545 396 510 - 8.3%
Total tonnes milled 2 022 656 2 269 206 -10.9%
Average combined head grade (g/t) 5.0 5.1 -2.0%
7
PGMs in concentrate produced (kg) 9 113 10 087 -9.7%
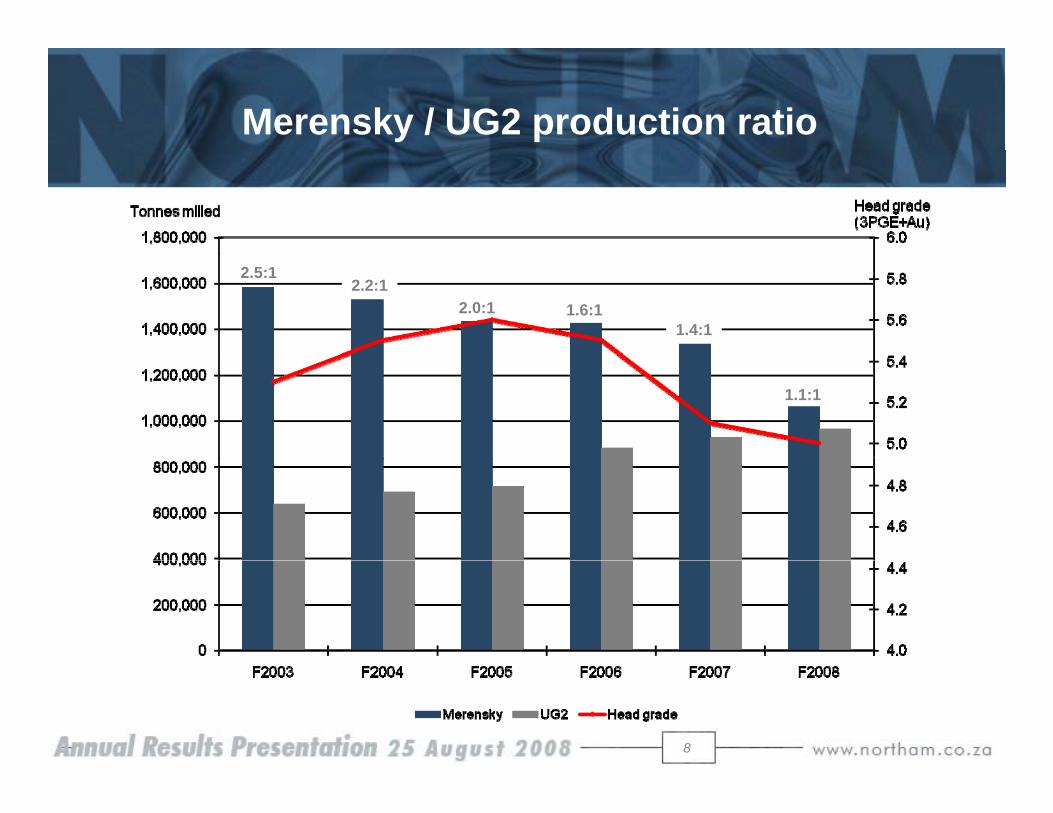
Merensky / UG2 production ratio
2.5:12.2:1
2.0:1 1.6:11.4:1
1.1:1
8

Mining operations – optimising the ore reserves
easterntransitiontransition
zone
41
possiblenormal
reef
9
LJD204137

Key focus on metallurgical operations
• UG2 plant modifications• installation of HPGR crusher• improved throughput• reduced power consumptionp p• convert rod mill to ball mill• better grind
• Overall effect:• Overall effect: • better recoveries, lower operating costs
• Smelter shutdown in October /November• Smelter shutdown in October /November• duration – two months• cost of rebuild – R50 million
10

Income statement
F2008(R000)
F2007(R000) Change
Sales revenue 3 886 137 3 739 805 3.9%
Cost of sales 1 608 648 1 727 945 -6.9%
Operating profit 2 277 489 2 011 860 13.2%
Investment income 97 507 83 643 15.0%
Net sundry income 1 824 5 287 -65.5%y
Booysendal expenditure (17 969) -
Profit before tax 2 358 851 2 100 806 12.3%
Tax 866 040 774 562 11.8%
Profit attributable to shareholders 1 492 811 1 326 244 12.6%
Headline earnings – cents 627 2 560 2 12 0%
11
Headline earnings – cents 627.2 560.2 12.0%
Operating margin 58.9% 53.8% 9.5%
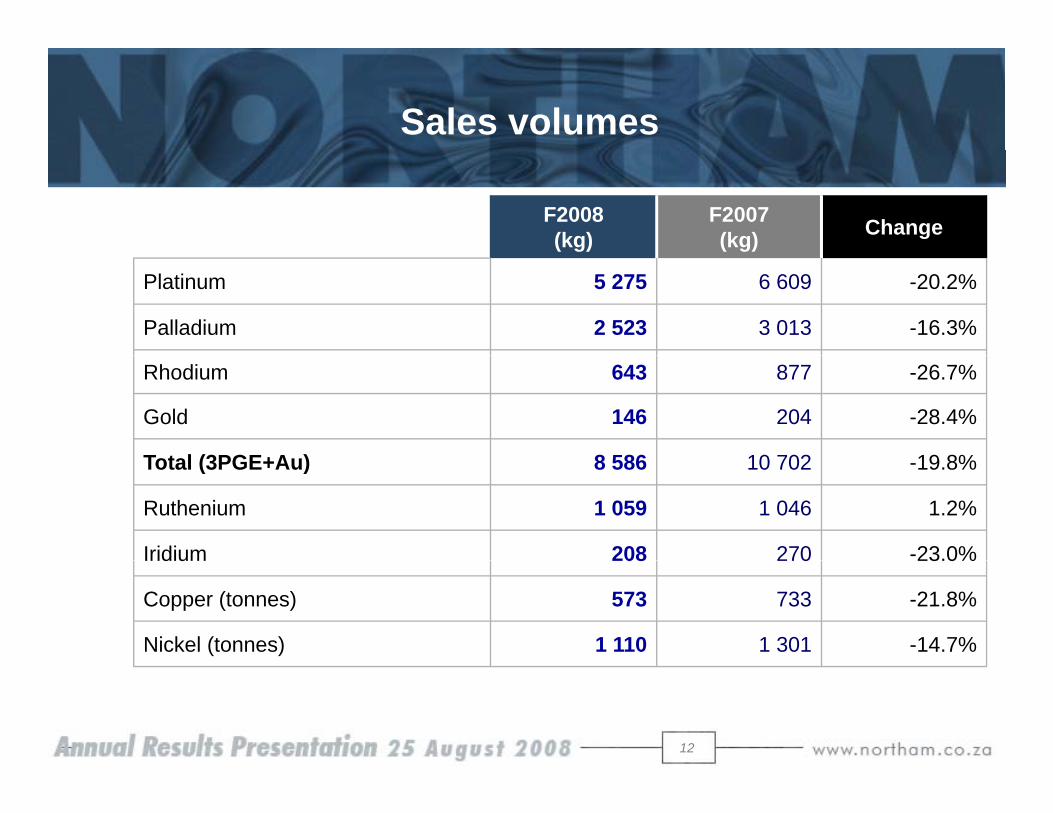
Sales volumes
F2008(kg)
F2007(kg) Change
Platinum 5 275 6 609 -20.2%
Palladium 2 523 3 013 -16.3%
Rhodium 643 877 -26.7%
Gold 146 204 -28.4%
T t l (3PGE+A ) 8 586 10 702 19 8%Total (3PGE+Au) 8 586 10 702 -19.8%
Ruthenium 1 059 1 046 1.2%
Iridium 208 270 -23.0%Iridium 208 270 23.0%
Copper (tonnes) 573 733 -21.8%
Nickel (tonnes) 1 110 1 301 -14.7%
12

Revenue contributions
13

Cost of sales
2008(R000)
2007(R000)
Change
Cost of sales 1 608 648 1 727 945 (6.9%)
Operating costs 1 626 610 1 360 818 19.5%
Concentrates purchased - 106 447
Refining and realisation 75 540 91 816 (17.7%)
D i i 149 32 129 040 1 %Depreciation 149 325 129 040 15.7%
Change in metal stocks (242 827) 39 824 (709.8%)
14

Unit cash costs
F2008 F2007 Change
R d / t i d 683 37 526 00 29 9%Rand / tonne mined 683.37 526.00 29.9%
Rand / tonne milled 789.34 601.19 31.3%
Rand / kilogram (3PGE+Au) produced 175 197 135 248 29.5%
15

Unit cash costs
R/kg (3PGE+Au) PPIR/kg (3PGE+Au) PPI
1616
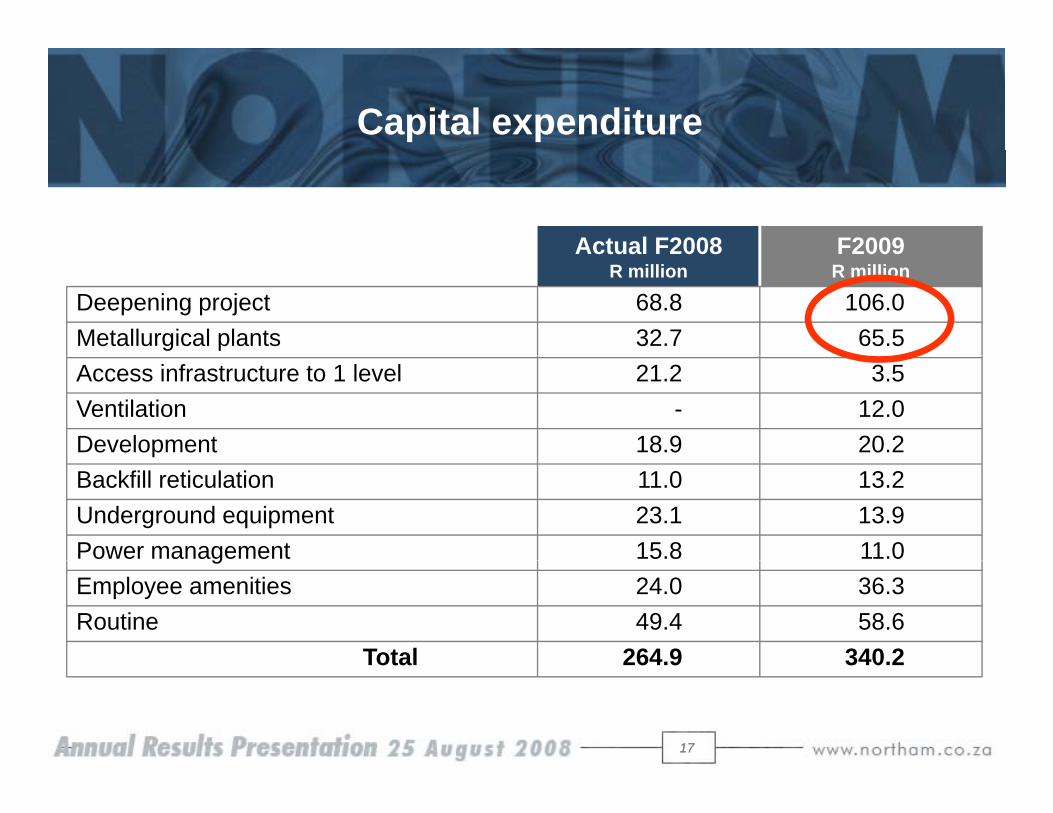
Capital expenditure
Actual F2008 F2009Actual F2008R million
F2009R million
Deepening project 68.8 106.0Metallurgical plants 32.7 65.5Access infrastructure to 1 level 21.2 3.5Ventilation - 12.0Development 18.9 20.2Backfill reticulation 11.0 13.2Underground equipment 23.1 13.9Power management 15.8 11.0gEmployee amenities 24.0 36.3Routine 49.4 58.6
Total 264.9 340.2
1717
Total 264.9 340.2
18

Metal prices
11 000$ 2 276/oz
1 600
2 000
9 000
10 000
$ 10 100/oz
1 200
Pt, P
d, A
u
7 000
8 000
Rho
dium
$ 1 023/oz
800
5 000
6 000
$ 588/oz
0
400
06 06 06 07 07 07 07 07 07 07 07 07 07 07 07 08 08 08 08 08 08 08 08
3 000
4 000
19
Oct 06
Nov 06
Dec 06
Jan 0
7Fe
b 07
Mar 07
Apr 07
May 07
Jun 0
7Ju
l 07
Aug 07
Sep 07
Oct 07
Nov 07
Dec 07
Jan 0
8Fe
b 08
Mar 08
Apr 08
May 08
Jun 0
8Ju
l 08
Aug 08
Platinum (US$/oz) Palladium (US$/oz) Gold (US$/oz) Rhodium (US$/oz)

Basket price
2 300 700 000
1 700
1 900
2 100
500 000
600 000
1 300
1 500
US$
/oz
400 000
R/k
g
R 409 159/kg
R 501 285/kgR 467 300/kg
700
900
1 100
200 000
300 000
R 291 547/kg R 304 494/kg
500
700
Jan-0
7Feb
-07
Mar-0
7Apr
-07
May-0
7Ju
n-07
Jul-0
7Aug
-07Sep
-07Oct-
07Nov
-07Dec
-07Ja
n-08
Feb-
08Mar
-08
Apr-0
8May
-08
Jun-0
8Ju
l-08
Aug-08
Sep-08
100 000
20
Basket Price (US$/oz) Basket Price (R/kg) Ave Basket H207 Ave Basket H108
Ave Basket H208 Ave Basket H109 Ave Basket F2008
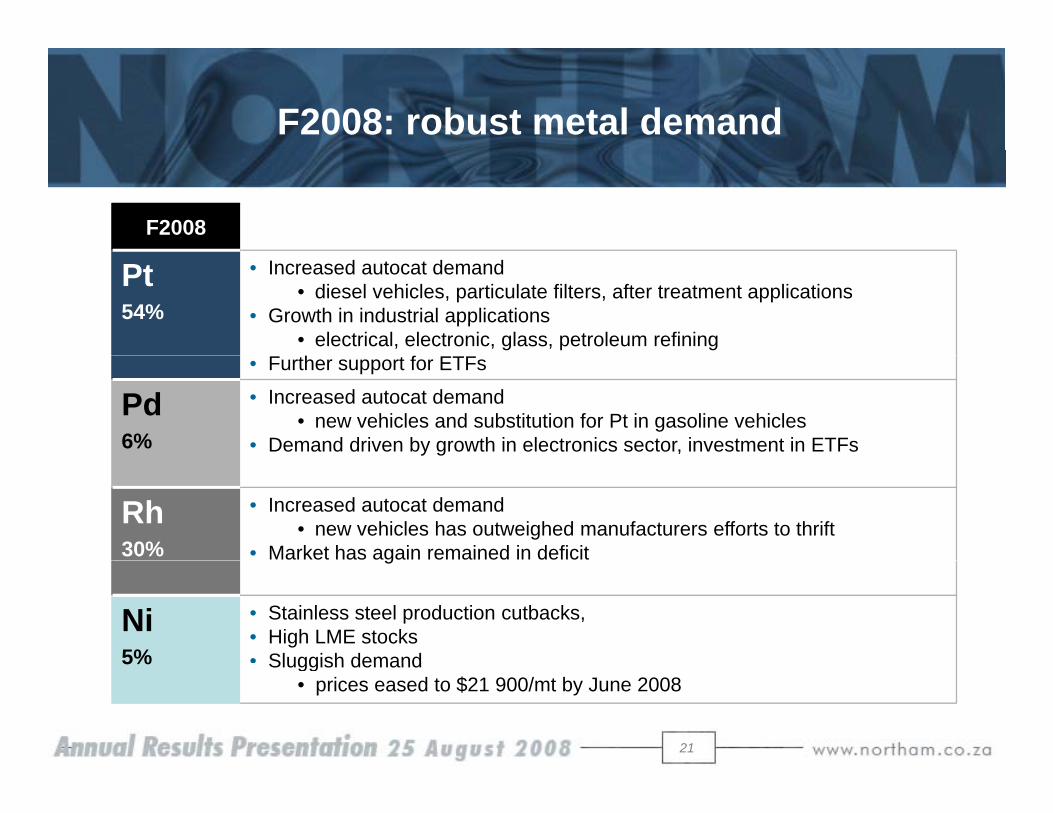
F2008: robust metal demand
F2008
Pt54%
• Increased autocat demand • diesel vehicles, particulate filters, after treatment applications
• Growth in industrial applications • electrical, electronic, glass, petroleum refining
• Further support for ETFs
Pd6%
• Increased autocat demand• new vehicles and substitution for Pt in gasoline vehicles
• Demand driven by growth in electronics sector, investment in ETFs
Rh30%
• Increased autocat demand• new vehicles has outweighed manufacturers efforts to thrift
• Market has again remained in deficitg
Ni5%
• Stainless steel production cutbacks, • High LME stocks • Sluggish demand
21
5% Sluggish demand• prices eased to $21 900/mt by June 2008

Outlook remains sound
• Recent slump in prices – negative autocat sentiment, disinvestment• global decrease in vehicle sales appears inevitable• recycling, thrifting and substitution to continue
but sell off in speculative positions on TOCOM and NYMEX as• but, sell off in speculative positions on TOCOM and NYMEX as well as in ETFs appears to have ended
• However – outlook for fundamental demand for PGMs remains sound • on-going tightening of emissions legislation• potential for increased vehicle sales in developing (BRIC) countries • recovery in demand from jewellery sector• recovery in demand from jewellery sector • continued growth of demand from electronics sector
• PGM prices likely to remain buoyed by supply-side risks
22
23

To recap – locality
1B1A 1B1A 1B1A 1B1A
1D 1C1D 1C1D 1C1D 1C 14.5km
24
24

To recap – Booysendal brings to Northam
• Larger, more diverse asset base - significantly reducing risk profile
• Potential to at least double production
• Mineral resource ± 100 yrs LOM
Ph 1 i l t t 15% f b d 30• Phase 1 mine only extracts 15% of orebody over 30 years
• Reduction of average unit costs
• Control of fully independent beneficiation stream mine to market
25
• Solid BEE credentials
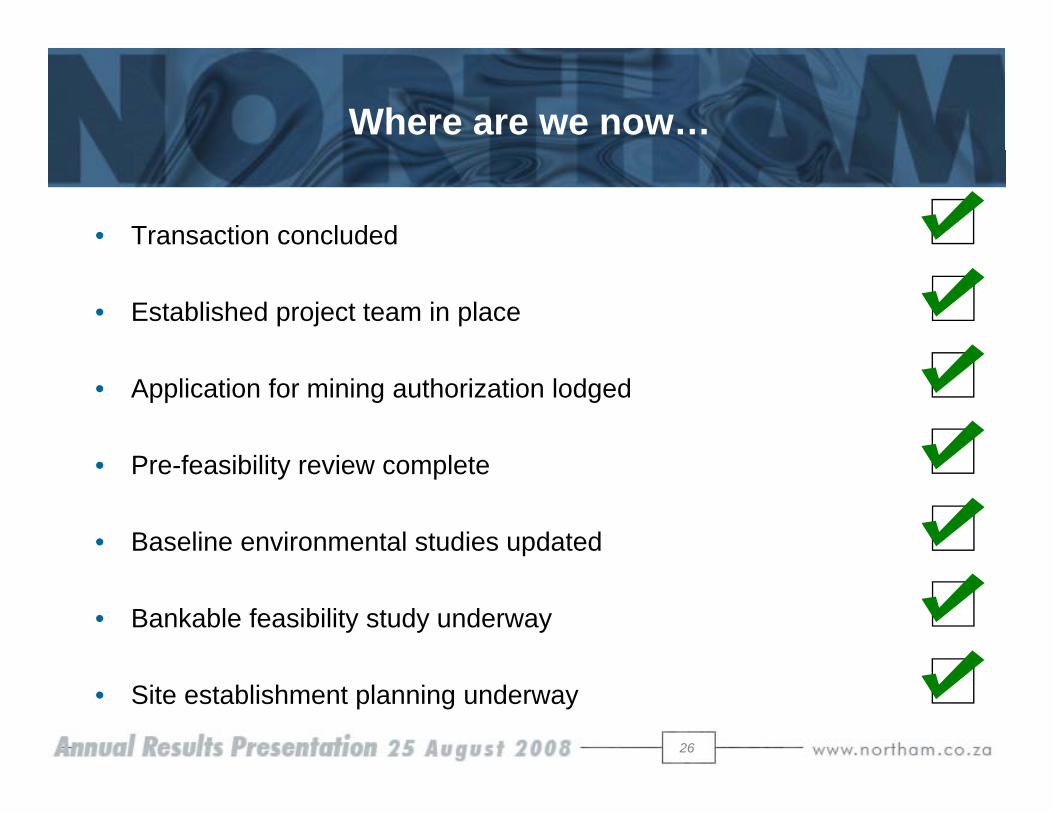
Where are we now…
• Transaction concluded
• Established project team in place
• Application for mining authorization lodged
P f ibilit i l t• Pre-feasibility review complete
• Baseline environmental studies updated
• Bankable feasibility study underway
26
• Site establishment planning underway

Pre-feasibility review complete
• Objectives of the three month review:
• consolidate and review prior studies
• review geology and mineral resources
• investigate mining method and production options
• determine principal project elements:
• metallurgy• metallurgy
• bulk infrastructure, engineering, access and services
• human resources
• environmental issues and permitting
• Develop the foundation for the subsequent bankable feasibility study
27

Pre-feasibility review findings
• Eleven production scenarios ranging in scale from 120ktm to 480ktm considered and based on:
• 120ktm production modules
• standalone Merensky reef mine• standalone Merensky reef mine
• standalone UG2 reef mine
• combinations of UG2 and Merensky reef productiony p
• Review results suggest:
• UG2 production should be prioritized
• Modular production build-up in 120ktm units offers flexibility and ameliorates risk related to power and water from the De Hoop dam
28

NORTHSetting the scene
MR North Decline
2KM
UG2 North Decline
8KM
MR South Decline
UG2 Outcrop
UG2 South Decline
p
MR O tMR Outcrop
29

Bankable feasibility study
• Experienced project team
• 25 members with combined experience of over 500 years
• Duration 12 to 15 months – expect to be complete during H2 2009
• Budget R50 million
30

Key issues for F2009
• Northam mine
• wage negotiations
• deepening project
• implementing EETF
• Booysendal project
• complete BFS• complete BFS
• construction to start in 2010
• Corporatep
• evaluate optimal Booysendal funding mechanism
• strengthen offshore shareholder base
31
• explore potential for further corporate activity

Northam – growth you can count on
• Track record of consistent delivery to shareholders
• Experienced PGM mine operators
• Cash generative and ungeared
• Near-term expansion through acquisition of world-class asset
• Processing solutions for emerging producers
• Further value unlocking opportunities through corporate activity
32


Sales revenue
2008(R000)
2007(R000)
Change(R000) (R000)
g
Platinum 2 093 212 1 837 462 13.9%
Palladium 239 379 238 849 0.2%
Rhodium 1 151 946 1 074 565 7.2%
Gold 28 662 30 826 -7.0%
Total (3PGE+Au) 3 513 199 3 181 702 10.4%Total (3PGE Au) 3 513 199 3 181 702 10.4%
Ruthenium 105 123 87 308 20.4%
Iridium 21 427 25 221 15.0%
C 30 769 36 851 16 5%Copper 30 769 36 851 -16.5%
Nickel 211 089 403 744 -47.7%
Other 4 530 4 979 -9.0%
34
Total 3 886 137 3 739 805 3.9%