A Year of Action A Future of Possibilities - Annual report...beyond cardiac rhythm management (CRM)...
144
2008 Annual Report A Year of Action A Future of Possibilities
Transcript of A Year of Action A Future of Possibilities - Annual report...beyond cardiac rhythm management (CRM)...

2008 Annual Report
A Year of Action A Future of Possibilities

Sales
Operating income
Net income
Diluted net earnings
per common share
Diluted weighted average
shares outstanding
Cash fl ow from operations
Working capital
Total assets
Total debt
Total liabilities
Total stockholders’ equity
Cash Flow and Balance Sheet
Operations
Sales
2004
$ 43,460
132,360
476,166
171,652
222,028
254,138
2005
$ 43,335
151,958
512,911
170,464
244,306
268,605
2006
$ 39,205
199,051
547,827
170,000
248,134
299,693
2007
$ 42,965
116,816
663,851
241,198
341,180
322,671
2008
$ 57,101
142,219
848,931
352,920
498,179
350,752
2004
$ 200,119
26,940
14,218
0.66
21,540
2005
$ 241,097
16,886
10,107
0.46
21,810
2006
$ 271,142
22,376
16,126
0.73
26,334
2007
$ 318,746
20,020
15,050
0.67
22,422
2008
$ 546,644
34,894
18,559
0.81
24,128
Financial Highlights(in thousands, except per share data)
$546,644
$318,746
$271,142
$241,097
$200,119
2008
2007
2006
2005
2004

Greatbatch is a leading supplier of enabling
technology to the medical device and commercial
industries. For nearly 40 years, Greatbatch has
maintained a reputation for exceptional innovation,
performance and reliability by providing top
quality technologies to industries that depend
on consistent, long-lasting performance.
We are working diligently on the integration of our acquired businesses so we
can optimize performance and continue to deliver value to our customers and
shareholders. Throughout this annual report, we are proud to introduce to you
the new Greatbatch family of companies and the identity system that will drive
brand awareness, preference and loyalty.
The new Greatbatch family of companies is strategically aligned to deliver
unprecedented performance, reliability and critical technologies to allow our
customers the opportunity to bring their solutions to market. The family extends
beyond cardiac rhythm management (CRM) into the neuromodulation, vascular
access and orthopaedics markets. The commercial side of our business has
expanded into the portable medical and process markets and also serves the
energy, security, mobile data and environmental markets. We now have a global
customer base for whom we continually deliver on our reputation of excellence
and reliability.
1

2008 was a year of transformation, execution and momentum building for
Greatbatch. It was a year in which we achieved our goals and made signifi cant
progress executing on our strategic initiatives. We have worked hard to ensure
that we established the foundation that will carry the success of Greatbatch
forward into 2009 and beyond.
Over the past year, we focused a considerable amount of our energy and resources
towards implementing our strategic initiatives. In such uncertain economic times,
we felt that remaining dedicated to our strategy of diversifi cation, streamlining
our operations and driving growth through innovation would not only help
Greatbatch emerge from this recession as a stronger company, but as a
company better suited to meet the unique demands of our customers.
One of the achievements in 2008 that I am most proud of is the success of our
diversifi cation strategy. At the beginning of 2007, we set out to enhance the
overall diversifi cation of our business and create additional opportunities to
leverage our core strengths. Through the completion of seven acquisitions
in less than a year, we did just that. This expansion has created additional
opportunities to sell a broader portfolio of products across multiple divisions
within our key accounts. Additionally, it reduced our reliance on the CRM market
from a concentration of approximately 80% of revenues in 2007 to approximately
50% in 2008. Given the normalized growth level currently being experienced
by the CRM market and achieving record sales of $546.6 million during 2008,
including 7% organic growth, I think it is safe to say that we have validated our
strategic vision.
Although diversifying the business was an important part of 2008, continuing to
streamline our operations and optimize our production was another key step in
reaching our desired milestones. At Greatbatch, we have a reputation of successfully
optimizing and consolidating our operations and we continued this performance
over this past year. During 2008, IndustryWeek recognized our Alden, New York
facility as being one of the top 10 best plants in North America. Additionally, the
State of Massachusetts recognized our Raynham facility with an Economic Impact
Award. In 2008, we also implemented six and initiated another four consolidation
projects to enhance the operating performance of our new businesses and to
Dear Fellow Shareholders,
2

move them closer to the Greatbatch operating model. As evidenced by the
improvement in our operating margin during 2008, we have already begun to
realize several of the benefi ts, which will defi ne our success within this initiative.
Our fi nal strategic initiative is to drive growth through developing innovative
new technologies. During 2008, we spent over $40 million on research and
development. On an annualized basis, Greatbatch intends to spend approximately
8% of sales revenue on R&D as we continue to develop new off erings and
solutions for our customers. This investment in R&D is important in that it enables
us to maintain our leadership position in our core markets, drive new growth
opportunities and potentially provide additional cost savings across our growing
portfolio. The growing demand for our innovative new product solutions such as
MRI compatible components and wireless sensing devices has helped us identify
future growth opportunities across our family of businesses. We are continuously
evaluating opportunities to facilitate the introduction of new or improved
technologies in order to provide our customers and partners the ability to bring
those solutions to market.
Ultimately, the true driver behind all of our achievements to date has been the
phenomenal talent and dedication of our 3,300 Greatbatch employees. It is through
this group of people that we have been able to spread the Greatbatch culture and
establish the quality and recognition that accompanies our products today.
As you read through this annual report, you’ll see why 2008 was indeed a year
of action. As a company that is holistic and forward looking in its vision, the
momentum we have gained through 2008 cannot be ignored, and I couldn’t
be more excited for our future of possibilities.
Sincerely,
Thomas J. Hook
“In such uncertain economic times, we felt that remaining dedicated to our
strategy of diversifi cation, streamlining our operations and driving growth
through innovation would not only help Greatbatch emerge from this recession
as a stronger company, but as a company better suited to meet the unique
demands of our customers.”
Thomas J. Hook — President & Chief Executive Offi cer
3

The last two years have represented signifi cant change at Greatbatch. Our
diversifi cation strategy continues to progress, as we have acquired seven
companies, streamlined operations and built a diverse off ering of products
and unique technologies to better serve an expanded customer base. The
results of this are made evident by our record diversifi ed sales in 2008.
Greatbatch Medical is committed to the design and manufacture of critical
technologies that enhance the reliability and performance of medical devices
and procedures. We do this to ensure that our customers can continuously
provide clinicians with better treatment options to improve patient outcomes.
Electrochem invests in delivering highly customized and reliable technology
solutions in battery power and wireless sensing systems to enable our customers’
products in critical industrial markets for their mission success.
We are very proud of what the new Greatbatch family has become – a coalition
of companies strategically aligned to deliver unprecedented performance and
reliability in critical technologies to serve some of today’s most vital applications.
Our Businesses
CRM & Neurology
Orthopaedics
Vascular Access
Commercial
15%
85%
15%
85%
14%
26%
51%
9%
2007 SALES
(PRE-ACQUISITIONS)
2008 SALES
4

5

6

Our implantable medical business has grown signifi cantly over the past two
years through a combination of acquisitions and organic growth. Over the
course of 2008, we successfully integrated our core and acquired businesses
into Greatbatch Medical, a cohesive unit which now serves the cardiac rhythm
management, neuromodulation, vascular access and orthopaedics markets.
With a broader product off ering in place, we can continue to strengthen our
performance by ensuring that our customers can focus on what matters most
to them—the advancement of medical technologies that contribute to the best
outcomes possible for patients around the world. We are following through on
our commitment to their success by providing supporting technologies and doing
our part to facilitate new developments.
In our core markets of CRM and neuromodulation, our revenue growth and
positioning as a key strategic partner to our customers remains strong. In 2008,
we continued to see further adoption of our Q series battery platform. With
momentum behind us, we expect to see our QHR® and QMR® technology further
implemented into our customers’ product off erings in 2009. Our technology
enables each customer’s specifi c strategy, while improving patient care and safety.
We are also excited about our MRI compatible lead systems and components. In
2008, we were granted a key foundation patent to our MRI intellectual property,
and signed a collaborative agreement with an OEM customer who will leverage
our eM-able™ technology in future CRM systems. We are ready to further engage
in development agreements with our other customers in 2009.
“We see a signifi cant opportunity for growth for our expanded product lines. Our
plan is to leverage our new technologies, broader product off erings and strong
customer relationships to capitalize on signifi cant cross-selling opportunities.”
Mauricio Arellano — Senior Vice President, Cardiac & Neurology
7

“What excites me in particular about our diversifi cation into the orthopaedics
space is the opportunity to leverage our core strengths of innovation and
operating discipline to become an ideal partner for our customers.”
Susan H. Campbell — Senior Vice President, Orthopaedics
8
Turning to vascular access, during 2008 we continued to commercialize the
products and technologies acquired in 2007. Although these revenue lines are
smaller, we now have various product lines, including advanced introducer and
catheter delivery systems, which give us opportunities where we historically had
little to no revenue. Our vascular access products provide us with signifi cant
growth opportunities for the future.
$468,410
$269,822
$227,407
$207,914
$172,655
2008
2007
2006
2005
2004
GREATBATCH MEDICAL SALES (IN THOUSANDS) 5-YEAR CAGR: 20%
We entered the fast growing and global orthopaedics market in early 2008.
Throughout the year, we began to put in place various lean manufacturing tools,
which will drive best-in-class leadtimes and fl awless execution for our customers.
Further leveraging our history of innovation and reliability will be key areas
of focus for 2009 and will drive investment for this business. We believe the
opportunities within this market are endless and that 2009 will be an exciting
year of integration, improvement and growth.
What sets us apart from our competitors is our history of innovation, reliability
and operational excellence. An example of our operational excellence lies in the
recognition our Alden facility received when it was named among IndustryWeek’s
2008 Top 10 Best Plants. These characteristics, which are evident across our
business, will prove to be the biggest assets we have to grow our revenues
profi tably in the future.

Through Electrochem, we provide unique and innovative technology solutions for
critical applications, leveraging our heritage and technical expertise in customized
battery solutions and expanding into wireless sensing solutions. Our technologies
are used to ensure reliable power for soldier communications, to improve operations
for oil and gas companies, to detect and warn of developing tsunamis, and to
ensure automated external defi brillators perform when needed. These are just
a few of the critical applications that Electrochem’s technologies enable.
“Our expanded technology portfolio provides us the ability to customize solutions
for our customers, which has opened up new market penetration opportunities.”
Susan M. Bratton — Senior Vice President, Commercial
9
$78,504
$48,924
$43,735
$33,183
$27,464
2008
2007
2006
2005
2004
ELECTROCHEM SALES (IN THOUSANDS) 5-YEAR CAGR: 25%
Our Electrochem business has gone through changes over the past year that
have improved our comprehensive off erings and brought us closer to our end
customers. During 2008, we began to integrate our IntelliSensing and Engineered
Assemblies Corporation (EAC) acquisitions, and made signifi cant investments
in capacity, technology and automation. Investing in capacity was a priority
for us, and the successful construction of our new state-of-the-art facility in
Raynham, Massachusetts was a major part of our strategic plan. Our business
is highly customized to meet our customers’ complex needs, and operations that
enable fl exibility and agility are essential to our future growth and success. This
integration of our technologies and the expansion of our capacity have given us
a competitive advantage over the rest of the marketplace, where no one else has
the breadth of off erings that Electrochem can provide.

FEBRUARY
Acquisition of DePuy Orthopaedics’ facility
in Chaumont, France completed, enhancing
Greatbatch’s strategic relationship with one
of the largest orthopaedic companies in the
world and extending its product off ering to
a full range of orthopaedic implants.
MARCH
In eff orts to fully encompass
the scope and diversity of our
medical business segment,
Greatbatch initiates a global
branding campaign in an eff ort
to unify the brands acquired.
APRIL
Greatbatch announces the
launch of the new Electrochem
brand which incorporates
its acquisition-enhanced
product line, its heritage
and technical expertise in
delivering customized battery
solutions and its expansion
into comprehensive wireless
sensing systems to off er
a broader solution set for
its commercial markets.
JUNE
Greatbatch
was granted a
key foundation
patent for its
MRI technology.
MRI compatible
components are
just one example
of Greatbatch’s
strategy to deliver
innovative solutions
to its customers.
JANUARY
Acquisition of Precimed
completed, giving
Greatbatch both new
technology and an ideal
entry into the fast-growing
orthopaedics market.
MAY
Sorin Group and Greatbatch
announce agreement to
leverage Greatbatch’s MRI
technology for Sorin Group
CRM Devices.
2008 was a year of action for Greatbatch. On top of outstanding fi nancial
performance, we made a great deal of progress in our diversifi cation strategy,
continuing a strong tradition of streamlining operations and driving growth
through innovation. Having completed and integrated seven acquisitions,
successfully consolidated and re-aligned many of our facilities and innovated
a number of new products and technologies, we believe our pursuit
of Greatbatch’s transformation was evident this year more than ever.
A Year of Action
10
Creating tomorrow.

SEPTEMBER
Completed consolidation of
Electrochem Orchard Park, NY
location into existing Clarence,
NY facility, eff ectively reducing
excess manufacturing capacity.
AUGUST
Construction of Electrochem
Raynham, MA facility completed
and consolidation of Canton,
MA facility into Raynham
begins. Raynham triples the
capacity of Electrochem’s
operations to support its
growing business and allows
for greater semi-automation
and optimized manufacturing
processes.
DECEMBER
Greatbatch Medical
Alden, NY facility
is recognized for
its continuous
improvements in lean
manufacturing and
Six Sigma practices
with IndustryWeek’s
top 10 best plants in
North America award.
JULY
Completed consolidation of
Greatbatch Medical Columbia,
MD facility into Tijuana, Mexico
facility while continuing to meet
all customer demands.
NOVEMBER
Electrochem Raynham, MA facility
is recognized by the Massachusetts
Alliance for Economic Development
as a Gold Award Winner. Recognizes
Electrochem for continuing to make an
impact in Massachusetts through facility
expansion, job creation and commitment
to the community.
OCTOBER
Announced plans to consolidate 1) Greatbatch
Medical Blaine, MN facility into existing Plymouth,
MN facility; 2) Electrochem Teterboro, NJ facility
into Raynham, MA facility; and 3) Greatbatch
Medical Exton, PA administrative offi ces into
other facilities that have excess capacity, further
streamlining operations.
11

12
A Future of Possibilities
RESEARCH AND DEVELOPMENT SPEND
During 2008, Greatbatch spent approximately
8% of sales revenue on research and development.
We intend to maintain our investment at these
levels as we continue to develop new off erings
for our customers in both the Greatbatch Medical
and Electrochem segments.
ELECTROCHEM
Electrochem’s acquired
rechargeable battery
and wireless sensing
technologies have
produced a number of
opportunities in which
we could see horizontal
and vertical penetration,
especially within the
energy, portable medical
and process markets.
RICH FARRELL — VICE PRESIDENT, QIG
“Greatbatch has and will continue to
support the development of ideas
and technologies that can be used to
better serve our customers. One of our
main objectives for the future will be to
provide our customers with cost eff ective
technological advantages and innovative
ideas that they need to be successful.”
GREATBATCH MEDICAL
Within Greatbatch Medical, we continue to work with our customers
to develop technologies that diff erentiate their products. These
include our Q series medium- and high-rate batteries, our new
platform of premium rechargeable batteries, MRI compatible lead
systems and components, EMI fi ltering, and high energy/high
density capacitors. We have high expectations for development
and commercialization of these projects going forward.
At Greatbatch, we leverage our strength in the development and manufacturing of
critical technologies to provide our customers and partners the opportunity to bring
those solutions to market while retaining their focus on the clinical relationships
that are paramount to their successful growth. We believe that many of the
technologies we are developing today will provide us with a signifi cant platform
for growth in the future. Additionally, through a combination of patents, licenses,
trade secrets and know-how, which establishes and protects our proprietary
rights, our technologies will continue to lead our industries for years to come.
2009 PROJECTED
2008
2007
$ 48.0 MILLION
$ 41.2 MILLION
$ 35.1 MILLION

UNITED STATES SECURITIES AND EXCHANGE COMMISSION
Washington, D.C. 20549
FORM 10-K
ANNUAL REPORT PURSUANT TO SECTION 13 or 15(d) OF THE SECURITIES EXCHANGE ACT OF 1934
For The Fiscal Year Ended January 2, 2009
Commission File Number 1-16137
GREATBATCH, INC.
(Exact name of Registrant as specified in its charter)
Delaware (State of Incorporation)
16-1531026 (I.R.S. Employer Identification No.)
10000 Wehrle Drive
Clarence, New York 14031 (Address of principal executive offices)
(716) 759-5600
(Registrant’s telephone number, including area code)
Securities Registered Pursuant to Section 12(b) of the Act:
Title of Each Class: Name of Each Exchange on Which Registered: Common Stock, Par Value $.001 Per Share New York Stock Exchange
Preferred Stock Purchase Rights New York Stock Exchange
Securities Registered Pursuant to Section 12(g) of the Act: None
Indicate by check mark if the registrant is a well-known seasoned issuer, as defined in Rule 405 of the Securities Act. Yes [ ] No [X]
Indicate by check mark if the registrant is not required to file reports pursuant to Section 13 or Section 15(d) of the Act. Yes [ ] No [X]
Indicate by check mark whether the Registrant (1) has filed all reports required to be filed by Section 13 or 15(d) of the Securities Exchange Act of 1934 during the preceding 12 months (or for such shorter period that the Registrant was required to file such reports), and (2) has been subject to such filing requirements for the past 90 days. Yes [X] No [ ]

Indicate by check mark if disclosure of delinquent filers pursuant to Item 405 of Regulation S-K is not contained herein, and will not be contained, to the best of the registrant’s knowledge, in definitive proxy or information statements incorporated by reference in Part III of this Form 10-K or any amendment to this Form 10-K. [ ]
Indicate by check mark whether the registrant is a large accelerated filer, an accelerated filer, a non-accelerated filer, or a smaller reporting company. See the definitions of “large accelerated filer,” “accelerated filer” and “smaller reporting company” in Rule 12b-2 of the Exchange Act. (Check one):
Large accelerated filer [ ] Accelerated filer [X] Non- accelerated filer [ ] Smaller reporting company [ ]
Indicate by check mark whether the Registrant is a shell company (as defined in Rule 12b-2 of the Act).
Yes [ ] No [X] The aggregate market value of common stock of Greatbatch, Inc. held by nonaffiliates as of June 27,
2008, based on the last sale price of $17.20, as reported on the New York Stock Exchange: $382.3 million. Solely for the purpose of this calculation, shares held by directors and officers and 10 percent shareholders of the Registrant have been excluded. Such exclusion should not be deemed a determination by or an admission by the Registrant that these individuals are, in fact, affiliates of the Registrant.
Shares of common stock outstanding on March 2, 2009: 23,039,217
DOCUMENTS INCORPORATED BY REFERENCE
The following documents, in whole or in part, are specifically incorporated by reference in the indicated part of the Company’s Proxy Statement:
Document Part
Proxy Statement for the 2009 Annual Meeting of Stockholders
Part III, Item 10 “Directors, Executive Officers and Corporate Governance”
Part III, Item 11
“Executive Compensation” Part III, Item 12
“Security Ownership of Certain Beneficial Owners and Management and Related Stockholder Matters”
Part III, Item 13
“Certain Relationships and Related Transactions, and Director Independence”
Part III, Item 14 “Principal Accounting Fees and Services”

3
TABLE OF CONTENTS
ITEM PAGE NUMBER NUMBER
PART I
1 Business ................................................................................................................................................... 4
1A Risk Factors ............................................................................................................................................. 17
1B Unresolved Staff Comments .................................................................................................................... 27
2 Properties ................................................................................................................................................. 27
3 Legal Proceedings .................................................................................................................................... 28
4 Submission of Matters to a Vote of Security Holders ............................................................................. 28
PART II
5 Market for Registrant’s Common Equity, Related Stockholder Matters and Issuer Purchases of Equity Securities. ................................................................................................................................................
28
6 Selected Financial Data ........................................................................................................................... 30
7 Management’s Discussion and Analysis of Financial Condition and Results of Operation ................... 31
7A Quantitative and Qualitative Disclosures About Market Risk ................................................................. 58
8 Financial Statements and Supplementary Data ....................................................................................... 60
9 Changes in and Disagreements With Accountants on Accounting and Financial Disclosure ................. 111
9A Controls and Procedures .......................................................................................................................... 112
9B Other Information .................................................................................................................................... 112
PART III
10 Directors, Executive Officers and Corporate Governance ...................................................................... 113
11 Executive Compensation ......................................................................................................................... 113
12 Security Ownership of Certain Beneficial Owners and Management and Related Stockholder Matters 113
13 Certain Relationships and Related Transactions, and Director Independence ........................................ 113
14 Principal Accounting Fees and Services .................................................................................................. 113
PART IV
15 Exhibits, Financial Statement Schedules ................................................................................................. 113
Signatures ............................................................................................................................................... 115

4
PART I ITEM 1. BUSINESS
OVERVIEW
Greatbatch, Inc. is a leading developer and manufacturer of critical products used in medical devices for the cardiac rhythm management, neuromodulation, vascular, orthopedic and interventional radiology markets. Additionally, Greatbatch, Inc. is a world leader in the design, manufacture and distribution of electrochemical cells, battery packs and wireless sensors for demanding applications in markets such as energy, security, portable medical, environmental monitoring and more. When used in this report, the terms “we,” “us,” “our” and the “Company” mean Greatbatch, Inc. and its subsidiaries. We believe that our proprietary technology, close customer relationships, multiple product offerings, market leadership and dedication to quality provide us with competitive advantages and create a barrier to entry for potential market entrants.
The Company is a Delaware corporation that was incorporated in 1997 and since that time has completed the following acquisitions:
Acquisition date Acquired company Business at time of acquisition
July 1997 Wilson Greatbatch Ltd. (“WGL”)
Founded in 1970, the company designed and manufactured batteries for implantable medical devices (“IMD”) and commercial applications including oil and gas, aerospace, and oceanographic.
August 1998 Hittman Materials and Medical Components, Inc. (“Hittman”)
Founded in 1962, the company designed and manufactured ceramic and glass feedthroughs and specialized porous coatings for electrodes used in IMDs.
August 2000 Battery Engineering, Inc. (“BEI”)
Founded in 1983, the company designed and manufactured high-energy density batteries for industrial, commercial, military and medical applications.
June 2001 Sierra-KD Components division of Maxwell Technologies, Inc. (“Sierra”)
Founded in 1986, the company designed and manufactured ceramic electromagnetic filtering capacitors and integrated them with wire feedthroughs for use in IMDs. Sierra also designed and manufactured ceramic capacitors for military, aerospace and commercial applications.

5
Acquisition date Acquired company Business at time of acquisition
July 2002 Globe Tool and Manufacturing Company, Inc. (“Globe”)
Founded in 1954, the company designed and manufactured precision enclosures used in IMDs and commercial products used in the aerospace, electronic, and automotive sectors.
March 2004 NanoGram Devices Corporation (“NanoGram”)
Founded in 1996, the company developed nanoscale materials for battery and medical device applications.
April 2007 BIOMEC, Inc. (“BIOMEC”)
Established in 1998, the company provided medical device design and component integration to early-stage and established customers.
June 2007 Enpath Medical, Inc. (“Enpath”)
Founded in 1981, the company designed, developed, and manufactured venous introducers and dilators, implantable leadwires, steerable sheaths and steerable catheters.
October 2007 IntelliSensing LLC (“IntelliSensing”)
Established in 2005, the company designed and manufactured battery-powered wireless sensing solutions for demanding commercial applications.
November 2007 Quan Emerteq LLC (“Quan”)
Founded in 1998, the company designed, developed, and manufactured single use medical device products and components including delivery systems, catheters, stimulation leadwires and microcomponents and assemblies.
November 2007 Engineered Assemblies Corporation (“EAC”)
Founded in 1984, the company designed and integrated custom battery solutions and electronics focused on rechargeable systems.
January 2008 P Medical Holding SA (“Precimed”)
Founded in 1994, the company designed, manufactured and supplied trays, instruments and implants for orthopedic original equipment manufacturers (“OEM”).
February 2008 DePuy Orthopaedics’ Chaumont, France manufacturing facility (“DePuy”)
The facility manufactured hip, shoulder trauma and knee implants for DePuy.

6
FINANCIAL STATEMENT YEAR END
We utilize a fifty-two, fifty-three week fiscal year ending on the Friday nearest December 31st. Fiscal years 2008, 2007 and 2006 ended on January 2, 2009, December 28, 2007 and December 29, 2006, respectively. Fiscal year 2008 contained fifty-three weeks while fiscal years 2007 and 2006 contained fifty-two weeks.
SEGMENT INFORMATION
We operate our business in two reportable segments – Implantable Medical Components (“IMC”) and Electrochem Solutions (“Electrochem”). Segment information including sales from external customers, profit or loss, and assets by segment as well as sales from external customers and long-lived assets by geographic area are set forth at Note 15 – “Business Segment Information” of the Notes to the Consolidated Financial Statements contained at Item 8 of this report.
IMPLANTABLE MEDICAL DEVICE INDUSTRY
An IMD is an instrument that is surgically inserted into the body to provide diagnosis or therapy.
One sector of the IMD market is cardiac rhythm management (“CRM”), which is comprised of devices such as implantable pacemakers, implantable cardioverter defibrillators (“ICDs”), cardiac resynchronization therapy (“CRT”) devices, and cardiac resynchronization therapy with backup defibrillation devices (“CRT-D”).
A new emerging opportunity sector of the IMD market is the neuromodulation market, which is comprised of pacemaker-type devices that stimulate nerves for the treatment of various conditions. Beyond approved therapies of pain control, incontinence, Parkinson’s disease and epilepsy, nerve stimulation for the treatment of other disabilities such as migraines, obesity and depression has shown promising results.
The following table sets forth the main categories of battery-powered IMDs and the principal illness or symptom treated by each device:
Device Principal Illness or Symptom Pacemakers ...................................................... Abnormally slow heartbeat (Bradycardia) ICDs ................................................................. Rapid and irregular heartbeat (Tachycardia) CRT/CRT-Ds ................................................... Congestive heart failure Neurostimulators .............................................. Chronic pain, movement disorders, epilepsy,
obesity or depression Left ventricular assist devices (LVADs) .......... Heart failure Drug pumps ...................................................... Diabetes or chronic pain We believe that the CRM and Neuromodulation markets continue to exhibit strong underlying growth fundamentals and that we are well positioned to continue to participate in this market growth. Increased demand is being driven by the following factors:
• Advances in medical technology – new therapies will allow physicians to use IMDs to treat a wider range of heart diseases.

7
• New, more sophisticated implantable devices – device manufacturers are developing new CRM devices and adding new features to existing products.
• New indications for CRM devices – the patient groups that are eligible for CRM devices have increased. Insurance guidelines may allow device reimbursements for these expanding patient populations.
• Growth within neuromodulation – approved segments growing at 17% CAGR with additional new indications and therapies targeted to complete clinical activities within two years.
• Expansion of neuromodulation applications – therapies expected to expand as new therapeutic applications for pulse generators are identified.
• An aging population – the number of people in the U.S. that are over age 65 is expected to double in the next 30 years.
• New performance requirements – government regulators are increasingly requiring that IMDs be protected from electromagnetic interference (“EMI”).
• Global markets – increased market penetration worldwide. With the acquisition of Enpath and Quan during 2007, we obtained new product offerings for vascular access. These offerings include products that deliver therapies for coronary/neurovascular disease, peripheral vascular disease, neuromodulation, CRM, as well as products for medical imaging and drug and pharmaceutical delivery. These products seek to capitalize on the growth in the Neuromodulation and CRM markets, specifically with new indications for neuromodulation devices. In addition, we continue to see strong growth in the vascular markets because of stent delivery procedures, peripheral-vascular disease therapies, and new indications for tissue extraction or ablation.
• Continued focus on minimally invasive procedures – Patients and health care providers looking for minimally invasive technologies to treat disease expanding both catheter based procedures and associated vascular access.
In early 2008, with the acquisition of Precimed and the Chaumont manufacturing facility, we entered the orthopedic sector of the IMD market. Many of the factors affecting the orthopedic market segment are similar to the CRM market. These factors include aging population, new implant and surgical technology, rising rates of obesity, a growing replacements market and emerging affluence in developing nations. As a result, we believe that the orthopedic market will also continue to exhibit strong growth fundamentals.
ELECTROCHEM SOLUTIONS INDUSTRY Our customized rechargeable and non-rechargeable battery solutions are used in a number of demanding industrial markets such as energy, security, portable medical, environmental monitoring and more. Applications in these segments cover a number of battery-powered systems including downhole drilling tools, hand-held military communications, automated external defibrillators, and more. Electrochem’s primary power systems are used in these core markets because of extreme operating conditions and long life requirements. Our primary batteries operate reliably and safely at extremely high and low temperatures and with high shock and vibration.

8
Our rechargeable power systems include a number of chemistries including lithium, nickel and lead acid. We provide value-added solutions to complement our secondary power systems such as charging and battery management. Our unique wireless sensing system is a complete solution, incorporating advanced, ruggedized sensors, gateways and software. Electrochem’s patented system is a complete solution, utilizing our own battery power and offering control and monitoring for applications in existing markets such as energy and new markets such as process control. We expect the demand for reliable portable power and integrated wireless sensing solutions to continue to rise with demand in energy, security and portable medical segments. PRODUCTS The following table provides information about our principal products:
IMPLANTABLE MEDICAL COMPONENTS:
PRODUCT DESCRIPTION PRINCIPAL PRODUCT ATTRIBUTES
Batteries Power sources include: ♦ Lithium iodine (“Li Iodine”) ♦ Lithium silver vanadium oxide (“Li SVO”) ♦ Lithium carbon monoflouride (“Li CFx”) ♦ Lithium ion rechargeable (“Li Ion”) ♦ Lithium SVO/CFx (“QHR” & “QMR”)
High reliability and predictability Long service life Customized configuration Light weight Compact and less intrusive
Capacitors Storage for energy generated by a battery before delivery to the heart. Used in ICDs and CRT-Ds.
Stores more energy per unit volume (energy density) than other existing technologies Customized configuration
EMI filters Filters electromagnetic interference to limit undesirable response, malfunctioning or degradation in the performance of electronic equipment
High reliability attenuation of EMI RF over wide frequency ranges Customized design
Feedthroughs Allow electrical signals to be brought from inside hermetically sealed IMD to an electrode
Ceramic to metal seal is substantially more durable than traditional seals Multifunctional
Coated electrodes Deliver electric signal from the feedthrough to a body part undergoing stimulation
High quality coated surface Flexible in utilizing any combination of biocompatible coating surfaces Customized offering of surfaces and tips
Precision components ♦ Machined ♦ Molded and over molded products
High level of manufacturing precision Broad manufacturing flexibility
Enclosures and related components
♦ Titanium ♦ Stainless steel
Precision manufacturing, flexibility in configurations and materials
Value-added assemblies
Combination of multiple components in a single package/unit
Leveraging products and capabilities to provide subassemblies and assemblies Provides synergies in component technology and procurement systems

9
PRODUCT DESCRIPTION PRINCIPAL PRODUCT ATTRIBUTES
Leads Cardiac, neuro and hearing restoration stimulation leads
Custom and unique configurations that increase therapy effectiveness, provide finished device design and manufacturing
Introducers Creates a conduit to insert infusion catheters, guidewires, implantable ports, pacemaker leads and other therapeutic devices into a blood vessel
Variety of sizes and materials that facilitate problem-free access in a variety of clinical applications
Catheters Delivers therapeutic devices to specific sites in the
body
Enable safe, simple delivery of therapeutic and diagnostic devices, soft tip and steerability. Provide regulatory clearance and finished device
Implants Orthopedic implants for reconstructive hip, shoulder, knee, trauma and spine procedures
Precision manufacturing, leveraging capabilities and products, complete processes including sterile packaging and coatings
Instruments Orthopedic instruments for reconstructive and trauma procedures
Designed to improve surgical techniques, reduce surgery time, increase surgical precision and decrease risk of contamination
Trays Delivery systems for cleaning and sterilizing orthopedic instruments and implants
Deliver turn-key full service kits
ELECTROCHEM SOLUTIONS:
Cells ♦ Moderate-rate ♦ Spiral (high rate)
Optimized rate capability, shock and vibration resistant High energy density
Primary and rechargeable battery packs
Bundling of commercial batteries in a customer specific configuration
Increased power and recharging capabilities and ease of integration into customer applications
Wireless sensors Operates where wired sensors are undesirable or impractical
Measures pressure and temperature at the same time, withstands harsh environments
RESEARCH AND DEVELOPMENT Our position as a leading developer and manufacturer of components for IMDs and commercial batteries is largely the result of our long history of technological innovation. We invest substantial resources in research, development and engineering. Our scientists, engineers and technicians focus on improving existing products, expanding the use of our products and developing new products. In addition to our internal technology and product development efforts, we also engage outside research institutions for unique technology projects. PATENTS AND PROPRIETARY TECHNOLOGY We rely on a combination of patents, licenses, trade secrets and know-how to establish and protect our proprietary rights to our technologies and products. We have 372 active U.S. patents and 264 active foreign patents. We also have 272 U.S. and 373 foreign pending patent applications at various stages of approval. During the past three years, we have been granted 87 new U.S. patents, of which 13 were granted in 2008. Corresponding foreign patents have been issued or are expected to be issued in the near future. Often, several patents covering various aspects of the design protect a single product. We believe this provides broad protection of the inventions employed.

10
We are also a party to several license agreements with third parties under which we have obtained, on varying terms, the exclusive or non-exclusive rights to patents held by them. One of these agreements is for the basic technology used in our wet tantalum capacitors. We have also granted rights in our patents to others under license agreements. It is our policy to require our management and technical employees, consultants and other parties having access to our confidential information to execute confidentiality agreements. These agreements prohibit disclosure of confidential information to third parties except in specified circumstances. In the case of employees and consultants, the agreements generally provide that all confidential information relating to our business is the exclusive property of the Company. MANUFACTURING AND QUALITY CONTROL While we have adequate capacity we primarily manufacture small lot sizes, as most customer orders range from a few hundred to a few thousand units. As a result, our ability to remain flexible is an important factor in maintaining high levels of productivity. Each of our production teams receives assistance from a manufacturing support team, which typically consists of representatives from our quality control, engineering, manufacturing, materials and procurement departments. Our quality systems are compliant with and certified to various recognized international standards. Our commercial battery facilities in Raynham, MA and Teterboro, NJ, and our facilities in Alden, NY and Minneapolis, MN (enclosure manufacturing and engineering) are ISO 9001-2000 registered, which requires compliance with regulations regarding quality systems of product design (where applicable), supplier control, manufacturing processes and management review. This certification can only be achieved after completion of an audit conducted by an independent authority. The Quality Systems of our facilities in Tijuana, Mexico, Minneapolis, MN, Clarence, NY (machining and assembly of components), and the Orvin, Switzerland (Precimed) sites are certified to the requirements of ISO 13485 for the design (where applicable) and manufacture of components and finished device assemblies. This level of certification allows for the manufacture and distribution (via CE mark) of finished medical devices as well as device components in Europe and finished medical devices in Canada. This certification gives us the ability to serve as a manufacturing partner to medical device manufacturers, which we believe will improve our competitive position in the vascular access, CRM and emerging neuromodulation and orthopedic markets. Our Vascular Access facility (Minneapolis, MN) and several of our Orthopedics facilities (Switzerland and France) are also registered with the FDA, thus enabling the manufacture and distribution of FDA cleared registered medical devices inside the U.S. We are currently working with several neuromodulation companies that can benefit from our expanded capabilities. Providing device level manufacturing capability allows us to move up our customers’ supply-chain and helps to drive both component and sub-assembly growth. Our existing manufacturing plants are audited by several notified bodies (TUV, G-Med, QMI, BSI, and the National Standards Authority of Ireland). To maintain certification, all facilities must be reexamined routinely by their respective notified body.

11
SALES AND MARKETING Products from our IMC business are sold directly to our customers. In our Electrochem business, we utilize a combination of direct and indirect sales methods, depending on the particular product. In 2008, approximately 49% of our products were sold in the U.S. Sales to countries outside of the U.S. are primarily to customers whose corporate offices are located and headquartered in the U.S. Information regarding our sales by geographic area is set forth at Note 15 – “Business Segment Information” of the Notes to the Consolidated Financial Statements contained at Item 8 of this report. The majority of our medical customers contract with us to develop custom components and assemblies to fit their product specifications. As a result, we have established close working relationships between our internal program managers and our customers. We market our products and technologies at industry meetings and trade shows domestically and internationally.
Internal sales managers support all activity and involve engineers and technology professionals in the sales process to address customer requests appropriately.
We sell our commercial cells and battery packs directly to the end user, directly to manufacturers that incorporate our products into other devices for resale, or to distributors who sell our products to manufacturers and end users. Our sales managers are trained to assist our customers in selecting appropriate chemistries and configurations. We market our Electrochem products at various technical trade meetings. We also place print advertisements in relevant trade publications.
Firm backlog orders at January 2, 2009 and December 28, 2007 were approximately $190.4 million and $107.2 million, respectively. Most of these orders are expected to be shipped within one year. See Customers section below for further discussion. CUSTOMERS Our IMC customers include leading OEMs, in alphabetical order here and throughout this report, such as Biotronik, Boston Scientific, DePuy, Johnson & Johnson, Medtronic, Smith & Nephew, Sorin Group, St. Jude Medical, Stryker and Zimmer. During 2007 and 2008, we completed seven acquisitions consistent with our strategic objective to diversify our customer base and market concentration. As a result, in 2008, Boston Scientific, Medtronic and St. Jude Medical, collectively accounted for 44% of our total sales, compared to 67% in 2007 and 2006. The nature and extent of our selling relationships with each IMC customer are different in terms of breadth of component products purchased, purchased product volumes, length of contractual commitment, ordering patterns, inventory management and selling prices. We have pricing arrangements with our customers that at times do not specify minimum order quantities. Our visibility to customer ordering patterns is over a relatively short period of time. Our customers may have inventory management programs and alternate supply arrangements of which we are unaware. Additionally, the relative market share among OEM device manufacturers changes periodically. These and other factors can significantly impact our sales. Our Electrochem customers are primarily companies involved in demanding applications in markets such as energy, security, portable medical and environmental monitoring including Halliburton Company, Weatherford International, General Electric, Thales, Zoll Medical Corp. and Scripps Institution of Oceanography.

12
SUPPLIERS AND RAW MATERIALS
We purchase certain critical raw materials from a limited number of suppliers due to the technically challenging requirements of the supplied product and/or the lengthy process required to qualify these materials with our customers. We cannot quickly establish additional or replacement suppliers for these materials because of these requirements. In the past, we have not experienced any significant interruptions or delays in obtaining these raw materials. We maintain minimum safety stock levels of critical raw materials.
For other raw material purchases, we utilize competitive pricing methods such as bulk purchases, precious metal pool buys, blanket orders, and long-term contracts to secure supply. We believe that there are alternative suppliers or substitute products available at competitive prices for all of the materials we purchase.
COMPETITION
Existing and potential competitors in our IMC business includes leading IMD manufacturers such as Biotronik, Boston Scientific, DePuy, Johnson & Johnson, Medtronic, Smith & Nephew, Sorin Group, St. Jude Medical, Stryker and Zimmer that currently have vertically integrated operations and may expand their vertical integration capability in the future. Competitors also include independent suppliers who typically specialize in one type of component.
Our known non-vertically integrated competitors include the following:
Product Line Competitors
Medical batteries Litronik (a subsidiary of Biotronik) Eagle-Picher
Capacitors Critical Medical Components
Feedthroughs Alberox (subsidiary of The Morgan Crucible Co. PLC)
EMI filtering AVX (subsidiary of Kyocera) Eurofarad
Enclosures Heraeus Hudson
Commercial batteries/battery packs
Engineered Power Saft Tadiran Tracer Technologies Ultralife Nexergy Micro-power Accutech vMonitor
Machined and molded components
Numerous

13
Product Line Competitors
Value added assembly Numerous
Orthopedic trays, instruments and implants
Symmetry Paragon Accelent Teleflex Viasys Orchid
Catheters Teleflex
Leads Oscor GOVERNMENT REGULATION Except as described below, our business is not subject to direct governmental regulation other than the laws and regulations generally applicable to businesses in the jurisdictions in which we operate. We are subject to federal, state and local environmental laws and regulations governing the emission, discharge, use, storage and disposal of hazardous materials and the remediation of contamination associated with the release of these materials at our facilities and at off-site disposal locations. Our manufacturing and research, development and engineering activities may involve the controlled use of small amounts of hazardous materials. Liabilities associated with hazardous material releases arise principally under the federal Comprehensive Environmental Response, Compensation and Liability Act and analogous state laws that impose strict, joint and several liability on owners and operators of contaminated facilities and parties that arrange for the off-site disposal of hazardous materials. We are not aware of any material noncompliance with the environmental laws currently applicable to our business and we are not subject to any material claim for liability with respect to contamination at any Company facility or any off-site location. We cannot assure you that we will not become subject to such environmental liabilities in the future as a result of historic or current operations. To varying degrees, our products are subject to regulation by numerous government agencies, including the U.S. Food and Drug Administration (“FDA”) and comparable foreign agencies. The medical product components we manufacture are not subject to regulation by the FDA. However, the FDA and related state and foreign governmental agencies regulate the completed devices we manufacture as well as our customers’ products as finished medical devices. We have “master files” on record with the FDA. Master files may be used to provide confidential detailed information about facilities, processes, or articles used in the manufacturing, processing, packaging and storing of one or more medical device components. These submissions may be used by device manufacturers to support the premarket notification process required by Section 510(k) of the Federal Food Drug & Cosmetic Act. This notification process is necessary to obtain clearance from the FDA to market a device for human use in the U.S.

14
The medical devices we manufacture and market are subject to regulation by the FDA and, in some instances, by state and foreign authorities. Pursuant to the Medical Device Amendments of 1976 to the Federal Food, Drug and Cosmetic Act and related regulations, medical devices intended for human use are classified into three categories (Classes I, II and III), depending upon the degree of regulatory control to which they will be subject. In the U.S., our introducer and delivery catheter products are considered Class II devices. If a Class II device is substantially equivalent to an existing (predicate) device that has been continuously marketed since the effective date of the 1976 Amendments, FDA requirements may be satisfied through a Pre-market Notification Submission or 510(k) under which the applicant provides product information supporting its claim of substantial equivalence. In a 510(k) Submission, the FDA may also require that we provide clinical test results demonstrating the safety and efficacy of the device. Generally, Class III devices are typically life-sustaining, life supporting, or implantable devices that must receive Pre-Market Approval (“PMA”) by the FDA to ensure their safety and effectiveness. A PMA is a more rigorous approval process typically requiring human clinical studies. Certain leads that we manufacture and market are Class III devices, but any required PMA is submitted and received by our customers. As a manufacturer of medical devices, we are also subject to certain other FDA regulations and our device manufacturing processes and facilities are subject to on-going review by the FDA in order to ensure compliance with the current Good Manufacturing Practices Regulation (21CFR820). We believe that our manufacturing and quality and regulatory systems conform to the requirements of all pertinent FDA regulations. Our sales and marketing practices are subject to regulation by the U.S. Department of Health and Human Services pursuant to federal anti-kickback laws, and are also subject to similar state laws. We are also subject to various other environmental, transportation and labor laws as well as various other directives and regulations both in the U.S. and abroad. We believe that compliance with these laws will not have a material impact on our capital expenditures, earnings or competitive position. Given the scope and nature of these laws, however, there can be no assurance that they will not have a material impact on our results of operations. We assess potential contingent liabilities on a quarterly basis. At present, we are not aware of any such liabilities that would have a material impact on our business.
RECRUITING AND TRAINING
We invest substantial resources in our recruiting efforts that focus on supplying quality personnel to support our business objectives. We have established a number of programs that are designed to challenge and motivate our employees. All staff are encouraged to be proactive in contributing ideas. Feedback surveys are used to collect suggestions on ways that our business and operations can be improved. We further meet our hiring needs through outside sources as required.
We provide a training program for our new employees that is designed to educate them on safety, quality, business strategy, corporate culture, and the methodologies and technical competencies that are required for our business. Our safety training programs focus on such areas as basic industrial safety practices and emergency response procedures to deal with any potential fires or chemical spills. All of our employees are required to participate in a specialized training program that is designed to provide an understanding of our quality

15
objectives. Supporting our lifelong learning environment, we offer our employees a tuition reimbursement program and encourage them to continue their education at accredited colleges and universities. Many of our professionals attend seminars on topics that are related to our corporate objectives and strategies. We believe that comprehensive training is necessary to ensure that our employees have state of the art skills, utilize best practices, and have a common understanding of work practices.
EMPLOYEES
The following table provides a breakdown of employees as of January 2, 2009:
Manufacturing 1,580 General and administrative 139 Sales and marketing 36 Research, development and engineering 199 Chaumont, France facility 214 Switzerland facilities 233 Tijuana, Mexico facility 882 Total 3,283
We also employ a number of temporary employees to assist us with various projects and service functions and address peaks in staff requirements. Our employees are not represented by any union. Approximately 170 and 180 positions at our Switzerland and France locations, respectively, are manufacturing in nature. The positions at our Tijuana, Mexico facility are primarily manufacturing. We believe that we have a good relationship with our employees.
EXECUTIVE OFFICERS OF THE COMPANY Information concerning our executive officers is presented below as of March 2, 2009. The officers’ terms of office run until the first meeting of the Board of Directors after our Annual Meeting, which takes place immediately following our Annual Meeting of Stockholders and until their successors are elected and qualified, except in the case of earlier death, retirement, resignation or removal. Mauricio Arellano, age 42, is Senior Vice President and the Business Leader for our Cardiac and Neurology Group. He served as the Senior Vice President and Business Leader of our CRM and Neuromodulation Group from January 2008 to October 2008, our Medical Solutions Group from November 2006 to January 2008 and as Vice President of Greatbatch Mexico from January 2005 to November 2006. Mr. Arellano joined our Company in October 2003 as the Plant Manager of our former Carson City, NV facility. Prior to joining our Company, he served in a variety of human resources and operational roles with Tyco Healthcare – Especialidades Medicas Kenmex and with Sony de Tijuana Este.
Susan M. Bratton, age 52, is Senior Vice President and Business Leader for our Commercial Group. She served as Vice President of Corporate Quality from March 2001 to January 2005, as General Manager of our Electrochem Division from July 1998 to March 2001 and as Director of Procurement from June 1991 to July 1998. Ms. Bratton has held various other positions with our Company since joining us in 1976.

16
Susan H. Campbell, age 44, is Senior Vice President and the Business Leader for our Orthopedics Group. Ms. Campbell had served as Senior Vice President for Global Manufacturing and Supply Chain from January 2008 until October 2008 and the Business Leader for our Medical Power Group from January 2005 until January 2008. She joined our Company in April 2003 as the Plant Manager for our medical battery facility. Prior to that time, Ms. Campbell was a plant manager for Delphi Corporation and General Motors Corporation. Barbara M. Davis, age 58, is Vice President for Human Resources, a position she has held since April 2004. She joined our Company in October 1998 as Director of Human Resources and Organization Development. Richard M. Farrell, age 46, is Vice President of our QIG Group. Mr. Farrell joined the Company with our acquisition of Quan in November 2007 as Vice President for Business Development. He was a founder of and had been employed by Quan in a variety of roles, since 1998, most recently as its Vice President of Business Development. Thomas J. Hook, age 46, is our President & Chief Executive Officer. Prior to August 2006, he was our Chief Operating Officer, a position he assumed upon joining our Company in September 2004. From August 2002 until September 2004, Mr. Hook was employed by CTI Molecular Imaging where he had served as President, CTI Solutions Group. Thomas J. Mazza, age 55, is Senior Vice President & Chief Financial Officer, a position he has held since August 2005. He joined our Company in November 2003 as Vice President and Corporate Controller. Prior to that, Mr. Mazza served in a variety of financial roles with Foster Wheeler Ltd., including Vice President and Corporate Controller. Timothy G. McEvoy, age 51, is Vice President, General Counsel & Secretary, a position he has held since joining our Company in February 2007. From 1992 until January 2007, he was employed in a variety of legal roles by Manufacturers and Traders Trust Company, most recently as Administrative Vice President and Deputy General Counsel. AVAILABLE INFORMATION
We make available free of charge through our internet website our annual report on Form 10-K, quarterly reports on Form 10-Q, current reports on Form 8-K and amendments to those reports filed or furnished pursuant to Section 13(a) or 15(d) of the Securities Exchange Act of 1934 as soon as reasonably practicable after we electronically file those reports with, or furnish them to, the Securities and Exchange Commission. Our Internet address is www.greatbatch.com. The information contained on our website is not incorporated by reference in this annual report on Form 10-K and should not be considered a part of this report. These items may also be obtained free of charge by written request made to Christopher J. Thome, Manager of External Reporting and Investor Relations, Greatbatch, Inc., 10000 Wehrle Drive, Clarence, New York 14031.

17
CAUTIONARY FACTORS THAT MAY AFFECT FUTURE RESULTS Some of the statements contained in this annual report on Form 10-K and other written and oral statements made from time to time by us and our representatives, are not statements of historical or current fact. As such, they are “forward-looking statements” within the meaning of Section 27A of the Securities Act of 1933, as amended, and Section 21E of the Securities Exchange Act of 1934, as amended. We have based these forward-looking statements on our current expectations, which are subject to known and unknown risks, uncertainties and assumptions. They include statements relating to:
• future sales, expenses and profitability; • the future development and expected growth of our business and industry; • our ability to execute our business model and our business strategy; • our ability to identify trends within our industries and to offer products and services
that meet the changing needs of those markets; and • projected capital expenditures.
You can identify forward-looking statements by terminology such as “may,” “will,” “should,” “could,” “expects,” “intends,” “plans,” “anticipates,” “believes,” “estimates,” “predicts,” “potential” or “continue” or the negative of these terms or other comparable terminology. These statements are only predictions. Actual events or results may differ materially from those suggested by these forward-looking statements. In evaluating these statements and our prospects generally, you should carefully consider the factors set forth below. All forward-looking statements attributable to us or persons acting on our behalf are expressly qualified in their entirety by these cautionary factors and to others contained throughout this report. We are under no duty to update any of the forward-looking statements after the date of this report or to conform these statements to actual results. Although it is not possible to create a comprehensive list of all factors that may cause actual results to differ from the results expressed or implied by our forward-looking statements or that may affect our future results, some of these factors include the following: dependence upon a limited number of customers; customer ordering patterns; product obsolescence; our inability to market current or future products; pricing pressure from customers; our ability to timely and successfully implement our cost reduction and plant consolidation initiatives; our reliance on third party suppliers for raw materials, products and subcomponents; fluctuating operating results; our inability to maintain high quality standards for our products; challenges to our intellectual property rights; product liability claims; our inability to successfully consummate and integrate acquisitions and to realize synergies and to operate these acquired businesses in accordance with expectations; our unsuccessful expansion into new markets; our inability to obtain licenses to key technology; regulatory changes or consolidation in the healthcare industry; global economic factors including currency exchange rates and interest rates; and other risks and uncertainties that arise from time to time and are described in Item 1A of this report. ITEM 1A. RISK FACTORS
Our business faces many risks. Any of the risks discussed below, or elsewhere in this report or in our other SEC filings, could have a material impact on our business, financial condition or results of operations. Additional risks and uncertainties not presently known to us or that we currently believe to be immaterial may also impair our business operations.
18
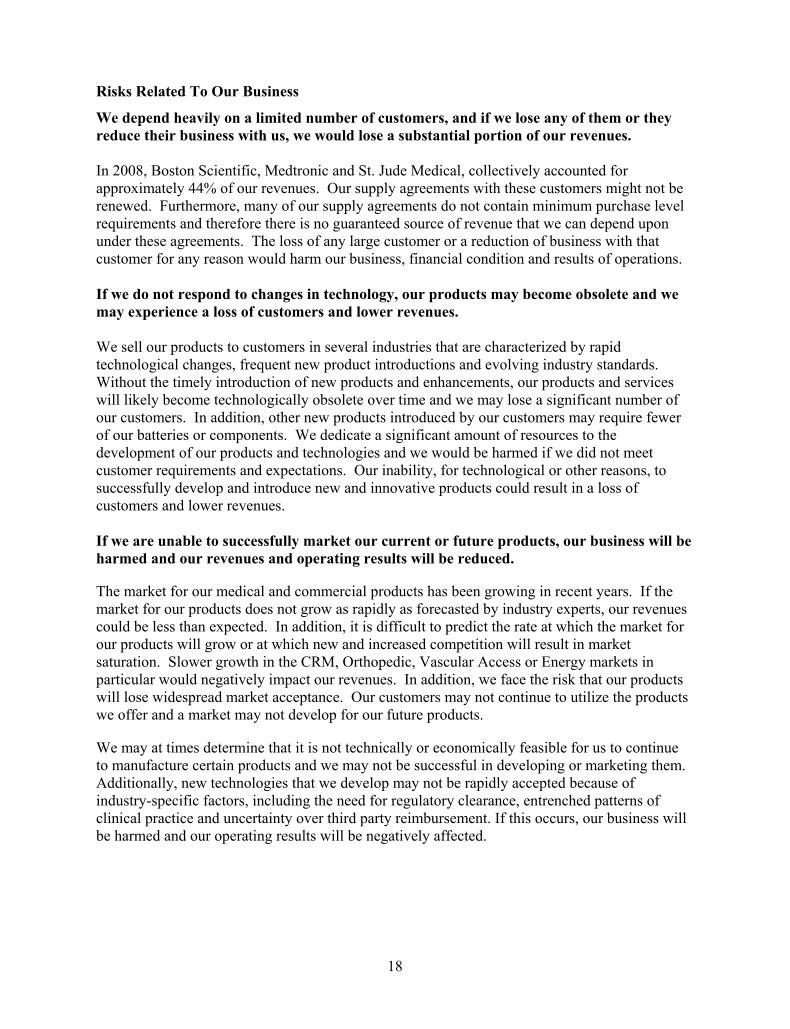
Risks Related To Our Business
We depend heavily on a limited number of customers, and if we lose any of them or they reduce their business with us, we would lose a substantial portion of our revenues. In 2008, Boston Scientific, Medtronic and St. Jude Medical, collectively accounted for approximately 44% of our revenues. Our supply agreements with these customers might not be renewed. Furthermore, many of our supply agreements do not contain minimum purchase level requirements and therefore there is no guaranteed source of revenue that we can depend upon under these agreements. The loss of any large customer or a reduction of business with that customer for any reason would harm our business, financial condition and results of operations. If we do not respond to changes in technology, our products may become obsolete and we may experience a loss of customers and lower revenues. We sell our products to customers in several industries that are characterized by rapid technological changes, frequent new product introductions and evolving industry standards. Without the timely introduction of new products and enhancements, our products and services will likely become technologically obsolete over time and we may lose a significant number of our customers. In addition, other new products introduced by our customers may require fewer of our batteries or components. We dedicate a significant amount of resources to the development of our products and technologies and we would be harmed if we did not meet customer requirements and expectations. Our inability, for technological or other reasons, to successfully develop and introduce new and innovative products could result in a loss of customers and lower revenues. If we are unable to successfully market our current or future products, our business will be harmed and our revenues and operating results will be reduced.
The market for our medical and commercial products has been growing in recent years. If the market for our products does not grow as rapidly as forecasted by industry experts, our revenues could be less than expected. In addition, it is difficult to predict the rate at which the market for our products will grow or at which new and increased competition will result in market saturation. Slower growth in the CRM, Orthopedic, Vascular Access or Energy markets in particular would negatively impact our revenues. In addition, we face the risk that our products will lose widespread market acceptance. Our customers may not continue to utilize the products we offer and a market may not develop for our future products.
We may at times determine that it is not technically or economically feasible for us to continue to manufacture certain products and we may not be successful in developing or marketing them. Additionally, new technologies that we develop may not be rapidly accepted because of industry-specific factors, including the need for regulatory clearance, entrenched patterns of clinical practice and uncertainty over third party reimbursement. If this occurs, our business will be harmed and our operating results will be negatively affected.

19
We are subject to pricing pressures from customers, which could harm operating results.
We have made price reductions to some of our large customers in recent years and we expect customer pressure for price reductions will continue. Price concessions or reductions may cause our operating results to suffer. In addition, any delay or failure by a large customer to make payments due to us would harm our operating results and financial condition.
We rely on third party suppliers for raw materials, key products and subcomponents and if we are unable to obtain these materials, products and subcomponents on a timely basis or on terms acceptable to us, our ability to manufacture products will suffer.
Our business depends on a continuous supply of raw materials. The principal raw materials used in our business include lithium, iodine, tantalum, platinum, ruthenium, gallium trichloride, tantalum pellets, vanadium pentoxide, iridium, and titanium. Raw materials needed for our business are susceptible to fluctuations due to transportation, government regulations, price controls, economic climate or other unforeseen circumstances. Increasing global demand for some of the raw materials we need for our business, including platinum, iridium, gallium trichloride, tantalum and titanium, has caused the prices of these materials to increase significantly. In addition, there are a limited number of worldwide suppliers of several raw materials needed to manufacture our products, including lithium, gallium trichloride, carbon monofluoride, and tantalum. We may not be able to continue to procure raw materials critical to our business or to procure them at acceptable price levels.
We rely on third party manufacturers to supply many of our products and subcomponents. Manufacturing problems may occur with these and other outside sources, as a supplier may fail to develop and supply products and subcomponents to us on a timely basis, or may supply us with products and subcomponents that do not meet our quality, quantity and cost requirements. If any of these problems occur, we may be unable to obtain substitute sources for these products and subcomponents on a timely basis or on terms acceptable to us, which could harm our ability to manufacture our own products and components profitably or on time. In addition, to the extent the processes that our suppliers use to manufacture products and subcomponents are proprietary, we may be unable to obtain comparable subcomponents from alternative suppliers.
We may never realize the full value of our intangible assets, which represent a significant portion of our total assets.
At January 2, 2009, we had $428.6 million of intangible assets, representing 50% of our total assets. These intangible assets consist primarily of goodwill, trademarks, tradenames, customer lists and patented technology arising from our acquisitions. Goodwill and other intangible assets with indefinite lives are not amortized, but are tested annually or upon the occurrence of certain events that indicate that the assets may be impaired. We may not receive the recorded value for our intangible assets if we sell or liquidate our business or assets. In addition, the material concentration of intangible assets increases the risk of a large charge to earnings in the event that the recoverability of these intangible assets is impaired, and in the event of such a charge to earnings, the market price of our common stock could be adversely affected. In addition, intangible assets with definite lives, which represent $90.3 million of our net intangible assets at January 2, 2009, will continue to be amortized. We incurred total amortization expenses relating to these intangible assets of $10.7 million in 2008. These expenses will reduce our future earnings or increase our future losses.

20
Quality problems with our products could harm our reputation for producing high quality products, erode our competitive advantage.
Our products are held to high quality and performance standards. In the event that our products fail to meet these standards, our reputation for producing high quality products could be harmed, which would damage our competitive advantage and could result in lower revenues.
Quality problems with our products could result in warranty claims and additional costs.
We generally allow customers to return defective or damaged products for credit, replacement, or exchange. We generally warrant that our products will meet customer specifications and will be free from defects in materials and workmanship. Additionally, we carry a safety stock of inventory for our customers which may be impacted by warranty claims. We accrue for our exposure to warranty claims based upon recent historical experience and other specific information as it becomes available. However, such reserves may not be adequate to cover future warranty claims and additional warranty costs and/or inventory write-offs may be incurred which could harm our operating results or financial condition.
Regulatory issues resulting from product complaints/recalls or regulatory body audits could harm our ability to produce and supply products or bring new products to market. Our products are designed, manufactured and distributed globally in compliance with all pertinent regulations and standards. However, a product complaint recall or negative regulatory body audit may cause products to be removed from the market. In addition, during the corrective phase, regulatory bodies may not allow new products to be cleared for marketing and sale. If we become subject to product liability claims, our operating results and financial condition could suffer. The manufacturing and sale of our products expose us to potential product liability claims and product recalls, including those that may arise from failure to meet product specifications, misuse or malfunction of, or design flaws in our products, or use of our products with components or systems not manufactured or sold by us. Many of our products are components and function in interaction with our customers’ medical devices. For example, our batteries are produced to meet various electrical performance, longevity and other specifications, but the actual performance of those products is dependent on how they are in fact utilized as part of the customers’ devices over the lifetime of the products. Product performance and device interaction from time to time have been, and may in the future be, different than expected for a number of reasons. Consequently, it is possible that customers may experience problems with their medical devices that could require device recall or other corrective action, where our batteries met the specification at delivery, and for reasons that are not related primarily or at all to any failure by our product to perform in accordance with specifications. It is possible that our customers (or end-users) may in the future assert that our products caused or contributed to device failure where our product was not the primary cause of the device performance issue. Even if these assertions do not lead to product liability or contract claims, they could harm our reputation and our customer relationships.

21
Provisions contained in our agreements with key customers attempting to limit our damages, including provisions to limit damages to liability for gross negligence, may not be enforceable in all instances or may otherwise fail to protect us from liability for damages. Product liability claims or product recalls, regardless of their ultimate outcome, could require us to spend significant time and money in litigation or require us to pay significant damages. The occurrence of product liability claims or product recalls could adversely affect our operating results and financial condition.
We carry liability insurance coverage that is limited in scope and amount. We may not be able to maintain this insurance at a reasonable cost or on reasonable terms, or at all. This insurance may not be adequate to protect us against a product liability claim that arises in the future.
Our operating results may fluctuate, which may make it difficult to forecast our future performance and may result in volatility in our stock price.
Our operating results have fluctuated in the past and are likely to fluctuate significantly from quarter to quarter due to a variety of factors, including but not limited to the following:
• the fixed nature of a substantial percentage of our costs, which results in our operations being particularly sensitive to fluctuations in revenue;
• changes in the relative portion of our revenue represented by our various products and customers, which could result in reductions in our profits if the relative portion of our revenue represented by lower margin products increases;
• timing of orders placed by our principal customers who account for a significant portion of our revenues; and
• increased costs of raw materials or supplies. If we are unable to protect our intellectual property and proprietary rights, our business could be adversely affected.
We rely on a combination of patents, licenses, trade secrets and know-how to establish and protect our proprietary rights to our technologies and products. As of January 2, 2009, we held 372 active U.S. patents and 264 active foreign patents. However, the steps we have taken or will take to protect our proprietary rights may not be adequate to deter misappropriation of our intellectual property. In addition to seeking formal patent protection whenever possible, we attempt to protect our proprietary rights and trade secrets by entering into confidentiality and non-compete agreements with employees, consultants and third parties with which we do business. However, these agreements can be breached and, if they are, there may not be an adequate remedy available to us and we may be unable to prevent the unauthorized disclosure or use of our technical knowledge, practices or procedures. If our trade secrets become known, we may lose our competitive advantages. If third parties infringe or misappropriate our patents or other proprietary rights, our business could be seriously harmed. We may be required to spend significant resources to monitor our intellectual property rights, we may not be able to detect infringement of these rights and may lose our competitive advantages associated with our intellectual property rights before we do so. In addition, competitors may design around our technology or develop competing technologies that do not infringe on our proprietary rights.

22
We may be subject to intellectual property claims, which could be costly and time consuming and could divert our management from our business operations.
In producing our products, third parties may claim that we are infringing on their intellectual property rights, and we may be found to have infringed those intellectual property rights. We may be unaware of intellectual property rights of others that may be used in our technology and products. In addition, third parties may claim that our patents have been improperly granted and may seek to invalidate our existing or future patents. If any claim for invalidation prevailed, the result could be greatly expanded opportunities for third parties to manufacture and sell products that compete with our products and our revenues from any related license agreements would decrease accordingly. We also typically do not receive significant indemnification from parties which license technology to us against third party claims of intellectual property infringement.
Any litigation or other challenges regarding our patents or other intellectual property could be costly and time consuming and could divert our management and key personnel from our business operations. The complexity of the technology involved in producing our products, and the uncertainty of intellectual property litigation increases these risks. Claims of intellectual property infringement might also require us to enter into costly royalty or license agreements. However, we may not be able to obtain royalty or license agreements on terms acceptable to us, or at all. We also may be subject to significant damages or injunctions against development and sale of our products. See “Litigation” of Item 7 Management’s Discussion and Analysis of Financial Condition and Results of Operations.
We are dependent upon our senior management team and key personnel and the loss of any of them could significantly harm us.
Our future performance depends to a significant degree upon the continued contributions of our senior management team and key technical personnel. Our products are highly technical in nature. In general, only highly qualified and trained scientists have the necessary skills to develop our products. The loss or unavailability to us of any member of our senior management team or a key technical employee could significantly harm us. We face intense competition for these professionals from our competitors, customers and companies operating in our industry. To the extent that the services of members of our senior management team and key technical personnel would be unavailable to us for any reason, we would be required to hire other personnel to manage and operate our company and to develop our products and technology. We may not be able to locate or employ such qualified personnel on acceptable terms.
We may not be able to attract, train and retain a sufficient number of qualified employees to maintain and grow our business.
Our success will depend in large part upon our ability to attract, train, retain and motivate highly skilled employees and management. There is currently aggressive competition for employees who have experience in technology and engineering. We compete intensely with other companies to recruit and hire from this limited pool. The industries in which we compete for employees are characterized by high levels of employee attrition. Although we believe we offer competitive salaries and benefits, we may have to increase spending in order to attract, train and retain personnel.
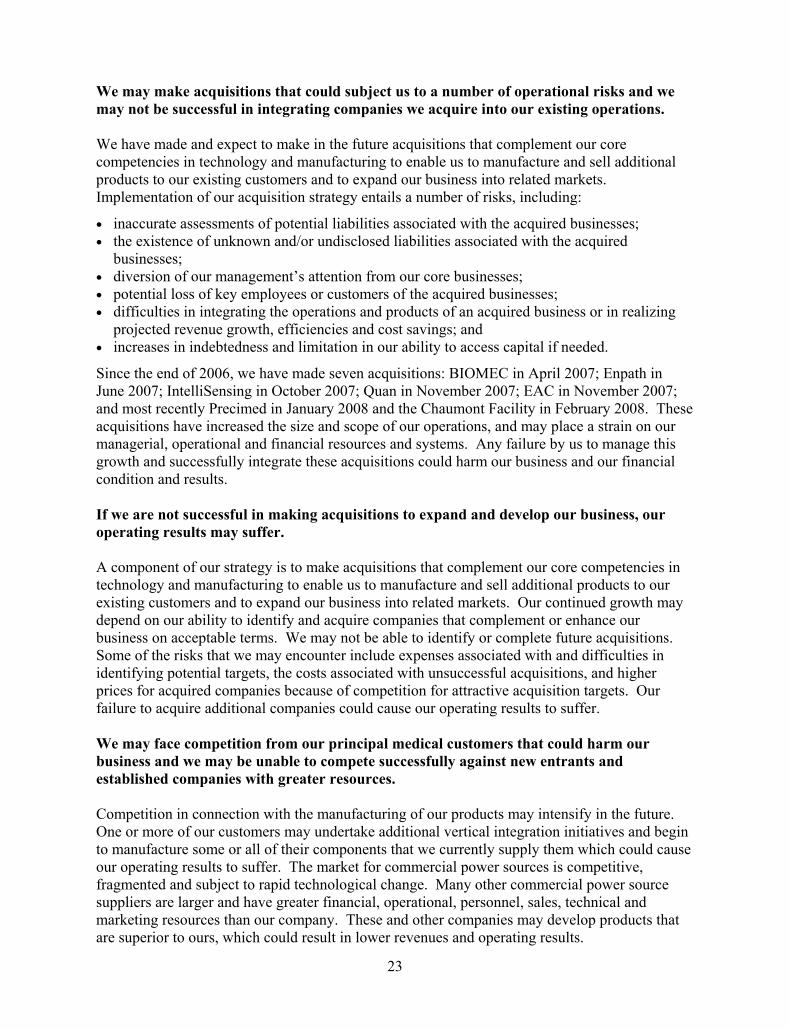
23
We may make acquisitions that could subject us to a number of operational risks and we may not be successful in integrating companies we acquire into our existing operations. We have made and expect to make in the future acquisitions that complement our core competencies in technology and manufacturing to enable us to manufacture and sell additional products to our existing customers and to expand our business into related markets. Implementation of our acquisition strategy entails a number of risks, including:
• inaccurate assessments of potential liabilities associated with the acquired businesses; • the existence of unknown and/or undisclosed liabilities associated with the acquired
businesses; • diversion of our management’s attention from our core businesses; • potential loss of key employees or customers of the acquired businesses; • difficulties in integrating the operations and products of an acquired business or in realizing
projected revenue growth, efficiencies and cost savings; and • increases in indebtedness and limitation in our ability to access capital if needed.
Since the end of 2006, we have made seven acquisitions: BIOMEC in April 2007; Enpath in June 2007; IntelliSensing in October 2007; Quan in November 2007; EAC in November 2007; and most recently Precimed in January 2008 and the Chaumont Facility in February 2008. These acquisitions have increased the size and scope of our operations, and may place a strain on our managerial, operational and financial resources and systems. Any failure by us to manage this growth and successfully integrate these acquisitions could harm our business and our financial condition and results. If we are not successful in making acquisitions to expand and develop our business, our operating results may suffer. A component of our strategy is to make acquisitions that complement our core competencies in technology and manufacturing to enable us to manufacture and sell additional products to our existing customers and to expand our business into related markets. Our continued growth may depend on our ability to identify and acquire companies that complement or enhance our business on acceptable terms. We may not be able to identify or complete future acquisitions. Some of the risks that we may encounter include expenses associated with and difficulties in identifying potential targets, the costs associated with unsuccessful acquisitions, and higher prices for acquired companies because of competition for attractive acquisition targets. Our failure to acquire additional companies could cause our operating results to suffer. We may face competition from our principal medical customers that could harm our business and we may be unable to compete successfully against new entrants and established companies with greater resources. Competition in connection with the manufacturing of our products may intensify in the future. One or more of our customers may undertake additional vertical integration initiatives and begin to manufacture some or all of their components that we currently supply them which could cause our operating results to suffer. The market for commercial power sources is competitive, fragmented and subject to rapid technological change. Many other commercial power source suppliers are larger and have greater financial, operational, personnel, sales, technical and marketing resources than our company. These and other companies may develop products that are superior to ours, which could result in lower revenues and operating results.

24
Accidents at one of our facilities could delay production and adversely affect our operations.
Our business involves complex manufacturing processes and hazardous materials that can be dangerous to our employees. Although we employ safety procedures in the design and operation of our facilities, there is a risk that an accident or death could occur in one of our facilities. Any accident, such as a chemical spill, could result in significant manufacturing delays or claims for damages resulting from injuries, which would harm our operations and financial condition. The potential liability resulting from any such accident or death, to the extent not covered by insurance, could harm our financial condition and/or operating results. Any disruption of operations at any of our facilities could harm our business. We intend to expand into new markets and our proposed expansion plans may not be successful, which could harm our operating results.
We intend to expand into new markets through the development of new product applications based on our existing component technologies. These efforts have required and will continue to require us to make substantial investments, including significant research, development and engineering expenditures and capital expenditures for new, expanded or improved manufacturing facilities. Specific risks in connection with expanding into new markets include the inability to transfer our quality standards into new products, the failure of customers in new markets to accept our products, and competition. We may not be able to successfully manage expansion into new markets and products and these unsuccessful efforts may harm our operating results. Our failure to obtain licenses from third parties for new technologies or the loss of these licenses could impair our ability to design and manufacture new products and reduce our revenues.
We occasionally license technologies from third parties rather than depending exclusively on our own proprietary technology and developments. For example, we license a capacitor patent from another company. Our ability to license new technologies from third parties is and will continue to be critical to our ability to offer new and improved products. We may not be able to continue to identify new technologies developed by others and even if we are able to identify new technologies, we may not be able to negotiate licenses on favorable terms, or at all. Additionally, we could lose rights granted under licenses for reasons beyond our control. Our international operations and sales are subject to a variety of risks and costs that could adversely affect our profitability and operating results. Our sales to countries outside the U.S., which accounted for 51% of net sales for 2008, our Mexico, Switzerland and France locations are subject to certain foreign country risks. Our international operations are, and will continue to be, subject to a number of risks and potential costs, including:
• changes in foreign regulatory requirements; • local product preferences and product requirements; • longer-term receivables than are typical in the U.S.; • difficulties in enforcing agreements through certain foreign legal systems; • less protection of intellectual property in some countries outside of the U.S.; • trade protection measures and import and export licensing requirements; • work force instability; • political and economic instability; and • complex tax and cash management issues.

25
We incur certain expenses related to our foreign operations that are denominated in a foreign currency. Historically, foreign currency fluctuations have not had a material effect on our consolidated financial statements. However, fluctuations in foreign currency exchange rates could have a significant negative impact on our profitability and operating results. The current economic environment and credit market uncertainty could interrupt our access to capital markets, borrowings, or financial transactions to hedge certain risks, which could adversely affect our financial condition. As of January 2, 2009, we had $352.9 million of long-term debt with varying maturities, including our convertible subordinated notes and revolving line of credit. These arrangements have allowed us to make investments in growth opportunities and fund working capital requirements. In addition, we enter into financial transactions to hedge certain risks, including foreign exchange and interest rate risk. Our continued access to capital markets, the stability of our lenders and their willingness to support our needs, and the stability of the parties to our financial transactions that hedge risks are essential for us to meet our current obligations, fund operations, and fund our strategic initiatives. An interruption in our access to external financing or financial transactions to hedge risk could adversely affect our business prospects and financial condition. See further information regarding our liquidity in “Liquidity and Capital Resources” under Item 7, “Management’s Discussion and Analysis of Financial Condition and Results of Operations.” Risks Related To Our Industries
The healthcare industry is subject to various political, economic and regulatory changes that could force us to modify how we develop and price our products. The healthcare industry is highly regulated and is influenced by changing political, economic and regulatory factors. Several of our product lines are subject to international, federal, state and local health and safety, packaging and product content regulations. In addition, IMDs produced by our medical customers are subject to regulation by the U.S. Food and Drug Administration and similar governmental agencies. These regulations govern a wide variety of product activities from design and development to labeling, manufacturing, promotion, sales and distribution. Compliance with these regulations may be time consuming, burdensome and expensive and could negatively affect our customers’ abilities to sell their products, which in turn would adversely affect our ability to sell our products. This may result in higher than anticipated costs or lower than anticipated revenues.
These regulations are also complex, change frequently and have tended to become more stringent over time. Federal and state legislatures have periodically considered programs to reform or amend the U.S. healthcare system at both the federal and state levels. In addition, these regulations may contain proposals to increase governmental involvement in healthcare, lower reimbursement rates or otherwise change the environment in which healthcare industry participants operate. We may be required to incur significant expenses to comply with these regulations or remedy past violations of these regulations. Any failure by our company to comply with applicable government regulations could also result in cessation of portions or all of our operations, impositions of fines and restrictions on our ability to carry on or expand our operations. In addition, because many of our products are sold into regulated industries, we must comply with additional regulations in marketing our products.

26
Our business is subject to environmental regulations that could be costly to comply with. Federal, state and local regulations impose various environmental controls on the manufacturing, transportation, storage, use and disposal of batteries and hazardous chemicals and other materials used in, and hazardous waste produced by, the manufacturing of power sources and components. Conditions relating to our historical operations may require expenditures for clean-up in the future and changes in environmental laws and regulations may impose costly compliance requirements on us or otherwise subject us to future liabilities. Additional or modified regulations relating to the manufacture, transportation, storage, use and disposal of materials used to manufacture our batteries and components or restricting disposal of batteries may be imposed. In addition, we cannot predict the effect that additional or modified regulations may have on us or our customers.
Consolidation in the healthcare industry could result in greater competition and reduce our IMC revenues and harm our business. Many healthcare industry companies are consolidating to create new companies with greater market power. As the healthcare industry consolidates, competition to provide products and services to industry participants will become more intense. These industry participants may try to use their market power to negotiate price concessions or reductions for our products. If we are forced to reduce our prices because of consolidation in the healthcare industry, our revenues would decrease and our operating results would suffer.
Our IMC business is indirectly subject to healthcare industry cost containment measures that could result in reduced sales of our products. Several of our customers rely on third party payors, such as government programs and private health insurance plans, to reimburse some or all of the cost of the procedures in which our products are used. The continuing efforts of government, insurance companies and other payors of healthcare costs to contain or reduce those costs could lead to patients being unable to obtain approval for payment from these third party payors. If that occurred, sales of IMDs may decline significantly, and our customers may reduce or eliminate purchases of our products. The cost containment measures that healthcare payors are instituting, both in the U.S. and internationally, could reduce our revenues and harm our operating results.
Our Electrochem revenues are dependent on conditions in the oil and natural gas industry, which historically have been volatile. Sales of our commercial products depend to a great extent upon the condition of the oil and gas industry. In the past, oil and natural gas prices have been volatile and the oil and gas exploration and production industry has been cyclical, and it is likely that oil and natural gas prices will continue to fluctuate in the future. The current and anticipated prices of oil and natural gas influence the oil and gas exploration and production business and are affected by a variety of political and economic factors beyond our control, including worldwide demand for oil and natural gas, worldwide and domestic supplies of oil and natural gas, the ability of the Organization of Petroleum Exporting Countries (“OPEC”) to set and maintain production levels and pricing, the level of production of non-OPEC countries, the price and availability of alternative fuels, political stability in oil producing regions and the policies of the various governments regarding exploration and development of their oil and natural gas reserves. An adverse change in the oil and gas exploration and production industry or a reduction in the exploration and production expenditures of oil and gas companies could cause our revenues from Electrochem product sales to decline.

27
ITEM 1B. UNRESOLVED STAFF COMMENTS None. ITEM 2. PROPERTIES Our executive offices are located in Clarence, New York. The following table sets forth information about all of our significant facilities as of January 2, 2009:
Location Sq. Ft. Own/Lease Principal Use Alden, NY ........................... 125,000 Own Medical battery and capacitor manufacturing Blaine, MN .......................... 32,400 Own Medical device manufacturing and engineering
(formerly Quan) Canton, MA......................... 32,000 Own Commercial battery manufacturing and research,
development and engineering (“RD&E”) Chaumont, France ............... 59,200 Own Manufacturing of orthopedic and surgical goods
(formerly DePuy) Clarence, NY ....................... 117,800 Own Corporate offices and RD&E Clarence, NY ....................... 20,800 Own Machining and assembly of components Clarence, NY ....................... 18,600 Lease Machining and assembly of components Cleveland, OH..................... 16,900 Lease Office and lab space for strategic design and
innovation (formerly BIOMEC) Columbia City, IN ............... 40,000 Lease Manufacturing of orthopedic and surgical goods
(formerly Precimed) Corgemont, Switzerland ..... 34,400 Lease Manufacturing of orthopedic and surgical goods
(formerly Precimed) Indianapolis, IN................... 82,600 Own Manufacturing of orthopedic and surgical goods
(formerly Precimed) Minneapolis, MN ................ 72,000 Own Enclosure manufacturing and engineering Orvin, Switzerland .............. 34,400 Own Manufacturing of orthopedic and surgical goods
(formerly Precimed) Plymouth, MN..................... 95,700 Lease Introducers, catheters and leads manufacturing and
engineering (formerly Enpath) Raynham, MA ..................... 81,000 Own Commercial battery manufacturing and RD&E Teterboro, NJ ...................... 23,500 Lease Office, warehousing and manufacturing (formerly
EAC) Tijuana, Mexico .................. 144,000 Lease Value-added assembly, and feedthrough, electrode
and EMI filtering manufacturing
We believe these facilities are suitable and adequate for our current business. During 2008, construction of our new 81,000 square foot manufacturing facility in Raynham, MA was completed. Additionally, the expansion of our research and development location in Clarence, NY was completed in mid-2008. This provided an additional 35,000 square feet of space for our corporate headquarters and replaced the 45,000 square feet of leased space previously utilized. Finally, in 2008 we ceased operations at our Orchard Park, NY, Suzhou, China, and Saignelegier, Switzerland facilities.

28
ITEM 3. LEGAL PROCEEDINGS
We are involved in various legal actions arising in the normal course of business. While we do not believe that the ultimate resolution of any such pending activities will have a material adverse effect on our consolidated results of operations, financial position, or cash flows, litigation is subject to inherent uncertainties. If an unfavorable ruling were to occur, there exists the possibility of a material adverse impact in the period in which the ruling occurs. As previously reported, on June 12, 2006, Enpath was named as defendant in a patent infringement action filed by Pressure Products Medical Supplies, Inc. (“Pressure Products”) in which Pressure Products alleged that Enpath’s FlowGuard™ valved introducer, which has been on the market for more than three years, and Enpath’s ViaSeal™ prototype introducer, which has not been sold, infringes claims in Pressure Products patents. After trial, a jury found that Enpath infringed the Pressure Products patents, but not willfully, and awarded damages in the amount of $1.1 million. Enpath has appealed the final judgment to the U.S. Court of Appeals for the Federal Circuit. As a result of a post-trial motion and pending the appeal, Enpath is permitted to continue to sell FlowGuard™ provided that Enpath pays into an escrow fund a royalty of between $1.50 and $2.25 for each sale of a FlowGuard™ valved introducer. The amount accrued as escrow during 2008 was $0.5 million. During 2008, the Company incurred $4.5 million of costs related to this litigation.
During 2002, a former non-medical customer commenced an action alleging that the Company had used proprietary information of the customer to develop certain products. The Company believes that it has meritorious defenses and is vigorously defending the matter. The potential risk of loss is between $0.0 and $1.7 million. ITEM 4. SUBMISSION OF MATTERS TO A VOTE OF SECURITY HOLDERS
No matters were submitted to a vote of security holders during the fourth quarter of 2008.
PART II
ITEM 5. MARKET FOR REGISTRANT’S COMMON EQUITY, RELATED STOCKHOLDER MATTERS AND ISSUER PURCHASES OF EQUITY SECURITIES.
The Company’s common stock trades on the New York Stock Exchange (“NYSE”) under the symbol “GB.” The following table sets forth for the periods indicated the high, low and closing sales prices per share for the common stock as reported by the NYSE:
2007 High Low Close First Quarter 2007 Second Quarter 2007 Third Quarter 2007 Fourth Quarter 2007
$30.05 33.17 34.96 27.50
$25.04 25.31 26.00 18.52
$25.50 32.40 26.59 19.91
2008 First Quarter 2008 Second Quarter 2008 Third Quarter 2008 Fourth Quarter 2008
$23.48 19.79 27.08 27.41
$17.18 15.49 16.86 17.72
$18.79 17.20 25.78 26.72

29
As of March 2, 2009 there were 250 record holders of the Company’s common stock. The Company stock account included in our 401(k) plan is considered one record holder for the purposes of this calculation. There are approximately 1,700 holders of Company stock in the 401(k) including active and former employees. We have not paid cash dividends and currently intend to retain any earnings to further develop and grow our business. To satisfy minimum tax withholding requirements on vested restricted stock awards as allowed under the Company’s 2002 and 2005 stock incentive plans, the Company repurchased 56,755 shares from employees of the Company at an average cost of $24.57 per share in 2008. The price of these repurchases was based upon the closing market price of the Company’s stock on the date of vesting. PERFORMANCE GRAPH
The following graph compares for the five year period ended January 2, 2009, the cumulative total stockholder return for Greatbatch, Inc., the S&P SmallCap 600 Index, and the Hemscott Peer Group Index. The Hemscott Peer Group Index includes approximately 200 comparable companies included in the Hemscott Industry Group 520 Medical Instruments & Supplies and 521 Medical Appliances & Equipment. The graph assumes that $100 was invested on January 2, 2004 and assumes reinvestment of dividends. The stock price performance shown on the following graph is not necessarily indicative of future price performance:
0.00
25.00
50.00
75.00
100.00
125.00
150.00
175.00
1/02/04 12/31/04 12/30/05 12/29/06 12/28/07 1/02/09
GREATBATCH, INC. HEMSCOTT PEER GROUP INDEXS&P SMALLCAP 600 INDEX
Dol
lars

30
ITEM 6. SELECTED FINANCIAL DATA
The following table provides selected financial data of our Company for the periods indicated. You should read this data along with Item 7, “Management’s Discussion and Analysis of Financial Condition and Results of Operations,” and Item 8, “Financial Statements and Supplementary Data” appearing elsewhere in this report. The consolidated statement of operations data and the consolidated balance sheet data for the fiscal years indicated have been derived from our consolidated financial statements and related notes.
Jan. 2, Dec. 28, Dec. 29, Dec. 30, Dec. 31,Years ended 2009 (3) 2007 (3) 2006 2005 2004
Consolidated Statement of Operations Data:
Sales 546,644$ 318,746$ 271,142$ 241,097$ 200,119$
Income before income taxes 27,303 (1) 28,688 (1) 23,534 (1) 15,464 (1)(2) 23,732 (2)
Income per share Basic 0.82$ 0.68$ 0.74$ 0.47$ 0.67$ Diluted 0.81 0.67 0.73 0.46 (2) 0.66 (2)
Consolidated Balance Sheet Data:Working capital 142,219$ 116,816$ 199,051$ 151,958$ 132,360$
Total assets 848,931 663,851 547,827 512,911 476,166
Long-term obligations 404,827 276,772 205,859 200,261 193,948
(in thousands, except per share data)
(1) From 2005 to 2008, we recorded charges in other operating expenses, net related to our ongoing
cost savings and consolidation efforts. Additional information is set forth at Note 11 – “Other Operating Expenses” of the Notes to the Consolidated Financial Statements contained in Item 8 of this report.
(2) Beginning in fiscal year 2006, we adopted Financial Accounting Standards Board, Statement of Financial Accounting Standards No. 123 (revised 2004), Share-Based Payment (“SFAS No. 123(R)”), and related Securities and Exchange Commission rules included in Staff Accounting Bulletin No. 107. Under SFAS No. 123(R) we are now required to record compensation costs related to all stock-based awards. Income before income taxes and diluted earnings per share would have been lower by $3.4 million or $0.10 per share for 2005, respectively, and $3.2 million or $0.10 per share for 2004, respectively. Additional information is set forth at Note 10 – “Stock-Based Compensation” of the Notes to the Consolidated Financial Statements contained in Item 8 of this report.
(3) During 2008, we acquired P Medical Holding, SA (January 2008) and DePuy Orthopaedics Chaumont, France facility (February 2008). During 2007, we acquired BIOMEC, Inc. (April 2007), Enpath Medical, Inc. (June 2007), IntelliSensing, LLC (October 2007), Quan Emerteq, LLC (November 2007), and Engineered Assemblies Corporation (November 2007). These amounts include the results of operations of these companies subsequent to their acquisitions. As a result of these acquisitions, the Company recorded charges in 2008 and 2007 of $8.7 million and $17.8 million, respectively related to inventory step up amortization and in process research and development. Additional information is set forth at Note 2 – “Acquisitions” of the Notes to the Consolidated Financial Statements contained in Item 8 of this report.

31
ITEM 7. MANAGEMENT’S DISCUSSION AND ANALYSIS OF FINANCIAL CONDITION AND RESULTS OF OPERATIONS
YOU SHOULD READ THE FOLLOWING DISCUSSION AND ANALYSIS OF OUR FINANCIAL CONDITION AND RESULTS OF OPERATIONS IN CONJUNCTION WITH OUR FINANCIAL STATEMENTS AND RELATED NOTES INCLUDED ELSEWHERE IN THIS REPORT.
Overview
Our Business • Our business • CEO message • Our acquisitions • Our customers • Financial overview • Product development
Cost Savings and Consolidation Efforts • 2005 & 2006 facility shutdowns and consolidations • 2007 & 2008 facility shutdowns and consolidations
Our Critical Accounting Estimates • Valuation of goodwill, other identifiable intangible assets and IPR&D • Stock-based compensation • Inventories • Tangible long-lived assets • Provision for income taxes
Our Financial Results • Results of operations table • Fiscal 2008 compared with fiscal 2007 • Fiscal 2007 compared with fiscal 2006 • Liquidity and capital resources • Off-balance sheet arrangements • Litigation • Contractual obligations • Inflation • Impact of recently issued accounting standards
Our Business We operate our business in two reportable segments – Implantable Medical Components (“IMC”) and Electrochem Solutions (“Electrochem”). Our IMC business designs and manufactures components and devices for the Cardiac Rhythm Management (“CRM”), Neuromodulation, Vascular Access and Orthopedic markets. Additionally, our IMC business offers value-added assembly and design engineering services for products that incorporate Implantable Medical Device (“IMD”) components.

32
Our IMC customers include leading original equipment manufacturers (“OEM”), in alphabetical order here and throughout this report, such as Biotronik, Boston Scientific, DePuy Orthopaedics, Johnson & Johnson, Medtronic, Smith & Nephew, Sorin Group, St. Jude Medical, Stryker and Zimmer. We entered the Vascular Access and Orthopedic markets through our acquisitions in 2008 and 2007. Electrochem is a world leader in the design, manufacture and distribution of electrochemical cells, battery packs and wireless sensors for demanding applications in markets such as energy, security, portable medical, environmental monitoring and more. Electrochem broadened its product portfolio through its acquisitions of Engineered Assemblies Corporation (“EAC”) and IntelliSensing, LLC in 2007, and can now design and provide its customers rechargeable battery and wireless sensor systems. CEO Message The last two years have represented significant change at Greatbatch. As our diversification strategy continues to progress, we have acquired seven companies, streamlined operations, and have built a diverse offering of products and unique technologies to better serve an expanded customer base. The results of this are made evident by our record sales in 2008. Our 2008 results reflect the continued successful execution of our strategic plan. Despite the turmoil in the broader economy, our diversification strategy and focus on delivering innovative solutions for our customers enabled us to drive improved operating performance. Additionally, to support our growth strategies, we are working diligently on the integration of our family of companies so we can optimize performance and deliver innovative value to our customers and our shareholders. We are extremely satisfied with the progress we have made on the integration of our acquisitions. In addition, we remain committed to ongoing improvements in our operating performance through further leveraging our diversified revenue base, continued facility consolidation, and product development activities which are focused on high value-added products across all of our business segments. We will continue to evaluate opportunities to leverage our cutting edge technology, operational capabilities, and unmatched dedication to driving innovation for our customers. We believe we have set a solid foundation to further strengthen and expand our position in the marketplace and we remain confident in Greatbatch’s future growth opportunities. Our Acquisitions On April 3, 2007, we acquired substantially all of the assets of BIOMEC, Inc. (“BIOMEC”). BIOMEC is a biomedical device company based in Cleveland, OH. The results of BIOMEC’s operations were included in our IMC business from the date of acquisition. The purchase price and other direct costs of BIOMEC totaled $11.4 million, which we paid in cash. Total assets acquired from BIOMEC were $12.0 million, of which $7.4 million were intangible assets, including $2.3 million of in-process research and development (“IPR&D”), which we immediately expensed, and $5.1 million of goodwill. On June 15, 2007, we completed our acquisition of Enpath Medical, Inc. (“Enpath”). Enpath designs, develops, manufactures and markets single use medical device products for the cardiac rhythm management, neuromodulation and interventional radiology markets. The results of Enpath’s operations were included in our IMC business from the date of acquisition. The purchase price and other direct costs of Enpath totaled $98.4 million, which we paid in cash. Total assets acquired from Enpath were $113.8 million, of which $91.3 million were intangible assets, including $13.8 million of IPR&D which we immediately expensed, and $48.9 million of goodwill.

33
On October 26, 2007 we acquired substantially all of the assets of IntelliSensing, LLC (“IntelliSensing”). IntelliSensing designs and manufactures wireless sensor solutions that measure temperature, pressure, flow and other critical data. The results of IntelliSensing’s operations were included in our Electrochem business from the date of acquisition. The purchase price and other direct costs of IntelliSensing totaled $3.9 million, which we paid in cash. Total assets acquired from IntelliSensing were $4.0 million, of which $3.8 million were intangible assets, including $1.9 million of goodwill. On November 16, 2007, we acquired substantially all of the assets of Quan Emerteq, LLC (“Quan”). Quan designs, develops and manufactures single use medical device products for the vascular, CRM and neuromodulation markets. The results of Quan’s operations were included in our IMC business from the date of acquisition. The purchase price and other direct costs of Quan totaled $60.0 million, which we primarily paid in cash. Total assets acquired from Quan were $62.8 million, of which $52.4 million were intangible assets, including $32.2 million of goodwill. On November 16, 2007, we acquired substantially all of the assets of Engineered Assemblies Corporation (“EAC”). EAC is a leading provider of custom battery solutions and electronics integration focused on rechargeable battery systems. The results of EAC’s operations were included in our Electrochem business from the date of acquisition. The purchase price and other direct costs of EAC totaled $15.1 million, which we paid in cash. Total assets acquired from EAC were $16.7 million, of which $7.9 million were intangible assets, including $5.5 million of goodwill. On January 7, 2008, we acquired P Medical Holding SA (“Precimed”) which has administrative offices in Orvin, Switzerland and Exton, PA, manufacturing operations in Switzerland and Indiana and sales offices in Japan, China and the United Kingdom. Precimed is a leading technology-driven supplier to the orthopedic industry. The results of Precimed’s operations were included in our IMC business from the date of acquisition. The purchase price and other direct costs of Precimed totaled $85.0 million, which we paid in cash. Total assets acquired from Precimed were $143.0 million, of which $82.3 million were intangible assets, including $2.2 million of IPR&D which we immediately expensed, and $47.2 million of goodwill. On February 11, 2008, Precimed completed its previously announced acquisition of DePuy Orthopaedics (“DePuy”) Chaumont, France manufacturing facility (the “Chaumont Facility”). The Chaumont Facility produces hip and shoulder implants for DePuy Ireland who distributes them worldwide through various DePuy selling entities. This transaction included a new four year supply agreement with DePuy. The results of DePuy’s operations were included in our IMC business from the date of acquisition. The purchase price and other direct costs of the Chaumont Facility totaled $28.7 million, which was paid in cash. Total assets acquired from the Chaumont Facility were $29.3 million, of which $6.6 million was goodwill. Going forward, we expect the pace of acquisitions to be less than the 2008 & 2007 level. However, we will continue to pursue strategically targeted and opportunistic acquisitions.

34
Our Customers Our products are designed to provide reliable, long lasting solutions that meet the evolving requirements and needs of our customers and the end users of their products. The nature and extent of our selling relationships with each customer are different in terms of breadth of products purchased, purchased product volumes, length of contractual commitment, ordering patterns, inventory management and selling prices. Our IMC customers include leading OEMs, such as Biotronik, Boston Scientific, DePuy, Johnson & Johnson, Medtronic, Smith & Nephew, Sorin Group, St. Jude Medical, Stryker and Zimmer. During 2007 and in the first quarter of 2008, we completed seven acquisitions in order to diversify our customer base and market concentration. As a result, in 2008 Boston Scientific, Medtronic and St. Jude Medical collectively accounted for 44% of our total sales, compared to 67% in 2007 and 2006. Our Electrochem customers are primarily companies involved in energy, security, portable medical, environmental monitoring and more. We have entered into long-term supply agreements with some of those customers. Some of these customers include, General Electric, Halliburton Company, PathFinder Energy Services and Weatherford International. Financial Overview We achieved sales of $546.6 million for 2008, an increase of 71% over the previous year. 2008 benefitted from our acquisitions in 2007 and 2008 which added approximately $208.2 million of incremental revenue as well as organic growth of 7%. This included approximately $10 million of revenue due to the additional week of sales in 2008 resulting from our fiscal year-end falling in 2009 (closest Friday to December 31st). During 2008, we were extremely focused on the integration of our seven acquisitions from 2007 and 2008. This included the initiation and implementation of numerous cost savings and consolidation initiatives, as well as leveraging the diversified revenue base that we acquired to drive improved operating performance. Our diluted earnings per share for 2008 totaled $0.81 compared to $0.67 for 2007. 2008 results were reduced by $0.59 per share of net charges and gains such as IPR&D charges, non-recurring acquisition related charges (inventory step-up amortization) and charges related to our cost savings and consolidation initiatives partially offset by a debt extinguishment gain. 2007 results were reduced by $0.60 per share of similar charges, net of gains. We completed five acquisitions in 2007 and two in the first two months of 2008. These acquisitions were enabled by our strong cash position and the financing we put in place during the first half of 2007. As of January 2, 2009, we had $22.1 million in cash and cash equivalents and $352.9 million of long-term debt. Payment on $30.5 million of this debt is due in June 2010 with the remaining debt due in 2012 and 2013. For 2008, we generated $57.1 million of cash flow from operations compared to $43.0 million in 2007, an increase of 33%.

35
Product Development Currently, we are developing a series of new products for customer applications in the CRM, neuromodulation, vascular access, orthopedics and commercial markets. Some of the key development initiatives include:
1. Continue the evolution of our Q series high rate ICD batteries; 2. Continue development of MRI compatible product lines; 3. Integrate Biomimetic coating technology with vascular access devices; 4. Complete design of next generation steerable catheters; 5. Advance minimally invasive surgical techniques for orthopedics industry; 6. Develop disposable instrumentation; 7. Provide wireless sensing solutions to commercial customers; and 8. Develop a charging platform for commercial secondary offering.
In May 2008, we announced the execution of a letter of intent in which the Sorin Group will leverage our MRI technology in their future CRM devices. At the same time we continue to explore and develop similar relationships with other customers in both the CRM and neuromodulation space. MRI compatible components are just one example of our strategy to continue to deliver innovative solutions for our customers that improve the functionality, safety, and efficiency of their products. Approximately $2.3 million of the BIOMEC purchase price was allocated to the estimated fair value of acquired IPR&D projects that had not yet reached technological feasibility and had no alternative future use as of the acquisition date. The value assigned to IPR&D relates to projects that incorporate BIOMEC’s novel-polymer coating (biomimetic) technology that mimics the surface of endothelial cells of blood vessels. An agreement was reached in 2008 with an OEM partner to provide coating material and services for their catheter products. Testing was conducted to support this application, and a 510(k) was submitted to the Food and Drug Administration (“FDA”) in December requesting clearance to market this product. We expect approval of this 510(k) in early 2009, with product sales to commence following this clearance. There were no significant changes from our original estimates with regard to these projects during 2008. Approximately $13.8 million of the Enpath purchase price was allocated to the estimated fair value of acquired IPR&D projects that had not yet reached technological feasibility and had no alternative future use. These projects primarily represent the next generation of introducer and catheter products already being sold by Enpath which incorporate new enhancements and customer modifications. One introducer project was launched near the end of 2008. We expect to commercially launch the other introducer products under development in 2009 which will replace existing products. These introducer projects acquired have been delayed due to timing of customer adoption and transition and technical difficulties of some of the projects. Additionally, future sales from our ViaSealTM introducer project have been enjoined due to litigation (See “Litigation”). The catheter IPR&D project, to which a portion of the Enpath purchase price was allocated, has been put on hold indefinitely in order to allocate resources to other projects. These delays in introducer and catheter projects are not expected to have a material impact on our results of operations.

36
Approximately $2.2 million of the Precimed purchase price was allocated to the preliminary estimated fair value of acquired IPR&D projects that had not yet reached technological feasibility and had no alternative future use. The value assigned to IPR&D related to Reamer, Instrument Kit, Locking Plate and Cutting Guide projects. These projects primarily represent the next generation of products already being sold by Precimed which incorporate new enhancements and customer modifications. We commercially launched a portion of these products in 2008 and expect to launch others in 2009. Several of the other orthopedic projects acquired have been delayed and two have been cancelled due to the timing of customer adoption, technical difficulties, inability to meet margin goals and feasibility assessments. These changes are not expected to have a material impact on our results of operations as these projects were assumed to have lower margins. Cost Savings and Consolidation Efforts
From 2005 to 2008, we recorded charges in other operating expenses related to our ongoing cost savings and consolidation efforts. Additional information is set forth in Note 11 – “Other Operating Expenses” of the Notes to the Consolidated Financial Statements contained in Item 8 of this report.
2005 & 2006 facility shutdowns and consolidations - Beginning in the first quarter of 2005 and ending in the second quarter of 2006 we consolidated our medical capacitor manufacturing operations in Cheektowaga, NY, and our implantable medical battery manufacturing operations in Clarence, NY, into our advanced power source manufacturing facility in Alden, NY (“Alden Facility”). We also consolidated our capacitor research, development and engineering operations from our Cheektowaga, NY facility into our technology center in Clarence, NY. In the first quarter of 2005, we announced our intent to close our Carson City, NV facility and consolidate the work performed at that facility into our Tijuana, Mexico facility. This consolidation project was completed in the third quarter of 2007. In the fourth quarter of 2005, we announced our intent to close our Columbia, MD facility (“Columbia Facility”) and Fremont, CA Advanced Research Laboratory (“ARL”). We also announced that the manufacturing operations at our Columbia Facility will be moved into our Tijuana Facility and that the research, development and engineering and product development functions at our Columbia Facility and at ARL will relocate to our technology center in Clarence, NY. The ARL portion of this consolidation project was completed in the fourth quarter of 2006. The Columbia Facility portion of this consolidation project was completed in the third quarter of 2008. During the fourth quarter of 2006, we completed a plan for consolidating our corporate and business unit organization structure. A significant portion of the annual savings from this initiative was reinvested into research & development activities and business growth opportunities. The total cost of these projects was $24.7 million, which was incurred from 2005 to 2008, and included the following:
• Severance and retention - $7.4 million; • Production inefficiencies, moving and revalidation - $4.6 million; • Accelerated depreciation and asset write-offs - $1.1 million; • Personnel - $8.4 million; and • Other - $3.2 million.

37
All categories of costs were considered to be cash expenditures, except accelerated depreciation and asset write-offs. Approximately $23.6 million of these expenses for the facility shutdowns and consolidations were included in the IMC business segment, $0.1 million in the Electrochem segment (2006) and $1.0 million was recorded in unallocated operating expenses (2006). 2007 & 2008 facility shutdowns and consolidations - In the first quarter of 2007, we announced that we will close our current Electrochem manufacturing facility in Canton, MA and construct a new 81,000 square foot replacement facility in Raynham, MA. This initiative is not cost savings driven but capacity driven for the Electrochem group. In the second quarter of 2007, we announced that we will consolidate our corporate offices in Clarence, NY into our existing research and development center also in Clarence, NY after an expansion of that facility was complete. This expansion and relocation was completed in the third quarter of 2008. During the second and third quarters of 2008, we reorganized and consolidated various general & administrative and research & development functions throughout the organization in order to optimize those resources with the businesses we acquired in 2007 and 2008. In the second half of 2008, we ceased manufacturing at our facility in Suzhou, China, which was acquired from EAC, and closed our leased manufacturing facility in Orchard Park, NY, which was acquired from IntelliSensing. Additionally, we consolidated our Saignelegier, Switzerland manufacturing facility, which was acquired from Precimed. The operations of these facilities were relocated to existing facilities which have excess capacity. The facility in China is expected to be used as a procurement office in 2009. In the fourth quarter of 2008, we approved a plan for the closure of our Teterboro, New Jersey (Electrochem manufacturing), Blaine, Minnesota (Vascular Access manufacturing) and Exton, Pennsylvania (Orthopedics corporate office) facilities. The operations at these facilities will be moved to other existing facilities with excess capacity. The above initiatives are expected to be completed over the next twelve months. The total cost for these facility shutdowns and consolidations is expected to be approximately $13.5 million to $15.0 million of which $8.9 million has been incurred through January 2, 2009.
The major categories of costs include the following: • Severance and retention - $4.3 million to $4.6 million; • Production inefficiencies, moving and revalidation - $2.4 million to $2.7 million; • Accelerated depreciation and asset write-offs - $4.1 million to $4.4 million; • Personnel - $1.2 million to $1.5 million; and • Other - $1.5 million to $1.8 million.

38
As a result of our consolidation initiatives, during 2008 two facilities were determined to be impaired. Accordingly, these facilities, which had a carrying amount of $5.1 million, were written down to their fair value of $3.4 million. This resulted in an impairment charge of $1.7 million, which was included in other operating expense. All categories of costs are considered to be cash expenditures, except accelerated depreciation and asset write-offs. For 2008, costs of $5.0 million are included in the IMC business segment. For 2008 and 2007, costs of $3.3 million and $0.5 million, respectively, are included in the Electrochem business segment. The annual anticipated cost savings from these initiatives is estimated to be approximately $5 million to $6 million, and will not be fully realized until 2010. Our Critical Accounting Estimates The preparation of our consolidated financial statements in accordance with generally accepted accounting principles in the United States of America (“GAAP”) requires us to make estimates and assumptions that affect reported amounts and related disclosures. The methods, estimates and judgments we use in applying our accounting policies have a significant impact on the results we report in our financial statements. Management considers an accounting estimate to be critical if:
• It requires assumptions to be made that were uncertain at the time the estimate was made; and • Changes in the estimate or different estimates that could have been selected could have a
material impact on our consolidated results of operations, financial position or cash flows. Our most critical accounting estimates are described below. We also have other policies that we consider key accounting policies, such as our policies for revenue recognition; however, these policies do not meet the definition of critical accounting estimates, because they do not generally require us to make estimates or judgments that are difficult or subjective.

39
Balance Sheet Caption / Nature of Critical
Estimate Item Assumptions / Approach Used Effect of Variations of Key Assumptions Used
Valuation of goodwill, other identifiable intangible assets and IPR&D
When we acquire a company, we allocate the purchase price to the assets we acquire and liabilities we assume based on their fair value at the date of acquisition.
We then allocate the purchase price in excess of net tangible assets acquired to identifiable intangible assets, including IPR&D. Other indefinite lived intangible assets, such as trademarks and tradenames, are considered non-amortizing intangible assets as they are expected to generate cash flows indefinitely.
Goodwill is recorded when the purchase price paid for an acquisition exceeds the estimated fair value of the net identified tangible and intangible assets acquired.
Indefinite lived intangibles and goodwill are required to be assessed for impairment on an annual basis or more frequent if certain indicators are present.
Definite-lived intangible assets are amortized over their estimated useful lives.
We base the fair value of identifiable tangible and intangible assets (including IPR&D) on detailed valuations that use information and assumptions provided by management. The fair values of the assets acquired and liabilities assumed are determined using one of three valuation approaches: market, income and cost. The selection of a particular method for a given asset depends on the reliability of available data and the nature of the asset, among other considerations. The market approach values the subject asset based on available market pricing for comparable assets. The income approach values the subject asset based on the present value of risk adjusted cash flows projected to be generated by the asset. The projected cash flows for each asset considers multiple factors, including current revenue from existing customers, attrition trends, reasonable contract renewal assumptions from the perspective of a marketplace participant, and expected profit margins giving consideration to historical and expected margins. The cost approach values the subject asset by determining the current cost of replacing that asset with another of equivalent economic utility. The cost to replace a given asset reflects the estimated reproduction or replacement cost for the asset, less an allowance for loss in value due to depreciation or obsolescence, with specific consideration given to economic obsolescence if indicated. We perform an annual review on the last day of each fiscal year, or more frequently if indicators of potential impairment exist, to determine if the recorded goodwill and other indefinite lived intangible assets are impaired. We assess goodwill for impairment by comparing the fair value of our reporting units to their carrying value to determine if there is potential impairment. If the fair value of a reporting unit is less than its carrying value, an impairment loss is recorded to the extent that the implied fair value of the goodwill within the reporting unit is less than its carrying value. Fair values for reporting units are determined based primarily on the income approach, however where appropriate, the market approach or appraised values are also used. Definite-lived intangible assets such as purchased technology, patents and customer lists are reviewed at least quarterly to determine if any adverse conditions exist or a change in circumstances has occurred that would indicate impairment or a change in their remaining useful life. Indefinite lived intangible assets such as trademarks and tradenames are evaluated for impairment by using the income approach.
The use of alternative valuation assumptions, including estimated cash flows and discount rates, and alternative estimated useful life assumptions could result in different purchase price allocations. In arriving at the value of the IPR&D, we additionally consider among other factors: the in-process projects stage of completion; commercial feasibility of the project; the complexity of the work completed as of the acquisition date; the projected costs to complete; the expected introduction date and the estimated useful life of the technology. Significant changes in these estimates and assumptions could impact the value of the assets and liabilities recorded which would change the amount and timing of future intangible asset amortization expense.
We make certain estimates and assumptions that affect the determination of the expected future cash flows from our reporting units for our goodwill impairment testing. These include sales growth, cost of capital, and projections of future cash flows. Significant changes in these estimates and assumptions could create future impairment losses to our goodwill.
For indefinite lived assets such as trademarks and tradenames, we make certain estimates of revenue streams, royalty rates and other future benefits. Significant changes in these estimates could create future impairments of these indefinite lived intangible assets.
Estimation of the useful lives of definite-lived intangible assets requires significant management judgment. Events could occur that would materially affect our estimates of the useful lives. Significant changes in these estimates and assumptions could change the amount of future amortization expense or could create future impairments of these definite-lived intangible assets.
A 1% change in the amortization of our intangible assets would increase/decrease current year net income by approximately $0.07 million, or approximately $0.003 per diluted share. As of January 2, 2009 we have $428.6 million of intangible assets recorded on our balance sheet representing 50% of total assets. This includes $90.3 million of amortizing intangible assets, $36.1 million of indefinite lived intangible assets and $302.2 million of goodwill.

40
Balance Sheet Caption / Nature of Critical
Estimate Item Assumptions / Approach Used Effect of Variations of Key Assumptions Used
Stock-based compensation
We record compensation costs related to our stock-based awards in accordance with Financial Accounting Standards Board (“FASB”) Statement of Financial Accounting Standards (“SFAS”) No. 123 (revised 2004), Share-Based Payment (“SFAS No. 123(R)”), and related Securities and Exchange Commission rules included in Staff Accounting Bulletin No. 107. Under the fair value recognition provisions of SFAS No. 123(R), we measure stock-based compensation cost at the grant date based on the fair value of the award. Compensation cost for service-based awards is recognized ratably over the applicable vesting period. Compensation cost for performance-based awards is reassessed each period and recognized based upon the probability that the performance targets will be achieved. The amount of stock-based compensation expense recognized during a period is based on the portion of the awards that are ultimately expected to vest. The total expense recognized over the vesting period will only be for those awards that ultimately vest.
We utilize the Black-Scholes Options Pricing Model to determine the fair value of stock options under SFAS No. 123(R). We are required to make certain assumptions with respect to selected Black Scholes model inputs, including expected volatility, expected life, expected dividend yield and the risk-free interest rate. Expected volatility is based on the historical volatility of our stock over the most recent period commensurate with the estimated expected life of the stock options. The expected life of stock options granted, which represents the period of time that the stock options are expected to be outstanding, is based, primarily, on historical data. The expected dividend yield is based on our history and expectation of dividend payouts. The risk-free interest rate is based on the U.S. Treasury yield curve in effect at the time of grant for a period commensurate with the estimated expected life. For restricted stock and restricted stock unit awards, the fair market value is determined based upon the closing value of our stock price on the grant date. Compensation cost for performance-based stock options and restricted stock units is reassessed each period and recognized based upon the probability that the performance targets will be achieved. That assessment is based upon our actual and expected future performance as well as that of the individuals who have been granted performance-based awards. Stock-based compensation expense is only recorded for those awards that are expected to vest. Forfeiture estimates for determining appropriate stock-based compensation expense are estimated at the time of grant based on historical experience and demographic characteristics. Revisions are made to those estimates in subsequent periods if actual forfeitures differ from estimated forfeitures.
Option pricing models were developed for use in estimating the value of traded options that have no vesting restrictions and are fully transferable. Because our share-based payments have characteristics significantly different from those of freely traded options, and because changes in the subjective input assumptions can materially affect our estimates of fair values, existing valuation models may not provide reliable measures of the fair values of our share-based compensation. Consequently, there is a risk that our estimates of the fair values of our share-based compensation awards may bear little resemblance to the actual values realized upon the exercise, expiration or forfeiture of those share-based payments in the future. Stock options may expire worthless or otherwise result in zero intrinsic value as compared to the fair values originally estimated on the grant date and reported in our consolidated financial statements. Alternatively, value may be realized from these instruments that is significantly in excess of the fair values originally estimated on the grant date and reported in our consolidated financial statements. There are significant differences among valuation models. This may result in a lack of comparability with other companies that use different models, methods and assumptions.
There is a high degree of subjectivity involved in selecting assumptions to be utilized to determine fair value and forfeiture assumptions. If factors change and result in different assumptions in the application of SFAS No. 123(R) in future periods, the expense that we record for future grants may differ significantly from what we have recorded in the current period. Additionally, changes in performance of the Company or individuals who have been granted performance-based awards that affect the likelihood that performance based targets are achieved could materially impact the amount of stock-based compensation expense recognized.
A 1% change in our stock based compensation expense would increase/decrease current year net income by approximately $0.04 million, or approximately $0.002 per diluted share.

41
Balance Sheet Caption / Nature of Critical
Estimate Item Assumptions / Approach Used Effect of Variations of Key Assumptions Used
Inventories
Inventories are stated at the lower of cost, determined using the first-in, first-out method, or market.
Inventory standard costing requires complex calculations that include assumptions for overhead absorption, scrap, sample calculations, manufacturing yield estimates and the determination of which costs are capitalizable. The valuation of inventory requires us to estimate obsolete or excess inventory as well as inventory that is not of saleable quality.
Variations in methods or assumptions could have a material impact on our results. If our demand forecast for specific products is greater than actual demand and we fail to reduce manufacturing output accordingly, we could be required to record additional inventory reserves, which would have a negative impact on our net income.
A 1% write-down of our inventory would decrease current year net income by approximately $0.7 million, or approximately $0.03 per diluted share. As of January 2, 2009 we have $112.3 million of inventory recorded on our balance sheet representing 13% of total assets.
Tangible long-lived assets
Property, plant and equipment and other tangible long-lived assets are carried at cost. This cost is charged to depreciation or amortization expense over the estimated life of the operating assets primarily using straight-line rates. Long-lived assets are subject to impairment assessment.
We assess the impairment of tangible long-lived assets when events or changes in circumstances indicate that the carrying value of the assets may not be recoverable. Factors that we consider in deciding when to perform an impairment review include significant under-performance of a business or product line in relation to expectations, significant negative industry or economic trends, and significant changes or planned changes in our use of the assets. Recoverability potential is measured by comparing the carrying amount of the asset group to the related total future undiscounted cash flows. The projected cash flows for each asset group considers multiple factors, including current revenue from existing customers, proceeds from the sale of the asset group, reasonable contract renewal assumptions from the perspective of a marketplace participant, and expected profit margins giving consideration to historical and expected margins. If an asset group’s carrying value is not recoverable through related cash flows, the asset group is considered to be impaired. Impairment is measured by comparing the asset group’s carrying amount to its fair value. When it is determined that useful lives of assets are shorter than originally estimated, and there are sufficient cash flows to support the carrying value of the asset group, we accelerate the rate of depreciation in order to fully depreciate the assets over their new shorter useful lives.
Estimation of the useful lives of tangible assets that are long-lived requires significant management judgment. Events could occur, including changes in cash flow that would materially affect our estimates and assumptions related to depreciation. Unforeseen changes in operations or technology could substantially alter the assumptions regarding the ability to realize the return of our investment in long-lived assets. Also, as we make manufacturing process conversions and other facility consolidation decisions, we must make subjective judgments regarding the remaining useful lives of our assets, primarily manufacturing equipment and buildings. Significant changes in these estimates and assumptions could change the amount of future depreciation expense or could create future impairments of these long-lived assets.
A 1% write-down in our tangible long-lived assets would decrease current year net income by approximately $1.2 million, or approximately $0.05 per diluted share. As of January 2, 2009 we have $182.8 million of tangible long-lived assets recorded on our balance sheet representing 22% of total assets.

42
Balance Sheet Caption / Nature of Critical
Estimate Item Assumptions / Approach Used Effect of Variations of Key Assumptions Used
Provision for income taxes
In accordance with the liability method of accounting for income taxes specified in SFAS No. 109, Accounting for Income Taxes, the provision for income taxes is the sum of income taxes both currently payable and deferred. The changes in deferred tax assets and liabilities are determined based upon the changes in differences between the bases of assets and liabilities for financial reporting purposes and the tax bases of assets and liabilities as measured by the enacted tax rates that management estimates will be in effect when the differences reverse.
Beginning in 2007, we adopted FASB Interpretation No. 48, Accounting for Uncertainty in Income Taxes—an interpretation of FASB Statement No. 109(“FIN No. 48”), to assess and record income tax uncertainties. FIN No. 48 prescribes a recognition threshold and measurement attribute for financial statement recognition and measurement of a tax position taken or expected to be taken in a tax return and also provides guidance on various related matters such as derecognition, interest and penalties, and disclosure.
In relation to recording the provision for income taxes, management must estimate the future tax rates applicable to the reversal of temporary differences, make certain assumptions regarding whether book/tax differences are permanent or temporary and if temporary, the related timing of expected reversal. Also, estimates are made as to whether taxable operating income in future periods will be sufficient to fully recognize any gross deferred tax assets. If recovery is not likely, we must increase our provision for taxes by recording a valuation allowance against the deferred tax assets that we estimate will not ultimately be recoverable. Alternatively, we may make estimates about the potential usage of deferred tax assets that decrease our valuation allowances.
The calculation of our tax liabilities involves dealing with uncertainties in the application of complex tax regulations. Significant judgment is required in evaluating our tax positions and determining our provision for income taxes. During the ordinary course of business, there are many transactions and calculations for which the ultimate tax determination is uncertain. We establish reserves for uncertain tax positions when we believe that certain tax positions do not meet the more likely than not threshold. We adjust these reserves in light of changing facts and circumstances, such as the outcome of a tax audit or the lapse of the statute of limitations. The provision for income taxes includes the impact of reserve provisions and changes to the reserves that are considered appropriate. We follow FIN No. 48 for accounting for our uncertain tax positions.
Changes could occur that would materially affect our estimates and assumptions regarding deferred taxes. Changes in current tax laws and tax rates could affect the valuation of deferred tax assets and liabilities, thereby changing the income tax provision. Also, significant declines in taxable income could materially impact the realizable value of deferred tax assets. At January 2, 2009, we had $23.1 million of deferred tax assets on our balance sheet and a valuation allowance of $4.5 million has been established for certain deferred tax assets as it is more likely than not that they will not be realized .
A 1% increase in the effective tax rate would increase the current year provision by $0.3 million, reducing diluted earnings per share by $0.01 based on shares outstanding at January 2, 2009.

43
Our Financial Results The commentary that follows should be read in conjunction with our consolidated financial statements and related notes. We utilize a fifty-two, fifty-three week fiscal year ending on the Friday nearest December 31st. Fiscal years 2008, 2007, and 2006 ended on January 2, 2009, December 28, and December 29, respectively. Fiscal year 2008 contained fifty-three weeks while fiscal years 2007 and 2006 contained fifty-two weeks.
Results of Operations Table
Dollars in thousands, except per share dataJan. 2, 2009
Dec. 28, 2007
Dec. 29, 2006 $ Change % Change $ Change % Change
IMC CRM/Neuromodulation $ 278,279 $ 251,426 $ 227,407 $ 26,853 11% $ 24,019 11% Vascular Access 47,415 18,396 - 29,019 158% 18,396 NA Orthopedics 142,446 - - 142,446 NA - NATotal IMC 468,140 269,822 227,407 198,318 73% 42,415 19%Electrochem 78,504 48,924 43,735 29,580 60% 5,189 12%Total sales 546,644 318,746 271,142 227,898 71% 47,604 18%Cost of sales - excluding amortization of intangible assets 384,014 198,184 164,885 185,830 94% 33,299 20%Cost of sales - amortization of intangible assets 6,841 4,537 3,813 2,304 51% 724 19%Total cost of sales 390,855 202,721 168,698 188,134 93% 34,023 20%Cost of sales as a % of sales 71.5% 63.6% 62.2% 7.9% 1.4%
Selling, general, and administrative expenses 72,633 44,674 38,785 27,959 63% 5,889 15%SG&A as a % of sales 13.3% 14.0% 14.3% -0.7% -0.3%
Research, development and engineering costs, net 31,444 29,914 24,225 1,530 5% 5,689 23%RD&E as a % of sales 5.8% 9.4% 8.9% -3.6% 0.5%
Other operating expense 16,818 21,417 17,058 (4,599) -21% 4,359 26%Operating income 34,894 20,020 22,376 14,874 74% (2,356) -11%Operating margin 6.4% 6.3% 8.3% 0.1% -2.0%
Interest expense 13,168 7,303 4,605 5,865 80% 2,698 59%Interest income (711) (7,050) (5,775) 6,339 -90% (1,275) 22%Gain on sale of investment security - (4,001) - 4,001 NA (4,001) NAGain on extinguishment of debt (3,242) (4,473) - 1,231 -28% (4,473) NAOther (income) expense, net (1,624) (447) 12 (1,177) 263% (459) NAProvision for income taxes 8,744 13,638 7,408 (4,894) -36% 6,230 84%Effective tax rate 32.0% 47.5% 31.5% -15.5% 16.0%Net income $ 18,559 $ 15,050 $ 16,126 $ 3,509 23% $ (1,076) -7%Net margin 3.4% 4.7% 5.9% -1.3% -1.2%
Diluted earnings per share $ 0.81 $ 0.67 $ 0.73 $ 0.14 21% $ (0.06) -8%
2008-2007 2007-2006Year ended

44
Fiscal 2008 Compared with Fiscal 2007
Sales Sales were a record $546.6 million in 2008, an increase of 71% compared to 2007. This growth was achieved through acquisitions and organic growth of 7%. Our acquisitions, which expanded our product lines and diversified our customer base, contributed $208.2 million incremental revenue in 2008. Revenue for 2008 also included approximately $10 million of additional sales as a result of 2008 being a 53 week fiscal year versus 2007 which had 52 weeks. IMC - The nature and extent of our selling relationship with our customers is different in terms of products purchased, selling prices, product volumes, ordering patterns and inventory management. We have pricing arrangements with our customers that at times do not specify minimum order quantities. Our visibility to customer ordering patterns is over a relatively short period of time. Our customers may have inventory management programs and alternate supply arrangements of which we are unaware. Additionally, the relative market share among the OEM device manufacturers changes periodically. Consequently, these and other factors can significantly impact our sales in any given period. Our 2008 revenue from our IMC business increased $198.3 million or 73% over 2007. Our acquisitions in 2007 and 2008 contributed $183.2 million to this increase. Included in our IMC segment is our CRM/Neuromodulation product line which saw year over year growth of $26.9 million, $11.8 million of which was attributable to our acquisitions in 2007. 2008 revenue from our IMC segment also includes sales from our Vascular Access and Orthopedic product lines which increased $29.0 million and $142.4 million, respectively over the prior year and were acquired near the end of 2007 and beginning of 2008. The additional week of sales added approximately $9 million to our IMC revenue in 2008. Additionally, Vascular Access revenue benefited from the timing of customer inventory stocking for introducers in the fourth quarter of 2008, which may impact first quarter of 2009 revenues. Orthopedic sales during the first three quarters of 2008 benefited from the release of excess backlog that was on hand at the time of the Precimed acquisitions, which has since been fulfilled. The non-acquisition related increase in CRM/Neuromodulation revenue in 2008 was primarily due to higher feedthrough, and assembly revenue partially offset by lower ICD battery, coated components and ICD capacitor sales. The increase in feedthrough revenue can be attributed to market growth as well as the timing of customer product launches. The increase in assembly sales reflected an increase in price during 2008 due to contractual agreements related to material price increases. The decrease in ICD battery revenue is primarily due to customer vertical integration partially offset by increased adoption of our Q Series high rate ICD batteries. The decline in coated component sales is primarily the result of a customer changing product mix near the end of 2007 due to marketplace field actions. Revenues in 2007 included an increased level of capacitor sales due to a customer supply issue in the first half of 2007. Electrochem - Similar to IMC customers, we have pricing arrangements with our customers that many times do not specify minimum quantities. Our visibility to customer ordering patterns is over a relatively short period of time as most customers utilize short term purchase orders as opposed to long-term contracts.
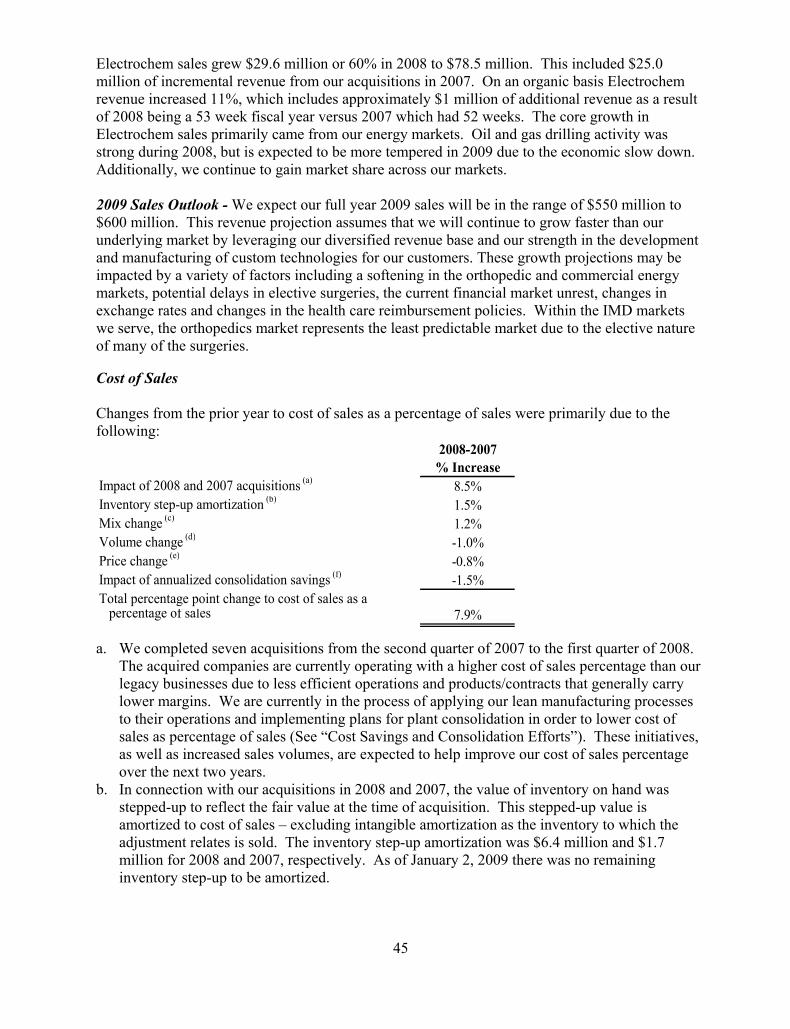
45
Electrochem sales grew $29.6 million or 60% in 2008 to $78.5 million. This included $25.0 million of incremental revenue from our acquisitions in 2007. On an organic basis Electrochem revenue increased 11%, which includes approximately $1 million of additional revenue as a result of 2008 being a 53 week fiscal year versus 2007 which had 52 weeks. The core growth in Electrochem sales primarily came from our energy markets. Oil and gas drilling activity was strong during 2008, but is expected to be more tempered in 2009 due to the economic slow down. Additionally, we continue to gain market share across our markets. 2009 Sales Outlook - We expect our full year 2009 sales will be in the range of $550 million to $600 million. This revenue projection assumes that we will continue to grow faster than our underlying market by leveraging our diversified revenue base and our strength in the development and manufacturing of custom technologies for our customers. These growth projections may be impacted by a variety of factors including a softening in the orthopedic and commercial energy markets, potential delays in elective surgeries, the current financial market unrest, changes in exchange rates and changes in the health care reimbursement policies. Within the IMD markets we serve, the orthopedics market represents the least predictable market due to the elective nature of many of the surgeries. Cost of Sales Changes from the prior year to cost of sales as a percentage of sales were primarily due to the following:
2008-2007% Increase
Impact of 2008 and 2007 acquisitions (a) 8.5%Inventory step-up amortization (b) 1.5%Mix change (c) 1.2%Volume change (d) -1.0%Price change (e) -0.8%Impact of annualized consolidation savings (f) -1.5%Total percentage point change to cost of sales as a
percentage of sales 7.9%
a. We completed seven acquisitions from the second quarter of 2007 to the first quarter of 2008. The acquired companies are currently operating with a higher cost of sales percentage than our legacy businesses due to less efficient operations and products/contracts that generally carry lower margins. We are currently in the process of applying our lean manufacturing processes to their operations and implementing plans for plant consolidation in order to lower cost of sales as percentage of sales (See “Cost Savings and Consolidation Efforts”). These initiatives, as well as increased sales volumes, are expected to help improve our cost of sales percentage over the next two years.
b. In connection with our acquisitions in 2008 and 2007, the value of inventory on hand was stepped-up to reflect the fair value at the time of acquisition. This stepped-up value is amortized to cost of sales – excluding intangible amortization as the inventory to which the adjustment relates is sold. The inventory step-up amortization was $6.4 million and $1.7 million for 2008 and 2007, respectively. As of January 2, 2009 there was no remaining inventory step-up to be amortized.

46
c. The revenue increase in 2008, excluding acquisitions, included a higher mix of low-rate medical batteries and assembly sales, which generally have lower margins. Additionally, revenue from coated components, ICD capacitors and high-rate medical batteries, which are generally higher margin products, were lower.
d. This decrease is primarily due to higher feedthrough production which absorbed a higher amount of fixed costs such as plant overhead and depreciation. In addition, higher overhead efficiencies were driven by greater inventory build for moves and replenishment of safety stock.
e. This decrease was primarily driven by contractual price increases for our high rate medical batteries and price increases contingent upon raw material costs.
f. This decrease was a result of a reduction in excess capacity in connection with our facility consolidations completed in 2008 (See “Cost Savings and Consolidation Efforts”).
We expect cost of sales as a percentage of sales to benefit in future years from our consolidation efforts and the elimination of excess capacity. SG&A Expenses Changes from the prior year to SG&A expenses were primarily due to the following (in millions):
2008-2007$ Increase
Headcount increases associated with acquisitions (a) 18.9$ Amortization (b) 2.8 Enpath legal expense (c) 4.0 Other (d) 2.3 Net increase in SG&A 28.0$
a. Personnel acquired in functional areas such as Finance, Human Resources and Information Technology were the primary drivers of this increase. The remaining increase was for consulting, travel and other administrative expenses to operate those areas.
b. In connection with our acquisitions in 2008 and 2007, the value of customer relationships and non-compete agreements were recorded at fair value at the time of acquisition. These intangible assets are amortized to SG&A over their estimated useful lives.
c. Amount represents increased costs incurred in connection with a patent infringement action which went to trial in 2008 – see “Litigation.”
d. Increase is primarily a result of 2008 being a 53 week fiscal year versus 2007 which had 52 weeks, including additional payroll taxes that resulted from fiscal year 2008 ending in 2009.
SG&A expenses as a percentage of sales are expected to decline in the near term as synergies from our acquisitions are realized.

47
RD&E Expenses Net research, development and engineering costs were as follows (in millions):
January 2, December 28, 2009 2007
Research and development costs 18.8$ 16.1$
Engineering costs 22.4 18.9 Less cost reimbursements (9.8) (5.1) Engineering costs, net 12.6 13.8 Total RD&E 31.4$ 29.9$
Year ended
The increase in RD&E expenses for 2008 was primarily due to our acquisitions in 2007 and 2008 which added $5.3 million of incremental research and development costs, $4.1 million of incremental engineering costs and $2.7 million of incremental cost reimbursements. These increases were offset by our efforts to streamline these functions in 2008 to better align resources as well as the timing of cost reimbursements. RD&E expenses are expected to increase in 2009, reflecting our continued development of and investment in core product technologies. Other Operating Expenses Acquired In-Process Research and Development - Approximately $2.2 million and $16.1 million of the purchase price related to the 2008 and 2007 acquisitions, respectively, was allocated to IPR&D projects acquired. These projects had not yet reached technological feasibility and had no alternative future use as of the acquisition date, thus were immediately expensed on the date of acquisition. Additional information regarding these projects is set forth in Note 2 – “Acquisitions” of the Notes to the Consolidated Financial Statements contained in Item 8 of this report and “Product Development” section of this Item. The remaining other operating expenses are as follows (in millions):
January 2, December 28,2009 2007
(a) 2005 & 2006 facility shutdowns and consolidations 0.7$ 4.7$ (a) 2007 & 2008 facility shutdowns and consolidations 8.3 0.5 (b) Integration costs 5.4 - (c) Asset dispositions and other 0.2 0.1
14.6$ 5.3$
Year ended
a. Refer to the “Cost Savings and Consolidation Efforts” section of this Item for disclosures related to the timing and level of remaining expenditures for these items as of January 2, 2009.
b. For 2008, we incurred costs related to the integration of the companies acquired in 2007 and 2008. The integration initiatives include the implementation of the Oracle ERP system, training and compliance with policies as well as the implementation of lean manufacturing and six sigma initiatives. The expenses are primarily for consultants, relocation and travel costs that will not be required after the integrations are completed.
c. During 2008 and 2007, we had various asset disposals which were partially offset by insurance proceeds received on previously disposed assets.

48
In 2009 consolidation and integration expenses are expected to be approximately $10 million to $13 million. Interest Expense and Interest Income
Interest expense for 2008 is $5.9 million higher than 2007 primarily due to the additional $80 million of 2.25% convertible notes issued at the beginning of 2007 as well as the additional interest expense associated with line of credit draws used to fund our acquisitions and debt extinguishment in 2008. See Note 8 – “Debt” of the Notes to the Consolidated Financial Statements in this Form 10-K for additional information about our long-term debt obligations. We expect non-cash interest expense to increase materially in 2009 as a result of the changes in accounting for convertible debt effective in 2009. See “Impact of Recently Issued Accounting Standards” section of this Item for a further description of these changes. Cash interest costs for 2009 should remain relatively consistent with 2008 as we have fixed a significant portion of our interest costs utilizing interest rate swaps. Interest income for 2008 decreased by $6.3 million in comparison to the prior year primarily due to the cash deployed in connection with our acquisitions in 2007 and 2008. We expect interest income to remain comparable to the current year level for the foreseeable future. Gain on sale of investment security
In the second quarter of 2007, we sold an investment security which resulted in a pre-tax gain of $4.0 million. Gain on extinguishment of debt
In December 2008 we entered into privately negotiated agreements under which we repurchased $21.8 million in aggregate principal amount of our original $170.0 million of 2.25% convertible subordinated notes due 2013 (“CSN I”) at $845.38 per $1,000 of principal. The primary purpose of this transaction was to retire the debentures, which contained a put option exercisable on June 15, 2010, at a discount. This transaction was funded with availability under our existing line of credit. This transaction was accounted for as an extinguishment of debt and resulted in a pre-tax gain of $3.2 million. In the first quarter of 2007, we exchanged $117.8 million of our original $170.0 million of CSN I for an equivalent principal amount of a new series of 2.25% convertible subordinated notes due 2013. The primary purpose of this transaction was to eliminate the June 15, 2010 call and put option that is included in the terms of the exchanged CSN I. We accounted for this exchange as an extinguishment of debt, which resulted in a net pre-tax gain of $4.5 million. Other (income) expense, net
In December 2007, we entered into a forward contract to purchase 80,000,000 Swiss Francs (“CHF”), at an exchange rate of 1.1389 CHF per one U.S. dollar, in order to partially fund our acquisition of Precimed, which closed in January 2008 and was payable in Swiss Francs. In January 2008, we entered into an additional forward contract to purchase 20,000,000 CHF at an exchange rate of 1.1156 per one U.S. dollar. We entered into a similar foreign exchange contract in January 2008 in order to fund our acquisition of the Chaumont Facility, which closed in February 2008 and was payable in Euros. The net result of the above transactions was a gain of $2.4 million, $1.6 million of which was recorded in 2008 and $0.8 million in 2007.

49
Provision for Income Taxes Our effective tax rate for fiscal year 2008 of 32.0% is lower than the U.S. statutory rate primarily as a result of the Swiss Tax Holiday tax benefit, offset in part by the IPR&D charge from the acquisition of Precimed, which was not deductible for income tax purposes. Our effective tax rate for fiscal year 2007 of 47.5% was higher than the U.S. statutory rate primarily as a result of the IPR&D charge from the acquisition of Enpath, which was not deductible for income tax purposes. We expect our effective tax rate in 2009 to be more in line with the 35% U.S. statutory rate. Fiscal 2007 Compared with Fiscal 2006
Sales We achieved sales growth of 18% in 2007 compared to 2006. This growth was achieved through acquisitions and organic growth of 8%. This growth came during a period in which the CRM industry continued to recover from a difficult 2006. Our acquisitions which expanded our product lines and diversified our customer base represented a 10% increase in revenue. IMC - We achieved year-over-year growth of 19% in our IMC business despite our underlying markets growing at a low-single digit pace and an approximate 1% net reduction in selling prices. Our acquisitions represented a 10% increase in IMC revenue. ICD capacitors, ICD batteries, assembly products and coated electrodes were the primary growth drivers. ICD capacitor sales increased due to a non-recurring customer supply issue in the first half of the year. Growth in ICD batteries was primarily due to increased sales of our “Q” technology battery which was introduced near the end of 2006, partially offset by lower prices. This growth represents increased adoption of our high rate battery technology. Consistent with our strategy to increase the integration of our component products (including enclosures) into our assembly business, assembly revenues, which are included in Other IMC revenue, increased by 48% in 2007. Correspondingly, revenues from enclosures decreased by 13% over the same period. In addition to the above, the increase in assembly sales reflected an increase in price due to contractual agreements related to material price increases. Electrochem - Electrochem sales grew by 12% in 2007 through a combination of increased market penetration, new product introductions, greater value-added pack assembly and acquisitions. Our acquisitions represented a 7% increase in Electrochem revenue. The core growth rate slowed from the prior year partially due to the favorable benefit of approximately $1.5 million to $2.5 million in customer inventory stocking in 2006 as they consolidated operations. Cost of Sales Changes from the prior year to cost of sales as a percentage of sales were primarily due to the following:
2007-2006% Increase
Price reduction (a) 0.5%Inventory step-up (b) 0.5%Excess capacity at Columbia Facility (c) 0.4%Total percentage point change to cost of sales as a
percentage of sales 1.4%

50
a. This increase was primarily due to contractual price concessions negotiated with our larger customers. Price reductions were negotiated in exchange for longer term commitments, primarily in the IMC segment.
b. In connection with our acquisitions, the value of inventory on hand was stepped-up to reflect the fair value at the time of acquisition. The inventory step-up amortization, which is recorded as cost of sales – excluding intangible amortization, was $1.7 million.
c. The Columbia Facility was operating with excess capacity during 2007 as its production transitioned to our Tijuana, Mexico Facility. The excess capacity cost is approximately $1.2 million. In accordance with our inventory accounting policy, excess capacity costs are expensed.
SG&A Expenses Changes from the prior year to SG&A expenses were primarily due to the following (in millions):
2007-2006$ Increase
Headcount increases associated with acquisitions (a) 3.8$ Amortization (b) 1.0 Increased sales and marketing workforce (c) 0.9 Increased legal expense (d) 0.5 Other (0.3) Net increase in SG&A 5.9$
a. Personnel working for the acquired companies in functional areas such as Finance, Human Resources and Information Technology were the primary drivers of this increase. The remaining increase was for consulting, travel and other administrative expenses to operate these areas.
b. Relates to the amortization of customer relationships and non-compete agreements recorded as a result of our acquisitions in 2007.
c. The increase in sales and marketing workforce was primarily a result of our planned efforts to increase the marketing and sales of our products.
d. The increase in legal expense is primarily due to increased staffing levels and activity related to customer contract renewals during the year.
RD&E Expenses Net research, development and engineering costs were as follows (in millions):
December 28, December 29, 2007 2006
Research and development costs 16.1$ 16.1$
Engineering costs 18.9 9.9 Less cost reimbursements (5.1) (1.8) Engineering costs, net 13.8 8.1 Total RD&E 29.9$ 24.2$
Year ended

51
The increase in RD&E expenses for 2007 was primarily due to a planned headcount increase in engineering personnel as we continue to invest substantial resources in product technologies. Additionally, $1.9 million of research and development costs, $4.9 million of engineering costs and $2.6 million of cost reimbursements were a result of the acquisitions in 2007. Reimbursement on product development projects increased compared to last year primarily due to the timing of the achievement of milestones, as well as the Enpath and BIOMEC acquisitions, which added $2.6 million of cost reimbursements. Other Operating Expenses Acquired In-Process Research and Development - Approximately $2.3 million and $13.8 million of the BIOMEC and Enpath purchase prices, respectively, represent the estimated fair value of IPR&D projects acquired from those companies. These projects had not yet reached technological feasibility and had no alternative future use as of the acquisition date, thus were immediately expensed on the date of acquisition. The remaining other operating expenses are as follows (in millions):
December 28, December 29,2007 2006
(a) 2005 & 2006 facility shutdowns and consolidations 4.7$ 11.0$ (a) 2007 & 2008 facility shutdowns and consolidations 0.5 - (b) Asset dispositions and other 0.1 6.1
5.3$ 17.1$
Year Ended
a. Refer to “Cost Savings and Consolidation Efforts” section of this Item for additional disclosures. b. During 2007, we had various asset disposals which were offset by $0.5 million of insurance
proceeds on previously disposed assets. During 2006, we recorded a loss of $4.4 million related to the write-off of a battery test system that was under development. Upon completion of our engineering and technical evaluation, it was determined that the system could not meet the required specifications in a cost effective manner. This charge was included in the IMC business segment. The remaining expense for 2006 includes charges for various asset dispositions and $0.8 million for professional fees related to a potential acquisition that was no longer considered probable.
Interest Expense and Interest Income Interest expense for 2007 is higher than the prior year period primarily due to the additional $80 million of 2.25% convertible notes issued at the end of the first quarter of 2007 and additional amortization of deferred fees and discounts associated with these notes and the notes exchanged at that time. See Note 8 – “Debt” of the Notes to the Consolidated Financial Statements in this Form 10-K for additional information about our long-term debt obligations. Interest income for 2007 increased in comparison to 2006 primarily due to increased cash, cash equivalents and short-term investment balances, as well as higher rates earned. Gain on sale of investment security In the second quarter of 2007, we sold an investment security which resulted in a pre-tax gain of $4.0 million.

52
Gain on extinguishment of debt In the first quarter of 2007, we exchanged $117.8 million of our original $170.0 million of CSN I for an equivalent principal amount of a new series of 2.25% convertible subordinated notes due 2013. The primary purpose of this transaction was to eliminate the June 15, 2010 call and put option that is included in the terms of the exchanged CSN I. We accounted for this exchange as an extinguishment of debt, which resulted in a net pre-tax gain of $4.5 million ($2.9 million net of tax) or $0.13 per diluted share. Other (income) expense, net In December 2007, we entered into a forward contract to purchase 80,000,000 CHF, at an exchange rate of 1.1389 CHF per one U.S. dollar, in order to partially fund our acquisition of Precimed, which closed in January 2008 and was payable in Swiss Francs. The net result of the above transaction was a gain of $0.8 million which was recorded in 2007 as Other Income (Expense), Net. Provision for Income Taxes Our effective tax rate is higher than the U.S. statutory rate primarily as a result of the IPR&D charge from the acquisition of Enpath, which is non-deductible for income tax purposes. As a result, our effective tax rate was 47.5% in 2007. Excluding this IPR&D charge, our effective tax rate was consistent with 2006. Liquidity and Capital Resources
January 2, December 28,(Dollars in millions) 2009 2007
Cash and cash equivalents and short-term investments (a)(b) 22.1$ 40.5$ Working capital(b) 142.2$ 116.8$ Current ratio(b)
2.5:1.0 2.8:1.0
As of
a. We did not hold any short-term investments as of January 2, 2009. Short-term investments in 2007 consisted of municipal, U.S. Government Agency and corporate notes and bonds acquired with maturities that exceed three months.
b. Cash and cash equivalents and short-term investments decreased primarily due to the cash used to acquire Precimed and the Chaumont Facility and capital expenditures which were funded by $79.9 million of net cash received from borrowings and $57.1 million of cash flow generated from operations. Our increase in working capital was primarily due to the growth of the Company. As a percentage of assets, working capital remained consistent with the prior year at approximately 17%. Our current ratio remained relatively consistent with 2007 year-end amounts. We expect cash generated from operations to be sufficient to fund our consolidation and integration initiatives, future capital expenditures, contractual obligations and debt service payments.

53
Revolving line of credit - We have a senior credit facility (the “Credit Facility”) consisting of a $235 million revolving line of credit, which can be increased to $335 million upon our request. The Credit Facility also contains a $15 million letter of credit subfacility and a $15 million swingline subfacility. The Credit Facility is secured by our non-realty assets including cash, accounts and notes receivable, and inventories, and has an expiration date of May 22, 2012 with a one-time option to extend to April 1, 2013 if no default has occurred. Interest rates under the Credit Facility are, at our option, based upon the current prime rate or the LIBOR rate plus a margin that varies with our leverage ratio. If interest is paid based upon the prime rate, the applicable margin is between minus 1.25% and 0.00%. If interest is paid based upon the LIBOR rate, the applicable margin is between 1.00% and 2.00%. We are required to pay a commitment fee between 0.125% and 0.250% per annum on the unused portion of the Credit Facility based on our leverage ratio.
The Credit Facility contains limitations on the incurrence of indebtedness, limitations on the incurrence of liens and licensing of intellectual property, limitations on investments and restrictions on certain payments. Except to the extent paid for by common equity of Greatbatch or paid for out of cash on hand, the Credit Facility limits the amount paid for acquisitions in total to $100 million. The restrictions on payments, among other things, limit repurchases of our stock to $60 million and our ability to make cash payments upon conversion of our convertible subordinated notes, and dividends. These limitations can be waived upon approval of a simple majority of the lenders. Such waiver was obtained in order to fund the Precimed acquisition and repurchase our convertible subordinated notes in 2008.
The Credit Facility also requires us to maintain a ratio of adjusted EBITDA, as defined in the credit agreement, to interest expense of at least 3.00 to 1.00, and a total leverage ratio, as defined in the credit agreement, of not greater than 5.00 to 1.00 from May 22, 2007 through September 29, 2009 and not greater than 4.50 to 1.00 from September 30, 2009 and thereafter. As of January 2, 2009, we are in compliance with the required covenants. The Credit Facility contains customary events of default. Upon the occurrence and during the continuance of an event of default, a majority of the lenders may declare the outstanding advances and all other obligations under the Credit Facility immediately due and payable. In connection with our acquisition of Precimed and the Chaumont Facility, we borrowed $117 million under this revolving line of credit in 2008. We borrowed an additional net $15.0 million under the revolving line of credit since that time in order to fund the repurchase of convertible subordinated notes. The weighted average interest rate on these borrowings as of January 2, 2009, which does not include the impact of our interest rate swaps, was 3.8%. Interest rates reset based upon the six-month ($105 million), three-month ($8 million), two-month ($13 million) and one-month ($6 million) LIBOR rate. Based upon current capital needs, we do not anticipate making significant principal payments on the revolving line of credit within the next twelve months. As of January 2, 2009, we had $103 million available under our revolving line of credit. Extinguishment of Debt - In December 2008 we entered into privately negotiated agreements under which we repurchased $21.8 million in aggregate principal amount of our 2.25% convertible subordinated notes due 2013 at $845.38 per $1,000 of principal. The primary purpose of this transaction was to retire the debentures, which contained a put option exercisable on June 15, 2010, at a discount. This transaction was funded with availability under our existing line of credit. This transaction was accounted for as an extinguishment of debt and resulted in a pre-tax gain of $3.2 million.

54
As of January 2, 2009 we have outstanding $30.5 million of 2.25% convertible subordinated notes due 2013, which contain a put option exercisable on June 15, 2010. We believe that our cash flow from operations, as well as availability under our existing line of credit will be sufficient to fund the repayment of these notes if put to us. The remaining $197.8 million of convertible subordinated notes are not due until 2013 and do not have a put option. Operating Activities - Net cash flows from operating activities for 2008 increased $14.1 million over 2007. This increase was primarily driven by higher net income excluding non-cash items (consisting of depreciation, amortization, stock-based compensation, non-cash gains/losses) of $20.4 million. This increase was partially offset by cash flow used by our operating accounts, primarily inventory, due to the timing of inventory purchases and inventory safety stock build-up. The extinguishment of debt in 2008 resulted in a reclassification of approximately $3.2 million of current income tax liability, which will be paid in 2009. This amount was previously recorded as a non-current deferred tax liability on the balance sheet. The remaining variances can be attributed to the timing of cash receipts and payments, including those related to the companies acquired in 2007 and 2008. We anticipate that cash flow from operations will be sufficient to meet our operating, capital expenditure and debt service needs, other than for acquisitions. Included in accounts receivable as of January 2, 2009 is an $11.6 million value added tax receivable with the French government related to inventory purchases for the Chaumont Facility. We have made claims with the proper French authorities and fully expect to collect this amount in the first half of 2009, however collection is not guaranteed. Investing Activities - Net cash used in investing activities was $148.7 million for 2008. This was primarily the result of the acquisition of Precimed and the Chaumont Facility in 2008. The increase in property, plant and equipment purchases over 2007 of $24.2 million primarily relates to the construction of our new Electrochem manufacturing facility in Raynham, MA and the expansion of our corporate offices in 2008. Our current expectation for 2009 is that capital spending will be in the range of $30.0 million to $40.0 million of which approximately half are discretionary in nature. These purchases relate to routine investments to support our internal growth and to maintain our technology leadership. We anticipate cash flow from operations will be sufficient to fund these capital expenditures. We regularly engage in discussions relating to potential acquisitions. We continually assess our financing facilities and capital structure to ensure liquidity and capital levels are sufficient to meet our strategic objectives. Going forward, we will continue to pursue strategically targeted and opportunistic acquisitions. Financing Activities - Cash flow provided by financing activities for 2008 primarily related to $117.0 million of borrowings on our revolving line of credit taken in connection with the acquisition of Precimed and the Chaumont Facility and an additional net $15.0 million of borrowings under our revolving line of credit in order to fund our repurchase of $22 million par value of our convertible subordinated notes. We repaid $33.6 million of the debt assumed from Precimed during 2008. In 2007, we repaid $7.1 million of debt assumed from Enpath. During 2007, we received net proceeds of $76.0 million in connection with our issuance of 2.25% convertible subordinated notes and paid $6.6 million of financing fees related to that transaction and the new revolving credit agreement discussed above.

55
Capital Structure - At January 2, 2009, our capital structure consisted of $220.9 million of convertible subordinated notes, $132.0 million of debt under our revolving line of credit and 22.9 million shares of common stock outstanding. Additionally, we have $22.1 million in cash and cash equivalents which is sufficient to meet our short-term operating cash needs. If necessary, we have access to $103 million under our available line of credit and are authorized to issue 100 million shares of common stock and 100 million shares of preferred stock. The market value of our outstanding common stock since our initial public offering has exceeded our book value; accordingly, we believe that if needed we can access public markets to raise additional capital. Our capital structure allows us to support our internal growth and provides liquidity for corporate development initiatives. Off-Balance Sheet Arrangements
We have no off-balance sheet arrangements within the meaning of Item 303(a)(4) of Regulation S-K. Litigation
We are a party to various legal actions arising in the normal course of business. While we do not believe that the ultimate resolution of any such pending activities will have a material adverse effect on our consolidated results of operations, financial position, or cash flows, litigation is subject to inherent uncertainties. If an unfavorable ruling were to occur, there exists the possibility of a material adverse impact in the period in which the ruling occurs. As previously reported, on June 12, 2006, Enpath was named as defendant in a patent infringement action filed by Pressure Products Medical Supplies, Inc. (“Pressure Products”) in which Pressure Products alleged that Enpath’s FlowGuard™ valved introducer, which has been on the market for more than three years, and Enpath’s ViaSeal™ prototype introducer, which has not been sold, infringes claims in Pressure Products patents. After trial, a jury found that Enpath infringed the Pressure Products patents, but not willfully, and awarded damages in the amount of $1.1 million. Enpath has appealed the final judgment to the U.S. Court of Appeals for the Federal Circuit. As a result of a post-trial motion and pending the appeal, Enpath is permitted to continue to sell FlowGuard™ provided that Enpath pays into an escrow fund a royalty of between $1.50 and $2.25 for each sale of a FlowGuard™ valved introducer. The amount accrued as escrow during 2008 was $0.5 million. During 2008, we incurred $4.5 million of costs related to this litigation. During 2002, a former non-medical customer commenced an action alleging that Greatbatch had used proprietary information of the customer to develop certain products. We have meritorious defenses and are vigorously defending the matter. The potential risk of loss is up to $1.7 million. Contractual Obligations
The following table summarizes our significant contractual obligations at January 2, 2009:
CONTRACTUAL OBLIGATIONS TotalLess than 1
year 1-3 years 3-5 yearsMore than 5
years
Long-Term Debt Obligations (a) 397,972$ 10,019$ 49,461$ 338,492$ -$ Operating Lease Obligations (b) 11,068 2,910 3,370 2,803 1,985 Purchase Obligations (c) 18,062 18,062 - - - Pension Obligations (d) 9,852 703 1,590 2,010 5,549 Total 436,954$ 31,694$ 54,421$ 343,305$ 7,534$
Payments due by period

56
a. Includes the annual interest expense on our convertible debentures of 2.25%, which is paid semi-annually. These amounts assume the June 2010 put option is exercised on the $30.5 million of 2.25% convertible subordinated notes outstanding issued in May 2003. Also includes the expected interest expense on the $132 million outstanding on our line of credit based upon the period end weighted average interest rate of 3.7%, which includes the impact of our interest rate swaps outstanding. See Note 8 – “Debt” of the Notes to the Consolidated Financial Statements in this Form 10-K for additional information about our long-term debt obligations.
b. See Note 13 – “Commitments and Contingencies” of the Notes to the Consolidated Financial Statements in this Form 10-K for additional information about our operating lease obligations.
c. For the purposes of this table, contractual obligations for purchases of goods or services are defined as agreements that are enforceable and legally binding and that specify all significant terms, including: fixed or minimum quantities; fixed, minimum or variable price provisions; and the approximate timing of the transaction. Our purchase orders are normally based on our current manufacturing needs and are fulfilled by our vendors within short time horizons. We enter into blanket orders with vendors that have preferred pricing and terms, however these orders are normally cancelable by us without penalty.
d. See Note 9 – “Employee Benefit Plans” of the Notes to the Consolidated Financial Statements in this Form 10-K for additional information about our pension plan obligations. These amounts do not include any potential future contributions to our pension plan that may be necessary if the rate of return earned on pension plan assets is not sufficient to fund the rate of increase of our pension liability. Future cash contributions may be required. As of January 2, 2009 our actuarially determined pension liability exceeded the plans assets by $6.0 million.
This table does not include the forward contract entered into in February 2009 to purchase 10 million Mexican pesos per month from March 2009 to December 2009 at an exchange rate of 14.85 pesos per one U.S. dollar. This contract was entered into in order to hedge the risk of peso denominated payments associated with the operations at our Tijuana, Mexico facility. This contract will be accounted for as a cash flow hedge. Inflation We utilize certain critical raw materials (including precious metals) in our products that we obtain from a limited number of suppliers due to the technically challenging requirements of the supplied product and/or the lengthy process required to qualify these materials with our customers. We cannot quickly establish additional or replacement suppliers for these materials because of these requirements. Our results may be negatively impacted by an increase in the price of these critical raw materials. This risk is partially mitigated as many of the supply agreements with our customers allow us to partially adjust prices for the impact of any raw material price increases and the supply agreements with our vendors have final one-time buy clauses to meet a long-term need. Historically, raw material price increases have not materially impacted our results of operations. Impact of Recently Issued Accounting Standards In June 2008, the Emerging Issues Task Force (“EITF”) issued EITF 07-5, Determining Whether an Instrument (or Embedded Feature) Is Indexed to an Entity's Own Stock. This Issue prescribes a two step process for determining whether an instrument (or an embedded feature), such as our convertible subordinated notes, is indexed to our stock as follows: Step 1: if the instrument is not based on (a) an observable market, other than the market for our stock, or (b) an observable index, other than an index calculated or measured solely by reference to our own operations then the instrument is considered indexed to our own stock. Step 2: if the instrument settlement amount is

57
fixed then the instrument is considered indexed to our own stock. If we determine that our convertible subordinated notes are not indexed to our own stock, they would not meet the scope exception in paragraph 11(a) of SFAS No. 133 and thus would be accounted for under SFAS No. 133. We are still evaluating the impact of EITF 07-5 on our consolidated financial statements, which is effective beginning in fiscal year 2009. In June 2008, the FASB issued Staff Position (“FSP”) EITF 03-6-1, “Determining Whether Instruments Granted in Share-Based Payment Transactions Are Participating Securities.” This FSP concluded that all outstanding unvested share-based payment awards (restricted stock) that contain rights to nonforfeitable dividends are considered participating securities. Accordingly, the two-class method of computing basic and diluted EPS is required for these securities. FSP 03-6-1, which was effective beginning in fiscal year 2009, did not have a material impact on our consolidated financial statements and will be applied retrospectively to all periods presented in future financial statements. In May 2008, the FASB issued FSP APB 14-1, “Accounting for Convertible Debt Instruments that May be Settled in Cash Upon Conversion (Including Partial Cash Settlement).” This FSP requires issuers of convertible debt instruments that may be settled in cash upon conversion (including partial cash settlement) separately account for the liability and equity components of those instruments in a manner that will reflect the entity’s nonconvertible debt borrowing rate when interest cost is recognized in subsequent periods. This statement is effective beginning in fiscal year 2009 and will be applied retrospectively to all periods presented in future financial statements. This FSP is only applicable prospectively if we determine that our convertible subordinated notes are indexed to our own stock under the guidance of EITF 07-5. We estimate that this FSP, if applicable, will increase 2009 non-cash interest expense by approximately $7 million to $8 million and reduce 2009 diluted EPS by approximately $0.19 per share to $0.22 per share.
In March 2008, the FASB issued SFAS No. 161, Disclosures about Derivative Instruments and Hedging Activities. SFAS No. 161 amends and expands the disclosure requirements of SFAS No. 133, and requires entities to provide enhanced qualitative disclosures about objectives and strategies for using derivatives, quantitative disclosures about fair values and amounts of gains and losses on derivative contracts, and disclosures about credit-risk-related contingent features in derivative agreements. We will make the required disclosures beginning in 2009. In December 2007, the FASB issued SFAS No. 141(R), Business Combinations. This Statement replaces FASB Statement No. 141, Business Combinations but retains the guidance in SFAS No. 141 for identifying and recognizing intangible assets separately from goodwill. However, SFAS No. 141(R) significantly changed the accounting for business combinations with regards to the number of assets and liabilities assumed that are to be measured at fair value, the accounting for contingent consideration and acquired contingencies as well as the accounting for direct acquisition costs and IPR&D. SFAS No. 141(R) is effective for acquisitions consummated beginning in fiscal year 2009 and will materially impact our consolidated financial statements if we consummate an acquisition after the date of adoption. SFAS No. 141(R) provides that any changes to an entity’s acquired uncertain tax positions and valuation allowances associated with acquired deferred tax assets will no longer be applied to goodwill, regardless of the acquisition date of the associated business combination. As such, any changes to the acquired uncertain tax positions and valuation allowances will be recognized as an adjustment to income tax expense.

58
In December 2007, the FASB issued SFAS No. 160, Noncontrolling Interests in Consolidated Financial Statements—an amendment of ARB No. 51. This Statement amends Accounting Research Bulletin No. 51 to establish accounting and reporting standards for the noncontrolling interest in a subsidiary and for the deconsolidation of a subsidiary. SFAS No. 160 did not have a material impact on our consolidated financial statements, which was effective beginning in fiscal year 2009.
In September 2006, the FASB issued SFAS No. 157, Fair Value Measurements. This Statement defines fair value, establishes a framework for measuring fair value while applying U.S. GAAP, and expands disclosures about fair value measurements. SFAS No. 157 establishes a fair value hierarchy that distinguishes between (1) market participant assumptions based on market data obtained from independent sources and (2) the reporting entity’s own assumptions developed based on unobservable inputs. In February 2008, the FASB issued FSP FAS 157-b—Effective Date of FASB Statement No. 157. This FSP (1) partially deferred the effective date of SFAS No. 157 for one year for certain nonfinancial assets and nonfinancial liabilities and (2) removed certain leasing transactions from the scope of SFAS No. 157. Effective in fiscal year 2008, we adopted the provisions of SFAS No. 157 for all financial assets and financial liabilities and nonfinancial assets and nonfinancial liabilities that are recognized or disclosed at fair value on a recurring basis. The provisions of SFAS No. 157 that were effective in 2009, did not materially impact our consolidated financial statements. ITEM 7A. QUANTITATIVE AND QUALITATIVE DISCLOSURES ABOUT MARKET
RISK Foreign Currency
With our acquisition of Precimed and the Chaumont Facility, we significantly increased our exposure to foreign currency exchange rate fluctuations due to transactions denominated in Swiss Francs and Euros. We continually evaluate our exposure to foreign currency risk and develop hedging strategy’s to best mitigate these risks, which include the use of various derivative instruments. We believe that a hypothetical 10% change in the value of the U.S. dollar in relation to our most significant foreign currency exposures would not have a material impact on our net earnings as the impact of foreign currency rates on revenue is almost entirely offset by the inverse impact on our cost of sales and operating expenses. In December 2007, we entered into a forward contract to purchase 80,000,000 CHF, at an exchange rate of 1.1389 CHF per one U.S. dollar, in order to partially fund the acquisition of Precimed, which closed in January 2008 and was payable in Swiss Francs. In January 2008, we entered into an additional forward contract to purchase 20,000,000 CHF at an exchange rate of 1.1156 per one U.S. dollar. We entered into a similar foreign exchange contract in January 2008 in order to fund the acquisition of the Chaumont Facility, which closed in February 2008 and was payable in Euros. The net result of the above transactions was a gain of $2.4 million, $1.6 million of which was recorded in 2008 as other (income) expense, net. In February 2009, we entered into a forward contract to purchase 10 million Mexican pesos per month from March 2009 to December 2009 at an exchange rate of 14.85 pesos per one U.S. dollar. This contract was entered into in order to hedge the risk of peso denominated payments associated with the operations at our Tijuana, Mexico facility. This contract will be accounted for as a cash flow hedge.

59
We translate all assets and liabilities of our foreign operations of Precimed and the Chaumont Facility acquired in 2008 at the period-end exchange rate and translate sales and expenses at the average exchange rates in effect during the period. The net effect of these translation adjustments is recorded in the consolidated financial statements as comprehensive income (loss). The aggregate translation adjustment for 2008 was a loss of $0.2 million. Translation adjustments are not adjusted for income taxes as they relate to permanent investments in our foreign subsidiaries. Net foreign currency transaction gains and losses included in other income amounted to a gain of $0.1 million for 2008. A hypothetical 10% change in the value of the U.S. Dollar in relation to our most significant foreign currency subsidiary (P Medical Holding SA - Swiss Francs) would have had an impact of approximately $10 million on these foreign net assets as of January 2, 2009. Included in accounts receivable as of January 2, 2009 is an $11.6 million value added tax receivable with the French government related to inventory purchases for the Chaumont Facility. We have made claims with the proper French authorities and fully expect to collect this amount in the first half of 2009, however collection is not guaranteed. This receivable is denominated in Euros and is subject to foreign currency risk, which could be material. Interest Rate Swaps As of January 2, 2009, we had $132 million outstanding on our revolving line of credit. Interest rates reset on this debt based upon the six-month ($105 million), three-month ($8 million), two-month ($13 million) and one-month ($6 million) LIBOR rate, thus subjecting us to interest rate risk. During 2008, we entered into three receive floating-pay fixed interest rate swaps indexed to the six-month LIBOR rate. The objective of these swaps is to hedge against potential changes in cash flows on our outstanding revolving line of credit. No credit risk was hedged. The receive variable leg of the swaps and the variable rate paid on the revolving line of credit bear the same rate of interest, excluding the credit spread, and reset and pay interest on the same dates. Information regarding our outstanding interest rate swaps is as follow:
Current FairPay receive value
Type of Notional Start End fixed floating January 2,Instrument hedge amount date date rate rate 2009
(In thousands) (In thousands)Interest rate swap Cash flow 80,000$ 3/5/2008 7/7/2010 3.09% 3.14% (1,484)$ Interest rate swap Cash flow 18,000 12/18/2008 12/18/2010 2.00% 2.17% - Interest rate swap Cash flow 50,000 7/7/2010 7/7/2011 2.16% 6M LIBOR 90
148,000$ 2.64% (1,394)$
The estimated fair value of the interest rate swap agreement represents the amount we expect to receive (pay) to terminate the contracts. No portion of the change in fair value of the interest rate swaps during 2008 was considered ineffective. The amount recorded as an offset to interest expense in 2008 related to the interest rate swaps was $0.4 million. A hypothetical one percentage point change in the LIBOR interest rate on the remaining $34 million of floating rate debt would have had an impact of approximately $0.3 million on our interest expense. This amount is not indicative of the hypothetical net earnings impact due to partially offsetting impacts on our cash and cash equivalents to interest income.

60
ITEM 8. FINANCIAL STATEMENTS AND SUPPLEMENTARY DATA
The following are set forth below:
Management’s Report on Internal Control Over Financial Reporting
Reports of Independent Registered Public Accounting Firm
Consolidated Balance Sheets as of January 2, 2009 and December 28, 2007
Consolidated Statements of Operations and Comprehensive Income for the years ended January 2, 2009, December 28, 2007 and December 29, 2006
Consolidated Statements of Cash Flows for the years ended January 2, 2009, December 28, 2007 and December 29, 2006
Consolidated Statements of Stockholders’ Equity for the years ended January 2, 2009, December 28, 2007 and December 29, 2006
Notes to Consolidated Financial Statements

61
MANAGEMENT’S REPORT ON INTERNAL CONTROL OVER FINANCIAL REPORTING
The Company’s certifying officers are responsible for establishing and maintaining adequate internal control over financial reporting. The Company’s internal control over financial reporting is designed and maintained under the supervision of its certifying officers to provide reasonable assurance regarding the reliability of financial reporting and the preparation of the Company’s financial statements for external reporting purposes in accordance with accounting principles generally accepted in the United States of America. As of January 2, 2009, management conducted an assessment of the effectiveness of the Company’s internal control over financial reporting based on the framework established in Internal Control – Integrated Framework issued by the Committee of Sponsoring Organizations of the Treadway Commission. Based on this assessment, management has determined that the Company’s internal control over financial reporting as of January 2, 2009 is effective. In conducting the evaluation of the effectiveness of internal control over financial reporting as of January 2, 2009, as permitted by the guidance issued by the Office of the Chief Accountant of the Securities and Exchange Commission, management excluded the following subsidiaries acquired in 2008:
• Precimed, Inc.
• P Medical Holding SA and subsidiaries, including the DePuy Orthopaedics Chaumont, France manufacturing facility
These subsidiaries represented approximately 39% and 21% of net and total assets, respectively, and 26% of revenues of the consolidated financial statement amounts as of and for the year ended January 2, 2009. See Note 2 - “Acquisitions” for a discussion of these acquisitions and their impact on the Company’s Consolidated Financial Statements. The effectiveness of internal control over financial reporting as of January 2, 2009 has been audited by Deloitte & Touche LLP, the Company’s independent registered public accounting firm. Dated: March 2, 2009 Thomas J. Hook Thomas J. Mazza President & Chief Executive Officer Senior Vice President & Chief Financial Officer

62
REPORT OF INDEPENDENT REGISTERED PUBLIC ACCOUNTING FIRM
To the Board of Directors and Stockholders of Greatbatch, Inc. Clarence, New York
We have audited the internal control over financial reporting of Greatbatch, Inc. and subsidiaries (the "Company") as of January 2, 2009, based on criteria established in Internal Control — Integrated Framework issued by the Committee of Sponsoring Organizations of the Treadway Commission. As described in Management’s Report on Internal Control Over Financial Reporting, management excluded from its assessment the internal control over financial reporting at Precimed, Inc. and P Medical Holding SA and subsidiaries, which were acquired in 2008, and whose financial statements constitute 39% and 21% of net and total assets, respectively, and 26% of revenues of the consolidated financial statement amounts as of and for the year ended January 2, 2009. Accordingly, our audit did not include the internal control over financial reporting at Precimed, Inc. and P Medical Holding SA and subsidiaries. The Company's management is responsible for maintaining effective internal control over financial reporting and for its assessment of the effectiveness of internal control over financial reporting, included in the accompanying Management’s Report on Internal Control Over Financial Reporting. Our responsibility is to express an opinion on the Company's internal control over financial reporting based on our audit.
We conducted our audit in accordance with the standards of the Public Company Accounting Oversight Board (United States). Those standards require that we plan and perform the audit to obtain reasonable assurance about whether effective internal control over financial reporting was maintained in all material respects. Our audit included obtaining an understanding of internal control over financial reporting, assessing the risk that a material weakness exists, testing and evaluating the design and operating effectiveness of internal control based on the assessed risk, and performing such other procedures as we considered necessary in the circumstances. We believe that our audit provides a reasonable basis for our opinion.
A company's internal control over financial reporting is a process designed by, or under the supervision of, the company's principal executive and principal financial officers, or persons performing similar functions, and effected by the company's board of directors, management, and other personnel to provide reasonable assurance regarding the reliability of financial reporting and the preparation of financial statements for external purposes in accordance with generally accepted accounting principles. A company's internal control over financial reporting includes those policies and procedures that (1) pertain to the maintenance of records that, in reasonable detail, accurately and fairly reflect the transactions and dispositions of the assets of the company; (2) provide reasonable assurance that transactions are recorded as necessary to permit preparation of financial statements in accordance with generally accepted accounting principles, and that receipts and expenditures of the company are being made only in accordance with authorizations of management and directors of the company; and (3) provide reasonable assurance regarding prevention or timely detection of unauthorized acquisition, use, or disposition of the company's assets that could have a material effect on the financial statements.

63
Because of the inherent limitations of internal control over financial reporting, including the possibility of collusion or improper management override of controls, material misstatements due to error or fraud may not be prevented or detected on a timely basis. Also, projections of any evaluation of the effectiveness of the internal control over financial reporting to future periods are subject to the risk that the controls may become inadequate because of changes in conditions, or that the degree of compliance with the policies or procedures may deteriorate.
In our opinion, the Company maintained, in all material respects, effective internal control over financial reporting as of January 2, 2009, based on the criteria established in Internal Control — Integrated Framework issued by the Committee of Sponsoring Organizations of the Treadway Commission.
We have also audited, in accordance with the standards of the Public Company Accounting Oversight Board (United States), the consolidated financial statements and financial statement schedule as of and for the year ended January 2, 2009, of the Company and our report dated March 3, 2009, expressed an unqualified opinion on those financial statements and financial statement schedule.
Buffalo, New York March 3, 2009

64
REPORT OF INDEPENDENT REGISTERED PUBLIC ACCOUNTING FIRM
To the Board of Directors and Stockholders of Greatbatch, Inc. Clarence, New York
We have audited the accompanying consolidated balance sheets of Greatbatch, Inc. and subsidiaries (the "Company") as of January 2, 2009 and December 28, 2007, and the related consolidated statements of operations and comprehensive income, stockholders' equity, and cash flows for each of the three years in the period ended January 2, 2009. Our audits also included the consolidated financial statement schedule listed in the Index at Item 15(a)(2). These financial statements and consolidated financial statement schedule are the responsibility of the Company's management. Our responsibility is to express an opinion on the financial statements and financial statement schedule based on our audits.
We conducted our audits in accordance with the standards of the Public Company Accounting Oversight Board (United States). Those standards require that we plan and perform the audit to obtain reasonable assurance about whether the financial statements are free of material misstatement. An audit includes examining, on a test basis, evidence supporting the amounts and disclosures in the financial statements. An audit also includes assessing the accounting principles used and significant estimates made by management, as well as evaluating the overall financial statement presentation. We believe that our audits provide a reasonable basis for our opinion.
In our opinion, such consolidated financial statements present fairly, in all material respects, the financial position of the Company as of January 2, 2009 and December 28, 2007, and the results of its operations and its cash flows for each of the three years in the period ended January 2, 2009, in conformity with accounting principles generally accepted in the United States of America. Also, in our opinion, such consolidated financial statement schedule, when considered in relation to the basic consolidated financial statements taken as a whole, presents fairly, in all material respects, the information set forth therein.
We have also audited, in accordance with the standards of the Public Company Accounting Oversight Board (United States), the Company's internal control over financial reporting as of January 2, 2009, based on the criteria established in Internal Control—Integrated Framework issued by the Committee of Sponsoring Organizations of the Treadway Commission and our report dated March 3, 2009, expressed an unqualified opinion on the Company's internal control over financial reporting.
Buffalo, New York March 3, 2009

65
January 2, December 28,ASSETS 2009 2007Current assets: Cash and cash equivalents 22,063$ 33,473$ Short-term investments available for sale - 7,017 Accounts receivable, net of allowance for doubtful accounts 86,364 56,962 Inventories, net 112,304 71,882 Refundable income taxes - 377 Deferred income taxes 8,086 6,469 Prepaid expenses and other current assets 6,754 5,044 Total current assets 235,571 181,224 Property, plant and equipment, net 166,668 114,946 Amortizing intangible assets, net 90,259 71,268 Trademarks and tradenames 36,130 32,582 Goodwill 302,221 248,540 Deferred income taxes 1,942 - Other assets 16,140 15,291
Total assets 848,931$ 663,851$
LIABILITIES AND STOCKHOLDERS’ EQUITYCurrent liabilities: Accounts payable 48,727$ 33,433$ Income taxes payable 4,128 - Accrued expenses and other current liabilities 40,497 30,975 Total current liabilities 93,352 64,408 Long-term debt 352,920 241,198 Deferred income taxes 44,306 35,346 Other long-term liabilities 7,601 228 Total liabilities 498,179 341,180 Commitments and contingencies (Note 13)Stockholders' equity: Preferred stock, $0.001 par value, authorized 100,000,000 shares;
no shares issued or outstanding in 2008 or 2007 - - Common stock, $0.001 par value, authorized 100,000,000
shares; 22,970,916 shares issued and 22,943,176 shares outstanding in 2008and 22,477,340 shares issued and 22,470,299 shares outstanding in 2007 23 22
Additional paid-in capital 251,772 238,574 Treasury stock, at cost, 27,740 shares in 2008 and 7,041 shares in 2007 (741) (140) Retained earnings 102,774 84,215 Accumulated other comprehensive loss (3,076) - Total stockholders’ equity 350,752 322,671
Total liabilities and stockholders' equity 848,931$ 663,851$
The accompanying notes are an integral part of these consolidated financial statements
GREATBATCH, INC. CONSOLIDATED BALANCE SHEETS
(in thousands except share and per share data)

66
January 2, December 28, December 29,2009 2007 2006
Sales 546,644$ 318,746$ 271,142$
Cost of sales - excluding amortization of intangible assets 384,014 198,184 164,885
Cost of sales - amortization of intangible assets 6,841 4,537 3,813 Selling, general and administrative expenses 72,633 44,674 38,785 Research, development and engineering costs, net 31,444 29,914 24,225 Acquired in-process research and development 2,240 16,093 - Other operating expenses, net 14,578 5,324 17,058
Operating income 34,894 20,020 22,376 Interest expense 13,168 7,303 4,605 Interest income (711) (7,050) (5,775) Gain on extinguishment of debt (3,242) (4,473) - Gain on sale of investment security - (4,001) - Other (income) expense, net (1,624) (447) 12
Income before provision for income taxes 27,303 28,688 23,534 Provision for income taxes 8,744 13,638 7,408
Net income 18,559$ 15,050$ 16,126$
Earnings per share:Basic 0.82$ 0.68$ 0.74$ Diluted 0.81$ 0.67$ 0.73$
Weighted average shares outstanding:Basic 22,525 22,152 21,803 Diluted 24,128 22,422 26,334
Comprehensive income:Net income 18,559$ 15,050$ 16,126$
Foreign currency translation adjustment (228) - - Unrealized loss on interest rate swaps, net of tax (906) - - Defined benefit pension plan liability adjustment (1,942) - -
Net unrealized gain (loss) on short-term- (923) 3,594
Less: reclassification adjustment for net realizedgain on short-term investments available for sale,net of tax - (2,601) -
Comprehensive income 15,483$ 11,526$ 19,720$
investments available for sale, net of tax
The accompanying notes are an integral part of these consolidated financial statements
GREATBATCH, INC.CONSOLIDATED STATEMENTS OF OPERATIONS
AND COMPREHENSIVE INCOME(in thousands except per share amounts)
Year Ended

67
January 2, December 28, December 29,2009 2007 2006
Cash flows from operating activities: Net income 18,559$ 15,050$ 16,126$ Adjustments to reconcile net income to net cash from operating activities:
Depreciation and amortization 45,382 25,842 19,309 Stock-based compensation 11,211 9,252 9,717 Gain on extinguishment of debt (3,242) (4,473) - Gain on sale of investment security - (4,001) - Acquired in-process research and development 2,240 16,093 - Other non-cash (gains) losses/asset writedowns, net 2,994 (972) 5,379 Deferred income taxes 1,671 (4,935) 4,888
Changes in operating assets and liabilities: Accounts receivable (18,640) (14,523) (1,288) Inventories (21,077) (1,969) (12,483) Prepaid expenses and other current assets (35) (238) (855) Accounts payable 14,285 11,138 64 Accrued expenses and other liabilities 1,589 (4,581) (1,011) Income taxes 2,164 1,282 (641)
Net cash provided by operating activities 57,101 42,965 39,205 Cash flows from investing activities:
Purchases of short-term investments (2,010) (70,058) (54,800) Proceeds from maturity/disposition of short-term investments 9,027 133,578 53,808 Acquisition of property, plant and equipment (44,172) (19,993) (15,445) Purchase of cost method investment, net of distributions (4,300) (1,750) - Acquisitions, net of cash acquired (107,577) (188,148) - Other investing activities 306 567 64
Net cash used in investing activities (148,726) (145,804) (16,373) Cash flows from financing activities:
Repayments under line of credit, net - (1,000) - Principal payments of long-term debt (62,058) (6,093) (464) Proceeds from issuance of long-term debt 142,000 76,000 - Payment of debt issuance costs - (6,628) - Issuance of common stock 2,210 2,699 2,082 Excess tax benefits from stock-based awards 298 392 294 Repurchase of treasury stock (793) (205) -
Net cash provided by financing activities 81,657 65,165 1,912 Effect of foreign currency exchange on cash and cash equivalents (1,442) - - Net increase (decrease) in cash and cash equivalents (11,410) (37,674) 24,744 Cash and cash equivalents, beginning of year 33,473 71,147 46,403
Cash and cash equivalents, end of year 22,063$ 33,473$ 71,147$
The accompanying notes are an integral part of these consolidated financial statements
GREATBATCH, INC.CONSOLIDATED STATEMENTS OF CASH FLOWS
(in thousands)
Year Ended

68
Acc
umul
ated
Add
ition
alot
her
Tota
lpa
id-in
Ret
aine
dco
mpr
ehen
sive
stoc
khol
ders
'Sh
ares
A
mou
ntca
pita
lSh
ares
A
mou
ntea
rnin
gsin
com
e (lo
ss)
equi
ty
Ba
lanc
e, D
ecem
ber 3
1, 2
005
21,7
52
22
$
215,
614
$
-
-
$
53,0
39$
(7
0)$
26
8,60
5$
Sto
ck-b
ased
com
pens
atio
n-
-
6,41
7
-
-
-
-
6,41
7
N
et sh
ares
issu
ed u
nder
stoc
k in
cent
ive p
lans
257
-
2,08
2
(8
)
(2
05)
-
-
1,87
7
I
ncom
e tax
ben
efit
from
stoc
k op
tions
a
nd re
stric
ted
stock
-
-
29
4
-
-
-
-
29
4
Sha
res c
ontri
bute
d to
401
(k)
110
-
2,78
0
-
-
-
-
2,78
0
N
et in
com
e-
-
-
-
-
16,1
26
-
16,1
26
T
otal
oth
er co
mpr
ehen
sive g
ain,
net
-
-
-
-
-
-
3,
594
3,
594
Bala
nce,
Dec
embe
r 29,
200
622
,119
22
22
7,18
7
(8)
(205
)
69,1
65
3,
524
29
9,69
3
Sto
ck-b
ased
com
pens
atio
n-
-
5,67
3
-
-
-
-
5,67
3
N
et sh
ares
issu
ed u
nder
stoc
k in
cent
ive p
lans
248
-
2,49
4
1
65
-
-
2,55
9
I
ncom
e tax
ben
efit
from
stoc
k op
tions
and
restr
icte
d sto
ck-
-
264
-
-
-
-
264
S
hare
s con
tribu
ted
to 4
01(k
) 11
0
-
2,
956
-
-
-
-
2,
956
Net
inco
me
-
-
-
-
-
15
,050
-
15
,050
Tot
al o
ther
com
preh
ensiv
e los
s, ne
t-
-
-
-
-
-
(3,5
24)
(3
,524
)
Ba
lanc
e, D
ecem
ber 2
8, 2
007
22,4
77
22
238,
574
(7
)
(1
40)
84
,215
-
32
2,67
1
Sto
ck-b
ased
com
pens
atio
n-
-
6,82
2
-
-
-
-
6,82
2
N
et sh
ares
issu
ed u
nder
stoc
k in
cent
ive p
lans
266
1
1,
417
(21)
(6
01)
-
-
817
I
ncom
e tax
ben
efit
from
stoc
k op
tions
and
restr
icte
d sto
ck-
-
14
-
-
-
-
14
S
hare
s iss
ued
in co
nnec
tion
with
the
Qua
n Em
erte
q ac
quisi
tion
60
-
1,47
3
-
-
-
-
1,47
3
S
hare
s con
tribu
ted
to 4
01(k
) 16
8
-
3,
472
-
-
-
-
3,
472
Net
inco
me
-
-
-
-
-
18
,559
-
18
,559
Tot
al o
ther
com
preh
ensiv
e los
s, ne
t-
-
-
-
-
-
(3,0
76)
(3
,076
)
Ba
lanc
e, Ja
nuar
y 2,
200
922
,971
23$
25
1,77
2$
(28)
(7
41)
$
10
2,77
4$
(3,0
76)
$
35
0,75
2$
GR
EATB
ATC
H, I
NC
.C
ON
SOLI
DA
TED
STA
TEM
ENTS
OF
STO
CK
HO
LDER
S’ E
QU
ITY
(in th
ousa
nds)
The a
ccom
pany
ing
note
s are
an in
tegr
al p
art o
f the
se co
nsol
idat
ed fi
nanc
ial s
tate
men
ts
Trea
sury
Com
mon
stoc
kst
ock

69
GREATBATCH, INC. NOTES TO CONSOLIDATED FINANCIAL STATEMENTS
1. SUMMARY OF SIGNIFICANT ACCOUNTING POLICIES
Principles of Consolidation - The consolidated financial statements include the accounts of Greatbatch, Inc. and its wholly owned subsidiary (collectively, the “Company” or “Greatbatch”). All intercompany balances and transactions have been eliminated in consolidation.
Nature of Operations - The Company operates its business in two reportable segments – Implantable Medical Components (“IMC”) and Electrochem Solutions (“Electrochem”). The IMC business designs and manufactures components and devices for the Cardiac Rhythm Management (“CRM”), Neuromodulation, Vascular Access and Orthopedic markets. Additionally, the IMC business offers value-added assembly and design engineering services for products that incorporate Implantable Medical Device (“IMD”) components. IMC customers include leading original equipment manufacturers (“OEM”), in alphabetical order here and throughout this report, such as Biotronik, Boston Scientific, DePuy Orthopaedics (“DePuy”), Johnson & Johnson, Medtronic, Smith & Nephew, Sorin Group, St. Jude Medical, Stryker and Zimmer. IMC entered the Vascular Access market through its acquisition of Enpath Medical, Inc. (“Enpath”) and Quan Emerteq, LLC (“Quan”) in 2007 and the Orthopedic market through its acquisition of P Medical Holding SA (“Precimed”) and the assets of DePuy’s Chaumont, France manufacturing facility (the “Chaumont Facility”) in early 2008. Electrochem is a world leader in the design, manufacture and distribution of electrochemical cells, battery packs and wireless sensors for demanding applications in markets such as energy, security, portable medical, environmental monitoring and more. Electrochem broadened its product portfolio through its acquisitions of Engineered Assemblies Corporation (“EAC”) and IntelliSensing, LLC in 2007, and can now design and provide its customers rechargeable battery and wireless sensor systems. Fiscal Year End - The Company utilizes a fifty-two, fifty-three week fiscal year ending on the Friday nearest December 31st. Fiscal years 2008, 2007 and 2006 ended on January 2, 2009, December 28, 2007 and December 29, 2006, respectively. Fiscal year 2008 contained fifty-three weeks while fiscal years 2007 and 2006 contained fifty-two weeks.
Fair Value Measurements – Beginning in fiscal year 2008, the Company adopted the provisions of Statement of Financial Accounting Standards (“SFAS”) No. 157, Fair Value Measurements, for all financial assets and liabilities and nonfinancial assets and liabilities that are recognized or disclosed at fair value on a recurring basis (at least annually). Under this standard, fair value is defined as the price that would be received to sell an asset or paid to transfer a liability (i.e. the “exit price”) in an orderly transaction between market participants at the measurement date. See Recent Accounting Pronouncements in this note for further information.
SFAS No. 157 establishes a hierarchy for inputs used in measuring fair value that maximizes the use of observable inputs and minimizes the use of unobservable inputs by requiring that the most observable inputs be used when available. Observable inputs are inputs that market participants would use in pricing the asset or liability developed based on market data obtained from sources independent of the Company. Unobservable inputs are inputs that reflect the Company’s assumptions about the assumptions market participants would use in pricing the asset or liability developed based on the best information available in the circumstances. The hierarchy is broken down into three levels based on the reliability of inputs as follows:

70
Level 1 — Valuations based on quoted prices in active markets for identical assets or liabilities that the Company has the ability to access. Since valuations are based on quoted prices that are readily and regularly available in an active market, valuation of these products does not entail a significant degree of judgment. Level 2 — Valuation is determined from quoted prices for similar assets or liabilities in active markets, quoted prices for identical or similar instruments in markets that are not active or by model-based techniques in which all significant inputs are observable in the market. Level 3 — Valuations based on inputs that are unobservable and significant to the overall fair value measurement. The degree of judgment exercised in determining fair value is greatest for instruments categorized in Level 3. The availability of observable inputs can vary and is affected by a wide variety of factors, including, the type of asset/liability, whether the asset/liability is established in the marketplace, and other characteristics particular to the transaction. To the extent that valuation is based on models or inputs that are less observable or unobservable in the market, the determination of fair value requires more judgment. In certain cases, the inputs used to measure fair value may fall into different levels of the fair value hierarchy. In such cases, for disclosure purposes the level in the fair value hierarchy within which the fair value measurement in its entirety falls is determined based on the lowest level input that is significant to the fair value measurement in its entirety. Fair value is a market-based measure considered from the perspective of a market participant rather than an entity-specific measure. Therefore, even when market assumptions are not readily available, assumptions are required to reflect those that market participants would use in pricing the asset or liability at the measurement date. The carrying amount of financial instruments, including cash and cash equivalents, trade receivables and accounts payable, approximated their fair value as of January 2, 2009 because of the short maturity of these instruments. Cash and Cash Equivalents - Cash and cash equivalents consist of cash and highly liquid, short-term investments with maturities at the time of purchase of three months or less. Short-Term Investments – The Company did not hold any short-term investments at the end of 2008. Short-term investments at December 28, 2007 are comprised of municipal, U.S. Government Agency and corporate notes and bonds acquired with maturities that exceed three months. All short-term investments as of December 28, 2007 are classified as available-for-sale and have a maturity of less than one year at the time of acquisition. Available-for-sale securities are carried at fair value with the unrealized gain or loss, net of tax, reported in accumulated other comprehensive income (loss) as a separate component of stockholders’ equity. Realized gains and losses and investment income are included in net income. The cost of securities sold is based on the specific identification method. Unrealized losses considered to be other than temporary are recognized in net income.

71
Concentration of Credit Risk - Financial instruments that potentially subject the Company to concentration of credit risk consist principally of accounts receivable. A significant portion of the Company’s sales are to four customers, all in the medical device industry, and, as such, the Company is directly affected by the condition of those customers and that industry. However, the credit risk associated with trade receivables is partially mitigated due to the stability of those customers. The Company performs on-going credit evaluations of its customers. Note 15 – “Business Segment Information” contains information on sales and accounts receivable for these customers. The Company maintains cash deposits with major banks, which from time to time may exceed federally insured limits. The Company performs on-going credit evaluations of its banks. Included in accounts receivable as of January 2, 2009 is an $11.6 million value added tax receivable with the French government related to inventory purchases for the Chaumont Facility. The Company has made claims with the proper French authorities and fully expects to collect this amount in the first half of 2009, however collection is not guaranteed. This receivable is denominated in Euros and is subject to foreign currency risk, which could be material. Allowance for Doubtful Accounts - The Company provides credit, in the normal course of business, to its customers in the form of trade receivables. The Company maintains an allowance for doubtful customer accounts for those receivables that it does not expect to collect. The Company accrues its estimated losses from uncollectable accounts receivable to the allowance based upon recent historical experience, the length of time the receivable has been outstanding and other specific information as it becomes available. Provisions to the allowance for doubtful accounts are charged to current operating expenses. Actual losses are charged against this allowance when incurred. The allowance for doubtful accounts was $1.6 million at January 2, 2009 and $0.8 million at December 28, 2007.
Inventories - Inventories are stated at the lower of cost, determined using the first-in first-out method, or market. Provisions for excess, obsolete or expired inventory are based primarily on how long the inventory has been held as well as our estimates of forecasted net sales of that product. A significant change in the timing or level of demand for our products may result in recording additional provisions for excess, obsolete or expired inventory in the future.
Property, Plant and Equipment - Property, plant and equipment is carried at cost. Depreciation is computed primarily by the straight-line method over the estimated useful lives of the assets, as follows: buildings and building improvements 7-40 years; machinery and equipment 3-8 years; office equipment 3-10 years; and leasehold improvements over the remaining lives of the improvements or the lease term, if less. The cost of repairs and maintenance is expensed as incurred; renewals and betterments are capitalized. Upon retirement or sale of an asset, its cost and related accumulated depreciation or amortization is removed from the accounts and any gain or loss is recorded in operating income or expense.
Business Combinations – The Company records its business combinations under the purchase method of accounting. Under the purchase method of accounting, the Company allocates the purchase price of each acquisition to the tangible and identifiable intangible assets acquired and liabilities assumed based on their respective fair values at the date of acquisition. The fair value of identifiable intangible assets is based upon detailed valuations that use various assumptions made by management. Any excess of the purchase price over the fair value of the net tangible and intangible assets acquired is allocated to goodwill.

72
Amortizing Intangible Assets – Acquired intangible assets other than goodwill and trademark and tradenames consist primarily of purchased technology, patents and customer lists. The Company amortizes its definite-lived intangible assets on a straight-line basis over their estimated useful lives as follows: purchased technology and patents 5-15 years; customer lists 7-20 years and other intangible assets 1-10 years.
Purchased In-Process Research and Development (“IPR&D”) – When the Company acquires another entity, a portion of the purchase price is allocated, as applicable, to IPR&D. The Company defines IPR&D as the value assigned to those projects for which the related products have not received regulatory approval and have no alternative future use. Determining the portion of the purchase price allocated to IPR&D requires the Company to make significant estimates. The amount of the purchase price allocated to IPR&D is determined by estimating the future cash flows of each project and discounting the net cash flows back to their present values. The discount rate used is determined at the time of acquisition in accordance with accepted valuation methods. These methodologies include consideration of the risk of the project not achieving commercial feasibility.
Impairment of Long-Lived Assets – The Company assesses the impairment of definite lived long-lived assets when events or changes in circumstances indicate that the carrying value of the assets may not be recoverable. Factors that are considered in deciding when to perform an impairment review include significant under-performance of a business or product line in relation to expectations, significant negative industry or economic trends, and significant changes or planned changes in the use of the assets. Recoverability potential is measured by comparing the carrying amount of the asset group to the related total future undiscounted cash flows. If an asset group’s carrying value is not recoverable through related cash flows, the asset group is considered to be impaired. Impairment is measured by comparing the asset group’s carrying amount to its fair value. When it is determined that useful lives of assets are shorter than originally estimated, and there are sufficient cash flows to support the carrying value of the assets, the rate of depreciation is accelerated in order to fully depreciate the assets over their new shorter useful lives. Goodwill and trademarks and tradenames are not amortized but are periodically tested for impairment. The Company assesses goodwill for impairment by comparing the fair value of its reporting units to their carrying amounts on the last day of each fiscal year, or more frequently if certain events occur or circumstances change, to determine if there is potential impairment. If the fair value of a reporting unit is less than its carrying value, an impairment loss is recorded to the extent that the implied fair value of the goodwill within the reporting unit is less than its carrying value. Fair values for reporting units are determined based on discounted cash flows, market multiples or appraised values as appropriate. Indefinite lived intangible assets such as trademarks and tradenames are assessed for impairment on the last day of each fiscal year, or more frequently if certain events occur or circumstances change, by comparing the fair value of the asset to their carrying value. The fair value is determined by using a relief-from-royalty approach. The Company has determined that, based on the impairment tests performed, no impairment of goodwill or trademarks and tradenames have occurred during 2008, 2007 or 2006.

73
Other Assets – Other assets includes deferred costs incurred in connection with the Company’s issuance of its convertible subordinated notes and revolving line of credit. These costs are being amortized using the effective yield method over the period from the date of issuance to the put option date (if applicable) or the contractual maturity date, whichever is earlier. Total net deferred financing fees amounted to $5.0 million at January 2, 2009 and $6.4 million at December 28, 2007. Other assets also include long-term investments in equity securities of entities which the Company does not have the ability to exercise significant influence over and are accounted for using the cost method. Each reporting period, management evaluates these investments to determine if there are any events or circumstances that are likely to have a significant adverse effect on the fair value of the investment. Examples of such impairment indicators include, but are not limited to: a significant deterioration in earnings performance; a significant adverse change in the regulatory, economic or technological environment of an investee; or a significant doubt about an investee’s ability to continue as a going concern. If an impairment indicator is identified, management will estimate the fair value of the investment and compare it to its carrying value. The estimation of fair value considers all available financial information related to the investee, including, but not limited to, valuations based on recent third-party equity investments in the investee. If the fair value of the investment is less than its carrying value, the investment is impaired and a determination as to whether the impairment is other-than-temporary is made. Impairment is deemed to be other-than-temporary unless the Company has the ability and intent to hold the investment for a period sufficient for a market recovery up to the carrying value of the investment. Further, evidence must indicate that the carrying value of the investment is recoverable within a reasonable period. For other-than-temporary impairments, an impairment loss is recognized equal to the difference between the investment’s carrying value and its fair value. The aggregate recorded amount of cost method investments at January 2, 2009 and December 28, 2007 was $10.9 million and $6.8 million, respectively. The Company has determined that these investments are not considered variable interest entities as defined in Financial Accounting Standards Board (“FASB”) Interpretation (“FIN”) 46(R), Consolidation of Variable Interest Entities, an interpretation of ARB No. 51. The Company’s exposure related to these entities is limited to its recorded investment. These investments are in research and development companies whose fair value is subject to future fluctuations, which could be significant. Income Taxes - The consolidated financial statements of the Company have been prepared using the asset and liability approach in accounting for income taxes, which requires the recognition of deferred income taxes for the expected future tax consequences of net operating losses, credits, and temporary differences between the financial statement carrying amounts and the tax bases of assets and liabilities. A valuation allowance is provided on deferred tax assets if it is determined that it is more likely than not that the asset will not be realized. The Company and its domestic subsidiaries file a consolidated U.S. federal income tax return. State tax returns are filed on a combined or separate basis depending on the applicable laws in the jurisdictions where tax returns are filed. The Company also files foreign tax returns on a separate company basis in the countries in which it operates.

74
Beginning in fiscal year 2007, the Company adopted the provisions of FIN No. 48, Accounting for Uncertainty in Income Taxes, an interpretation of FASB SFAS No. 109. FIN No. 48 clarifies the accounting for uncertainty in income taxes recognized under SFAS No. 109. FIN No. 48 prescribes a recognition threshold and measurement attribute for financial statement recognition and measurement of a tax position taken or expected to be taken in a tax return and also provides guidance on various related matters such as derecognition, interest and penalties, and disclosure. Upon adoption of FIN No. 48, the Company did not recognize any adjustment to its $1.8 million of unrecognized tax benefits. The Company recognizes interest expense related to uncertain tax positions as Interest Expense. Penalties, if incurred, are recognized as a component of Selling, General and Administrative Expenses. Derivative Financial Instruments – The Company recognizes all derivative financial instruments in its consolidated financial statements at fair value in accordance with FASB Statement No. 133, Accounting for Derivative Instruments and Hedging Activities. Changes in the fair value of derivative instruments are recorded in earnings unless hedge accounting criteria are met. All of the Company’s derivative financial instruments as of January 2, 2009 are designated as cash flow hedges. There were no derivative financial instruments outstanding as of December 28, 2007. The effective portion of changes in fair value of these cash flow hedges is recorded each period, net of tax, in accumulated other comprehensive income (loss) until the related hedged transaction occurs. Any ineffective portion of changes in fair value of these cash flow hedges is recorded in earnings. Foreign Currency Translation - The Company translates all assets and liabilities of its foreign subsidiaries, where the U.S. dollar is not the functional currency, at the period-end exchange rate and translates income and expenses at the average exchange rates in effect during the period. The net effect of this translation is recorded in the consolidated financial statements as accumulated other comprehensive income (loss). Translation adjustments are not adjusted for income taxes as they relate to permanent investments in the Company’s foreign subsidiaries. Net foreign currency transaction gains and losses included in other income/expense amounted to a gain of $0.1 million for 2008 and were not material for 2007 and 2006. Revenue Recognition - Revenue from the sale of products is recognized at the time the product is shipped and title passes to our customers. The Company includes shipping and handling fees billed to customers in sales. Shipping and handling costs associated with inbound and outbound freight are generally recorded in cost of sales. In certain instances the Company obtains component parts for sub-assemblies from its customers that are included in the final product. These amounts were excluded from sales and cost of sales recognized by the Company. The cost of these customer supplied component parts amounted to $35.1 million, $35.1 million and $18.8 million in 2008, 2007 and 2006, respectively. Product Warranties – The Company allows customers to return defective or damaged products for credit, replacement, or exchange. The Company generally warrants that its products will meet customer specifications and will be free from defects in materials and workmanship. The Company accrues its estimated exposure to warranty claims based upon recent historical experience and other specific information as it becomes available.

75
Research and Development and Engineering Costs – Research and development costs are expensed as incurred. The primary costs are salary and benefits for personnel. Engineering costs are expensed as incurred. Cost reimbursements for engineering services from customers for whom the Company designs products are recorded as an offset to engineering costs upon achieving development milestones specified in the contracts.
Net research, development and engineering costs are comprised of the following (in thousands):
January 2, December 28, December 29,2009 2007 2006
Research and development costs 18,750$ 16,141$ 16,096$
Engineering costs 22,447 18,929 9,888 Less: cost reimbursements (9,753) (5,156) (1,759)
Engineering costs, net 12,694 13,773 8,129 Total research, development and engineering costs, net 31,444$ 29,914$ 24,225$
Year Ended
Stock-Based Compensation - The Company records compensation costs related to stock-based awards in accordance with SFAS No. 123 (revised 2004), Share-Based Payment (“SFAS No. 123(R)”), and related Securities and Exchange Commission (“SEC”) rules included in Staff Accounting Bulletin (“SAB”) No. 107. Under the fair value recognition provisions of SFAS No. 123(R), the Company measures stock-based compensation cost at the grant date based on the estimated fair value of the award. Compensation cost for service-based awards is recognized ratably over the applicable vesting period. Compensation cost for performance-based awards is reassessed each period and recognized based upon the probability that the performance targets will be achieved. The Company utilizes the Black-Scholes option pricing model to estimate the fair value of stock options granted. For restricted stock and restricted stock unit awards, the fair market value of the award is determined based upon the closing value of the Company’s stock price on the grant date. The amount of stock-based compensation expense recognized during a period is based on the portion of the awards that are ultimately expected to vest. The Company estimates pre-vesting forfeitures at the time of grant by analyzing historical data and revises those estimates in subsequent periods if actual forfeitures differ from those estimates. The total expense recognized over the vesting period will only be for those awards that ultimately vest. Defined Benefit Pension Plans - In connection with the Precimed and Chaumont Facility acquisitions, the Company recorded a pension liability related to defined benefit pension plans provided to non-U.S. employees of those businesses. The Company accounts for these pension plans in accordance with SFAS No. 158, Employers’ Accounting for Defined Benefit Pension and Other Postretirement Plans. This Statement requires an employer to recognize in its balance sheet as an asset or liability the overfunded or underfunded status of a defined benefit pension plan, measured as the difference between the fair value of plan assets and the benefit obligation. For a pension plan, the benefit obligation is the projected benefit obligation which is calculated based on actuarial computations of current and future benefits for employees. SFAS No. 158 requires that gains or losses and prior service costs or credits that arise during the period, but are not included as components of net periodic benefit expense, be recognized as a component of accumulated other Comprehensive income. Pension expense is charged to current operating expenses.

76
Earnings Per Share - Basic earnings per share is calculated by dividing net income by the weighted average number of shares outstanding during the period. Diluted earnings per share is calculated by adjusting for potential common shares, which consist of stock options, unvested restricted stock and restricted stock units and contingently convertible instruments. Holders of the Company’s convertible subordinated notes may convert them into shares of the Company’s common stock under certain circumstances (see Note 8 – “Debt”). The Company includes the effect of the conversion of these convertible notes in the calculation of diluted earnings per share using the if-converted method or the treasury method for instruments that may be settled in cash at the Company’s election and which the Company has the ability and intent to settle them in cash, as long as the effect is dilutive. For computation of earnings per share under conversion conditions, the number of diluted shares outstanding increases by the amount of shares that are potentially convertible during that period. Also, net income is adjusted for the calculation to add back interest expense on the convertible notes as well as unamortized discount and deferred financing fees amortization recorded during the period. The following table reflects the calculation of basic and diluted earnings per share (in thousands, except per share amounts):
January 2, December 28, December 29,2009 2007 2006
Numerator for basic earnings per share: Income from continuing operations 18,559$ 15,050$ 16,126$ Effect of dilutive securities:
Interest expense on convertible notes and related deferred financing fees, net of tax 871 - 3,064
Numerator for diluted earnings per share 19,430$ 15,050$ 19,190$
Denominator for basic earnings per share:Weighted average shares outstanding 22,525 22,152 21,803
Effect of dilutive securities:Convertible notes 1,267 - 4,219 Stock options and unvested restricted stock 336 270 312
Dilutive potential common shares 1,603 270 4,531 Denominator for diluted earnings per share 24,128 22,422 26,334
Basic earnings per share 0.82$ 0.68$ 0.74$ Diluted earnings per share 0.81$ 0.67$ 0.73$
Year Ended
The diluted weighted average share calculations do not include the following as they are not dilutive to the earnings per share calculations or the respective performance criteria have not been met as of the reporting date:
January 2, December 28, December 29,2009 2007 2006
Time based stock options and restricted stock 1,500,000 664,000 1,084,000Performance based stock options and
restricted stock units 515,000 287,000 215,000Convertible subordinated notes - 2,027,000 -
Year Ended

77
Comprehensive Income - The Company’s comprehensive income as reported in the Consolidated Statements of Operations and Comprehensive Income includes net income, foreign currency translation gains (losses), unrealized gain (loss) on its interest rate swaps, the net unrealized gain (loss) on short-term investments available for sale, adjusted for any realized gains/losses, and the overfunded or underfunded status of the Company’s defined benefit pension plans. Accumulated other comprehensive loss is comprised of the following (in thousands):
Pre-tax Tax Net-of-taxamount amount amount
Balance at December 28, 2007 - - - Foreign currency translation adjustment (228) - (228) Unrealized loss on interest rate swaps (1,394) 488 (906) Defined benefit pension plan liability adjustment (2,513) 571 (1,942) Balance at January 2, 2009 (4,135)$ 1,059$ (3,076)$
Supplemental Cash Flow Information (in thousands):
January 2, December 28, December 29,2009 2007 2006
Cash paid during the year for: Interest 10,021$ 5,325$ 3,888$ Income taxes 3,811 17,341 2,867 Noncash investing and financing activities:
Net unrealized gain (loss) on available-for-sale securities -$ (923)$ 3,594$
Unrealized loss on interest rate swaps, net (906) - - Common stock contributed to 401(k) Plan 3,472 2,956 2,780 Property, plant and equipment purchases
included in accounts payable 2,762 3,307 808 Unsettled purchase of treasury stock 741 140 205 Exchange of convertible subordinated notes - 117,782 - Shares issued in connection with business
acquisition 1,473 - - Acquisition of non-cash assets and liabilities:
Assets acquired 169,508$ 209,946$ -$ Liabilities assumed 58,693 20,395 -
Year Ended
Use of Estimates - The preparation of financial statements in conformity with accounting principles generally accepted in the United States of America requires management to make estimates and assumptions that affect the reported amounts of assets and liabilities and disclosure of contingent assets and liabilities at the date of the financial statements and reported amounts of sales and expenses during the reporting period. Actual results could differ materially from those estimates.

78
Recent Accounting Pronouncements — In June 2008, the Emerging Issues Task Force (“EITF”) issued EITF 07-5, Determining Whether an Instrument (or Embedded Feature) Is Indexed to an Entity's Own Stock. This Issue prescribes a two step process for determining whether an instrument (or an embedded feature), such as the Company’s convertible subordinated notes, is indexed to the Company’s own stock as follows: Step 1: if the instrument is not based on (a) an observable market, other than the market for the issuer's stock, or (b) an observable index, other than an index calculated or measured solely by reference to the issuer's own operations then the instrument is considered indexed to its own stock. Step 2: if the instrument settlement amount is fixed then the instrument is considered indexed to its own stock. If the Company determines that its convertible subordinated notes are not indexed to its own stock, they would not meet the scope exception in paragraph 11(a) of SFAS No. 133 and thus would be accounted for under SFAS No. 133. The Company is still evaluating the impact of EITF 07-5 on its consolidated financial statements, which is effective beginning in fiscal year 2009. In June 2008, the FASB issued Staff Position (“FSP”) EITF 03-6-1, “Determining Whether Instruments Granted in Share-Based Payment Transactions Are Participating Securities.” This FSP concluded that all outstanding unvested share-based payment awards (restricted stock) that contain rights to nonforfeitable dividends are considered participating securities. Accordingly, the two-class method of computing basic and diluted EPS is required for these securities. FSP 03-6-1, which was effective beginning in fiscal year 2009, did not have a material impact on the Company’s consolidated financial statements and will be applied retrospectively to all periods presented in future financial statements. In May 2008, the FASB issued FSP APB 14-1, “Accounting for Convertible Debt Instruments that May be Settled in Cash Upon Conversion (Including Partial Cash Settlement).” This FSP requires issuers of convertible debt instruments that may be settled in cash upon conversion (including partial cash settlement) separately account for the liability and equity components of those instruments in a manner that will reflect the entity’s nonconvertible debt borrowing rate when interest cost is recognized in subsequent periods. This statement is effective beginning in fiscal year 2009 and will be applied retrospectively to all periods presented in future financial statements. This FSP is only applicable prospectively if the Company determines that its convertible subordinated notes are indexed to its own stock under the guidance of EITF 07-5. The Company estimates that this FSP, if applicable, will increase 2009 non-cash interest expense by approximately $7 million to $8 million and reduce 2009 diluted EPS by approximately $0.19 per share to $0.22 per share. In March 2008, the FASB issued SFAS No. 161, Disclosures about Derivative Instruments and Hedging Activities. SFAS No. 161 amends and expands the disclosure requirements of SFAS No. 133, and requires entities to provide enhanced qualitative disclosures about objectives and strategies for using derivatives, quantitative disclosures about fair values and amounts of gains and losses on derivative contracts, and disclosures about credit-risk-related contingent features in derivative agreements. The Company will make the required disclosures beginning in 2009. In December 2007, the FASB issued SFAS No. 141(R), Business Combinations. This Statement replaces FASB Statement No. 141, Business Combinations but retains the guidance in SFAS No. 141 for identifying and recognizing intangible assets separately from goodwill. However, SFAS No. 141(R) significantly changed the accounting for business combinations with regards to the number of assets and liabilities assumed that are to be measured at fair value, the accounting for

79
contingent consideration and acquired contingencies as well as the accounting for direct acquisition costs and IPR&D. SFAS No. 141(R) is effective for acquisitions consummated beginning in fiscal year 2009 and will materially impact the Company’s consolidated financial statements if an acquisition is consummated after the date of adoption. SFAS No. 141(R) provides that any changes to an entity’s acquired uncertain tax positions and valuation allowances associated with acquired deferred tax assets will no longer be applied to goodwill, regardless of the acquisition date of the associated business combination. Any changes to the acquired uncertain tax positions and valuation allowances will be recognized as an adjustment to income tax expense. In December 2007, the FASB issued SFAS No. 160, Noncontrolling Interests in Consolidated Financial Statements—an amendment of ARB No. 51. This Statement amends Accounting Research Bulletin No. 51 to establish accounting and reporting standards for the noncontrolling interest in a subsidiary and for the deconsolidation of a subsidiary. SFAS No. 160 did not have a material impact on the Company’s consolidated financial statements, which was effective beginning in fiscal year 2009. In September 2006, the FASB issued SFAS No. 157, Fair Value Measurements. This Statement defines fair value, establishes a framework for measuring fair value while applying U.S. GAAP, and expands disclosures about fair value measurements. SFAS No. 157 establishes a fair value hierarchy that distinguishes between (1) market participant assumptions based on market data obtained from independent sources and (2) the reporting entity’s own assumptions developed based on unobservable inputs. In February 2008, the FASB issued FSP FAS 157-b—Effective Date of FASB Statement No. 157. This FSP (1) partially deferred the effective date of SFAS No. 157 for one year for certain nonfinancial assets and nonfinancial liabilities and (2) removed certain leasing transactions from the scope of SFAS No. 157. Effective in fiscal year 2008, the Company adopted the provisions of SFAS No. 157 for all financial assets and financial liabilities and nonfinancial assets and nonfinancial liabilities that are recognized or disclosed at fair value on a recurring basis. The provisions of SFAS No. 157 that were effective in 2009, did not materially impact the Company’s consolidated financial statements.
2. ACQUISITIONS
P Medical Holding SA - On January 7, 2008, the Company acquired P Medical Holding SA (“Precimed”) with administrative offices in Orvin, Switzerland and Exton, PA, manufacturing operations in Switzerland and Indiana and sales offices in Japan, China and the United Kingdom. This transaction diversified the Company’s revenue and established the Company as a leading supplier to the orthopedics industry.
This transaction was accounted for under the purchase method of accounting. Accordingly, the results of Precimed’s operations were included in the consolidated financial statements from the date of acquisition. The aggregate purchase price was $85.0 million, consisting of the cash issued at closing to Precimed shareholders ($82.4 million), and other direct acquisition-related costs, including financial advisory, legal and accounting services ($2.6 million). Additionally, the purchase agreement included a contingent payment which ranged from 0 to 12,000,000 Swiss Francs (“CHF”) depending on Precimed’s 2008 earnings performance. Based upon the final contingent earn-out calculation, no contingent payment was made. During 2008, a $2.6 million contingent payment was made relating to an acquisition consummated by Precimed in 2006. The purchase price was funded with cash on hand and borrowings under the Company’s revolving credit agreement. Concurrently with the closing of the transaction, the Company immediately repaid $31.6 million of Precimed’s long-term debt.

80
The cost of the acquisition was allocated to the assets acquired and liabilities assumed from Precimed based on their fair values as of the acquisition date, with the amount exceeding the fair value recorded as goodwill. The fair values of the assets acquired were determined using one of three valuation approaches: market, income and cost. The selection of a particular method for a given asset depended on the reliability of available data and the nature of the asset, among other considerations. The market approach, which estimates the value for a subject asset based on available market pricing for comparable assets, was utilized for land and in-process and finished inventory. The income approach, which estimates the value for a subject asset based on the present value of cash flows projected to be generated by the asset, was used for certain intangible assets such as technology and patents, customer relationships, trademarks and tradenames, IPR&D and for the noncompete agreements with employees. The projected cash flows were discounted at a required rate of return that reflects the relative risk of the Precimed transaction and the time value of money. The projected cash flows for each asset considered multiple factors, including current revenue from existing customers, attrition trends, reasonable contract renewal assumptions from the perspective of a marketplace participant, and expected profit margins giving consideration to historical and expected margins. The cost approach was used for the majority of real and personal property and raw materials inventory. The cost to replace a given asset reflects the estimated reproduction or replacement cost for the property, less an allowance for loss in value due to depreciation or obsolescence, with specific consideration given to economic obsolescence if indicated. The following table summarizes the final allocation of the cost of the acquisition to the assets acquired and liabilities assumed as of the close of the acquisition (in thousands):
As of(in thousands) January 7, 2008Assets acquired Current assets 33,982$ Property, plant and equipment 25,070 Acquired IPR&D 2,240 Amortizing intangible assets 29,355 Trademarks and tradenames 3,514 Goodwill 47,160 Other assets 1,720 Total assets acquired 143,041 Liabilities assumed Current liabilities 25,421 Long-term liabilities 32,599 Total liabilities assumed 58,020 Purchase price 85,021$
Current assets and current liabilities – The fair value of current assets (except inventory) and current liabilities was assumed to approximate their carrying value as of the acquisition date due to the short-term nature of these assets and liabilities. The fair value of the in-process and finished inventory acquired was estimated by applying a version of the market approach called the comparable sales method. This approach estimates the fair value of the asset by calculating the potential sales generated from selling the inventory and subtracting from it the costs related to the completion and sale of that inventory and a reasonable

81
profit allowance. Based upon this methodology, the Company recorded the inventory acquired at fair value resulting in an increase in inventory of $5.6 million. During the first quarter of 2008, the Company expensed the entire step-up value as cost of sales as the acquired Precimed inventory to which that step-up value was related was sold during that period. Raw materials inventory was valued at replacement cost. Property, plant and equipment (“PP&E”) - The fair value of the PP&E acquired was estimated by applying the cost approach for personal property, buildings and building improvements and the market approach for land. The cost approach was applied by developing a replacement cost and adjusting for depreciation and obsolescence. The value of the land acquired was derived from market prices for comparable properties. Intangible assets - The purchase price was allocated to specific intangible assets as follows (dollars in thousands):
Fair value
assigned
Weighted average
amortization period (years)
Weighted average discount
rate Amortizing intangible assets Customer relationships $ 16,564 20 13% Technology and patents 11,771 15 14% Noncompete agreements 1,020 5 13% $ 29,355 17 13% Trademarks and tradenames $ 3,514 indefinite 13% Acquired IPR&D $ 2,240 - 14%
Customer relationships – Customer relationships represent the estimated fair value of both the contractual and non-contractual customer relationships Precimed has as of the acquisition date. The primary customers of Precimed include Johnson & Johnson, Smith & Nephew, Stryker, Medtronic and Zimmer, some of which are also customers of Greatbatch. These relationships were valued separately from goodwill at the amount which an independent third party would be willing to pay for these relationships. The fair value of customer relationships was determined using the multi-period excess-earnings method, a form of the income approach. The Company determined that the estimated useful life of the intangible assets associated with the existing customer relationships is approximately 20 years. This life was based upon historical customer attrition and management’s understanding of the industry and regulatory environment. The expected cash flows associated with these customer relationships were nominal after 20 years.
Technology and patents - Technology and patents consists of technical processes, patented and unpatented technology, manufacturing know-how and the understanding with respect to products or processes that have been developed by Precimed and that will be leveraged in current and future products. The fair value of technology and patents acquired was determined utilizing the relief from royalty method. The Company determined that the estimated useful life of the technology and patents is approximately 15 years. This life is based upon management’s estimate of the product life cycle associated with technology and patents before they will be replaced by new technologies. The expected cash flows associated with technology and patents were nominal after 15 years.

82
Trademarks and tradenames – Trademarks and tradenames represent the estimated fair value of corporate and product names acquired from Precimed, which will be utilized by the Company in the future. These tradenames were valued separately from goodwill at the amount which an independent third party would be willing to pay for use of these names. The fair value of the trademarks and tradenames was determined by applying the relief from royalty method of the income approach. The tradenames are inherently valuable as the Company believes they convey favorable perceptions about the products with which they are associated. This in turn generates consistent and increased demand for the products, which provides the Company with greater revenues, as well as greater production and operating efficiencies. Thus, the Company will realize larger profit margins than companies without the tradenames. At this time, the Company intends to utilize these trademarks and tradenames for an indefinite period of time given that Greatbatch is new to the orthopedics market and is not well known in that industry. Thus these intangible assets are not being amortized but are tested for impairment on an annual basis. Acquired IPR&D - Approximately $2.2 million of the purchase price represents the fair value of acquired IPR&D projects that had not yet reached technological feasibility and had no alternative future use. Accordingly, the amount was immediately expensed on the acquisition date and is not deductible for tax purposes. The value assigned to IPR&D related to Reamer, Instrument Kit, Locking Plate and Cutting Guide projects. These projects primarily represent the next generation of products already being sold by Precimed which incorporate new enhancements and customer modifications. The commercial launch of these products was assumed to be in 2008 and 2009. For purposes of valuing the IPR&D, the Company estimated total costs to complete the projects to be approximately $0.2 million. If the Company is not successful in completing these projects, future sales may be adversely affected resulting in erosion of the Company’s market share. The fair value of these projects was determined based on the excess earnings method. This model utilized discount rates that took into consideration the internal rate of return expected from the Precimed transaction and the risks surrounding the successful development and commercialization of each of the IPR&D projects. The Company believes that the estimated acquired IPR&D amounts represent their fair value at the date of acquisition and do not exceed the amount an independent third party would be willing to pay for the projects. Goodwill - The excess of the purchase price over the fair value of net tangible and intangible assets acquired of $47.2 million was allocated to goodwill. Various factors contributed to the establishment of goodwill, including: the value of Precimed’s highly trained assembled work force and management team; the expected revenue growth over time that is attributable to increased market penetration from future products and customers; and the incremental value to the Company’s IMC business from expanding and diversifying its revenues. The goodwill acquired in connection with the Precimed acquisition was allocated to the Company’s IMC business segment and is not deductible for tax purposes. DePuy Orthopaedics Chaumont, France Facility - On February 11, 2008, Precimed acquired the assets of DePuy Orthopaedics (“DePuy”) Chaumont, France manufacturing facility (the “Chaumont Facility”). The Chaumont Facility produces hip and shoulder implants for DePuy Ireland which distributes them worldwide through various DePuy selling entities. This transaction, which included a new four year supply agreement with DePuy, enhances Greatbatch’s and Precimed’s strategic relationship with DePuy, one of the largest orthopedic companies in the world. The addition of this facility will align Precimed closer to its orthopedic customers and further extends its offerings to a full range of orthopedic implants.

83
This transaction was accounted for under the purchase method of accounting. Accordingly, the results of the Chaumont Facility were included in our consolidated financial statements from the date of acquisition. The aggregate purchase price was $28.7 million, consisting of the cash issued to DePuy ($27.0 million), and other direct acquisition-related costs, including financial advisory, transfer tax, legal and accounting fees ($1.7 million). The aggregate purchase price was allocated to the assets acquired ($6.3 million inventory, $13.4 million PP&E) and pension liability assumed from the Chaumont Facility based on their fair values as of the close of the acquisition, with the amount exceeding the fair value recorded as goodwill ($6.6 million).
Various factors contributed to the establishment of goodwill, including: the value of the Chaumont Facility’s highly trained assembled work force; the expected revenue growth over time and the incremental value to the Company’s Orthopedics business from having the capability to manufacture joint implants; and the strategic partnership established with DePuy, one of the largest orthopedic companies in the world. Goodwill resulting from the Chaumont Facility acquisition was allocated to the Company’s IMC business segment and is not deductible for tax purposes.
Pro Forma Results (Unaudited) - The following unaudited pro forma information presents the consolidated results of operations of the Company, Precimed, and the Chaumont Facility as if those acquisitions had occurred as of the beginning of each of the fiscal years presented. Additionally, 2007 amounts reflect the Company’s 2007 acquisition of Enpath (June 2007), Quan (November 2007) and EAC (November 2007) as if those acquisitions had occurred as of the beginning of 2007 (in thousands, except per share amounts):
Year Ended
(Unaudited) January 2,
2009 December 28,
2007
Sales $ 555,139 $ 502,043 Net income 24,539 18,713 Earnings per share:
Basic $1.09 $0.84 Diluted $1.05 $0.82
The unaudited pro forma information presents the combined operating results of Greatbatch, Precimed, the Chaumont Facility, Enpath, Quan and EAC, with the results prior to the acquisition date adjusted to include the pro forma impact of the amortization of acquired intangible assets and depreciation of fixed assets based on the purchase price allocation, the elimination of non-recurring IPR&D charges ($2.2 million in 2008 and $13.8 million in 2007) and inventory step-up amortization recorded by Greatbatch ($6.4 million in 2008 and $1.7 million in 2007), the adjustment to interest income/expense reflecting the cash paid in connection with the acquisition, including acquisition-related expenses, at Greatbatch’s weighted average interest income/expense rate, and the impact of income taxes on the pro forma adjustments utilizing the applicable statutory tax rate, except for IPR&D which is not deductible for tax purposes. The unaudited pro forma consolidated basic and diluted earnings per share are based on the consolidated basic and diluted weighted average shares of Greatbatch.
The unaudited pro forma results are presented for illustrative purposes only and do not reflect the realization of potential cost savings, and any related integration costs. Certain cost savings may result from the acquisition; however, there can be no assurance that these cost savings will be achieved. These pro forma results do not purport to be indicative of the results that would have been obtained, or to be a projection of results that may be obtained in the future.

84
3. SHORT-TERM INVESTMENTS
Short-term investments available for sale are comprised of the following (in thousands):
Cost
Gross unrealized
gains
Gross unrealized
lossesEstimated fair
valueDecember 28, 2007Commercial Paper 1,087$ 5$ -$ 1,092$ U.S. Government Agencies 1,469 4 - 1,473 Corporate Bonds 4,452 4 (4) 4,452 Total short-term investments 7,008$ 13$ (4)$ 7,017$
The Company did not hold any short-term investments as of January 2, 2009. During 2007, the Company sold an equity security investment which resulted in a pre-tax gain of $4.0 million.
4. INVENTORIES
Inventories are comprised of the following (in thousands):
January 2, December 28, 2009 2007
Raw material 58,352$ 38,561$ Work-in-process 28,851 19,603 Finished goods 25,101 13,718
Total 112,304$ 71,882$
5. PROPERTY, PLANT AND EQUIPMENT
Property, plant and equipment are comprised of the following (in thousands):
January 2, December 28, 2009 2007
Manufacturing machinery and equipment 109,911$ 80,447$ Buildings and building improvements 68,346 35,611 Information technology hardware and software 27,558 21,671 Construction work in process 17,452 23,115 Leasehold improvements 17,031 19,957 Land and land improvements 11,671 6,024 Furniture and fixtures 9,488 5,345 Other 662 210
262,119 192,380 Accumulated depreciation (95,451) (77,434) Total 166,668$ 114,946$
Depreciation expense for property, plant and equipment during 2008, 2007 and 2006 was $25.5 million, $16.4 million and $14.8 million, respectively.

85
6. INTANGIBLE ASSETS
Amortizing intangible assets are comprised of the following (in thousands):
Gross carrying amount
Accumulated amortization
Foreign currency
translationNet carrying
amount
Purchased technology and patents 81,639$ (35,881)$ 184$ 45,942$ Customer lists 46,547 (4,056) 271 42,762 Other 3,508 (1,964) 11 1,555 Total amortizing intangible assets 131,694$ (41,901)$ 466$ 90,259$
Purchased technology and patents 69,813$ (28,968)$ -$ 40,845$ Customer lists 29,983 (840) - 29,143 Other 2,660 (1,380) - 1,280 Total amortizing intangible assets 102,456$ (31,188)$ -$ 71,268$
December 28, 2007
January 2, 2009
Intangible amortization expense was $10.7 million, $5.6 million and $3.8 million for 2008, 2007 and 2006, respectively. Prior to 2007, all intangible amortization expense was included in Cost of Sales. Intangible amortization expense included in Selling, General and Administrative Expenses related to the customer lists and non-compete agreements acquired in 2008 and 2007 was $3.9 million and $1.0 million, respectively. Annual intangible amortization expense is estimated to be $10.0 million for 2009, $9.5 million for 2010, $9.4 million for 2011, $9.3 million for 2012 and $8.5 million for 2013. The change in trademarks and tradenames during 2008 is as follows (in thousands):
Balance at December 28, 2007 32,582$ Acquired in 2008 3,514 Foreign currency translation 34 Balance at January 2, 2009 36,130$
The Company is currently performing a review of its market strategy to determine the best use of its “non-Greatbatch” tradenames, including those acquired with its recent acquisitions. The outcome of this review, which is expected to be completed in 2009, may impact the useful lives of the Company’s “non-Greatbatch” tradenames which had a value of $20.3 million as of January 2, 2009. The change in goodwill during 2008 is as follows (in thousands):
IMC Electrochem TotalBalance at December 28, 2007 238,810$ 9,730$ 248,540$ Adjustments to goodwill related to 2007 acquisitions (118) 213 95 Goodwill recorded for 2008 acquisitions 53,760 - 53,760 Foreign currency translation (174) - (174) Balance at January 2, 2009 292,278$ 9,943$ 302,221$

86
7. ACCRUED EXPENSES AND OTHER CURRENT LIABILITIES
Accrued expenses and other current liabilities are comprised of the following (in thousands):
January 2, December 28, 2009 2007
Salaries and benefits 11,757$ 10,655$ Profit sharing and bonuses 14,860 13,669 Warranty 1,395 1,454 Other 12,485 5,197 Total 40,497$ 30,975$
8. DEBT
Long-term debt is comprised of the following (in thousands):
January 2, December 28, 2009 2007
Revolving line of credit 132,000$ -$ 2.25% convertible subordinated notes I, due 2013 30,450 52,2182.25% convertible subordinated notes II, due 2013 197,782 197,782Unamortized discount (7,312) (8,802)
Total long-term debt 352,920$ 241,198$
Revolving Line of Credit - The Company has a senior credit facility (the “Credit Facility”) consisting of a $235 million revolving line of credit, which can be increased to $335 million upon the Company’s request. The Credit Facility also contains a $15 million letter of credit subfacility and a $15 million swingline subfacility. The Credit Facility is secured by the Company’s non-realty assets including cash, accounts and notes receivable, and inventories, and has an expiration date of May 22, 2012 with a one-time option to extend to April 1, 2013 if no default has occurred. Interest rates under the Credit Facility are, at the Company’s option, based upon the current prime rate or the LIBOR rate plus a margin that varies with the Company’s leverage ratio. If interest is paid based upon the prime rate, the applicable margin is between minus 1.25% and 0.00%. If interest is paid based upon the LIBOR rate, the applicable margin is between 1.00% and 2.00%. The Company is required to pay a commitment fee between 0.125% and 0.250% per annum on the unused portion of the Credit Facility based on the Company’s leverage ratio. The Credit Facility contains limitations on the incurrence of indebtedness, limitations on the incurrence of liens and licensing of intellectual property, limitations on investments and restrictions on certain payments. Except to the extent paid for by the common equity of Greatbatch or paid for out of cash on hand, the Credit Facility limits the amount paid for acquisitions in total to $100 million. The restrictions on payments, among other things, limit repurchases of Greatbatch’s stock to $60 million and the ability of the Company to make cash payments upon conversion of CSN II (as defined below) and dividends. These limitations can be waived upon the Company’s request and approval of a simple majority of the lenders. Such waiver was obtained in order to fund the Precimed acquisition and repurchase the Company’s convertible subordinated notes in 2008.

87
The Credit Facility also requires the Company to maintain a ratio of adjusted EBITDA, as defined in the credit agreement, to interest expense of at least 3.00 to 1.00, and a total leverage ratio, as defined in the credit agreement, of not greater than 5.00 to 1.00 from May 22, 2007 through September 29, 2009 and not greater than 4.50 to 1.00 from September 30, 2009 and thereafter. As of January 2, 2009, the Company was in compliance with the required covenants. The Credit Facility contains customary events of default. Upon the occurrence and during the continuance of an event of default, a majority of the lenders may declare the outstanding advances and all other obligations under the Credit Facility immediately due and payable. In connection with the Company’s acquisition of Precimed and the Chaumont Facility, the Company borrowed $117 million under its revolving line of credit in the first quarter of 2008. The Company borrowed an additional net $15.0 million under the revolving line of credit since that time in order to fund the repurchase of CSN I as discussed below. The weighted average interest rate on these borrowings as of January 2, 2009, which does not include the impact of the interest rate swaps described below, was 3.8%. Interest rates reset based upon the six-month ($105 million), three-month ($8 million), two-month ($13 million) and one-month ($6 million) LIBOR rate. Based upon current capital needs, management does not anticipate making significant principal payments on the revolving line of credit within the next twelve months. As of January 2, 2009, the Company had $103 million available under its revolving line of credit. The carrying amount of credit facility borrowings approximates their fair values at January 2, 2009 given their variable interest rates. Interest Rate Swaps – During 2008, the Company entered into three receive floating-pay fixed interest rate swaps indexed to the six-month LIBOR rate. The objective of these swaps is to hedge against potential changes in cash flows on the Company’s outstanding revolving line of credit, which is also indexed to the six-month LIBOR rate. No credit risk was hedged. The receive variable leg of the swaps and the variable rate paid on the revolving line of credit bear the same rate of interest, excluding the credit spread, and reset and pay interest on the same dates. The Company intends to continue electing the six-month LIBOR as the benchmark interest rate on the debt being hedged. If the Company repays the debt it intends to replace the hedged item with similarly indexed forecast cash flows. Information regarding the Company’s outstanding interest rate swaps is as follow:
Current FairPay receive value
Type of Notional Start End fixed floating January 2,Instrument hedge amount date date rate rate 2009
(In thousands) (In thousands)Interest rate swap Cash flow 80,000$ 3/5/2008 7/7/2010 3.09% 3.14% (1,484)$ Interest rate swap Cash flow 18,000 12/18/2008 12/18/2010 2.00% 2.17% - Interest rate swap Cash flow 50,000 7/7/2010 7/7/2011 2.16% 6M LIBOR 90
148,000$ 2.64% (1,394)$
The estimated fair value of the interest rate swap agreement represents the amount the Company expects to receive (pay) to terminate the contracts. No portion of the change in fair value of the interest rate swaps during 2008 was considered ineffective. The amount recorded as an offset to interest expense in 2008 related to the interest rate swaps was $0.4 million.

88
Convertible Subordinated Notes - In May 2003, the Company completed a private placement of $170 million of 2.25% convertible subordinated notes, due 2013 (“CSN I”). In November 2003, the Company had a registration statement with the SEC declared effective with respect to these notes and the underlying common stock. In March 2007, the Company entered into separate, privately negotiated agreements to exchange $117.8 million of CSN I for an equivalent principal amount of a new series of 2.25% convertible subordinated notes due 2013 (“CSN II”) (collectively the “Exchange”) at a 5% discount. The primary purpose of the Exchange was to eliminate the June 15, 2010 call and put option that is included in the terms of CSN I. In connection with the Exchange, the Company issued an additional $80 million aggregate principal amount of CSN II at a price of $950 per $1,000 of principal. In June 2007, the Company had a registration statement with the SEC declared effective with respect to these notes and the underlying common stock. The Exchange was accounted for as an extinguishment of debt and resulted in a pre-tax gain of $4.5 million. As a result of the extinguishment, the Company had to recapture the tax interest expense that was previously deducted on the extinguished notes. This resulted in an additional current income tax liability of approximately $11.3 million, which was paid in 2007. This amount was previously recorded as a non-current deferred tax liability on the balance sheet. In December 2008 the Company entered into privately negotiated agreements under which it repurchased $21.8 million in aggregate principal amount of its outstanding CSN I at $845.38 per $1,000 of principal. The primary purpose of this transaction was to retire the debentures, which contained a put option exercisable on June 15, 2010, at a discount. This transaction was funded with availability under the Company’s existing line of credit. This transaction was accounted for as an extinguishment of debt and resulted in a pre-tax gain of $3.2 million. As a result of the extinguishment, the Company had to recapture the tax interest expense that was previously deducted on the extinguished notes. This resulted in an additional current income tax liability of approximately $3.2 million, which will be paid in the first quarter of 2009. This amount was previously recorded as a non-current deferred tax liability on the balance sheet. The following is a summary of the significant terms of CSN I and CSN II:
CSN I - The notes bear interest at 2.25% per annum, payable semi-annually. Holders may convert the notes into shares of the Company’s common stock at a conversion rate of 24.8219 shares per $1,000 of principal, subject to adjustment, before the close of business on June 15, 2013 only under the following circumstances: (1) during any fiscal quarter commencing after July 4, 2003, if the closing sale price of the Company’s common stock exceeds 120% of the $40.29 conversion price for at least 20 trading days in the 30 consecutive trading day period ending on the last trading day of the preceding fiscal quarter; (2) subject to certain exceptions, during the five business days after any five consecutive trading day period in which the trading price per $1,000 of principal for each day of such period was less than 98% of the product of the closing sale price of the Company’s common stock and the number of shares issuable upon conversion of $1,000 of principal; (3) if the notes have been called for redemption; or (4) upon the occurrence of certain corporate events.

89
Beginning June 20, 2010, the Company may redeem any of the notes at a redemption price of 100% of their principal amount, plus accrued interest. Note holders may require the Company to repurchase their notes on June 15, 2010 or at any time prior to their maturity following a fundamental change, as defined in the indenture agreement, at a repurchase price of 100% of their principal amount, plus accrued interest. The notes are subordinated in right of payment to all of our senior indebtedness and effectively subordinated to all debts and other liabilities of the Company’s subsidiaries. Beginning with the six-month interest period commencing June 15, 2010, the Company will pay additional contingent interest during any six-month interest period if the trading price of the notes for each of the five trading days immediately preceding the first day of the interest period equals or exceeds 120% of the principal amount of the notes. CSN II - The notes bear interest at 2.25% per annum, payable semi-annually. The holders may convert the notes into shares of the Company’s common stock at a conversion price of $34.70 per share, which is equivalent to a conversion ratio of 28.8219 shares per $1,000 of principal. The conversion price and the conversion ratio will adjust automatically upon certain changes to the Company’s capitalization. CSN II notes were issued at a price of $950 per $1,000 of principal. The effective interest rate of CSN II notes, which takes into consideration the amortization of the discount and deferred fees related to the issuance of those notes, was 3.55%. The notes are convertible at the option of the holders at such time as: (i) the closing price of the Company’s common stock exceeds 150% of the conversion price of the notes for 20 out of 30 consecutive trading days; (ii) the trading price per $1,000 of principal is less than 98% of the product of the closing sale price of common stock for each day during any five consecutive trading day period and the conversion rate per $1,000 of principal; (iii) the notes have been called for redemption; (iv) the Company distributes to all holders of common stock rights or warrants entitling them to purchase additional shares of common stock at less than the average closing price of common stock for the ten trading days immediately preceding the announcement of the distribution; (v) the Company distributes to all holders of common stock any form of dividend which has a per share value exceeding 5% of the price of the common stock on the day prior to such date of distribution; (vi) the Company affects a consolidation, merger, share exchange or sale of assets pursuant to which its common stock is converted to cash or other property; (vii) the period beginning 60 days prior to but excluding June 15, 2013; and (viii) certain fundamental changes, as defined in the indenture agreement, occur or are approved by the Board of Directors. Conversions in connection with corporate transactions that constitute a fundamental change require the Company to pay a premium make-whole amount whereby the conversion ratio on the notes may be increased by up to 8.2 shares per $1,000 of principal. The premium make-whole amount will be paid in shares of common stock upon any such conversion, subject to the net share settlement feature of the notes described below. The notes contain a net share settlement feature that requires the Company to pay cash for each $1,000 of principal. Any amounts in excess of $1,000 will be settled in shares of the Company’s common stock, or at the Company’s option, cash. The Company has a one-time irrevocable election to pay the principal amount in shares of its common stock, which it currently does not plan to exercise.

90
The notes are redeemable by the Company at any time on or after June 20, 2012, or at the option of a holder upon the occurrence of certain fundamental changes, as defined in the agreement. The notes are subordinated in right of payment to all of our senior indebtedness and effectively subordinated to all debts and other liabilities of the Company’s subsidiaries. The fair-value of the convertible subordinated notes based on recent sales prices as of January 2, 2009 and December 28, 2007 was approximately $188 million and $220 million, respectively. Acquired Debt - Concurrently with the close of the Precimed acquisition, the Company assumed and repaid $31.6 million of long-term debt acquired. Additionally, the Company assumed a mortgage note of $2.0 million with a former owner that carried an interest rate of 3%. The Company repaid this note in full in 2008. Deferred Financing Fees - The following is a reconciliation of deferred financing fees for 2008 and 2007, which are included in other assets (in thousands):
Balance at December 29, 2006 2,305$ Financing costs deferred 6,632 Written-off during the year (1,416) Amortization during the year (1,110)
Balance at December 28, 2007 6,411 Financing costs deferred 14 Written-off during the year (124) Amortization during the year (1,307)
Balance at January 2, 2009 4,994$
9. EMPLOYEE BENEFIT PLANS
Savings Plan - The Company sponsors a defined contribution 401(k) plan, which covers substantially all of its U.S. based employees. The plan provides for the deferral of employee compensation under Section 401(k) and a discretionary Company match. In 2008, 2007 and 2006, this match was $0.35 per dollar of participant deferral, up to 6% of the total compensation for each participant. Net costs related to this defined contribution plan were $1.5 million in 2008, $1.0 million in 2007 and $0.9 million in 2006. In addition to the above, under the terms of the 401(k) plan document there is an annual discretionary defined contribution for substantially all U.S. based employees equal to five percent of each employee’s eligible compensation. This amount is contributed to the 401(k) plan in the form of Company stock. Compensation cost recognized related to the defined contribution was approximately $4.4 million in 2008, $3.6 million in 2007 and $3.3 million in 2006. As of January 2, 2009, the 401(k) Plan held 534,116 shares of Company stock and there were approximately 150,500 committed-to-be released shares for the plan, which equals the estimated number of shares to settle the liability based on the closing market price of the Company’s stock at January 2, 2009 of $26.72. Pension Plans - In connection with the Precimed and Chaumont Facility acquisitions, the Company recorded a pension liability related to defined benefit pension plans provided to non-U.S. based employees of those businesses. Under these plans, benefits accrue to employees based upon years of service, position, age and compensation.

91
Information relating to the funding position of the Company’s defined benefit pension plans as of the plans measurement date of January 2, 2009 were as follows (in thousands):
Year EndedJanuary 2,
2009Change in projected benefit obligation:Projected benefit obligation at beginning of year -$ Projected benefit obligation acquired 14,017 Service cost 679 Interest cost 480 Plan participants' contributions 873 Actuarial loss 446 Benefits paid (1,317) Settlements (1,941) Foreign currency translation 202 Projected benefit obligation at end of year 13,439
Change in fair value of plan assets:Fair value of plan assets at beginning of year - Plan assets acquired 10,484 Employer contributions 922 Plan participants' contributions 873 Actual loss on plan assets (2,013) Benefits paid (1,292) Settlements (1,718) Foreign currency translation 198 Fair value of plan assets at end of year 7,454 Projected benefit obligation in excess of plan
assets at end of year 5,985$ Current portion of pension liabilty 12$ Noncurrent portion of pension liability 5,973$ Accumulated benefit obligation at end of year 12,128$
Amounts recognized in accumulated other comprehensive loss:Net loss occurring during the year 2,886$ Net (gain) on settlements (373) Pre-tax adjustment 2,513 Taxes (571) Net adjustment 1,942$

92
Net pension cost is comprised of the following (in thousands):
Year EndedJanuary 2,
2009Service cost 679$ Interest cost 480 Expected return on plan assets (427) Settlements 152 Recognized net actuarial gain (4) Net pension cost 880$
The principal actuarial assumptions used were as follows:
Year EndedJanuary 2,
2009Discount rate 3.0%Salary growth 2.5%Expected rate of return on plan assets 4.0%Long-term inflation rate 1.5%
The discount rate used is based on the yields of foreign government bonds with a duration matching the duration of the liabilities plus approximately 50 basis points to reflect the risk of investing in corporate bonds. The expected rate of return on plan assets reflects long-term earnings expectations on existing plan assets and those contributions expected to be received during the current plan year. In estimating that rate, appropriate consideration was given to historical returns earned by plan assets in the fund and the rates of return expected to be available for reinvestment. Rates of return were adjusted to reflect current capital market assumptions and changes in investment allocations. Equity securities and fixed income securities were assumed to earn a return in the range of 6% to 7% and 2% to 3%, respectively. When these overall return expectations are applied to the pension plan’s target allocation, the expected rate of return is determined to be 4.0%. The weighted average asset allocation as of the valuation date was as follows:
Asset Category: Target Actual
Bonds 60% 47% Equity 25% 20% Other 15% 33% 100% 100%
This allocation is consistent with the Company’s goal of diversifying the pension plans assets in order to preserve capital while achieving investment results that will contribute to the proper funding of pension obligations and cash flow requirements.

93
Estimated benefit payments over the next ten years are as follows (in thousands):
2009 $ 703 2010 753 2011 837 2012 952 2013 1,058
2014-2018 5,549
Education Assistance Program - The Company reimburses tuition, textbooks and laboratory fees for college or other job related programs for all of its U.S. based employees. The Company also reimburses college tuition for the dependent children of its full-time U.S. based employees. For certain employees, the dependent children benefit vests on a straight-line basis over ten years. Minimum academic achievement is required in order to receive reimbursement under both programs. Aggregate expenses under the programs were approximately $1.3 million, $1.5 million and $1.2 million in 2008, 2007 and 2006, respectively.
10. STOCK-BASED COMPENSATION
Compensation costs related to share-based payments totaled $6.8 million, $5.7 million and $6.4 million for 2008, 2007 and 2006, respectively. These amounts included accelerated vesting expense for certain retirement-eligible employees of $0.01 million, $0.1 million and $2.4 million, respectively, and modification expense of $0.05 million, $0.6 million and $0.3 million, respectively. This modification expense relates to the Company’s adoption of executive retirement guidelines in 2005 for senior level executives and the extension of the exercise period after termination for all outstanding stock options of its former Chief Executive Officer in 2006. Stock-based compensation expense included in the Consolidated Statements of Cash Flows includes costs recognized for stock options, restricted stock, restricted stock units and the annual share contribution to the 401(k) Plan. See Note 9 – “Employee Benefit Plans.” Proceeds from the exercise of stock options under stock option plans are credited to common stock at par value and the excess is credited to additional paid-in capital. A portion of the Company’s granted options qualify as incentive stock options (“ISO”) for income tax purposes. As such, a tax benefit is not recorded at the time the compensation cost related to the options is recorded for book purposes due to the fact that an ISO does not ordinarily result in a tax benefit unless there is a disqualifying disposition. Stock option grants of non-qualified options result in the creation of a deferred tax asset, which is a temporary difference, until the time that the option is exercised. Due to the treatment of incentive stock options for tax purposes, the Company’s effective tax rate from year to year is subject to variability. Stock-based compensation expense is only recorded for those awards that are expected to vest. Forfeiture estimates for determining appropriate stock-based compensation expense are estimated at the time of grant based on historical experience and demographic characteristics. Revisions are made to those estimates in subsequent periods if actual forfeitures differ from estimated forfeitures. A 9% annual forfeiture rate estimate was used for the stock-based compensation expense recorded during 2008, 2007 and 2006 unless it was certain that the awards would vest (i.e. retirement eligible employees, awards that immediately vest). In those instances, a 0% forfeiture rate was used.

94
Summary of Plans The Company’s 1997 Stock Option Plan (‘‘1997 Plan’’) authorized the issuance of up to 480,000 shares of nonqualified and incentive stock options to purchase the Company’s common stock, subject to the terms of the plan. The 1997 Plan has been frozen to any new stock option issuances. The Company’s 1998 Stock Option Plan (‘‘1998 Plan’’) authorized the issuance of up to 1,220,000 shares of nonqualified and incentive stock options to purchase the Company’s common stock, subject to the terms of the plan. The 1998 Plan has been frozen to any new stock option issuances. The Company’s 2002 Restricted Stock Plan (“2002 Plan”) authorized the issuance of stock awards to employees. The number of shares that were reserved for issuance under the plan could not exceed 200,000. The 2002 Plan has been frozen to any new stock award issuances. The Company has a stock option plan that provides for the issuance of nonqualified stock options to Non-Employee Directors (“Director Plan”). The Director Plan authorized the issuance of up to 100,000 shares of nonqualified stock options to purchase the Company’s common stock. The Director Plan has been frozen to any new stock option issuances. The Company’s 2005 Stock Incentive Plan (“2005 Plan”), as amended, authorizes the issuance of up to 2,450,000 shares of equity incentive awards including nonqualified and incentive stock options, restricted stock, restricted stock units, stock bonuses and stock appreciation rights subject to the terms of the 2005 Plan. The 2005 Plan has a sub-limit that limits the amount of restricted stock, restricted stock units and stock bonuses that may be awarded in the aggregate to 850,000 shares of the 2,450,000 shares authorized by the 2005 Plan. As of January 2, 2009, 436,050 shares were available for future grants of stock options, stock appreciation rights, restricted stock, restricted stock units or stock bonuses under the 2005 Plan. Stock Options Stock options granted generally vest over a four to five year period. The stock options expire 10 years from the date of grant. Stock options are granted at exercise prices equal to or greater than the fair value of the Company’s common stock on the date of grant. Performance-based stock options only vest if certain performance metrics are achieved. The performance metrics generally cover a three-year performance period beginning in the year of grant and include the achievement of revenue, adjusted operating earnings and adjusted operating cash flow targets. Intrinsic value is calculated for in-the-money options (exercise price less than market price) outstanding and/or exercisable as the difference between the market price of our common shares as of January 2, 2009 ($26.72) and the weighted average exercise price of the underlying options, multiplied by the number of options outstanding and/or exercisable.

95
The following tables summarize stock option activity related to the Company’s time-vested and performance-vested stock options:
Weighted average
remaining contractual
life Aggregate
intrinsic value(in years) (in millions)
Outstanding at December 30, 2005 1,211,350 23.09$ Granted 299,617 24.86 Exercised (153,339) 12.47 Forfeited or Expired (71,970) 25.53
Outstanding at December 29, 2006 1,285,658 24.64 Granted 230,477 25.11 Exercised (138,667) 19.04 Forfeited or Expired (76,301) 29.32
Outstanding at December 28, 2007 1,301,167 25.04 Granted 452,964 20.21 Exercised (131,100) 16.85 Forfeited or Expired (124,737) 25.21
Outstanding at January 2, 2009 1,498,294 24.28$ 6.8 $5.4Expected to Vest at January 2, 2009 1,425,373 24.30$ 6.8 $5.3Exercisable at January 2, 2009 1,068,582 25.09$ 6.1 $3.4
Weighted average exercise
price
Number of time-vested
stock options
Weighted average
remaining contractual
life Aggregate
intrinsic value(in years) (in millions)
Outstanding at December 30, 2005 185,810 23.60$ Granted 183,648 22.38 Exercised (7,266) 23.60 Forfeited or Expired (21,321) 22.96
Outstanding at December 29, 2006 340,871 22.98 Granted 146,231 29.65 Exercised (2,635) 22.38 Forfeited or Expired (41,612) 24.17
Outstanding at December 28, 2007 442,855 25.08 Granted 417,888 21.88 Exercised - - Forfeited or Expired (62,179) 22.24
Outstanding at January 2, 2009 798,564 23.62$ 8.6 $2.9Expected to Vest at January 2, 2009 557,479 23.65$ 9.0 $2.1Exercisable at January 2, 2009 145,649 23.60$ 6.4 $0.5
Weighted average exercise
price
Number of performance-vested stock
options

96
The following table provides certain information relating to the exercise of stock options (in thousands):
January 2, December 28, December 29,2009 2007 2006
Intrinsic value 974$ 1,338$ 2,120$ Cash received 2,210 2,699 2,082 Tax benefit realized 313 292 236
Year Ended
As of January 2, 2009, $7.8 million of unrecognized compensation cost related to non-vested stock options is expected to be recognized over a weighted-average period of approximately 3 years. Shares are distributed from the Company’s authorized but unissued reserve upon the exercise of stock options or treasury stock if available. The Company does not intend to purchase treasury shares to fund the future exercises of stock options. Fair Value The Company utilizes the Black-Scholes Option Pricing Model to determine the fair value of stock options under SFAS No. 123(R). Management is required to make certain assumptions with respect to selected model inputs, including anticipated changes in the underlying stock price (i.e. expected volatility) and option exercise activity (i.e. expected life). Expected volatility is based on the historical volatility of the Company’s stock over the most recent period commensurate with the estimated expected life of the stock options. The expected life of options granted, which represents the period of time that the options are expected to be outstanding, is based on historical data. The expected dividend yield is based on the Company’s history and expectation of dividend payouts. The risk-free interest rate is based on the U.S. Treasury yield curve in effect at the time of grant for a period commensurate with the estimated expected life. If factors change and result in different assumptions in the application of SFAS No. 123(R) in future periods, the stock option expense that the Company records for future grants may differ significantly from what the Company has recorded in the current period.
The weighted-average fair value and assumptions used to value options granted are as follows:
January 2, December 28, December 29,2009 2007 2006
Weighted-average fair value $8.38 $11.84 $10.85Risk-free interest rate 2.91% 4.52% 4.74%Expected volatility 39% 40% 42%Expected life (in years) 5 5 5Expected dividend yield 0% 0% 0%
Year Ended

97
Restricted Stock and Restricted Stock Units Time-vested restricted stock and restricted stock unit awards granted typically vest 50% on the second fiscal year-end from the date of the award and 25% on the third and fourth fiscal year-ends from the date of the award. Performance-vested restricted stock vests upon the achievement of certain annual diluted earnings per share targets by the Company, or the seventh anniversary date of the award.
The following table summarizes restricted stock and restricted stock unit activity related to the Company’s plans:
Weighted averageActivity fair value
Nonvested at December 30, 2005 93,956 22.46$ Shares granted (1) 145,126 23.25 Shares vested (25,911) 20.00 Shares forfeited (9,015) 22.63 Nonvested at December 29, 2006 204,156 23.32 Shares granted 122,031 27.17 Shares vested (36,435) 23.56 Shares forfeited (7,618) 23.30 Nonvested at December 28, 2007 282,134 24.96 Shares granted 142,441 20.08 Shares vested (194,269) 24.04 Shares forfeited (22,541) 21.39 Nonvested at January 2, 2009 (2) 207,765 22.86$
(1) Includes 50,879 performance-vested restricted stock units which vested in January 2008. (2) Includes 24,000 performance-vested restricted stock with a weighted average grant date fair value of $23.07 per
share. The fair value of restricted stock and restricted stock units is equal to the fair value of the Company’s stock on the date of grant. The realized tax benefit from the vesting of restricted stock and restricted stock units was $0.04 million, $0.03 million and $0.05 million for 2008, 2007 and 2006, respectively. As of January 2, 2009, there was $3.6 million of total unrecognized compensation cost related to the restricted stock and restricted stock unit awards. That cost is expected to be recognized over a weighted-average period of approximately 2 years.

98
11. OTHER OPERATING EXPENSES
Other operating expenses, net in the Company’s Consolidated Statements of Operations and Comprehensive Income are comprised of the following (in thousands):
January 2, December 28, December 29,2009 2007 2006
(a) 2005 & 2006 facility shutdowns and consolidations 663$ 4,697$ 10,985$ (b) 2007 & 2008 facility shutdowns and consolidations 8,347 531 - (c) Integration costs 5,369 - - (d) Asset dispositions and other 199 96 6,073
14,578$ 5,324$ 17,058$
Year ended
(a) 2005 & 2006 facility shutdowns and consolidations - Beginning in the first quarter of 2005 and ending in the second quarter of 2006 the Company consolidated its medical capacitor manufacturing operations in Cheektowaga, NY, and its implantable medical battery manufacturing operations in Clarence, NY, into its advanced power source manufacturing facility in Alden, NY (“Alden Facility”). The Company also consolidated its capacitor research, development and engineering operations from its Cheektowaga, NY facility into its technology center in Clarence, NY. In the first quarter of 2005, the Company announced its intent to close its Carson City, NV facility and consolidate the work performed at that facility into its Tijuana, Mexico facility. This consolidation project was completed in the third quarter of 2007. In the fourth quarter of 2005, the Company announced its intent to close its Columbia, MD facility (“Columbia Facility”) and Fremont, CA Advanced Research Laboratory (“ARL”). The Company also announced that the manufacturing operations at its Columbia Facility will be moved into its Tijuana Facility and that the research, development and engineering and product development functions at its Columbia Facility and at ARL will relocate to its technology center in Clarence, NY. The ARL portion of this consolidation project was completed in the fourth quarter of 2006. The Columbia Facility portion of this consolidation project was completed in the third quarter of 2008. During the fourth quarter of 2006, the Company completed a plan for consolidating its corporate and business unit organization structure. A significant portion of the annual savings from this initiative was reinvested into research & development activities and business growth opportunities. The total cost of these projects was $24.7 million, which was incurred from 2005 to 2008, and included the following:
• Severance and retention - $7.4 million; • Production inefficiencies, moving and revalidation - $4.6 million; • Accelerated depreciation and asset write-offs - $1.1 million; • Personnel - $8.4 million; and • Other - $3.2 million.

99
All categories of costs were considered to be cash expenditures, except accelerated depreciation and asset write-offs. Approximately $23.6 million of these expenses for the facility shutdowns and consolidations were included in the IMC business segment, $0.1 million in the Electrochem segment (2006) and $1.0 million was recorded in unallocated operating expenses (2006). As of January 2, 2009, $0.08 million of accrued consolidation expenses relate to the IMC business segment. Accrued liabilities related to the 2005 & 2006 facility shutdowns and consolidations are comprised of the following (in thousands):
Severance and
retention
Production inefficiencies, moving and revalidation Personnel Other Total
Balance, December 29, 2006 4,704$ -$ -$ -$ 4,704$ Restructuring charges 1,405 1,037 1,678 577 4,697 Cash payments (3,959) (1,037) (1,678) (577) (7,251) Balance, December 28, 2007 2,150$ -$ -$ -$ 2,150$
Restructuring charges 159 42 184 278 663 Cash payments (2,234) (42) (184) (278) (2,738) Balance, January 2, 2009 75$ -$ -$ -$ 75$
(b) 2007 & 2008 facility shutdowns and consolidations - In the first quarter of 2007, the Company announced that it will close its current Electrochem manufacturing facility in Canton, MA and construct a new 81,000 square foot replacement facility in Raynham, MA. This initiative is not cost savings driven but capacity driven for the Electrochem group. In the second quarter of 2007, the Company announced that it will consolidate its corporate offices in Clarence, NY into its existing research and development center also in Clarence, NY after an expansion of that facility was complete. This expansion and relocation was completed in the third quarter of 2008. During the second and third quarters of 2008, the Company reorganized and consolidated various general & administrative and research & development functions throughout the organization in order to optimize those resources with the businesses it acquired in 2007 and 2008. In the second half of 2008, the Company ceased manufacturing at its facility in Suzhou, China, which was acquired from EAC, and closed its leased manufacturing facility in Orchard Park, NY, which was acquired from IntelliSensing, LLC. Additionally, the Company consolidated its Saignelegier, Switzerland manufacturing facility, which was acquired from Precimed. The operations of these facilities were relocated to existing facilities which have excess capacity. The facility in China is expected to be used as a procurement office in 2009. In the fourth quarter of 2008, management of the Company approved a plan for the closure of its Teterboro, New Jersey (Electrochem manufacturing), Blaine, Minnesota (Vascular Access manufacturing) and Exton, Pennsylvania (Orthopedics corporate office) facilities. The operations at these facilities will be moved to other existing facilities with excess capacity.

100
The above initiatives are expected to be completed over the next twelve months. The total cost for these facility shutdowns and consolidations is expected to be approximately $13.5 million to $15.0 million of which $8.9 million has been incurred through January 2, 2009.
The major categories of costs include the following:
• Severance and retention - $4.3 million to $4.6 million; • Production inefficiencies, moving and revalidation - $2.4 million to $2.7 million; • Accelerated depreciation and asset write-offs - $4.1 million to $4.4 million; • Personnel - $1.2 million to $1.5 million; and • Other - $1.5 million to $1.8 million.
All categories of costs are considered to be cash expenditures, except accelerated depreciation and asset write-offs. For 2008, costs of $5.0 million are included in the IMC business segment. For 2008 and 2007, costs of $3.3 million and $0.5 million, respectively, are included in the Electrochem business segment. As of January 2, 2009 and December 28, 2007, $0.4 million and $0.6 million of accrued consolidation expenses relate to the IMC business segment, respectively. As of January 2, 2009, $0.2 million of accrued consolidation expenses relate to the Electrochem business segment. Accrued liabilities related to the 2007 & 2008 facility shutdowns and consolidations are comprised of the following (in thousands):
Severance and
retention
Production inefficiencies, moving and revalidation
Accelerated depreciation/ asset write-
offs Personnel Other Total Balance, December 29, 2006 570$ -$ -$ -$ -$ 570$ Restructuring charges - - 531 - - 531 Write-offs - - (531) - - (531) Cash payments - - - - - - Balance, December 28, 2007 570$ -$ -$ -$ -$ 570$
Restructuring charges 2,661 2,074 2,978 82 552 8,347 Write-offs - - (2,978) - - (2,978) Cash payments (2,637) (2,074) - (82) (552) (5,345) Balance, January 2, 2009 594$ -$ -$ -$ -$ 594$
As a result of these consolidation initiatives, during 2008 two facilities classified as held and used and held for sale in accordance with SFAS No. 144, Accounting for the Impairment or Disposal of Long-Lived Asset, were determined to be impaired. Accordingly, these facilities, which had a carrying amount of $5.1 million, were written down to their fair value of $3.4 million. This resulted in an impairment charge of $1.7 million, which was included in other operating expense.
(c) Integration costs. For 2008, the Company incurred costs related to the integration of the companies acquired in 2007 and 2008. The integration initiatives include the implementation of the Oracle ERP system, training and compliance with Company policies as well as the implementation of lean manufacturing and six sigma initiatives. The expenses are primarily for consultants, relocation and travel costs that will not be required after the integrations are completed.

101
(d) Asset dispositions and other. During 2008 and 2007, the Company had various asset disposals which were partially offset by insurance proceeds received on previously disposed assets. During 2006, the Company recorded a loss of $4.4 million related to the write-off of a battery test system that was under development. Upon completion of the Company’s engineering and technical evaluation, it was determined that the system could not meet the required specifications in a cost effective manner. This charge was included in the IMC business segment. The remaining expense for 2006 includes charges for various asset dispositions and $0.8 million for professional fees related to a potential acquisition that was no longer considered probable.
12. INCOME TAXES
The U.S. and international components of income (loss) before provision for income taxes were as follows (in thousands):
January 2, December 28, December 29,2009 2007 2006
U.S. 32,732$ 27,773$ 22,805$ International (5,429) 915 729 Income (loss) before provision for income taxes 27,303$ 28,688$ 23,534$
Year Ended
The provision (benefit) for income taxes was comprised of the following (in thousands):
January 2, December 28, December 29,2009 2007 2006
Current:Federal 5,860$ 17,661$ 2,457$ State 693 592 142 International 520 320 (79)
7,073 18,573 2,520 Deferred:
Federal 5,399 (4,738) 5,040 State (692) (25) 57 International (3,036) (172) (209)
1,671 (4,935) 4,888
Provision for income taxes 8,744$ 13,638$ 7,408$
Year Ended

102
The provision for income taxes differs from the U.S. statutory rate due to the following:
January 2, December 28, December 29,2009 2007 2006
Statutory rate 35.0 % 35.0 % 35.0 %Swiss tax holiday (5.7) 0.0 0.0 Federal tax credits (3.3) (4.9) (1.8) Foreign rate differential 3.0 0.8 (0.7) In-process research and development 2.3 16.9 0.0 State taxes, net of federal benefit (0.7) 1.9 (0.1) Valuation allowance 0.7 (0.6) 0.7 Extraterritorial income exclusion 0.0 (0.2) (3.8) Other 0.7 (1.4) 2.2 Effective tax rate 32.0 % 47.5 % 31.5 %
Year Ended
During the second quarter of 2008, the Company received a nine year tax holiday (i.e. reduction in tax rate) from the Canton of Bern, Switzerland, beginning in 2009. This resulted in a one time reduction of the Swiss deferred tax liabilities of approximately $1.5 million, which is reflected in the 2008 effective tax rate. The tax holiday was granted based upon projections of future capital investment and employment levels in the Canton of Bern. These projections are subject to periodic review by the governmental and tax authorities. If these projections are not met, part or all of the tax holiday may be revoked. If part or all of the tax holiday were revoked, a portion (or all) of the tax benefit recognized in 2008 would be reversed. The Company also negotiated a tax holiday with the Swiss federal authorities, although this tax holiday is contingent on certain conditions that have not yet been met. As such, this tax holiday will not be recorded until the conditions have been satisfied. In 2008, 2007 and 2006, 131,100, 141,302, and 92,693 shares of common stock, respectively, were issued through the exercise of non-qualified stock options or through the disqualifying disposition of ISO’s. The amount of the tax benefit to the Company from these transactions, which is credited to additional paid-in capital rather than recognized as a reduction of income tax expense, was $0.3 million, $0.3 million, and $0.2 million in 2008, 2007 and 2006, respectively. These tax benefits have also been recognized in the consolidated balance sheet as a reduction of current income taxes payable.

103
Deferred tax assets (liabilities) consist of the following (in thousands):
January 2, December 28,2009 2007
Tax credits 5,307 5,090 Net operating loss carryforwards 3,633 1,691 Inventories 4,904 3,634 Accrued expenses 3,110 2,636 Stock-based compensation 4,790 3,465 Other 1,374 - Gross deferred tax assets 23,118 16,516 Less valuation allowance (4,485) (3,969)
18,633 12,547 Property, plant and equipment (4,233)$ (3,129)$ Intangible assets (37,020) (28,976) Convertible subordinated notes (11,658) (9,129) Other - (190) Gross deferred tax liabilities (52,911) (41,424) Net deferred tax liability (34,278)$ (28,877)$ Presented as follows:Current deferred tax asset 8,086$ 6,469$ Noncurrent deferred tax asset 1,942 - Noncurrent deferred tax liability (44,306) (35,346) Total net deferred tax liability (34,278)$ (28,877)$
Year Ended
As of January 2, 2009, the Company has the following carryforwards available:
Tax Begin to Jurisdiction attribute Amount Expire
U.S. Net Operating Loss $4.6 million (1) 2022Switzerland Net Operating Loss 7.6 million (1) 2011State Net Operating Loss 8.0 million (1) VariousFederal R&D Credit 0.8 million (1) 2025State R&D Credit 0.3 million (1) VariousState Investment Tax Credit 4.3 million Various
(1) These tax attributes were acquired primarily as part of the Enpath acquisition in 2007 and the Precimed acquisition in 2008. The utilization of the net operating losses and credits is subject to an annual limitation under Internal Revenue Code Section 382. Certain federal and state net operating loss carryforwards and tax credits per the income tax returns filed included uncertain tax positions taken in prior years. Due to the application of FIN 48, the actual tax attributes are larger than the net operating losses and tax credits for which a deferred tax asset is recognized for financial statement purposes.

104
In assessing the realizability of deferred tax assets, management considers, within each taxing jurisdiction, whether it is more likely than not that some portion or all of the deferred tax assets will not be realized. Management considers the scheduled reversal of deferred tax liabilities, projected future taxable income and tax planning strategies in making this assessment. Based on the consideration of the weight of both positive and negative evidence, management has determined that a portion of the deferred tax assets as of January 2, 2009 related to certain state investment tax credits and net operating losses will not be realized. The Company files annual income tax returns in the U.S., various state and local jurisdictions, and in various foreign jurisdictions. A number of years may elapse before an uncertain tax position, for which we have unrecognized tax benefits, is examined and finally settled. While it is often difficult to predict the final outcome or the timing of resolution of any particular uncertain tax position, we believe that our unrecognized tax benefits reflect the most probable outcome. The Company adjusts these unrecognized tax benefits, as well as the related interest, in light of changing facts and circumstances. The resolution of a matter could be recognized as an adjustment to the provision for income taxes and the effective tax rate in the period of resolution. Below is a summary of changes to the unrecognized tax benefit (in thousands):
January 2, December 28,2009 2007
Balance, beginning of year 1,678$ 1,787$ Additions based upon tax positions related to the current year 699 110 Additions recorded as part of purchase accounting 3,979 280 Reductions related to prior period tax positions (373) (481) Reductions relating to settlements with tax authorities (233) - Reductions as a result of a lapse of the applicable
statute of limitations (64) (18) Balance, end of year 5,686$ 1,678$
Year Ended
The tax years that remain open and subject to tax audits varies depending on the tax jurisdiction. During 2008, the IRS began their review of the Company’s 2006 and 2007 U.S. income tax returns and it is still in process. The 2005, 2006 and 2007 tax years remain open for examination. In addition, the state of Massachusetts began an audit of the 2004-2006 tax years of the Company and the state of New York completed its examination of the 2002-2005 tax years. Finally, the 2004-2007 Swiss tax returns were selected for review and this examination was completed in early 2009. It is reasonably possible that a reduction in the range of $0.8 million to $2.1 million of the balance of unrecognized tax benefits may occur within the next 12 months as a result of potential settlements with taxing authorities and the lapse of the statute of limitations. As of the end of 2008, approximately $4.0 million of unrecognized tax benefits would favorably impact the effective tax rate (net of federal benefit on state issues), if recognized.

105
13. COMMITMENTS AND CONTINGENCIES
Litigation – The Company is a party to various legal actions arising in the normal course of business. While the Company does not believe, except as indicated below, that the ultimate resolution of any such pending actions will have a material adverse effect on its results of operations, financial position or cash flows, litigation is subject to inherent uncertainties. If an unfavorable ruling were to occur, there exists the possibility of a material adverse impact in the period in which the ruling occurs. As previously reported, on June 12, 2006, Enpath was named as defendant in a patent infringement action filed by Pressure Products Medical Supplies, Inc. (“Pressure Products”) in which Pressure Products alleged that Enpath’s FlowGuard™ valved introducer, which has been on the market for more than three years, and Enpath’s ViaSeal™ prototype introducer, which has not been sold, infringes claims in Pressure Products patents. After trial, a jury found that Enpath infringed the Pressure Products patents, but not willfully, and awarded damages in the amount of $1.1 million. Enpath has appealed the final judgment to the U.S. Court of Appeals for the Federal Circuit. As a result of a post-trial motion and pending the appeal, Enpath is permitted to continue to sell FlowGuard™ provided that Enpath pays into an escrow fund a royalty of between $1.50 and $2.25 for each sale of a FlowGuard™ valved introducer. The amount accrued as escrow during 2008 was $0.5 million. During 2008, the Company incurred $4.5 million of costs related to this litigation. During 2002, a former non-medical customer commenced an action alleging that Greatbatch had used proprietary information of the customer to develop certain products. We have meritorious defenses and are vigorously defending the matter. The potential risk of loss is up to $1.7 million. License agreements - The Company is a party to various license agreements through 2018 for technology that is utilized in certain of its products. The most significant of these is an agreement to license the basic technology used for wet tantalum capacitors in the IMC segment. The Company is required to pay royalties based on agreed upon terms through August 2014. Expenses related to license agreements were $3.0 million, $2.1 million and $1.5 million, for 2008, 2007 and 2006, respectively. Product Warranties - The change in the aggregate product warranty liability was comprised of the following (in thousands):
January 2, December 28,2009 2007
Beginning balance 1,454$ 1,993$ Warranty reserves acquired 142 158 Additions to warranty reserve 1,185 945 Warranty claims paid (1,386) (1,642) Ending balance 1,395$ 1,454$
Year Ended

106
Operating Leases - The Company is a party to various operating lease agreements for buildings, equipment and software. The Company incurred operating lease expense of $3.8 million, $2.2 million, and $2.3 million, in 2008, 2007 and 2006, respectively. Minimum future annual operating lease payments are $2.9 million in 2009; $1.8 million in 2010; $1.5 million in 2011; $1.4 million in 2012; $1.4 million in 2013 and $2.0 million thereafter. The Company primarily leases buildings, which accounts for the majority of the future lease payments. Lease expense includes the effect of escalation clauses and leasehold improvement incentives which are accounted for ratably over the lease term. Workers’ Compensation Trust – In Western New York, the Company is a member of a group self-insurance trust that provides workers’ compensation benefits to eligible employees of the Company and other group member employers. For locations outside of Western New York, the Company utilizes traditional insurance relationships to provide workers’ compensation benefits. Under the terms of the Trust, the Company makes annual contributions to the Trust based on reported salaries paid to the employees using a rate based formula. Based on actual experience, the Company could receive a refund or be assessed additional contributions. For financial statement purposes, no amounts have been recorded for any refund or additional assessment since the Trust has not informed the Company of any such adjustments. Under the trust agreement, each participating organization has joint and several liability for trust obligations if the assets of the trust are not sufficient to cover its obligation. The Company does not believe that it has any current obligations under the joint and several liability.
Purchase Commitments - Contractual obligations for the purchase of goods or services are defined as agreements that are enforceable and legally binding on the Company and that specify all significant terms, including: fixed or minimum quantities to be purchased; fixed, minimum or variable price provisions; and the approximate timing of the transaction. Our purchase orders are normally based on our current manufacturing needs and are fulfilled by our vendors within short time horizons. We enter into blanket orders with vendors that have preferred pricing and terms, however these orders are normally cancelable by us without penalty. As of January 2, 2009, the total contractual obligation related to such expenditures is $16.4 million and will be financed by existing cash and cash equivalents or cash generated from operations. We also enter into contracts for outsourced services; however, the obligations under these contracts were not significant and the contracts generally contain clauses allowing for cancellation without significant penalty.
Foreign Currency Contract - In December 2007, the Company entered into a forward contract to purchase 80,000,000 CHF, at an exchange rate of 1.1389 CHF per one U.S. dollar, in order to partially fund the acquisition of Precimed, which closed in January 2008 and was payable in Swiss Francs. In January 2008, the Company entered into an additional forward contract to purchase 20,000,000 CHF at an exchange rate of 1.1156 per one U.S. dollar. The Company entered into a similar foreign exchange contract in January 2008 in order to fund the acquisition of the Chaumont Facility, which closed in February 2008 and was payable in Euros. The net result of the above transactions was a gain of $2.4 million, $1.6 million of which was recorded in 2008. 2009 Foreign Currency Contract (Unaudited) - In February 2009, the Company entered into a forward contract to purchase 10 million Mexican pesos per month from March 2009 to December 2009 at an exchange rate of 14.85 pesos per one U.S. dollar. This contract was entered into in order to hedge the risk of peso denominated payments associated with the operations at the Company’s Tijuana, Mexico facility. This contract will be accounted for as a cash flow hedge.

107
Capital Expenditures – During 2007, the Company commenced the construction of a new 81,000 square foot facility in Raynham, MA related to the Electrochem expansion. The facility officially opened in August 2008. Additionally in 2007, construction began on the expansion of our corporate headquarters. This project was completed in July 2008. The contractual obligations at January 2, 2009 for construction of facilities and other miscellaneous capital projects are $1.7 million and will be financed by cash and cash equivalents on hand, or from cash flows from operations. 14. FAIR VALUE MEASUREMENTS The following table provides information regarding financial assets and liabilities measured at fair value in the Company’s Consolidated Balance Sheet as of January 2, 2009 (in thousands):
Description
At January 2,
2009
Quoted prices in
active markets
for identical assets
(Level 1)
Significant other
observable inputs
(Level 2)
Significant unobservable
inputs (Level 3)
AssetsInterest rate swaps 90$ -$ 90$ -$ LiabilitiesInterest rate swap 1,484$ -$ 1,484$ -$
Fair value measurements using
Interest rate swaps - The fair value of the Company’s interest rate swaps are obtained from an independent pricing service that utilizes cash flow models with observable market data inputs to estimate fair value. These observable market data inputs include LIBOR and swap rates, and credit spread curves. The Company’s interest rate swaps are categorized in Level 2 of the fair value hierarchy. Other financial assets and liabilities measured at fair value: Convertible subordinated notes - The fair value of the Company’s convertible subordinated notes disclosed in Note 8 – “Debt” were determined based upon recent third-party transactions for the Company’s notes in an inactive market. The Company’s convertible subordinated notes are categorized in Level 2 of the fair value hierarchy. Pension plan assets - The fair value of the Company’s pension plan assets disclosed in Note 9 - “Employee Benefit Plans” and used to determine our pension liability are obtained from an independent pricing service that utilizes multidimensional relational models with observable market data inputs to estimate fair value. These observable market data inputs include benchmark yields, reported trades, broker/dealer quotes, issuer spreads, benchmark securities, bids, offers and reference data. The Company’s pension plan assets are categorized in Level 2 of the fair value hierarchy.

108
15. BUSINESS SEGMENT INFORMATION
The Company operates its business in two reportable segments – Implantable Medical Components (“IMC”) and Electrochem Solutions (“Electrochem”). The IMC segment designs and manufactures components and devices for the CRM, Neuromodulation, Vascular Access and Orthopedic markets. Additionally, the IMC business offers value-added assembly and design engineering services for products that incorporate IMC components. IMC entered the Vascular Access market through its acquisition of Enpath and Quan in 2007 and the Orthopedic market through its acquisition of Precimed and the Chaumont Facility in early 2008. Electrochem is a world leader in the design, manufacture and distribution of electrochemical cells, battery packs and wireless sensors for demanding applications in markets such as energy, security, portable medical, environmental monitoring and more. Electrochem broadened its product portfolio through its acquisitions of EAC and IntelliSensing, LLC in 2007, and can now design and provide its customers rechargeable battery and wireless sensor systems. The Company defines segment income from operations as sales less cost of sales including amortization and expenses attributable to segment-specific selling, general and administrative, research, development and engineering expenses, and other operating expenses. Segment income also includes a portion of non-segment specific selling, general and administrative, and research, development and engineering expenses based on allocations appropriate to the expense categories. The remaining unallocated operating expenses are primarily corporate headquarters and administrative function expenses. The unallocated operating expenses along with other income and expense are not allocated to reportable segments. Transactions between the two segments are not significant. Segment assets are intended to correlate with invested capital. The amounts include accounts receivable, inventories, net property, plant and equipment, amortizing intangible assets, trademark and tradenames, and goodwill. Corporate assets consist primarily of cash, short-term investments available for sale, deferred income taxes and net property, plant and equipment for corporate headquarters. The accounting policies of the segments are the same as those described and referenced in Note 1 “Summary of Significant Accounting Policies.” Sales by geographic area are presented by attributing sales from external customers based on where the products are shipped. The IMC segment results for 2008 includes $6.2 million and $2.2 million of inventory step-up amortization and IPR&D expense, respectively, related to the acquisitions in 2007 and 2008. IMC results for 2007 includes $1.5 million and $16.1 million of inventory step-up amortization and IPR&D expense, respectively, related to the acquisitions in 2007. Electrochem segment results for 2008 and 2007 include $0.2 million of inventory step-up amortization related to the acquisitions in 2007.

109
An analysis and reconciliation of the Company’s business segment and product line information to the respective information in the consolidated financial statements is as follows (in thousands):
January 2, December 28, December 29,2009 2007 2006
Sales:IMC
CRM/Neuromodulation 278,279$ 251,426$ 227,407$ Vascular Access 47,415 18,396 - Orthopedic 142,446 - -
Total IMC sales 468,140 269,822 227,407 Electrochem 78,504 48,924 43,735 Total sales 546,644$ 318,746$ 271,142$
Year Ended
January 2, December 28, December 29,2009 2007 2006
Segment income from operations: IMC 49,760$ 25,367$ 27,860$ Electrochem 9,499 9,378 12,359 Total segment income from operations 59,259 34,745 40,219 Unallocated operating expenses (24,365) (14,725) (17,843)
Operating income as reported 34,894 20,020 22,376 Unallocated other income (expense) (7,591) 8,668 1,158 Income before provision for income
taxes as reported 27,303$ 28,688$ 23,534$
Year Ended
January 2, December 28, December 29,2009 2007 2006
Depreciation and amortization: IMC 36,987$ 19,166$ 15,068$ Electrochem 2,748 1,632 833 Total depreciation and amortization included in segment income from operations 39,735 20,798 15,901 Unallocated depreciation and amortization 5,647 5,044 3,408 Total depreciation and amortization 45,382$ 25,842$ 19,309$
Year Ended

110
January 2, December 28, December 29,2009 2007 2006
Expenditures for tangible long-lived assets, excluding acquisitions: IMC 11,414$ 12,847$ 12,154$ Electrochem 19,602 7,558 1,351 Total reportable segments 31,016 20,405 13,505 Unallocated long-lived tangible assets 16,562 2,087 855
Total expenditures 47,578$ 22,492$ 14,360$
January 2, December 28,2009 2007
Identifiable assets, net: IMC 678,565$ 526,699$ Electrochem 65,631 44,667 Total reportable segments 744,196 571,366 Unallocated assets 104,735 92,485 Total assets 848,931$ 663,851$
Year Ended
As of
January 2, December 28, December 29,2009 2007 2006
Sales by geographic area: United States 266,985$ 153,708$ 137,138$ Non-domestic countries:
United Kingdom 75,917 67,409 57,341 France 74,670 13,065 15,388 Puerto Rico 56,941 42,132 26,221 All other 72,131 42,432 35,054
Consolidated sales 546,644$ 318,746$ 271,142$
Year Ended
January 2, December 28,2009 2007
Long-lived tangible assets: United States 142,631$ 111,364$ Foreign countries 42,119 18,873 Consolidated long-lived assets 184,750$ 130,237$
As of

111
Four customers accounted for a significant portion of the Company’s sales and accounts receivable as follows:
January 2, December 28, December 29, January 2, December 28,2009 2007 2006 2009 2007
Customer A 17% 25% 26% 11% 17%Customer B 14% 17% 16% 12% 17%Customer C 13% 25% 25% 9% 16%Customer D 12% 0% 0% 5% 0%Total 56% 67% 67% 37% 50%
Year EndedSales Accounts Receivable
As of
16. QUARTERLY SALES AND EARNINGS DATA – UNAUDITED
4th Qtr. 3rd Qtr. 2nd Qtr. 1st Qtr.2008Sales 146,600$ 136,242$ 141,648$ 122,154$ Gross profit (1) 46,742 41,753 40,595 26,699 Net income (loss) (2) 8,499 7,629 5,805 (3,374) Earnings per share - basic 0.38 0.34 0.26 (0.15) Earnings per share - diluted 0.36 0.33 0.25 (0.15)
2007Sales 84,415$ 79,009$ 78,462$ 76,860$ Gross profit (1) 26,555 29,140 31,706 28,624 Net income (loss) (2) 2,780 5,000 (3,399) 10,669 Earnings per share - basic 0.13 0.23 (0.15) 0.48 Earnings per share - diluted 0.12 0.22 (0.15) 0.43
(in thousands, except per share data)
(1) Gross profit equals total sales minus cost of sales including amortization of intangibles. (2) Net loss in the first quarter of 2008 and second quarter of 2007 was a result of inventory step up
amortization and an IPR&D charge. See Note 2 “Acquisitions.” ITEM 9. CHANGES IN AND DISAGREEMENTS WITH ACCOUNTANTS
ON ACCOUNTING AND FINANCIAL DISCLOSURE None.

112
ITEM 9A. CONTROLS AND PROCEDURES Management’s Report on Internal Control Over Financial Reporting - Appears under Part II, Item 8, “Financial Statements and Supplementary Data.”
a. Evaluation of Disclosure Controls and Procedures.
Our management, including the principal executive officer and principal financial officer, evaluated our disclosure controls and procedures (as defined in Rules 13a-15(e) and 15d-15(e) under the Securities Exchange Act of 1934) related to the recording, processing, summarization and reporting of information in our reports that we file with the SEC. These disclosure controls and procedures have been designed to provide reasonable assurance that material information relating to us, including our subsidiaries, is made known to our management, including these officers, by our employees, and that this information is recorded, processed, summarized, evaluated and reported, as applicable, within the time periods specified in the SEC’s rules and forms.
Based on their evaluation, as of January 2, 2009, our principal executive officer and principal financial officer have concluded that our disclosure controls and procedures are effective.
b. Changes in Internal Control Over Financial Reporting.
We acquired the following subsidiaries during 2008:
• Precimed, Inc.
• P Medical Holding SA and subsidiaries, including the DePuy Orthopaedics Chaumont, France manufacturing facility
We believe that the internal controls and procedures of the above mentioned subsidiaries are reasonably likely to materially affect our internal control over financial reporting. We are currently in the process of incorporating the internal controls and procedures of these subsidiaries into our internal controls over financial reporting.
The Company has begun to extend its Section 404 compliance program under the Sarbanes-Oxley Act of 2002 (the “Act”) and the applicable rules and regulations under such Act to include these subsidiaries. However, the Company has excluded the subsidiaries listed above from Management’s assessment of the effectiveness of internal control over financial reporting as of January 2, 2009, as permitted by the guidance issued by the Office of the Chief Accountant of the Securities and Exchange Commission. These subsidiaries represented approximately 39% and 21% of net and total assets, respectively, and 26% of revenues of the consolidated financial statement amounts as of and for the year ended January 2, 2009. The Company will report on its assessment of the internal controls of its combined operations within the time period provided by the Act and the applicable SEC rules and regulations concerning business combinations.
There were no other changes in the registrant’s internal control over financial reporting during our last fiscal quarter to which this Annual Report on Form 10-K relates that have materially affected, or are reasonably likely to materially affect, internal control over financial reporting, other than the above mentioned acquisitions.
ITEM 9B. OTHER INFORMATION
None.

113
PART III
ITEM 10. DIRECTORS, EXECUTIVE OFFICERS AND CORPORATE GOVERNANCE
The identification of each of the Registrant’s directors is incorporated by reference to the caption “Election of Directors” contained in the Company’s definitive Proxy Statement for its 2009 Annual Meeting of Stockholders, which will be filed with the Securities and Exchange Commission on or about April 13, 2009. The identification of the Company’s executive officers is presented under the caption “Executive Officers of the Company” contained in Part I of this Annual Report on Form 10-K. The other information required by Item 10 is incorporated by reference to the Company’s definitive Proxy Statement for its 2009 Annual Meeting of Stockholders, which will be filed with the Securities and Exchange Commission on or about April 13, 2009.
ITEM 11. EXECUTIVE COMPENSATION
Information regarding executive compensation in the Proxy Statement for the 2009 Annual Meeting of Stockholders is incorporated herein by reference.
ITEM 12. SECURITY OWNERSHIP OF CERTAIN BENEFICIAL OWNERS AND MANAGEMENT AND RELATED STOCKHOLDER MATTERS
Information regarding security ownership of certain beneficial owners in the Proxy Statement for the 2009 Annual Meeting of Stockholders is incorporated herein by reference.
ITEM 13. CERTAIN RELATIONSHIPS AND RELATED TRANSACTIONS, AND DIRECTOR
INDEPENDENCE
Information regarding certain relationships and related transactions, and director independence in the Proxy Statement for the 2009 Annual Meeting of Stockholders is incorporated herein by reference.
ITEM 14. PRINCIPAL ACCOUNTING FEES AND SERVICES
Information regarding the fees paid to and services provided by Deloitte & Touche LLP, the Company’s independent registered public accounting firm, in the Proxy Statement for the 2009 Annual Meeting of Stockholders is incorporated herein by reference.
PART IV
ITEM 15. EXHIBITS, FINANCIAL STATEMENT SCHEDULES (a) LIST OF DOCUMENTS FILED AS PART OF THIS REPORT
(1) Financial statements and financial statement schedules filed as part of this Annual Report on Form 10-K. See Part II, Item 8. “Financial Statements and Supplementary Data.”

114
(2) FINANCIAL STATEMENT SCHEDULES
The following financial statement schedule is included in this report on Form 10-K: Schedule II - Valuation and Qualifying Accounts.
Schedule II - Valuation and Qualifying Accounts
Col. B Col. EBalance at Charged to Col. D Balance at
Col. A Beginning Charged to Other Accounts- Deductions - End ofDescription of Period Costs & Expenses Describe Describe Period
January 2, 2009Allowance for doubtful accounts 758$ 590$ 374$ (5) (119)$ (2) 1,603$ Valuation allowance for deferred income tax assets 3,969$ -$ 580$ (5) (64)$ (1) 4,485$
December 28, 2007Allowance for doubtful accounts 532$ 151$ 173$ (4) (98)$ (2) 758$ Valuation allowance for deferred income tax assets 4,342$ -$ -$ (373)$ (1) 3,969$
December 29, 2006Allowance for doubtful accounts 450$ 179$ -$ (97)$ (2) 532$ Valuation allowance for deferred income tax assets 4,843$ 40$ (1) -$ (541)$ (3) 4,342$
(in thousands)
Additions
(1) Valuation allowance/reversal recorded in the provision for income taxes for certain net operating losses and tax credits.
(2) Accounts written off, net of collections on accounts receivable previously written off. (3) Reversal of valuation allowance related to available for sale investments. (4) Balances recorded as a part of our 2007 acquisitions of Enpath Medical, Quan Emerteq and EAC. (5) Balances recorded as a part of our 2008 acquisitions of P Medical Holding SA. Schedules not listed above have been omitted because the information required to be set forth therein is not applicable or is shown in the financial statements or notes thereto. (3) Exhibits required by Item 601 of Regulation S-K. The exhibits listed on the Exhibit Index of this
Annual Report on Form 10-K have been previously filed, are filed herewith or are incorporated herein by reference to other filings.

115
SIGNATURES
Pursuant to the requirements of Sections 13 or 15(d) of the Securities Exchange Act of 1934, the Registrant has duly caused this report to be signed on its behalf by the undersigned, thereunto duly authorized.
Dated: March 2, 2009 GREATBATCH, INC.
By /s/ Thomas J. Hook Thomas J. Hook President & Chief Executive Officer
(Principal Executive Officer)
By /s/ Thomas J. Mazza Thomas J. Mazza Senior Vice President & Chief Financial Officer (Principal Financial Officer)
By /s/ Marco F. Benedetti Marco F. Benedetti Corporate Controller (Principal Accounting Officer)

116
Pursuant to the requirements of the Securities Exchange Act of 1934, this report has been signed below by the following persons on behalf of the Registrant and in the capacities and on the date indicated.
Signature
Title
Date
/s/ Thomas J. Hook Thomas J. Hook
President & Chief Executive Officer & Director
March 2, 2009
/s/ Bill R. Sanford Bill R. Sanford
Chairman
March 3, 2009
/s/ Pamela G. Bailey Pamela G. Bailey
Director
March 3, 2009
/s/ Michael Dinkins Michael Dinkins
Director
March 3, 2009
/s/Kevin C. Melia Kevin C. Melia
Director
March 3, 2009
/s/Dr. Joseph A. Miller, Jr. Dr. Joseph A. Miller, Jr.
Director
March 3, 2009
/s/ Peter H. Soderberg Peter H. Soderberg
Director
March 3, 2009
/s/ William B. Summers, Jr. William B. Summers, Jr.
Director
March 3, 2009
/s/ John P. Wareham John P. Wareham
Director
March 3, 2009
/s/ Dr. Helena S. Wisniewski Dr. Helena S. Wisniewski
Director
March 3, 2009

117
EXHIBIT INDEX EXHIBIT NUMBER DESCRIPTION
2.1 Share Purchase Agreement dated as of November 21, 2007, by and among the persons named on the signature page, P Medical Holding SA, Greatbatch, Inc. and Greatbatch Ltd. (incorporated by reference to Exhibit 2.1 to our Current Report on Form 8-K filed on January 8, 2008).
3.1 Amended and Restated Certificate of Incorporation, as amended (incorporated by reference to Exhibit 3.1 to our quarterly report on Form 10-Q for the period ended June 27, 2008).
3.2 Amended and Restated Bylaws (incorporated by reference to Exhibit 3.2 to our Quarterly Report on Form 10-Q for the quarterly period ended March 29, 2002).
4.1 Indenture for 2¼ % Convertible Subordinated Debentures Due 2013 dated May 28, 2003 (incorporated by reference to Exhibit 4.2 to our Registration Statement on Form S-3 (File No. 333-107667) filed on August 5, 2003).
4.2 Registration Rights Agreement dated May 28, 2003 by among us and the initial purchasers of the Debentures described above (incorporated by reference to Exhibit 4.2 to our Registration Statement on Form S-3 (File No. 333-107667) filed on August 5, 2003).
4.3 Indenture for 2¼% Convertible Subordinated Debentures Due 2013 dated as of March 28, 2007 (incorporated by reference to Exhibit 10.3 to our Current Report on Form 8-K filed on March 29, 2007).
4.4 First Supplemental Indenture dated April 2, 2007 (incorporated by reference to Exhibit 10.3 to our Current Report on Form 8-K filed on April 4, 2007).
4.5 Registration Rights Agreement dated as of March 28, 2007 by and among us and the initial purchasers of the Debentures described above (incorporated by reference to Exhibit 10.2 to our Current Report on Form 8-K filed on March 29, 2007).
10.1# 1997 Stock Option Plan (including form of “standard” option agreement and form of “special” option agreement) (incorporated by reference to Exhibit 10.1 to our Registration Statement on Form S-1 (File No. 333-37554)).
10.2# 1998 Stock Option Plan (including form of “standard” option agreement, form of “special” option agreement and form of “non-standard” option agreement) (incorporated by reference to Exhibit 10.2 to our Registration Statement on Form S-1 (File No. 333-37554)).
10.3# Greatbatch Ltd. Equity Plus Plan Money Purchase Plan (incorporated by reference to Exhibit 10.3 to our Registration Statement on Form S-1 (File No. 333-37554)).

118
10.4# Greatbatch Ltd. Equity Plus Plan Stock Bonus Plan (incorporated by reference to Exhibit 10.4 to our Registration Statement on Form S-1 (File No. 333-37554)).
10.5# Non-Employee Director Stock Incentive Plan (incorporated by reference to Exhibit A to our Definitive Proxy Statement on Schedule 14-A filed on April 22, 2002).
10.6# Greatbatch, Inc. Executive Short Term Incentive Compensation Plan (incorporated by reference to Exhibit B to our Definitive Proxy Statement on Schedule 14A filed on April 20, 2007).
10.7 Credit Agreement dated as of May 22, 2007 by and among Greatbatch Ltd., the lenders party thereto and Manufacturers and Traders Trust Company, as administrative agent (incorporated by reference to Exhibit 10.1 of our Current Report on Form 8-K filed on May 25, 2007).
10.8* Amendment No. 1 to Credit Agreement dated as of December 20, 2007 by and among Greatbatch Ltd., the lenders party thereto and Manufacturers and Traders Trust Company, as administrative agent.
10.9* Amendment No. 2 to Credit Agreement dated as of November 4, 2008 by and among Greatbatch Ltd., the lenders party thereto and Manufacturers and Traders Trust Company, as administrative agent.
10.10# 2002 Restricted Stock Plan (incorporated by reference to Appendix B to our Definitive Proxy Statement on Schedule 14A filed on April 9, 2003).
10.11 License Agreement dated August 8, 1996, between Greatbatch Ltd. and Evans Capacitor Company (incorporated by reference to Exhibit 10.23 to our Registration Statement on Form S-1 (File No. 333-37554)).
10.12+ Amendment No. 2 dated December 6, 2002, between Greatbatch Technologies, Ltd. and Evans Capacitor Company (incorporated by reference to Exhibit 10.18 to our Annual Report on Form 10-K for the year ended January 3, 2003).
10.13+ Supplier Partnering Agreement dated as of October 23, 2003, between Greatbatch, Inc. and Pacesetter, Inc., a St. Jude Medical Company (incorporated by reference to Exhibit 10.20 to our Annual Report on Form 10-K for the year ended January 2, 2004).
10.14+ Amendment No. 1 dated October 8, 2004, to Supplier Partnering Agreement dated as of October 23, 2003, between Greatbatch, Inc. and Pacesetter, Inc., d/b/a St. Jude Medical CRMD (incorporated by reference to Exhibit 10.14 to our Annual Report on Form 10-K for the fiscal year ended December 31, 2004).
10.15+ License Agreement dated October 25, 2005 between Greatbatch, Inc. and Medtronic, Inc. (incorporated by reference to Exhibit 10.16 to our Annual Report on Form 10-K for the fiscal year ended December 30, 2005).

119
10.16# Form of Change of Control Agreement, dated August 14, 2006, between Greatbatch, Inc. and our executive officers (Thomas J. Hook, Thomas J. Mazza, Mauricio Arellano, Susan M. Bratton, Susan H. Campbell, Barbara Davis and Timothy McEvoy).
10.17# Employment Agreement dated August 8, 2006 between Greatbatch, Inc. and Thomas J. Hook (incorporated by reference to Exhibit 10.1 to our Quarterly Report on Form 10-Q for the quarterly period ended September 29, 2006).
10.18# 2005 Stock Incentive Plan (incorporated by reference to Exhibit B to our Definitive Proxy Statement on Schedule 14A filed on April 20, 2007).
10.19# Form of Restricted Stock Award Letter (incorporated by reference to Exhibit 10.22 to our Annual Report on Form 10-K for the fiscal year ended December 30, 2005).
10.20# Form of Incentive Stock Option Award Letter (incorporated by reference to Exhibit 10.23 to our Annual Report on Form 10-K for the fiscal year ended December 30, 2005).
10.21# Form of Nonqualified Option Award Letter (incorporated by reference to Exhibit 10.24 to our Annual Report on Form 10-K for the fiscal year ended December 30, 2005).
10.22# Form of Stock Option Award Letter (incorporated by reference to Exhibit 10.25 to our Annual Report on Form 10-K for the fiscal year ended December 30, 2005).
10.23+ Supply Agreement for medical device components dated March 31, 2006, between Greatbatch, Inc. and SORIN/ELA BIOMEDICA CRM and ELA MEDICAL SAS (incorporated by reference to Exhibit 10.1 to our Quarterly Report on Form 10-Q for the quarterly period ended March 31, 2006).
10.24 Form of Exchange and Purchase Agreement dated March 22, 2007, by and between Greatbatch, Inc. and certain other parties thereto. (Incorporated by reference to Exhibit 10.1 to our Current Report on Form 8-K filed on March 29, 2007).
10.25+ Amendment No. 2 to Supplier Partnering Agreement, effective as of July 27, 2005, between Greatbatch, Inc. and Pacesetter, Inc. d/b/a St. Jude Medical CRMD (incorporated by reference to Exhibit 10.1 to our Quarterly Report on Form 10-Q for the quarter ended March 30, 2007).
10.26+ Amendment No. 2 to Supplier Partnering Agreement, effective as of January 1, 2006, between Greatbatch, Inc. and Pacesetter, Inc. d/b/a St. Jude Medical CRMD (incorporated by reference to Exhibit 10.2 to our Quarterly Report on Form 10-Q for the quarter ended March 30, 2007).
10.27+ Amendment No. 4 to Supplier Partnering Agreement, effective as of January 1, 2006, between Greatbatch, Inc. and Pacesetter, Inc. d/b/a St. Jude Medical CRMD (incorporated by reference to Exhibit 10.3 to our Quarterly Report on Form 10-Q for the quarter ended March 30, 2007).

120
10.28+ Amendment No. 5 to Supplier Partnering Agreement, effective as of March 1, 2007, between Greatbatch, Inc. and Pacesetter, Inc. d/b/a St. Jude Medical CRMD (incorporated by reference to Exhibit 10.4 to our Quarterly Report on Form 10-Q for the quarter ended March 30, 2007).
10.29+ Amendment No. 6 to Supplier Partnering Agreement, effective as of March 1, 2007, between Greatbatch, Inc. and Pacesetter, Inc. d/b/a St. Jude Medical CRMD (incorporated by reference to Exhibit 10.5 to our Quarterly Report on Form 10-Q for the quarter ended March 30, 2007).
10.30+ Supply Agreement between Cardiac Pacemakers, Inc. (d/b/a Boston Scientific) and Greatbatch, Ltd., 2007 - 2010, effective July 1, 2007 (incorporated by reference to Exhibit 10.1 to our Quarterly Report on Form 10-Q for the quarter ended June 29, 2007).
12.1* Ratio of Earnings to Fixed Charges (Unaudited)
21.1* Subsidiaries of Greatbatch, Inc.
23.1* Consent of Independent Registered Public Accounting Firm
31.1* Certification of Chief Executive Officer pursuant to Rule 13a-14(a) of the Securities Exchange Act.
31.2* Certification of Chief Financial Officer pursuant to Rule 13a-14(a) of the Securities Exchange Act.
32.1* Certification of Chief Executive Officer and Chief Financial Officer pursuant to 18 U.S.C. Section 1350 as adopted pursuant to Section 906 of the Sarbanes-Oxley Act of 2002.
Portions of those exhibits marked “+” have been omitted and filed separately with the Securities and Exchange Commission pursuant to a request for confidential treatment.
* - Filed herewith.
# - Indicates exhibits that are management contracts or compensation plans or arrangements required to be filed pursuant to Item 14(c) of Form 10-K.

1
EXHIBIT 12.1
RATIO OF EARNINGS TO FIXED CHARGES (Unaudited)
Jan. 2, Dec. 28, Dec. 29, Dec. 30, Dec. 31,2009 2007 2006 2005 2004
Earnings:Income before income taxes 27,303$ 28,688$ 23,534$ 15,464$ 23,732$ Pretax charges (credits) (162) (21) - (30) -
Fixed Charges:Interest expense 10,435 5,427 3,966 3,965 3,857 Capitalized interest 171 22 - 32 - Discounts & deferred financing fees 2,797 2,198 719 703 678 Interest portion of rental expense 850 574 584 502 354
Total earnings and fixed charges 41,394$ 36,888$ 28,803$ 20,636$ 28,621$
Fixed Charges:Interest expense 10,435$ 5,427$ 3,966$ 3,965$ 3,857$ Capitalized interest 171 22 - 32 - Discounts & deferred financing fees 2,797 2,198 719 703 678 Interest portion of rental expense 850 574 584 502 354
Total fixed charges 14,253$ 8,221$ 5,269$ 5,202$ 4,889$
Ratio of earnings to fixed charges 2.9 4.5 5.5 4.0 5.9
Year-ended

1
EXHIBIT 21.1
SUBSIDIARIES OF GREATBATCH, INC. Subsidiary Incorporated
Greatbatch Ltd. (direct subsidiary of Greatbatch, Inc.)
New York
Greatbatch LLC (direct subsidiary of Greatbatch Ltd.)
Delaware
Greatbatch Tecnologias de Mexico, S. de C.V. (owned 99% by Greatbatch LLC & 1% by Greatbatch, Inc.)
Mexico
Greatbatch-Hittman, Inc. (direct subsidiary of Greatbatch Ltd.)
Delaware
Electrochem Solutions, Inc. (direct subsidiary of Greatbatch Ltd.)
Massachusetts
Greatbatch-Globe Tool, Inc. (direct subsidiary of Greatbatch Ltd.)
Minnesota
Electrochem Solutions, Inc. (direct subsidiary of Electrochem Solutions, Inc.)
Delaware
Precimed, Inc. (direct subsidiary of Greatbatch Ltd.)
Pennsylvania
P Medical Holding SA (direct subsidiary of Greatbatch Ltd.)
Switzerland
Precimed SA (direct subsidiary of P Medical Holding SA)
Switzerland
Precimed France SAS (direct subsidiary of Precimed SA)
France

1
EXHIBIT 23.1
CONSENT OF INDEPENDENT REGISTERED PUBLIC ACCOUNTING FIRM
We consent to the incorporation by reference in Registration Statement No’s. 333-61476, 333-97209, 333-129002, and 333-143519 on Form S-8, Post-Effective Amendment No. 1 to Registration Statement No. 333-107667 on Form S-3, and Registration Statement No. 333-142400 on Form S-3 of our reports dated March 3, 2009, relating to the consolidated financial statements and consolidated financial statement schedule of Greatbatch, Inc. and subsidiaries (the “Company”), and the effectiveness of the Company’s internal control over financial reporting, appearing in this Annual Report on Form 10-K of the Company for the year ended January 2, 2009.
Buffalo, New York March 3, 2009

1
EXHIBIT 31.1 CERTIFICATION
I, Thomas J. Hook, certify that:
1. I have reviewed this report on Form 10-K for the fiscal year ended January 2, 2009 of Greatbatch, Inc.;
2. Based on my knowledge, this report does not contain any untrue statement of a material fact or omit to state a material fact necessary to make the statements made, in light of the circumstances under which such statements were made, not misleading with respect to the period covered by the report;
3. Based on my knowledge, the financial statements, and other financial information included in this report, fairly present in all material respects the financial condition, results of operations and cash flows of the registrant as of, and for, the periods presented in this report;
4. The registrant’s other certifying officer and I are responsible for establishing and maintaining disclosure controls and procedures (as defined in Exchange Act Rules 13a-15(e) and 15d-15(e)) and internal control over financial reporting (as defined in Exchange Act Rules 13a-15(f) and 15d-15(f)) for the registrant and have:
a. Designed such disclosure controls and procedures, or caused such disclosure controls and procedures to be designed under our supervision, to ensure that material information relating to the registrant, including its consolidated subsidiaries, is made known to us by others within those entities, particularly during the period in which this report is being prepared;
b. Designed such internal control over financial reporting, or caused such internal control over financial reporting to be designed under our supervision, to provide reasonable assurance regarding the reliability of financial reporting and the preparation of financial statements for external purposes in accordance with generally accepted accounting principles;
c. Evaluated the effectiveness of the registrant’s disclosure controls and procedures and presented in this report our conclusions about the effectiveness of the disclosure controls and procedures, as of the end of the period covered by this report based on such evaluation;
d. Disclosed in this report any change in the registrant’s internal control over financial reporting that occurred during the registrant’s most recent fiscal quarter (the registrant’s fourth fiscal quarter in the case of an annual report) that has materially affected, or is reasonably likely to materially affect, the registrant’s internal control over financial reporting.

2
5. The registrant’s other certifying officer and I have disclosed, based on our most recent evaluation of internal control over financial reporting, to the registrant’s auditors and the audit committee of registrant’s board of directors (or persons performing the equivalent functions):
a. All significant deficiencies and material weaknesses in the design or operation of internal control over financial reporting which are reasonably likely to adversely affect the registrant’s ability to record, process, summarize and report financial information; and
b. Any fraud, whether or not material, that involves management or other employees who have a significant role in the registrant’s internal control over financial reporting.
Date: March 2, 2009
Thomas J. Hook President & Chief Executive Officer (Principal Executive Officer)

1
EXHIBIT 31.2 CERTIFICATION
I, Thomas J. Mazza, certify that:
1. I have reviewed this report on Form 10-K for the fiscal year ended January 2, 2009 of Greatbatch, Inc.;
2. Based on my knowledge, this report does not contain any untrue statement of a material fact or omit to state a material fact necessary to make the statements made, in light of the circumstances under which such statements were made, not misleading with respect to the period covered by the report;
3. Based on my knowledge, the financial statements, and other financial information included in this report, fairly present in all material respects the financial condition, results of operations and cash flows of the registrant as of, and for, the periods presented in this report;
4. The registrant’s other certifying officer and I are responsible for establishing and maintaining disclosure controls and procedures (as defined in Exchange Act Rules 13a-15(e) and 15d-15(e)) and internal control over financial reporting (as defined in Exchange Act Rules 13a-15(f) and 15d-15(f)) for the registrant and have:
a. Designed such disclosure controls and procedures, or caused such disclosure controls and procedures to be designed under our supervision, to ensure that material information relating to the registrant, including its consolidated subsidiaries, is made known to us by others within those entities, particularly during the period in which this report is being prepared;
b. Designed such internal control over financial reporting, or caused such internal control over financial reporting to be designed under our supervision, to provide reasonable assurance regarding the reliability of financial reporting and the preparation of financial statements for external purposes in accordance with generally accepted accounting principles;
c. Evaluated the effectiveness of the registrant’s disclosure controls and procedures and presented in this report our conclusions about the effectiveness of the disclosure controls and procedures, as of the end of the period covered by this report based on such evaluation;
d. Disclosed in this report any change in the registrant’s internal control over financial reporting that occurred during the registrant’s most recent fiscal quarter (the registrant’s fourth fiscal quarter in the case of an annual report) that has materially affected, or is reasonably likely to materially affect, the registrant’s internal control over financial reporting.

2
5. The registrant’s other certifying officer and I have disclosed, based on our most recent evaluation of internal control over financial reporting, to the registrant’s auditors and the audit committee of registrant’s board of directors (or persons performing the equivalent functions):
a. All significant deficiencies and material weaknesses in the design or operation of internal control over financial reporting which are reasonably likely to adversely affect the registrant’s ability to record, process, summarize and report financial information; and
b. Any fraud, whether or not material, that involves management or other employees who have a significant role in the registrant’s internal control over financial reporting.
Date: March 2, 2009 _______________________ Thomas J. Mazza Senior Vice President & Chief Financial Officer (Principal Financial Officer)

1
EXHIBIT 32.1
CERTIFICATION PURSUANT TO 18 U.S.C. SECTION 1350 AS ADOPTED PURSUANT TO SECTION 906 OF THE SARBANES-OXLEY ACT OF 2002
Pursuant to 18 U.S.C. Section 1350 as adopted pursuant to Section 906 of the Sarbanes-Oxley Act of 2002, each of the undersigned officers of Greatbatch, Inc. (the “Company”), does hereby certify, to such officer's knowledge, that: The Annual Report on Form 10-K for the fiscal year ended January 2, 2009 (the “Form 10-K”) of the Company fully complies with the requirements of section 13(a) or 15(d) of the Securities Exchange Act of 1934 and the information contained in the Form 10-K fairly presents, in all material respects, the financial condition and results of operations of the Company. Dated: March 2, 2009
Thomas J. Hook President & Chief Executive Officer (Principal Executive Officer)
Dated: March 2, 2009
Thomas J. Mazza Senior Vice President & Chief Financial Officer
(Principal Financial Officer) This certification is being furnished solely to accompany this Form 10-K pursuant to 18 U.S.C. Section 1350, and is not being filed for purposes of Section 18 of the Securities Exchange Act of 1934, as amended, or otherwise, and is not to be incorporated by reference into any filing of the Company unless such incorporation is expressly referenced within.

TOP ROW:
Dr. Joseph A. Miller, Jr.Executive Vice President & Chief Technology Offi cer, Corning, Inc.
John P. WarehamNon-Executive Chairman,STERIS Corporation
William B. Summers, Jr.Retired Chairman & Chief Executive Offi cer,McDonald Investments, Inc.
Michael DinkinsExecutive Vice President & Chief Financial Offi cer,USI Insurance Services
Pamela G. BaileyPresident & Chief Executive Offi cer,The Grocery Manufacturers Association
Kevin C. MeliaFormer Non-Executive Chairman,IONA Technologies PLC
BOTTOM ROW:
Peter H. SoderbergPresident & Chief Executive Offi cer, Hill-Rom Holdings, Inc.
Bill R. Sanford, ChairmanFounder & Chairman,Symark LLC
Thomas J. HookPresident & Chief Executive Offi cer, Greatbatch, Inc.
Dr. Helena S. WisniewskiMember of the Naval Research Advisory Committee
Thomas J. HookPresident & Chief Executive Offi cer
Thomas J. Mazza RIGHT
Senior Vice President & Chief Financial Offi cer
Mauricio ArellanoSenior Vice President, Cardiac & Neurology
Susan M. BrattonSenior Vice President,Commercial
Susan H. CampbellSenior Vice President, Orthopaedics
Barbara M. Davis LEFT
Vice President, Human Resources
Richard M. FarrellVice President, QIG
Timothy G. McEvoy CENTER
Vice President, General Counsel & Secretary
INVESTOR
INFORMATION
Shareholders, securities analysts, and investors seeking more information about the company can access information via the Internet or from the Investor Relations Department:
10000 Wehrle DriveClarence, NY 14031www.greatbatch.com
TRANSFER AGENT
AND REGISTRAR
BNY Mellon Shareowner Services480 Washington BoulevardJersey City, NJ 07310Tel: 800 288-9541TDD: 800 231-5469
INDEPENDENT
REGISTERED PUBLIC
ACCOUNTING FIRM
Deloitte & Touche LLP, Buff alo, NY
The company has fi led as exhibits to its Annual Report on Form 10-K for the year ended January 2, 2009, the Chief Executive Offi cer and Chief Financial Offi cer certifi cations required by Section 302 of the Sarbanes-Oxley Act.
On May 23, 2008, the Company submitted the required annual Chief Executive Offi cer certifi cation to the New York Stock Exchange, which stated he was not aware of any violation by the Company of the Exchange’s corporate governance listing standards.
BOARD OF DIRECTORS
SHAREHOLDER INFORMATION OFFICER CERTIFICATION
CORPORATE LEADERSHIP

www.greatbatch.com
©2009 Greatbatch, Inc. All rights reserved.
Greatbatch
10000 Wehrle DriveClarence, NY 14031tel 716-759-5600