
A Workforce Planning Framework for the Civil Service and Non Commercial State Bodies1
97
Guidelines A Workforce Planning Framework for the Civil Service and Non-Commercial State Bodies “Forecasting our future demands in the context of the business planning process to get the right people, with the right skills, in the right place at the right time.” Workforce PlanningTeam, Civil Service HR Directorate 1
-
Upload
bharichalo007 -
Category
Documents
-
view
6 -
download
0
description
Planning
Transcript of A Workforce Planning Framework for the Civil Service and Non Commercial State Bodies1

Guidelines
A Workforce Planning Framework
for the Civil Service
and Non-Commercial State Bodies
“Forecasting our future demands in the context of the business planning process to get the right people, with the right skills, in the right place at the right time.”
Workforce PlanningTeam, Civil Service HR Directorate
1

Contents
Users Guide...........................................................................................................................6
Context..................................................................................................................................8
Workforce Planning Process.................................................................................................9
Key Steps…………………………………………………………………………………………...12
Step 1 - Scope and Integration…………………………………………………………………...14
Step 2 – Analyse Demand………………………………………………………………………...14
Step 3 – Analyse Supply…………………………………………………………………………..16
Step 4 – Conduct a Gap Analysis………………………………………………………………..18
Step 5 – Create Strategy and Plan………………………………………………………………20
Step 6 – Implement and Evaluate………………………………………………………………..23
Appendix 1: Action Plan - Structure....................................................................................26
Appendix 2 – Worksheets....................................................................................................28
Appendix 3: Staff Skills Survey Form..................................................................................32
Appendix 4: Dublin City Questionnaires..............................................................................40
Appendix 5: Succession Planning.......................................................................................54
Appendix 6 - Sample Templates.........................................................................................60
2

3

4
B C
Programme level Performance Budgeting
Framework
Statement of Strategy
Staffing needs
Profile of Vote Group
A
Dynamic Action PlanEnd June 2012 (iterative)
ECF disciplines 2012-2015
Depts/Offices/NCSSBs
Skills
B
C
D
E
Age Profile
Grade Location
Policy Enablers
-Amendment to the PSM Act
2004 to facilitate mobility
-Limited Recruitment &
Promotion
Gap Analysis
Requirements relative to Surplus or Deficit

5

Users Guide
This framework is intended to provide a step-by-step guide to assist your organisation in preparing a Workforce Plan in support of your strategic and business planning objectives.
The Workforce Plan should flow from an analysis of your staffing needs relative to your business requirements using the 6 key steps of the Workforce Planning Process set out in this framework.
The framework provides a “toolkit” to assist your organisation in preparing its Workforce Plan and comprises
a suggested structure for your Workforce Plan - Appendix 1some key prompt questions which link directly to the planning steps - Appendix 2 a sample Staff Skills Survey form – Appendix 3a quantitative approach to identifying the key gaps in staffing - Appendix 4 an example of a formal methodology for Succession Planning - Appendix 5 sample templates for workforce analysis - Appendix 6
Complete 6 Key Steps
Main Document
Refer to Worksheets &
Questionnaires
Appendices 2, 3, 4 & 5
Refer to Templates for
Workforce AnalysisAppendix 6
Refer to Action Plan
Appendix 1 (Structure)
6

7

Context
Under the reform agenda it is intended to have an integrated approach to Public Service Reform which seeks to align a number of key initiatives including the Public Service Reform Plan, the Comprehensive Review of Expenditure (where relevant), the Public Service Agreement and any specific reform initiatives which are linked to the Programme for Government commitments. The Reform Delivery Office is responsible for coordinating the delivery of the Integrated Reform Delivery Plans.
This Workforce Planning Framework is a supporting initiative to the Public Service Reform Plan that has been developed by the Civil Service HR Directorate in the Department of Public Expenditure and Reform for the civil service and non-commercial Semi State bodies. Separate workforce plans will be developed by individual sectors in the public service including the Health, Education, Local Authority, Justice and Defence sectors.
The Government is committed to achieving a planned reduction of 37,500 staff in the public service to 282,500 by 2015, from a peak of 320,000 in 2008. Workforce Planning is intended to help organisations deploy staffing resources more optimally, especially in the context of this planned reduction of 12% in public service numbers over the medium term.
The challenge for each sector will be to manage this reduction in staffing levels while maintaining a high level of service delivery to clients and policy support to Government. While the primary focus of public service numbers policy will remain the reduction in the public service pay bill, there will be opportunities for selective recruitment in the coming years to reinforce the upskilling and reform of the civil service.
It will be a matter for local and departmental management and their agencies to identify emerging skills gaps, whether arising from staff turnover or from changes in the external environment, which require new responses and new skill sets.
The civil service has to operate efficiently and effectively against the backdrop of these workforce pressures and address potential loss of corporate memory. The challenge is to develop a leaner, more efficient and sustainable civil service capable of delivering better value for money outcomes.
“Workforce planning is an essential tool for anticipating possible future developments and maintaining a well-structured workforce of an
appropriate size, which is able to meet the changing needs of the public service in a cost-efficient manner”
OECD (2011), Public Servants as Partners for Growth: Toward a Stronger, Leaner and More Equitable Workforce, OECD Publishing.
8
Workforce Planning Process
Workforce planning is a process to measure and compare your current workforce (supply) with your future workforce (demand) relative to your organisation’s strategy and business planning process. An organisation operates most effectively when the right people with the right knowledge, skills and competencies are deployed appropriately.
Workforce planning should focus on the size and composition of your workforce, its deployment across your organisation, and the knowledge, skills and competencies necessary to pursue your business objectives. It includes all managed movement into, around and out of your organisation including recruitment, promotion, secondment, transfer, redeployment, attrition and retention.
Workforce planning is about …..
developing an understanding of the internal and external environment and how those factors will affect your current and future workforce understanding the makeup of your current workforce and the knowledge, skills and competencies that you require to achieve your intended business goals in the current and changing environmentlinking human resources strategies with your business objectives thinking about future service pressures and needs, and putting in place staffing strategies to address these
A Workforce Planning system should….
be holistic in its approach and link with your strategic/business planning and budget processes be built around service needs and the competencies/skills required to deliver a quality service be responsive to change variables such as the economic, technological and Government mandates be supportive of continual learning and development concepts be data driven to allow for scenario building with changing assumptions for different desired outcomes identify potential problems and manage riskdevelop workforce skills that take time to growtake account of regional structures optimise the use of human, financial and other resources
The structure of your organisation will partly determine how the process of workforce planning, including consultation and data retrieval, should be progressed.
9

Regardless of the process chosen, senior management in each organisation will need to ask what elements of work are critical, important or desirable. Some key questions would include for example …..
Where is your organisation going and what is its intended growth in the next 3-5 years and into the longer term? Which areas of its work will reduce or stop and which will grow? Which areas of its work will be delivered differently and in what ways? How can technological advancements help what your organisation does?
Accurate forecasting is important if organisations are to avoid having ….
a surplus of employees who are not fully and effectively deployed, or a deficit of employees which may result in reduced productivity and a sub-optimal performance.
An overriding requirement of any workforce plan is that it should be sustainable, affordable and value for money.
In many cases challenging choices and decisions will have to be made between service needs and financial constraints.
“The current economic, financial and demographic context demands careful workforce planning and strategic management of human
resources, to ensure that the public service maintains the capacity for service delivery.”
OECD (2011), Public Servants as Partners for Growth: Toward a Stronger, Leaner and More Equitable Workforce, OECD Publishing.
10
11

Key Steps
12
SCOPE AND INTEGRATE
STEP 1
ANALYSE DEMAND
STEP 2
ANALYSE SUPPLY
STEP 3
CONDUCT GAP ANALYSIS
STEP 4
CREACREATE STRATEGY & PLAN
STEP 5
IMPLEMENT & EVALUATE
STEP 6

13

Step 1 - Scope and Integration
Who The Workforce Action Plan should be developed by Government departments and offices as well as non-commercial semi-state bodies (NCSSBs). Departments should liaise with their respective NCSSBs to coordinate a Vote Group Plan that reflects the high level goals, outputs and outcomes of their Programmes under the performance budgeting initiative and the expenditure ceilings set out in the Medium Term Expenditure Framework.
WhenThe focus of the plan should be on the medium term (3-5 years) but your workforce plan should highlight shorter term (1-2 years) challenges to address the impact of fiscal consolidation measures. Where there is scope to forecast beyond 5 years that could be factored into the workforce forecasts.
Integrated with what Workforce planning should flow from the strategic planning process which should be informed and influenced by the Integrated Reform Delivery Plan. Your staffing needs should flow from your business needs. The strategic plan (and the supporting business planning process) specifies what is to be done while the workforce plan delineates who should be employed to do the work effectively. Together, the strategic plan and the workforce plan drive an organisation’s performance.
How oftenWorkforce planning is an iterative process and needs to be reviewed regularly in order to respond to changing circumstances. Ongoing monitoring will be required to ensure that your workforce plan remains current and aligned to the business needs of your organisation.
Step 2 – Analyse Demand
Your staffing needs should flow from your business needs. Demand analysis is about extracting from your Statement of Strategy and Business plans the “key business drivers” which will apply either upward or downward pressures on your organisation’s future staffing levels.
In preparing a Statement of Strategy your organisation will have set out its key objectives and priorities to reflect the Programme for Government, the Public Service Reform agenda and any other sector-specific policy initiatives.
14

Your Statement of Strategy, allied to the Business Plans which flow from it, will typically have taken account of any important environmental factors1 which are likely to impact on the achievement of your organisation’s goals and objectives for the future.
Every organisation will have unique business pressures exerting influence on its staffing but some general examples which might apply across organisations would include:
Downward Pressures Upward Pressures
Electronic channels/self-serviceStreamlining of operationsElimination of unnecessary or duplicate processesShared servicesSimplificationStructural & organisational reforms
New programmesIncreases in international commitmentsIncreases in the demand for State servicesAdditional statutory & regulatory requirements EU Presidency commitments in the short term
HR Sections should consult with managers across their organisation at an appropriate level to identify any upward or downward pressures on their staffing levels both in the short term (1-2 years) and the medium term (over the next 3-5 years). It would be important for your organisation in its Workforce Action Plan to list these pressures, to elaborate on the nature of the pressures and describe how they impact on your organisation’s future staffing. For
1 PESTLE, SWOT and the McKinsey 7S model are techniques often used in environmental analysis.15
Key Reference Documents in Workforce Planning
Statements of Strategy and Business Plans
Estimates for your Vote Group
Public Service Reform Plan /Integrated Reform Delivery Plans
Sector specific initiatives on foot of Programme for Government Commitments
Action Plans: Public Service Agreement 2010 – 2014Comprehensive Review of Expenditure (CRE)
Organisational Reviews

example, each manager should clearly identify upward pressures on staffing which are related solely to seasonal factors or to a particular year (which would suggest the use of temporary or contract staff) as opposed to more permanent staffing requirements. The workforce planning process then becomes a method for informing HR decisions on prioritisation of requests for new posts from line divisions/sections.
Some key questions for managers in relation to demand analysis might include the following.
What new or changed services do you foresee in the short term 1-2 years and the next 3 to 5 years? How will your business units be structured for tomorrow’s business? What skills or competencies will you require to carry out your future work functions? What technology or process re-engineering could be used to improve your service delivery?
Step 3 – Analyse Supply
This step involves analysing the attributes of your current workforce. Workforce analysis relies heavily on the proper collection and evaluation of data. Data can come from a variety of sources.
Primary sources of data include the following….
16
the civil service HRMS systemrole profiles - competenciesskills databases interviews at appropriate level in the organisation staff surveysfocus groups and workshopsIntegrated Reform Delivery Plans Organisational Reviews process mapsreports of Management Services Units

Analysis of your current staffing levels and the composition of your current workforce should consider the following ….
What posts now exist?How many people are working in a particular area?How essential is each post?Are there posts that are no longer needed?What is the use of temporary versus permanent staff?
In relation to information on the skills and experience of your staff, best practice indicates that HR Managers should develop (if they have not already done so) a database detailing in respect of each staff member:
their professional qualifications/ relevant training, their key experience across the key functional areas of their organisation (e.g. HR, IT, Industrial Relations, Finance, Communication, Project Management, Procurement, Policy Analysis and Specialist areas such as Taxation, Intellectual Property etc.), and
their key competencies.
A Staff Survey Form to capture skills and qualifications devised by the Training Branch of the Revenue Commissioners is set out in Appendix 3 for your information.
In relation to the presentation of supply data in your Workforce Action Plan generally, you can include any workforce dimensions that you consider important to your organisation’s business but these would normally include the following ….
staff numbers (headcount, full-time, part-time, contract) grades by category (General Service, Professional, Technical & Industrial) an organisation chart showing staff categorised on a functional basis - in the private sector for example the categories might be along the lines of personnel, purchasing, production, sales, finance, and distribution or on the product lines the company sellsa profile of staff by age, years of service, gender, location, qualifications, experience and/or competenciesimportant trends affecting future staff levels such as employment control framework targets, projections in relation to retirements, career breaks, transfers, redeployments, promotions (internal and external), and sick leave patterns historical trends can be useful to illustrate how staffing levels have changed in recent years, e.g. the last 3 to 5 years
Supply data for the purpose of profiling and trend analysis in the civil service may be obtained from the civil service HRMS system. Some data collection may require consultation and dialogue with managers at section or division level. The size and complexity of your organisation will determine the approach which is most appropriate to it.
17
Step 4 – Conduct a Gap Analysis
Gap analysis is the process of comparing your current workforce supply (Step 3) to your workforce demand (Step 2) and identifying gaps (deficits or surpluses). The process of identifying the differences between supply and demand establishes the roadmap for your organisation’s Workforce Action Plan. A risk assessment can be undertaken for each gap – how are strategic intents and desired outcomes impacted by the gap? You should prioritise those gaps that are critical to the delivery of your organisation’s future goals. Your focus should be on these gaps at least initially.
Gaps in a workforce can be defined in terms of specific grades, skills and experience, competencies or some combination of these;
grade (general service, professional, technical, industrial)
skills (professional qualifications & relevant training);
experience (e.g. HR, IT, Industrial Relations, Finance, Communication, Project Management, Procurement, Policy Analysis and Specialist areas such as Taxation, Intellectual Property etc.) and/or
core competencies - the behavioral characteristics that a person needs to perform a particular job effectively
Competencies can be developed for an organisation, or part of an organisation or for grades or specific posts. In the case of the Irish civil service, the following competencies have been developed under the PMDS system for training and development purposes:
Personal Effectiveness
Self ConfidenceAchievement, Drive & Commitment InitiativeTeamworkingCommunications
Thinking Style & Problem Solving
Analytical ThinkingConceptual ThinkingDecision Making & JudgmentSpecialised Expertise
Managing for Results
Managing Budgets & ResourcesInformation Seeking & ManagementConcern for Clarity & Work Quality
Group & Interpersonal Effectiveness
Networking/InfluencingInterpersonal UnderstandingCustomer ServiceManaging & Developing PeopleLeadership
18
Competencies have also been developed by the Public Appointment Service for the purposes of selection and recruitment in the civil service.
In a competency-based model, a workforce gap arises wherever the proficiency level for a competency is not being met by any member or segment of the organisation, or where there is difference between the level of proficiency identified for each competency, and the level of proficiency currently demonstrated by each member or segment of the workforce.
In attempting to identify skills gaps it may be useful to consider focusing your attention on particular posts within sections/divisions that deliver essential services. Workforce Segmentation involves identifying the segments of the workforce which are the most critical to the effectiveness your organisation.
19
Competencies are the characteristics that a person needs to perform their job effectively. These characteristics are effectively a demonstration of a combination of the knowledge, skills, abilities, and personal attributes that an individual brings to a situation and influences the way that individual interacts with the situation. Competencies are used primarily for selection and recruitment purposes and for identifying training and development needs.

Critical workforce segments are the positions that
are highly skilled, highly trained
provide a disproportionate amount of value
“make or break” a strategy
have the most valuable skills and
are generally the hardest to replace
By identifying critical workforce segments in your organisation you are seeking to ensure that your organisation secures an adequate supply of its most indispensable resources.
A quantitative-based questionnaire developed by Dublin City Council which seeks to identify priority business areas and the adequacy of staffing levels is set out in Appendix 4. It would need to be adapted by individual organisations to suit their particular business circumstances.
Step 5 – Create Strategy and Plan
Your Department/Office can create a Workforce Action Plan based on information collected through the gap analysis process and discussions with managers at section or division level and the MAC. This input will be the basis for determining solution strategies that can be considered to eliminate identified gaps. By the time you get to this point, you will have a clear picture of the issues and challenges faced across your organisation by division, functional areas, grades, etc.
Critically it is senior management in each organisation that must facilitate this process and signal buy-in to the process.
The following questions will be of particular relevance in formulating your Action Plan.
What are the three to five most critical workforce planning challenges facing your organisation today? What are the most common themes that emerged from your dialogue with managers and supervisors? What is the organisational impact if these challenges are not addressed? What, if any, actions are underway to address these challenges?
20

Is there enough time to develop staff internally for anticipated vacancies or new skill sets, or is use of redeployment options or targeted external recruitment the best approach?
Does your organisation have a policy of succession planning?Do existing staff demonstrate the potential or interest to develop new skills and assume new or modified positions? What is PMDS telling you in relation to the performance management of your staff and their training and development needs?What labour market competition exists for future skills (IT, Legal, Financial Analysis, and Intellectual Property)?Do current job classifications and post descriptions reflect future functional requirements and skills?
Do some divisions/sections need to be reorganised to meet business needs and strategic objectives? Is restructuring or rationalisation needed?
What are the recommended solution strategies that the organisation can take to address the challenges?
Are there areas of work where internal process improvement is needed?
Is outsourcing an option?
What will be required in terms of human and financial resources to carry out these strategies?
The HR area is typically the primary recipient of the Workforce Planning output and is normally but not exclusively responsible for executing the Action Plan.
Addressing Skill Gaps
HR mangers will need to explore the full-range of options when seeking to fill any skill gaps that have been identified. The options to consider include:
upskilling your existing staff to bridge the skills gaps (staff training and development)
redeploying suitable staff from within your organisation and realigning your work where necessary (mobility and restructuring)
redeploying suitable staff from other areas of the civil service where there are surplus staff (redeployment from within the civil service)
redeploying suitable staff from the NCSSBs where there are surplus staff
21

(redeployment or secondment from within your Vote Group)
redeploying suitable staff from the wider public service with surplus staff (redeployment or secondment from wider public service)
Use of outsourcing to perform a function
promotion and/ targeted recruitment (when all the above options have been exhausted)
Succession Planning
A key issue currently in the public service is the need for some form of succession planning. Succession planning identifies the key or critical positions that will become vacant within a specified amount of time (typically from 18 months to five years) and the competencies necessary to do the work associated with these positions. Its goal is similar to workforce planning, i.e. having “the right people in the right positions at the right time.” The focus of succession planning is on “key” positions critical to the mission of the organisation at all levels.
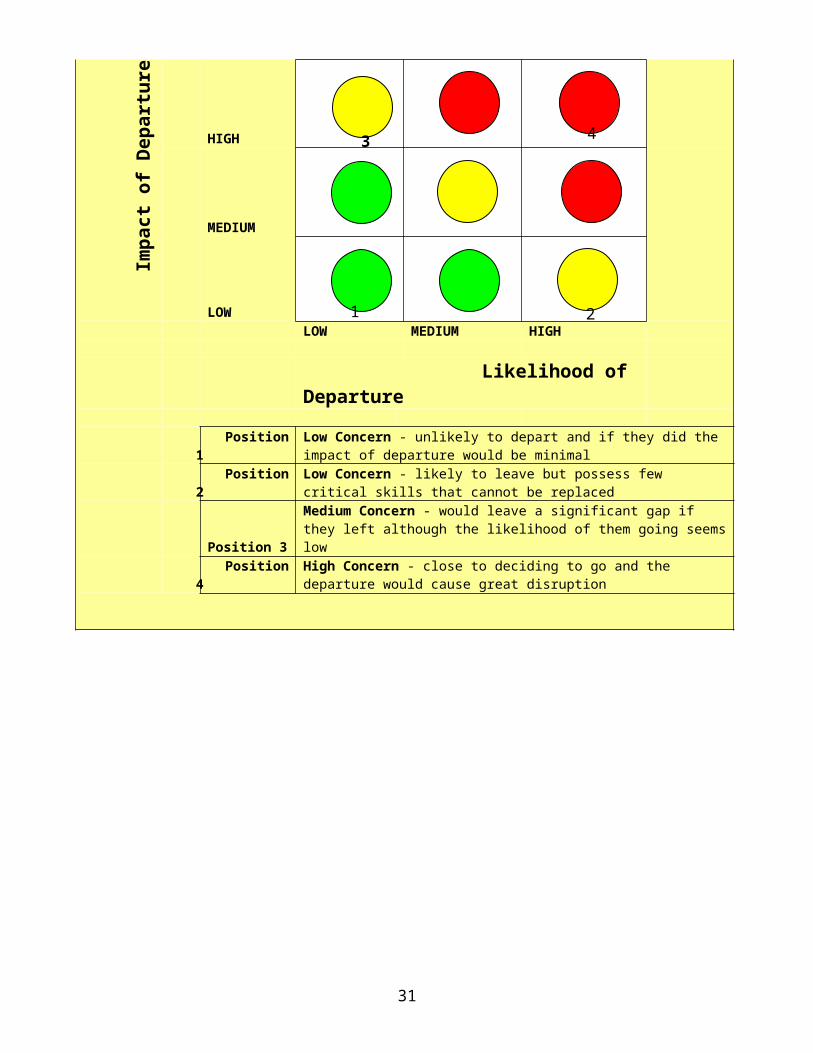
In the diagram below, for example, the areas highlighted in red are the areas of greatest risk where managers need to focus retention or succession planning efforts. The green areas are of limited concern, while the yellow areas are where managers need to keep a ‘watching brief’.
Risk Assessment Matrix
Imp
act
of
Dep
artu
re
HIGH
MEDIUM
LOW LOW MEDIUM HIGH
Likelihood of Departure Position 1 Low Concern - unlikely to depart and if they did the impact of departure
22
3
4
1
2

would be minimal
Position 2Low Concern - likely to leave but possess few critical skills that cannot be replaced
Position 3Medium Concern - would leave a significant gap if they left although the likelihood of them going seems low
Position 4High Concern - close to deciding to go and the departure would cause great disruption
23

“Key positions” might include leadership positions or specialist positions or roles that may be technical, or content–specific or otherwise hard to replace. (These positions should already have been identified under Step 4 of the planning process above and should not require a separate exercise.)
The succession planning process identifies and prepares suitable employees through mentoring, training and job rotation, to replace key players within an organisation as those key players leave their positions for whatever reasons – retirement, advancement, attrition, etc. Positions should be prioritised for succession planning based on this analysis. Department’s may assign a numerical value to the High, Medium and Low assessments in order to create a rank order of positions for succession planning. Alternatively, departments may choose to focus on positions rated high for both vacancy risk and impact . A formal structured approach to succession planning is set out in Appendix 5 for information.
At a minimum succession planning should involve the following:
identifying the critical posts at an early stage
ensuring that replacement staff have the skills, knowledge and competencies to perform these jobs through job rotation or formal training
assigning a successor to shadow the current holder of the key post for a transition period before s/he leaves
an agreed procedure for the handover of work and responsibilities (key documents including a comprehensive briefing note of key issues, a role profile, a section manual, a list of key contacts and key files etc.)
doing it now – don’t wait until you have only four weeks to fill a key position
Step 6 – Implement and Evaluate
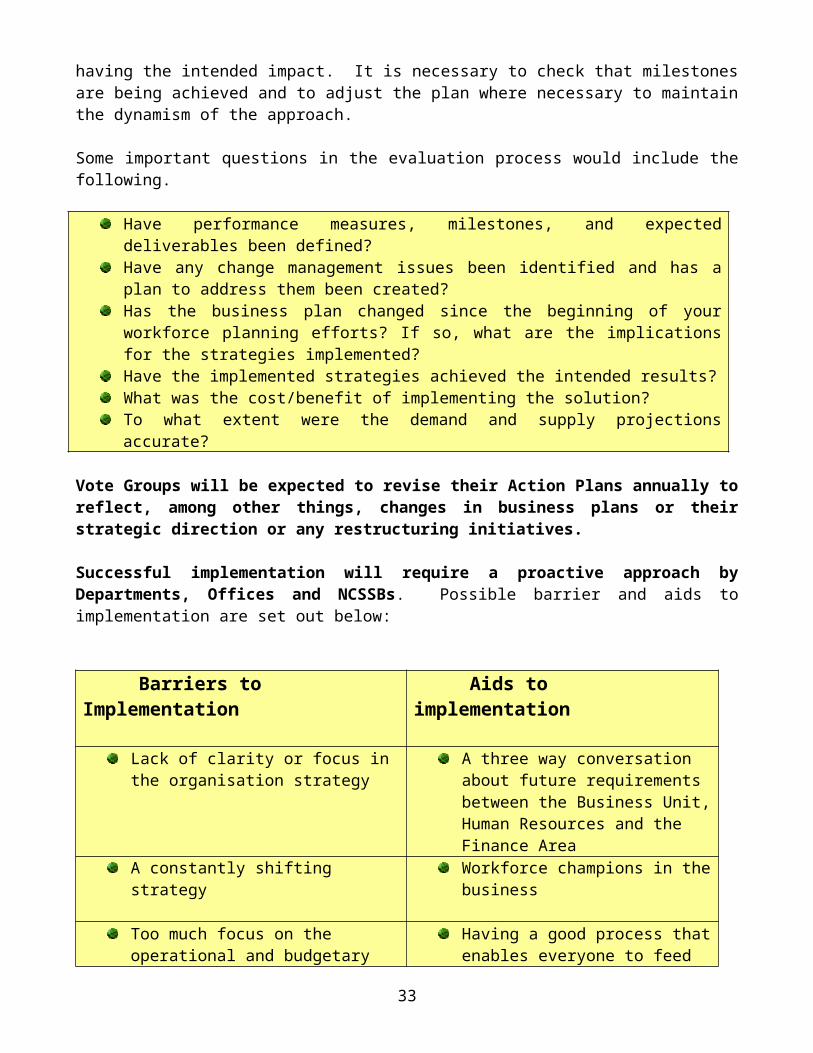
Workforce planning is not a one-off activity. There is a need to monitor the progress of agreed actions and assess whether they are having the intended impact. It is necessary to check that milestones are being achieved and to adjust the plan where necessary to maintain the dynamism of the approach.
Some important questions in the evaluation process would include the following.
Have performance measures, milestones, and expected deliverables been defined?Have any change management issues been identified and has a plan to address them been created?Has the business plan changed since the beginning of your workforce planning efforts? If so, what are the implications for the strategies implemented?Have the implemented strategies achieved the intended results?What was the cost/benefit of implementing the solution?To what extent were the demand and supply projections accurate?
24

Vote Groups will be expected to revise their Action Plans annually to reflect, among other things, changes in business plans or their strategic direction or any restructuring initiatives.
Successful implementation will require a proactive approach by Departments, Offices and NCSSBs. Possible barrier and aids to implementation are set out below:
Barriers to Implementation Aids to implementation
Lack of clarity or focus in the organisation strategy
A three way conversation about future requirements between the Business Unit, Human Resources and the Finance Area
A constantly shifting strategy Workforce champions in the business
Too much focus on the operational and budgetary planning at the expense of longer-term planning or a strategic direction for planning
Having a good process that enables everyone to feed in information that is informed by the needs of the business
Processes that don’t join up, meaning information is not fed into the planning cycle or that effort is duplicated
Human Resources and line management working together to understand future staffing needs
Failure to develop plans that are responsive enough to adapt to a changing environment
Understanding the difference between supply and demand for labour
Failure to review plans in the light of new information that indicates change
Bottom-up communication feeding the planning process
Poor quality data/systems Good quality data that people can believe, accompanied by sufficient analysis to explain what it means for the business
Too much focus on the numbers of people required and not enough on capacity and potential to develop new skills and abilities in the future
Managers acting on the data to make informed decisions
An over complicated system or trying to do too much too soon
Regular planning cycle and reviews with feedback into the planning process
Lack of planning skills and good guidance on workforce planning
Developing managers’ workforce and resource planning skills
25

26

27
Appendix 1: Action Plan - Structure
Overview &
Executive Summary
Demand Forecasting
(Environmental Scanning)
Supply Forecasting(Profiling & Trends)
Gap Analysis(Critical Posts & Segmentation)
Action Plan(Range of Options)
28

29

Appendix 2 – Worksheets
The following worksheets link to the 6 steps of the Workforce Planning Process
Worksheet 1 – Scope and Integration
What are the key issues and challenges facing the Department/Office that will affect its mission, values, strategies, and goals in the next 1-2 years and the next 3-5 years?
How will the Department’s organisation structure look in 3 to 5 years? How will the current structure evolve?
What specific workforce issues/problems is your Department/Office facing?
What are the timeframes required to resolve each of the issues/problems?
What is the consequence if each issue/problem is not resolved in the required timeframe?
Worksheet 2 – Analyse Demand
What are the Government’s/customer’s expectations? How are they changing?
Are changes (including reforms) occurring in other divisions or sections that will impact on your the work functions?
Are you able to meet the current volume of work?
Which work functions will remain unchanged? Which functions may be discontinued? Will any work functions be consolidated?
Is the department planning to offer new services which will add new work functions to your division/section?
What are the competencies, skills and experience required to perform the work? How will this change in the future?
What technology changes will be made, or new technology introduced, that may impact your work functions?
How does your Department’s/Office’s regionalised structure affect your approach to workforce planning?
In what way will legislation impact on our Department/Office?
What provisions are likely to arise during negotiations with the unions and what impact might they have on the organisation?
30
Worksheet 3 – Analyse Supply
What jobs now exist?
How many people are performing each job?
How many staff have retired from your organisation in 2011 and 2012 prior to the end of February “Grace Period”?
What are the projected rates of retirement for your organisation for the rest of 2012 and for each of the years 2013, 2014 and 2015?
What are the other factors (e.g. resignations, redeployments, career breaks, transfers, promotions etc) affecting your attrition rates which are likely to change or remain constant?
What are the other factors affecting your attrition rates which are likely to change or remain constant?
What are the education and experience levels of the current staff?
How will you determine if existing staff possess the required level of competencies or skills?
Is there an adequate supply of people to recruit from redeployment, internal/external panel lists?
Do you anticipate any reorganisations which could impact the staffing supply?
What use is made if any of temporary/contract staff versus permanent staff?
Worksheet 4 – Analyse Gap
When you compare the future demand to the existing supply, is there a gap? If so, when will the gap occur (i.e. 1 year, 3 years, 5 years, and 10 years)? If there is a gap, will you have too many staff or too few staff by functional classification or grade?
What aspects of the divisions/section’s work can be classified as critical, important or desirable?
Are your critical and important workloads adequately staffed? If not, when will the critical workloads require additional staff support and for how long?
Can workforce gaps be filled or partially filled by way of redeployment?
31

What will occur if the gap is not addressed (i.e. what critical business outcomes will not be met)?
What priorities do the Government, customers and stakeholders place on the various workloads and business outcomes?
Are there other areas within your Department/Office from which you can draw suitable staff to fill skills gaps?
Is external recruitment required? Are there established internal/external promotion panels that can be used to fill the gaps? Have you considered using the intern placement scheme?
Is there any classification or grading issue that needs to be addressed to close the workforce gap?
Do existing staff need training to enhance their competencies and skills? If so, is training available? Do you need to develop specialised training?
Worksheet 5 - Create Strategy and Plans
What are the 3-5 most critical workforce planning challenges facing your organisation today?
Has management’s support for initial and on-going implementation of the workforce plan been secured?
What are the most common themes that emerged from your dialogue with managers?
What is the organisational impact if these challenges are not addressed?
What selection/recruitment strategies are you proposing and for what posts?
Is there enough time to develop staff internally for anticipated vacancies or new competencies, or is special, fast paced recruitment the best approach?
What staff development strategies should be considered to prepare employees for specific positions or classifications?
What knowledge transfer/mentoring strategies need to be considered to capture the knowledge of experienced employees before they leave your Department/Office?
Does your Department/Office need to be restructured to meet business needs and strategic objectives?
Have acceptable timelines been established and approved?
32
Worksheet 6 - Implement and Evaluate
Have performance measures, milestones, and expected deliverables been defined?
Have any change management issues been identified and a plan to address them been created?
Has a communication plan been established?
Has the business plan changed since the beginning of your workforce planning efforts? If so, what are the implications for the strategies implemented?
Have the implemented strategies achieved the intended results?
What worked well during the workforce planning effort?
What did not work well during the workforce planning effort?
What was the cost/benefit of implementing the solution?
To what extent were the demand and supply projections accurate?
Is a new analysis necessary before revising the strategies?
33
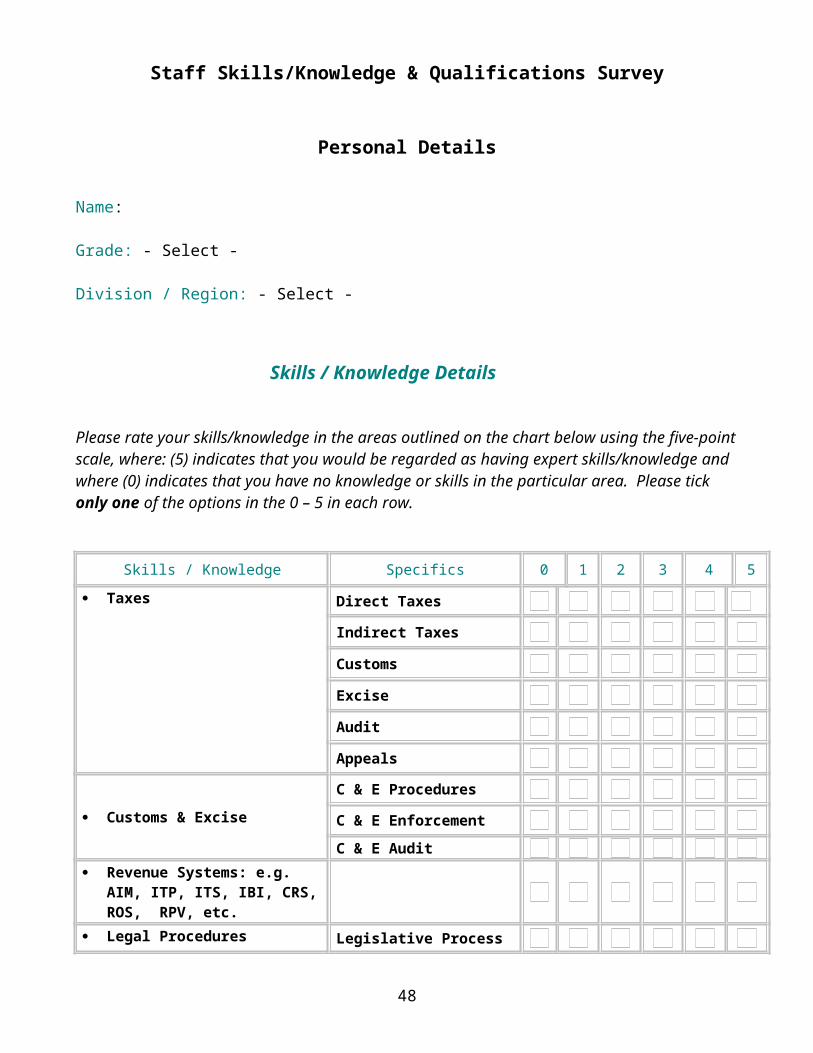
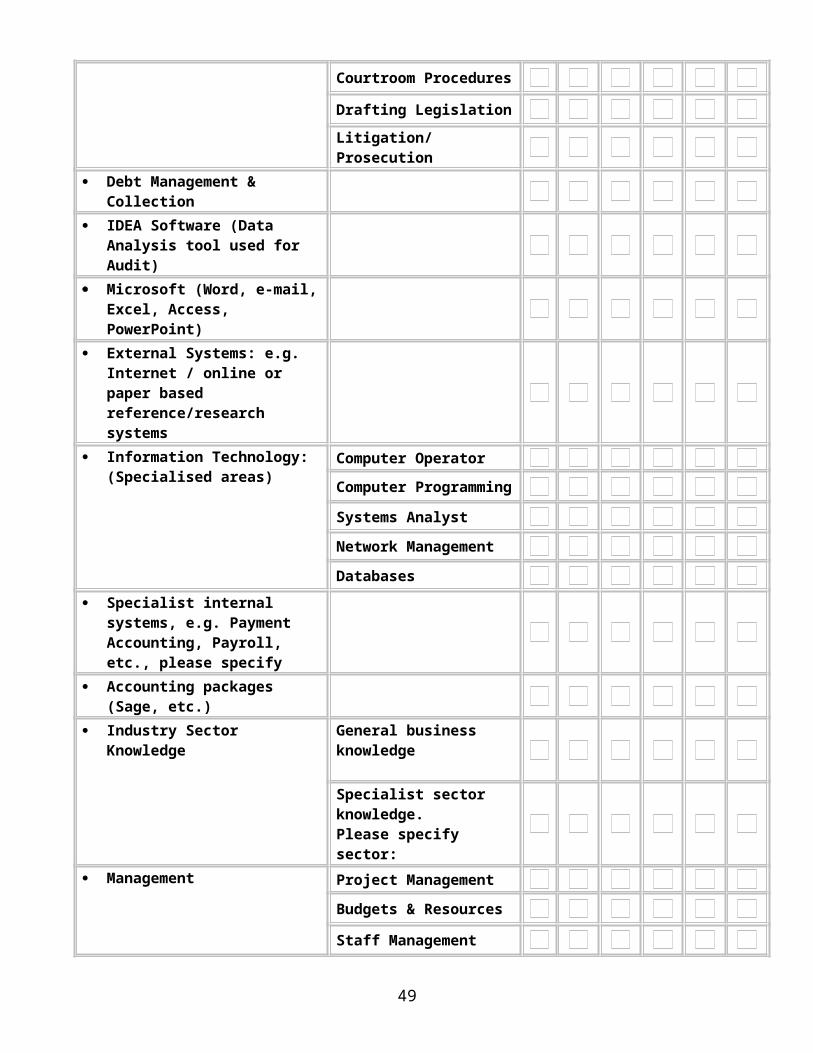
Appendix 3: Staff Skills Survey Form
The attached survey form was devised by the Training Branch of the Office of the Revenue Commissioners.
It links to Step 3 of the Workforce Planning Process.
It would need to be adapted by individual organisations to suit their own particular business circumstances.
34

35

Completing the Staff Survey Form
Instructions:
1. To select a field, click on the field with your left-mouse button. The field is highlighted, ready for your input. When you open the form, the first field is highlighted by default.
2. There are three types of fields: text fields, check boxes and drop-down lists. In text fields, simply type your input. Check boxes permit a choice from a range of options - make your selection by clicking into
the appropriate box with your left-mouse button. An X is entered in the selected box. To undo your selection, click into the box again.
Drop-down lists provide you with a list of options to choose from. Select one of the options by clicking on it. If you choose the ‘other-please specify’ option, you will need to provide further information in the box provided.
3. When you are finished inputting data in any field, press Tab to move to the next field.
4. Save and return the completed form by e-mail to ----------------------------, Training Branch. (VPN -------).
36

37

Staff Skills/Knowledge & Qualifications Survey
Personal Details
Name:
Grade: - Select -
Division / Region: - Select -
Skills / Knowledge Details
Please rate your skills/knowledge in the areas outlined on the chart below using the five-point scale, where: (5) indicates that you would be regarded as having expert skills/knowledge and where (0) indicates that you have no knowledge or skills in the particular area. Please tick only one of the options in the 0 – 5 in each row.
Skills / Knowledge Specifics 0 1 2 3 4 5
Taxes Direct Taxes
Indirect Taxes
Customs
Excise
Audit
Appeals
Customs & Excise
C & E Procedures
C & E Enforcement
C & E Audit
Revenue Systems: e.g. AIM, ITP, ITS, IBI, CRS, ROS, RPV, etc.
Legal Procedures Legislative Process
Courtroom Procedures
Drafting Legislation
Litigation/Prosecution
38

Debt Management & Collection
IDEA Software (Data Analysis tool used for Audit)
Microsoft (Word, e-mail, Excel, Access, PowerPoint)
External Systems: e.g. Internet / online or paper based reference/research systems
Information Technology: (Specialised areas)
Computer Operator
Computer Programming
Systems Analyst
Network Management
Databases
Specialist internal systems, e.g. Payment Accounting, Payroll, etc., please specify
Accounting packages (Sage, etc.)
Industry Sector Knowledge General business knowledge
Specialist sector knowledge. Please specify sector:
Management Project Management
Budgets & Resources
Staff Management
Human Resources Recruitment
Discipline
Training
Research Primary Research
Report Writing
Other – please specify
Qualification Details
Qualifications Achieved: – post 2nd level:
39

Do you have a post 2nd level qualification?: Click either the Yes or No Box: YesNo
(Where more than one qualification achieved, please provide details for each)
Qualification Type
If Other, please specify
Qualification Field
If Other, please specify
Qualification Title:e.g.
BSc/BA/BCh/BE /BCL/MSc etc.
Qualification Year
Awarding Body:e.g
University/College/ Institution
- Select - - Select -
- Select - - Select -
- Select - - Select -
- Select - - Select -
- Select - - Select -
Note: All information supplied will be treated in the strictest confidence
40

41

Appendix 4: Dublin City Questionnaires
A quantitative approach to identifying the critical segments in an organisation where skills gaps need to be addressed.
These questionnaires were devised by Dublin City Council for their Workforce Analysis Project.
The questionnaires link to Step 4 of the Workforce Planning Process.
They will need to be adapted by individual organisations to suit their own particular business circumstances.
42

43

Service Assessment Questionnaire
Department/Office Business Unit: Date Completed:
Tick one box and mark score1 Is the service a statutory function?
No Partial Fully Score1 2 3
2 Is there a risk to the health and safety of the public and/or employees?
No/Minimal Slight Significant Score1 2 3
3 Is there a potential loss of income to Dublin City Council?
Minor Marginal Significant Score1 2 3
4 Is there a potential for increased liability to fines, penalties, compensation?
No Slight Significant Score1 2 3
44

5 Is there a risk of to Environmental Damage?
No Potential Significant Score1 2 3
6 Rate the Unit’s contribution to the Business Environment of Dublin.
None Partial Significant Score1 2 3
7 Would service disruption cause inconvenience to the General Public?
No Minor Major Score1 2 3
8 Is there a risk to Social Cohesion/Development and Public Order?
No Slight Significant Score1 2 3
9 Are there National Service Indicators for your Unit?
No Yes Score1 2
45

10 Would service disruption cause negative political consequences or damage to the City’s reputation?
No Local Significant Score1 2 3
Total Score
Service Level Ratings:
10 to 17 = "Low"18 to 22 = "Medium"
23 to 29 = "High"
46

HR Assessment Questionnaire - Grade Level Survey
Department/Office:
Business Unit:
Employee Grade Title
No of Staff at this Grade (FTE)
Questions to be answered by head of Section or Division as appropriate
Tick one box and mark score1 Estimate the % reduction in your staffing levels over the next 6 months
Less than 5% Over 5% less than 10 % Over 10% Score1 3 6
2 Estimate the loss of valuable experience resulting from Q.1
Minimal Moderate Significant Score1 2 3
3 Have you introduced measures to improve operational efficiency?
No Review Only Change implemented Score1 2 3
47
4 Have you succession planning measures in place?
No Partial Fully Score1 2 3
5 Has your verifiable workload increased or decreased since 1/1/08?
Reduced No change or increase <10% Increase > 10% Score-2 2 4
6 Estimate your staffing levels (at this grade) over the next 18 months
Surplus Adequate Insufficient
7 If your answer to Q6 is either "Surplus" or "Insufficient", enter the number of staff concerned (FTE)
Surplus Deficit
Signed: Date Completed: Head of Unit:
Questions to be answered by CSD Section of your Department
8 % reduction in staffing levels at this grade from end of 1/01/08 to present
Less than 5% Over 5% less than 10% Over 10% Score1 3 6
48
9 Dept % Sick Leave rate in the last year
Over 6% Over 4% less than 6% Less than 4% Score1 3 6
10 Percentage of employees in this grade by Age Profile
0- to 10%- over 55 10-30% - Over 55 30% plus - Over 55 Score1 3 6
HR Level Ratings: Total Score
5 to 16 = "Capacity"17 to 28 = "Adequate"
29 to 37 = "Insufficient"
49

Guide to Completing Assessment Questionnaires
Service Assessment Questionnaire
Each business unit will answer and ‘score’ ten questions relating to its operations and the resulting ‘total score’ will allow senior management to determine the business importance or possible impact of any disruption/curtailment to the unit’s current service levels i.e.:
Service Impact
LOW
MEDIUM
HIGH
The following guidance should be used when answering the eleven questions:
1. Is the service a statutory function?
For the purposes of this exercise, a statutory function is considered to be either a role carried out as a requirement of legislation (Irish Law, EU law) and/or Departmental Circulars.
If all aspects of your unit’s operations are statutory functions you should answer ‘Fully’. Otherwise answer ‘No’ or ‘Partial’ as appropriate.
2. Is there a risk to the Health & Safety of the public and/or employees?
‘Significant’ - risk would arise where disruption/curtailment of a service would result in an immediate and/or serious risk to the Health & Safety of the public and/or employees.
‘Slight’ - risk would arise where there is a potential for incidents of a less serious nature affecting the Health & Safety of the public and/or employees.
‘No / Minimal’ - disruption/curtailment of a service would either (a) not raise any Health & Safety concerns or (b) any potential risk would be negligible.
3. Is there a potential for loss of income to Dublin City Council?
For the purposes of this exercise, income is defined as any source of ongoing revenue streams and may allow under certain circumstances longer term capital funding particularly where it covers salaries.
‘Minor’ - up to €500k in a year‘Marginal’ - between €500k and €1million in a year‘Significant’ - over €1million in a year
50

4. Is there a potential for increased liability to fines, penalties, compensation?
‘Significant’ - curtailment of service would undoubtedly result in corporate fines/penalties for breaching statutory requirements
‘Slight’ - potential for compensation claims from individuals/businesses
‘No’ - no potential risk of fines/penalties or compensation claims
5. Is there a risk to Environmental Damage?
‘Significant’ - curtailment of service would result in an immediate and/or serious risk of pollution
in respect of water, waste, noise and air quality
‘Potential’ - potential long term risk (not immediate) of a minor nature to the City’s Environmental
Landscape
‘No’ - curtailment of service would not result in any risk to the City’s EnvironmentalLandscape
6. Rate the Unit’s Contribution to the Business Environment of Dublin
‘Significant’ - plays a vital role in generating business and employment opportunities in the city
‘Partial’ - plays a mainly supportive and advisory role to existing commercial activities
‘None / Minimal the service does not directly contribute to commercial business activities
7. Would service disruption cause inconvenience to the General Public?
‘Major’ - immediate and serious impact on ‘quality of life’ issues for the public
‘Minor’ - delays and ‘backlogs’ in dealing with customer queries/applications
‘No’ - no direct impact on customers / general public
51

8. Is there a risk to Social Cohesion/Development and Public Order?
‘Significant’ - curtailment of services could result in both an increase in anti-social behavior/crime
and a lack of community identity/involvement
‘Potential’ - medium/long term risk of increased deprivation resulting in areas of social exclusion
‘No’ - would be unlikely to increase anti-social behavior or exacerbate social exclusion
9. Are there National Service Indicators for your Unit?
Yes or No
10. Would service disruption cause negative political consequences or damage to the City’s reputation?
‘Significant’ - would result in considerable/sustained adverse publicity and possible politicalIntervention
‘Local’ - may result in adverse reaction at local/constituency or ‘interest group’ level only
Human Resources Assessment Questionnaire
Each business unit will answer and (where requested) ‘score’ seven questions relating to staffing levels (by grade) for the unit relating to its operations. The Human Resources Dept will answer a further three questions based on centrally held statistics. The outcome and ‘score’ from this exercise will indicate the unit’s HR status for the grade concerned i.e.:
HR Level
CAPACITY
ADEQUATE
INSUFFICIENT
The following guidance should be used when completing the assessment form:
Employee Grade
The form is intended to indicate the staffing levels for individual grades. For the purposes of this exercise, staff should be recorded/assessed in their substantive grades only. If it is essential for someone to ‘act’ at a higher grade, that position can be recorded as a ‘deficit’ (Q6 and 7) in the return for the higher grade.
No of Staff in Post (FTE)
52

Enter the total number of staff working at this grade based on a full time employee equivalent (e.g. working sharing three days a week count as 0.6, or four days a week 0.8).
Questions
1. Estimate the % reduction in HR levels over the next 18 months
Based on current staffing levels for this grade/group in your unit, estimate the percentage reduction in this level based on known changes i.e. retirements (including ISERs), career breaks, long term sick leave (on half pay or pension rate).
2. Estimate the loss of valuable experience resulting from Q.1
A high score would apply where the departing employee(s) is in a ‘specialist role and/or is the only person undertaking a specific task and there would be considerable training need to ‘up skill’ a replacement. A lower score would apply where there are already a number of staff employed in a similar role and the loss could be more easily managed.
3. Have you introduced measures to improve operational efficiency?
Your answer should reflect measures since 1/1/09 to re-organise workloads, ensure better use of resources (e.g. more efficient procedures), reprioritising of service delivery, introduce cost effective IT solutions.
NB: Supporting evidence will be required where the ‘maximum’ score has been selected.
4. Have you succession planning measures in place?
Your answer should reflect measures taken to ensure the effective transfer of knowledge and skills from departing employee(s) so that their role(s) can be immediately assumed, e.g. detailed job specification and work schedule provided by departing employee, key tasks explained to other staff prior to leaving, all electronic and paper files moved to accessible location, training provided on specific skills and introductions made to key contacts and network groups.
5. Has your verifiable workload increased or decreased since 1/1/08?
Indicate whether there has been a reduction or percentage increase (less or greater than 10%) in your unit’s workload. NB: Supporting evidence will be required where the ‘maximum’ score has been selected.
53

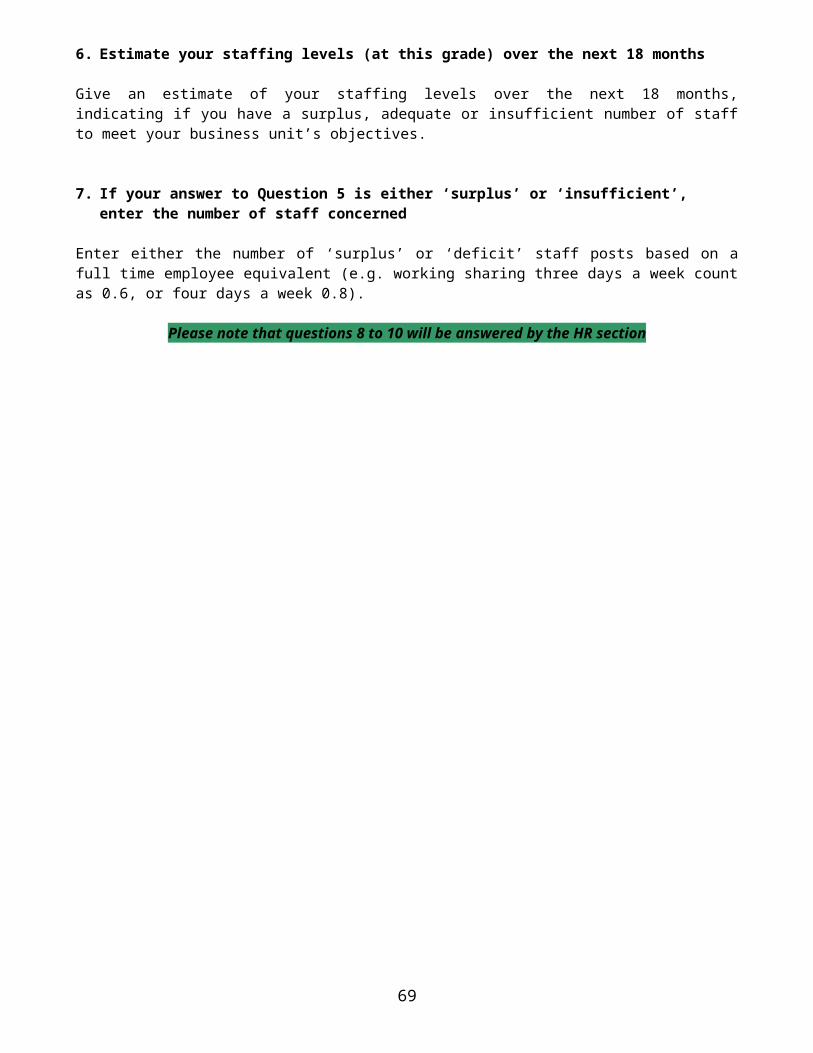
6. Estimate your staffing levels (at this grade) over the next 18 months
Give an estimate of your staffing levels over the next 18 months, indicating if you have a surplus, adequate or insufficient number of staff to meet your business unit’s objectives.
7. If your answer to Question 5 is either ‘surplus’ or ‘insufficient’, enter the number of staff concerned
Enter either the number of ‘surplus’ or ‘deficit’ staff posts based on a full time employee equivalent (e.g. working sharing three days a week count as 0.6, or four days a week 0.8).
Please note that questions 8 to 10 will be answered by the HR section
54

55

Appendix 5: Succession Planning
Key Steps and
Sample Templates
A formal quantitative approach to Succession Planning.
56

57

Step 1: Identify Key Leadership/Specialist PositionThe department’s HR team should identify key leadership or specialist positions by evaluating the impact each position has on the organisation achieving its strategic goals and objectives.
Position Title: Division:
Incumbent:
Section: Location:
Position Impact Factor Manager’s/Supervisor’s estimate of difficulty or effort required based on the function, responsibility, authority, priority of strategic objectives to replace position incumbent.
3- Critical and unique knowledge 2- Important, procedural, knowledge and skills 1- Common knowledge and skills
Vacancy Risk FactorThe projected retirement dates from the Workforce Retirement Forecast Reports, marketability, and other factors for position turnover.
3- Projected Retirement date or other turnover factors w/in 1 year2- Projected Retirement date or other turnover factors w/in 5 years1- Projected Retirement date or other turnover factors greater than 5 years
Position Impact Factor multiplied by Vacancy Risk Factor = Total Attrition Factor
Total Attrition Factor: Estimated effort and urgency to the delivery of programmes and services
High (6 and higher)
Medium (4-6 points)
Low (1-3 points)
58

Step 2: Identify Competency, Skills and Success Factors of Leader/Specialist
The next step for the HR team is to document the education, experiences, key competencies, and other factors necessary for success for each key leadership position.
Position Title: Division:
Section: LocationEducation(Third Level Degree or equivalent)
Experiences
Competencies
(check the key competencies for the position. It is suggested that you limit your selection to a maximum of 5 core competencies
Self ConfidenceAchievement, Drive & Commitment InitiativeTeamworkingCommunicationsAnalytical ThinkingConceptual ThinkingDecision Making & JudgmentSpecialised ExpertiseManaging Budgets & ResourcesInformation Seeking & ManagementConcern for Clarity & Work QualityNetworking/InfluencingInterpersonal UnderstandingCustomer ServiceManaging & Developing PeopleLeadership
Additional Factors
59

Step 3: Assess Current “Bench Strength”
The HR team should utilise this form to indicate the number of current employees who, in their judgment, are either currently eligible or may be eligible within 3-5 years for each of the prioritised key leadership/specialist positions.
Position Title: Finance Officer Division:
Section: Finance Unit Location: Dublin
# Ready Now
# Ready within 1 year
# Ready within 2 year
3
# Ready within 3- 5 years
2Action Plan: The Finance Officer is a key leadership position with a high position impact and vacancy risk. The current incumbent is eligible to retire. Career development assignments and shadowing will be done. The current Officer will develop a plan to be presented to the HR Team within 30 days.
As the HR team evaluate the depth (strength and/or weakness) of the available talent for each prioritised key position, it is important not to inflate the preparedness assessment of the organisation. The HR team should not rely on the same person as their bench strength for multiple positions, especially if the positions for which they would be relying on this individual are both high impact and high risk. While it may be unlikely that multiple high impact/high risk positions would be vacated within a given short period of time, it is possible. In current circumstances there is a risk of this occurring in the Irish public service.
Step 4: Design and Implement Career Development Strategies
This step in the succession planning process is focused on helping key employees and their managers discuss career development plans. Discussing and encouraging the career development of all employees is an important part of management. However, for the purpose of succession planning and increasing “bench strength” in specified areas, the selection of a subset of employees upon which to focus career development efforts may be necessary. The annual performance review session provides an opportunity to begin discussions of career development goals and opportunities.
60

61

Appendix 6 - Sample Templates
(These templates relate link to Steps 2, 3 and 4)
62

63

Templates - Demand Analysis
Downward Pressures on Staffing Upward Pressures on Staffing
Division/Section
Any likely increase/decrease in activity/workload. If yes, please state what or why:
Any changes because of technological advances? If yes, please state what or why
Any service delivery changes, e.g. changes in where and how the service is delivered. If yes, please state what or why:
1. 1. 1.
2. 2. 2.
3. 3. 3.
What effect on staff numbers and skills?
What effect on staff numbers and skills?
What effect on staff numbers and skills/
Asst Sec PO AP AO HEO
64

EO/SO CO Grand Total
65

Templates - Supply Analysis
Organisation Chart by Vote/ Programme
Vote
Programme A Programme B Programme C
Assistant Secretary1
Assistant Secretary1
Assistant Secretary1
Principal5
Assistant Principal15
AO/HEO30/60
Principal5
Assistant Principal15
AO/HEO30/60
Principal5
Assistant Principal15
AO/HEO30/60
EO/SO40/20
EO/SO40/20
EO/SO40/20
Clerical100
Clerical100
Clerical100
Total Staff Total Staff Total Staff
66

Grade/Location
Offices/BranchesNumber of Branches/Offices
Grade Title Grade Numbers Total Staff Number
Limerick 1 A.Sec 1 PO 3 AP 15 HEO 30 EO 50 SO 20 EO 1 CO 70 190Galway 1 AP 2 HEO 5 EO 10 SO 1 EO 1 CO 1 20Dublin 7 A.Sec 3 PO 10 AP 30 HEO 40 EO 50 SO 40 EO 10 CO 150 333Grand Total 9 543 543
Composition of Staff (Fulltime/Part-time/Contract)
Department/OfficeDate:
Grade Full-Time Part-time Contract
Grand Total
67

Functional Divide
Department/OfficeDate Functional Area Number of Employees Percent of All EmployeesCivil Service Human Resources CMOD and e-Government Government Reform Health & Pensions Policy Labour Market & Enterprise Policy Expenditure Evaluation & Management Public Service Reform & Delivery Remuneration & IR Office of the Chief Medical Officer CSD IT Support
Grand Total
68
Categories/Levels
Department/OfficeDate
Levels/Categories Number of Employees Percent of All EmployeesMAC (Asst Sec upwards) Management (AP and PO) Executive (AO/HEO/EO) Clerical & Supervisory (SO and CO)Support Staff (Service Officers & CleanersProfessional Technical Industrial
Grand Total
Professional15%
Technical39%
General Service25%
Industrial21%
69

Top Mngt Sen Mngt Mid Mngt Clercial Others
Top Mngt
Sen Mngt
Mid Mngt
Clercial
Others
0%
5%
10%
15%
20%
25%
30%
35%
40%
ASEC+
PO Others SO AO AP HEO EO CO
%
70

Section Breakdown
Distribution by Section Division:
Date:
Section: Number of Employees Percent of All Employees
Grand Total
71

Skills and Qualifications
Skills / Knowledge Details(See Appendix 4 – Revenue example)
Proficiency Level (where 5 is an expert and 0
is no knowledge)Name (details of names blocked out)
Grade Skills knowledge
Specifics 0 1 2 3 4 5
Qualification Details
Name Grade Qualification Title
Level Achieved
Qualification Year
Awarding Body
72

Age and Service Analysis (FTE)
Age <20 20-29 30-39 40-49 50-54 55-59 >60Years of service
<55-910-1415-1920-2425-2930-3435-3940+Total
<25 25-29 30-34 35-39 40-44 45-49 50-54 55-59 60+
All Grades
73

AgeGrade
<20 20-29 30-39 40-49 50-54 55-59 >60 Total
A SecPOAPHEO/AOEO/SOCOOtherTotal
Eligibility to Retire (Headcount)
Year Number % Cumulative %2012 252 3.9% 3.9%2012 138 2.1% 6.1%2013 177 2.8% 8.8%2014 204 3.2% 12.0%2015 213 3.3% 15.3%2016 226 3.5% 18.8%2017 225 3.5% 22.3%2018 227 3.5% 25.8%2019 281 4.4% 30.2%2020 425 6.6% 36.8%>2020 4,068 63.2% 100.0%Total 6,436 100.0% Based on number reaching 60 during the relevant year
Age All Grades % of Total Comment<25 - -
25-29 30 6% 7% below 3030-34 60 12% 35-39 60 12% 19% below 3540-44 70 14% 70% above 4045-49 80 16% 56% above 4550-54 100 20% 40% above 5055-59 70 14% 20% above 5560+ 30 6%
Total 500 100%
74

Grades (June 2012) % above 40 % above 45 % above 50 % above 55Sec Gen 100% 88% 82% 53%Ass Sec 98% 93% 80% 50%PO 92% 79% 63% 30%AP 89% 74% 53% 27%HEO 83% 66% 44% 18%AO 22% 10% 3% 3%EO 66% 50% 33% 13%SO 82% 70% 50% 18%CO 54% 40% 27% 14%Service Officer 88% 75% 60% 44%Total 67% 52% 36% 17%
Grade Drift 1997 – 2009
1997 2000 2007 2009 % Increase97-09
2011
A.Sec
PO
AP
HEO/AO
EO/SO
CO
Other
Services
Cleaner
Total
75

Gap Analysis
Identified Surplus/Gap
2011 2012 2013 2014 2015 Total
ECF targets 594 574 564 554 546 -
Retirements -12 -17 -17 -18 -20 -84
Career Break exits -5 -2 -4 -11
Career Break returns 1 1 4 6
Projected Serving 596 575 557 539 519 -
Surplus/Deficit 2 1 -7 -15 -27
Critical Vacancies (2012-2015)
Grade Loss % Loss Replace OptionsA SecPOAPHEO/AO
EO/SOCOOther
Total
Proposed Revised Shape
Grade 2012 2013 2014 2105A Sec PO AP HEO/AO EO/SO CO Other Total ECF
76
(A) (B) (C) (D)=B-C
Current serving Forecast Supply FTE Forecast Demand FTE Forecast Gap FTE
Grade1/1/2012
(FTE) 2012 2013 2014 2015 2012 2013 2014 2015 2012 2013 2014 2015
For Grade in table above add Post Rating, i.e.
1= critical role2= required role3 = optional role
77