A Well Construction Cost-Benefit Analysis (CBA): For …seidc.com/pdf/Well Construction CBA 2012...
24
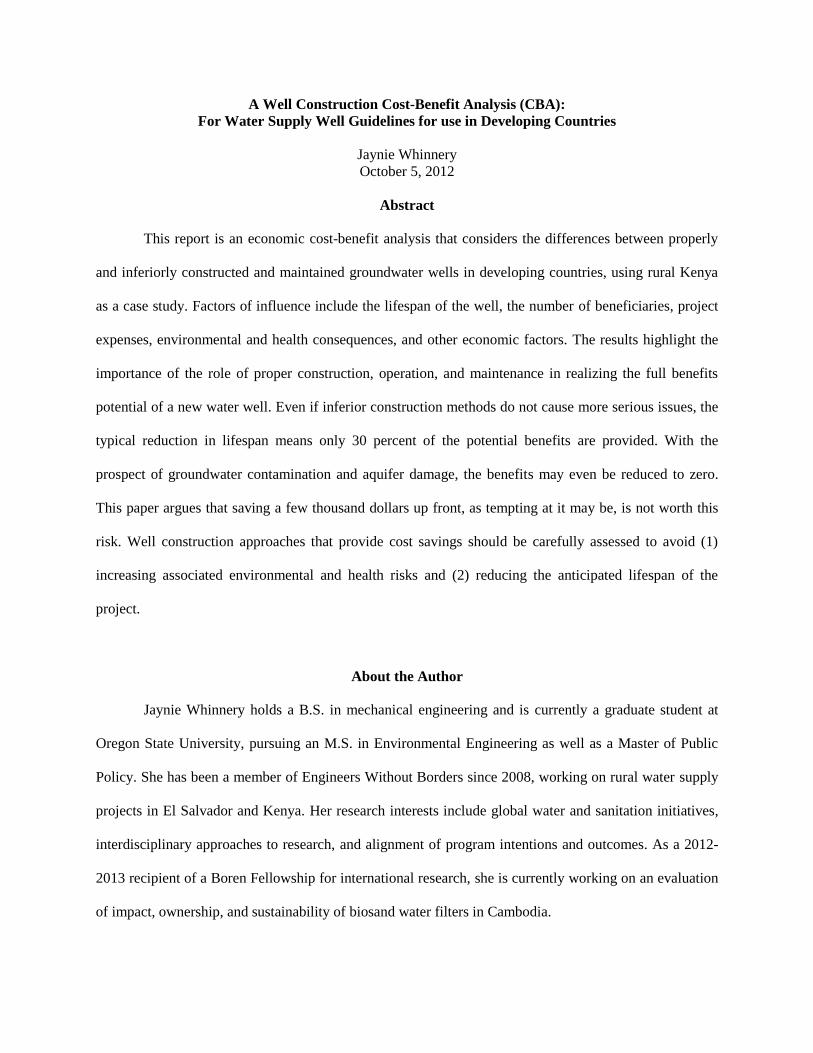
A Well Construction Cost-Benefit Analysis (CBA): For Water Supply Well Guidelines for use in Developing Countries Jaynie Whinnery October 5, 2012 Abstract This report is an economic cost-benefit analysis that considers the differences between properly and inferiorly constructed and maintained groundwater wells in developing countries, using rural Kenya as a case study. Factors of influence include the lifespan of the well, the number of beneficiaries, project expenses, environmental and health consequences, and other economic factors. The results highlight the importance of the role of proper construction, operation, and maintenance in realizing the full benefits potential of a new water well. Even if inferior construction methods do not cause more serious issues, the typical reduction in lifespan means only 30 percent of the potential benefits are provided. With the prospect of groundwater contamination and aquifer damage, the benefits may even be reduced to zero. This paper argues that saving a few thousand dollars up front, as tempting at it may be, is not worth this risk. Well construction approaches that provide cost savings should be carefully assessed to avoid (1) increasing associated environmental and health risks and (2) reducing the anticipated lifespan of the project. About the Author Jaynie Whinnery holds a B.S. in mechanical engineering and is currently a graduate student at Oregon State University, pursuing an M.S. in Environmental Engineering as well as a Master of Public Policy. She has been a member of Engineers Without Borders since 2008, working on rural water supply projects in El Salvador and Kenya. Her research interests include global water and sanitation initiatives, interdisciplinary approaches to research, and alignment of program intentions and outcomes. As a 2012- 2013 recipient of a Boren Fellowship for international research, she is currently working on an evaluation of impact, ownership, and sustainability of biosand water filters in Cambodia.
Transcript of A Well Construction Cost-Benefit Analysis (CBA): For …seidc.com/pdf/Well Construction CBA 2012...
A Well Construction Cost-Benefit Analysis (CBA):
For Water Supply Well Guidelines for use in Developing Countries
Jaynie Whinnery
October 5, 2012
Abstract
This report is an economic cost-benefit analysis that considers the differences between properly
and inferiorly constructed and maintained groundwater wells in developing countries, using rural Kenya
as a case study. Factors of influence include the lifespan of the well, the number of beneficiaries, project
expenses, environmental and health consequences, and other economic factors. The results highlight the
importance of the role of proper construction, operation, and maintenance in realizing the full benefits
potential of a new water well. Even if inferior construction methods do not cause more serious issues, the
typical reduction in lifespan means only 30 percent of the potential benefits are provided. With the
prospect of groundwater contamination and aquifer damage, the benefits may even be reduced to zero.
This paper argues that saving a few thousand dollars up front, as tempting at it may be, is not worth this
risk. Well construction approaches that provide cost savings should be carefully assessed to avoid (1)
increasing associated environmental and health risks and (2) reducing the anticipated lifespan of the
project.
About the Author
Jaynie Whinnery holds a B.S. in mechanical engineering and is currently a graduate student at
Oregon State University, pursuing an M.S. in Environmental Engineering as well as a Master of Public
Policy. She has been a member of Engineers Without Borders since 2008, working on rural water supply
projects in El Salvador and Kenya. Her research interests include global water and sanitation initiatives,
interdisciplinary approaches to research, and alignment of program intentions and outcomes. As a 2012-
2013 recipient of a Boren Fellowship for international research, she is currently working on an evaluation
of impact, ownership, and sustainability of biosand water filters in Cambodia.
A Well Construction Cost-Benefit Analysis (CBA) Whinnery (2012)
2
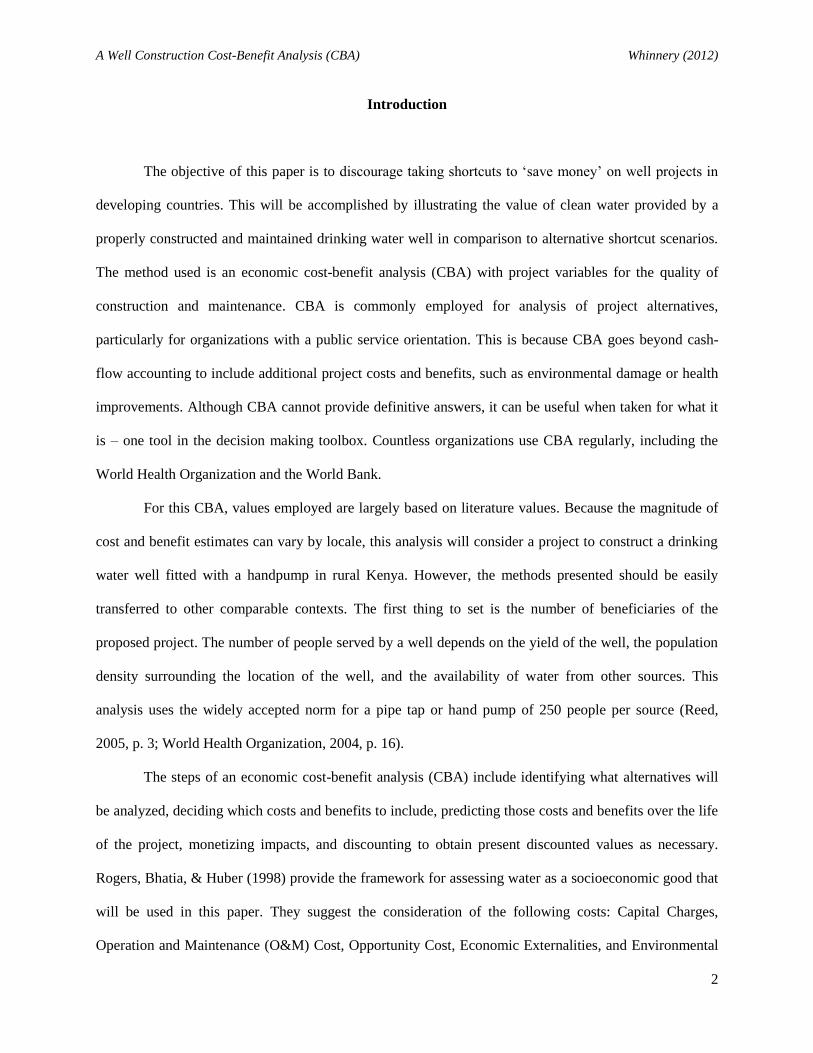
Introduction
The objective of this paper is to discourage taking shortcuts to ‘save money’ on well projects in
developing countries. This will be accomplished by illustrating the value of clean water provided by a
properly constructed and maintained drinking water well in comparison to alternative shortcut scenarios.
The method used is an economic cost-benefit analysis (CBA) with project variables for the quality of
construction and maintenance. CBA is commonly employed for analysis of project alternatives,
particularly for organizations with a public service orientation. This is because CBA goes beyond cash-
flow accounting to include additional project costs and benefits, such as environmental damage or health
improvements. Although CBA cannot provide definitive answers, it can be useful when taken for what it
is – one tool in the decision making toolbox. Countless organizations use CBA regularly, including the
World Health Organization and the World Bank.
For this CBA, values employed are largely based on literature values. Because the magnitude of
cost and benefit estimates can vary by locale, this analysis will consider a project to construct a drinking
water well fitted with a handpump in rural Kenya. However, the methods presented should be easily
transferred to other comparable contexts. The first thing to set is the number of beneficiaries of the
proposed project. The number of people served by a well depends on the yield of the well, the population
density surrounding the location of the well, and the availability of water from other sources. This
analysis uses the widely accepted norm for a pipe tap or hand pump of 250 people per source (Reed,
2005, p. 3; World Health Organization, 2004, p. 16).
The steps of an economic cost-benefit analysis (CBA) include identifying what alternatives will
be analyzed, deciding which costs and benefits to include, predicting those costs and benefits over the life
of the project, monetizing impacts, and discounting to obtain present discounted values as necessary.
Rogers, Bhatia, & Huber (1998) provide the framework for assessing water as a socioeconomic good that
will be used in this paper. They suggest the consideration of the following costs: Capital Charges,
Operation and Maintenance (O&M) Cost, Opportunity Cost, Economic Externalities, and Environmental
A Well Construction Cost-Benefit Analysis (CBA) Whinnery (2012)
3
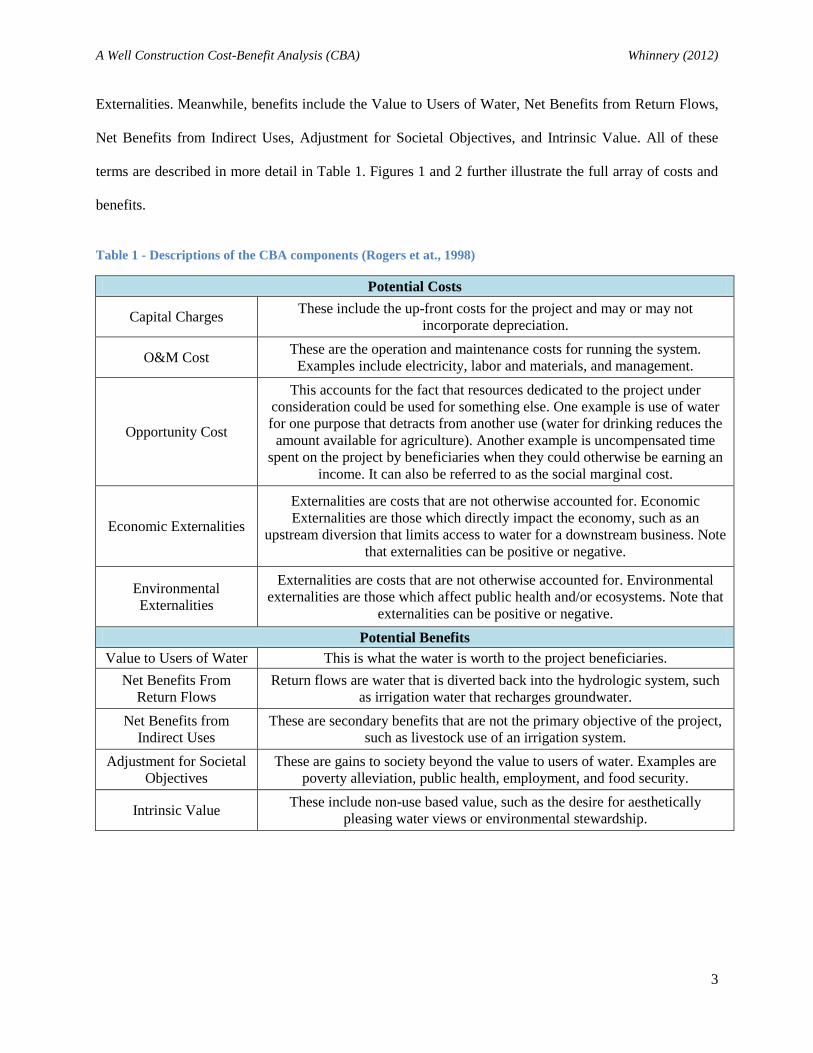
Externalities. Meanwhile, benefits include the Value to Users of Water, Net Benefits from Return Flows,
Net Benefits from Indirect Uses, Adjustment for Societal Objectives, and Intrinsic Value. All of these
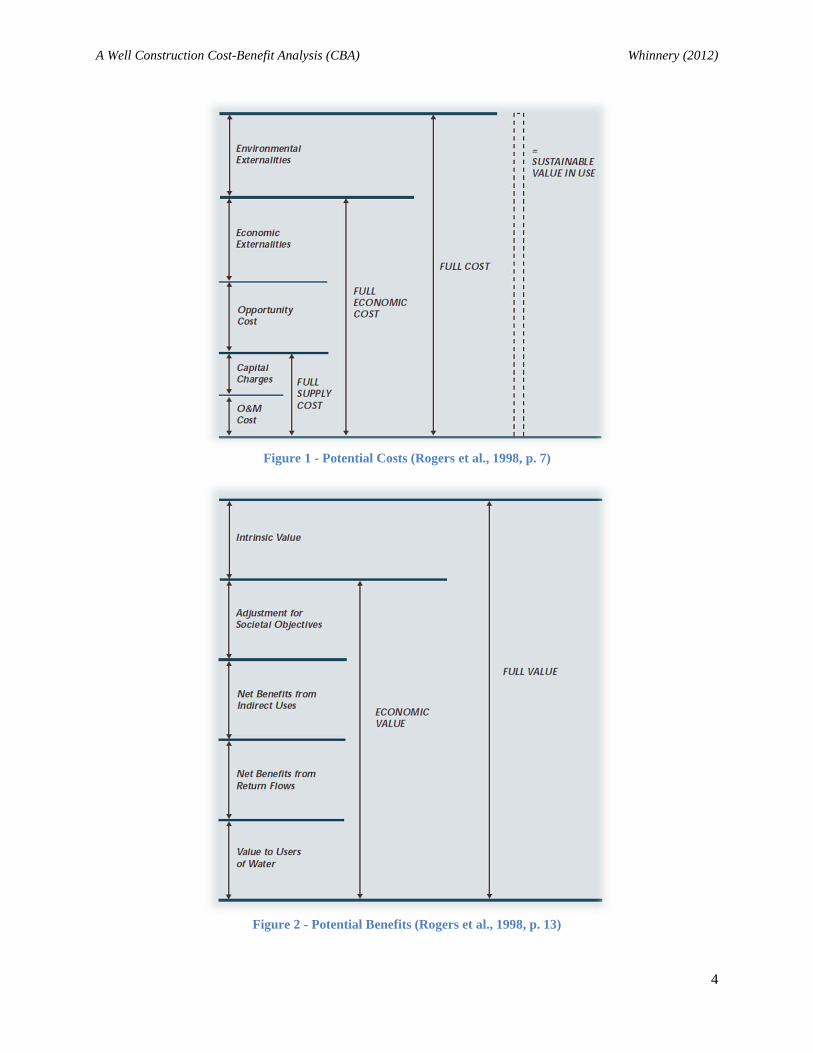
terms are described in more detail in Table 1. Figures 1 and 2 further illustrate the full array of costs and
benefits.
Table 1 - Descriptions of the CBA components (Rogers et at., 1998)
Potential Costs
Capital Charges These include the up-front costs for the project and may or may not
incorporate depreciation.
O&M Cost These are the operation and maintenance costs for running the system.
Examples include electricity, labor and materials, and management.
Opportunity Cost
This accounts for the fact that resources dedicated to the project under
consideration could be used for something else. One example is use of water
for one purpose that detracts from another use (water for drinking reduces the
amount available for agriculture). Another example is uncompensated time
spent on the project by beneficiaries when they could otherwise be earning an
income. It can also be referred to as the social marginal cost.
Economic Externalities
Externalities are costs that are not otherwise accounted for. Economic
Externalities are those which directly impact the economy, such as an
upstream diversion that limits access to water for a downstream business. Note
that externalities can be positive or negative.
Environmental
Externalities
Externalities are costs that are not otherwise accounted for. Environmental
externalities are those which affect public health and/or ecosystems. Note that
externalities can be positive or negative.
Potential Benefits
Value to Users of Water This is what the water is worth to the project beneficiaries.
Net Benefits From
Return Flows
Return flows are water that is diverted back into the hydrologic system, such
as irrigation water that recharges groundwater.
Net Benefits from
Indirect Uses
These are secondary benefits that are not the primary objective of the project,
such as livestock use of an irrigation system.
Adjustment for Societal
Objectives
These are gains to society beyond the value to users of water. Examples are
poverty alleviation, public health, employment, and food security.
Intrinsic Value These include non-use based value, such as the desire for aesthetically
pleasing water views or environmental stewardship.
A Well Construction Cost-Benefit Analysis (CBA) Whinnery (2012)
4
Figure 1 - Potential Costs (Rogers et al., 1998, p. 7)
Figure 2 - Potential Benefits (Rogers et al., 1998, p. 13)
A Well Construction Cost-Benefit Analysis (CBA) Whinnery (2012)
5
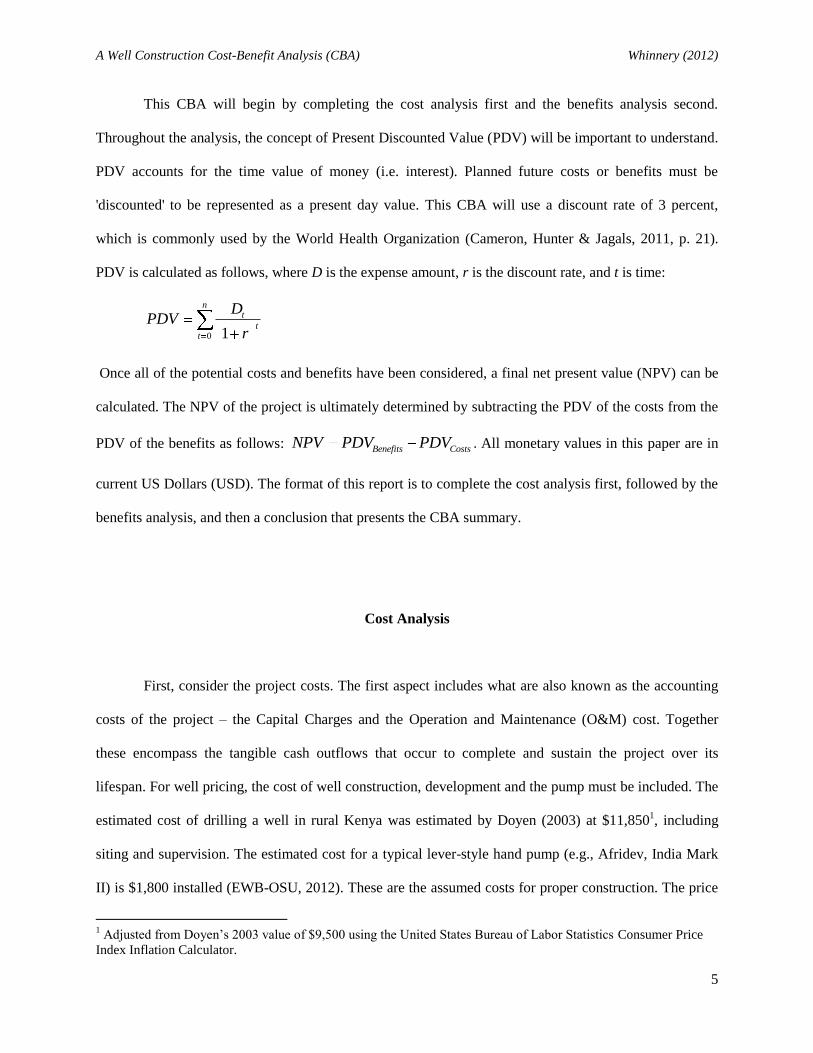
This CBA will begin by completing the cost analysis first and the benefits analysis second.
Throughout the analysis, the concept of Present Discounted Value (PDV) will be important to understand.
PDV accounts for the time value of money (i.e. interest). Planned future costs or benefits must be
'discounted' to be represented as a present day value. This CBA will use a discount rate of 3 percent,
which is commonly used by the World Health Organization (Cameron, Hunter & Jagals, 2011, p. 21).
PDV is calculated as follows, where D is the expense amount, r is the discount rate, and t is time:
0 1
nt
tt
DPDV
r
Once all of the potential costs and benefits have been considered, a final net present value (NPV) can be
calculated. The NPV of the project is ultimately determined by subtracting the PDV of the costs from the
PDV of the benefits as follows: Benefits CostsNPV PDV PDV . All monetary values in this paper are in
current US Dollars (USD). The format of this report is to complete the cost analysis first, followed by the
benefits analysis, and then a conclusion that presents the CBA summary.
Cost Analysis
First, consider the project costs. The first aspect includes what are also known as the accounting
costs of the project – the Capital Charges and the Operation and Maintenance (O&M) cost. Together
these encompass the tangible cash outflows that occur to complete and sustain the project over its
lifespan. For well pricing, the cost of well construction, development and the pump must be included. The
estimated cost of drilling a well in rural Kenya was estimated by Doyen (2003) at $11,8501, including
siting and supervision. The estimated cost for a typical lever-style hand pump (e.g., Afridev, India Mark
II) is $1,800 installed (EWB-OSU, 2012). These are the assumed costs for proper construction. The price
1 Adjusted from Doyen’s 2003 value of $9,500 using the United States Bureau of Labor Statistics Consumer Price
Index Inflation Calculator.
A Well Construction Cost-Benefit Analysis (CBA) Whinnery (2012)
6
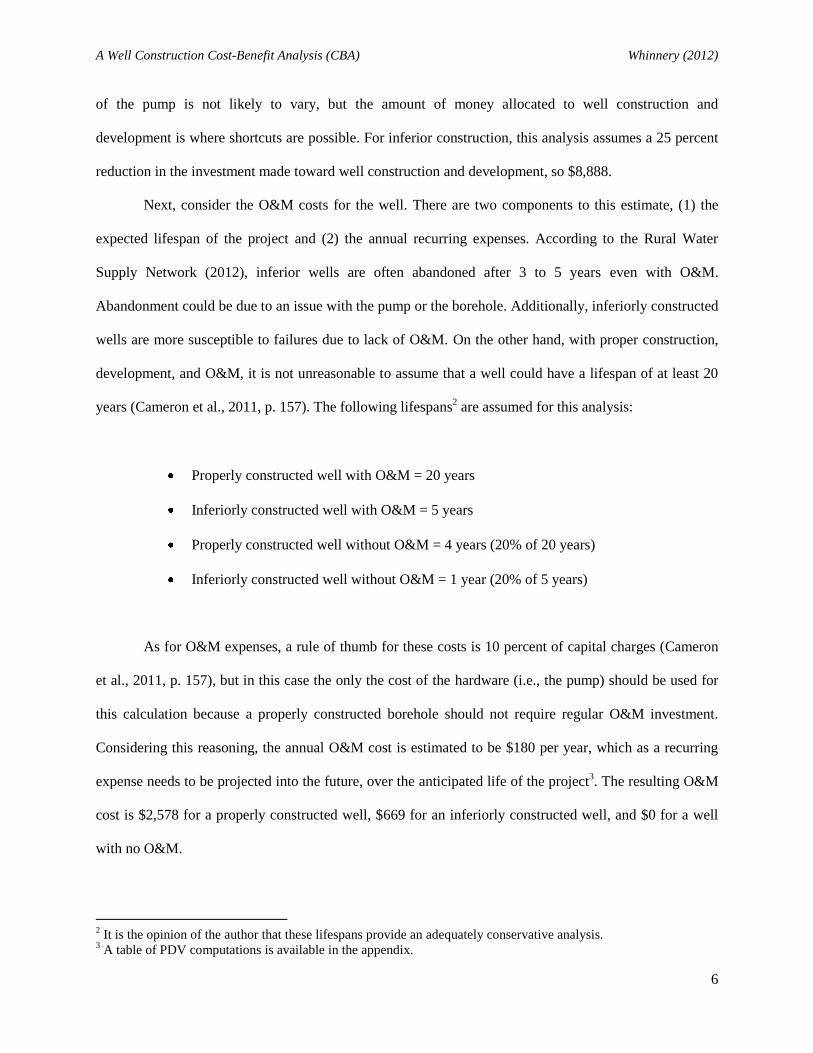
of the pump is not likely to vary, but the amount of money allocated to well construction and
development is where shortcuts are possible. For inferior construction, this analysis assumes a 25 percent
reduction in the investment made toward well construction and development, so $8,888.
Next, consider the O&M costs for the well. There are two components to this estimate, (1) the
expected lifespan of the project and (2) the annual recurring expenses. According to the Rural Water
Supply Network (2012), inferior wells are often abandoned after 3 to 5 years even with O&M.
Abandonment could be due to an issue with the pump or the borehole. Additionally, inferiorly constructed
wells are more susceptible to failures due to lack of O&M. On the other hand, with proper construction,
development, and O&M, it is not unreasonable to assume that a well could have a lifespan of at least 20
years (Cameron et al., 2011, p. 157). The following lifespans2 are assumed for this analysis:
Properly constructed well with O&M = 20 years
Inferiorly constructed well with O&M = 5 years
Properly constructed well without O&M = 4 years (20% of 20 years)
Inferiorly constructed well without O&M = 1 year (20% of 5 years)
As for O&M expenses, a rule of thumb for these costs is 10 percent of capital charges (Cameron
et al., 2011, p. 157), but in this case the only the cost of the hardware (i.e., the pump) should be used for
this calculation because a properly constructed borehole should not require regular O&M investment.
Considering this reasoning, the annual O&M cost is estimated to be $180 per year, which as a recurring
expense needs to be projected into the future, over the anticipated life of the project3. The resulting O&M
cost is $2,578 for a properly constructed well, $669 for an inferiorly constructed well, and $0 for a well
with no O&M.
2 It is the opinion of the author that these lifespans provide an adequately conservative analysis.
3 A table of PDV computations is available in the appendix.
A Well Construction Cost-Benefit Analysis (CBA) Whinnery (2012)
7
Opportunity cost is the next component of this analysis. Simply defined, opportunity cost is the
next best use of an input, so all project inputs must be considered. The capital expenses for the well have
been assessed at competitive market prices. Given that the competitive market price for a private good is
equivalent to the opportunity cost, assuming no influence from minimum wage, the production expenses
already include associated opportunity costs. Another aspect is that beneficiaries of a well project are
likely to participate in several hours of related technical training and health education. This should be
accounted for as an opportunity cost, because it is time that could be spent otherwise, such as
participating in income generating activities.
This paper assumes the total time investment required is equivalent to one working day per
person at the time of well construction. As a proxy, the gross national income (GNI), adjusted for
purchasing power parity (PPP), is used to monetize all time-based measurements in this paper. According
to the World Bank (2012), this value for Kenya is $1,720, leading to an estimated daily income of just
under five dollars per day per capita. Because GNI is a gross measure by definition, the opportunity cost
estimated in this paper is higher than it is in actuality since rural areas have lower incomes in comparison
to urban areas. However, because the same value is used for all aspects of the CBA it will not change the
final ranking of alternatives. The total PDV4 for opportunity cost is estimated at $1,178 for all scenarios.
The final aspect of the cost analysis is to determine applicable externalities. These are economic
and environmental costs that are not otherwise accounted for – direct impacts to the economy, public
health, ecosystems, etc. Externalities can be negative or positive, but one should be careful to avoid
double counting (e.g. counting health improvement as a positive environmental externality cost AND an
adjustment for societal objectives benefit). For this reason, this analysis focuses on possible negative
externalities and leaves the positive externality of improved health for the benefits section. Without
knowing more about the constraints of the groundwater resource, there are no foreseeable negative
economic externalities for constructing a well, so a value of $0 is used for this analysis. If the new well
4 A table of PDV computations is available in the appendix.
A Well Construction Cost-Benefit Analysis (CBA) Whinnery (2012)
8
could restrict the amount of water available to income-producing activities (e.g., local agriculture and
businesses), the resulting negative economic externality should be evaluated and included in the analysis.
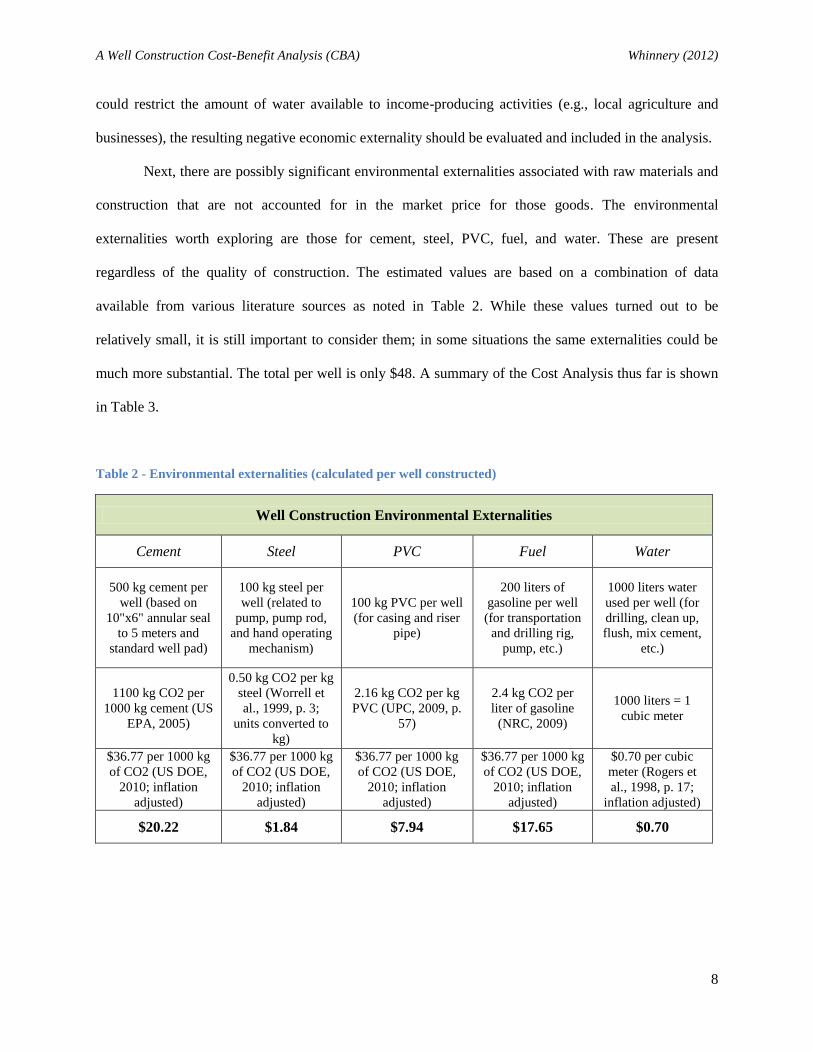
Next, there are possibly significant environmental externalities associated with raw materials and
construction that are not accounted for in the market price for those goods. The environmental
externalities worth exploring are those for cement, steel, PVC, fuel, and water. These are present
regardless of the quality of construction. The estimated values are based on a combination of data
available from various literature sources as noted in Table 2. While these values turned out to be
relatively small, it is still important to consider them; in some situations the same externalities could be
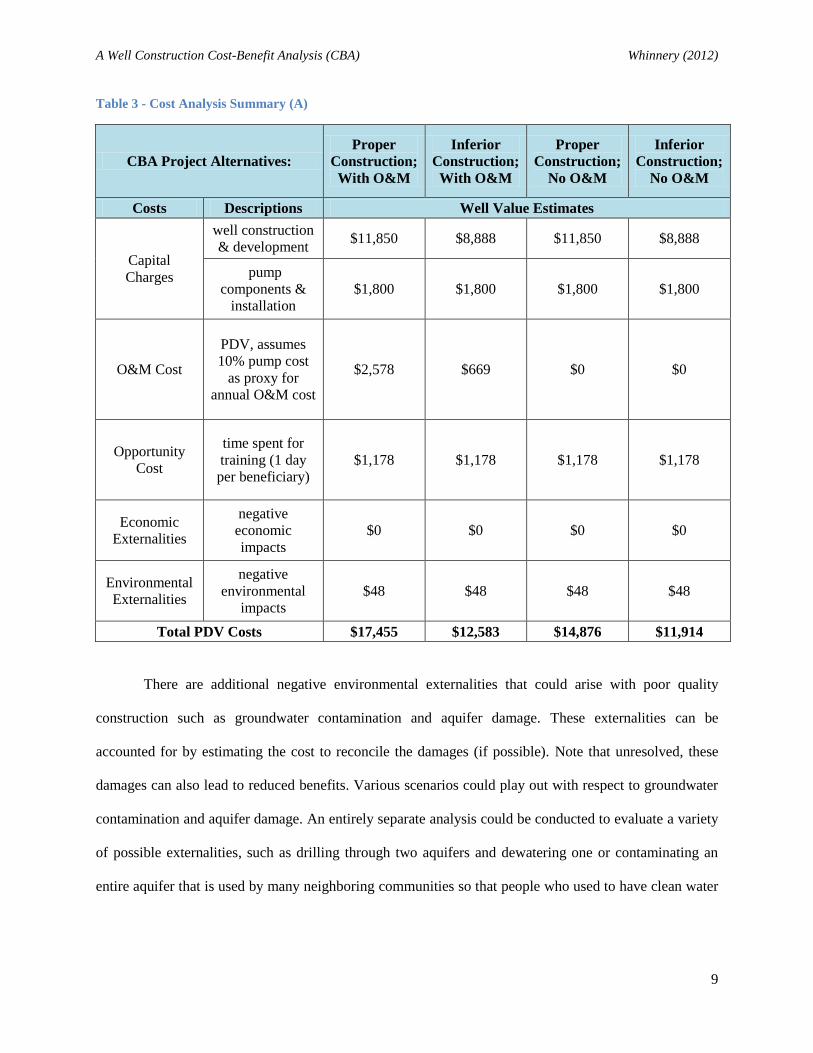
much more substantial. The total per well is only $48. A summary of the Cost Analysis thus far is shown
in Table 3.
Table 2 - Environmental externalities (calculated per well constructed)
Well Construction Environmental Externalities
Cement Steel PVC Fuel Water
500 kg cement per
well (based on
10"x6" annular seal
to 5 meters and
standard well pad)
100 kg steel per
well (related to
pump, pump rod,
and hand operating
mechanism)
100 kg PVC per well
(for casing and riser
pipe)
200 liters of
gasoline per well
(for transportation
and drilling rig,
pump, etc.)
1000 liters water
used per well (for
drilling, clean up,
flush, mix cement,
etc.)
1100 kg CO2 per
1000 kg cement (US
EPA, 2005)
0.50 kg CO2 per kg
steel (Worrell et
al., 1999, p. 3;
units converted to
kg)
2.16 kg CO2 per kg
PVC (UPC, 2009, p.
57)
2.4 kg CO2 per
liter of gasoline
(NRC, 2009)
1000 liters = 1
cubic meter
$36.77 per 1000 kg
of CO2 (US DOE,
2010; inflation
adjusted)
$36.77 per 1000 kg
of CO2 (US DOE,
2010; inflation
adjusted)
$36.77 per 1000 kg
of CO2 (US DOE,
2010; inflation
adjusted)
$36.77 per 1000 kg
of CO2 (US DOE,
2010; inflation
adjusted)
$0.70 per cubic
meter (Rogers et
al., 1998, p. 17;
inflation adjusted)
$20.22 $1.84 $7.94 $17.65 $0.70
A Well Construction Cost-Benefit Analysis (CBA) Whinnery (2012)
9
Table 3 - Cost Analysis Summary (A)
CBA Project Alternatives:
Proper
Construction;
With O&M
Inferior
Construction;
With O&M
Proper
Construction;
No O&M
Inferior
Construction;
No O&M
Costs Descriptions Well Value Estimates
Capital
Charges
well construction
& development $11,850 $8,888 $11,850 $8,888
pump
components &
installation
$1,800 $1,800 $1,800 $1,800
O&M Cost
PDV, assumes
10% pump cost
as proxy for
annual O&M cost
$2,578 $669 $0 $0
Opportunity
Cost
time spent for
training (1 day
per beneficiary)
$1,178 $1,178 $1,178 $1,178
Economic
Externalities
negative
economic
impacts
$0 $0 $0 $0
Environmental
Externalities
negative
environmental
impacts
$48 $48 $48 $48
Total PDV Costs $17,455 $12,583 $14,876 $11,914
There are additional negative environmental externalities that could arise with poor quality
construction such as groundwater contamination and aquifer damage. These externalities can be
accounted for by estimating the cost to reconcile the damages (if possible). Note that unresolved, these
damages can also lead to reduced benefits. Various scenarios could play out with respect to groundwater
contamination and aquifer damage. An entirely separate analysis could be conducted to evaluate a variety
of possible externalities, such as drilling through two aquifers and dewatering one or contaminating an
entire aquifer that is used by many neighboring communities so that people who used to have clean water
A Well Construction Cost-Benefit Analysis (CBA) Whinnery (2012)
10
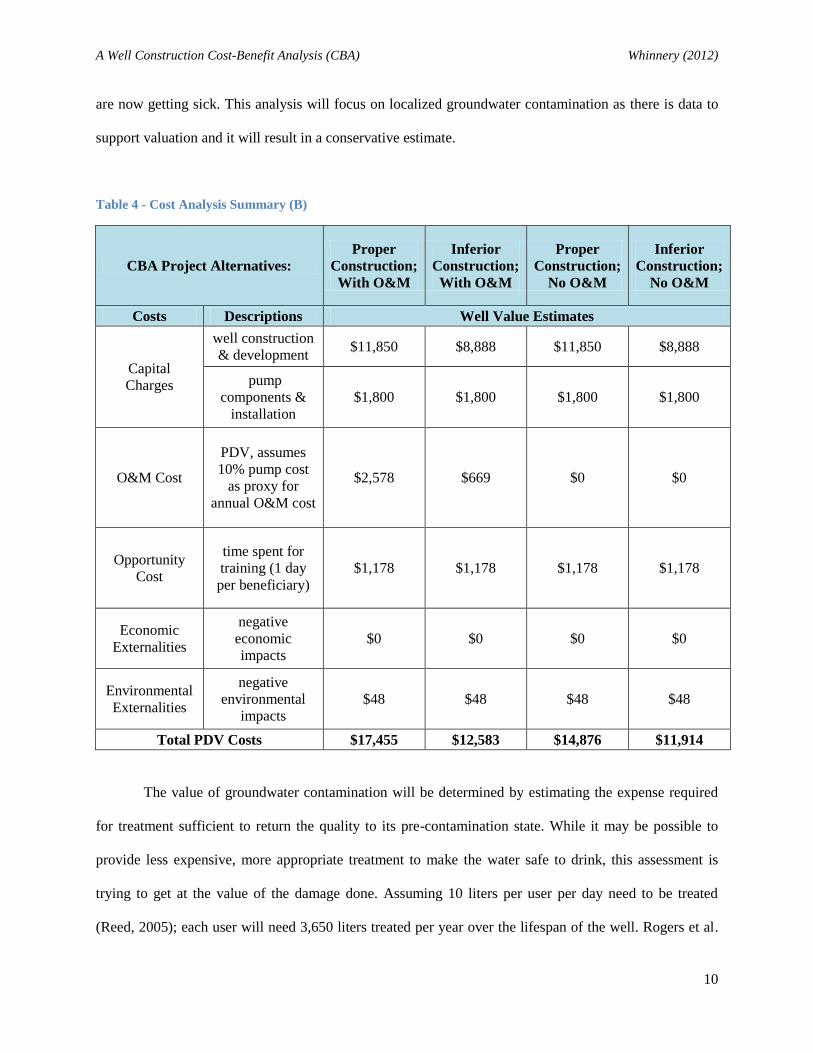
are now getting sick. This analysis will focus on localized groundwater contamination as there is data to
support valuation and it will result in a conservative estimate.
Table 4 - Cost Analysis Summary (B)
CBA Project Alternatives:
Proper
Construction;
With O&M
Inferior
Construction;
With O&M
Proper
Construction;
No O&M
Inferior
Construction;
No O&M
Costs Descriptions Well Value Estimates
Capital
Charges
well construction
& development $11,850 $8,888 $11,850 $8,888
pump
components &
installation
$1,800 $1,800 $1,800 $1,800
O&M Cost
PDV, assumes
10% pump cost
as proxy for
annual O&M cost
$2,578 $669 $0 $0
Opportunity
Cost
time spent for
training (1 day
per beneficiary)
$1,178 $1,178 $1,178 $1,178
Economic
Externalities
negative
economic
impacts
$0 $0 $0 $0
Environmental
Externalities
negative
environmental
impacts
$48 $48 $48 $48
Total PDV Costs $17,455 $12,583 $14,876 $11,914
The value of groundwater contamination will be determined by estimating the expense required
for treatment sufficient to return the quality to its pre-contamination state. While it may be possible to
provide less expensive, more appropriate treatment to make the water safe to drink, this assessment is
trying to get at the value of the damage done. Assuming 10 liters per user per day need to be treated
(Reed, 2005); each user will need 3,650 liters treated per year over the lifespan of the well. Rogers et al.
A Well Construction Cost-Benefit Analysis (CBA) Whinnery (2012)
11
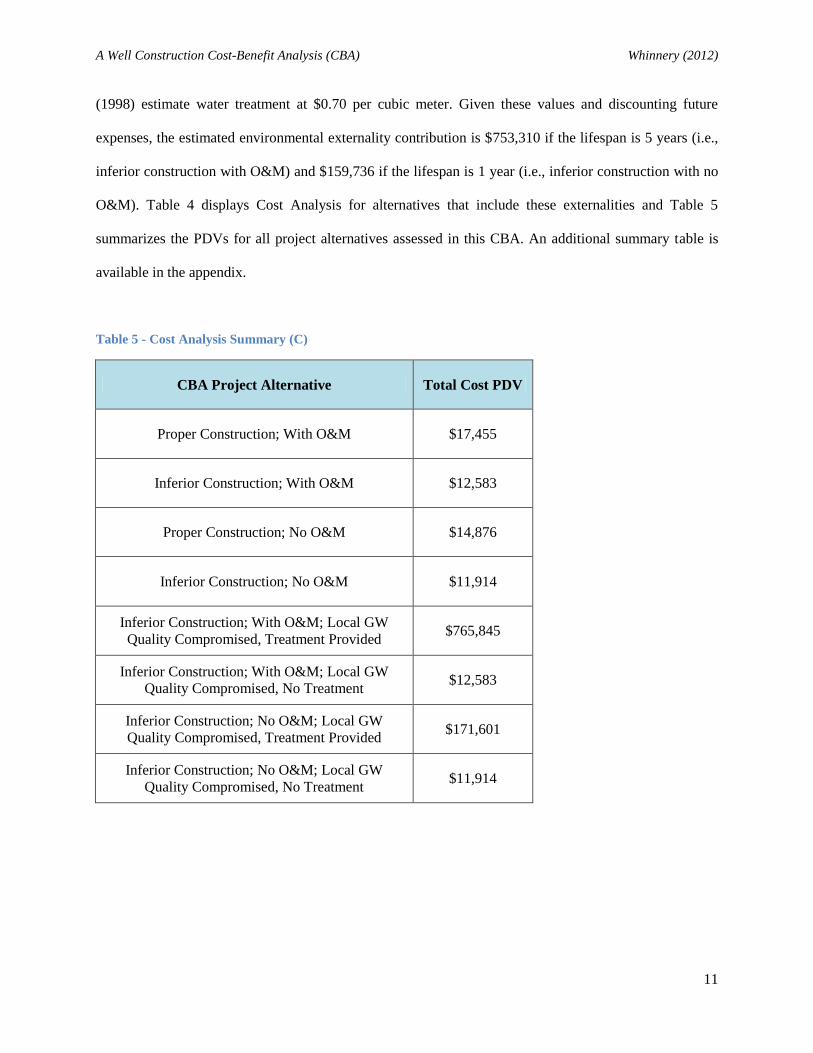
(1998) estimate water treatment at $0.70 per cubic meter. Given these values and discounting future
expenses, the estimated environmental externality contribution is $753,310 if the lifespan is 5 years (i.e.,
inferior construction with O&M) and $159,736 if the lifespan is 1 year (i.e., inferior construction with no
O&M). Table 4 displays Cost Analysis for alternatives that include these externalities and Table 5
summarizes the PDVs for all project alternatives assessed in this CBA. An additional summary table is
available in the appendix.
Table 5 - Cost Analysis Summary (C)
CBA Project Alternative Total Cost PDV
Proper Construction; With O&M $17,455
Inferior Construction; With O&M $12,583
Proper Construction; No O&M $14,876
Inferior Construction; No O&M $11,914
Inferior Construction; With O&M; Local GW
Quality Compromised, Treatment Provided $765,845
Inferior Construction; With O&M; Local GW
Quality Compromised, No Treatment $12,583
Inferior Construction; No O&M; Local GW
Quality Compromised, Treatment Provided $171,601
Inferior Construction; No O&M; Local GW
Quality Compromised, No Treatment $11,914
A Well Construction Cost-Benefit Analysis (CBA) Whinnery (2012)
12
Benefits Analysis
Moving on to assess the benefits for the project alternatives, recall that potential benefits include
the value to users of water, net benefits from return flows, net benefits from indirect uses, adjustment for
societal objectives, and intrinsic value. For this analysis, benefits from return flows, indirect use, and
intrinsic value are assumed to be negligible and therefore set to values of zero. These benefits are more
commonly associated with irrigation or restoration projects. It is possible that agriculture and/or livestock
could benefit in some way from a new well, but not including these possible benefits makes the analysis
more conservative.
For estimating the value to users of water, this analysis uses a revealed preference for the value to
users of water, which is the preferred method for assessing the value of a policy or project to its
beneficiaries. There are three common methods for this type of assessment as follows: (1) market-based
(i.e., monetary value of time saved), (2) contingent valuation (e.g., survey regarding willingness to pay),
and (3) revealed preference (i.e., how much people are already paying for a comparable good or service).
Out of these three options, revealed preference should be used if the data is available because it requires
fewer inferences. In this case, data is available that estimates households in developing countries spend
about 10 percent of their annual income on water (Cameron et al., 2011, p. 42). Income is again based on
GNI per capita, PPP, as it was in the Cost Analysis, and this benefit needs to be discounted for annual
benefits in the future. The resulting PDV5 is $658,923 for a properly constructed well with O&M,
$202,835 for an inferiorly constructed well with O&M, $164,630 for a properly constructed well with no
O&M, and $43,000 for an inferiorly constructed well with no O&M.
Another meaningful aspect of this benefits analysis is the adjustment for societal objectives. The
reason many organizations take on well drilling projects in the first place is for this reason, to improve the
livelihoods of people currently lacking access to clean water. Poverty alleviation and public health
improvements are both key societal objectives. Safe access to water has direct implications for improved
5 A table of PDV computations is available in the appendix.
A Well Construction Cost-Benefit Analysis (CBA) Whinnery (2012)
13
health; it can also be a catalyst for other benefits such as increased productivity and happiness (Hutton et
al., 2007). However, these are largely secondary benefits afforded by improved health. Therefore, indirect
impacts will not be included to avoid potential double counting. This paper focuses on the direct health
impacts of clean water that can be provided by a new well, in terms of associated reductions in diarrhea
and related deaths. While there are other illnesses connected to lack of safe access to clean water, diarrhea
is the most significant and there is a wealth of data to support related analysis. Other conceivable direct
benefits such as money saved on medical expenses and time saved collecting water are not included in
this section of the Benefits Analysis to avoid double counting with the Value to Users of Water. Overall,
these deliberate constraints only make this analysis more conservative.
Estimating societal benefits involves several steps. First is the most controversial part of CBA,
the value of a statistical life (VSL) must be set. This value allows the assignment of an economic value to
life and productivity, to enable accounting for lives lost or saved and reductions or gains in productivity.
As standard practice for CBA, the VSL has been rigorously estimated at $8.9 million6 in the United States
(Viscusi & Aldy, 2002, p. 67). Emulating the methodology used by Hatfield Consultants (2009), the VSL
in Kenya can be calculated by adjusting for the difference in GNI per capita, PPP between the US and
Kenya. This results in a VSL of $313,623 in Kenya.
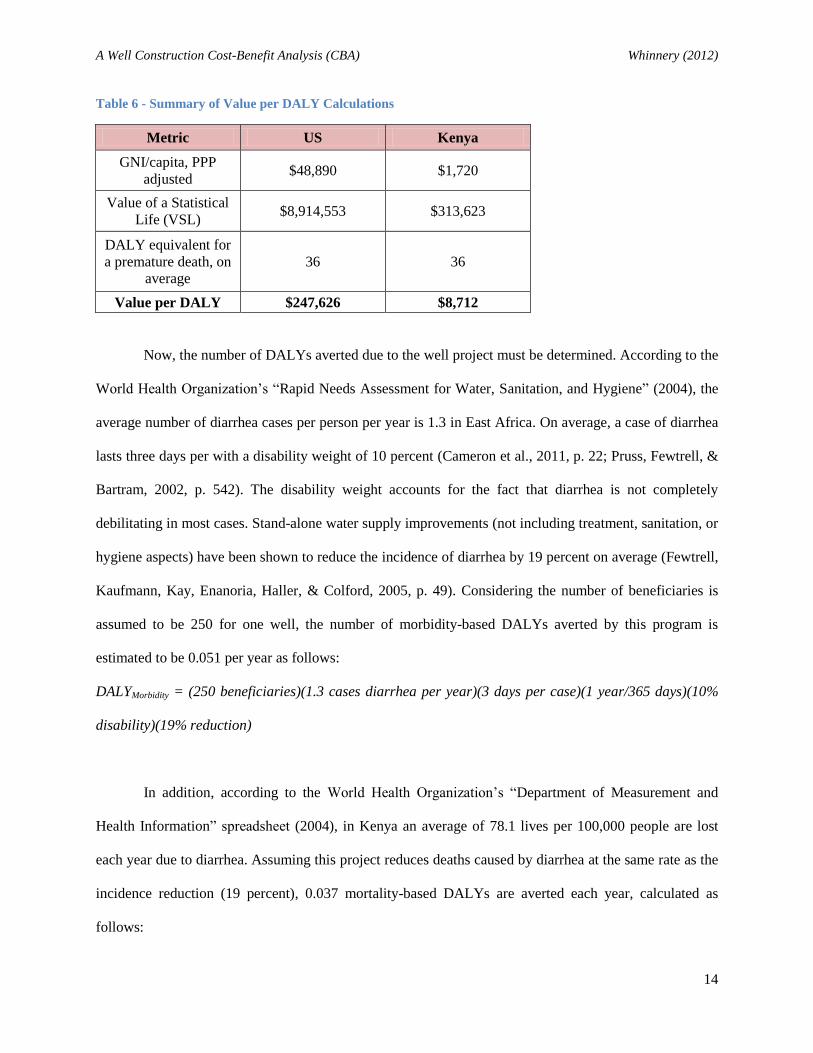
The next step is to determining the value of a disability-adjusted life year (DALY). The DALY is
a common metric used in the field of public health for quantifying disease burden. It incorporates all
associated health costs, including morbidity (disability) and mortality (death). The World Health
Organization (2012) commonly uses an average equivalency of 36 DALYs per premature death. Again
replicating the approach taken by Hatfield Consultants, the value per DALY can be determined by
dividing the VSL by the number of DALYs assigned for a premature death. This results in the value of
$8,712 per DALY in Kenya; see Table 6.
6 Adjusted from Viscusi & Aldy’s 2002 value of $7 million using the United States Bureau of Labor Statistics
Consumer Price Index Inflation Calculator.
A Well Construction Cost-Benefit Analysis (CBA) Whinnery (2012)
14
Table 6 - Summary of Value per DALY Calculations
Metric US Kenya
GNI/capita, PPP
adjusted $48,890 $1,720
Value of a Statistical
Life (VSL) $8,914,553 $313,623
DALY equivalent for
a premature death, on
average
36 36
Value per DALY $247,626 $8,712
Now, the number of DALYs averted due to the well project must be determined. According to the
World Health Organization’s “Rapid Needs Assessment for Water, Sanitation, and Hygiene” (2004), the
average number of diarrhea cases per person per year is 1.3 in East Africa. On average, a case of diarrhea
lasts three days per with a disability weight of 10 percent (Cameron et al., 2011, p. 22; Pruss, Fewtrell, &
Bartram, 2002, p. 542). The disability weight accounts for the fact that diarrhea is not completely
debilitating in most cases. Stand-alone water supply improvements (not including treatment, sanitation, or
hygiene aspects) have been shown to reduce the incidence of diarrhea by 19 percent on average (Fewtrell,
Kaufmann, Kay, Enanoria, Haller, & Colford, 2005, p. 49). Considering the number of beneficiaries is
assumed to be 250 for one well, the number of morbidity-based DALYs averted by this program is
estimated to be 0.051 per year as follows:
DALYMorbidity = (250 beneficiaries)(1.3 cases diarrhea per year)(3 days per case)(1 year/365 days)(10%
disability)(19% reduction)
In addition, according to the World Health Organization’s “Department of Measurement and
Health Information” spreadsheet (2004), in Kenya an average of 78.1 lives per 100,000 people are lost
each year due to diarrhea. Assuming this project reduces deaths caused by diarrhea at the same rate as the
incidence reduction (19 percent), 0.037 mortality-based DALYs are averted each year, calculated as
follows:
A Well Construction Cost-Benefit Analysis (CBA) Whinnery (2012)
15
DALYMortality = (250 beneficiaries)(78.1/100,000 lives lost)(19% reduction)
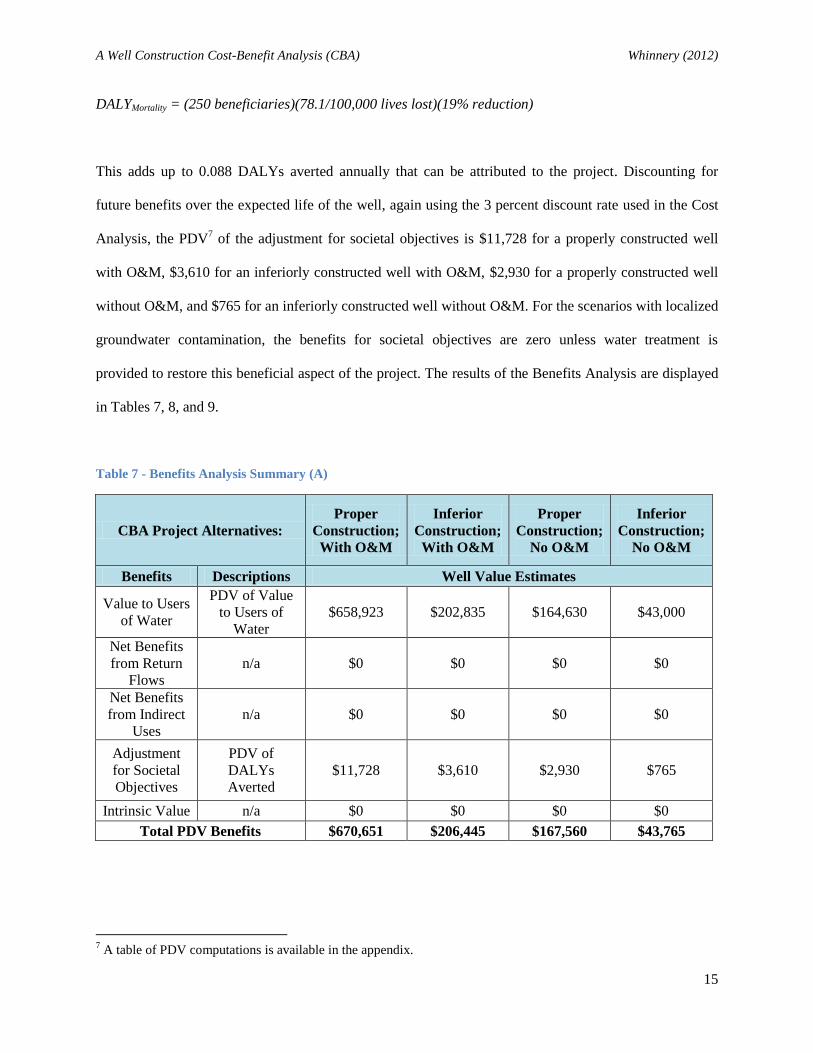
This adds up to 0.088 DALYs averted annually that can be attributed to the project. Discounting for
future benefits over the expected life of the well, again using the 3 percent discount rate used in the Cost
Analysis, the PDV7 of the adjustment for societal objectives is $11,728 for a properly constructed well
with O&M, $3,610 for an inferiorly constructed well with O&M, $2,930 for a properly constructed well
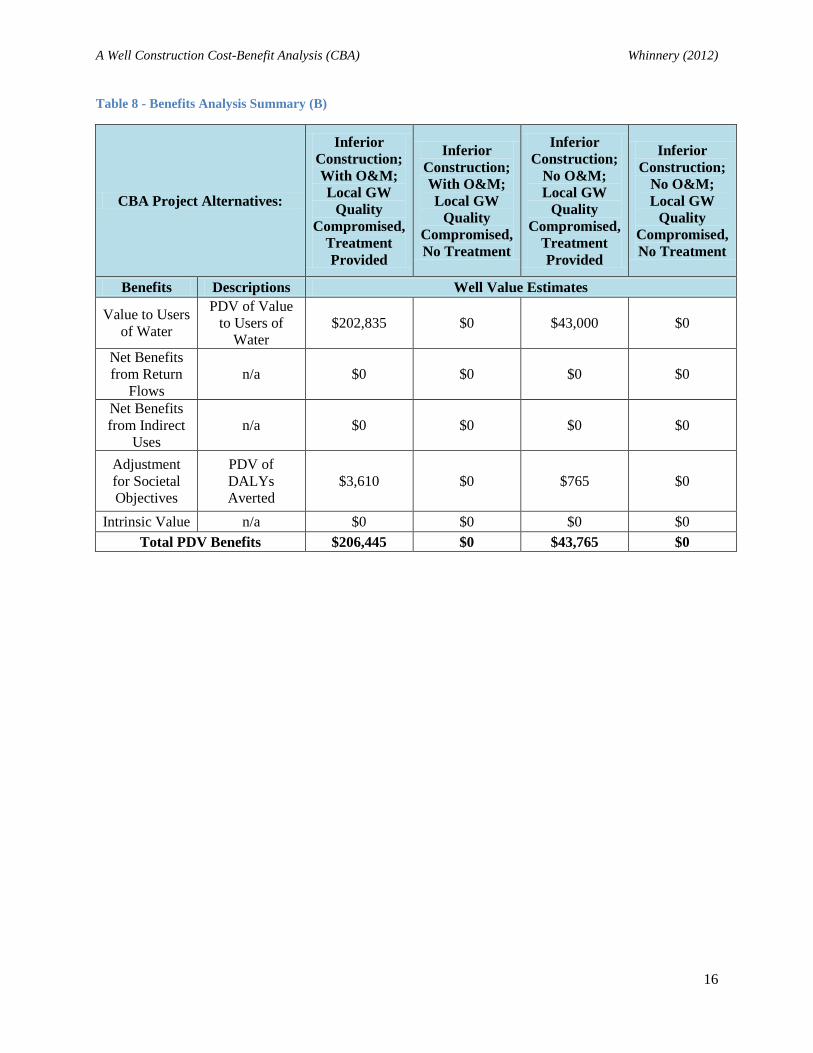
without O&M, and $765 for an inferiorly constructed well without O&M. For the scenarios with localized
groundwater contamination, the benefits for societal objectives are zero unless water treatment is
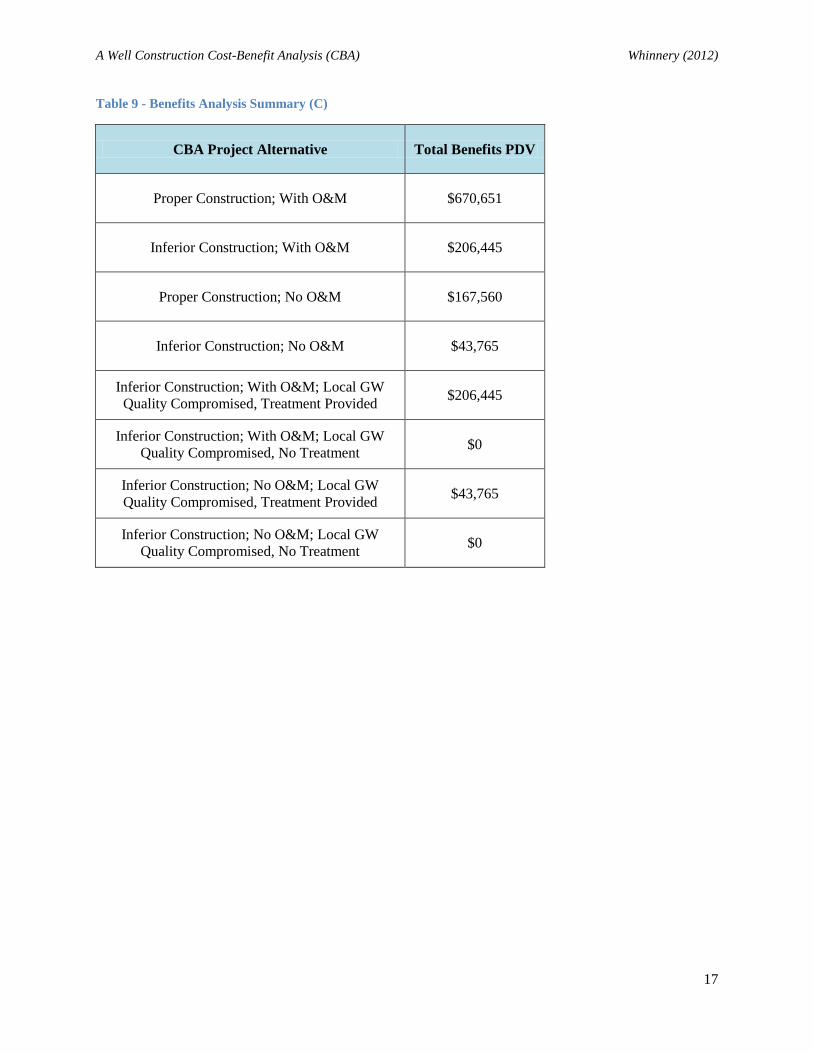
provided to restore this beneficial aspect of the project. The results of the Benefits Analysis are displayed
in Tables 7, 8, and 9.
Table 7 - Benefits Analysis Summary (A)
CBA Project Alternatives:
Proper
Construction;
With O&M
Inferior
Construction;
With O&M
Proper
Construction;
No O&M
Inferior
Construction;
No O&M
Benefits Descriptions Well Value Estimates
Value to Users
of Water
PDV of Value
to Users of
Water
$658,923 $202,835 $164,630 $43,000
Net Benefits
from Return
Flows
n/a $0 $0 $0 $0
Net Benefits
from Indirect
Uses
n/a $0 $0 $0 $0
Adjustment
for Societal
Objectives
PDV of
DALYs
Averted
$11,728 $3,610 $2,930 $765
Intrinsic Value n/a $0 $0 $0 $0
Total PDV Benefits $670,651 $206,445 $167,560 $43,765
7 A table of PDV computations is available in the appendix.
A Well Construction Cost-Benefit Analysis (CBA) Whinnery (2012)
16
Table 8 - Benefits Analysis Summary (B)
CBA Project Alternatives:
Inferior
Construction;
With O&M;
Local GW
Quality
Compromised,
Treatment
Provided
Inferior
Construction;
With O&M;
Local GW
Quality
Compromised,
No Treatment
Inferior
Construction;
No O&M;
Local GW
Quality
Compromised,
Treatment
Provided
Inferior
Construction;
No O&M;
Local GW
Quality
Compromised,
No Treatment
Benefits Descriptions Well Value Estimates
Value to Users
of Water
PDV of Value
to Users of
Water
$202,835 $0 $43,000 $0
Net Benefits
from Return
Flows
n/a $0 $0 $0 $0
Net Benefits
from Indirect
Uses
n/a $0 $0 $0 $0
Adjustment
for Societal
Objectives
PDV of
DALYs
Averted
$3,610 $0 $765 $0
Intrinsic Value n/a $0 $0 $0 $0
Total PDV Benefits $206,445 $0 $43,765 $0
A Well Construction Cost-Benefit Analysis (CBA) Whinnery (2012)
17
Table 9 - Benefits Analysis Summary (C)
CBA Project Alternative Total Benefits PDV
Proper Construction; With O&M $670,651
Inferior Construction; With O&M $206,445
Proper Construction; No O&M $167,560
Inferior Construction; No O&M $43,765
Inferior Construction; With O&M; Local GW
Quality Compromised, Treatment Provided $206,445
Inferior Construction; With O&M; Local GW
Quality Compromised, No Treatment $0
Inferior Construction; No O&M; Local GW
Quality Compromised, Treatment Provided $43,765
Inferior Construction; No O&M; Local GW
Quality Compromised, No Treatment $0
A Well Construction Cost-Benefit Analysis (CBA) Whinnery (2012)
18
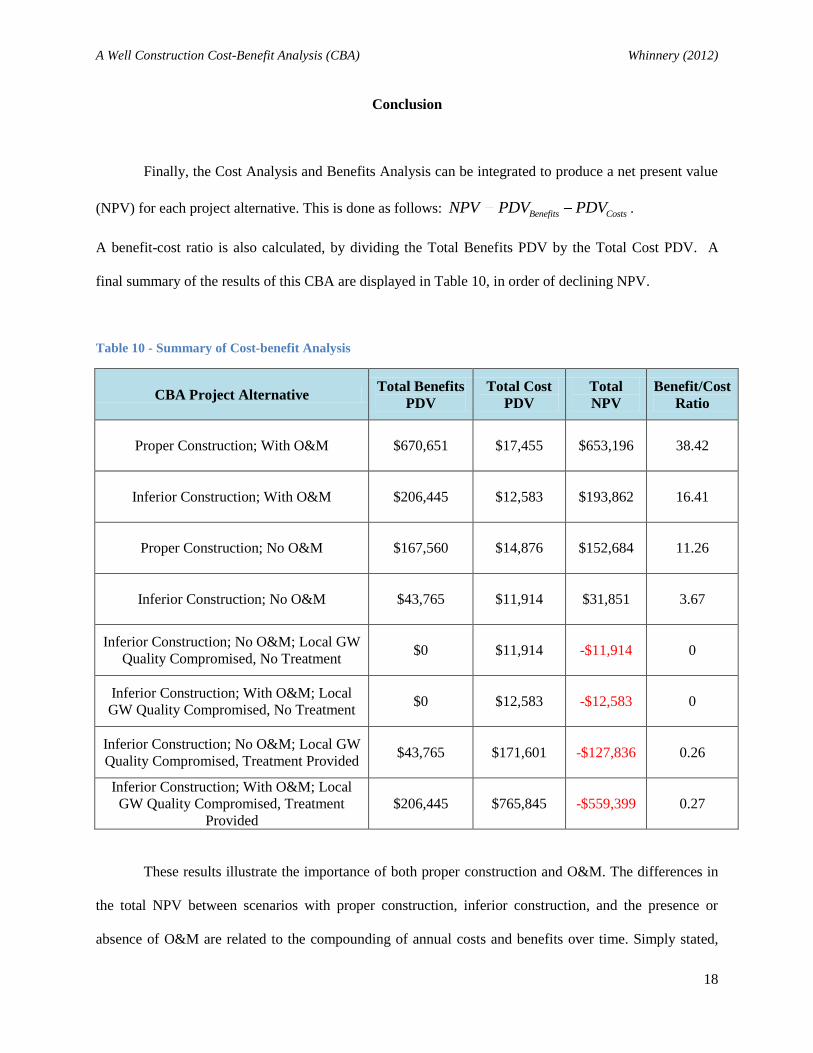
Conclusion
Finally, the Cost Analysis and Benefits Analysis can be integrated to produce a net present value
(NPV) for each project alternative. This is done as follows: Benefits CostsNPV PDV PDV .
A benefit-cost ratio is also calculated, by dividing the Total Benefits PDV by the Total Cost PDV. A
final summary of the results of this CBA are displayed in Table 10, in order of declining NPV.
Table 10 - Summary of Cost-benefit Analysis
CBA Project Alternative Total Benefits
PDV
Total Cost
PDV
Total
NPV
Benefit/Cost
Ratio
Proper Construction; With O&M $670,651 $17,455 $653,196 38.42
Inferior Construction; With O&M $206,445 $12,583 $193,862 16.41
Proper Construction; No O&M $167,560 $14,876 $152,684 11.26
Inferior Construction; No O&M $43,765 $11,914 $31,851 3.67
Inferior Construction; No O&M; Local GW
Quality Compromised, No Treatment $0 $11,914 -$11,914 0
Inferior Construction; With O&M; Local
GW Quality Compromised, No Treatment $0 $12,583 -$12,583 0
Inferior Construction; No O&M; Local GW
Quality Compromised, Treatment Provided $43,765 $171,601 -$127,836 0.26
Inferior Construction; With O&M; Local
GW Quality Compromised, Treatment
Provided
$206,445 $765,845 -$559,399 0.27
These results illustrate the importance of both proper construction and O&M. The differences in
the total NPV between scenarios with proper construction, inferior construction, and the presence or
absence of O&M are related to the compounding of annual costs and benefits over time. Simply stated,
A Well Construction Cost-Benefit Analysis (CBA) Whinnery (2012)
19
inferior construction and the absence of O&M are both likely to result in a well with a shorter lifespan,
which substantially reduces the overall benefit of implementing the well in the first place. In this CBA,
even in the best case scenario inferior construction with O&M provides only 30 percent of the potential
benefits – a decrease of nearly $500,000 in benefits in order to save a comparatively small amount of
money, $5,000.
Even worse, inferior construction methods have an increased probability of causing bigger
problems such as groundwater contamination and aquifer damage. Even in the limited case of localized
groundwater contamination, this CBA suggests that cutting a few thousand dollars from the budget up
front can mean the benefits are reduced to nothing. Furthermore, if a treatment scheme is provided to deal
with the contamination, the costs are estimated to outweigh the benefits by a ratio of nearly four to one.
This does not mean that a contaminated source should be left for use without treatment, but it might be
more cost effective to start from scratch with a different source if available. Instead, this should be taken
as a compelling reason for proper well construction practices, even if saving a few dollars at the
beginning of the project seems tempting at first glance.
The role of O&M in the costs and benefits of a well project is also highlighted in this CBA. A
properly constructed well still requires an appropriate O&M plan; otherwise the lifespan will be shortened
significantly. In this way, project sustainability is directly related to the total value of the benefits
provided. The absence of O&M has a comparable impact on the estimated value of a well, whether
properly or inferiorly constructed, with a reduction of around 80 percent. As an example, proper
construction without O&M saves about $2,500 over the lifespan of the well but reduces the benefits by
over $500,000.
Given all of the considerations presented in this analysis, hopefully it is evident that shortcuts are
not a wise strategy when it comes to drilling wells. This is not to say that there is no such thing as a
properly constructed, low-cost well. However, keep in mind that the greatest benefit will not necessarily
come from minimizing the upfront costs and maximizing the number of wells constructed, with disregard
for the quality of construction, operation, and maintenance. But rather, the most benefits will be realized
A Well Construction Cost-Benefit Analysis (CBA) Whinnery (2012)
20
through the greatest number of properly constructed and maintained wells. Well construction approaches
that provide cost savings should be carefully assessed to avoid (1) increasing associated environmental
and health risks and (2) reducing the anticipated lifespan of the project.
A detailed spreadsheet including all calculations can be found online at
www.seidc.com/pdf/Hydrophilanthropy_Well_Guidlelines.pdf
For further information contact Jaynie Whinnery at [email protected].
A Well Construction Cost-Benefit Analysis (CBA) Whinnery (2012)
21
References
Bureau of Labor Statistics (BLS). (2012). CPI Inflation Calculator. http://www.bls.gov/
data/inflation_calculator.htm.
Cameron, J., Hunter, P., Jagals, P., Pond, K. (2011). Valuing water, valuing livelihoods: Guidance on
social cost-benefit analysis of drinking-water interventions, with special reference to small
community water supplies. World Health Organization. Retrieved from
http://whqlibdoc.who.int/publications/2011/9781843393108_eng.pdf.
Clean-Water-For-Laymen. (2010). Making Concrete for Use in Water Well Construction: The Basics.
Accessed from http://www.clean-water-for-laymen.com/making-concrete.html.
Doyen, J. (2003). A comparative study on water well drilling costs in Kenya. Rural Water Supply
Network Document. Retrieved from http://www.rwsn.ch/documentation/skatdocumentation.2008-
08-25.3202857121/file.
Engineers Without Borders – Oregon State University (EWB-OSU). (2012). Lela Community Water
Project: Pre-Implementation report. Retrieved from http://groups.engr.oregonstate.edu/ewb/wp-
content/ uploads/525_OSULelaKenya_Apr2012.pdf.
Fewtrell, L., Kaufmann, R., Kay, D., Enanoria, W., Haller, L., & Colford, J. (2005). Water, Sanitation,
and Hygiene Interventions to Reduce Diarrhoea in Less Developed Countries: A Systematic
Review and Meta-Analysis. Lancet Infectious Diseases, 5(1), 42-52.
Hatfield Consultants. (2009). Regional capacity building program for health risk management of
persistent organic pollutants (POPs) in South East Asia. Retrieved from
http://www.popstoolkit.com/UserFiles/File/EconReports/Cambodia/Cambodia%20Economic%20
Valuation%20Report%20-%20Title%20TOC.pdf &
http://www.popstoolkit.com/UserFiles/File/EconReports/Cambodia/Cambodia%20Economic%20
Valuation%20Report%20-%20Economic%20Analysis.pdf
Hutton, G., Haller, L., & Bartram, J. (2007). Global Cost-Benefit Analysis of Water Supply and
Sanitation Interventions. WHO Journal of Water and Health, 5(4), 481-502.
Natural Resources Canada (NRC). (2009). Calculating Estimated Annual Carbon Dioxide Emissions.
Accessed from http://oee.nrcan.gc.ca/publications/transportation/fuel-guide/2007/calculating-
co2.cfm?attr=8.
Pruss, A., Kay, D., Fewtrell, L., & Bartram, J. (2002). Estimating the burden of disease from water,
sanitation, and hygiene at a global level. Environmental Health Perspectives, 110(5), 537-542.
Retrieved from http://www.who.int/quantifying_ehimpacts/global/en/ArticleEHP052002.pdf.
Reed, B. (2005). Minimum water quantity needed for domestic use in emergencies. WHO – Technical
Notes for Emergencies. Retrieved from http://www.searo.who.int/LinkFiles/
List_of_Guidelines_for_Health_Emergency_Minimum_water_quantity.pdf.
Rogers, P., Bhatia, R., & Huber, A. (1998). Water as a social and economic good: How to put the
principle into practice. Global Water Partnership Technical Advisory Committee Background
Paper No. 2. Retrieved from http://info.worldbank.org/etools/docs/library/80637/
IWRM4_TEC02-WaterAsSocialEconGood-Rogers.pdf.
A Well Construction Cost-Benefit Analysis (CBA) Whinnery (2012)
22
Rural Water Supply Network (RWSN). (2012). Documentation. Accessed at http://www.rwsn.ch/
documentation.
Universitat Politecnica de Catalunya (UPC). (2009) Appendix A: PVC production. Retrieved from
http://upcommons.upc.edu/pfc/bitstream/2099.1/14307/2/APPENDIX%20A%20-
%20PVC%20Production.pdf.
US DOE (Department of Energy). (2010). Final rule technical support document (TSD): Energy
efficiency program for commercial and industrial equipment: small electric motors, Appendix
15A (by the Interagency Working Group on Social Cost of Carbon). Social Cost of Carbon for
Regulatory Impact Analysis Under Executive Order 12866.
US EPA (Environmental Protection Agency). (2001). Cost Analyses for Selected Groundwater Cleanup
Projects: Pump and Treat Systems and Permeable Reactive Barriers. Retrieved from
http://www.epa.gov/tio/download/remed/542r00013.pdf.
US EPA (Environmental Protection Agency). (2005). Compilation of Air Pollutant Emission Factors,
Volume I: Stationary Point and Area Sources, AP 42. Retrieved from
http://www.epa.gov/ttn/chief/ap42/ch11/final/c11s06.pdf.
Viscusi, W. K. & Aldy, J. E. (2002). The value of a statistical life: A critical review of market estimates
throughout the world. Harvard Law School John M. Olin Center for Law, Economics and
Business Discussion Paper Series. Paper 392. Retrieved from
http://lsr.nellco.org/harvard_olin/392.
World Bank. (2012). Retrieved from http://www.worldbank.org/.
World Health Organization. (2004). Department of Measurement and Health Information. Retrieved from
www.who.int/healthinfo/statistics/ bodgbddeathdalyestimates.xls.
World Health Organization. (2004). Rapid needs assessment for water, sanitation, and hygiene. Retrieved
from http://www.searo.who.int/en/section23/section1108/info-kit/
Rapid_needs_Assessment_guidelines.doc.
World Health Organization. (2012). Burden of disease and cost-effectiveness estimates. Retrieved from
http://www.who.int/water_sanitation_health/diseases/burden/ en/index.html.
Worrell, E., Martin, N., & Price, L. (1999). Energy Efficiency and Carbon Dioxide Emissions Reduction
Opportunities in the U.S. Iron and Steel Sector. Ernest Orlando Lawrence Berkeley National
Laboratory.
A Well Construction Cost-Benefit Analysis (CBA) Whinnery (2012)
23
Appendix
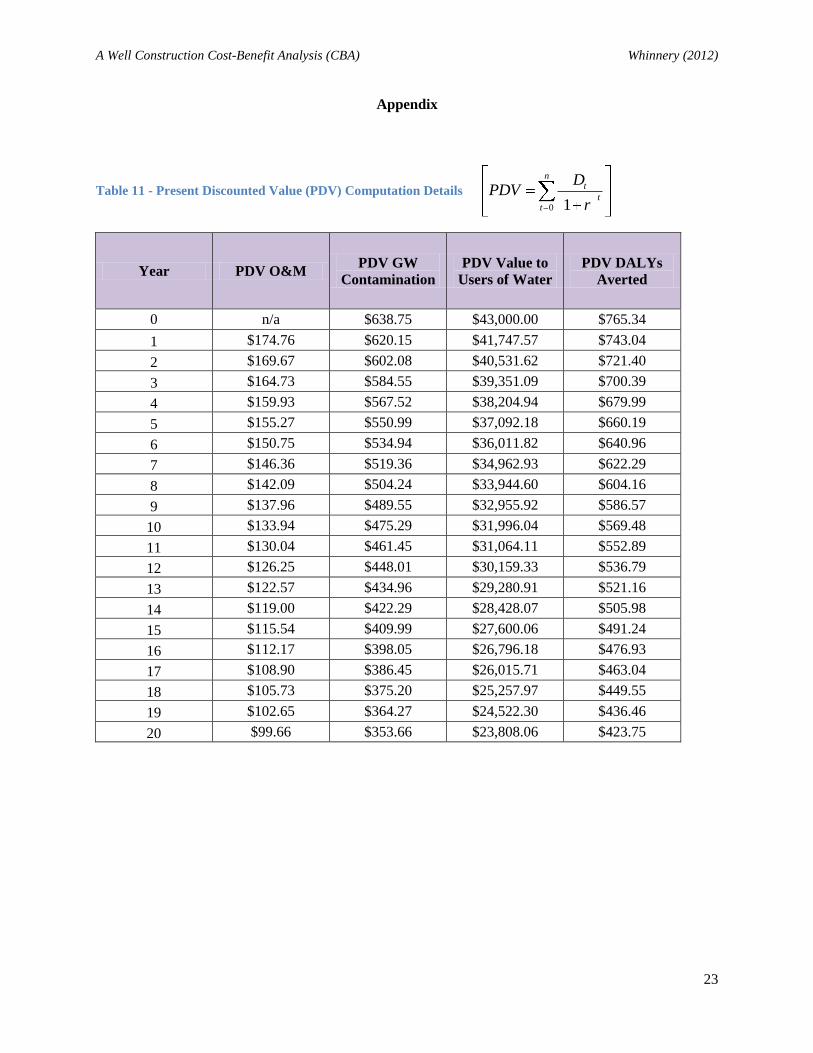
Table 11 - Present Discounted Value (PDV) Computation Details
0 1
nt
tt
DPDV
r
Year PDV O&M PDV GW
Contamination
PDV Value to
Users of Water
PDV DALYs
Averted
0 n/a $638.75 $43,000.00 $765.34
1 $174.76 $620.15 $41,747.57 $743.04
2 $169.67 $602.08 $40,531.62 $721.40
3 $164.73 $584.55 $39,351.09 $700.39
4 $159.93 $567.52 $38,204.94 $679.99
5 $155.27 $550.99 $37,092.18 $660.19
6 $150.75 $534.94 $36,011.82 $640.96
7 $146.36 $519.36 $34,962.93 $622.29
8 $142.09 $504.24 $33,944.60 $604.16
9 $137.96 $489.55 $32,955.92 $586.57
10 $133.94 $475.29 $31,996.04 $569.48
11 $130.04 $461.45 $31,064.11 $552.89
12 $126.25 $448.01 $30,159.33 $536.79
13 $122.57 $434.96 $29,280.91 $521.16
14 $119.00 $422.29 $28,428.07 $505.98
15 $115.54 $409.99 $27,600.06 $491.24
16 $112.17 $398.05 $26,796.18 $476.93
17 $108.90 $386.45 $26,015.71 $463.04
18 $105.73 $375.20 $25,257.97 $449.55
19 $102.65 $364.27 $24,522.30 $436.46
20 $99.66 $353.66 $23,808.06 $423.75
A Well Construction Cost-Benefit Analysis (CBA) Whinnery (2012)
24
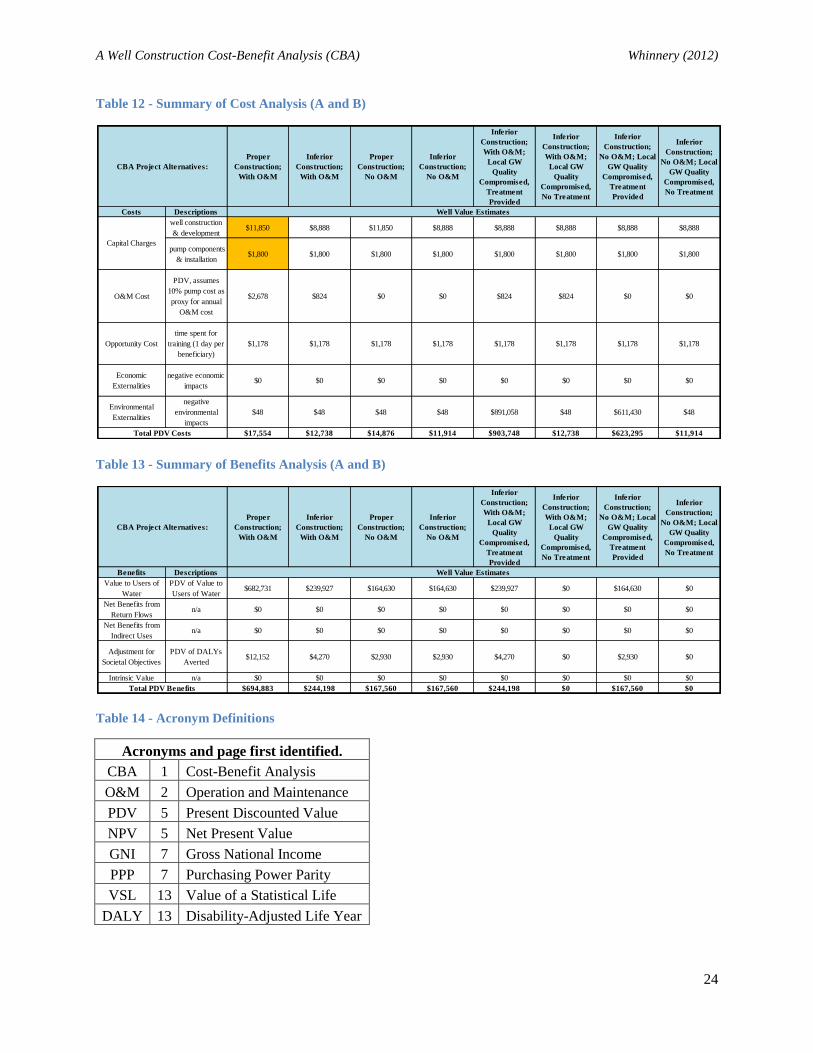
Table 12 - Summary of Cost Analysis (A and B)
Table 13 - Summary of Benefits Analysis (A and B)
Table 14 - Acronym Definitions
Acronyms and page first identified.
CBA 1 Cost-Benefit Analysis
O&M 2 Operation and Maintenance
PDV 5 Present Discounted Value
NPV 5 Net Present Value
GNI 7 Gross National Income
PPP 7 Purchasing Power Parity
VSL 13 Value of a Statistical Life
DALY 13 Disability-Adjusted Life Year
Proper
Construction;
With O&M
Inferior
Construction;
With O&M
Proper
Construction;
No O&M
Inferior
Construction;
No O&M
Inferior
Construction;
With O&M;
Local GW
Quality
Compromised,
Treatment
Provided
Inferior
Construction;
With O&M;
Local GW
Quality
Compromised,
No Treatment
Inferior
Construction;
No O&M; Local
GW Quality
Compromised,
Treatment
Provided
Inferior
Construction;
No O&M; Local
GW Quality
Compromised,
No Treatment
Costs Descriptions
well construction
& development$11,850 $8,888 $11,850 $8,888 $8,888 $8,888 $8,888 $8,888
pump components
& installation$1,800 $1,800 $1,800 $1,800 $1,800 $1,800 $1,800 $1,800
O&M Cost
PDV, assumes
10% pump cost as
proxy for annual
O&M cost
$2,678 $824 $0 $0 $824 $824 $0 $0
Opportunity Cost
time spent for
training (1 day per
beneficiary)
$1,178 $1,178 $1,178 $1,178 $1,178 $1,178 $1,178 $1,178
Economic
Externalities
negative economic
impacts$0 $0 $0 $0 $0 $0 $0 $0
Environmental
Externalities
negative
environmental
impacts
$48 $48 $48 $48 $891,058 $48 $611,430 $48
$17,554 $12,738 $14,876 $11,914 $903,748 $12,738 $623,295 $11,914Total PDV Costs
Capital Charges
Well Value Estimates
CBA Project Alternatives:
Proper
Construction;
With O&M
Inferior
Construction;
With O&M
Proper
Construction;
No O&M
Inferior
Construction;
No O&M
Inferior
Construction;
With O&M;
Local GW
Quality
Compromised,
Treatment
Provided
Inferior
Construction;
With O&M;
Local GW
Quality
Compromised,
No Treatment
Inferior
Construction;
No O&M; Local
GW Quality
Compromised,
Treatment
Provided
Inferior
Construction;
No O&M; Local
GW Quality
Compromised,
No Treatment
Benefits Descriptions
Value to Users of
Water
PDV of Value to
Users of Water$682,731 $239,927 $164,630 $164,630 $239,927 $0 $164,630 $0
Net Benefits from
Return Flowsn/a $0 $0 $0 $0 $0 $0 $0 $0
Net Benefits from
Indirect Usesn/a $0 $0 $0 $0 $0 $0 $0 $0
Adjustment for
Societal Objectives
PDV of DALYs
Averted$12,152 $4,270 $2,930 $2,930 $4,270 $0 $2,930 $0
Intrinsic Value n/a $0 $0 $0 $0 $0 $0 $0 $0
$694,883 $244,198 $167,560 $167,560 $244,198 $0 $167,560 $0
Well Value Estimates
Total PDV Benefits
CBA Project Alternatives: