A Visual Approach to Construction Cost Estimating · Today, estimating technologies used by...
113
Marquee University e-Publications@Marquee Master's eses (2009 -) Dissertations, eses, and Professional Projects A Visual Approach to Construction Cost Estimating Phuwadol Samphaongoen Marquee University Recommended Citation Samphaongoen, Phuwadol, "A Visual Approach to Construction Cost Estimating" (2010). Master's eses (2009 -). Paper 28. hp://epublications.marquee.edu/theses_open/28
Transcript of A Visual Approach to Construction Cost Estimating · Today, estimating technologies used by...
Marquette Universitye-Publications@Marquette
Master's Theses (2009 -) Dissertations, Theses, and Professional Projects
A Visual Approach to Construction CostEstimatingPhuwadol SamphaongoenMarquette University
Recommended CitationSamphaongoen, Phuwadol, "A Visual Approach to Construction Cost Estimating" (2010). Master's Theses (2009 -). Paper 28.http://epublications.marquette.edu/theses_open/28
A VISUAL APPROACH TO CONSTRUCTION COST ESTIMATING
by
Phuwadol Samphaongoen, B.S.
A Thesis submitted to the Faculty of the Graduate School,
Marquette University,
In Partial Fulfillment of the Requirements for
the Degree of Master of Science
Milwaukee, Wisconsin
May 2010
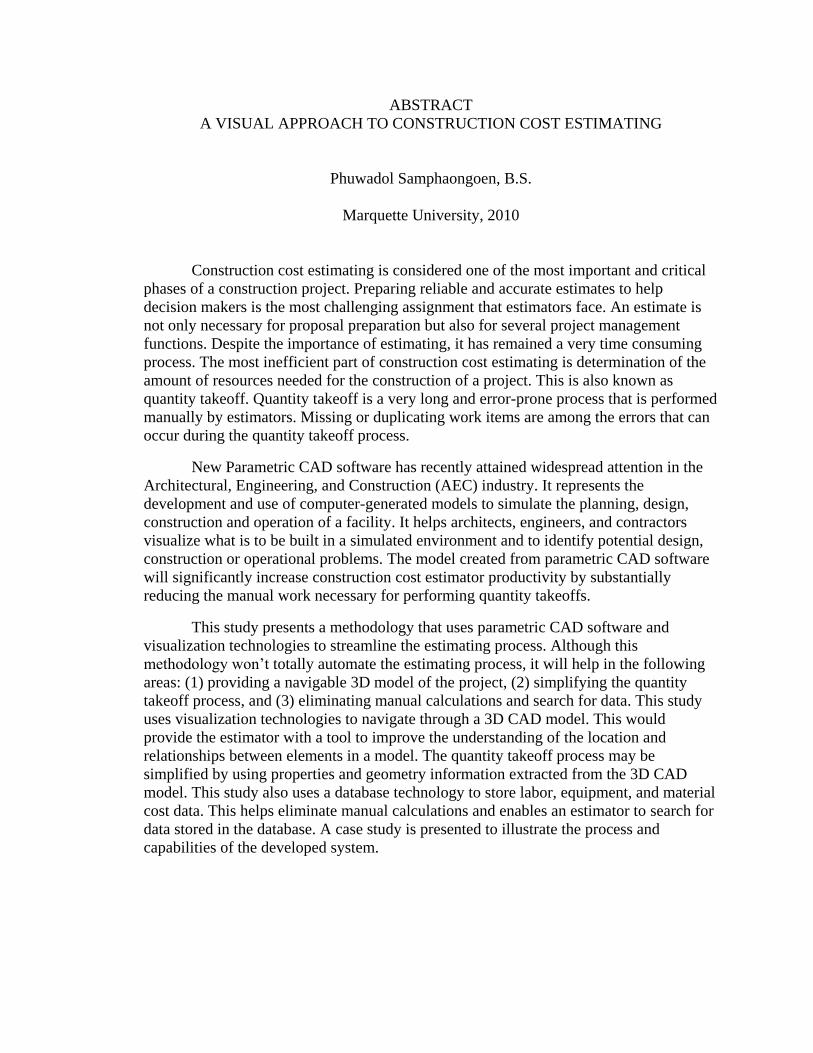
ABSTRACT
A VISUAL APPROACH TO CONSTRUCTION COST ESTIMATING
Phuwadol Samphaongoen, B.S.
Marquette University, 2010
Construction cost estimating is considered one of the most important and critical
phases of a construction project. Preparing reliable and accurate estimates to help
decision makers is the most challenging assignment that estimators face. An estimate is
not only necessary for proposal preparation but also for several project management
functions. Despite the importance of estimating, it has remained a very time consuming
process. The most inefficient part of construction cost estimating is determination of the
amount of resources needed for the construction of a project. This is also known as
quantity takeoff. Quantity takeoff is a very long and error-prone process that is performed
manually by estimators. Missing or duplicating work items are among the errors that can
occur during the quantity takeoff process.
New Parametric CAD software has recently attained widespread attention in the
Architectural, Engineering, and Construction (AEC) industry. It represents the
development and use of computer-generated models to simulate the planning, design,
construction and operation of a facility. It helps architects, engineers, and contractors
visualize what is to be built in a simulated environment and to identify potential design,
construction or operational problems. The model created from parametric CAD software
will significantly increase construction cost estimator productivity by substantially
reducing the manual work necessary for performing quantity takeoffs.
This study presents a methodology that uses parametric CAD software and
visualization technologies to streamline the estimating process. Although this
methodology won’t totally automate the estimating process, it will help in the following
areas: (1) providing a navigable 3D model of the project, (2) simplifying the quantity
takeoff process, and (3) eliminating manual calculations and search for data. This study
uses visualization technologies to navigate through a 3D CAD model. This would
provide the estimator with a tool to improve the understanding of the location and
relationships between elements in a model. The quantity takeoff process may be
simplified by using properties and geometry information extracted from the 3D CAD
model. This study also uses a database technology to store labor, equipment, and material
cost data. This helps eliminate manual calculations and enables an estimator to search for
data stored in the database. A case study is presented to illustrate the process and
capabilities of the developed system.

i
ACKNOWLEDGEMENTS
Phuwadol Samphaongoen, B.S.
This thesis would not have been possible without the support of family and
friends. Thank you to my committee for your patience. A special thank to my advisor Dr.
Saeed Karshenas for pushing and guiding me every step along this journey. His
encouragement, support, and suggestions provided strong motivation for the time put into
completing this research. I would also like to thank the Marquette University Department
of Civil and Environmental Engineering for taking the interest in my research.
I would also like to thank David Sell for his help during the database and
application development.
Special thank and acknowledgment to Mom Wannee, Dad Watana, Brother Dew,
and Sister Dear. Without them and their unmatched generosity, love, support, and
encouragement, this thesis would not have been completed.
Thank you to all my friends and host families who have supported me throughout
my academic career. Without their love and support, this work would not have been
developed, progress, or completed.
Lastly, I am most grateful to my parents, Papa Narong Samphaongoen and Mom
Sirada Suksawasdee. Without their unconditional love, support, and encouragement, my
endeavor in life would never have been completed or successful.
ii
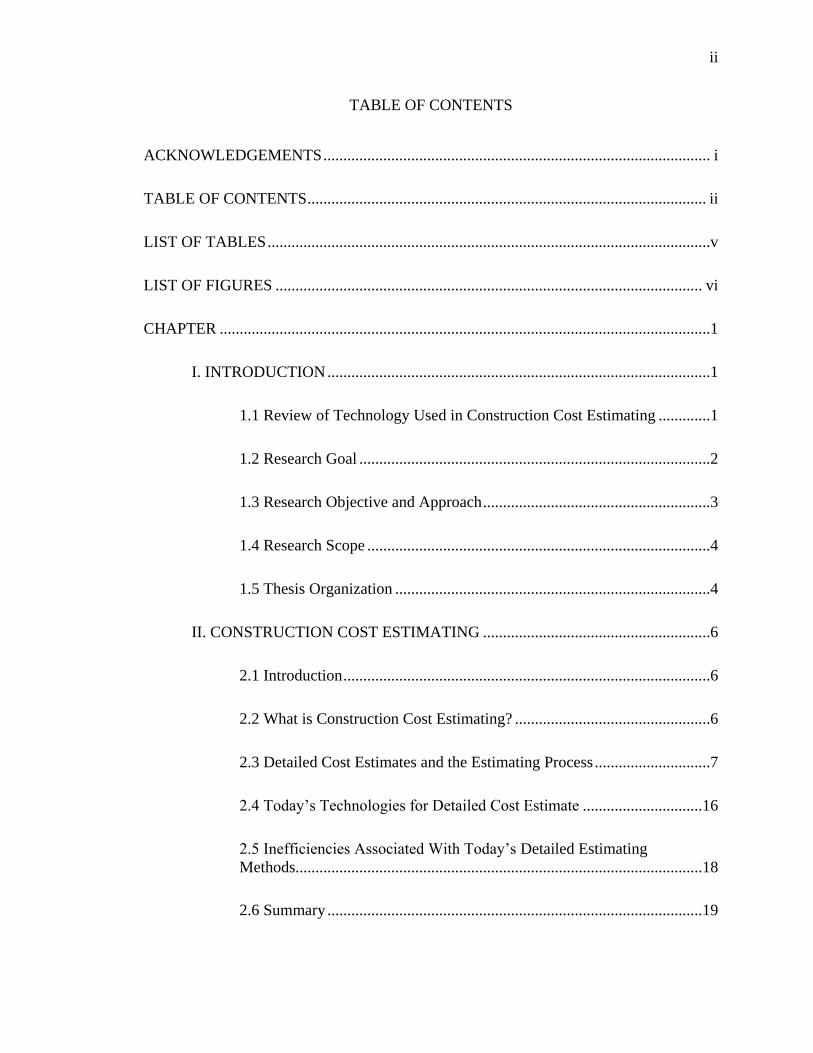
TABLE OF CONTENTS
ACKNOWLEDGEMENTS ................................................................................................. i
TABLE OF CONTENTS .................................................................................................... ii
LIST OF TABLES ...............................................................................................................v
LIST OF FIGURES ........................................................................................................... vi
CHAPTER ...........................................................................................................................1
I. INTRODUCTION ................................................................................................1
1.1 Review of Technology Used in Construction Cost Estimating .............1
1.2 Research Goal ........................................................................................2
1.3 Research Objective and Approach .........................................................3
1.4 Research Scope ......................................................................................4
1.5 Thesis Organization ...............................................................................4
II. CONSTRUCTION COST ESTIMATING .........................................................6
2.1 Introduction ............................................................................................6
2.2 What is Construction Cost Estimating? .................................................6
2.3 Detailed Cost Estimates and the Estimating Process .............................7
2.4 Today’s Technologies for Detailed Cost Estimate ..............................16
2.5 Inefficiencies Associated With Today’s Detailed Estimating
Methods......................................................................................................18
2.6 Summary ..............................................................................................19
iii
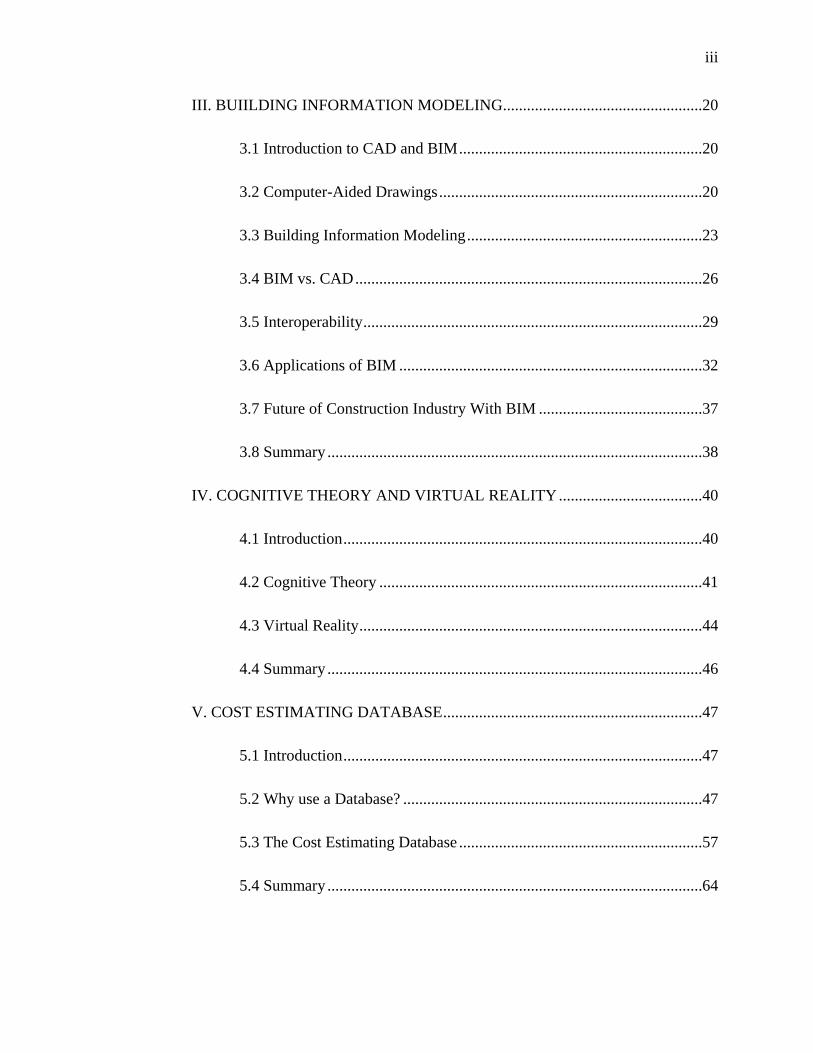
III. BUIILDING INFORMATION MODELING ..................................................20
3.1 Introduction to CAD and BIM .............................................................20
3.2 Computer-Aided Drawings ..................................................................20
3.3 Building Information Modeling ...........................................................23
3.4 BIM vs. CAD .......................................................................................26
3.5 Interoperability .....................................................................................29
3.6 Applications of BIM ............................................................................32
3.7 Future of Construction Industry With BIM .........................................37
3.8 Summary ..............................................................................................38
IV. COGNITIVE THEORY AND VIRTUAL REALITY ....................................40
4.1 Introduction ..........................................................................................40
4.2 Cognitive Theory .................................................................................41
4.3 Virtual Reality ......................................................................................44
4.4 Summary ..............................................................................................46
V. COST ESTIMATING DATABASE .................................................................47
5.1 Introduction ..........................................................................................47
5.2 Why use a Database? ...........................................................................47
5.3 The Cost Estimating Database .............................................................57
5.4 Summary ..............................................................................................64
iv
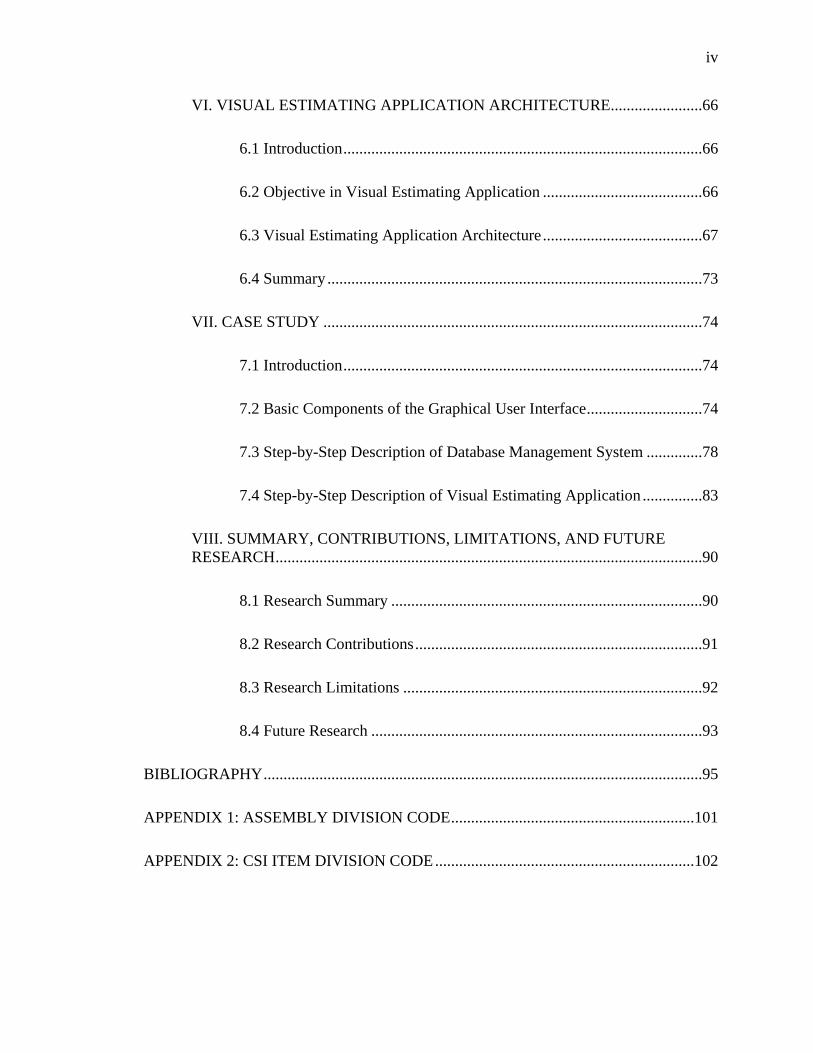
VI. VISUAL ESTIMATING APPLICATION ARCHITECTURE.......................66
6.1 Introduction ..........................................................................................66
6.2 Objective in Visual Estimating Application ........................................66
6.3 Visual Estimating Application Architecture ........................................67
6.4 Summary ..............................................................................................73
VII. CASE STUDY ...............................................................................................74
7.1 Introduction ..........................................................................................74
7.2 Basic Components of the Graphical User Interface .............................74
7.3 Step-by-Step Description of Database Management System ..............78
7.4 Step-by-Step Description of Visual Estimating Application ...............83
VIII. SUMMARY, CONTRIBUTIONS, LIMITATIONS, AND FUTURE
RESEARCH ...........................................................................................................90
8.1 Research Summary ..............................................................................90
8.2 Research Contributions ........................................................................91
8.3 Research Limitations ...........................................................................92
8.4 Future Research ...................................................................................93
BIBLIOGRAPHY ..............................................................................................................95
APPENDIX 1: ASSEMBLY DIVISION CODE .............................................................101
APPENDIX 2: CSI ITEM DIVISION CODE .................................................................102
v
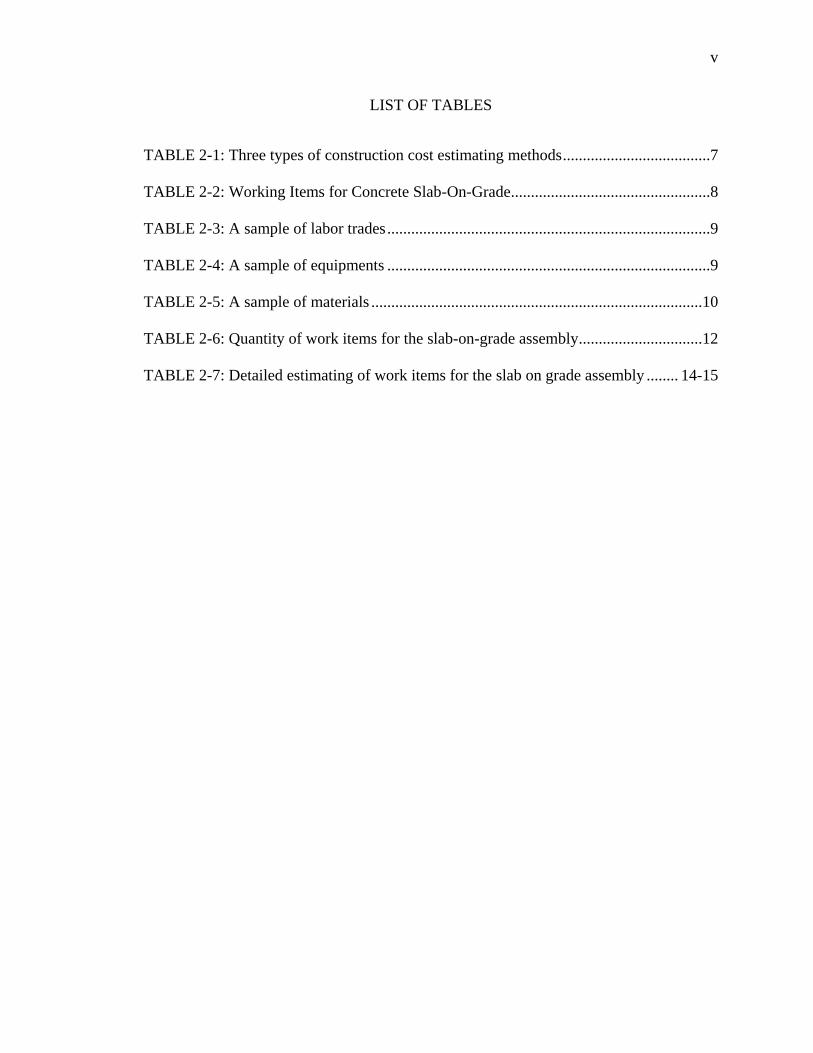
LIST OF TABLES
TABLE 2-1: Three types of construction cost estimating methods .....................................7
TABLE 2-2: Working Items for Concrete Slab-On-Grade ..................................................8
TABLE 2-3: A sample of labor trades .................................................................................9
TABLE 2-4: A sample of equipments .................................................................................9
TABLE 2-5: A sample of materials ...................................................................................10
TABLE 2-6: Quantity of work items for the slab-on-grade assembly ...............................12
TABLE 2-7: Detailed estimating of work items for the slab on grade assembly ........ 14-15
vi
LIST OF FIGURES
FIGURE 2-1: A building plan consisting of four walls and a slab-on-grade ....................11
FIGURE 2-2: A section view of wall and slab-on-grade ...................................................12
FIGURE 3-1: A 2D CAD Drawing ...................................................................................21
FIGURE 3-2: 3D CAD Wire Frame Model .......................................................................22
FIGURE 3-3: Rendered 3D CAD Model ...........................................................................23
FIGURE 4-1: Simplified model of human information processing ...................................42
FIGURE 5-1: Hierarchical Database Model ......................................................................49
FIGURE 5-2: Network Database Model ............................................................................49
FIGURE 5-3: The Relational Database Model ..................................................................50
FIGURE 5-4: Cost Estimating Database Schema ..............................................................58
FIGURE 5-5: Labor Table .................................................................................................59
FIGURE 5-6: Equipment Table .........................................................................................60
FIGURE 5-7: Material Table .............................................................................................61
FIGURE 5-8: Crew Table ..................................................................................................62
FIGURE 5-9a: Crew_Labor Table.....................................................................................62
FIGURE 5-9b: Crew_Equipment Table ............................................................................62
FIGURE 5-10: Item Table .................................................................................................63
FIGURE 5-11: Assembly Table.........................................................................................64
FIGURE 5-12: Assembly_Item Table ...............................................................................64
FIGURE 6-1: Visual Estimating Application Architecture ...............................................68
FIGURE 6-2: View Frame Relative to the World Frame ..................................................71
FIGURE 7-1: Revit Element Extractor ..............................................................................75
vii
FIGURE 7-2: Database Management Button in the Visualization Walk-Through
Application .........................................................................................................................76
FIGURE 7-3: Database Management Dialog Box .............................................................77
FIGURE 7-4: Database Management Menu in the Visual Estimating Application ..........77
FIGURE 7-5: “Add” Radio Button in the Labor Table Dialog Box..................................79
FIGURE 7-6: After the “add” button is clicked, textboxes, “OK”, and “Cancel” buttons
are enabled. ........................................................................................................................79
FIGURE 7-7: After the estimator has clicked “OK” and the list will be updated
automatically ......................................................................................................................80
FIGURE 7-8: Roof is selected and the update button is clicked .......................................81
FIGURE 7-9: Update picture dialog box. Asphalt roof picture was selected ....................82
FIGURE 7-10: After “Roof” has been updated to “Asphalt Roof” ...................................82
FIGURE 7-11: An item is selected to be deleted ...............................................................83
FIGURE 7-12: “My Menu” added on the top tool bar. It is used to extract element
properties into an XML file. ..............................................................................................84
FIGURE 7-13: Model shown in the visualization system module ....................................85
FIGURE 7-14: A wall is selected using the walkthrough camera .....................................86
FIGURE 7-15: Estimating dialog box shown during an assembly is being selected ........87
FIGURE 7-16: Different Items for the Assembly is shown in the dialog box ..................88
FIGURE 7-17: Item Cost Estimating Summary ................................................................89
FIGURE 7-18: Estimating report created by the Visual Estimating Application ..............89
1
CHAPTER 1
INTRODUCTION
Construction cost estimating is a cumbersome process. It takes a long time for an
estimator to complete an accurate estimate and construction contractors must prepare cost
estimates quite often in order to prepare bids for new projects. This presents a challenge
to an estimator who has to prepare several estimates in a short period of time. In recent
years, computers and estimating software have reduced the amount of manual work
necessary for preparing an estimate by organizing and providing fast access to latest
labor, material and equipment costs, quickly performing calculations and generating
reports. There is room to improve the estimating process even more. This can be
accomplished by using the latest CAD and visualization technologies. Improvements can
be made in how information is transferred from design files to estimating applications
and in visually matching CAD elements with estimating database assemblies.
This chapter provides a brief description of the current technology used in the
construction cost estimating process. It also discusses research goals, approach, and
scope. Finally, the organization of the thesis will be described.
1.1 REVIEW OF TECHNOLOGIES USED IN CONSTRUCTION COST
ESTIMATING
Today, estimating technologies used by contractors vary tremendously from
contractor to contractor. Some might still be using simple tools such as paper and pencil,
while others are more technologically advanced and use computers for activities such as
quantity take off, calculations, and estimating report generation and use digitizing tablets
2
to transfer the dimensions of building elements from paper onto computer. Spreadsheet
templates are also widely used in estimating by contractors.
Most building design drawings currently used by contractors are produced using
2D CAD systems. Since 2D CAD systems do not contain building element properties, it
would be difficult to develop estimating systems that can directly import building
information from the CAD files. With the advent of new 3D CAD software, new
generations of estimating systems are being designed that can directly import all
information necessary for creating an estimate from CAD models.
Database technology has also advanced greatly in recent years and has made it
possible to organize and rapidly retrieve a large amount of up-to-date data from remote
sources. Application of the latest relational databases has also become easier with the
latest data access languages and scripting technology.
Another technology that has advanced tremendously in recent years and can be
employed in improving the estimating process is 3D graphics and visualization
technology. With the advances in visualization technology, it is now possible to visualize
the building and allow the estimator to interact with it. This allows the estimator to select
elements that should be included in an estimate as he/she walks inside the building.
1.2 RESEARCH GOAL
The goal of this research is to make the process of construction cost estimating
simpler and more intuitive by incorporating visualization technology. It is difficult and
time consuming to prepare an estimate by looking at a long list of building elements.
3
With the visual approach to cost estimating, the estimator can see exactly the
location and relationship between building elements while inside the virtual building.
Information from a 3D CAD model can be extracted and transferred to estimating
software. This helps reduce the time for manual data entry.
1.3 RESEARCH OBJECTIVE AND APPROACH
To achieve the research goal, the following objective and approach have been
completed:
1. A visualization module has been developed to assist the visual estimating
process using the Microsoft DirectX graphic library. A virtual environment
for a 3D model is provided by both geometry and material information
extracted from a 3D CAD model.
2. Components have been developed to navigate and interact with the 3D model.
First and third person cameras enable users to walk around or inside the
virtual building for visualization of the project and visually estimate the
project by selecting elements. This approach is based on the findings of
cognitive theories which emphasize visualization, in the form of images or
walkthrough, to help reduce the user’s memory load.
3. Database technology has been used to store cost information that is necessary
for construction cost estimating.
4. To minimize the tedious process, a connection between 3D CAD model the
process of construction cost estimating must be formed. An estimating
application has been developed to provide an interface that uses the latest
4
findings in cognitive science, virtual reality, and interactive visualization to
simplify the cost estimating process, making it more intuitive.
1.4 RESEARCH SCOPE
This research focuses on a visual approach to construction cost estimating.
Estimating the cost of a building project consists of determining the cost of a large
number of building elements made of different materials. For example, a building might
consist of concrete, steel, masonry, mechanical, electrical, and plumbing elements.
The Revit Architecture BIM software package has been used to create 3D CAD
models. Visualizing the 3D CAD model is limited to a computer workstation using
keyboard and mouse navigation.
1.5 THESIS ORGANIZATION
This thesis consists of eight chapters. Chapter 1 provides an introduction to the
research problem, approach, and scope for the thesis. Chapter 2 provides an overview of
current construction cost estimating practices, focusing on detailed estimates, information
needed for a detailed estimate and an example illustrating how the information is used to
make an estimate. Chapter 3 discusses the impact of building information modeling
(BIM) on the construction industry and how BIM is used to change the way construction
is done. Chapter 4 discusses cognitive psychology, how it explains the way humans think
and solve problems and how construction industry implements virtual reality and
interactive visualization to visualize construction projects.
5
Chapter 5 discusses the architecture of a visual estimating computer application
developed in this study and its objectives. It also explains the interaction of the Visual
Estimating Application with Autodesk Revit, 3D CAD models, and cost estimating
databases. Chapter 6 discusses database models, especially the relational model, and how
a database was designed for the Visual Estimating Application. Chapter 7 demonstrates
the Visual Estimating Application developed in this study. This is divided into two parts;
database management and visual estimating process. It shows Visual Estimating
Application can be used to estimate a building project. Chapter 8 provides a brief
description of research summary, contributions, limitations, and recommendations for
future research in the area of visual construction cost estimating.
6
CHAPTER 2
CONSTRUCTION COST ESTIMATING
2.1 INTRODUCTION
Cost estimating is an essential task for budgeting and bid preparation for any
construction project. A good estimate depends on many factors including time given to
the estimator, estimator’s experience, and a wide range of assumptions regarding the
project (Jrade and Alkass, 2007). Construction cost estimating involves collecting,
analyzing, and summarizing all available data for a project (Holm et al., 2005). This
chapter will focus on detailed estimates, the information needed for a detailed estimate
and an example illustrating how the information is used to make an estimate. Today’s
detailed estimating technologies and the difficulties associated with detailed estimates are
also reviewed.
2.2 WHAT IS CONSTRUCTION COST ESTIMATING?
A construction cost estimate is a prediction of the total cost of a construction
project. It’s the estimator’s responsibility to assist the owner of the project to plan and
budget for the construction of the project (Choi, 2004). There are three different types of
estimates used at different stages of construction: conceptual, semi-detailed, and detailed
cost estimates (Holm et al., 2005). The difference between these three estimating
methods is explained in table 2-1.
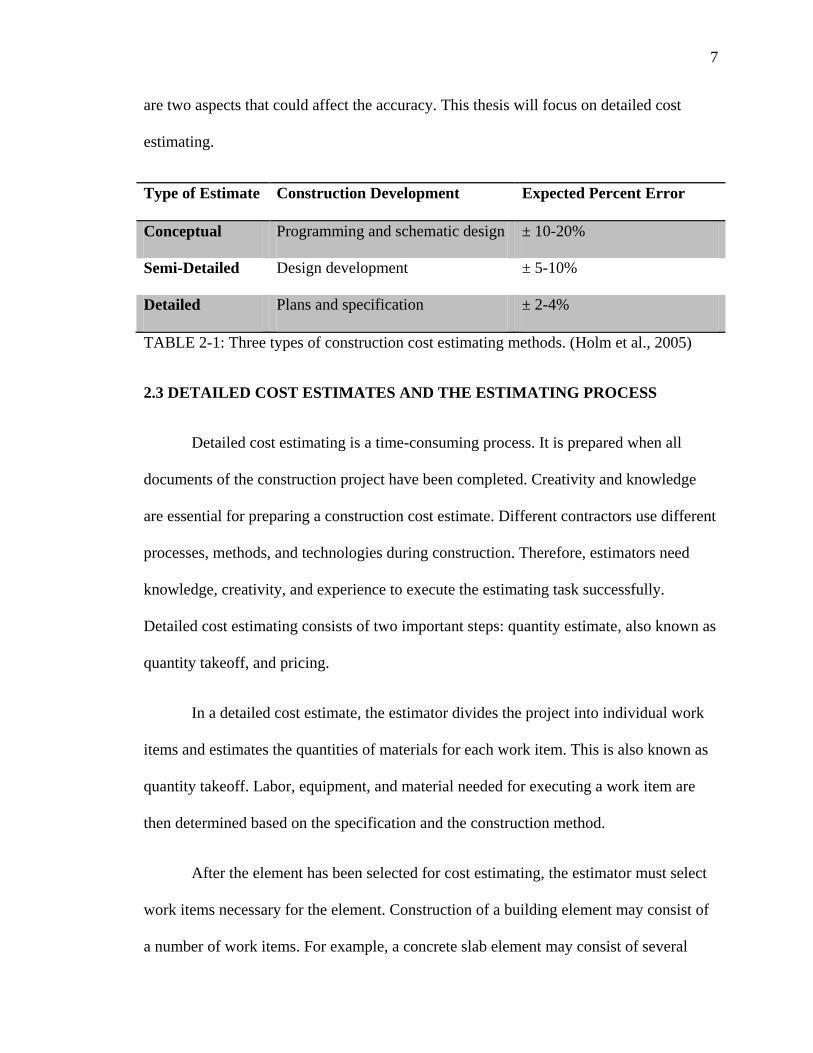
As Table 2-1 shows, the accuracy varies among estimating methods. The
completeness of construction documents and the methodologies of different contractors
7
are two aspects that could affect the accuracy. This thesis will focus on detailed cost
estimating.
Type of Estimate Construction Development Expected Percent Error
Conceptual Programming and schematic design ± 10-20%
Semi-Detailed Design development ± 5-10%
Detailed Plans and specification ± 2-4%
TABLE 2-1: Three types of construction cost estimating methods. (Holm et al., 2005)
2.3 DETAILED COST ESTIMATES AND THE ESTIMATING PROCESS
Detailed cost estimating is a time-consuming process. It is prepared when all
documents of the construction project have been completed. Creativity and knowledge
are essential for preparing a construction cost estimate. Different contractors use different
processes, methods, and technologies during construction. Therefore, estimators need
knowledge, creativity, and experience to execute the estimating task successfully.
Detailed cost estimating consists of two important steps: quantity estimate, also known as
quantity takeoff, and pricing.
In a detailed cost estimate, the estimator divides the project into individual work
items and estimates the quantities of materials for each work item. This is also known as
quantity takeoff. Labor, equipment, and material needed for executing a work item are
then determined based on the specification and the construction method.
After the element has been selected for cost estimating, the estimator must select
work items necessary for the element. Construction of a building element may consist of
a number of work items. For example, a concrete slab element may consist of several
8
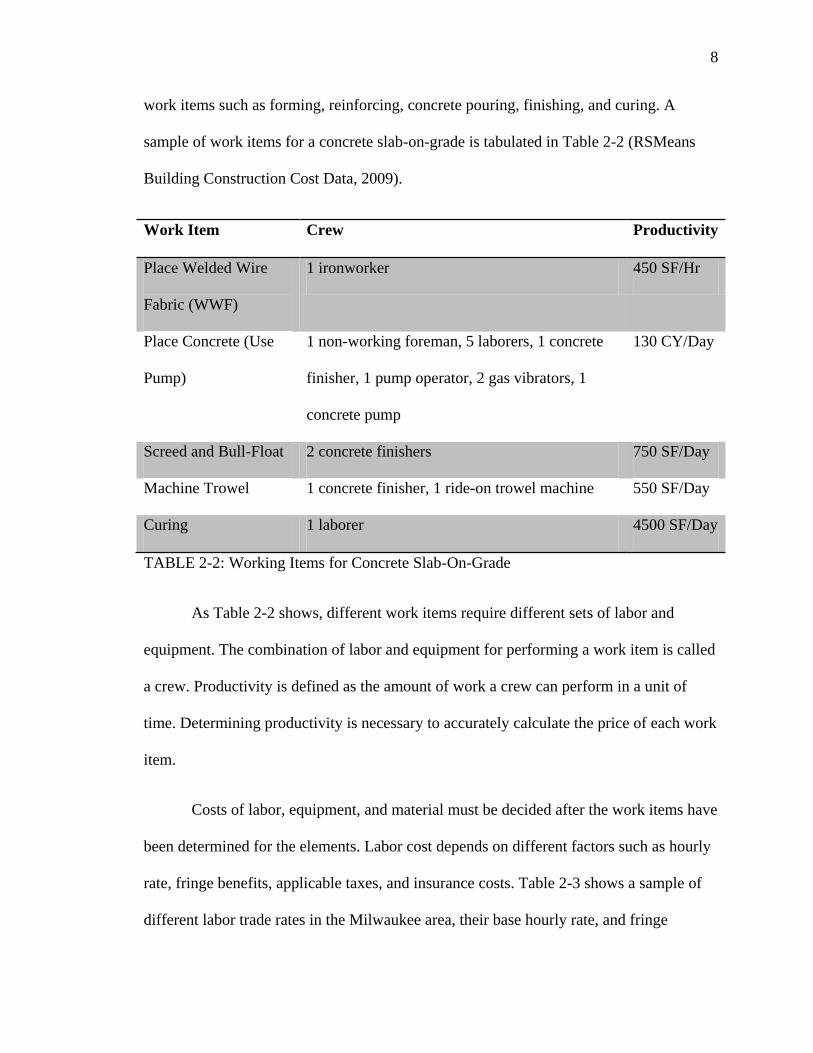
work items such as forming, reinforcing, concrete pouring, finishing, and curing. A
sample of work items for a concrete slab-on-grade is tabulated in Table 2-2 (RSMeans
Building Construction Cost Data, 2009).
Work Item Crew Productivity
Place Welded Wire
Fabric (WWF)
1 ironworker 450 SF/Hr
Place Concrete (Use
Pump)
1 non-working foreman, 5 laborers, 1 concrete
finisher, 1 pump operator, 2 gas vibrators, 1
concrete pump
130 CY/Day
Screed and Bull-Float 2 concrete finishers 750 SF/Day
Machine Trowel 1 concrete finisher, 1 ride-on trowel machine 550 SF/Day
Curing 1 laborer 4500 SF/Day
TABLE 2-2: Working Items for Concrete Slab-On-Grade
As Table 2-2 shows, different work items require different sets of labor and
equipment. The combination of labor and equipment for performing a work item is called
a crew. Productivity is defined as the amount of work a crew can perform in a unit of
time. Determining productivity is necessary to accurately calculate the price of each work
item.
Costs of labor, equipment, and material must be decided after the work items have
been determined for the elements. Labor cost depends on different factors such as hourly
rate, fringe benefits, applicable taxes, and insurance costs. Table 2-3 shows a sample of
different labor trade rates in the Milwaukee area, their base hourly rate, and fringe
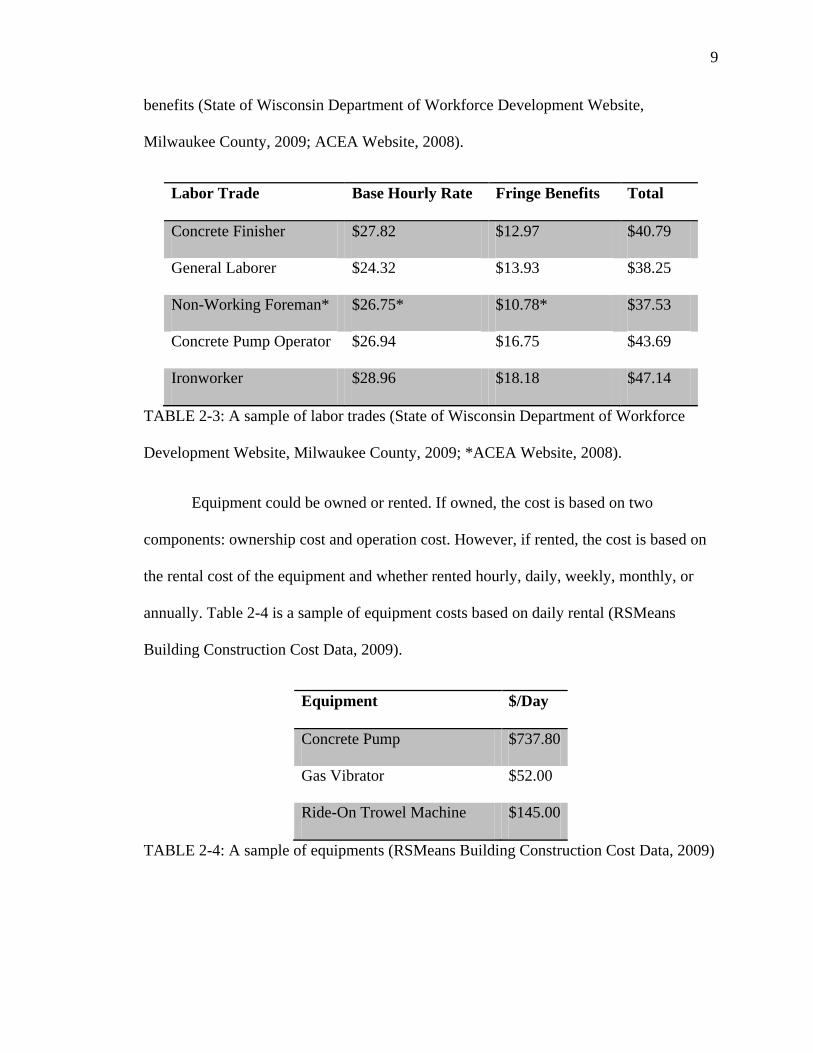
9
benefits (State of Wisconsin Department of Workforce Development Website,
Milwaukee County, 2009; ACEA Website, 2008).
Labor Trade Base Hourly Rate Fringe Benefits Total
Concrete Finisher $27.82 $12.97 $40.79
General Laborer $24.32 $13.93 $38.25
Non-Working Foreman* $26.75* $10.78* $37.53
Concrete Pump Operator $26.94 $16.75 $43.69
Ironworker $28.96 $18.18 $47.14
TABLE 2-3: A sample of labor trades (State of Wisconsin Department of Workforce
Development Website, Milwaukee County, 2009; *ACEA Website, 2008).
Equipment could be owned or rented. If owned, the cost is based on two
components: ownership cost and operation cost. However, if rented, the cost is based on
the rental cost of the equipment and whether rented hourly, daily, weekly, monthly, or
annually. Table 2-4 is a sample of equipment costs based on daily rental (RSMeans
Building Construction Cost Data, 2009).
Equipment $/Day
Concrete Pump $737.80
Gas Vibrator $52.00
Ride-On Trowel Machine $145.00
TABLE 2-4: A sample of equipments (RSMeans Building Construction Cost Data, 2009)
10
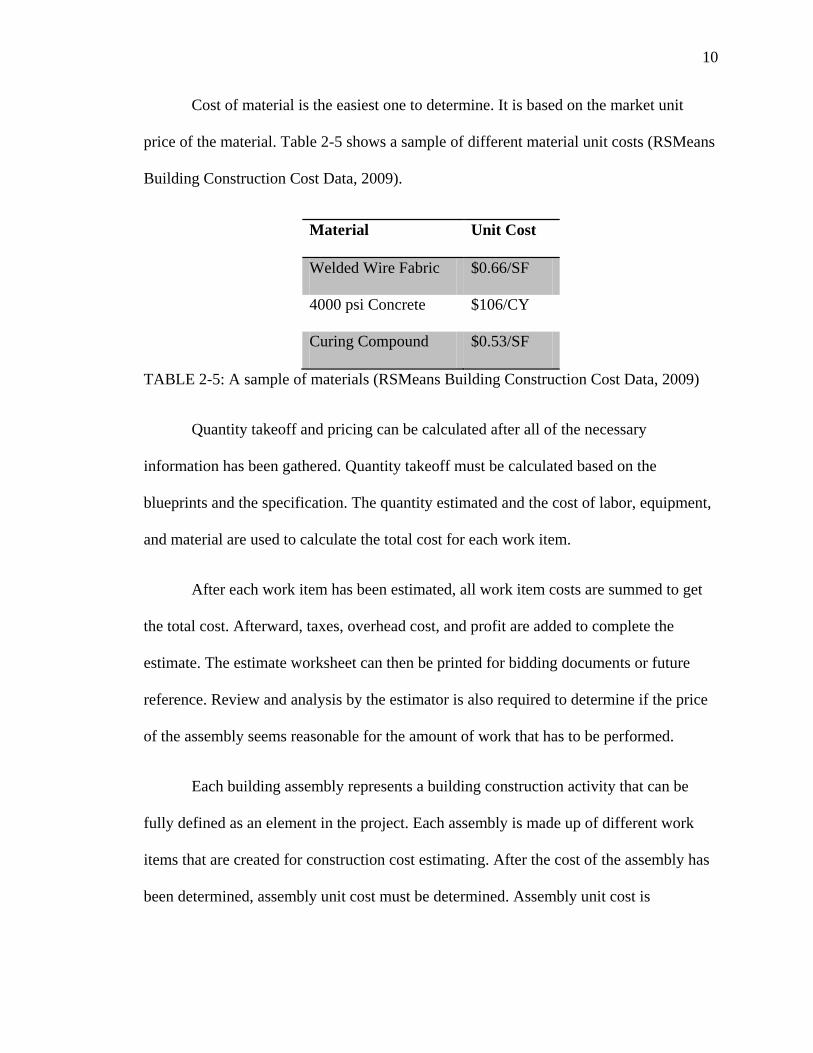
Cost of material is the easiest one to determine. It is based on the market unit
price of the material. Table 2-5 shows a sample of different material unit costs (RSMeans
Building Construction Cost Data, 2009).
Material Unit Cost
Welded Wire Fabric $0.66/SF
4000 psi Concrete $106/CY
Curing Compound $0.53/SF
TABLE 2-5: A sample of materials (RSMeans Building Construction Cost Data, 2009)
Quantity takeoff and pricing can be calculated after all of the necessary
information has been gathered. Quantity takeoff must be calculated based on the
blueprints and the specification. The quantity estimated and the cost of labor, equipment,
and material are used to calculate the total cost for each work item.
After each work item has been estimated, all work item costs are summed to get
the total cost. Afterward, taxes, overhead cost, and profit are added to complete the
estimate. The estimate worksheet can then be printed for bidding documents or future
reference. Review and analysis by the estimator is also required to determine if the price
of the assembly seems reasonable for the amount of work that has to be performed.
Each building assembly represents a building construction activity that can be
fully defined as an element in the project. Each assembly is made up of different work
items that are created for construction cost estimating. After the cost of the assembly has
been determined, assembly unit cost must be determined. Assembly unit cost is
11
determined based on the unit of measurement. For the slab-on-grade example, the
assembly unit is a square foot.
2.3.1 A Detailed Estimate Example
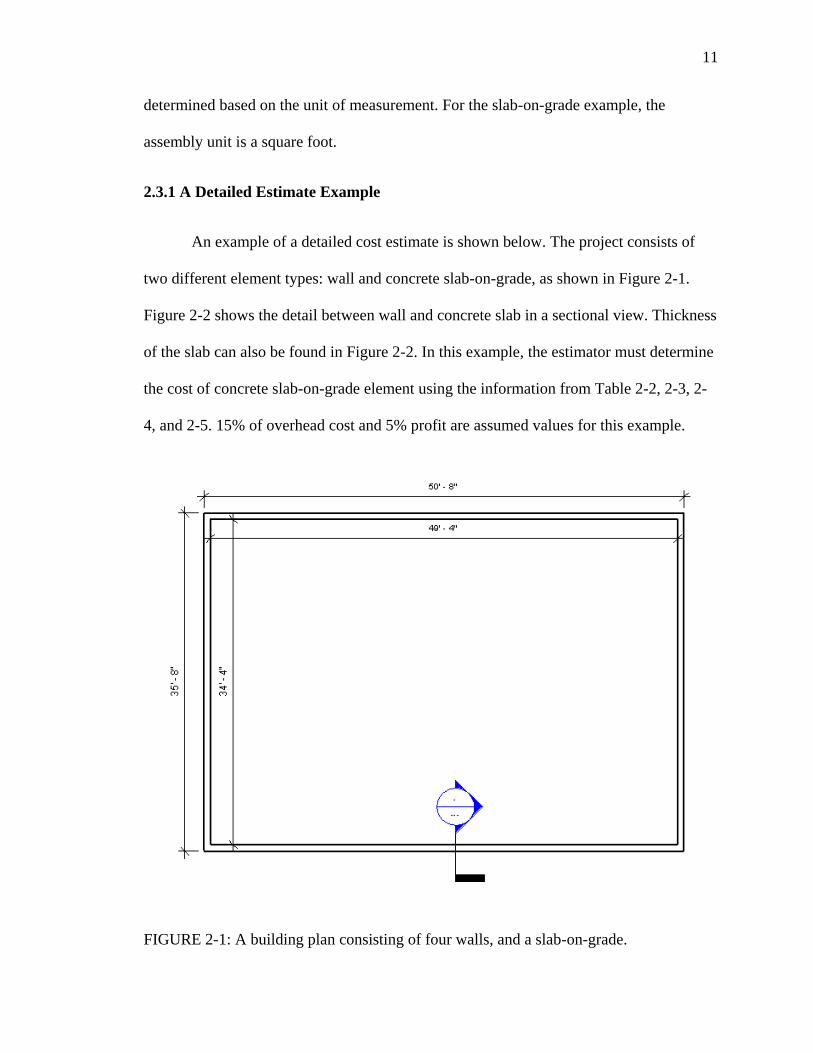
An example of a detailed cost estimate is shown below. The project consists of
two different element types: wall and concrete slab-on-grade, as shown in Figure 2-1.
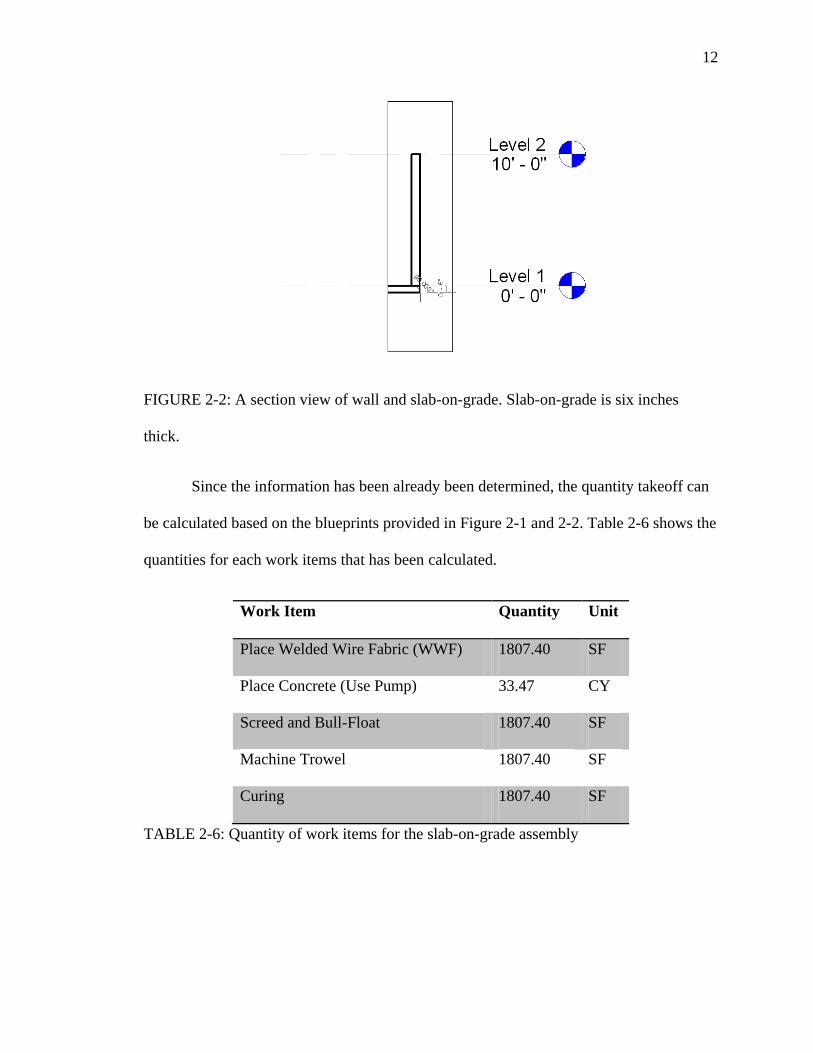
Figure 2-2 shows the detail between wall and concrete slab in a sectional view. Thickness
of the slab can also be found in Figure 2-2. In this example, the estimator must determine
the cost of concrete slab-on-grade element using the information from Table 2-2, 2-3, 2-
4, and 2-5. 15% of overhead cost and 5% profit are assumed values for this example.
FIGURE 2-1: A building plan consisting of four walls, and a slab-on-grade.
12
FIGURE 2-2: A section view of wall and slab-on-grade. Slab-on-grade is six inches
thick.
Since the information has been already been determined, the quantity takeoff can
be calculated based on the blueprints provided in Figure 2-1 and 2-2. Table 2-6 shows the
quantities for each work items that has been calculated.
Work Item Quantity Unit
Place Welded Wire Fabric (WWF) 1807.40 SF
Place Concrete (Use Pump) 33.47 CY
Screed and Bull-Float 1807.40 SF
Machine Trowel 1807.40 SF
Curing 1807.40 SF
TABLE 2-6: Quantity of work items for the slab-on-grade assembly
13
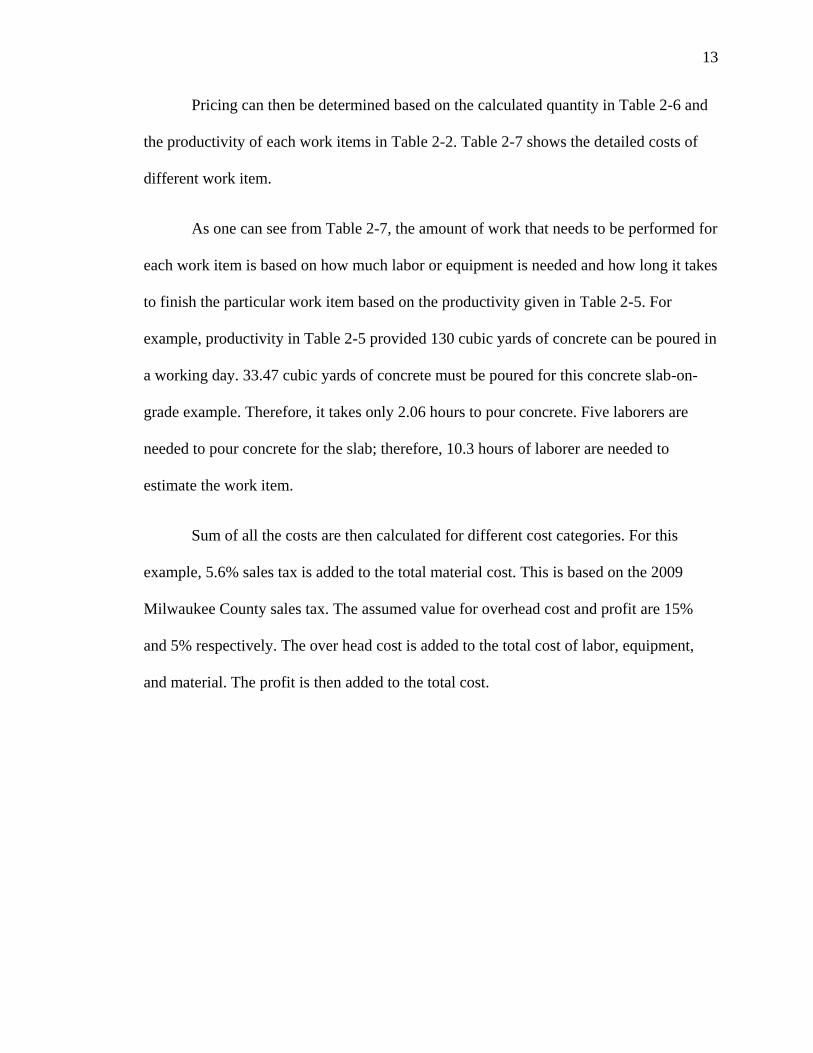
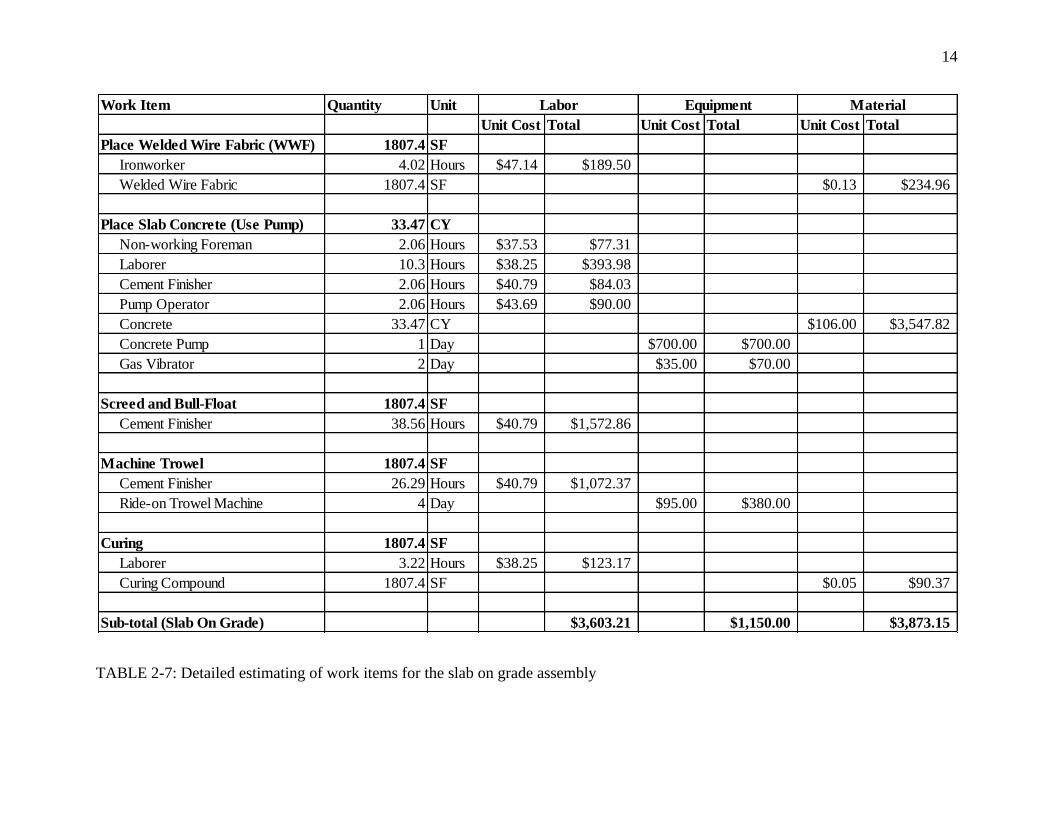
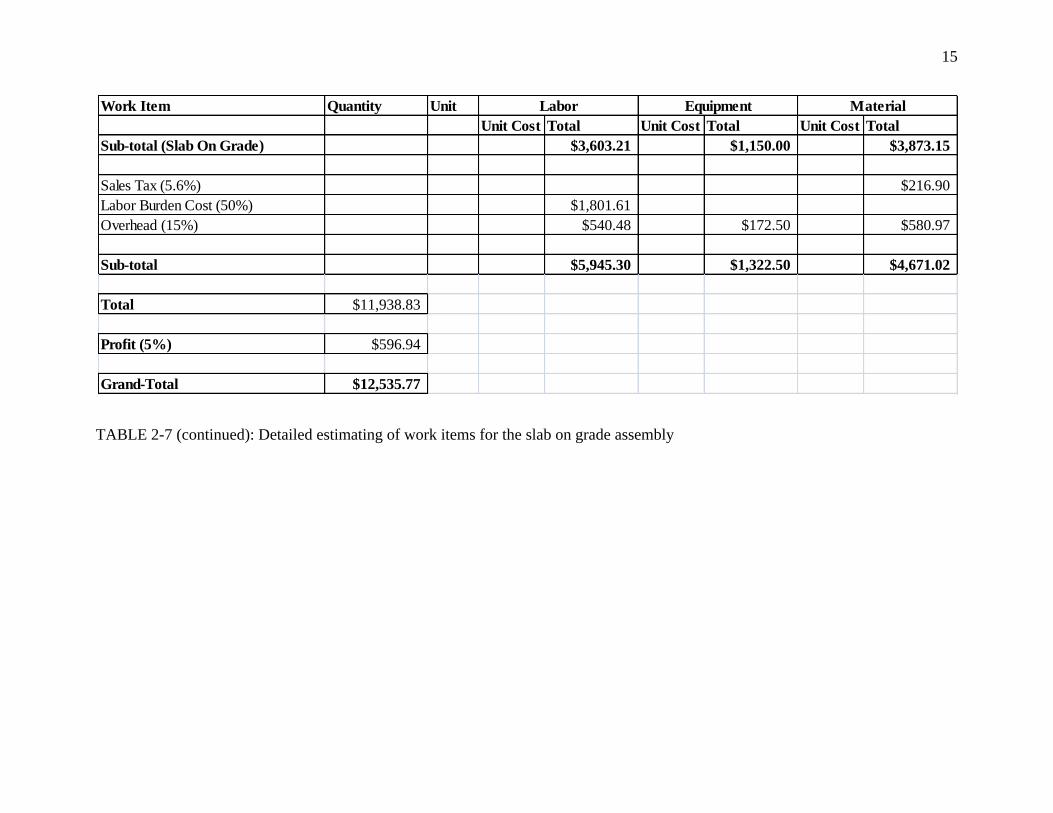
Pricing can then be determined based on the calculated quantity in Table 2-6 and
the productivity of each work items in Table 2-2. Table 2-7 shows the detailed costs of
different work item.
As one can see from Table 2-7, the amount of work that needs to be performed for
each work item is based on how much labor or equipment is needed and how long it takes
to finish the particular work item based on the productivity given in Table 2-5. For
example, productivity in Table 2-5 provided 130 cubic yards of concrete can be poured in
a working day. 33.47 cubic yards of concrete must be poured for this concrete slab-on-
grade example. Therefore, it takes only 2.06 hours to pour concrete. Five laborers are
needed to pour concrete for the slab; therefore, 10.3 hours of laborer are needed to
estimate the work item.
Sum of all the costs are then calculated for different cost categories. For this
example, 5.6% sales tax is added to the total material cost. This is based on the 2009
Milwaukee County sales tax. The assumed value for overhead cost and profit are 15%
and 5% respectively. The over head cost is added to the total cost of labor, equipment,
and material. The profit is then added to the total cost.
14
TABLE 2-7: Detailed estimating of work items for the slab on grade assembly
Work Item Quantity Unit
Unit Cost Total Unit Cost Total Unit Cost Total
Place Welded Wire Fabric (WWF) 1807.4 SF
Ironworker 4.02 Hours $47.14 $189.50
Welded Wire Fabric 1807.4 SF $0.13 $234.96
Place Slab Concrete (Use Pump) 33.47 CY
Non-working Foreman 2.06 Hours $37.53 $77.31
Laborer 10.3 Hours $38.25 $393.98
Cement Finisher 2.06 Hours $40.79 $84.03
Pump Operator 2.06 Hours $43.69 $90.00
Concrete 33.47 CY $106.00 $3,547.82
Concrete Pump 1 Day $700.00 $700.00
Gas Vibrator 2 Day $35.00 $70.00
Screed and Bull-Float 1807.4 SF
Cement Finisher 38.56 Hours $40.79 $1,572.86
Machine Trowel 1807.4 SF
Cement Finisher 26.29 Hours $40.79 $1,072.37
Ride-on Trowel Machine 4 Day $95.00 $380.00
Curing 1807.4 SF
Laborer 3.22 Hours $38.25 $123.17
Curing Compound 1807.4 SF $0.05 $90.37
Sub-total (Slab On Grade) $3,603.21 $1,150.00 $3,873.15
Labor Equipment Material
15
TABLE 2-7 (continued): Detailed estimating of work items for the slab on grade assembly
Work Item Quantity Unit
Unit Cost Total Unit Cost Total Unit Cost Total
Sub-total (Slab On Grade) $3,603.21 $1,150.00 $3,873.15
Sales Tax (5.6%) $216.90
Labor Burden Cost (50%) $1,801.61
Overhead (15%) $540.48 $172.50 $580.97
Sub-total $5,945.30 $1,322.50 $4,671.02
Total $11,938.83
Profit (5%) $596.94
Grand-Total $12,535.77
Labor Equipment Material
16
2.4 TODAY’S TECHNOLOGIES FOR DETAILED COST ESTIMATE
As one can see, detailed cost estimating is a cumbersome process that involves a
lot of data and calculations. Any technology that could assist the process of construction
cost estimating would help reduce estimator’s work load. Computers are considered to be
effective tools for assisting estimators during the construction cost estimating process.
Computers provide many benefits including reducing estimation errors and the time
needed to produce an estimate. Today’s estimating technologies include, but are not
limited to, spreadsheets, cost estimating software, digitizing tablets, on-screen digitizing
systems, and the yet to be matured 3-D CAD parametric estimating software.
2.4.1 Spreadsheet Estimating
A spreadsheet is a computer application that simulates a paper worksheet. It
provides the user with cells that are compiled into rows and columns. Each cell can
contain either text, numerical values, or formula can be defined in cells to obtain
calculated value from the related cells. Complicated mathematical calculations can be
automated with a change of a single cell with the use of formula in the spreadsheet.
Contractors use worksheets to accelerate the estimating process. The estimator can set up
a template with saved formula in the spreadsheet. Estimator can also perform quantity
takeoff calculations within a spreadsheet. Although a spreadsheet requires a lot of input
from the estimator, it eliminates the cumbersome and error prone manual calculations
during the quantity takeoff and pricing.
17
2.4.2 Construction Cost Estimating Software Packages
Various software packages are available to assist the estimator during the detailed
cost estimating process. The capabilities of software packages vary greatly. Some include
labor, equipment, and material cost databases, which facilitates the estimating process
after the database is set up. In order to perform a quantity takeoff, estimating software
packages include technologies such as digitizing tablets, on-screen digitizing systems,
and 3D CAD models.
2.4.3 Digitizing Tablets
A digitizing tablet is a computer input device that uses a stylus and a tracking
surface to capture the drawing on to the computer system. The drawing traced on the
tracking surface transfers point coordinates to a computer, thus it can be used for many
different purposes including construction cost estimating. Digitizing tablets’ purpose in
construction cost estimating is to digitize the paper-based blueprints provided by the
owner of the project or the designer. For example, the estimator can get the length,
perimeter, or area out of the drawing by the scale provided in the blueprints. These
parameters are available when using the digitizing tablet via software package. The
software package may also include estimating software. After the paper blueprints have
been digitized and the quantities for all work items have been determined, the estimator
can use those quantities to estimate the prices of items.
2.4.4 On-Screen Digitizing System
On-screen digitizing systems work the same way as a digitizing tablets. The main
difference is that an on-screen digitizing system works with computer graphic files or
18
scaled CAD documents instead of paper blueprints. This saves money by eliminating the
need for printing large paper blueprints and delivering them, since digital files or
documents can be sent by e-mail using electronic files.
2.4.5 3-D CAD
3-D computer aided drawing (CAD) models help estimators visualize what is
going to be built in the 3-D environment. The ability to digitally extract and transfer data
can speed up cost estimating process. A building model can be seen in many different
views, where details of elements, including their dimensions can be extracted and
transferred to the estimating software. A software company named Innovaya (Innovaya
Website, 2009) has already attempted construction cost estimating using 3-D CAD;
however, it is still a work in progress. Innovaya uses the estimating engine from
Timberline (Timberline Website, 2009) or MC2 ICE (MC
2 ICE Website, 2009).
2.5 INEFFICIENCIES ASSOCIATED WITH TODAY’S DETAILED
ESTIMATING METHODS
As discussed in section 2.4, even though computers have become a part of the
construction cost estimating process, there are still inefficiencies in the estimating
process. Quantity takeoff using the digitizing tablets or on-screen digitizing systems may
provide errors from unstable hand during tracing the drawing. Digitizing a large number
of blueprints is also a very time-consuming process.
Most building design drawings currently used by contractors are produced in 2-D
CAD systems. Since 2-D CAD systems do not contain building element properties, it
would be almost impossible to develop estimating systems that can directly import
19
building information from the CAD files. Although Innovaya has attempted using the
data provided by 3-D CAD, it is a work in progress and has yet to be proven. The test run
of Innovaya and MC2 ICE estimating software showed that the parametric data such as
length, width, or height from CAD models do not transfer to the cost estimating software
automatically. It requires manual input by the estimator. Although it saves time, the
system could be improved by developing an application to directly import necessary
information from CAD files.
2.6 SUMMARY
Today, detailed cost estimating is done using computer-assisted technologies,
which includes spreadsheets and estimating software. However, error prone and time
consuming processes are a few difficulties that could arise during the estimating process.
Although, the process of estimating has been improved, a solution to these difficulties
could ease the estimator’s task of construction project cost estimating.
3-D CAD and visualization can provide the estimator with a tool necessary to
cope with the ever increasing complications in design. Chapter 3 will focus on 3-D CAD
and the building information modeling technology, also known as BIM, and how this
technology is changing the way contractors work.
20
CHAPTER 3
BUILDING INFORMATION MODELING
3.1 INTRODUCTION TO CAD AND BIM
A cost estimate for a construction project can be prepared at any phase of the
construction project. However, detailed cost estimates require a complete set of plans and
specifications. Although most plans and specifications today are in 2D CAD format,
advanced technologies have changed the way drawings are prepared, and 3D CAD
drawings are playing a bigger role in documenting design intent. Building information
modeling (BIM) is another technology that is making an impact and becoming popular
throughout the architecture, engineering, and construction (AEC) industries. The use of
BIM enables architect to improve design efficiency. Structural designs can be optimized
by the engineer and contractors can improve the planning for the construction of the
project. This chapter will discuss in more detail CAD, BIM, the differences between the
two technologies, BIM’s applications, and the future of the construction industry with
BIM technology.
3.2 COMPUTER-AIDED DRAWINGS
Computer-aided drawings (CAD) have been a significant tool helping architects
and engineers in the engineering and design process (Jrade and Alkass, 2007). The basic
function of CAD software is to allow the user to prepare drawings by manipulating lines,
circles, rectangles, and text interactively on the computer screen. Some types of
architectural specific software offer graphical libraries of commonly used building
elements such as doors and windows. Creating a drawing is not the main advantage of
21
using CAD because it could be done on a paper-based medium; however, the main
advantage of CAD is its ability to easily edit a design (Sun and Howard, 2004). CAD
allows users to delete, move, copy, rotate, scale, and mirror design elements with ease.
CAD also has the functions to create repetitive design components, create elements at
equal distance on a line, a circle, or on a grid, extending lines, trimming lines, and fillet
any corners of an edge. These tasks are not easily carried out on the paper based drafting.
CAD allows designers to concentrate on the creative aspects of the design instead of
being distracted from unproductive activities (Bazjanac, 1975). CAD can be divided into
two major categories: two dimensional (2D CAD) and three dimensional (3D CAD).
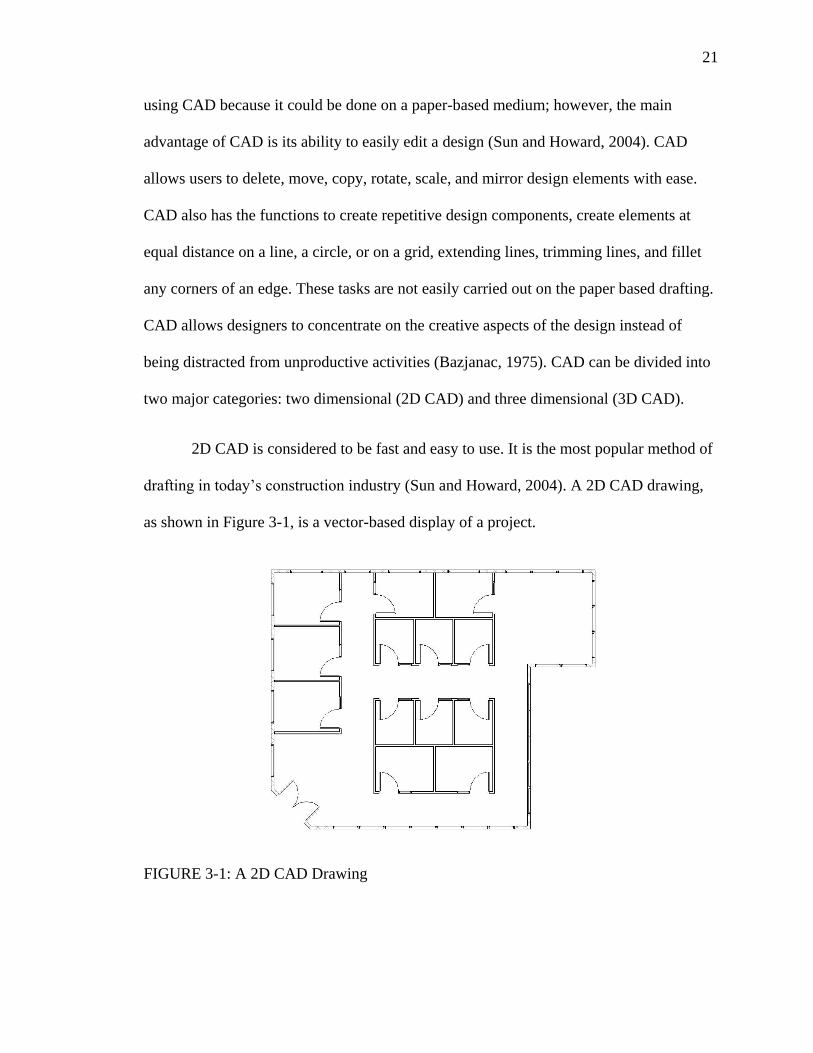
2D CAD is considered to be fast and easy to use. It is the most popular method of
drafting in today’s construction industry (Sun and Howard, 2004). A 2D CAD drawing,
as shown in Figure 3-1, is a vector-based display of a project.
FIGURE 3-1: A 2D CAD Drawing
22
Although it is fast and easy to use, 2D CAD uses lines to draw components
instead of the actual elements. Viewing of 2D drawings does not provide designer with
different angles of the design. 3D CAD is an alternative to 2D CAD, allowing views from
different angles and potential virtual environment capabilities of walking through or
flying through the structure.
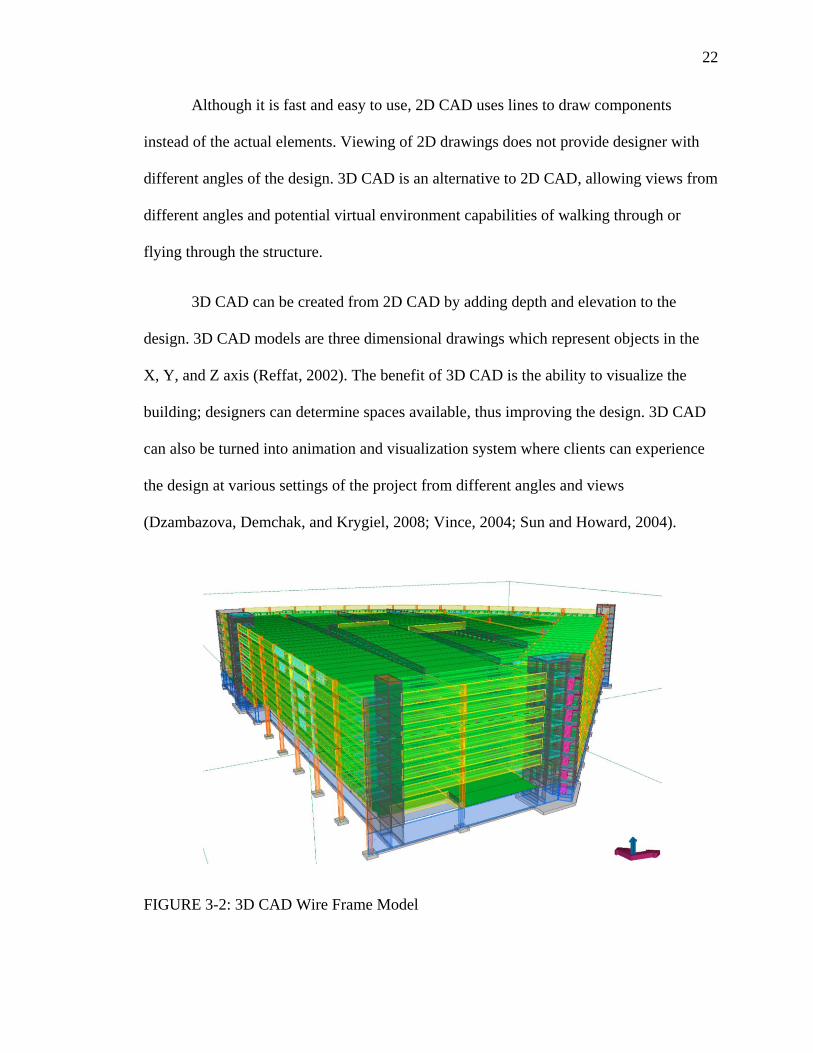
3D CAD can be created from 2D CAD by adding depth and elevation to the
design. 3D CAD models are three dimensional drawings which represent objects in the
X, Y, and Z axis (Reffat, 2002). The benefit of 3D CAD is the ability to visualize the
building; designers can determine spaces available, thus improving the design. 3D CAD
can also be turned into animation and visualization system where clients can experience
the design at various settings of the project from different angles and views
(Dzambazova, Demchak, and Krygiel, 2008; Vince, 2004; Sun and Howard, 2004).
FIGURE 3-2: 3D CAD Wire Frame Model
23
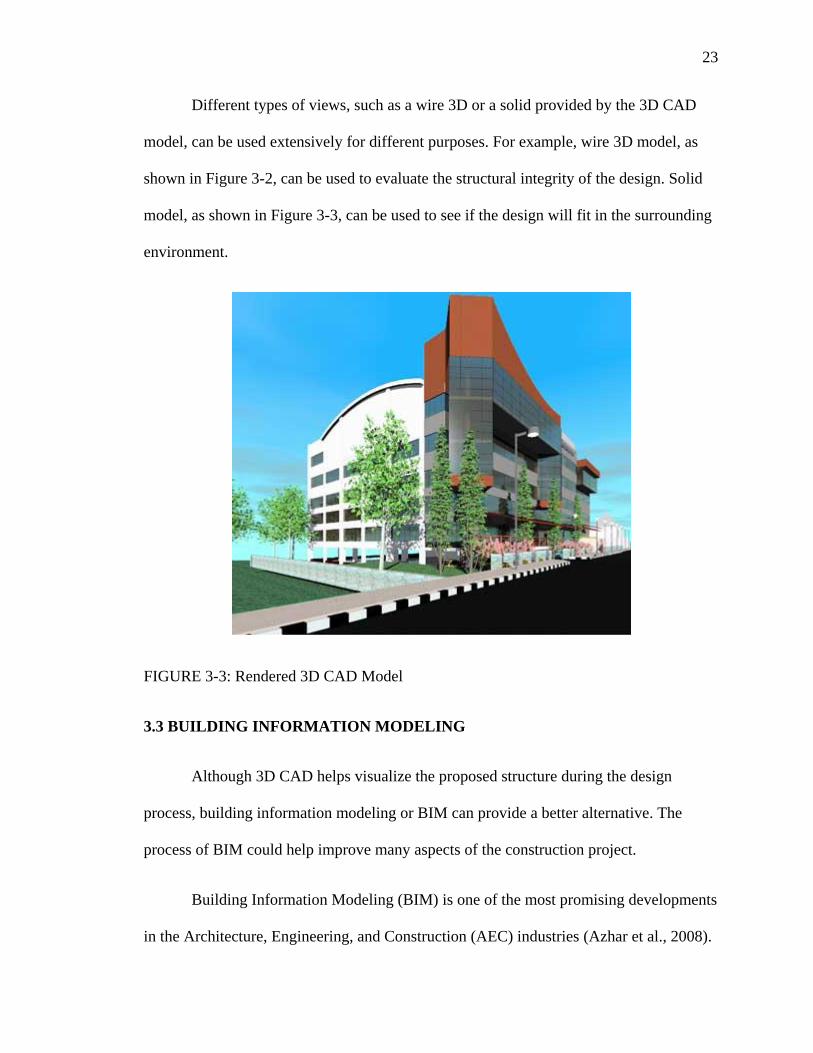
Different types of views, such as a wire 3D or a solid provided by the 3D CAD
model, can be used extensively for different purposes. For example, wire 3D model, as
shown in Figure 3-2, can be used to evaluate the structural integrity of the design. Solid
model, as shown in Figure 3-3, can be used to see if the design will fit in the surrounding
environment.
FIGURE 3-3: Rendered 3D CAD Model
3.3 BUILDING INFORMATION MODELING
Although 3D CAD helps visualize the proposed structure during the design
process, building information modeling or BIM can provide a better alternative. The
process of BIM could help improve many aspects of the construction project.
Building Information Modeling (BIM) is one of the most promising developments
in the Architecture, Engineering, and Construction (AEC) industries (Azhar et al., 2008).
24
According to Khemlani, BIM is a revolutionary technology that goes well beyond the
design phase to impact construction and lifecycle management of the project (AECbytes
Website, 2009). BIM is a data-rich, object-oriented, intelligent and parametric digital
representation of the facility, from which views and data appropriate to various users’
needs can be extracted and analyzed to generate information that can be used to make
decisions and to improve the process of delivering the facility (AGC, 2005). Information
provided by BIM includes, but is not limited to, dimensions, coordinates, properties, and
other element details for the building. BIM technology would provide the potential for
improving communication between participants involved in the construction project,
improving the quality of information, the quality of services delivered, and reducing cost
at every stage in the life cycle of a building (Smith and Tardif, 2009).
As today’s technology grows more complex, building design has become more
complicated. The involvement of the computer technology at the earliest phase of the
design process is becoming more common. Difficulties of the design associated with the
complexity of the building could provide many problems to not only the designer but also
the engineers and the contractors who build it. BIM provides the ability for the designer
to design the building with the modeling tool that creates object elements instead of
different types of lines connected to make up a model. The 3D parametric model that
BIM provides does not only provide the visualization of the model in three dimensions,
but it also stores information about the elements that make up the building. This
information includes its physical characteristics such as dimensions, locations, and
texture of the objects. Functional characteristics could also be found in the parametric
25
model, including the information about manufacturers and operating and maintenance
procedures (Azhar et al., 2008).
Structural analysis could also be done concurrently with the design process. Since
BIM contains all the geometric information of the building, engineers could extract the
necessary information to perform structural analyses.
Contractors can also benefit from BIM. It provides many features that help
contractors avoid costly errors during construction of the project. Element clashes can be
detected before the construction has started, saving contractors’ time and money.
Complexity of the construction or the design of the building could also provide many
difficulties during the preparation of plans and specifications. With an integrated
parametric 3D model, it’s possible to detect spatial clashes between the multitudes of
systems in the building (Dzambazova, Demchak, and Krygiel, 2008). Computer
analytical systems could support design decision making by enabling designers to test
and evaluate design alternatives rapidly in the search for an optimum solution (Bazjanac,
1975). Ambiguities in the design can also be highlighted by any team member and
resolved before the design has been finalized. Constructability issues can be raised and
debated among the parties involved (Levy, 2006). Time that is normally spent manually
checking all the drawings by the design consultants and by the contractor and their
subcontractors will be reduced considerably. This allows all parties to be more productive
on other tasks such as project management or quality control.
Facility management could also benefit via the completeness of documents at the
end of the construction. BIM provides the model where every detail of the constructed
26
building is included. The information provided by BIM is very detailed and can be used
not only for design and construction purposes, but also for the post construction
documentation where the details of every element of the building are archived. This
provides convenience for the owner because the BIM file can be used for many purposes.
Since the file is updated throughout the construction, it contains all the elements that have
been used in the actual project rather than the originally designed elements that might be
modified during construction.
BIM provides reliable features to architects, owners, engineers, contractors, and
all participants involved in the project (Alkas and Jrade, 2007). It uses a single outlet to
store all information about the building (Cyon Research Website, 2003). It is a system
that creates a single building model as a repository for all elements of a building (Levy,
2006). The development of a digital database enables collaboration among participants in
the construction project (Smith and Tardif, 2009), thus documents can be kept consistent
with one another (Cyon Research Website, 2003). Review and changes can be
recommended from every party involve in the project.
3.4 BIM vs. CAD
BIM provides many advantages over CAD. The key difference between BIM and
CAD is that a traditional CAD system uses many separate 2D documents to explain a
building. These documents are created separately and have no intelligent connection
between them. The possibility of uncoordinated data is very high. The change
management created by CAD is a tedious and error-prone process. BIM takes a different
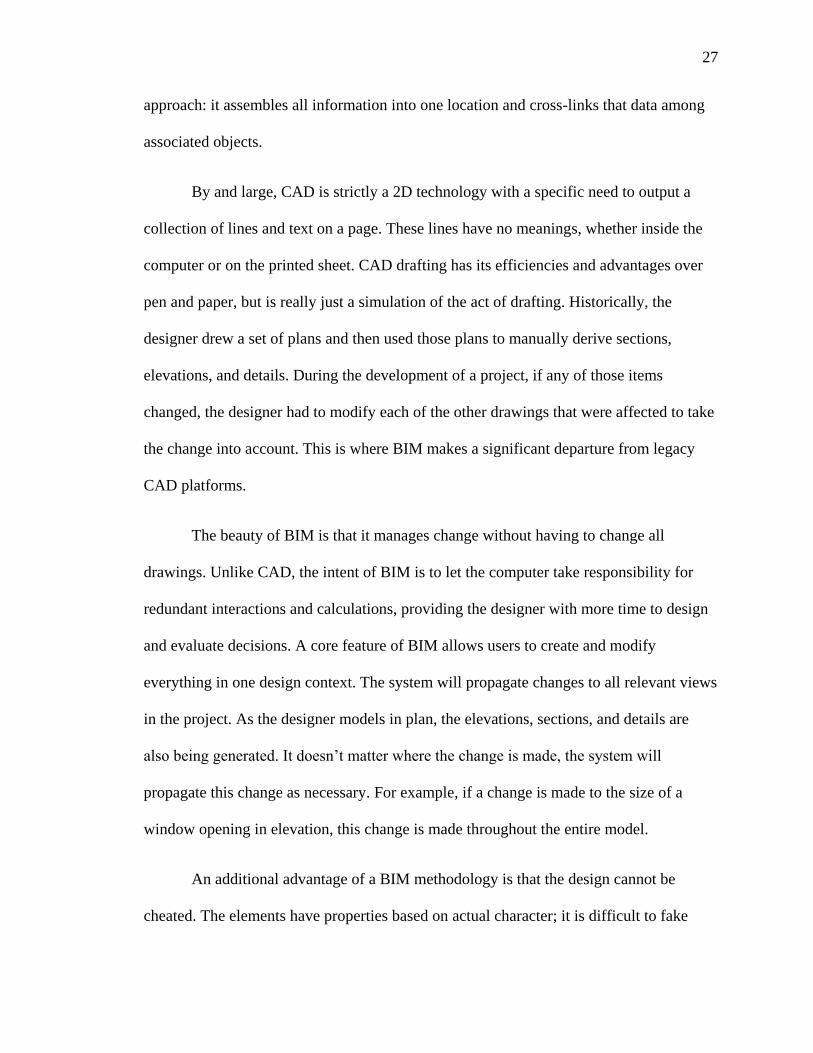
27
approach: it assembles all information into one location and cross-links that data among
associated objects.
By and large, CAD is strictly a 2D technology with a specific need to output a
collection of lines and text on a page. These lines have no meanings, whether inside the
computer or on the printed sheet. CAD drafting has its efficiencies and advantages over
pen and paper, but is really just a simulation of the act of drafting. Historically, the
designer drew a set of plans and then used those plans to manually derive sections,
elevations, and details. During the development of a project, if any of those items
changed, the designer had to modify each of the other drawings that were affected to take
the change into account. This is where BIM makes a significant departure from legacy
CAD platforms.
The beauty of BIM is that it manages change without having to change all
drawings. Unlike CAD, the intent of BIM is to let the computer take responsibility for
redundant interactions and calculations, providing the designer with more time to design
and evaluate decisions. A core feature of BIM allows users to create and modify
everything in one design context. The system will propagate changes to all relevant views
in the project. As the designer models in plan, the elevations, sections, and details are
also being generated. It doesn’t matter where the change is made, the system will
propagate this change as necessary. For example, if a change is made to the size of a
window opening in elevation, this change is made throughout the entire model.
An additional advantage of a BIM methodology is that the design cannot be
cheated. The elements have properties based on actual character; it is difficult to fake
28
elements within the design. In CAD system, this can be easy to overlook, because the
door has to be manually transcribed from plan to section and elevation. Because BIM is
based on actual assemblies it’s very difficult to misrepresent dimensions or objects within
the model.
A CAD system uses many separate files to document a building, whereas a BIM
project typically has only one file. CAD files are created individually and have no
intelligent connection between them. Each drawing represents a separate piece of work to
be managed and updated throughout the design process. The possibility of uncoordinated
data between drawings is therefore very high. BIM takes a different approach by
combining all the information and relating it to a single file, thus guaranteeing a
consistent model (Dzambazova, Demchak, and Krygiel, 2007; Dzambazova, Demchak,
and Krygiel, 2008). Interference checking in BIM also permits the user to immediately
see conflicts among architectural, structural, and mechanical elements in 3D.
BIM is based on an architectural classification system, not “layers”. Because a
building model is an assembly of meaningful, to-be-built objects, the user controls
visibility and graphics of objects using a rational list of well understood categories. This
is different from CAD, where every line belongs to a layer, and it is up to the user to
manage all layers.
BIM’s digital file can be used to instruct machines to produce components.
Traditional CAD files need to be annotated before they are sent to the fabricator. Models
from BIM can be sent directly to fabrication machines without the need of traditional
shop drawings (Dzambazova, Demchak, and Krygiel, 2008).
29
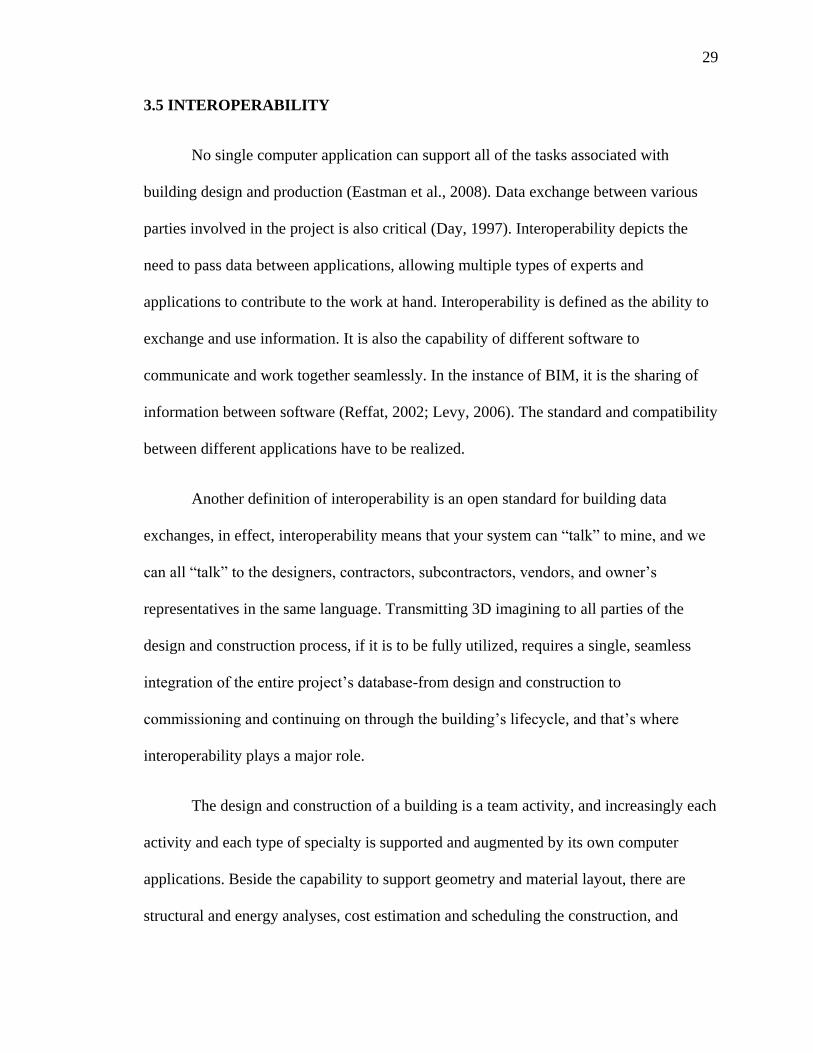
3.5 INTEROPERABILITY
No single computer application can support all of the tasks associated with
building design and production (Eastman et al., 2008). Data exchange between various
parties involved in the project is also critical (Day, 1997). Interoperability depicts the
need to pass data between applications, allowing multiple types of experts and
applications to contribute to the work at hand. Interoperability is defined as the ability to
exchange and use information. It is also the capability of different software to
communicate and work together seamlessly. In the instance of BIM, it is the sharing of
information between software (Reffat, 2002; Levy, 2006). The standard and compatibility
between different applications have to be realized.
Another definition of interoperability is an open standard for building data
exchanges, in effect, interoperability means that your system can “talk” to mine, and we
can all “talk” to the designers, contractors, subcontractors, vendors, and owner’s
representatives in the same language. Transmitting 3D imagining to all parties of the
design and construction process, if it is to be fully utilized, requires a single, seamless
integration of the entire project’s database-from design and construction to
commissioning and continuing on through the building’s lifecycle, and that’s where
interoperability plays a major role.
The design and construction of a building is a team activity, and increasingly each
activity and each type of specialty is supported and augmented by its own computer
applications. Beside the capability to support geometry and material layout, there are
structural and energy analyses, cost estimation and scheduling the construction, and
30
fabrication issues for each subsystem. Interoperability identifies the need to pass data
between applications, and for multiple applications to jointly contribute to the work at
hand. Interoperability eliminates the need to replicate data input that has already been
generated, and facilitates smooth workflows and automation.
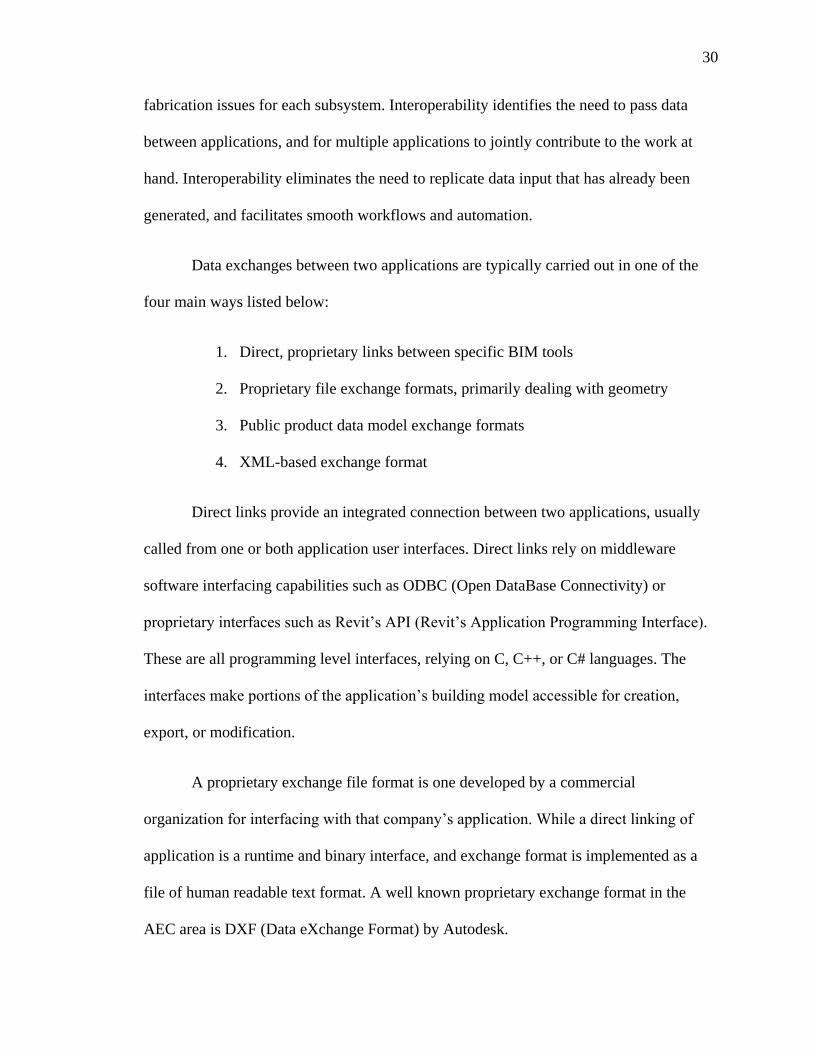
Data exchanges between two applications are typically carried out in one of the
four main ways listed below:
1. Direct, proprietary links between specific BIM tools
2. Proprietary file exchange formats, primarily dealing with geometry
3. Public product data model exchange formats
4. XML-based exchange format
Direct links provide an integrated connection between two applications, usually
called from one or both application user interfaces. Direct links rely on middleware
software interfacing capabilities such as ODBC (Open DataBase Connectivity) or
proprietary interfaces such as Revit’s API (Revit’s Application Programming Interface).
These are all programming level interfaces, relying on C, C++, or C# languages. The
interfaces make portions of the application’s building model accessible for creation,
export, or modification.
A proprietary exchange file format is one developed by a commercial
organization for interfacing with that company’s application. While a direct linking of
application is a runtime and binary interface, and exchange format is implemented as a
file of human readable text format. A well known proprietary exchange format in the
AEC area is DXF (Data eXchange Format) by Autodesk.
31
The public level exchange formats involve the use of an open-standard building
model. In 1994, an industry consortium was initiated to develop a class library for
representing construction project information and facilitating project data exchange
among software serving the AEC industry. The consortium was initially called Industry
Alliance for Interoperability. In 1997, the Alliance was renamed to International Alliance
for Interoperability (IAI) and became a global standards-setting organization representing
diverse constituencies including architects and engineers, software manufacturers,
government agencies, contractors, building owners and product manufacturers (IAI
Website, 2009). The IAI’s goal of developing standards for interoperability throughout
the AEC industry is primarily achieved through its Industry Foundation Classes (IFC).
IFC is a comprehensive data representation of the building model. The IFC object
descriptions deal with not only full 3D geometry but also relationships, process, material
properties, cost, and other behavior data (Hamilton et al., 2007). Integrating a CAD
model with IFC enables the accurate geometric representation to be integrated with
structural and behavior elements and facilitates linking with external applications.
According to Khemlani (AECbytes Website, 2009), the IFC data model is likely to
become the international standard for data exchange and integration within the building
construction industries.
XML or eXtensible Markup Language is an extension to HTML, the base
language for the Web. XML allows definition of the structure and meaning of some data
of interest; that structure is called a schema. The different XML schemas support
exchange of many types of data between applications. XML is especially good in
32
exchanging small amounts of business data between two applications set up for such
exchanges.
Interoperability provides the opportunities in the AEC industry to discover
applications that could be used with BIM. This creates more possibilities for BIM to be
used by different participants during a construction project. Applications associated with
BIM are discussed in section 3.6.
3.6 APPLICATIONS OF BIM
BIM provides many benefits throughout the lifetime of a construction project. It is
useful during the design phase, during actual construction and after the construction has
been completed. BIM uses interoperability to enable the exchanging of information
between different applications. Interoperability, as discussed in section 3.5, is used to
facilitate collaboration between different project participants. Therefore, BIM could be
used as a tool to help improve not only the construction process but it also helps to
manage the facility after the construction is completed.
Concept and Feasibility Study
Before the owner approaches an architect, it is necessary to determine the size of
the building, its functionalities and features that can be built within the budget and time
constraints. The goals and expectations could be achieved if the concept and feasibility
study of the project are within the acceptable limitations. A rough sketch of building
model built and linked to a cost database can be a tremendous assistance to an owner.
BIM could be used as an application to help owner during the concept and feasibility
study.
33
Accuracy and Consistency of 2D Drawing
2D drawings can be extracted and generated directly from a BIM model. This
reduces the amount of time and number of errors, while generating project drawings.
Also, when changes are made to a model, the drawings are updated and may be
regenerated as soon as the modifications are made.
Early Collaboration of Multiple Design Disciplines
BIM enables virtual coordination of a building’s infrastructure across all
disciplines. The coordination of mechanical, electrical and plumbing (MEP),
architectural, and structural systems can be achieved through the fully integrated 3D
models that BIM provide. Design time could be shortened and design errors and
omissions can be reduced. Rework due to the design flaws could be avoided with this
coordination of work. It also gives an earlier insight into the design problems and
provides an opportunity for a design to be improved continuously.
Check of Design Intent
BIM provides an early visualization of the 3D model. It allows the designer to see
if the design intent of the project has been achieved. The intent of the design is the
arrangement of features and dimensions that has been specified at the conceptual design
of the project. Purposes of spaces and rooms can be visualized at an earlier stage of
construction where changes can be made with little to no addition cost.
34
Cost Estimating
Construction cost estimating can be achieved at a better level. Estimates that use
conceptual BIM consisting of components can provide owners with quick feedback on
various design scenarios. Accurate estimates can be very valuable early in the project life
cycle, especially for assessing a project’s predicted cash flow.
BIM provides quantity takeoff tools to create faster, better detailed, and more
accurate estimates. During the construction of a project, owners and estimators struggle
with the ability to respond to design and requirement changes and to understand the
impact of those changes on the overall project budget. By linking the design model to an
estimating application, the project team can speed up the quantity takeoff and overall
estimating process to get faster feedback on proposed design changes.
Improve Energy Efficiency and Sustainability
The green building trend is leading many owners to consider the energy efficiency
of their facilities and the overall environmental impact of their projects. Sustainable
building is good business practice and can lead to greater marketability of a facility.
Building models provide several advantages over traditional 2D models due to the
richness of object information needed to perform energy or other environmental analyses.
Daylight analysis, glare, and solar heat gain are a few scenarios that help reduce the cost
of operation for the facility.

35
Construction Planning
Pre-fabrication provided by BIM-based design can greatly reduce the project
duration, from project approval to facility completion. The parametric nature of the BIM
model makes design changes easier and it automatically updates the necessary
documentations.
Owners also pay the cost for construction delays or lengthy project durations,
either in interest payments on loan, delayed rental income, or other income from sales of
goods or products. The application of BIM to support coordination and prefabrication can
result in improved field productivity, reduced field effort, and reductions in the overall
construction schedule, which results in on-time delivery for the owner.
BIM models can also be used to create a 4D model by adding the time dimension.
Owners and their service providers often encounter unforeseen conditions that even the
best digital models cannot foresee. Teams using digital models are often in a better
position to respond to unforeseen conditions.
Local Code Compliance
Owners and their design teams must work with a variety of jurisdictions to ensure
their facilities meet design, performance, and work place safety codes. Regulatory
personnel also face challenges for ensuring compliance and conformance during design
and construction. A potential benefit of a building information model is the ability to
automatically analyze and check the model for code compliance.
36
Clash Detection
Design errors could be a result of inconsistencies in the 2D drawings. These errors
are eliminated with the adaptation of virtual 3D model. Clashes can be identified before
the construction in the field begins.
Design Model as Basis for Fabricated Components
BIM provides a better involvement with the manufacturer of the component. BIM
shows exactly how the component will fit into the project. Necessary information for the
component is provided within the model. Fabrication of components on site would be
faster through better coordination, better connections, better assembly planning and
training.
Lean Construction
Lean construction is a way to design production systems to minimize waste of
materials, time, and effort in order to generate the maximum possible amount of value
(Koskela et al. 2002). BIM maximizes the efficiencies by providing accurate model
information and the material resources needed for the different stages of construction. It
provides the basis for better planning and scheduling. This helps ensure that labor,
equipment, and material are ready at the job site when they are needed.
Facility Operation and Management Systems
BIM helps produce higher quality and maintainable infrastructure through
interactive review of coordinated models. Some owners need more than typical MEP
37
systems to be accessible and maintainable. Interactive review of the model allows owners
to virtually access and simulates maintenance procedures.
BIM could be used to quickly populate a facility management database. Since
BIM is updated throughout the construction of the project, it can also be used as the as-
built plans that are used to manage the facility. Maintenance work and impact to retrofits
could be evaluated by using the visual and intelligent models to help facility managers.
A model, which has been updated throughout the construction, is a tool with great
accuracy for operating and managing the completed building. BIM can be used as an
advanced facilities management tool. It could be used for an evacuation plan, fire
protection simulation, thermal calculation and air-conditioning analysis (Eastman et al.,
2008).
3.7 FUTURE OF CONSTRUCTION INDUSTRY WITH BIM
BIM is a promising technology that will change how things are done in the AEC
industry. The transition from early adoption of technology to the mainstream practice is
expected in the near future. The future impact of BIM can be separated into different
parties and participants.
3.7.1 Designers
Designers will notice the productivity gains and deliver higher quality services to
project owners. Architects and engineers will be able to explore different designs while
keeping the cost and schedule of the project in check. BIM will also provide the
architects with more information, not only regarding the detail of elements in the
38
building, but also the visualization aspect. Virtual reality will enable exploration of
different environmental impact scenarios such as sun studies, wind analysis, and energy
efficiency. Engineers will also be able to do the structural analysis aspect of the model.
3.7.2 Owners
Owners will be able to better explore different designs and have a better plan and
schedule for the project. Owners will be able to see 3D visualization of the project at an
earlier stage.
3.7.3 Contractors
Contractors will be able to collaborate with other parties involved in the project
and have less to worry. Change orders and material changes will be instantaneously
updated throughout the model. BIM will allow faster and easier calculation of the
construction cost. The collaboration of both designers and the contractors can help
minimize delays during construction.
3.8 SUMMARY
There are many advantages that BIM provides. Estimators are able to use the
properties provided in the model to estimate the cost of construction. Labor intensive
tasks during estimating process can be simplified. BIM facilitates collaboration between
project participants. Interoperability also enables different applications to be developed.
BIM delivers many significant benefits and tools for all participants during various
phases of the project. Reducing errors and more efficient and reliable delivery process

39
that reduces time and cost are a few benefits to all participants. This thesis will utilize
BIM as a technology to develop a visual approach to construction cost estimating.
40
CHAPTER 4
COGNITIVE THEORY AND VIRUTAL REALITY
4.1 INTRODUCTION
Construction cost estimating is a time consuming and tedious process. Although
there are technologies to assist with the cost estimating process, inefficiencies still
abound. During the process of construction cost estimating, the estimator must learn
about the design and conditions of the project. A lot of data are needed to prepare an
estimate. Reviewing drawings, extracting information for quantity takeoff and looking up
the latest cost information from the cost databases are tasks that estimators must
accomplish. To improve the process and ease the estimator’s tasks, it is important to
understand how humans process information. The latest findings in cognitive psychology,
a branch of science that relates to how humans process information, will be examined for
this purpose.
In addition to cognitive psychology, visualization technology can also help
improve how humans understand and process information. As it has been said “a picture
is worth more than words can describe” (Gardiner and Christie, 1987; Retik, 1993), this
means visualization can help humans absorb and understand information easier. Visual
communication can also reduce humans’ cognitive load when processing new
information. Computer aided design (CAD) and building information modeling (BIM),
which have been discussed in Chapter 3, are two examples of how visualization is
currently used in the construction industry. Visualization is useful not only in the design
process but also during the construction. Visualization can also benefit cost estimating; it
41
can make it easier for estimators to become familiar with the new project before starting
to prepare the estimate and make the estimating process more intuitive. This chapter will
discuss cognitive theory along with virtual reality.
4.2 COGNITIVE THEORY
Cognitive psychology is a science branch that investigates how humans
understand and process information distributed across the internal mind and the external
environment (Gardiner and Christie, 1987; Nishida, 1992; Boland et al., 2008).
According to visual computing theorists and dual processing theory, a basic way to
effectively facilitate the connection between internal mind and external environment is to
improve the visibility of the information embedded in the data. A good external
representation will be one that links naturally to the internal representations that people
are capable of forming, thereby supporting their overall cognitive process. The ability to
visualize objects and situations in one’s mind and to manipulate those images is a
cognitive skill vital to many career fields, especially those which require work with
graphical representations such as visual arts and engineering (Holliday-Darr, Blasko, and
Dwyer, 1999). Using lines and symbols to represent the thoughts and ideas of engineers
and designers often provides a more effective means of communicating these concepts
than verbal descriptions (Scribner and Anderson, 2005). According to Bertoline et al.
(1992), 92% of the design process is graphically based while the other 8% divided
between mathematics and written or verbal communications.
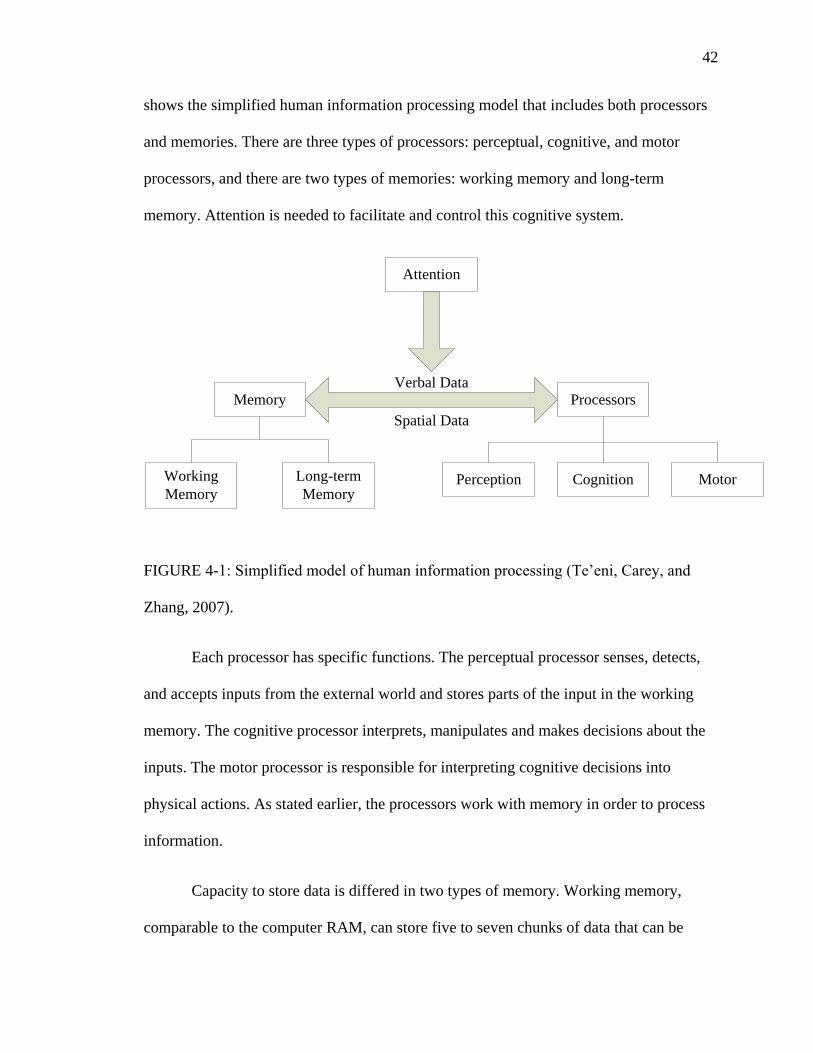
Human information processing model consists of both processors and memories
that interact in order to process information (Te’eni, Carey, and Zhang, 2007). Figure 4-1
42
shows the simplified human information processing model that includes both processors
and memories. There are three types of processors: perceptual, cognitive, and motor
processors, and there are two types of memories: working memory and long-term
memory. Attention is needed to facilitate and control this cognitive system.
Attention
Verbal Data
Spatial Data
Memory Processors
Working
Memory
Long-term
MemoryPerception Cognition Motor
FIGURE 4-1: Simplified model of human information processing (Te’eni, Carey, and
Zhang, 2007).
Each processor has specific functions. The perceptual processor senses, detects,
and accepts inputs from the external world and stores parts of the input in the working
memory. The cognitive processor interprets, manipulates and makes decisions about the
inputs. The motor processor is responsible for interpreting cognitive decisions into
physical actions. As stated earlier, the processors work with memory in order to process
information.
Capacity to store data is differed in two types of memory. Working memory,
comparable to the computer RAM, can store five to seven chunks of data that can be
43
retained for 10 to 20 seconds. A chunk of data is a unit of information such as name. The
capacity and retention of long-term memory is practically unlimited, however, retrieval
of information can be difficult.
It is very important to understand how the processors and memories work
together. Research in the field of cognitive science and human-computer interaction has
shown limitations of human brain during the information-processing task. Three
limitations are described by Te’eni, Carey, and Zhang (2007). First, the user will not
notice screen changes that fall within an interval of 100 milliseconds. Second, the user
cannot be expected to work with more than seven chunks of information simultaneously;
displaying more chunks means the user will concentrate on some parts of the screen,
ignoring other parts. Third, retrieval of information that is not expected to be in working
memory will probably degrade both speed and accuracy during information processing.
This is very important for software developers to keep in mind during design of software
such as an estimating program.
According to Gardiner and Christie (1987), realizing that designing for human-
machine cognitive compatibility can help make a machine more acceptable and more
useful to its intended user. The benefits of realizing the use of cognitive science in
developing software are many. Less training is needed to use the software, errors in using
it are less likely, more complex operations can be carried out by more people, work can
be done faster, and more interesting work can be done with little or no undesirable stress
on the user (Gardiner and Christie, 1987). The knowledge that users bring to the
interaction and the way in which they develop their understanding will influence the ease
of use of the software (Hammond et al., 1987).
44
Since there are a lot of data involve in the construction cost estimating process,
cognitive psychology principles and visualization technology can help improve the
process. A visual interface for estimating applications can provide a virtual model of the
project for the estimator in which he/she can see what is going to be built and will allow
the estimator to easily access project information thus reducing the need to repeatedly
referring to drawings or retrieving information from long-term memory.
4.3 VIRTUAL REALITY
During the design phase of a construction project, it is helpful to see the designed
building in 3D. Whether it is to see if the designed building would fit in the surrounding
environment or owner requirements have been fulfilled. One way to view a project during
the design is by using virtual reality.
Virtual reality systems can be described as a computer technology that enables a
user to look through a special display and instead of seeing the real world, he/she sees a
computer generated world. Virtual reality is about creating acceptable substitutes for real
objects or environments for training, entertainment, or design purposes (Vince, 2004;
Gutierrez, Vexo, and Thalmann, 2008). According to dictionary, “virtual” is something in
effect but not in actual form. For example, a virtual keyboard is a keyboard that can be
typed on, but it’s not present in the physical form. Virtual reality is about using
computers to create images of 3D environments within which one can participate in real
time and experience a sensation of being there (Vince, 2004; McMenemy and Ferguson,
2007; Gutierrez, Vexo, and Thalmann, 2008). The presence could be found in the form of
navigation and interaction. Navigation implies the ability to move around and explore the
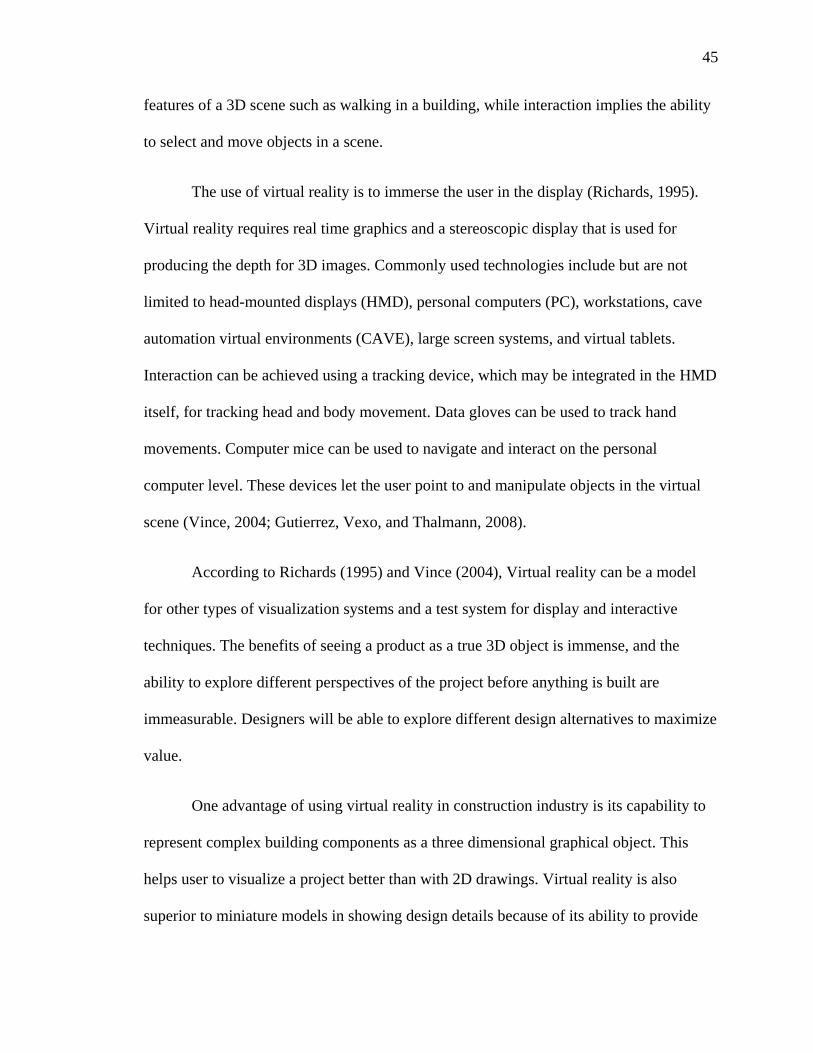
45
features of a 3D scene such as walking in a building, while interaction implies the ability
to select and move objects in a scene.
The use of virtual reality is to immerse the user in the display (Richards, 1995).
Virtual reality requires real time graphics and a stereoscopic display that is used for
producing the depth for 3D images. Commonly used technologies include but are not
limited to head-mounted displays (HMD), personal computers (PC), workstations, cave
automation virtual environments (CAVE), large screen systems, and virtual tablets.
Interaction can be achieved using a tracking device, which may be integrated in the HMD
itself, for tracking head and body movement. Data gloves can be used to track hand
movements. Computer mice can be used to navigate and interact on the personal
computer level. These devices let the user point to and manipulate objects in the virtual
scene (Vince, 2004; Gutierrez, Vexo, and Thalmann, 2008).
According to Richards (1995) and Vince (2004), Virtual reality can be a model
for other types of visualization systems and a test system for display and interactive
techniques. The benefits of seeing a product as a true 3D object is immense, and the
ability to explore different perspectives of the project before anything is built are
immeasurable. Designers will be able to explore different design alternatives to maximize
value.
One advantage of using virtual reality in construction industry is its capability to
represent complex building components as a three dimensional graphical object. This
helps user to visualize a project better than with 2D drawings. Virtual reality is also
superior to miniature models in showing design details because of its ability to provide
46
the user virtual walkthroughs inside or outside the virtual building (Hadikusumo and
Rowlinson, 1999).
Since virtual reality could be used to explore designs before they are built,
engineers and designers can use the technology to visualize structures before actually
building them (McMenemy and Ferguson, 2007). In addition to visualizing buildings and
structures, designers and engineers are also able to interact with them. Engineers can use
virtual reality in many applications, such as structural analysis and construction cost
estimating.
In this study, a virtual model of a project is created by extracting the geometry
and material properties from each element in a CAD model. Microsoft DirectX Library is
used to create a virtual environment using the extracted information. Construction cost
estimating can then be done by walking in the building and selecting elements in the
virtual model for estimating. Next section will discuss interactive visualization in more
detail.
4.4 SUMMARY
By applying the findings of cognitive psychology and visualization technology,
software can be designed that simplifies the process of construction cost estimating.
Virtual reality and interactive visualization can be used to perform estimating while
navigate in a virtual model f the building. Information could be extracted from the model
during navigation. A cost estimating application is needed in order to use extracted
information. The next chapter will discuss computer database technology and how a cost
estimating database can be developed for an estimating application.
47
CHAPTER 5
COST ESTIMATING DATABASES
5.1 INTRODUCTION
Construction cost estimating requires a lot of data on building elements, material,
equipment, labor, and other related information. These data need to be organized in a way
that they can be easily accessed. One way to solve the problem is to use a database for
storage of the data. A database is a storage facility or a collection of related records or
documents. Databases are designed, built, and populated with data for a specific purpose
and has an intended group of users and some applications in which these users are
interested (Retik and Langford, 2001). The estimating software designed for visual
estimating adopts database technology to store all the information necessary for
estimating. The cost estimating database will also be used to store new estimate
information. This chapter will discuss why databases are used, database models
especially the relational model, and how the estimating database used in this study was
designed.
5.2 WHY USE A DATABASE?
A database is an organization or a collection of related data. It is designed
specifically to manage large bodies of information, and store data in an organized and
structured manner that makes it easy for users to manage and retrieve data when required
(Agarwal et al., 2008). It is very much like a spreadsheet. However, a database is
designed to perform some very specific tasks which a spreadsheet is not able to do
effectively. These tasks include but are not limited to retrieving all records that match
48
particular criteria, update or modify a complete set of records at one time, and extract
values from records distributed among multiple tables (Brandon et al., 1985; Agarwal et
al., 2008).
These are some of the reasons why databases are used (Agarwal et al., 2008):
- Compactness: Databases help in maintaining large amounts of data, and
thus completely replace voluminous paper files.
- Speed: Searches for a particular piece of data or information in a database
are much faster than sorting through piles of paper.
- Less drudgery: It is a dull work to maintain files by hand; using a database
completely eliminates such maintenance.
- Currency: Database systems can easily be updated and so provide accurate
information all the time and on demand.
There are three “logical” database models – hierarchical, network, and relational.
These models present three ways of logically perceiving the arrangement of data in the
file structure (Bagui and Earp, 2003). Following is a brief description of each database
model.
Hierarchical Database Model
The hierarchical model represents data using hierarchical tree structures. Each
hierarchy represents a number of related records, arranged in multi-level structures,
consisting of one root record and any number of subordinate levels (Retik and Langford,
2001). This can be seen in Figure 5-1.
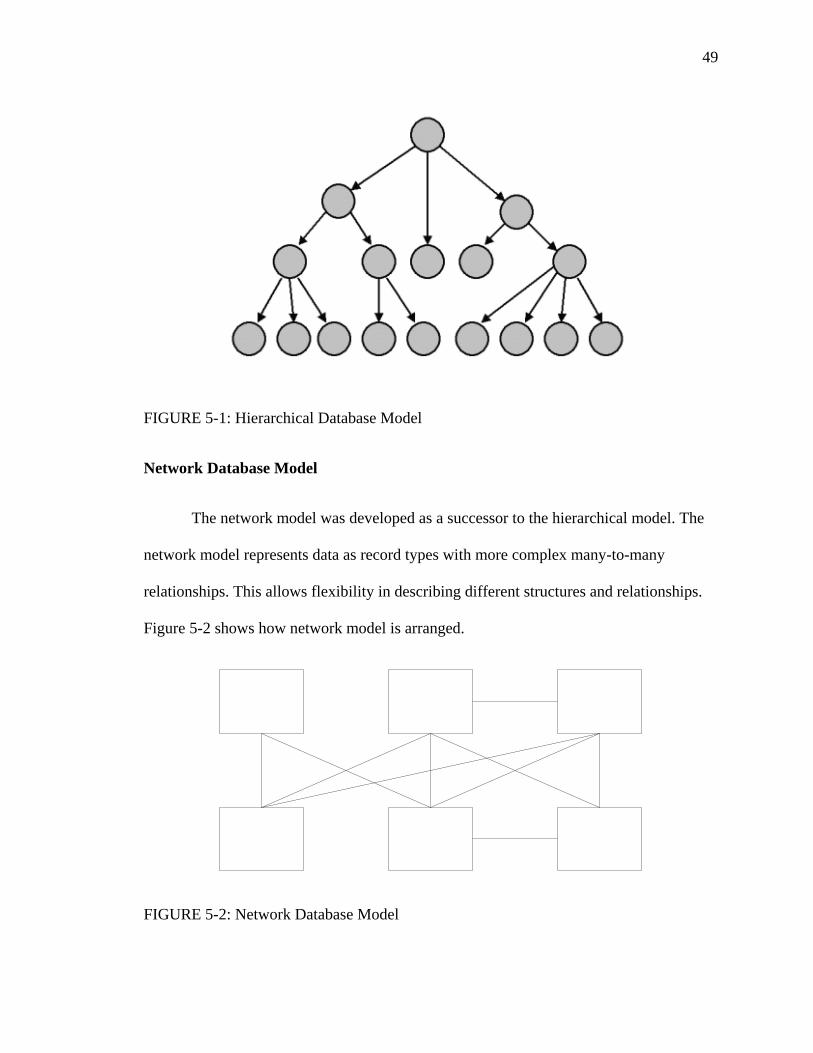
49
FIGURE 5-1: Hierarchical Database Model
Network Database Model
The network model was developed as a successor to the hierarchical model. The
network model represents data as record types with more complex many-to-many
relationships. This allows flexibility in describing different structures and relationships.
Figure 5-2 shows how network model is arranged.
FIGURE 5-2: Network Database Model
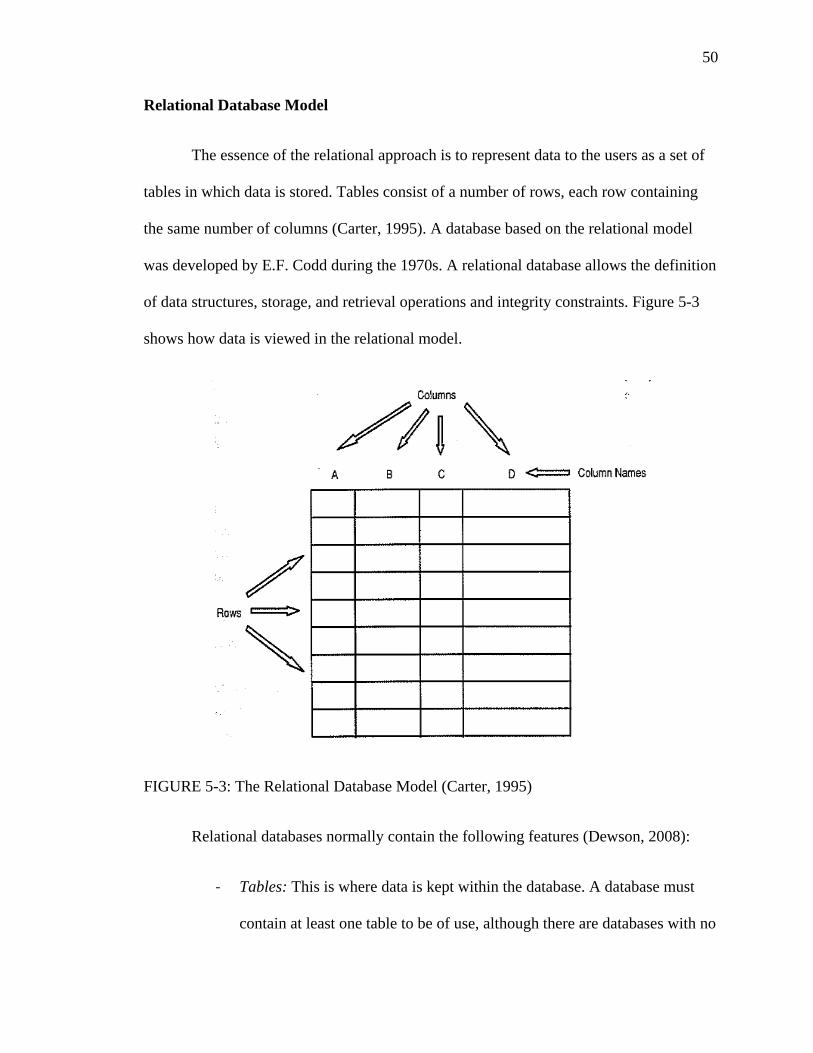
50
Relational Database Model
The essence of the relational approach is to represent data to the users as a set of
tables in which data is stored. Tables consist of a number of rows, each row containing
the same number of columns (Carter, 1995). A database based on the relational model
was developed by E.F. Codd during the 1970s. A relational database allows the definition
of data structures, storage, and retrieval operations and integrity constraints. Figure 5-3
shows how data is viewed in the relational model.
FIGURE 5-3: The Relational Database Model (Carter, 1995)
Relational databases normally contain the following features (Dewson, 2008):
- Tables: This is where data is kept within the database. A database must
contain at least one table to be of use, although there are databases with no
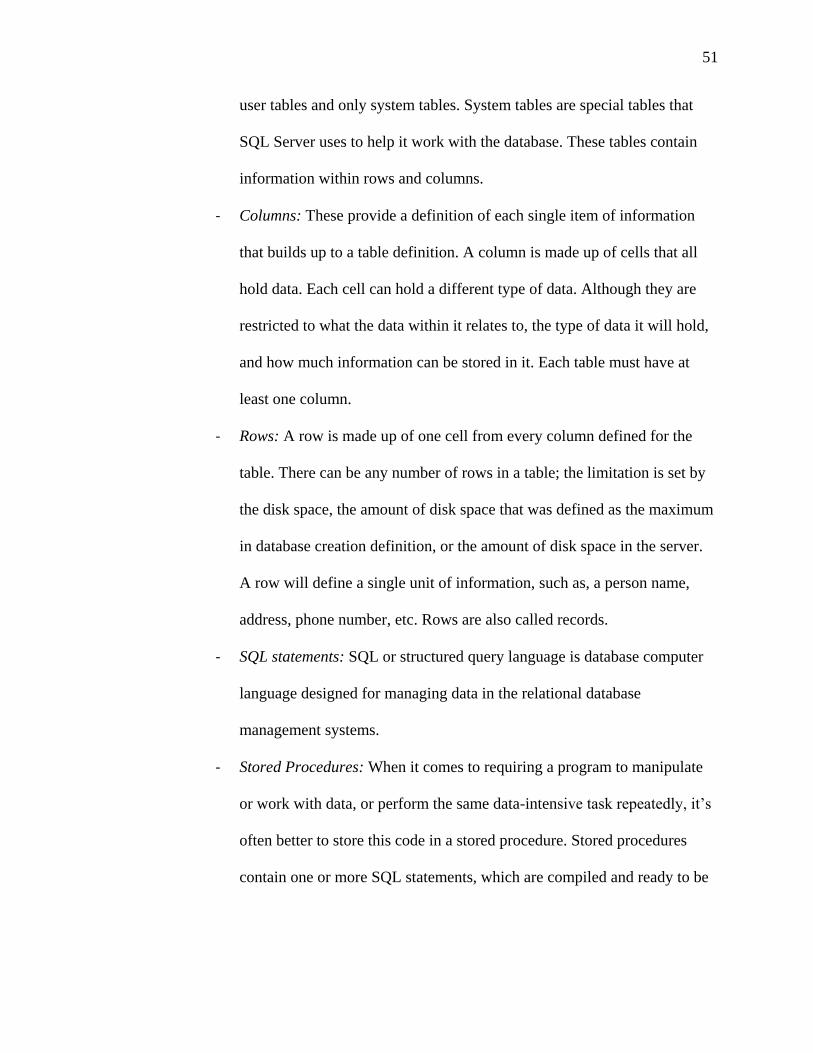
51
user tables and only system tables. System tables are special tables that
SQL Server uses to help it work with the database. These tables contain
information within rows and columns.
- Columns: These provide a definition of each single item of information
that builds up to a table definition. A column is made up of cells that all
hold data. Each cell can hold a different type of data. Although they are
restricted to what the data within it relates to, the type of data it will hold,
and how much information can be stored in it. Each table must have at
least one column.
- Rows: A row is made up of one cell from every column defined for the
table. There can be any number of rows in a table; the limitation is set by
the disk space, the amount of disk space that was defined as the maximum
in database creation definition, or the amount of disk space in the server.
A row will define a single unit of information, such as, a person name,
address, phone number, etc. Rows are also called records.
- SQL statements: SQL or structured query language is database computer
language designed for managing data in the relational database
management systems.
- Stored Procedures: When it comes to requiring a program to manipulate
or work with data, or perform the same data-intensive task repeatedly, it’s
often better to store this code in a stored procedure. Stored procedures
contain one or more SQL statements, which are compiled and ready to be
52
executed when required. Stored procedures are permanently stored in the
database, ready for use at any time.
- Indexes: These can be regarded as predefined lists of information that can
inform the database how the data is physically sorted and stored, or they
can be used to find rows of data quickly using information supplied by a
SQL query and matching this information to data within columns. An
index consists of one or more columns from the table it is defined for, but
it is not possible for an index to cover more than one table. Index is very
much like the index of a book, which is used to locate a piece of
information faster than looking through the book page by page.
- Views: These can be thought of as virtual tables. Views can contain
information combined from several tables and can present a more user-
friendly interface to the data. Views can also add a great deal of security to
an application, but they do give reduced functionality over the use of
stored procedures or direct access to the tables. Views can also be indexed
to speed processing of data within.
Since in this study a relational database is used for keeping data for cost
estimating purposes, it would not be a relational database at all if database relationship is
not discussed. The following section will provide the definition of relationship in the
relational database model and how it works with data.
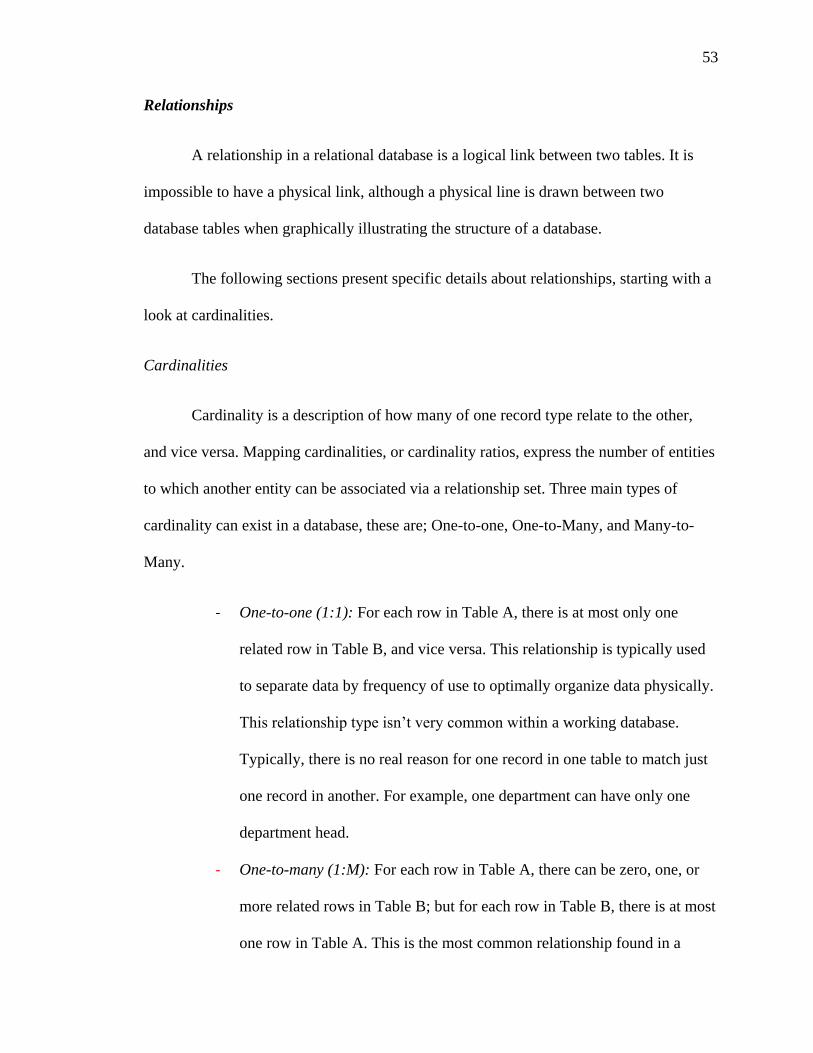
53
Relationships
A relationship in a relational database is a logical link between two tables. It is
impossible to have a physical link, although a physical line is drawn between two
database tables when graphically illustrating the structure of a database.
The following sections present specific details about relationships, starting with a
look at cardinalities.
Cardinalities
Cardinality is a description of how many of one record type relate to the other,
and vice versa. Mapping cardinalities, or cardinality ratios, express the number of entities
to which another entity can be associated via a relationship set. Three main types of
cardinality can exist in a database, these are; One-to-one, One-to-Many, and Many-to-
Many.
- One-to-one (1:1): For each row in Table A, there is at most only one
related row in Table B, and vice versa. This relationship is typically used
to separate data by frequency of use to optimally organize data physically.
This relationship type isn’t very common within a working database.
Typically, there is no real reason for one record in one table to match just
one record in another. For example, one department can have only one
department head.
- One-to-many (1:M): For each row in Table A, there can be zero, one, or
more related rows in Table B; but for each row in Table B, there is at most
one row in Table A. This is the most common relationship found in a
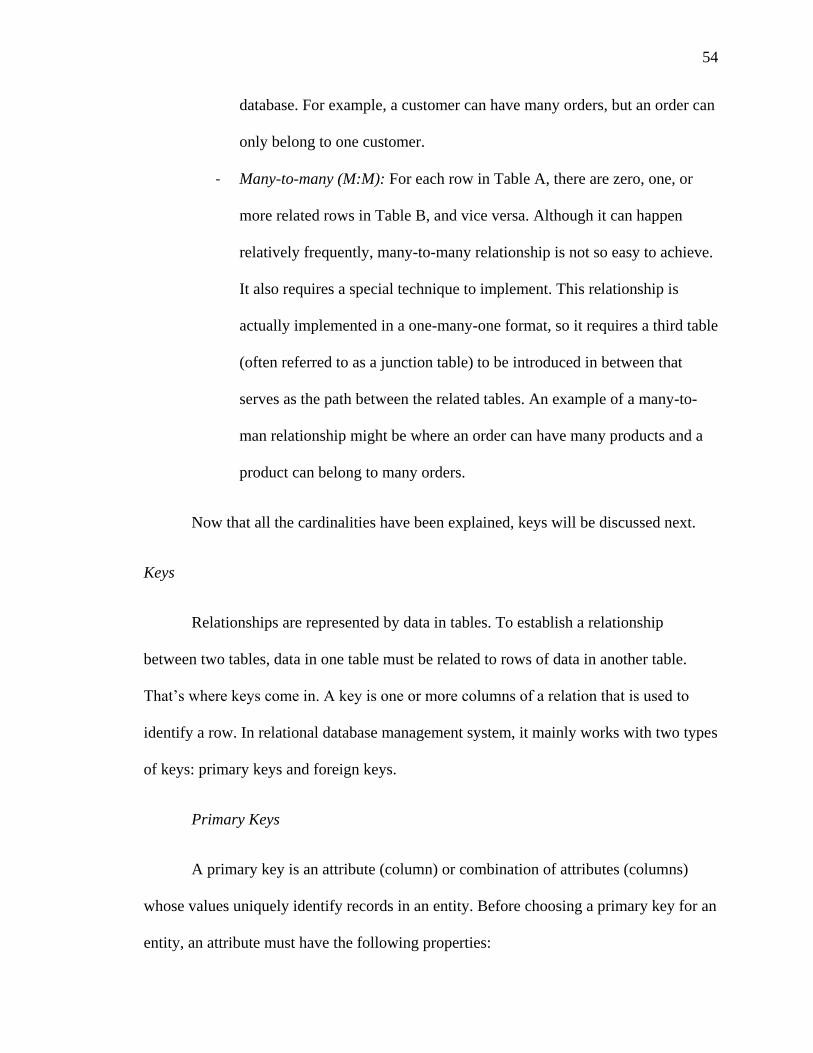
54
database. For example, a customer can have many orders, but an order can
only belong to one customer.
- Many-to-many (M:M): For each row in Table A, there are zero, one, or
more related rows in Table B, and vice versa. Although it can happen
relatively frequently, many-to-many relationship is not so easy to achieve.
It also requires a special technique to implement. This relationship is
actually implemented in a one-many-one format, so it requires a third table
(often referred to as a junction table) to be introduced in between that
serves as the path between the related tables. An example of a many-to-
man relationship might be where an order can have many products and a
product can belong to many orders.
Now that all the cardinalities have been explained, keys will be discussed next.
Keys
Relationships are represented by data in tables. To establish a relationship
between two tables, data in one table must be related to rows of data in another table.
That’s where keys come in. A key is one or more columns of a relation that is used to
identify a row. In relational database management system, it mainly works with two types
of keys: primary keys and foreign keys.
Primary Keys
A primary key is an attribute (column) or combination of attributes (columns)
whose values uniquely identify records in an entity. Before choosing a primary key for an
entity, an attribute must have the following properties:
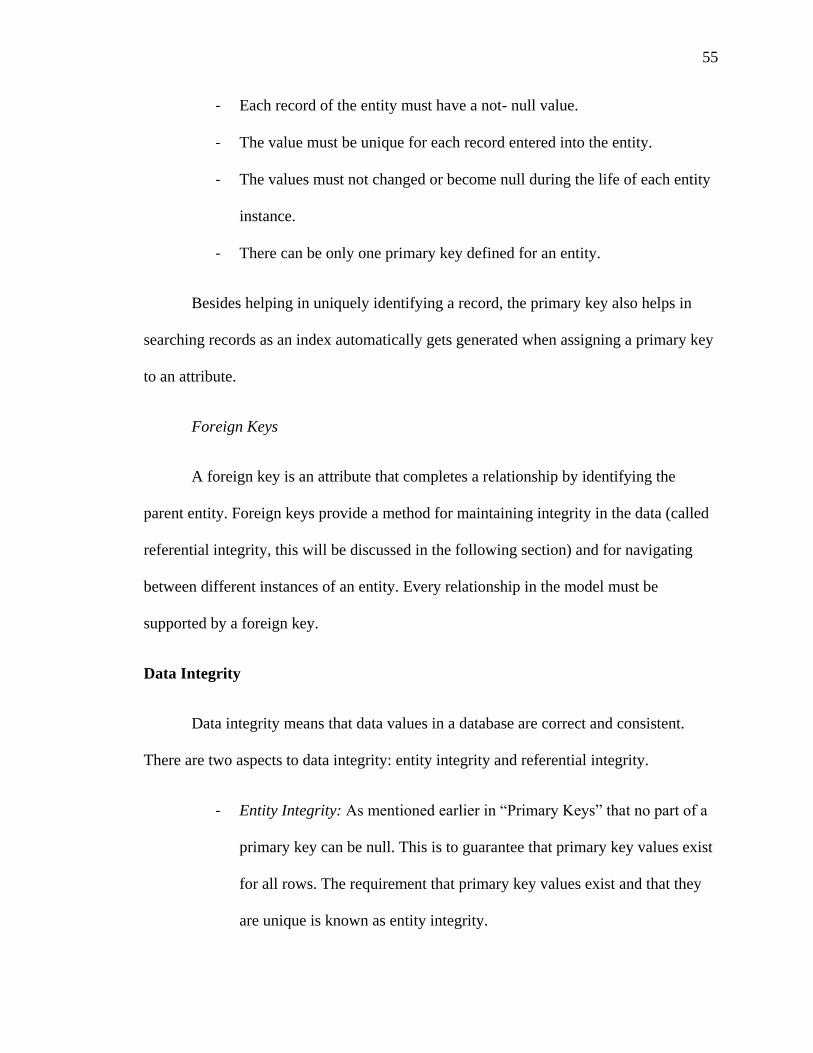
55
- Each record of the entity must have a not- null value.
- The value must be unique for each record entered into the entity.
- The values must not changed or become null during the life of each entity
instance.
- There can be only one primary key defined for an entity.
Besides helping in uniquely identifying a record, the primary key also helps in
searching records as an index automatically gets generated when assigning a primary key
to an attribute.
Foreign Keys
A foreign key is an attribute that completes a relationship by identifying the
parent entity. Foreign keys provide a method for maintaining integrity in the data (called
referential integrity, this will be discussed in the following section) and for navigating
between different instances of an entity. Every relationship in the model must be
supported by a foreign key.
Data Integrity
Data integrity means that data values in a database are correct and consistent.
There are two aspects to data integrity: entity integrity and referential integrity.
- Entity Integrity: As mentioned earlier in “Primary Keys” that no part of a
primary key can be null. This is to guarantee that primary key values exist
for all rows. The requirement that primary key values exist and that they
are unique is known as entity integrity.
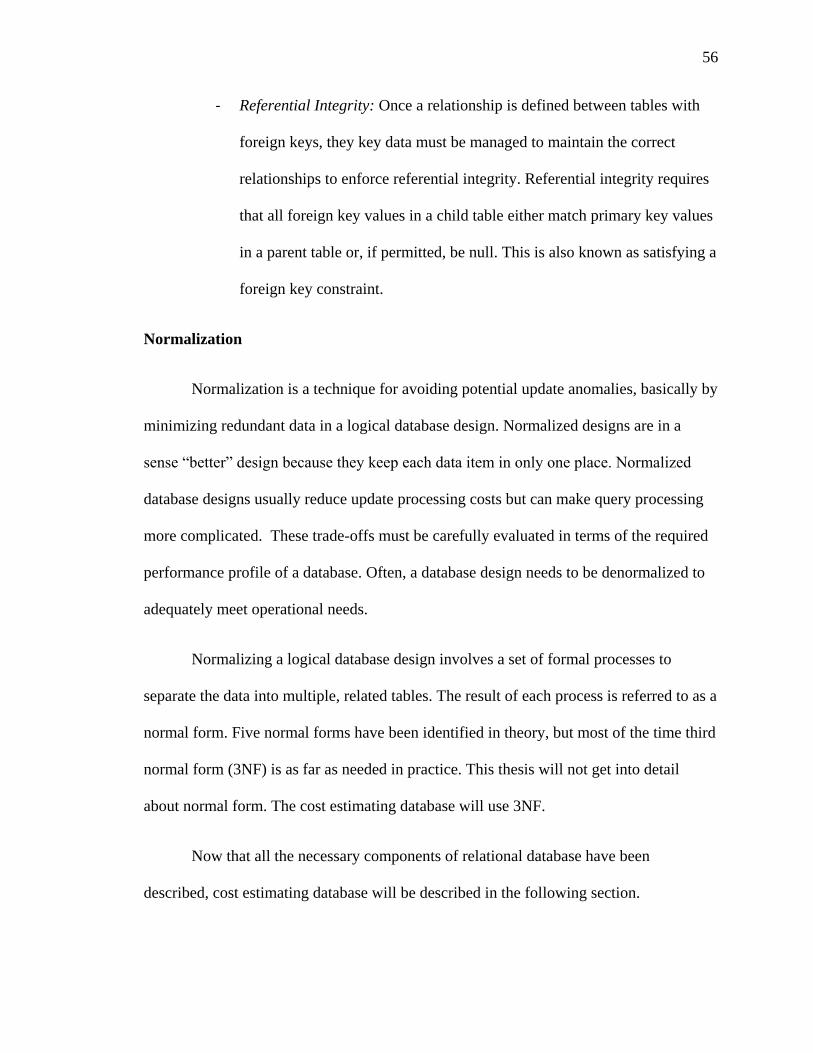
56
- Referential Integrity: Once a relationship is defined between tables with
foreign keys, they key data must be managed to maintain the correct
relationships to enforce referential integrity. Referential integrity requires
that all foreign key values in a child table either match primary key values
in a parent table or, if permitted, be null. This is also known as satisfying a
foreign key constraint.
Normalization
Normalization is a technique for avoiding potential update anomalies, basically by
minimizing redundant data in a logical database design. Normalized designs are in a
sense “better” design because they keep each data item in only one place. Normalized
database designs usually reduce update processing costs but can make query processing
more complicated. These trade-offs must be carefully evaluated in terms of the required
performance profile of a database. Often, a database design needs to be denormalized to
adequately meet operational needs.
Normalizing a logical database design involves a set of formal processes to
separate the data into multiple, related tables. The result of each process is referred to as a
normal form. Five normal forms have been identified in theory, but most of the time third
normal form (3NF) is as far as needed in practice. This thesis will not get into detail
about normal form. The cost estimating database will use 3NF.
Now that all the necessary components of relational database have been
described, cost estimating database will be described in the following section.
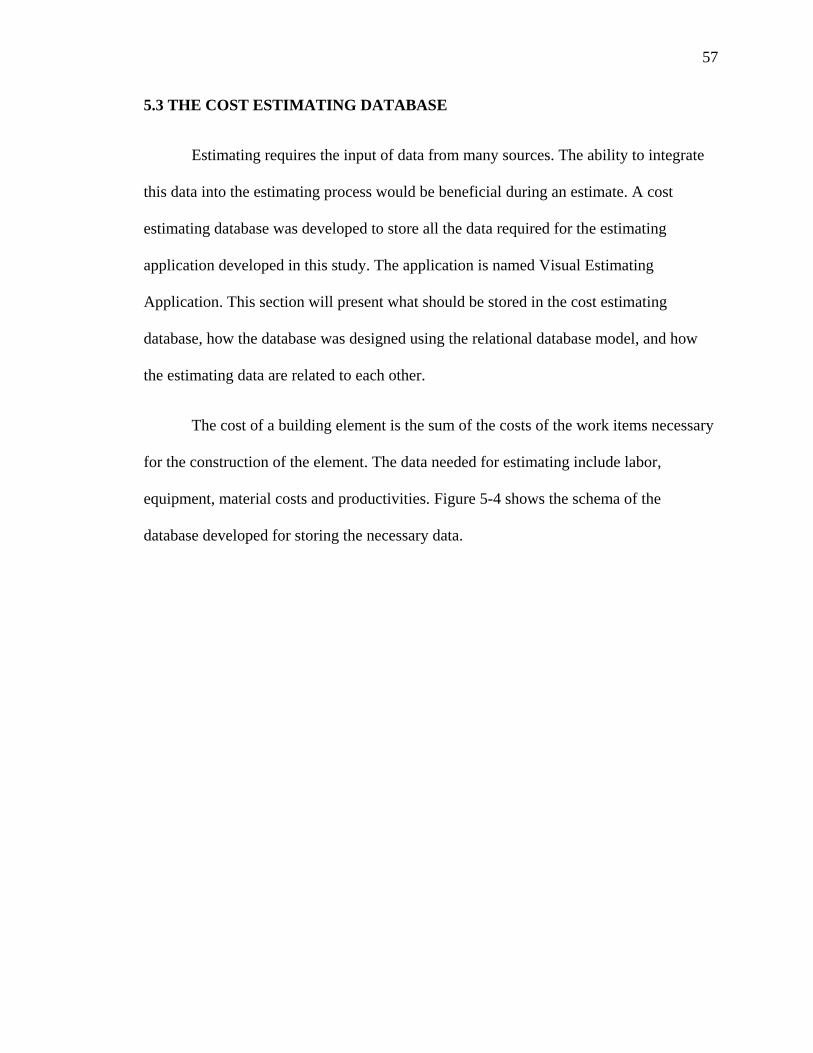
57
5.3 THE COST ESTIMATING DATABASE
Estimating requires the input of data from many sources. The ability to integrate
this data into the estimating process would be beneficial during an estimate. A cost
estimating database was developed to store all the data required for the estimating
application developed in this study. The application is named Visual Estimating
Application. This section will present what should be stored in the cost estimating
database, how the database was designed using the relational database model, and how
the estimating data are related to each other.
The cost of a building element is the sum of the costs of the work items necessary
for the construction of the element. The data needed for estimating include labor,
equipment, material costs and productivities. Figure 5-4 shows the schema of the
database developed for storing the necessary data.
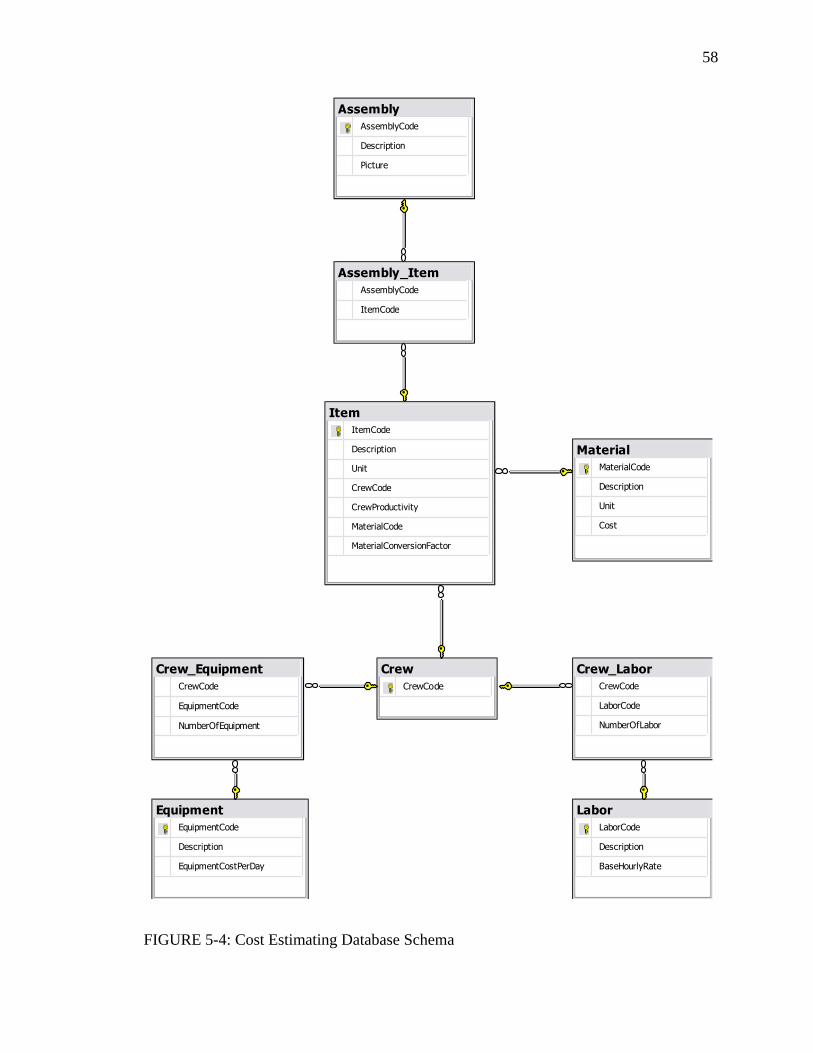
58
FIGURE 5-4: Cost Estimating Database Schema
Assembly
AssemblyCode
Description
Picture
Assembly_Item
AssemblyCode
ItemCode
Crew
CrewCode
Crew_Equipment
CrewCode
EquipmentCode
NumberOfEquipment
Crew_Labor
CrewCode
LaborCode
NumberOfLabor
Equipment
EquipmentCode
Description
EquipmentCostPerDay
Item
ItemCode
Description
Unit
CrewCode
CrewProductivity
MaterialCode
MaterialConversionFactor
Labor
LaborCode
Description
BaseHourlyRate
Material
MaterialCode
Description
Unit
Cost
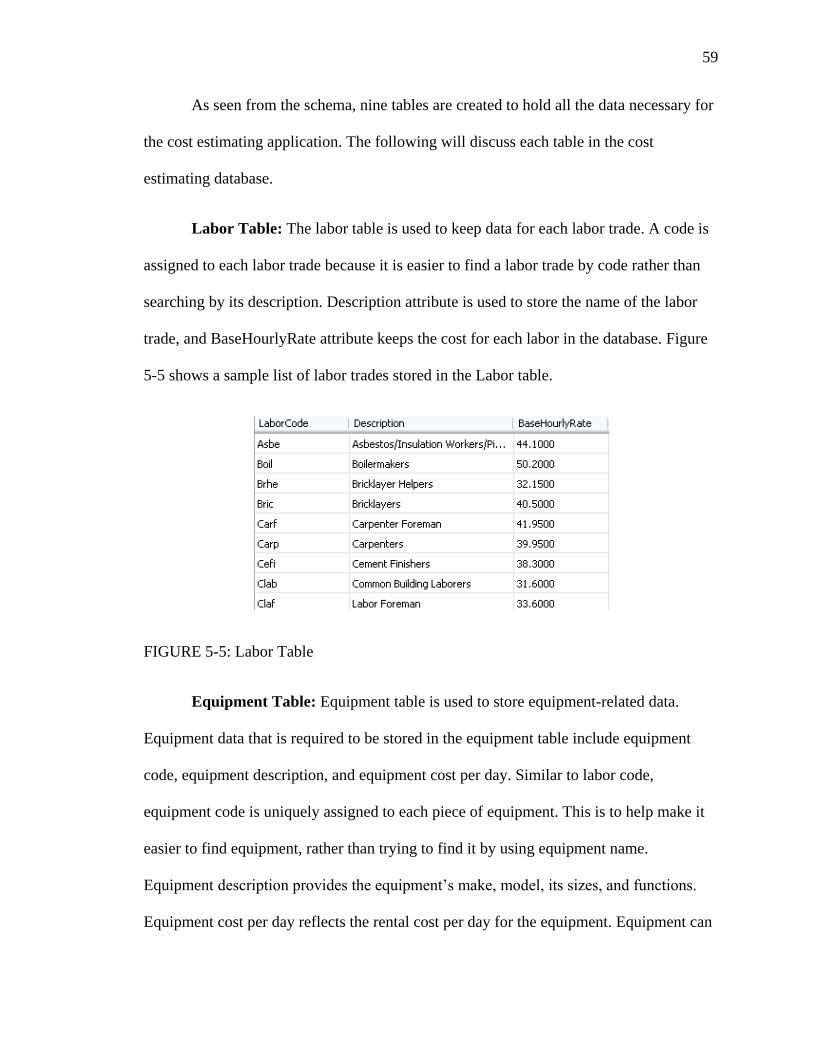
59
As seen from the schema, nine tables are created to hold all the data necessary for
the cost estimating application. The following will discuss each table in the cost
estimating database.
Labor Table: The labor table is used to keep data for each labor trade. A code is
assigned to each labor trade because it is easier to find a labor trade by code rather than
searching by its description. Description attribute is used to store the name of the labor
trade, and BaseHourlyRate attribute keeps the cost for each labor in the database. Figure
5-5 shows a sample list of labor trades stored in the Labor table.
FIGURE 5-5: Labor Table
Equipment Table: Equipment table is used to store equipment-related data.
Equipment data that is required to be stored in the equipment table include equipment
code, equipment description, and equipment cost per day. Similar to labor code,
equipment code is uniquely assigned to each piece of equipment. This is to help make it
easier to find equipment, rather than trying to find it by using equipment name.
Equipment description provides the equipment’s make, model, its sizes, and functions.
Equipment cost per day reflects the rental cost per day for the equipment. Equipment can
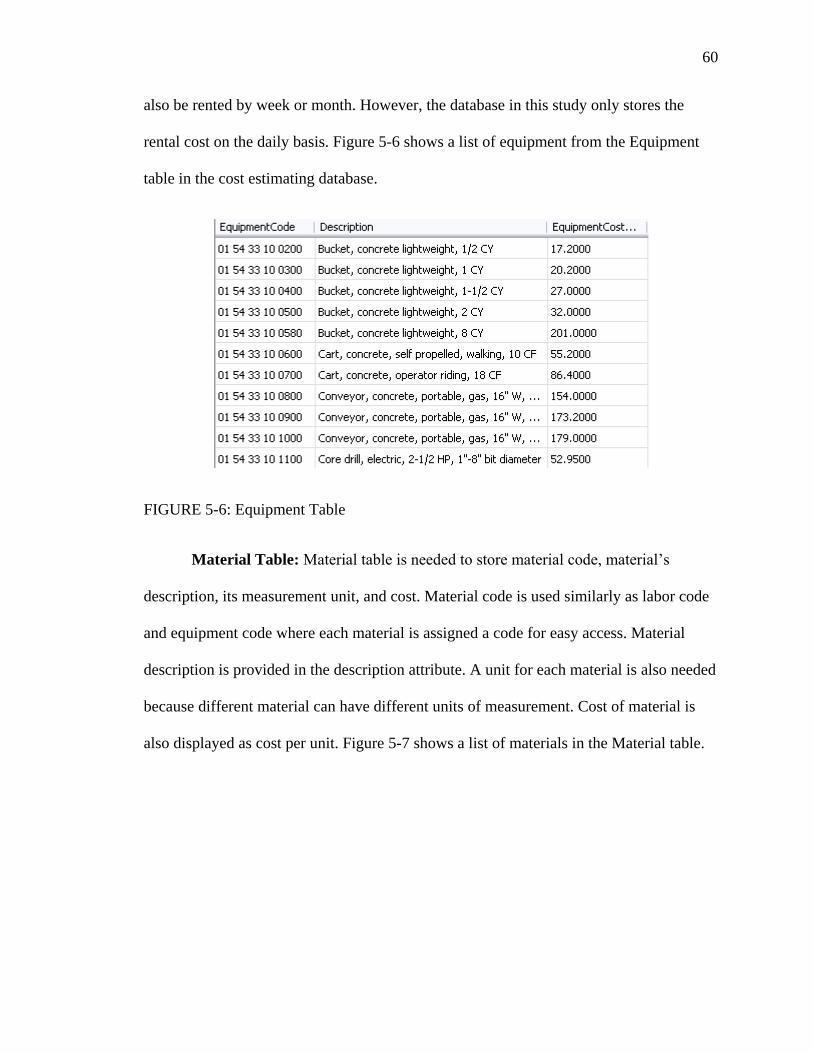
60
also be rented by week or month. However, the database in this study only stores the
rental cost on the daily basis. Figure 5-6 shows a list of equipment from the Equipment
table in the cost estimating database.
FIGURE 5-6: Equipment Table
Material Table: Material table is needed to store material code, material’s
description, its measurement unit, and cost. Material code is used similarly as labor code
and equipment code where each material is assigned a code for easy access. Material
description is provided in the description attribute. A unit for each material is also needed
because different material can have different units of measurement. Cost of material is
also displayed as cost per unit. Figure 5-7 shows a list of materials in the Material table.
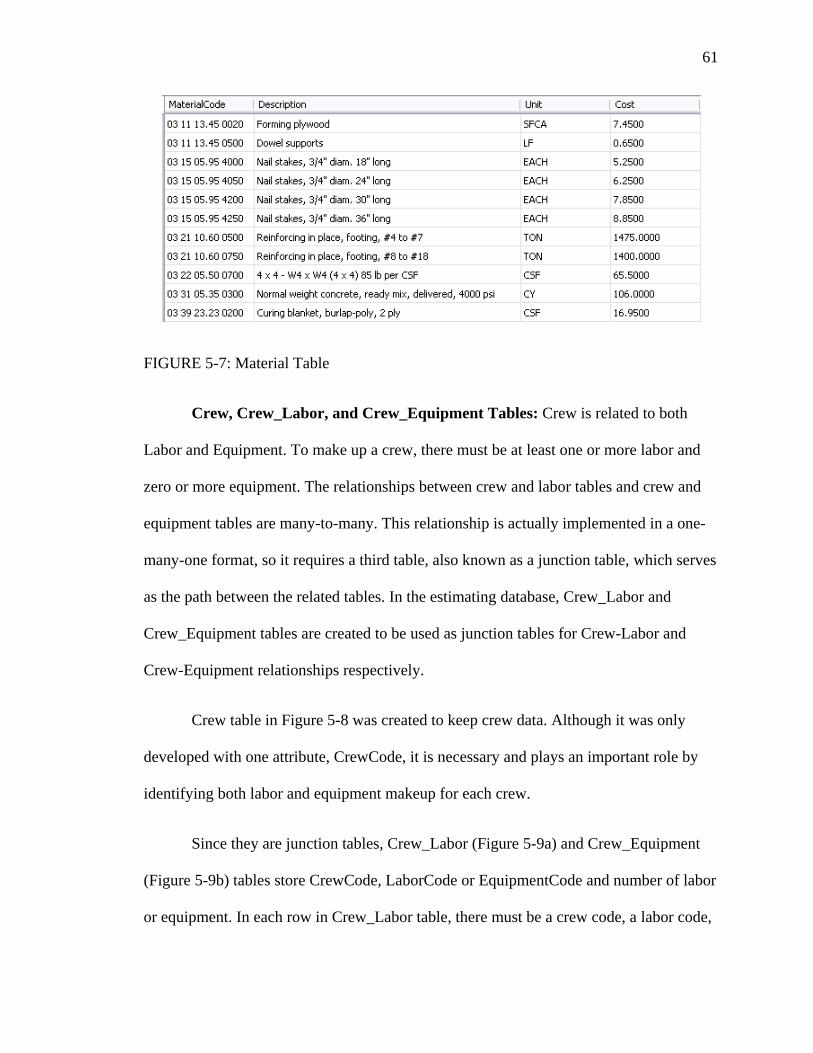
61
FIGURE 5-7: Material Table
Crew, Crew_Labor, and Crew_Equipment Tables: Crew is related to both
Labor and Equipment. To make up a crew, there must be at least one or more labor and
zero or more equipment. The relationships between crew and labor tables and crew and
equipment tables are many-to-many. This relationship is actually implemented in a one-
many-one format, so it requires a third table, also known as a junction table, which serves
as the path between the related tables. In the estimating database, Crew_Labor and
Crew_Equipment tables are created to be used as junction tables for Crew-Labor and
Crew-Equipment relationships respectively.
Crew table in Figure 5-8 was created to keep crew data. Although it was only
developed with one attribute, CrewCode, it is necessary and plays an important role by
identifying both labor and equipment makeup for each crew.
Since they are junction tables, Crew_Labor (Figure 5-9a) and Crew_Equipment
(Figure 5-9b) tables store CrewCode, LaborCode or EquipmentCode and number of labor
or equipment. In each row in Crew_Labor table, there must be a crew code, a labor code,
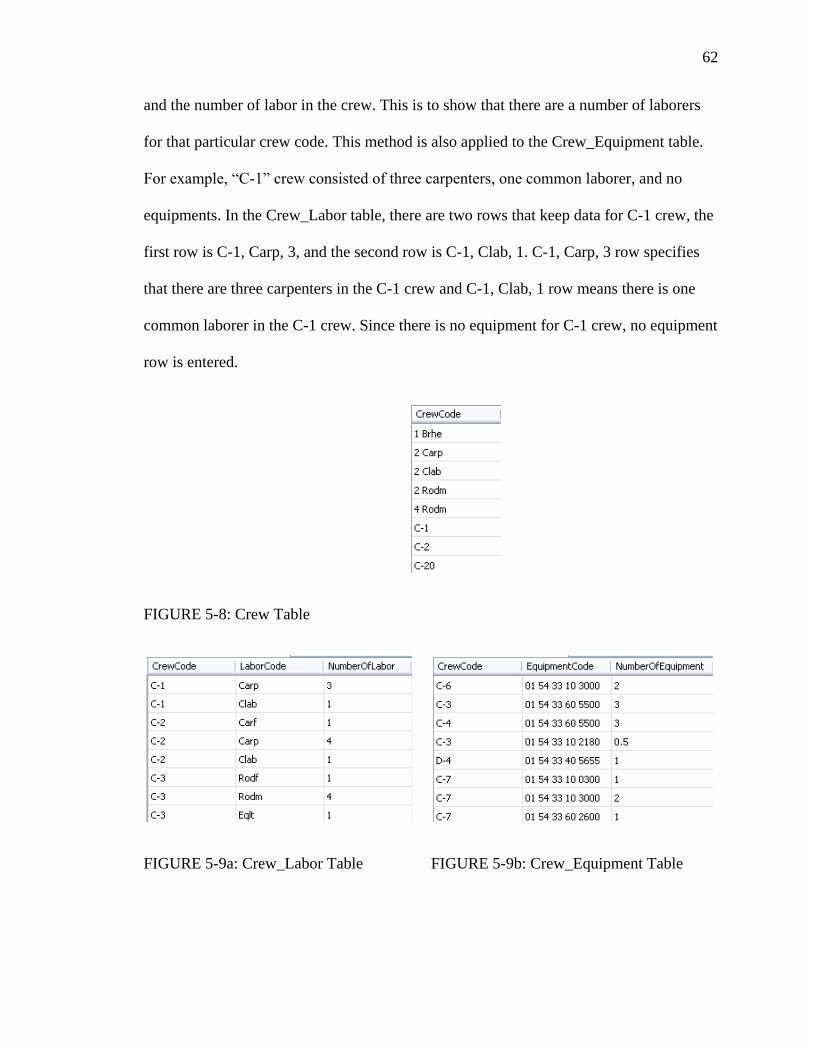
62
and the number of labor in the crew. This is to show that there are a number of laborers
for that particular crew code. This method is also applied to the Crew_Equipment table.
For example, “C-1” crew consisted of three carpenters, one common laborer, and no
equipments. In the Crew_Labor table, there are two rows that keep data for C-1 crew, the
first row is C-1, Carp, 3, and the second row is C-1, Clab, 1. C-1, Carp, 3 row specifies
that there are three carpenters in the C-1 crew and C-1, Clab, 1 row means there is one
common laborer in the C-1 crew. Since there is no equipment for C-1 crew, no equipment
row is entered.
FIGURE 5-8: Crew Table
FIGURE 5-9a: Crew_Labor Table FIGURE 5-9b: Crew_Equipment Table
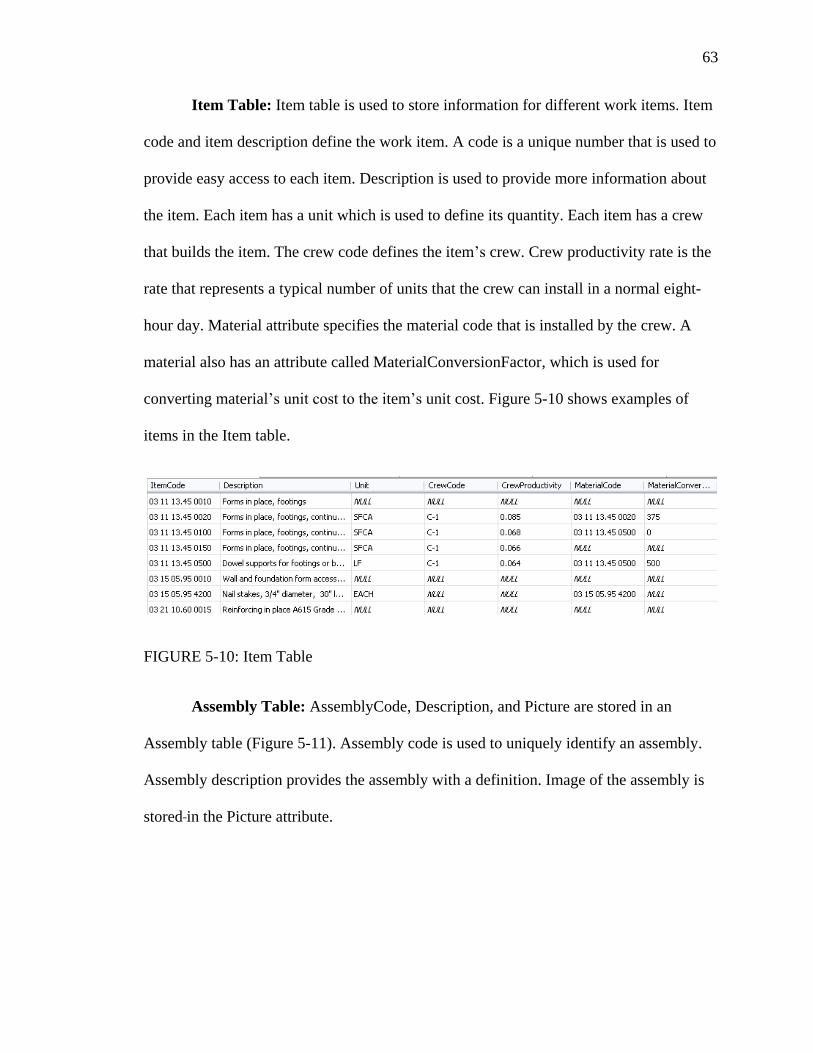
63
Item Table: Item table is used to store information for different work items. Item
code and item description define the work item. A code is a unique number that is used to
provide easy access to each item. Description is used to provide more information about
the item. Each item has a unit which is used to define its quantity. Each item has a crew
that builds the item. The crew code defines the item’s crew. Crew productivity rate is the
rate that represents a typical number of units that the crew can install in a normal eight-
hour day. Material attribute specifies the material code that is installed by the crew. A
material also has an attribute called MaterialConversionFactor, which is used for
converting material’s unit cost to the item’s unit cost. Figure 5-10 shows examples of
items in the Item table.
FIGURE 5-10: Item Table
Assembly Table: AssemblyCode, Description, and Picture are stored in an
Assembly table (Figure 5-11). Assembly code is used to uniquely identify an assembly.
Assembly description provides the assembly with a definition. Image of the assembly is
stored in the Picture attribute.
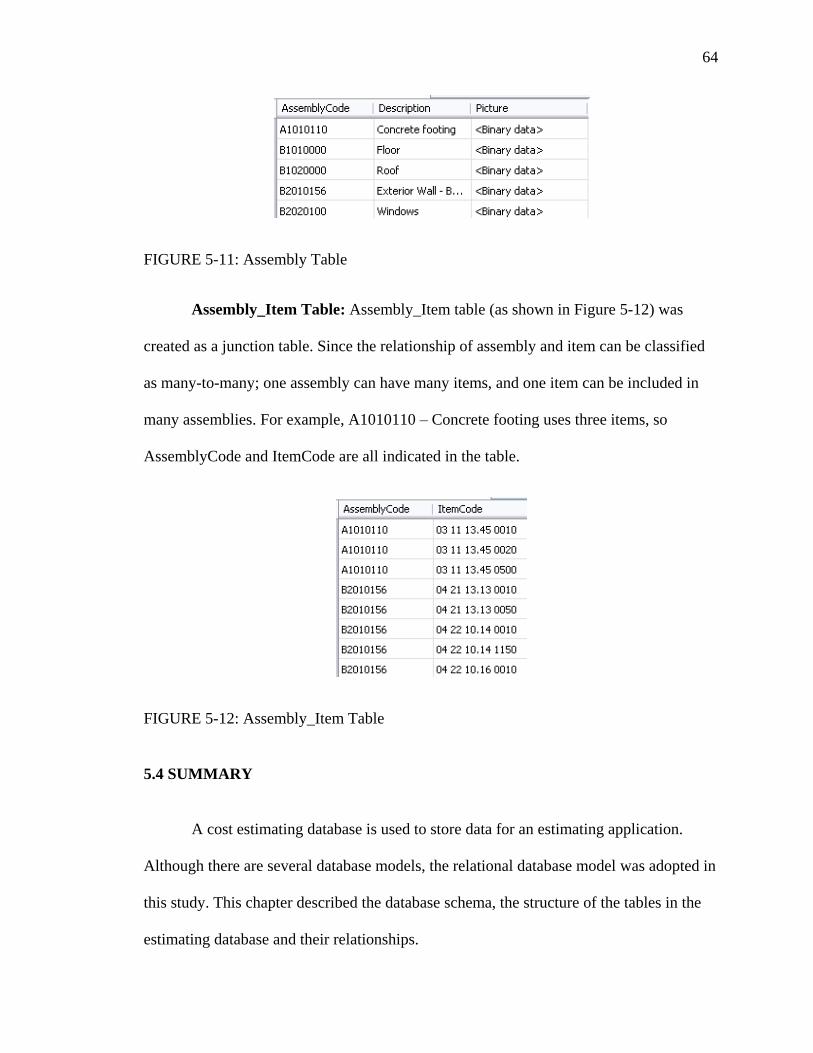
64
FIGURE 5-11: Assembly Table
Assembly_Item Table: Assembly_Item table (as shown in Figure 5-12) was
created as a junction table. Since the relationship of assembly and item can be classified
as many-to-many; one assembly can have many items, and one item can be included in
many assemblies. For example, A1010110 – Concrete footing uses three items, so
AssemblyCode and ItemCode are all indicated in the table.
FIGURE 5-12: Assembly_Item Table
5.4 SUMMARY
A cost estimating database is used to store data for an estimating application.
Although there are several database models, the relational database model was adopted in
this study. This chapter described the database schema, the structure of the tables in the
estimating database and their relationships.

65
The next chapter will discuss the architecture of the Visual Estimating
Application. It discusses various components of the application, the function of each
component and how they are related to each other.
66
CHAPTER 6
VISUAL ESTIMATING APPLICATION ARCHITECTURE
6.1 INTRODUCTION
Construction cost estimating requires a lot of manual work. Available methods,
such as digitizing tablet and on-screen quantity takeoff, require manual inputs, albeit
currently they are forefront technologies in construction cost estimating. In a project
where there are thousands of elements to be estimated, this proves to be tedious and very
time consuming. To minimize the tedious process and provide visualization at the early
stages of building process, a Visual Estimating Application (VEA) is developed to
provide the connection between building information modeling and the process of
construction cost estimating. VEA not only does help in repeated calculations,
summarizing and reporting, but it also helps extracting information from CAD models.
The application of BIM and visualization technology in estimating makes it easier for
estimators facing this task on a regular basis. This chapter discusses the objectives of
VEA and an overview of its architecture. It also explains the interaction of the VEA with
Autodesk Revit, 3D CAD models, and cost estimating databases.
6.2 OBJECTIVES OF VISUAL ESTIMATING APPLICATION
Building information modeling (BIM) is not limited to just the graphical
representation of a project, it also contains non-graphical information that include
functional, behavioral, and semantic properties. Since BIM contains information about
the model, it has become increasingly important in both architectural and engineering
practices. Applications could be developed based on BIM to help architects and engineers
67
do their work more efficiently (Reffat, 2002). For construction cost estimating, the
geometry and properties of elements are necessary. This information can be extracted
from BIM easily. To manipulate the data and visualize the 3D model, an application
named Visual Estimating Application (VEA) is developed. In VEA, an estimator can see
exactly the location and relationships among building elements while walking inside the
building. Information from a 3D CAD model can be extracted and transferred to
estimating software. This helps reduce the time for manual data entry. Looking up cost
information for estimating is also available from a custom database. VEA and its
architecture will be discussed in the following sections.
6.3 VISUAL ESTIMATING APPLICATION ARCHITECTURE
VEA was developed to improve the process of construction cost estimating. The
application and its components are shown in Figure 6-1. These components will be
discussed individually in the following sections.
VEA is developed for projects that use Autodesk Revit as their BIM modeler. The
element geometry and material information can be extracted from a Revit model via
Revit API. Using the extracted information and Microsoft DirectX graphics library, a
virtual prototype of the project is created in the visualization module (Van Verth and
Bishop, 2004, Karshenas, 2009). Section 6.3.1 will discuss Revit API in more detail. The
visualization module allows estimators to navigate and interact with the virtual
environment. First and third person cameras are developed for navigation while input
devices are used to interact with the model. This will be discussed in further detail in
section 6.3.2.
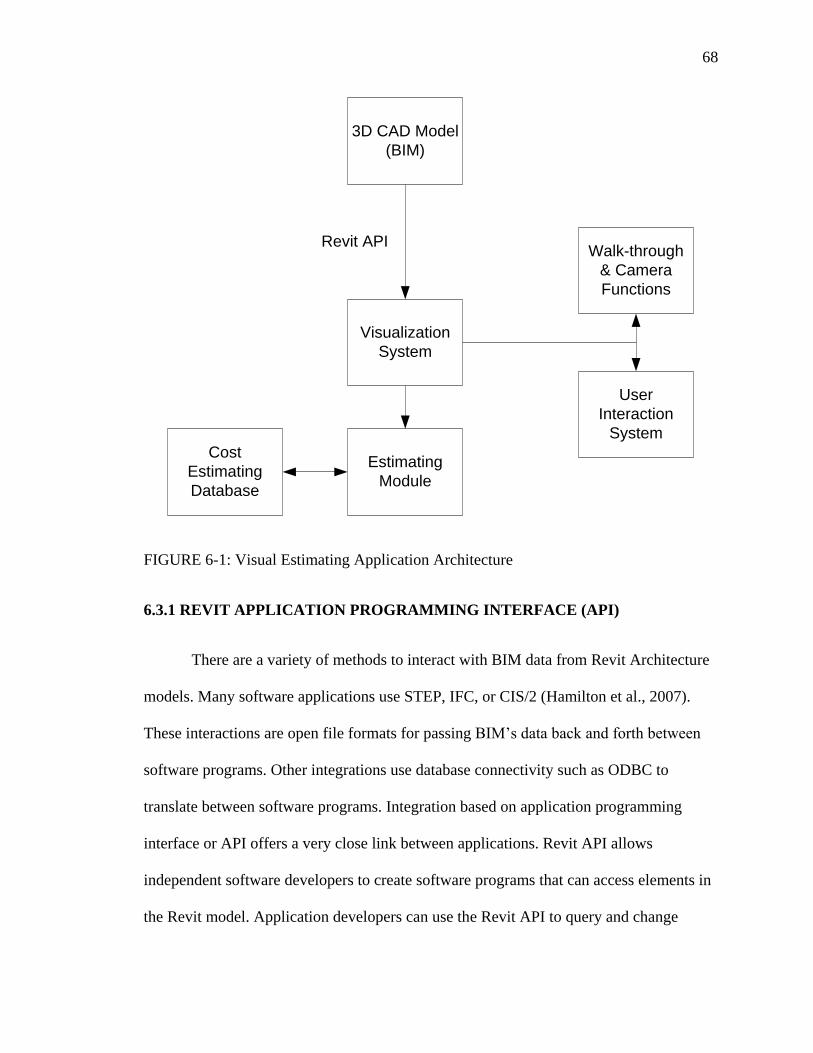
68
Visualization
System
Walk-through
& Camera
Functions
User
Interaction
System
Cost
Estimating
Database
3D CAD Model
(BIM)
Estimating
Module
Revit API
FIGURE 6-1: Visual Estimating Application Architecture
6.3.1 REVIT APPLICATION PROGRAMMING INTERFACE (API)
There are a variety of methods to interact with BIM data from Revit Architecture
models. Many software applications use STEP, IFC, or CIS/2 (Hamilton et al., 2007).
These interactions are open file formats for passing BIM’s data back and forth between
software programs. Other integrations use database connectivity such as ODBC to
translate between software programs. Integration based on application programming
interface or API offers a very close link between applications. Revit API allows
independent software developers to create software programs that can access elements in
the Revit model. Application developers can use the Revit API to query and change
69
element properties as well as to add and modify some elements. Even individual Revit
users and companies are taking advantage of the API to create their own custom tools and
add-on modules (Rundell, 2008). Integrations that use an API to link software
applications are often termed dynamic because the API enables software applications to
interact with each other directly (Revit API User’s Manual, 2008).
The visualization system module interfaces with Revit Architecture using Revit
API via C# programming language. The visualization system module extracts not only
element geometry, but also element material properties.
6.3.2 VISUALIZATION SYSTEM MODULE
After information has been extracted from the CAD model, a 3D representation of
the project is created by the visualization system module. This module was designed with
a custom graphics engine, full navigational control, and two-way communication with the
CAD engine. It was developed using Microsoft DirectX graphics library. Capabilities of
the visualization system include (Karshenas, 2009):
- Interface with Revit Architecture for extracting geometry and material
information for a building model.
- Create a 3D visualization of a building using information extracted from
its Revit design files.
- Interface with other applications such as Microsoft Project for 4D
visualization.
- Provide multimedia information about building elements.
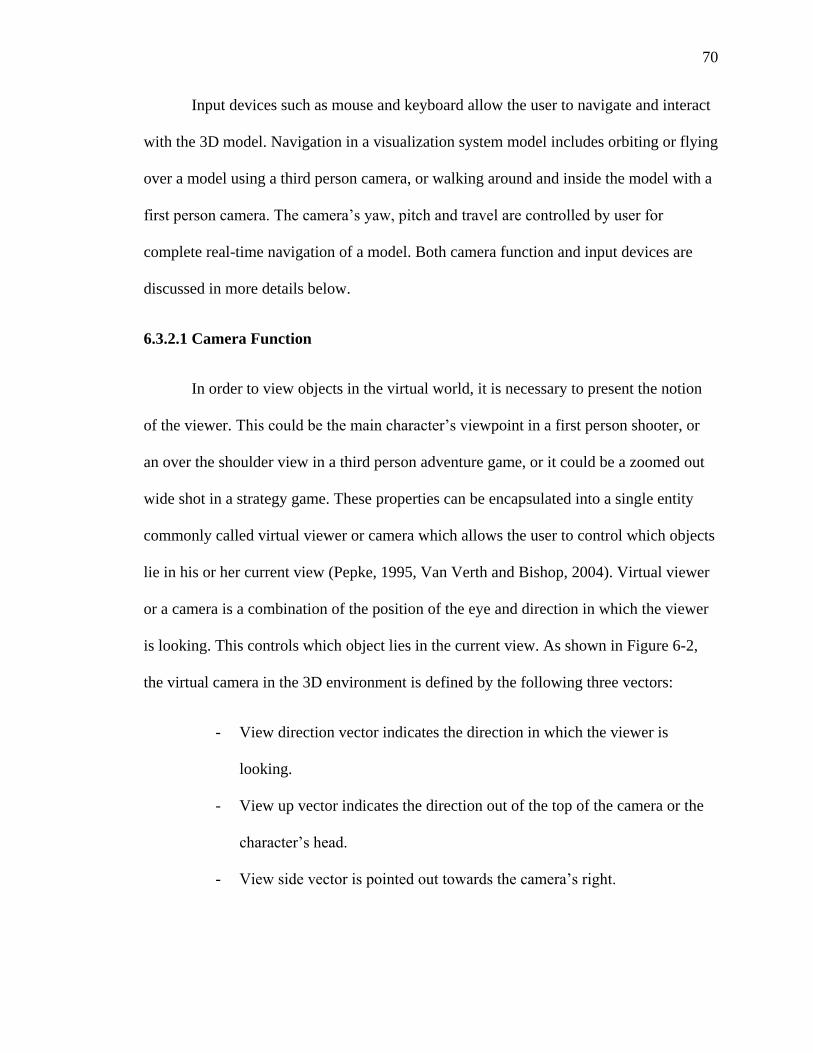
70
Input devices such as mouse and keyboard allow the user to navigate and interact
with the 3D model. Navigation in a visualization system model includes orbiting or flying
over a model using a third person camera, or walking around and inside the model with a
first person camera. The camera’s yaw, pitch and travel are controlled by user for
complete real-time navigation of a model. Both camera function and input devices are
discussed in more details below.
6.3.2.1 Camera Function
In order to view objects in the virtual world, it is necessary to present the notion
of the viewer. This could be the main character’s viewpoint in a first person shooter, or
an over the shoulder view in a third person adventure game, or it could be a zoomed out
wide shot in a strategy game. These properties can be encapsulated into a single entity
commonly called virtual viewer or camera which allows the user to control which objects
lie in his or her current view (Pepke, 1995, Van Verth and Bishop, 2004). Virtual viewer
or a camera is a combination of the position of the eye and direction in which the viewer
is looking. This controls which object lies in the current view. As shown in Figure 6-2,
the virtual camera in the 3D environment is defined by the following three vectors:
- View direction vector indicates the direction in which the viewer is
looking.
- View up vector indicates the direction out of the top of the camera or the
character’s head.
- View side vector is pointed out towards the camera’s right.
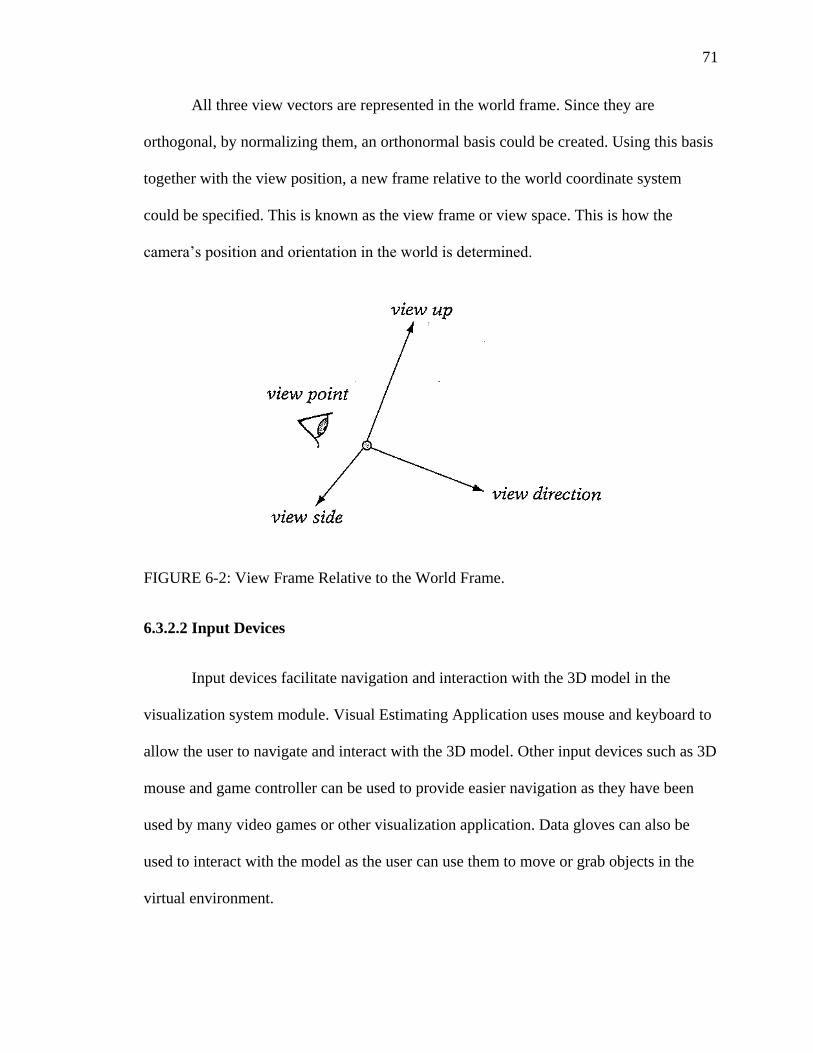
71
All three view vectors are represented in the world frame. Since they are
orthogonal, by normalizing them, an orthonormal basis could be created. Using this basis
together with the view position, a new frame relative to the world coordinate system
could be specified. This is known as the view frame or view space. This is how the
camera’s position and orientation in the world is determined.
FIGURE 6-2: View Frame Relative to the World Frame.
6.3.2.2 Input Devices
Input devices facilitate navigation and interaction with the 3D model in the
visualization system module. Visual Estimating Application uses mouse and keyboard to
allow the user to navigate and interact with the 3D model. Other input devices such as 3D
mouse and game controller can be used to provide easier navigation as they have been
used by many video games or other visualization application. Data gloves can also be
used to interact with the model as the user can use them to move or grab objects in the
virtual environment.
72
6.3.3 COST ESTIMATING DATABASE
After an element has been selected from the visualization system module, it must
be matched to an assembly from the cost estimating database for pricing. Chapter 5
provided an in depth discussion of the cost estimating database and its architecture.
6.3.4 ESTIMATING MODULE
The estimating module is a custom application designed to be an estimating
toolkit. It accesses and uses both the cost estimating database and the visualization
module. It also provides an interface for maintaining the estimating database. Estimating
module was developed for user-friendliness and simplicity. In order to successfully
develop and implement the module, several guidelines were established. The guidelines
are as follows (Karshenas, 2005):
- To allow iteration over all building element instances included in a
project.
- To allow an estimator to review geometry imported from Revit for a
building element instance.
- To allow an estimator to review and adjust the work items necessary for
the construction of a building element.
- To allow an estimator to add the cost of an element instance to the project
cost estimate.
These guidelines will allow fast access to the information necessary for preparing
an estimate and eliminate a lot of repetitive and tedious estimating tasks.
73
6.4 SUMMARY
Visual Estimating Application is developed to help ease the estimating process by
utilizing 3D CAD models and information extracted from BIM. It includes an estimating
module, a visualization module and a database.
The visualization module is used to help the estimator navigate and interact with
the project model. The cost estimating database keeps all the cost data necessary for
estimating. The visualization module interfaces with Revit Architecture using Revit API
via C# programming language. The estimating module matches a building element with
an assembly from the cost estimating database for estimating the element’s cost. The next
chapter will demonstrate the application applied to a simple cost estimating case.
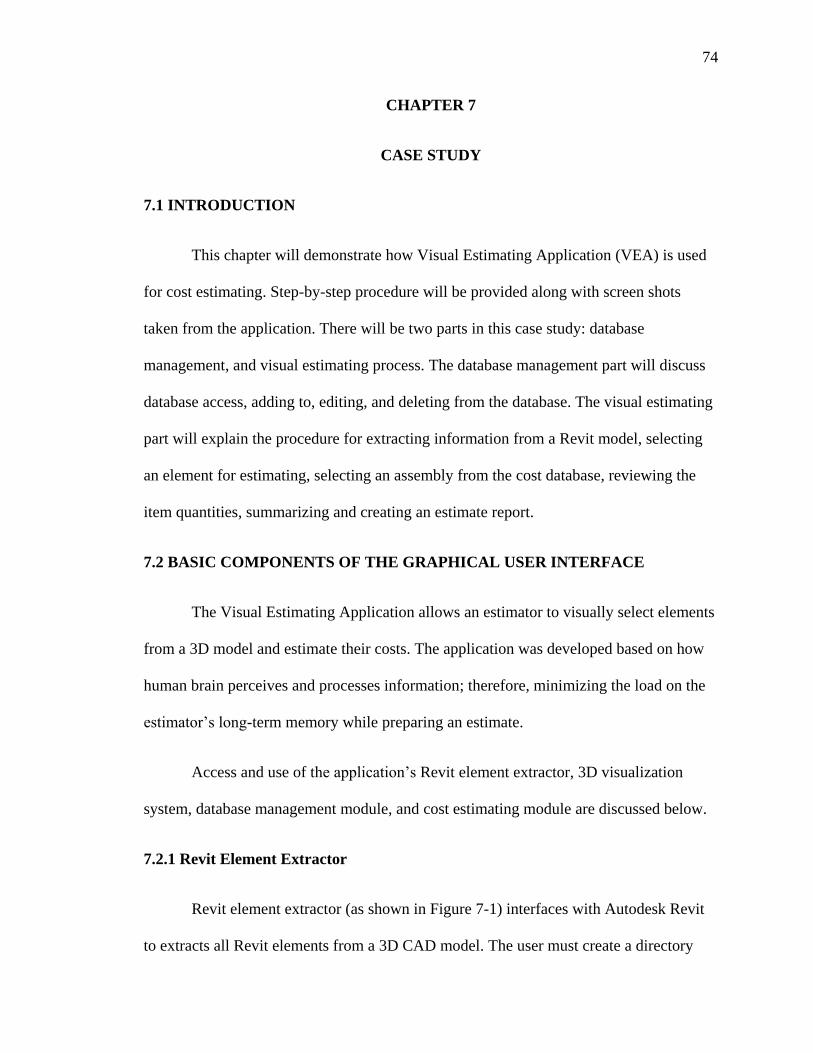
74
CHAPTER 7
CASE STUDY
7.1 INTRODUCTION
This chapter will demonstrate how Visual Estimating Application (VEA) is used
for cost estimating. Step-by-step procedure will be provided along with screen shots
taken from the application. There will be two parts in this case study: database
management, and visual estimating process. The database management part will discuss
database access, adding to, editing, and deleting from the database. The visual estimating
part will explain the procedure for extracting information from a Revit model, selecting
an element for estimating, selecting an assembly from the cost database, reviewing the
item quantities, summarizing and creating an estimate report.
7.2 BASIC COMPONENTS OF THE GRAPHICAL USER INTERFACE
The Visual Estimating Application allows an estimator to visually select elements
from a 3D model and estimate their costs. The application was developed based on how
human brain perceives and processes information; therefore, minimizing the load on the
estimator’s long-term memory while preparing an estimate.
Access and use of the application’s Revit element extractor, 3D visualization
system, database management module, and cost estimating module are discussed below.
7.2.1 Revit Element Extractor
Revit element extractor (as shown in Figure 7-1) interfaces with Autodesk Revit
to extracts all Revit elements from a 3D CAD model. The user must create a directory
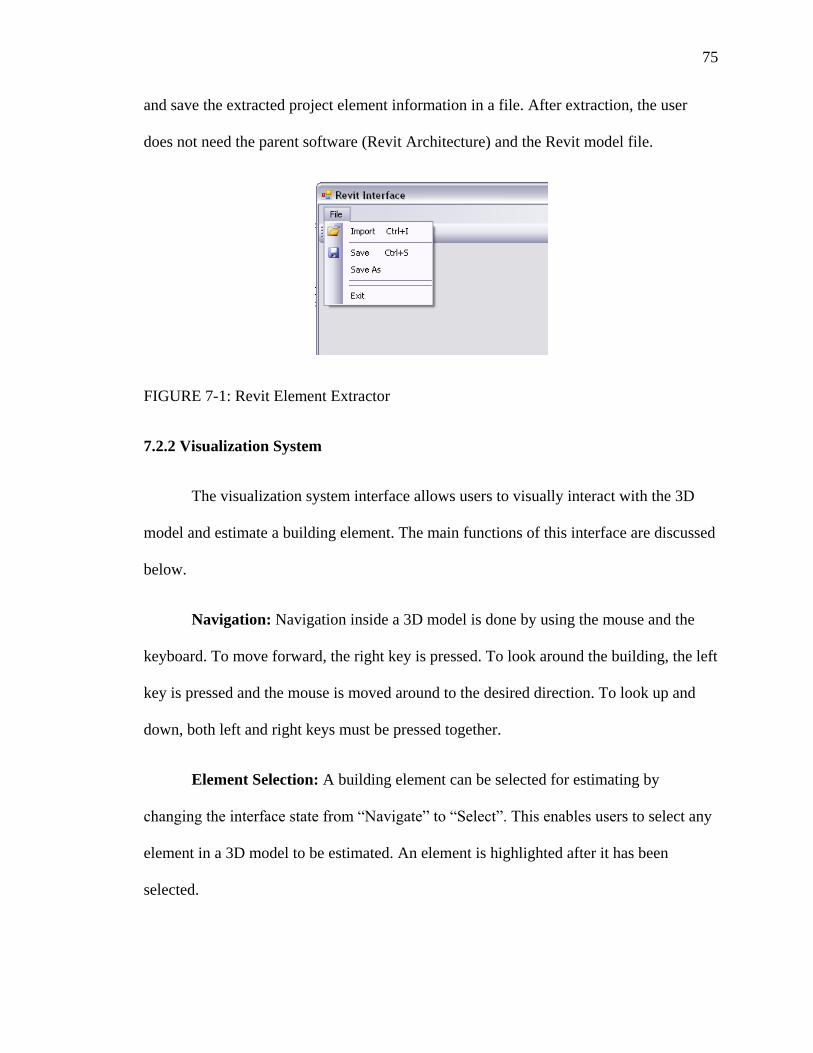
75
and save the extracted project element information in a file. After extraction, the user
does not need the parent software (Revit Architecture) and the Revit model file.
FIGURE 7-1: Revit Element Extractor
7.2.2 Visualization System
The visualization system interface allows users to visually interact with the 3D
model and estimate a building element. The main functions of this interface are discussed
below.
Navigation: Navigation inside a 3D model is done by using the mouse and the
keyboard. To move forward, the right key is pressed. To look around the building, the left
key is pressed and the mouse is moved around to the desired direction. To look up and
down, both left and right keys must be pressed together.
Element Selection: A building element can be selected for estimating by
changing the interface state from “Navigate” to “Select”. This enables users to select any
element in a 3D model to be estimated. An element is highlighted after it has been
selected.
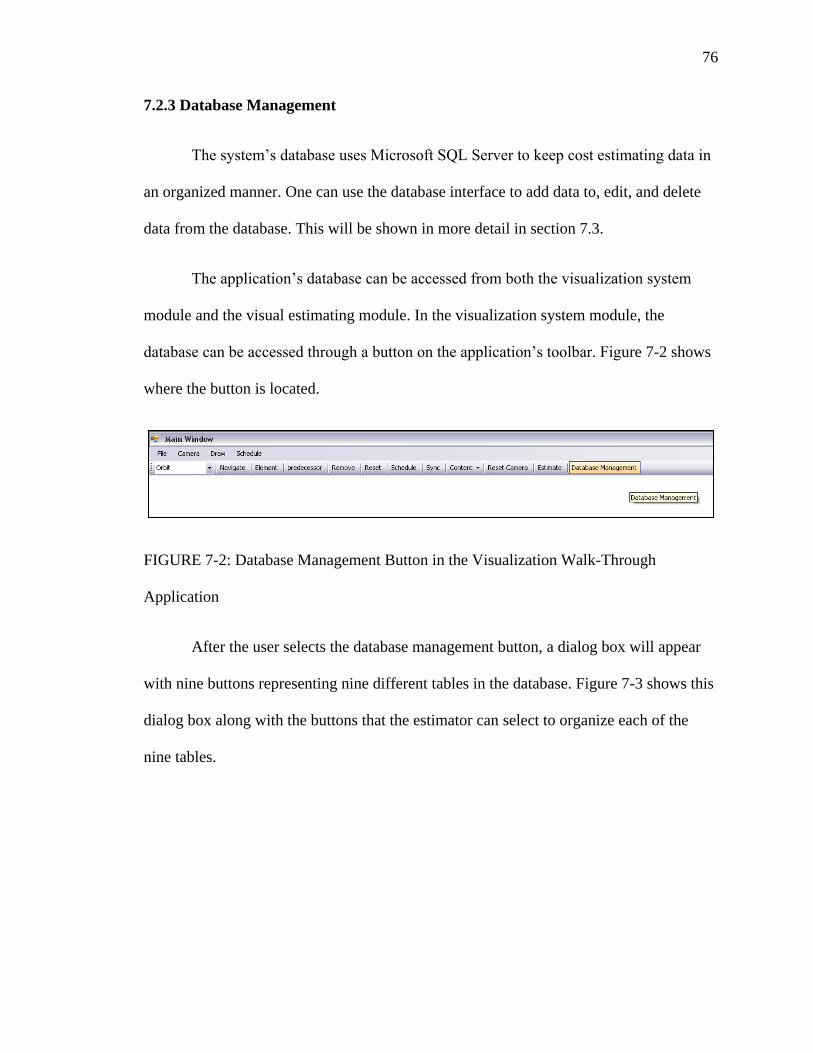
76
7.2.3 Database Management
The system’s database uses Microsoft SQL Server to keep cost estimating data in
an organized manner. One can use the database interface to add data to, edit, and delete
data from the database. This will be shown in more detail in section 7.3.
The application’s database can be accessed from both the visualization system
module and the visual estimating module. In the visualization system module, the
database can be accessed through a button on the application’s toolbar. Figure 7-2 shows
where the button is located.
FIGURE 7-2: Database Management Button in the Visualization Walk-Through
Application
After the user selects the database management button, a dialog box will appear
with nine buttons representing nine different tables in the database. Figure 7-3 shows this
dialog box along with the buttons that the estimator can select to organize each of the
nine tables.
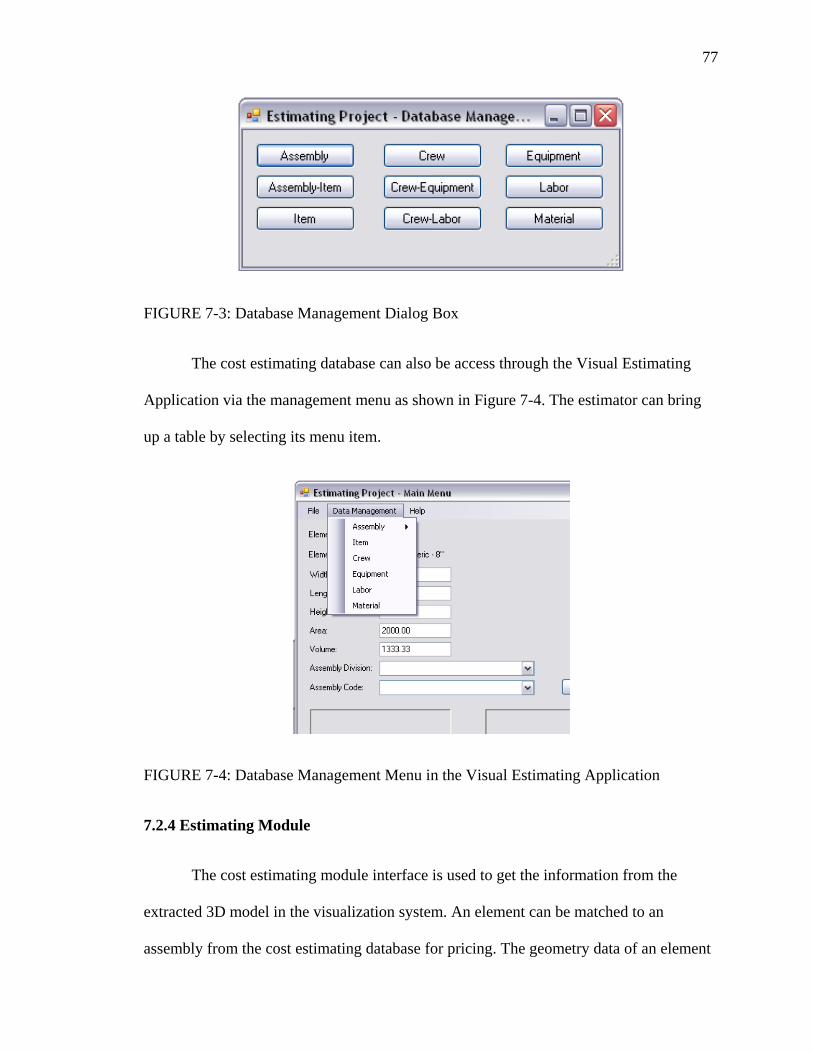
77
FIGURE 7-3: Database Management Dialog Box
The cost estimating database can also be access through the Visual Estimating
Application via the management menu as shown in Figure 7-4. The estimator can bring
up a table by selecting its menu item.
FIGURE 7-4: Database Management Menu in the Visual Estimating Application
7.2.4 Estimating Module
The cost estimating module interface is used to get the information from the
extracted 3D model in the visualization system. An element can be matched to an
assembly from the cost estimating database for pricing. The geometry data of an element
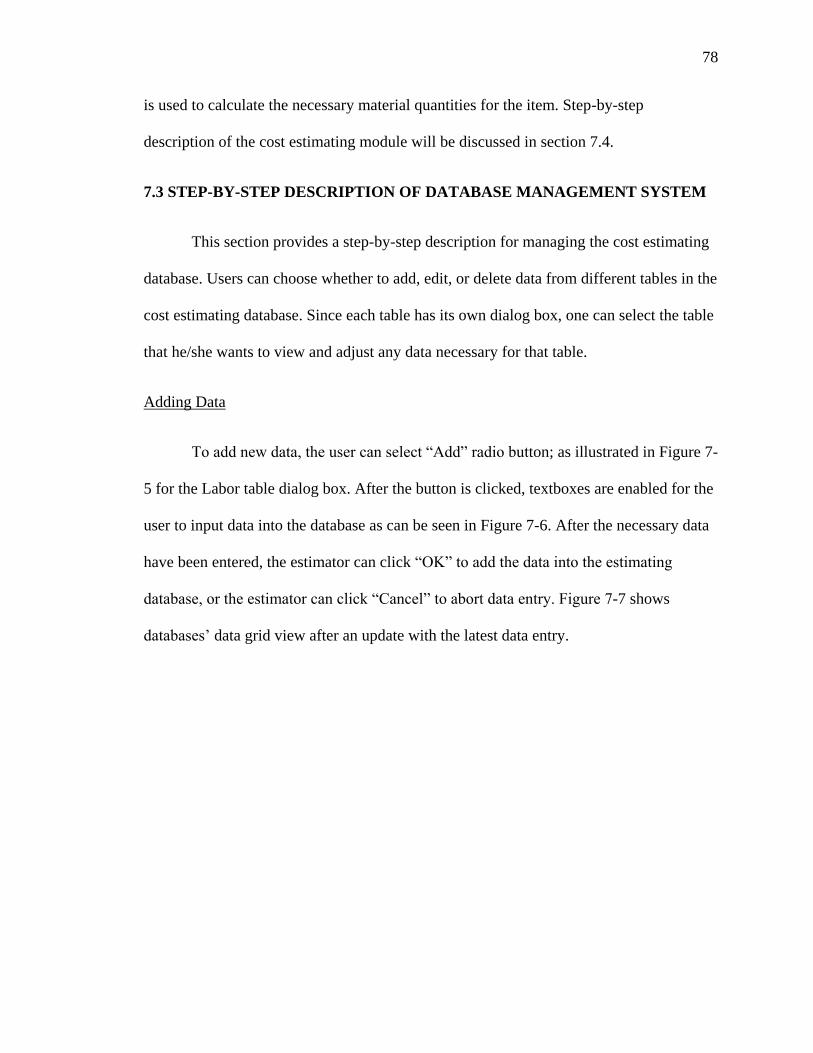
78
is used to calculate the necessary material quantities for the item. Step-by-step
description of the cost estimating module will be discussed in section 7.4.
7.3 STEP-BY-STEP DESCRIPTION OF DATABASE MANAGEMENT SYSTEM
This section provides a step-by-step description for managing the cost estimating
database. Users can choose whether to add, edit, or delete data from different tables in the
cost estimating database. Since each table has its own dialog box, one can select the table
that he/she wants to view and adjust any data necessary for that table.
Adding Data
To add new data, the user can select “Add” radio button; as illustrated in Figure 7-
5 for the Labor table dialog box. After the button is clicked, textboxes are enabled for the
user to input data into the database as can be seen in Figure 7-6. After the necessary data
have been entered, the estimator can click “OK” to add the data into the estimating
database, or the estimator can click “Cancel” to abort data entry. Figure 7-7 shows
databases’ data grid view after an update with the latest data entry.
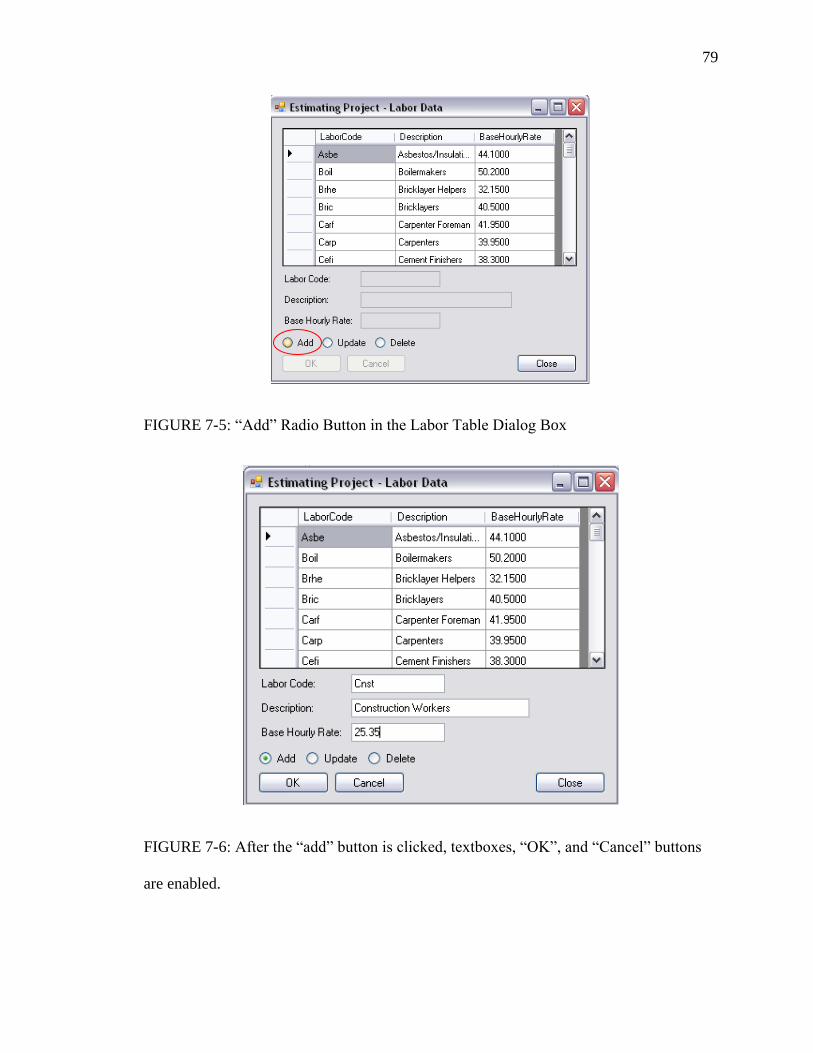
79
FIGURE 7-5: “Add” Radio Button in the Labor Table Dialog Box
FIGURE 7-6: After the “add” button is clicked, textboxes, “OK”, and “Cancel” buttons
are enabled.
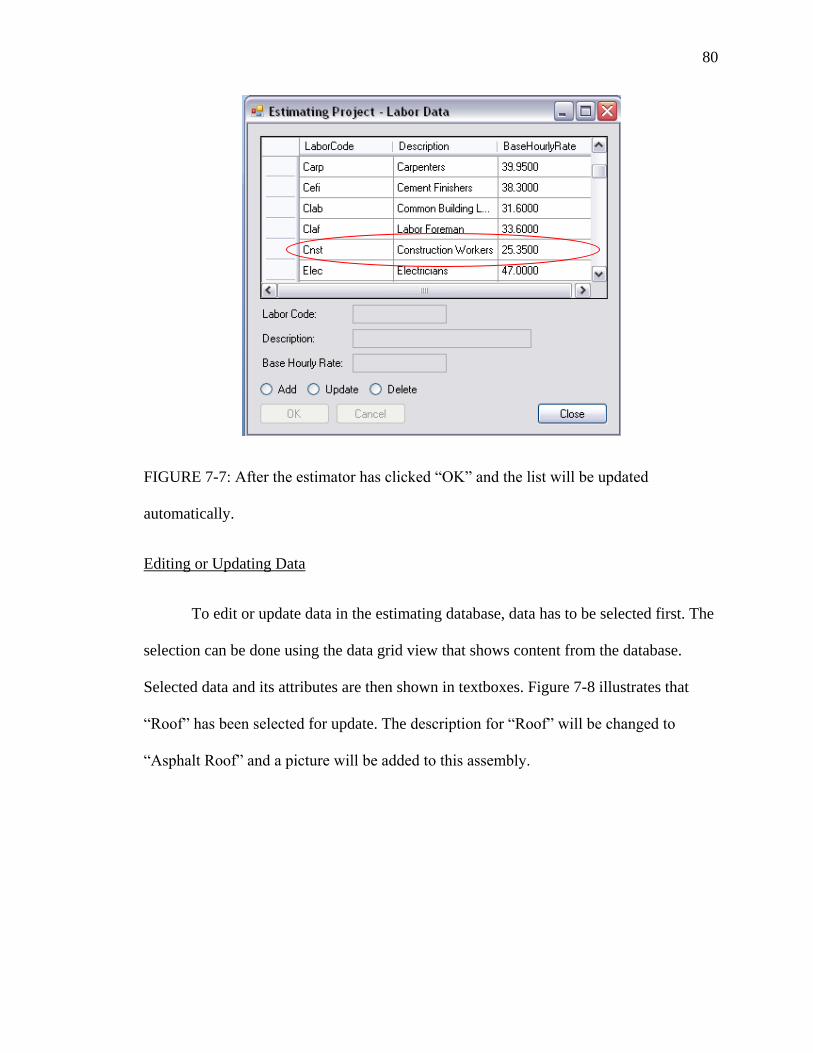
80
FIGURE 7-7: After the estimator has clicked “OK” and the list will be updated
automatically.
Editing or Updating Data
To edit or update data in the estimating database, data has to be selected first. The
selection can be done using the data grid view that shows content from the database.
Selected data and its attributes are then shown in textboxes. Figure 7-8 illustrates that
“Roof” has been selected for update. The description for “Roof” will be changed to
“Asphalt Roof” and a picture will be added to this assembly.
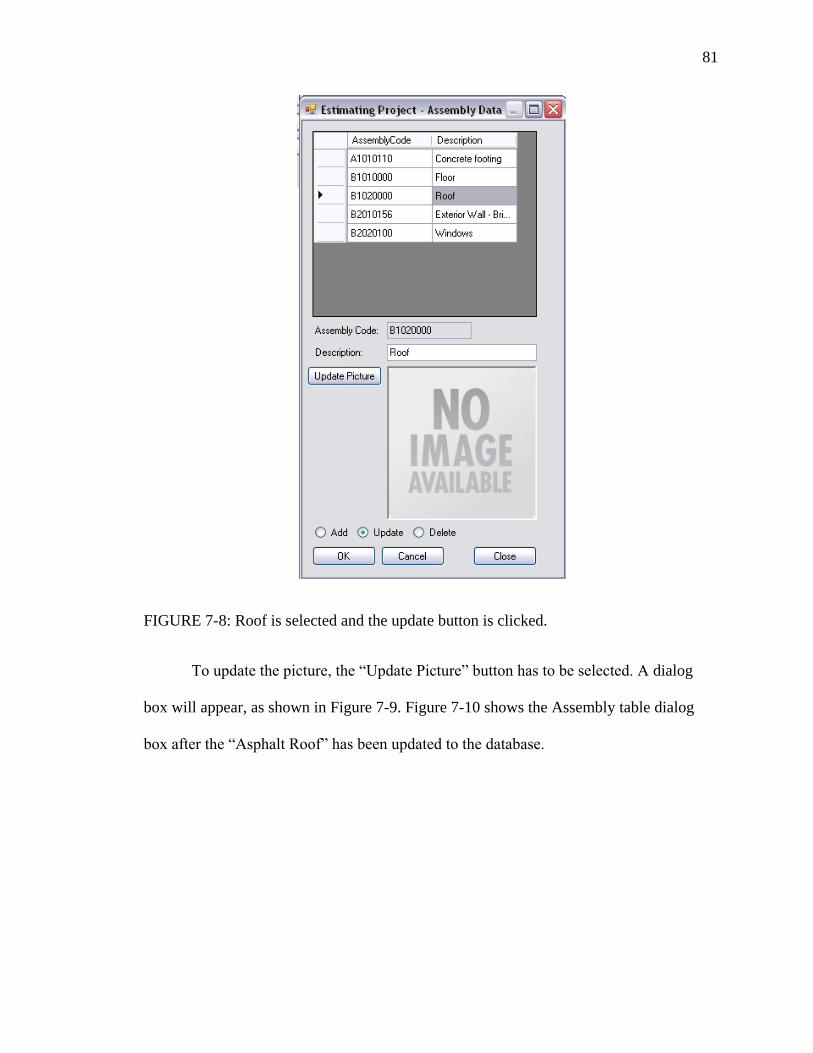
81
FIGURE 7-8: Roof is selected and the update button is clicked.
To update the picture, the “Update Picture” button has to be selected. A dialog
box will appear, as shown in Figure 7-9. Figure 7-10 shows the Assembly table dialog
box after the “Asphalt Roof” has been updated to the database.
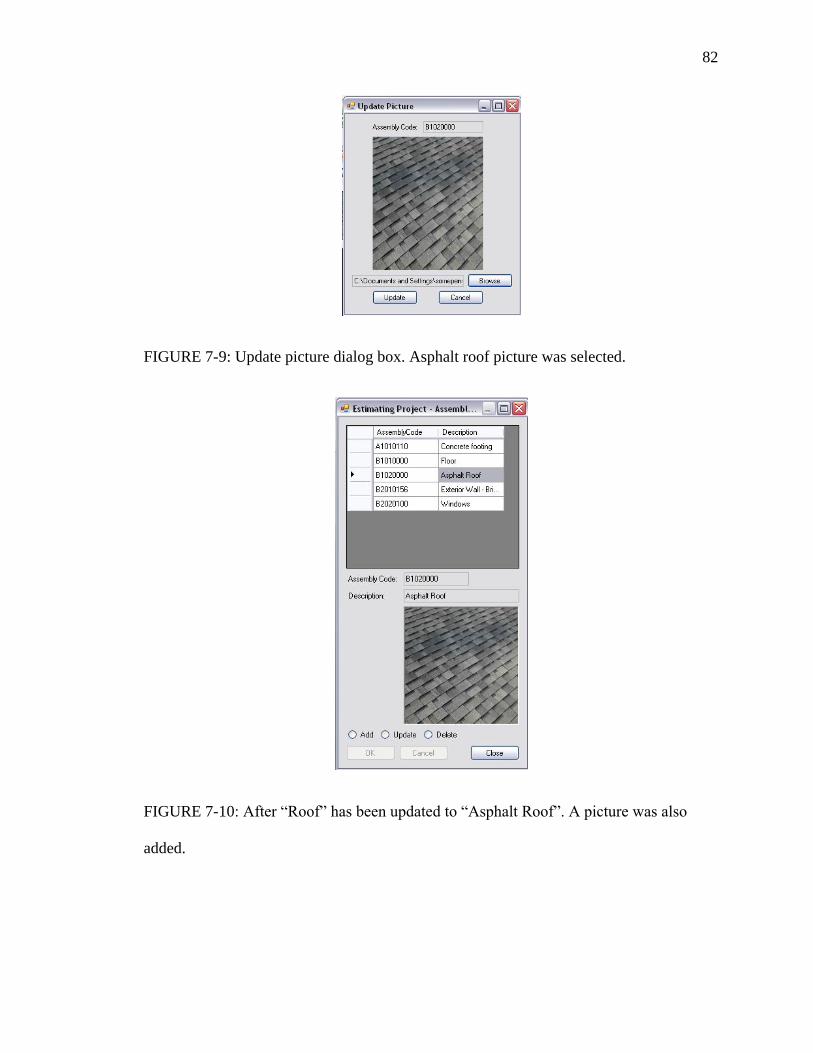
82
FIGURE 7-9: Update picture dialog box. Asphalt roof picture was selected.
FIGURE 7-10: After “Roof” has been updated to “Asphalt Roof”. A picture was also
added.
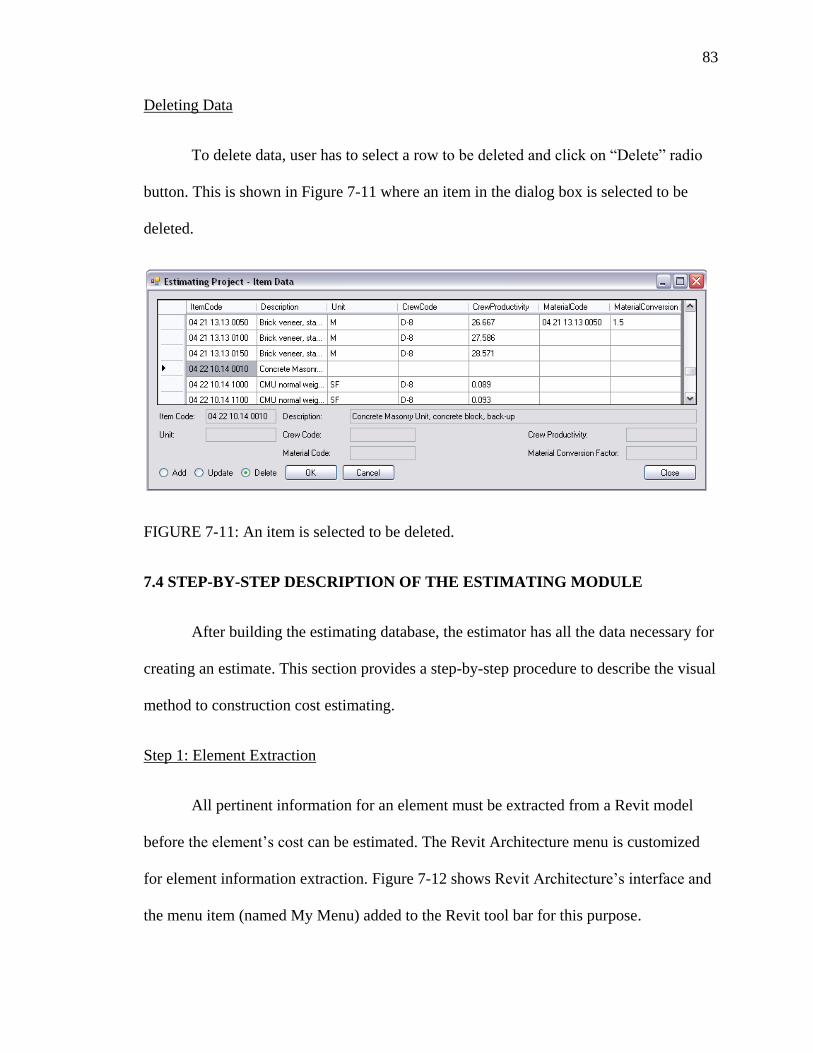
83
Deleting Data
To delete data, user has to select a row to be deleted and click on “Delete” radio
button. This is shown in Figure 7-11 where an item in the dialog box is selected to be
deleted.
FIGURE 7-11: An item is selected to be deleted.
7.4 STEP-BY-STEP DESCRIPTION OF THE ESTIMATING MODULE
After building the estimating database, the estimator has all the data necessary for
creating an estimate. This section provides a step-by-step procedure to describe the visual
method to construction cost estimating.
Step 1: Element Extraction
All pertinent information for an element must be extracted from a Revit model
before the element’s cost can be estimated. The Revit Architecture menu is customized
for element information extraction. Figure 7-12 shows Revit Architecture’s interface and
the menu item (named My Menu) added to the Revit tool bar for this purpose.
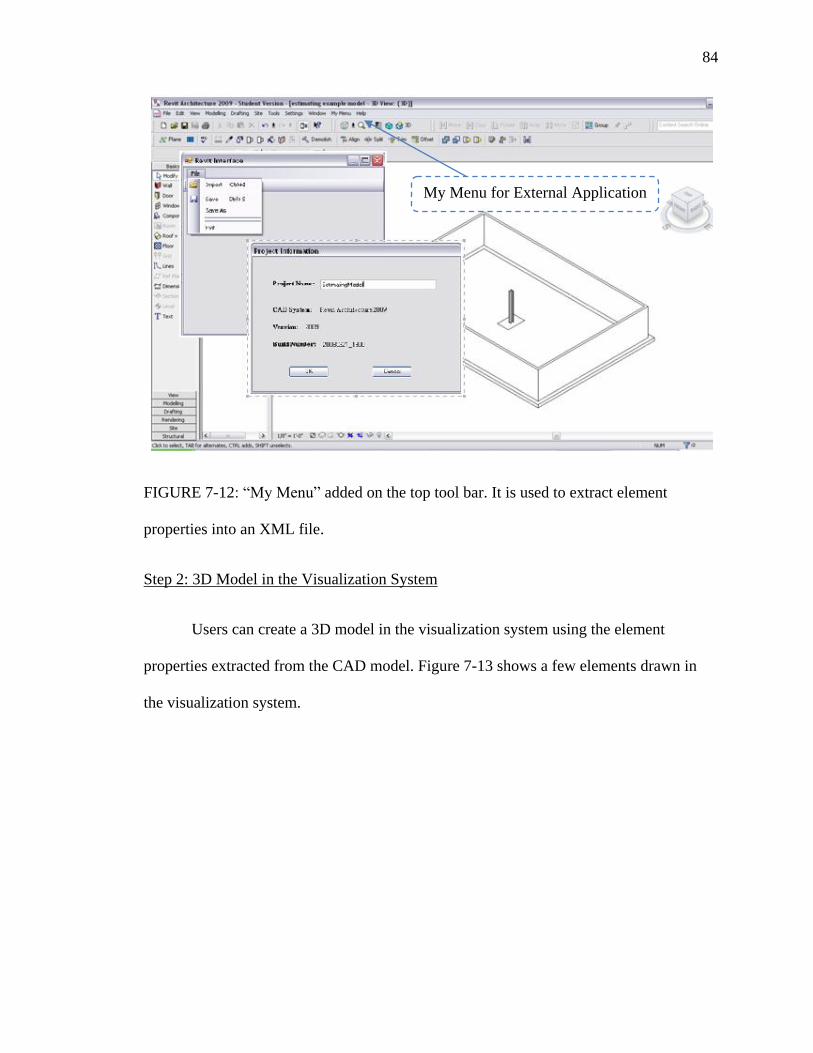
84
FIGURE 7-12: “My Menu” added on the top tool bar. It is used to extract element
properties into an XML file.
Step 2: 3D Model in the Visualization System
Users can create a 3D model in the visualization system using the element
properties extracted from the CAD model. Figure 7-13 shows a few elements drawn in
the visualization system.
My Menu for External Application
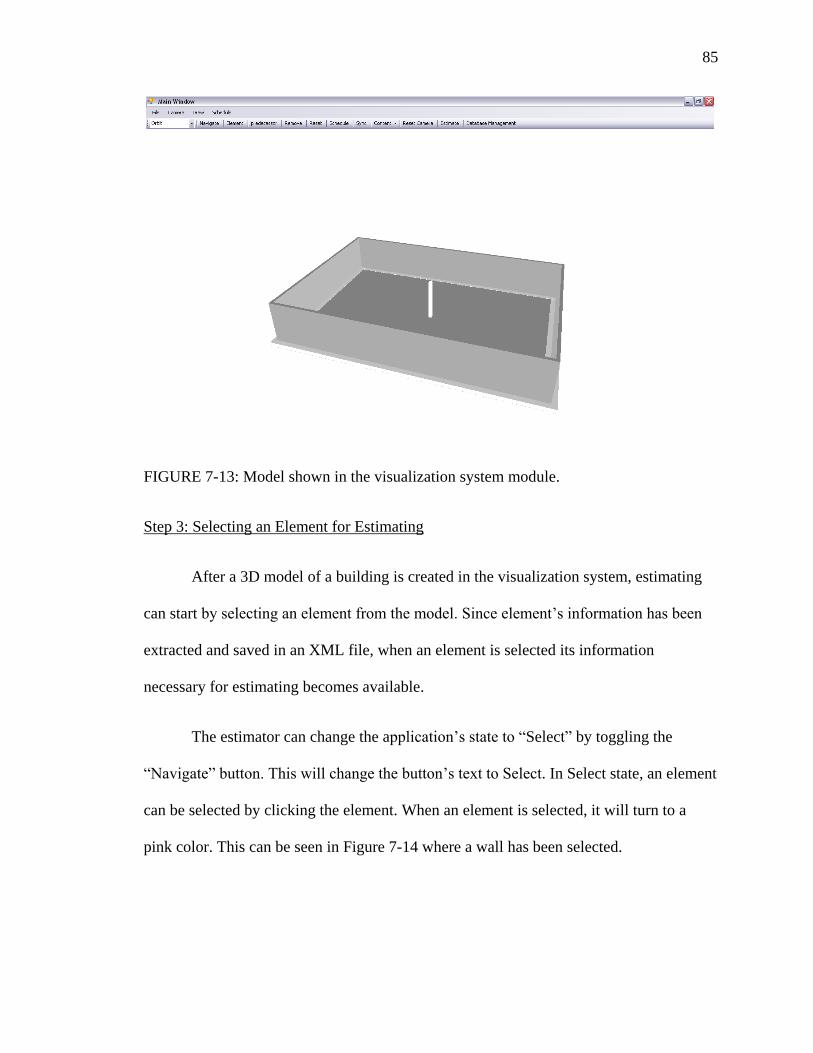
85
FIGURE 7-13: Model shown in the visualization system module.
Step 3: Selecting an Element for Estimating
After a 3D model of a building is created in the visualization system, estimating
can start by selecting an element from the model. Since element’s information has been
extracted and saved in an XML file, when an element is selected its information
necessary for estimating becomes available.
The estimator can change the application’s state to “Select” by toggling the
“Navigate” button. This will change the button’s text to Select. In Select state, an element
can be selected by clicking the element. When an element is selected, it will turn to a
pink color. This can be seen in Figure 7-14 where a wall has been selected.
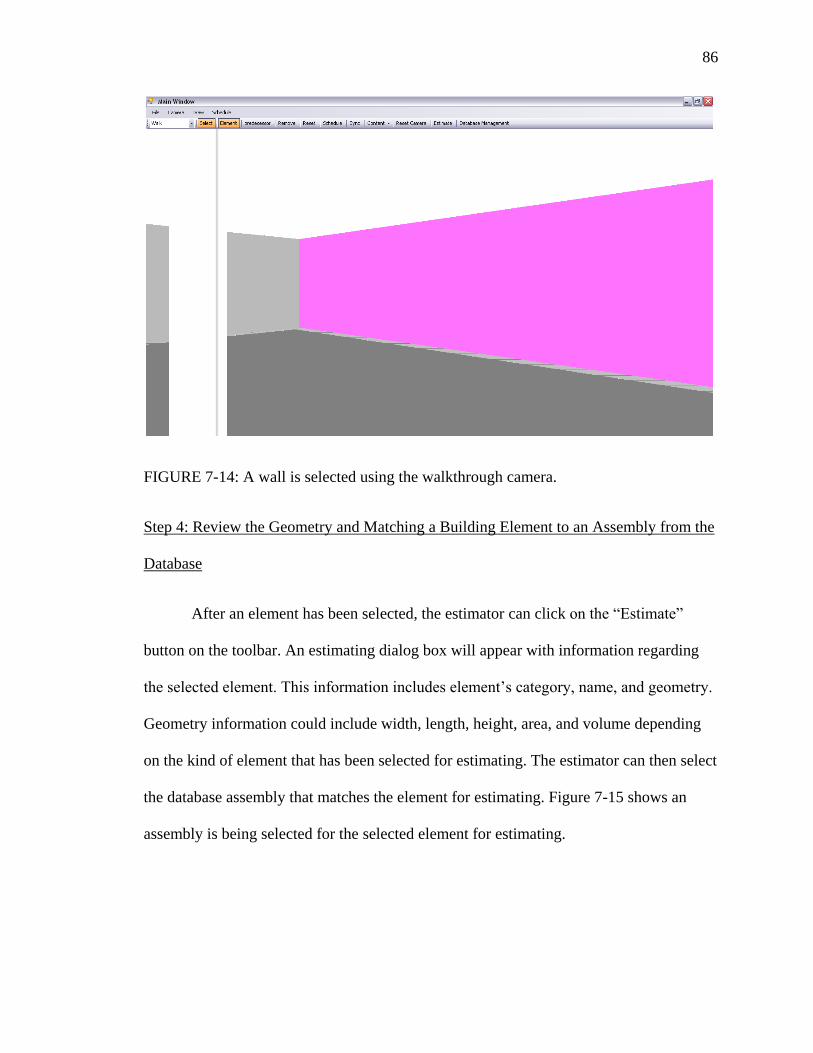
86
FIGURE 7-14: A wall is selected using the walkthrough camera.
Step 4: Review the Geometry and Matching a Building Element to an Assembly from the
Database
After an element has been selected, the estimator can click on the “Estimate”
button on the toolbar. An estimating dialog box will appear with information regarding
the selected element. This information includes element’s category, name, and geometry.
Geometry information could include width, length, height, area, and volume depending
on the kind of element that has been selected for estimating. The estimator can then select
the database assembly that matches the element for estimating. Figure 7-15 shows an
assembly is being selected for the selected element for estimating.
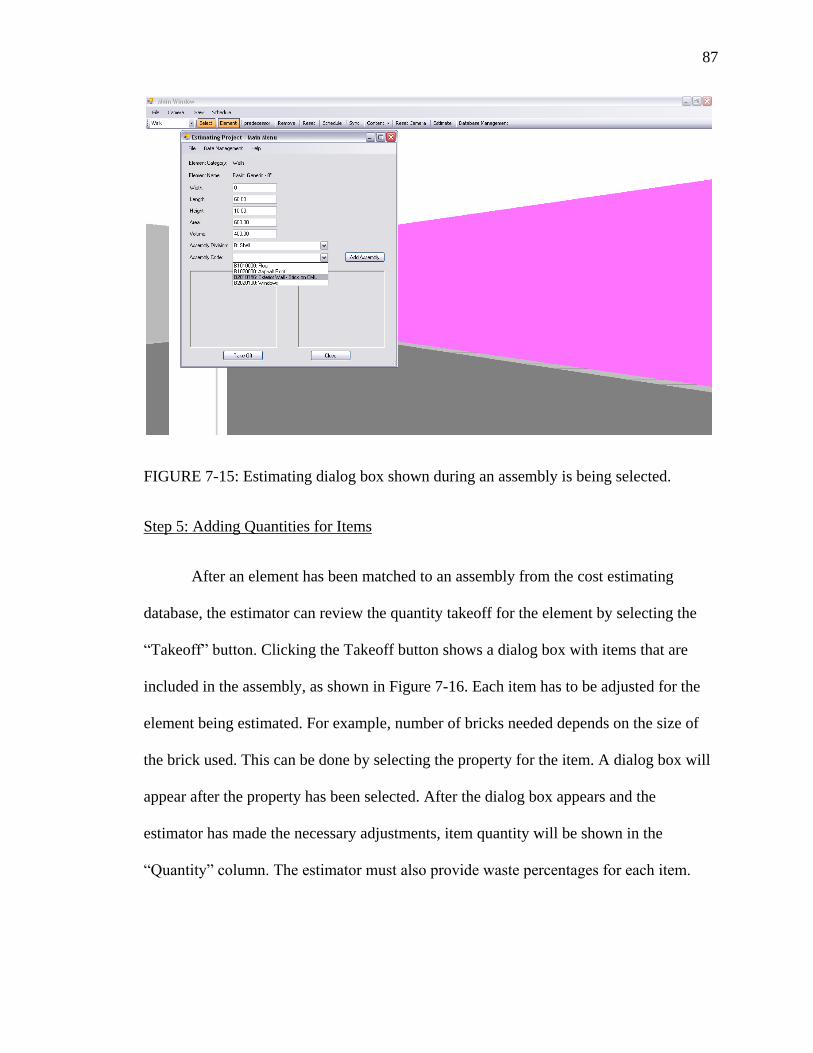
87
FIGURE 7-15: Estimating dialog box shown during an assembly is being selected.
Step 5: Adding Quantities for Items
After an element has been matched to an assembly from the cost estimating
database, the estimator can review the quantity takeoff for the element by selecting the
“Takeoff” button. Clicking the Takeoff button shows a dialog box with items that are
included in the assembly, as shown in Figure 7-16. Each item has to be adjusted for the
element being estimated. For example, number of bricks needed depends on the size of
the brick used. This can be done by selecting the property for the item. A dialog box will
appear after the property has been selected. After the dialog box appears and the
estimator has made the necessary adjustments, item quantity will be shown in the
“Quantity” column. The estimator must also provide waste percentages for each item.
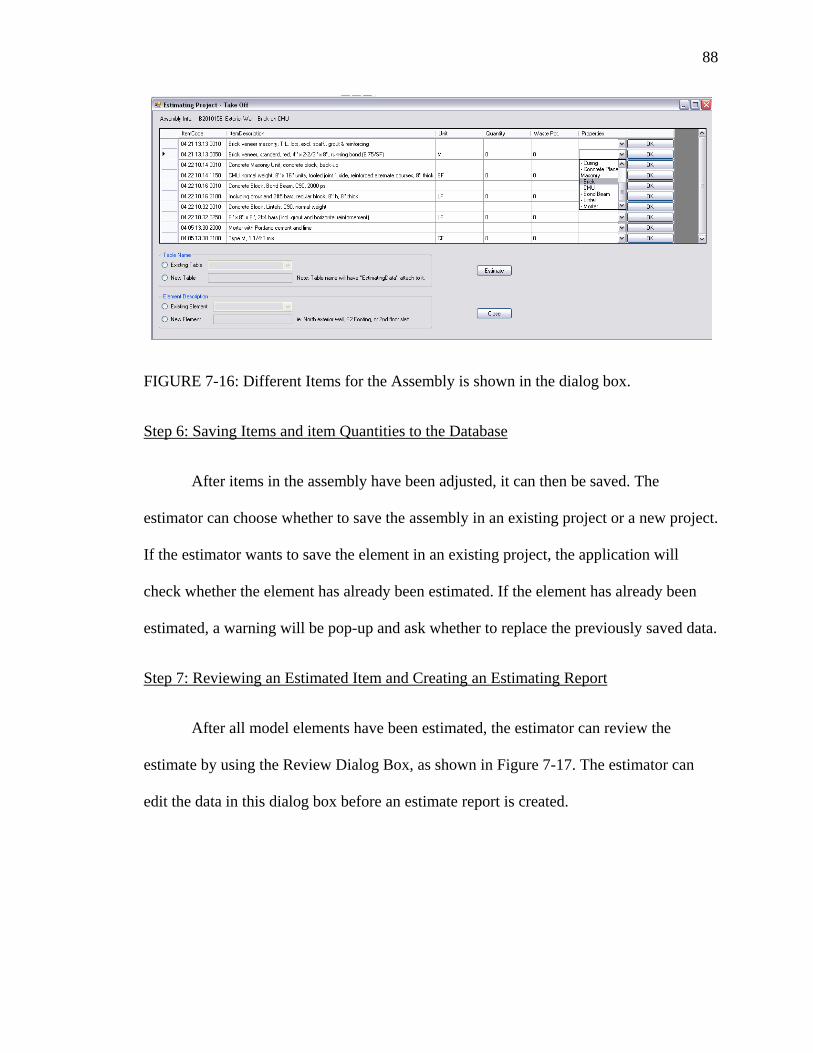
88
FIGURE 7-16: Different Items for the Assembly is shown in the dialog box.
Step 6: Saving Items and item Quantities to the Database
After items in the assembly have been adjusted, it can then be saved. The
estimator can choose whether to save the assembly in an existing project or a new project.
If the estimator wants to save the element in an existing project, the application will
check whether the element has already been estimated. If the element has already been
estimated, a warning will be pop-up and ask whether to replace the previously saved data.
Step 7: Reviewing an Estimated Item and Creating an Estimating Report
After all model elements have been estimated, the estimator can review the
estimate by using the Review Dialog Box, as shown in Figure 7-17. The estimator can
edit the data in this dialog box before an estimate report is created.
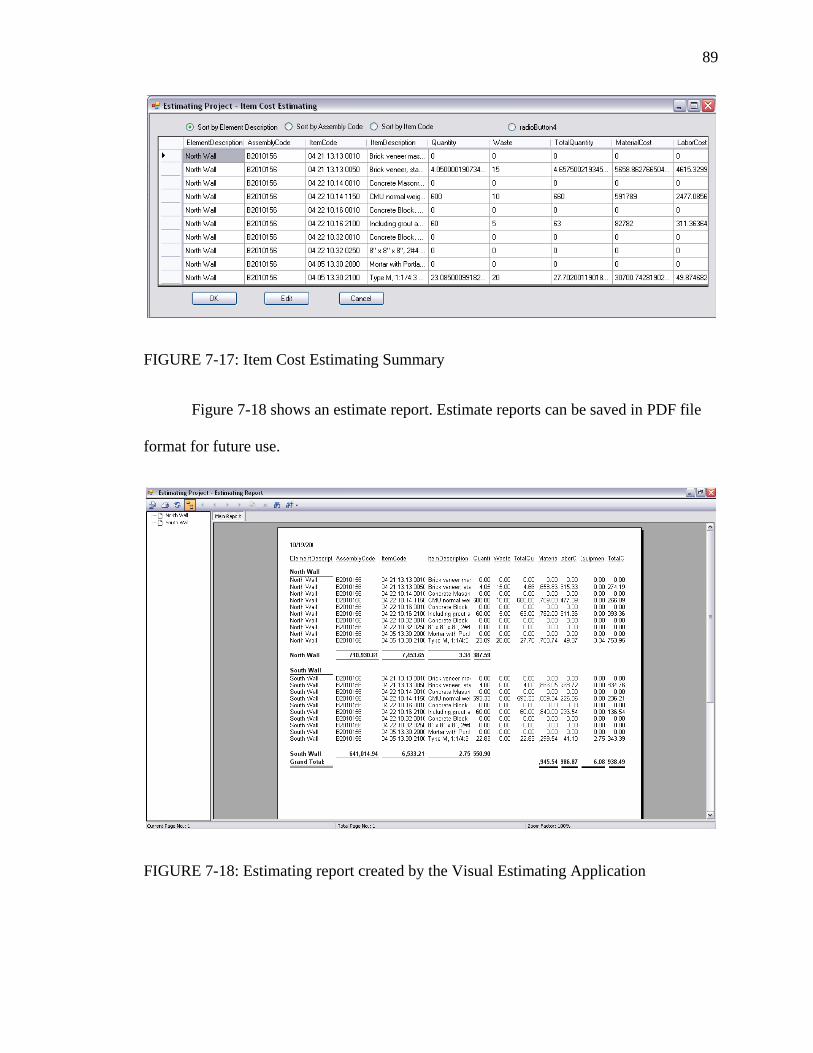
89
FIGURE 7-17: Item Cost Estimating Summary
Figure 7-18 shows an estimate report. Estimate reports can be saved in PDF file
format for future use.
FIGURE 7-18: Estimating report created by the Visual Estimating Application
90
CHAPTER 8
SUMMARY, CONTRIBUTIONS, LIMITATIONS, AND FUTURE RESEARCH
This chapter provides a brief description of research summary, contributions,
limitations, and recommendations for future research in the area of visual construction
cost estimating.
8.1 RESEARCH SUMMARY
The goal of this research was to make the process of construction cost estimating
simpler and more intuitive. It also introduced the use of visualization in estimating. The
developed application digitally transfers project information from a BIM model to the
estimating application; this reduces the manual data entry which is a very time
consuming process. This study provided a visual approach for estimating that allows an
estimator to walk inside a virtual building and select elements for estimating
interactively.
The developed Visual Estimating Application helps ease the estimating process
by utilizing 3D CAD models and information extracted from a 3D CAD model. A
visualization module is used to help the estimator navigate and interact with the model. A
cost estimating database is used to store cost data for the Visual Estimating Application.
Although several database models can be used for storing cost data, the relational
database model was adopted in this study.
The developed visualization module interfaces with Revit Architecture using
Revit API via C# programming language. The visualization module extracts from a Revit
91
model not only a building element’s geometry, but also element material properties. The
visualization module uses Microsoft DirectX graphical library to generate a virtual
prototype of the project.
The Visual Estimating Application matches an element extracted from a Revit
model to an assembly from the cost estimating database for preparing an estimate. An
estimate report could also be generated.
Although some of the tedious estimating tasks have been eliminated, the estimator
input is still a must. Different project has different methods of construction and
circumstances. Even though computers can assist some process during estimating, it
could only do so much while judgment and experience of estimator is also needed.
8.2 RESEARCH CONTRIBUTIONS
The following are the main research contributions:
1. Visual Interface for Cost Estimating: Visual approach to construction cost
estimating provides visual aids to the estimator, making the estimating process
more intuitive and simple. This application transfers the necessary information
from a BIM model to the estimating software. This eliminates the tedious and
time consuming process of manual data entry quantity takeoff.
2. Visual Cost Estimating as an Educational Tool: The Visual Estimating
Application can be used as an effective educational tool for students who have
no experience in construction cost estimating. According to Karshenas (2009),
during estimating, “students must perform less repetitive, mechanical
92
activities and spend more time observing, thinking, discussing, reflecting, and
solving problems. This requires:
i. Making access to cost estimating information intuitive and fast.
ii. Automating extraction of building element geometry and
material from CAD models.
iii. Exposing student to as many actual construction operations as
possible.”
3. Foundation for Future Research and Improvements: This research provides a
good foundation for developing not only an educational tool, but also a new
way to approach cost estimating commercially. Future research and
improvements for the Visual Estimating Application is provided in more
detail in section 8.4.
8.3 RESEARCH LIMITATIONS
1. Estimating the cost of a building project consists of determining the cost of a
large number of building elements made of different material. However, the
database was developed to a limited number of elements such as concrete and
masonry show the methodology of the Visual Estimating Application.
2. There are many BIM packages available in today’s market. One of the leading
BIM software company is Autodesk. This study is primarily focused on
Autodesk Revit Architecture. Although Revit Structure and Revit MEP are
available as part of Autodesk BIM package, they were not included in this
study.
93
3. Extraction of information from a 3D CAD model provides the Visual
Estimating Application with geometry and materials information needed for
cost estimate. However, elements extracted from Revit Architecture do not
contain information that can be used to automatically match to an assembly
provided by the cost estimating database. This process still requires manual
input from an estimator.
4. Since this is a visual approach to construction cost estimating, estimating is
done by navigating and selecting elements from inside a virtual building.
Navigating a 3D model using a 2-button mouse maybe difficult for some
users. A navigating device such as a 3D mouse may be more helpful for
navigation.
8.4 FUTURE RESEARCH
Future improvements to the Visual Estimating Application could be implemented
as follows:
1. Elements from the 3D CAD model have to be matched to an assembly from
the cost estimating database. Automating this process could provide the
estimator with an easier task of searching for an assembly in the database.
2. Since cost of equipments and materials changes on a regular basis. Cost
estimating database should be updated automatically from remote resources
such as suppliers’ web sites. This would help save time by not having to
update individual entries in the cost estimating database.

94
3. Computer network capability can be added to facilitate collaboration among
estimators. For example, an estimator can work on project walls while another
estimator works on footings.
95
BIBLIOGRAPHY
Agarwal, Vidya Vrat, James Huddleston, Ranga Raghuram, Syed Fahad Gilani, Jacob
Hammer Pedersen, and Jon Reid. Beginning C# 2008 Databases: from Novice to
Professional. Berkeley, CA: Apress, 2008. Print.
"Annual Prevailing Wage Rate Survey Data, Milwaukee County." Wisconsin Department
of Workforce Development. Web. 31 Oct. 2009.
<http://www.dwd.state.wi.us/pwfnl/PwfnlDetail.asp>.
"ArchiCAD 13 - Overview." Graphisoft Home Page. Web. 10 Feb. 2009.
<http://www.graphisoft.com/archicad>.
Azhar, Salman, Abid Nadeem, Johnny Mok, and Brian Leung. "Building Information
Modeling (BIM): A New Paradigm for Visual Interactive Modeling and Simulation
for Construction Projects." Advancing and Integrating Construction Education,
Research & Practice. Proc. of First International Conference on Construction in
Developing Countries, Karachi, Pakistan. 2008. Print.
Azhar, Salman, Michael Hein, and Blake Sketo. "Building Information Modeling:
Benefits, Risks and Challenges." Proc. of The 44th ASC National Conference,
Auburn, Alabama. 2008. Print.
Bagui, Sikha, and Richard Earp. Database Design Using Entity-relationship Diagrams.
Boca Raton: Auerbach, 2003. Print.
Boland, Jr., Richard J., Fred Collopy, Julia Grant, and Lin Zhao. "Virtual Prototyping of
Financial Flows as a Form of Management Control." Virtual Futures for Design,
Construction & Procurement. Ed. Peter Brandon and Tuba Kocaturk. Malden:
Blackwell, 2008. Print.
Boussabaine, A.H., B. Grew, S. Cowland, and P. Slater. "A Virtual Reality Model for
Site Layout." Novel Design and Information Technology Applications for Civil and
Structural Engineering. Ed. B. Kumar and B.H.V. Topping. Edinburgh: Civil-
Comp, 1999. Print.
Brook, Martin. Estimating and Tendering for Construction Work. 4th ed. Burlington:
Butterworth-Heinemann, 2008. Print.
Bryson, Steve. "Direct Manipulation in Virtual Reality." The Visualization Handbook.
Ed. Charles D. Hansen and Chris R. Johnson. Burlington: Elsevier Butterworth-
Heinemann, 2005. Print.
"Building Information Modeling - Bentley Architecture." Bentley Systems, Incorporated:
Providing Software for the Lifecycle of the World?s Infrastructure. Web. 10 Feb.
2009. <http://www.bentley.com/en-US/Products/Bentley+Architecture>.
96
"The Building Information Modeling: A Look at Graphisoft's Virtual Building Concept."
Cyon Research - Clarity In Sight. A Cyon Research White Paper. Web. 15 Apr.
2009. <http://cyonresearch.com/News/tabid/58/newsid382/67/Default.aspx>.
Carter, John. The Relational Database. London: Chapman & Hall, 1995. Print.
Choi, Ying-Kit. Principles of Applied Civil Engineering Design. New York: American
Society of Civil Engineers, 2004. Print.
The Construction Specifications Institute Site. Web. 18 Apr. 2009.
<http://www.csinet.org/s_csi-docs/9400/9361.pdf>.
"The Contractor's Guide to BIM." BIMGuide.pdf. Associated General Contractor of
America. Web. 8 Oct. 2009. <www.agcnebuilders.com/documents/BIMGuide.pdf>.
Day, Alan. Digital Building. Oxford: Laxton's, 1997. Print.
Dewson, Robin. Beginning SQL Server 2008 for Developers: from Novice to
Professional. Berkeley, CA: Apress, 2008. Print.
Dzambazova, Tatjana, Greg Demchak, and Eddy Krygiel. Mastering Revit Architecture
2008 (Mastering). San Francisco: Sybex, 2007. Print.
Eastman, Chuck, Paul Teicholz, Rafael Sacks, and Kathleen Liston. BIM Handbook A
Guide to Building Information Modeling for Owners, Managers, Designers,
Engineers and Contractors. New York: Wiley, 2008. Print.
Fischer, Martin. "Reshaping the Life Cycle Process with Virtual Design and Construction
Menthods." Virtual Futures for Design, Construction & Procurement. Ed. Peter
Brandon and Tuba Kocaturk. Malden: Blackwell, 2008. Print.
Fisher, Norman, Richard Barlow, Naomi Garnett, Edward Finch, and Robert Newcombe.
Project Modelling in Construction --seeing Is Believing. London: Thomas Telford
Pub., 1997. Print.
Gallagher, Richard S. "Future Trends in Scientific Visualization." Computer
Visualization: Graphics Techniques for Scientific and Engineerign Analysis. Ed.
Richard S. Gallagher. Salem: CRC, 1995. Print.
Gallagher, Richard S. "Scientific Visualization: An Engineering Perspective." Computer
Visualization: Graphics Techniques for Scientific and Engineerign Analysis. Ed.
Richard S. Gallagher. Salem: CRC, 1995. Print.
Gardiner, Margaret M., and Bruce Christie. "Introduction." Applying Cognitive
Psychology to User-Interface Design. Ed. Margaret M. Gardiner and Bruce
Christie. Chichester: Wiley, 1987. Print.
Gehry Technologies. Web. 10 Feb. 2009. <http://www.gehrytechnologies.com>.
Gutierrez, Mario A. Gutie?rrez, Frederic Vexo, and Daniel Thalmann. Stepping into
Virtual Reality. London: Springer-Verlag, 2008. Print.
97
Hadikusumo, B.H.W., and S. Rowlinson. "Design-For-Safety-Process (DFSP) Utilizing
Virtual Reality as a Representation Tool." Novel Design and Information
Technology Applications for Civil and Structural Engineering. Ed. B. Kumar and
B.H.V. Topping. Edinburgh: Civil-Comp, 1999. Print.
Hamilton, Andy, Hongxia Wang, Joseph H.M. Tah, Ali Tanyer, Steve Curwell, Amanda
Jane Marshall-Ponting, Yonghui Song, and Yusuf Arayici. "Integration of Building
and Urban ND Data to Support Intelligent Cities." Constructing the Future ND
Modelling. Ed. Ghassan Aouad, Angela Lee, and Song Wu. New York: Taylor &
Francis, 2007. Print.
Hammond, Nick, Margaret M. Gardiner, Bruce Christie, and Chris Marshall. "The Role
of Cognitive Psychology in User-Interface Design." Applying Cognitive Psychology
to User-Interface Design. Ed. Margaret M. Gardiner and Bruce Christie.
Chichester: Wiley, 1987. Print.
Hardin, Brad. BIM and Construction Management Proven Tools, Methods, and
Workflows. Indianapolis, Ind: Wiley Technology Pub., 2009. Print.
Holm, Leonard, John E. Schaufelberger, Dennis Griffin, and Thomas Cole. Construction
Cost Estimating Process and Practices. Upper Saddle River: Prentice Hall, 2005.
Print.
Jrade, Ahmad, and Sabah Alkass. "Computer-Integrated System for Estimating the Costs
of Building Projects." Journal of Architectural Engineering 13.4 (2007). Print.
Karlshoj, Jan. "Data Visualization: a Danish Example." Constructing the Future ND
Modelling. Ed. Ghassan Aouad, Angela Lee, and Song Wu. New York: Taylor &
Francis, 2007. Print.
Karshenas, Saeed, and Joey Tse. "A Case Based Reasoning Approach to Construction
Cost Estimating." Computing in Civil Engineering. Proc. of International Workshop
on Information Technology in Civil Engineering, Washington D.C. Reston, VA:
ASCE, 2002. Print.
Karshenas, Saeed. "Cost Estimating in the Age of 3-D CAD Software and Object
Databases." Brodening Perspectives. Proc. of Construction Research Congress
2005: Broadening Perspectives, San Diego, CA. Reston, VA: ASCE, 2005. Print.
Karshenas, Saeed. "Visualization And Multimedia Applications In Cost Estimating
Educations." Building A Sustainable Future. Proc. of Construction Research
Congress 2009: Building a Sustainable Future, Seattle, WA. Reston, VA: ASCE,
2009. Print.
Khemlani, Lachmi. "Visual Estimating - Extending BIM to Construction: AECbytes
"Building the Future" Article." AECbytes: Analysis, Research, and Reviews of AEC
Technology. Web. 21 Mar. 2009.
<http://www.aecbytes.com/buildingthefuture/2006/VisualEstimating.html>.
98
Koskela, Lauri, and Gregory Howell. "The Underlying Theory of Project Management Is
Obsolete." Proc. of The PMI Research Conference. 2002. Print.
Krygiel, Eddy, Greg Demchak, and Tatjana Dzambazova. Introducing Revit Architecture
2008. San Francisco: Sybex, 2007. Print.
Laitinen, Jarmo. "Lesson Learned from Ten Years of Conceptualising, Developing,
Introducing and Using ND BIMs." Constructing the Future ND Modelling. Ed.
Ghassan Aouad, Angela Lee, and Song Wu. New York: Taylor & Francis, 2007.
Print.
Langford, David, and Arkady Retik. Computer Integrated Planning and Design for
Construction. Nashville: Thomas Telford Ltd, 2001. Print.
Levy, Sidney M. Design-Build Project Delivery. New York: McGraw-Hill, 2006. Print.
Liberty, Jesse. Programming C#. Sebastopol: O'Reilly, 2005. Print.
Loftin, R. Bowen, Jim X. Chen, and Larry Rosenblum. "Visualization Using Virtual
Reality." The Visualization Handbook. Ed. Charles D. Hansen and Chris R.
Johnson. Burlington: Elsevier Butterworth-Heinemann, 2005. Print.
McMenemy, Karen, and Stuart Ferguson. A Hitchhiker's Guide to Virtual Reality.
Wellesley: AK Peters, 2007. Print.
Miller, Kevin R., and Thomas H. Mills. "Teaching PaperlessDetailed Quantity Take-off
and Estimating." Proc. of The 38th Annual ASC Conference, Virginia Polytechnic
Institue and State University, Blacksburg, VA. 2002. 33-40. Print.
"Milwaukee County Wage Rate Survey Data." ACEA: Allied Construction Employers
Association of Southeast Wisconsin. Web. 12 Feb. 2008.
<http://www.buildacea.org>.
Naji, Khalid. "Construction Safety." Constructing the Future ND Modelling. Ed. Ghassan
Aouad, Angela Lee, and Song Wu. New York: Taylor & Francis, 2007. Print.
Neil, James M. Construction Cost Estimating for Project Control. Englewood Cliffs, N.J:
Prentice-Hall, 1982. Print.
O'Connell, Kenneth. "Visual Ways of Knowing, Thinking, and Interacting." Interactive
Learning Through Visualization The Impact of Computer Graphics in Education.
Ed. Steve Cunningham and Roger Hubbold. Berlin: Springer-Verlag, 1992. Print.
Pepke, Eric. "Animation and Examination of Behavior Over Time." Computer
Visualization: Graphics Techniques for Scientific and Engineerign Analysis. Ed.
Richard S. Gallagher. Salem: CRC, 1995. Print.
Popescu, Calin, Kan Phaobunjong, and Nuntapong Ovararin. Estimating Building Costs.
New York: Marcel Dekker, 2003. Print.
99
Powell, Joe. The New Competitiveness in Design and Construction 12 Strategies That
Will Drive the 21st-Century's Most Successful Firms. New York: Wiley, 2008.
Print.
Pratt, David. Fundamentals of Construction Estimating. Clifton Park: Thomson Delmar
Learning, 2004. Print.
"Products | Beck Technology - Innovation in All Dimensions." Home | Beck Technology -
Innovation in All Dimensions. Web. 10 Feb. 2009. <http://www.beck-
technology.com/product_dp.asp>.
Rafiq, Y., M. Beck, I. Packham, and S. Denhan. "Evolutionary Computation and
Visualisation as Decision Support Tools for Conceptual Building Design."
Innovation in Civil and Structural Engineering Computing. Ed. B. H.V. Topping.
Stirling: Saxe-Coburg Publications, 2005. Print.
Reffat, Rabee M. "Three-dimensional CAD Models: Integrating Design and
Construction." Design and Construction: Building in Value. Ed. Rick Best and
Gerard De Valence. Woburn: Butterworth-Heinemann, 2002. Print.
Retik, A. "Visualization for Decision Making in Construction Planning." Visualization
and Intelligent Design in Engineering and Architecture. Ed. J. J. Connor, S.
Hernandez, T.K.S. Murthy, and H. Power. Boston: Computational Mechanics
Publications, 1993. Print.
Revit API. Program Documentation. Revit Architecture Building Information Modeling
Software - Autodesk. Web. 12 Jan. 2009. <http://www.autodesk.com/revit>.
"Revit Architecture Building Information Modeling Software - Autodesk." Autodesk - 2D
and 3D Design and Engineering Software for Architecture, Manufacturing, and
Digital Entertainment. Web. 10 Feb. 2009. <http://www.autodesk.com/revit>.
Richards, Larry G. "Applications of Engineering Visualization to Analysis and Design."
Computer Visualization: Graphics Techniques for Scientific and Engineerign
Analysis. Ed. Richard S. Gallagher. Salem: CRC, 1995. Print.
Riese, Martin. "One Island East, Hong Kong: A Case Study in Construction Virtual
Prototyping." Virtual Futures for Design, Construction & Procurement. Ed. Peter
Brandon and Tuba Kocaturk. Malden: Blackwell, 2008. Print.
Sabol, Louise. "Challenges in Cost Estimating with Building Information Modeling."
News : Design + Construction Strategies. Web. 15 Sept. 2009.
<http://www.dcstrategies.net/news.php>.
Schroeder, William J., and Kenneth M. Martin. "Overview of Visualization." The
Visualization Handbook. Ed. Charles D. Hansen and Chris R. Johnson. Burlington:
Elsevier Butterworth-Heinemann, 2005. Print.
100
Schroeder, William J., and Kenneth M. Martin. "The Visualization Toolkit." The
Visualization Handbook. Ed. Charles D. Hansen and Chris R. Johnson. Burlington:
Elsevier Butterworth-Heinemann, 2005. Print.
Shephard, Mark S., and William J. Schroeder. "Analysis Data for Visualization."
Computer Visualization: Graphics Techniques for Scientific and Engineerign
Analysis. Ed. Richard S. Gallagher. Salem: CRC, 1995. Print.
Sherman, William R., and Alan B. Craig. Understanding Virtual Reality Interface,
Application, and Design (The Morgan Kaufmann Series in Computer Graphics).
Greensboro: Morgan Kaufmann, 2003. Print.
Shirley, Peter. Fundamentals of Computer Graphics. Natick: AK Peters, 2002. Print.
Smith, Dana K., and Michael Tardif. Building Information Modeling A Strategic
Implementation Guide for Architects, Engineers, Constructors, and Real Estate
Asset Managers. New York: Wiley, 2009. Print.
Sun, Ming, and Rob Howard. Understanding IT in Construction. New York, NY: Spon,
2003. Print.
Te'eni, Dov, Jane M. Carey, and Ping Zhang. Human-Computer Interaction Developing
Effective Organizational Information Systems. New York: Wiley, 2007. Print.
"Tekla - Solutions." Tekla. Web. 10 Feb. 2009.
<http://www.tekla.com/US/SOLUTIONS/Pages/Default.aspx>.
Thorpe, Anthony, Richard A. Buswell, Rupert C. Soar, and Alistair G.F. Gibb. "VR or
PR: Virtual or Physical Reality?" Virtual Futures for Design, Construction &
Procurement. Ed. Peter Brandon and Tuba Kocaturk. Malden: Blackwell, 2008.
Print.
Van Kempen, Jay R. Van. Construction-cost Estimating. Reston, Va: Reston Pub., 1983.
Print.
Vince, John. Introduction to Virtual Reality. New York: Springer, 2004. Print.
Williams, Trefor. Information Technologies for Construction Managers, Architects and
Engineers. Clifton Park: Thomson Delmar Learning, 2006. Print.
Zudilova-Seinstra, Elena, Tony Adriaansen, and Robert Van Liere. "Overview of
Interactive Visualization." Trends in Interactive Visualization: State-of-the-art
Survey. Ed. Elena Zudilova-Seinstra, Tony Adriaansen, and Robert Van Liere.
London: Springer, 2009. Print.
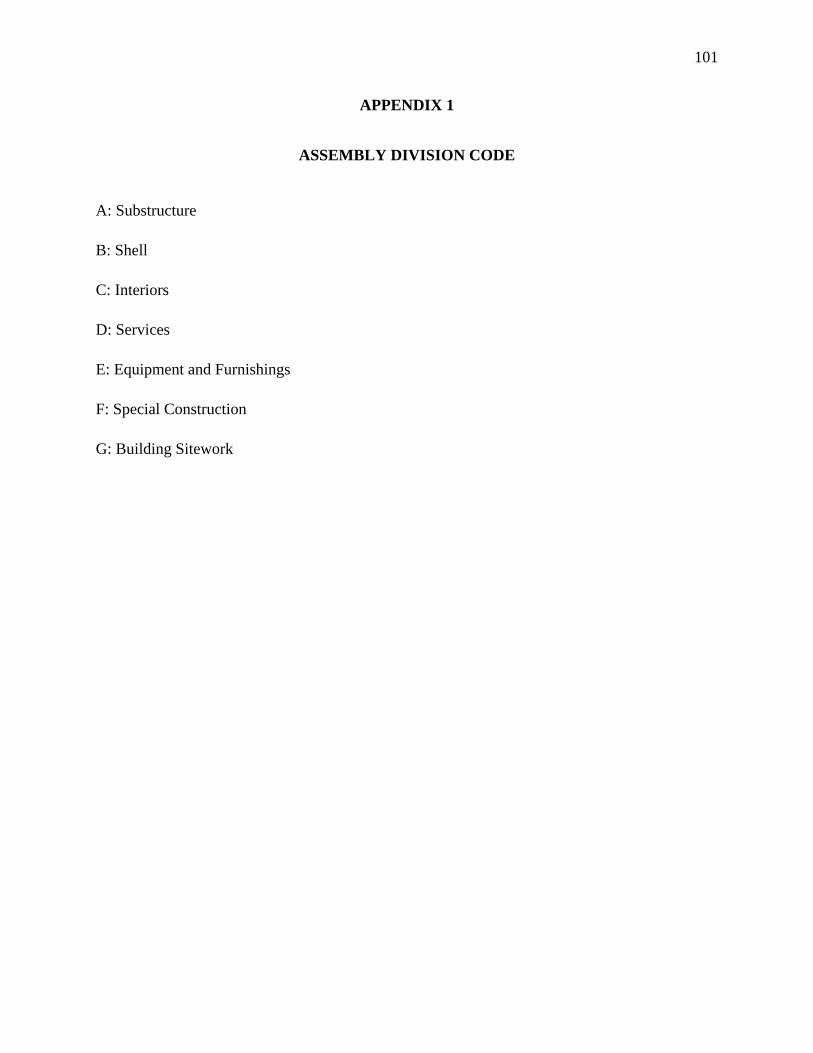
101
APPENDIX 1
ASSEMBLY DIVISION CODE
A: Substructure
B: Shell
C: Interiors
D: Services
E: Equipment and Furnishings
F: Special Construction
G: Building Sitework
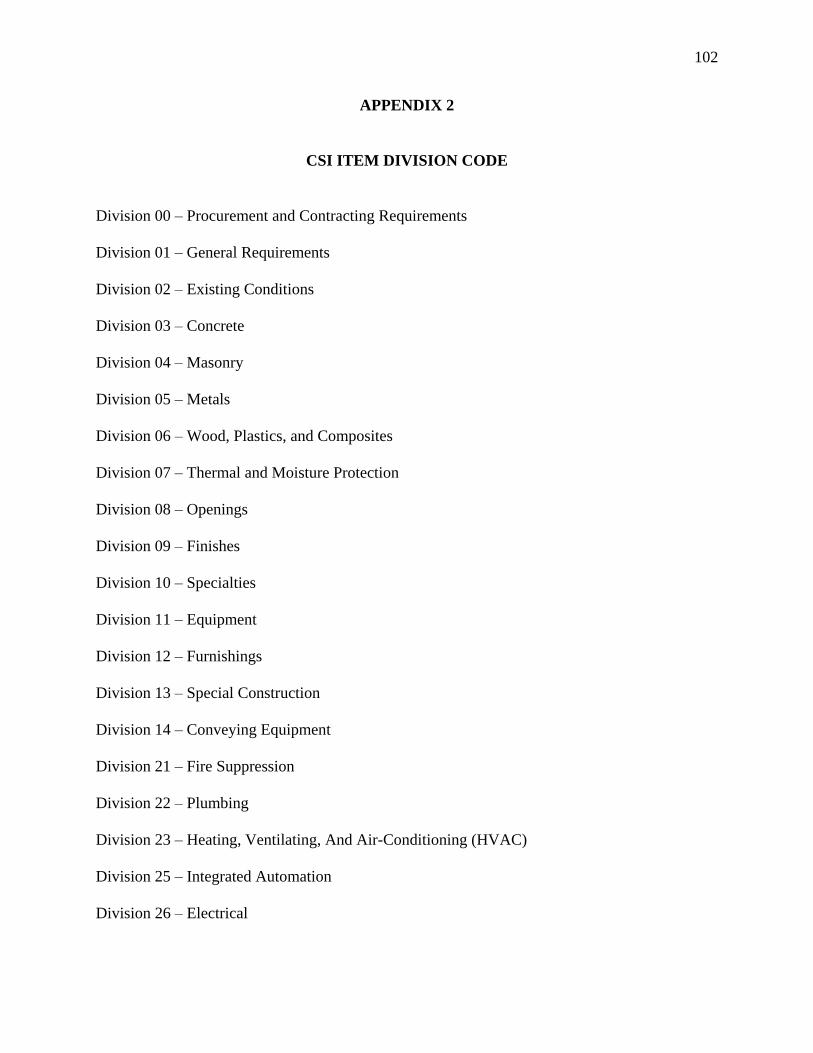
102
APPENDIX 2
CSI ITEM DIVISION CODE
Division 00 – Procurement and Contracting Requirements
Division 01 – General Requirements
Division 02 – Existing Conditions
Division 03 – Concrete
Division 04 – Masonry
Division 05 – Metals
Division 06 – Wood, Plastics, and Composites
Division 07 – Thermal and Moisture Protection
Division 08 – Openings
Division 09 – Finishes
Division 10 – Specialties
Division 11 – Equipment
Division 12 – Furnishings
Division 13 – Special Construction
Division 14 – Conveying Equipment
Division 21 – Fire Suppression
Division 22 – Plumbing
Division 23 – Heating, Ventilating, And Air-Conditioning (HVAC)
Division 25 – Integrated Automation
Division 26 – Electrical
103
Division 27 – Communications
Division 28 – Electronic Safety and Security
Division 31 – Earthwork
Division 32 – Exterior Improvements
Division 33 – Utilities
Division 34 – Transportation
Division 35 – Waterway and Marine Construction
Division 40 – Process Integration
Division 41 – Material Processing and Handling Equipment
Division 42 – Process Heating, Cooling, and Drying Equipment
Division 43 – Process Gas and Liquid Handling, Purification, and Storage Equipment
Division 44 – Pollution Control Equipment
Division 45 – Industry-Specific Manufacturing Equipment
Division 48 – Electrical Power Generation