A View of Colombian and Regional DCMs · Peru BBB+ Stable Colombia BBB Negative Panama BBB Stable...
27
Alejandro Bertuol Managing Director, Latin America ASOBANCARIA Medellín, August 2019 A View of Colombian and Regional DCMs
Transcript of A View of Colombian and Regional DCMs · Peru BBB+ Stable Colombia BBB Negative Panama BBB Stable...
Alejandro Bertuol
Managing Director, Latin America
ASOBANCARIA
Medellín, August 2019
A View of Colombian and Regional DCMs
1
2.0
2.2
2.4
2.6
2.8
3.0
3.2
3.4
2011 2012 2013 2014 2015 2016 2017 2018 2019F 2020F
(Mark
et exchange r
ate
weig
hts
, %
)
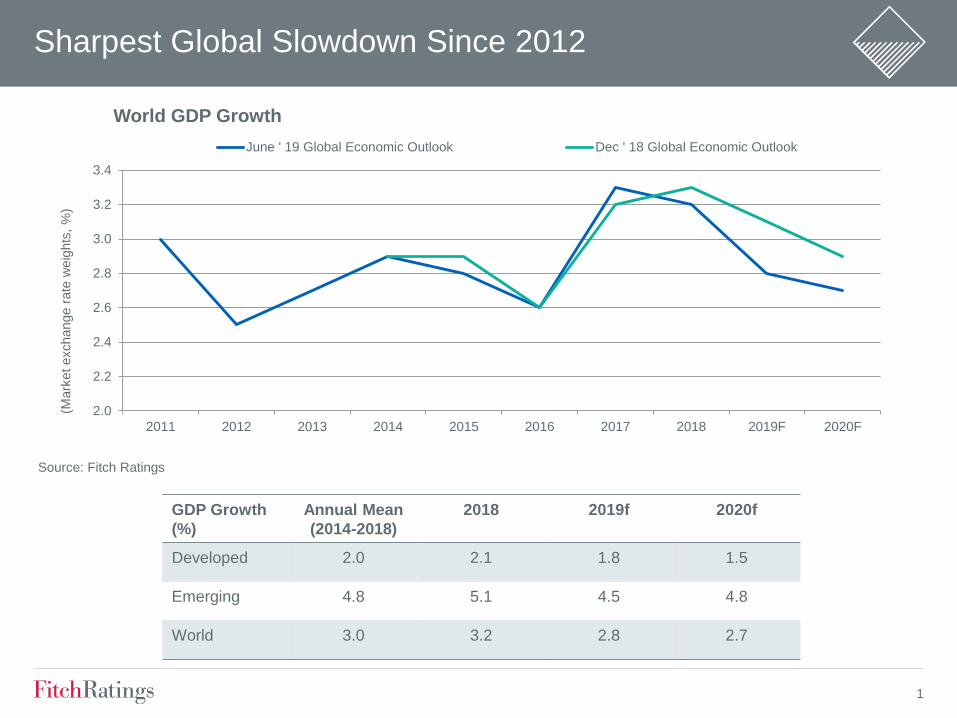
Source: Fitch Ratings
World GDP Growth
June ' 19 Global Economic Outlook Dec ' 18 Global Economic Outlook
Sharpest Global Slowdown Since 2012
GDP Growth
(%)
Annual Mean
(2014-2018)
2018 2019f 2020f
Developed 2.0 2.1 1.8 1.5
Emerging 4.8 5.1 4.5 4.8
World 3.0 3.2 2.8 2.7

2
World Growth in 2020 Revised Down in Fitch’s June GEO
-1.2
-1.0
-0.8
-0.6
-0.4
-0.2
0.0
0.2
0.4
Bra
zil
South
Afr
ica
Me
xic
o
South
Kore
a
Austr
alia
Ca
nad
a
Ru
ssia
India
(F
Y)
Germ
any
EM
Fra
nce
Indon
esia
Ita
ly
Tu
rkey
World
Japa
n
Un
ite
d S
tate
s
DM
Ch
ina
Spain
Sw
itzerl
and
Un
ite
d K
ing
dom
Euro
zone
Pola
nd
(Revis
ions s
ince M
ar
'19 G
EO
, p.p
.)
2019 2020
Source: Fitch Ratings
Revisions to Fitch GDP Growth Forecasts

3
LatAm Growth Underperforming EMs, World and US
-2
-1
0
1
2
3
4
5
6
7
8
201
0
201
1
201
2
201
3
201
4
201
5
201
6
201
7
201
8
201
9
202
0
(% GDP)
Largest Economies Dragging Down Regional Growth
Emerging Markets LatAm excl. Ven
Latam ex big 3, ex Ven Big 3
Source: Fitch Ratings
-2
-1
0
1
2
3
4
5
6
7
8
201
0
201
1
201
2
201
3
201
4
201
5
201
6
201
7
201
8
201
9
202
0
(% GDP)
Region Growing Below World and US since 2013
USA LatAm excl. Ven World
4
Growth Variance in 2019
-4
-2
0
2
4
6
8
10
Pan
am
a
Chile
Peru
Costa
Ric
a
Colo
mb
ia
Me
xic
o
Bra
zil
Arg
en
tin
a
(%yoy)
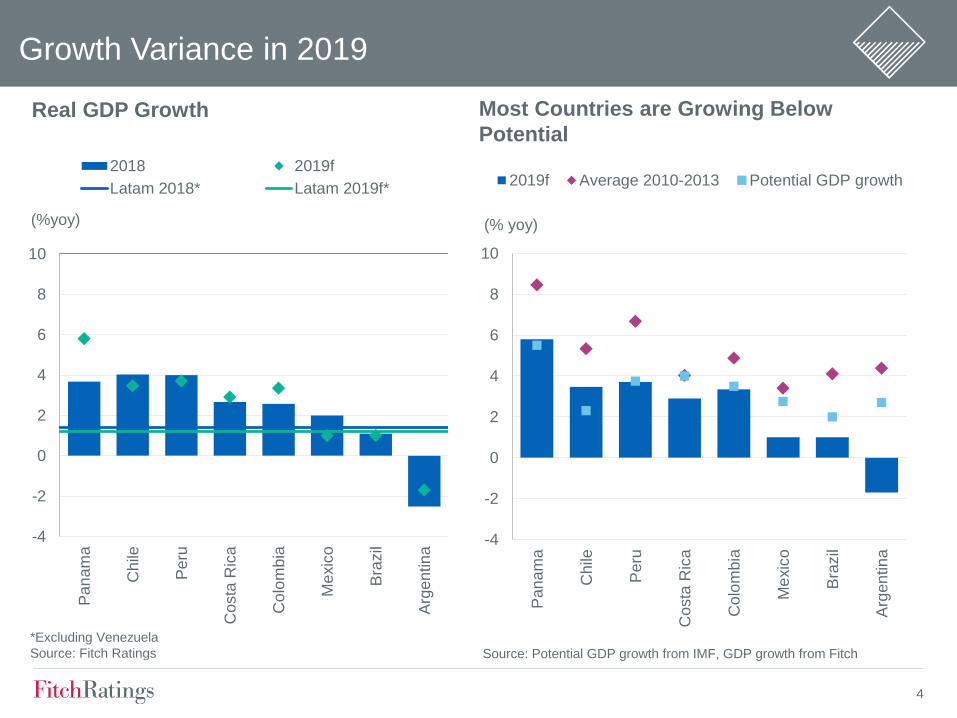
Real GDP Growth
2018 2019f
Latam 2018* Latam 2019f*
*Excluding Venezuela
Source: Fitch Ratings
-4
-2
0
2
4
6
8
10
Pan
am
a
Ch
ile
Peru
Costa
Ric
a
Co
lom
bia
Me
xic
o
Bra
zil
Arg
en
tin
a
(% yoy)
2019f Average 2010-2013 Potential GDP growth
Source: Potential GDP growth from IMF, GDP growth from Fitch
Most Countries are Growing Below
Potential

5
Lagging Consolidation Amid Rising Debt Burden
-12
-10
-8
-6
-4
-2
0
2
4
201
0
201
1
201
2
201
3
201
4
201
5
201
6
201
7
201
8
201
9f
202
0f
(%GDP)
Argentina Brazil ColombiaChile Mexico Peru
Source: Fitch Ratings
Gradual Reduction in Fiscal Deficits General Government Balance
0
10
20
30
40
50
60
70
80
90
201
0
201
1
201
2
201
3
201
4
201
5
201
6
201
7
201
8
201
9f
202
0f
(%GDP)
Argentina Brazil Chile
Colombia Mexico Peru
Source: Fitch Ratings
... And Debt Keeps Growing in Many
6
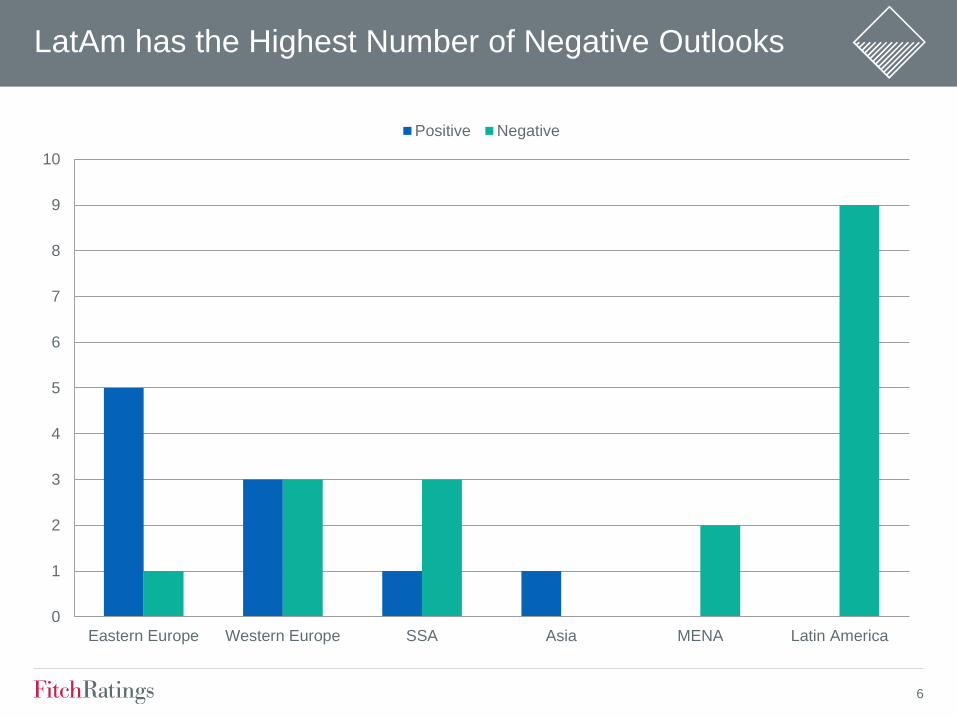
LatAm has the Highest Number of Negative Outlooks
0
1
2
3
4
5
6
7
8
9
10
Eastern Europe Western Europe SSA Asia MENA Latin America
Positive Negative
7
Ratings and Recent Actions
Sovereign LTFC Outlook
Chile A Stable
Mexico BBB Stable
Peru BBB+ Stable
Colombia BBB Negative
Panama BBB Stable
Aruba BBB- Negative
Uruguay BBB- Negative
Paraguay BB+ Stable
Guatemala BB Negative
Bolivia BB- Negative
Brazil BB- Stable
Dom. Republic BB- Stable
Costa Rica B+ Negative
Jamaica B+ Stable
Argentina CCC --
Nicaragua B- Negative
Ecuador B- Negative
El Salvador B- Stable
Suriname B- Stable
Negative Rating Pressures
8 of the 19 sovereigns on Negative Outlook
Lukewarm and uneven growth, persistent fiscal
challenges, political risks, and difficult market
access for some
Negative Actions in 2018-19
Mexico downgraded to BBB from BBB+ (2019)
Ecuador Outlook to Negative from Stable (2019)
Costa Rica to ‘B+’ from ‘BB, ’ Neg. Outlook (2019)
Bolivia Outlook to Negative from Stable (2019)
Colombia Outlook to Negative from Stable (2019)
Guatemala Outlook to Negative from Stable (2019)
Nicaragua to ‘B-’ from ‘B’, Negative Outlook (2018)
Argentina Outlook to Negative from Stable (2018)
Brazil to ‘BB-’ from ‘BB’, Stable Outlook (2018)
Positive Actions in 2018-19
Jamaica to ‘B+’ from ‘B’, Stable Outlook (2019)
Paraguay to ‘BB+’ from ‘BB’, Stable Outlook (2018)
Suriname Outlook to Stable from Negative (2018)
8
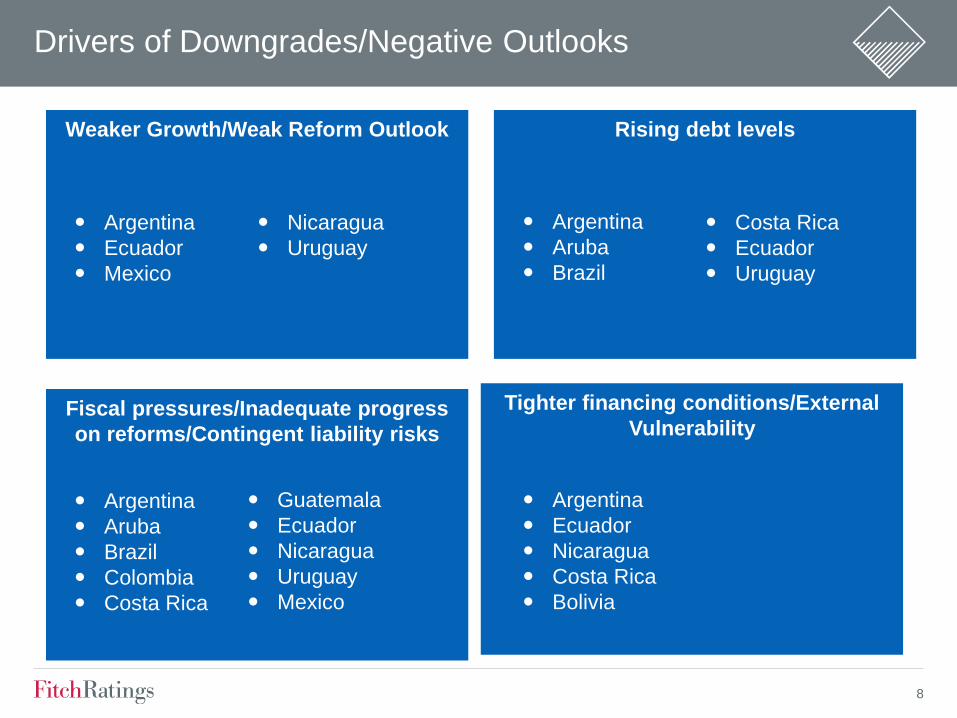
Drivers of Downgrades/Negative Outlooks
Weaker Growth/Weak Reform Outlook Rising debt levels
Fiscal pressures/Inadequate progress
on reforms/Contingent liability risks
Tighter financing conditions/External
Vulnerability
Argentina
Aruba
Brazil
Colombia
Costa Rica
Argentina
Ecuador
Nicaragua
Costa Rica
Bolivia
Argentina
Ecuador
Mexico
Argentina
Aruba
Brazil
Costa Rica
Ecuador
Uruguay
Guatemala
Ecuador
Nicaragua
Uruguay
Mexico
Nicaragua
Uruguay
9
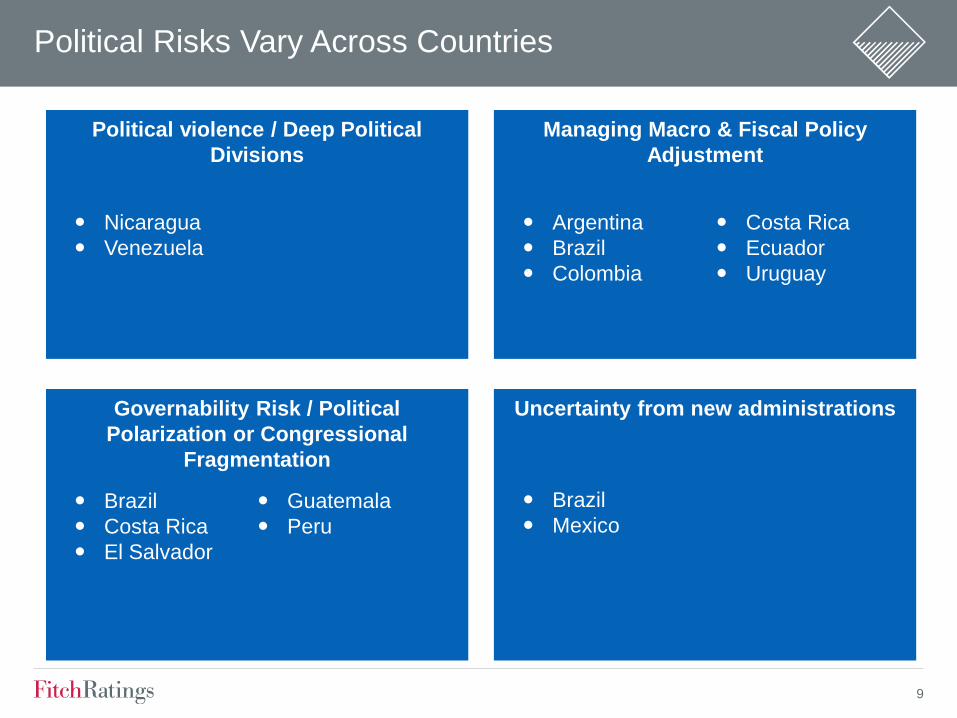
Political Risks Vary Across Countries
Political violence / Deep Political
Divisions
Managing Macro & Fiscal Policy
Adjustment
Governability Risk / Political
Polarization or Congressional
Fragmentation
Uncertainty from new administrations
Brazil
Costa Rica
El Salvador
Brazil
Mexico
Nicaragua
Venezuela
Argentina
Brazil
Colombia
Costa Rica
Ecuador
Uruguay
Guatemala
Peru

10
Colombia Rating Overview
Outlook revised to negative in May 2019,
affirmed at ‘BBB’, to reflect risks to fiscal
consolidation and the trajectory of
government debt, the weakening of fiscal
policy credibility, and increasing risk from
external balances.
Increased difficulty in meeting fiscal
targets from 2020 onwards as a result of
cuts in corporate tax rates passed in the
2018 Financing Law.
Current account deficit widened to 3.8%
of GDP in 2018 and forecast to widen
further to 4.2% of GDP in 2019.
Fitch forecasts growth acceleration in
2019 to 3.3% driven by supportive
consumption and higher investment.
Key Indicators 2018 2019f 2020f
Real GDP growth (%) 2.6 3.3 3.5
Inflation (%) 3.2 3.2 3.1
Central government balance (% of GDP) (3.1) (2.7) (2.3)
General government debt (% of GDP)* 42.3 43.6 43.7
Current account balance (% of GDP) (3.8) (4.2) (4.0)
International reserves, incl. gold (USDbn) 47.9 52.6 57.6
Net external debt (% of CXR) 51.1 51.6 51.7 Source: Fitch Ratings
*General government includes central government, provincial, regional and local
governments, social security funds and extra-budgetary funds.
1995 1998 2001 2004 2007 2010 2013 2016 2019
Rating History
Source: Fitch Ratings
Source: Fitch Ratings
BB+
BB
BBB+
BBB
BBB-
BB-

11
Colombia (BBB/Negative)
SRM output Qualitative overlay FC IDR
BBB-
Factor Notch adjustment
BBB
Macro
Long track record of prudent and consistent
macroeconomic policies.
+1
Public finances 0
External finances 0
Structural features 0
Total +1
Negative Sensitivities
× Failure to implement credible structural
measures to put government debt on a stable
or downward trajectory.
× Sustained deterioration in external imbalances
that leads to a continued rise in the external
debt burden and weak external liquidity
indicators.
× Growth underperformance relative to the ‘BBB’
median that detracts from per-capita income
convergence with similarly rated sovereigns.
Positive Sensitivities
Fiscal consolidation through credible and
predictable policies consistent with an improved
trajectory for public debt dynamics.
Reduced external imbalances that improve
external debt and liquidity ratios.
Higher growth that reduces income gap with
higher-rated sovereigns.
12
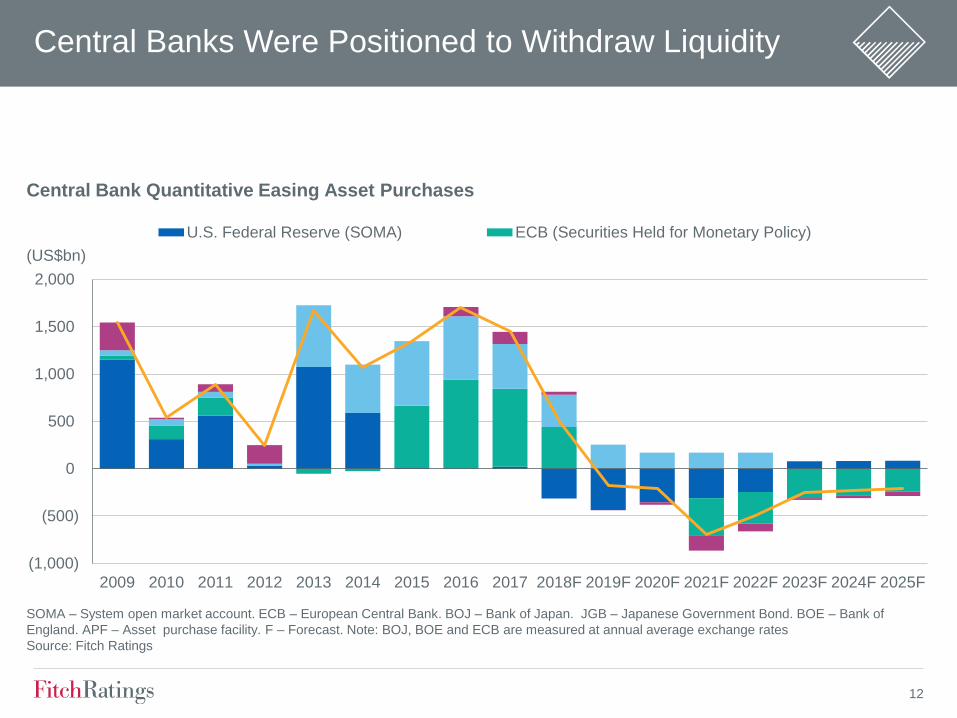
Central Banks Were Positioned to Withdraw Liquidity
(1,000)
(500)
0
500
1,000
1,500
2,000
2009 2010 2011 2012 2013 2014 2015 2016 2017 2018F 2019F 2020F 2021F 2022F 2023F 2024F 2025F
U.S. Federal Reserve (SOMA) ECB (Securities Held for Monetary Policy)
SOMA – System open market account. ECB – European Central Bank. BOJ – Bank of Japan. JGB – Japanese Government Bond. BOE – Bank of
England. APF – Asset purchase facility. F – Forecast. Note: BOJ, BOE and ECB are measured at annual average exchange rates
Source: Fitch Ratings
Central Bank Quantitative Easing Asset Purchases
(US$bn)

13
40
42
44
46
48
50
52
54
56
-5
0
5
10
15
20
2011 2012 2013 2014 2015 2016 2017 2018 2019
Balance>50 = easing (% Y/Y)
Source: Fitch Ratings, IIF, BIS, Haver Analytics
EM Bank Lending Standards and Dollar Lending
USD Credit to Emerging Markets
EM Bank Lending Conditions Survey (RHS)
Tightening in EM Credit Conditions
14
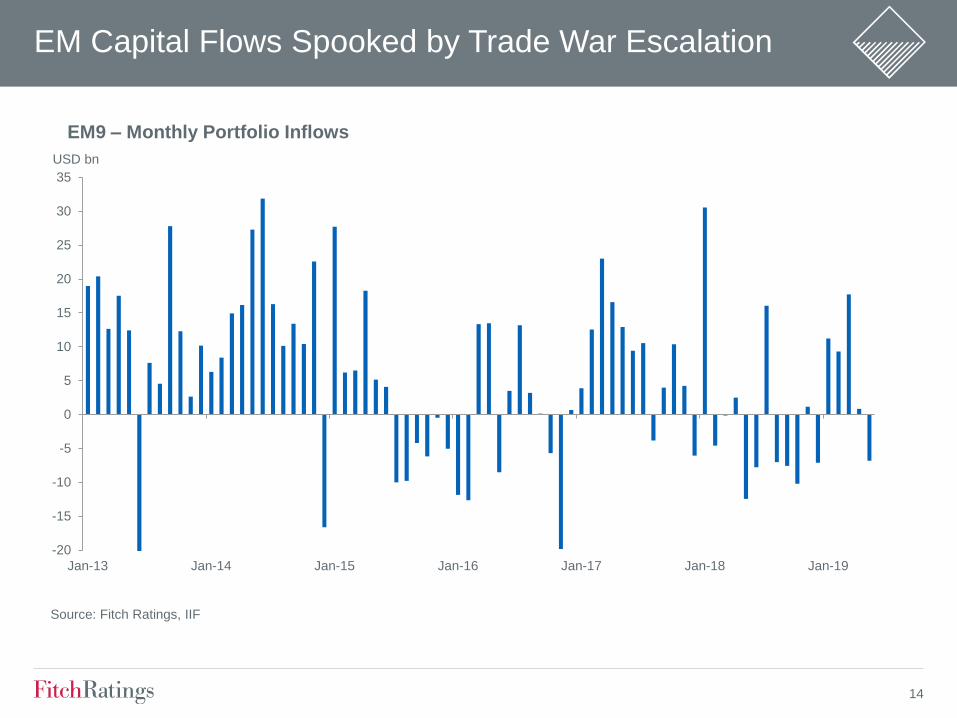
Jan-13 Jan-14 Jan-15 Jan-16 Jan-17 Jan-18 Jan-19
-20
-15
-10
-5
0
5
10
15
20
25
30
35
Source: Fitch Ratings, IIF
USD bn
EM9 – Monthly Portfolio Inflows
EM Capital Flows Spooked by Trade War Escalation

15
-500
0
500
1000
1500
2000
2009 2010 2011 2012 2013 2014 2015 2016 2017 2018 2019 F 2020 F
(USD bn)
Source: Fitch Ratings, ECB, Fed, BOJ, BOE, Haver Analytics
Central Bank QE Purchases in USD Equivalent Terms
BOJ (JGB's) ECB (Sec. Held for Monetary Policy) Fed (SOMA) BOE (APF & TFS) USD Total
Back to Global Quantitative Easing in 2020

16
0
50
100
150
World Arg Bra Chile Col Peru Mex
2012
2018
Regional DCMs
Market Cap of Listed Domestic Companies (%GDP) Stocks Traded, Turnover Ratio Domestic Shares (%)
0
50
100
150
World Arg Bra Chile Col Peru Mex
0
50
100
150
World Arg Bra Chile Col Peru Mex
Stocks Traded, Total Value (% GDP)
0
100
200
300
400
Arg Bra Chile Col Peru Mex
Listed Domestic Companies, Total
Source: World Federation of Exchanges; The World Bank

17
Colombian DCM Indicators
Fixed Domestic Income Issuance (COP, BN) Domestic Corp Fixed Income Issuance (COP, MM)
Bid-to-Cover, Domestic Corporate Issuance Corp Spreads Over CPI (2018)
Source: BVC, Fitch Ratings, Fitch Solutions; as of July 30, 2019
0
5
10
15
2013 2014 2015 2016 2017 2018 2019
Non-FI
FI
0
500,000
1,000,000
1,500,000
2,000,000
2,500,000
3,000,000
3,500,000
4,000,000
4,500,000
2013 2014 2015 2016 2017 2018 2019
AA(col) AAA(col)
0.0
0.5
1.0
1.5
2.0
2.5
3.0
3.5
4.0
2013 2014 2015 2016 2017 2018 2019
(X)
AA(col) AAA(col)
2.0%
2.5%
3.0%
3.5%
4.0%
4.5%
0 5 10 15 20 25 30
Term (years)
AAA(col) AA(col)

18
Colombia - Manageable Maturity Horizon (Corp)
0,0
1,0
2,0
3,0
4,0
5,0
6,0
7,0
8,0
9,0
10,0
11,0
2019 2020 2021 2022 2023 2024 2025 2026 2027 2028 Thereafter
(COP Tril.)
Source: Superintendencia Financiera.
Vencimientos Bonos Locales — Portafolio Fitch
0
500
1.000
1.500
2.000
2.500
3.000
3.500
2019 2020 2021 2022 2023 2024 2025 2026 2027 2028Thereafter
(USD Mil.)
Source: Fitch Ratings, Fitch Solutions.
Vencimientos Cross-Border Maturities — Portfolio Fitch
Estable 81%
Negativo15%
Positivo4%
Source: Fitch Ratings, Fitch Solutions.
Perspectiva de Calificaciones Nacionales(Mayo, 2019)

19
• Regional growth prospects, external environment
and pressured sovereign profiles suggest volatility
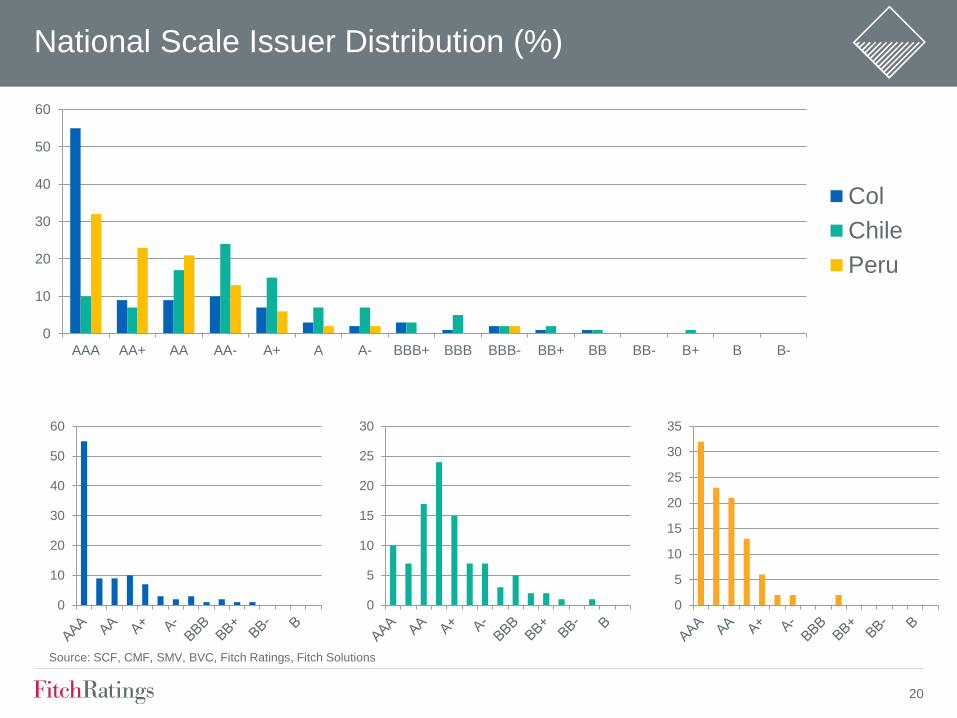
• National scale issuance rating concentration
• Broaden access to local, regional and global
DCMs
• TIG
• Transition to risk based supervision and
management
• Innovation and disruption
DCM Challenges & Opportunities
20
0
10
20
30
40
50
60
AAA AA+ AA AA- A+ A A- BBB+ BBB BBB- BB+ BB BB- B+ B B-
Col
Chile
Peru
National Scale Issuer Distribution (%)
0
5
10
15
20
25
30
0
5
10
15
20
25
30
35
0
10
20
30
40
50
60
Source: SCF, CMF, SMV, BVC, Fitch Ratings, Fitch Solutions
21
• Regional growth prospects, external environment
and pressured sovereign profiles suggest volatility
• National scale issuance rating concentration
• Broaden access to local, regional and global
DCMs
• TIG
• Transition to risk based supervision and
management
• Innovation and disruption
DCM Challenges & Opportunities
22
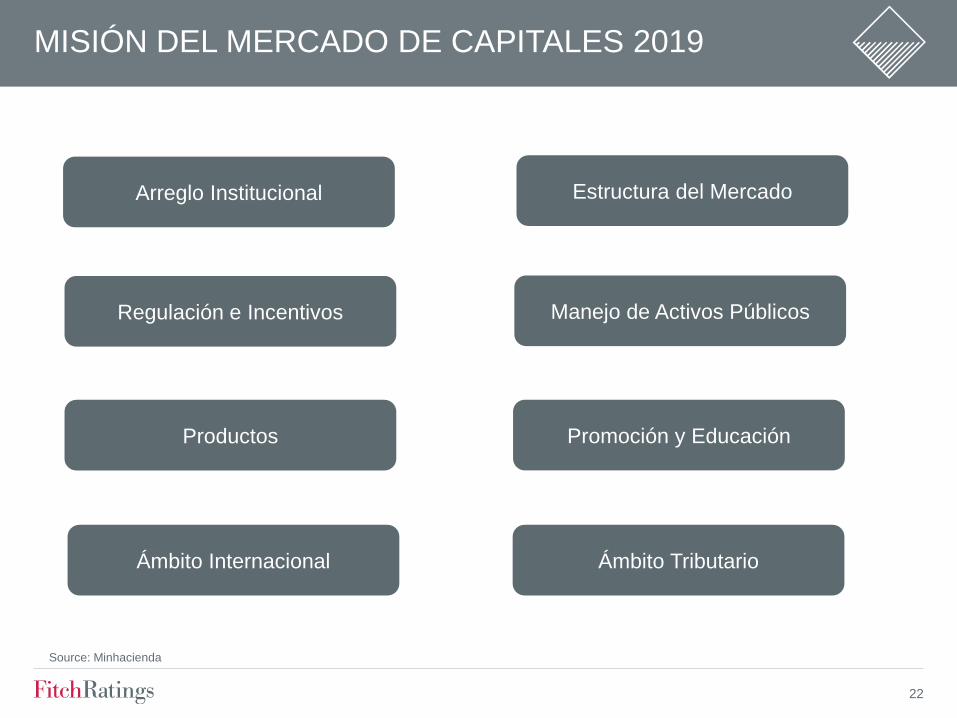
MISIÓN DEL MERCADO DE CAPITALES 2019
Arreglo Institucional
Regulación e Incentivos
Productos
Ámbito Internacional
Estructura del Mercado
Manejo de Activos Públicos
Promoción y Educación
Ámbito Tributario
Source: Minhacienda

23
Financial Integration: Pacific Alliance
Portfolio Investments (Dom vs PA, US$ MM, 2016) Does your organization see potential to increase its
investments or business volumes in the AP? (%)
Principal Factor Inhibiting FI in the PA (%) Non-national Investor Tax in PA Countries via MILA
Source: Centro UC CLAPES ; OEAP, December 2018
Origin
Colombia Chile Mexico Peru
Colombia 45,850 1,347 142 1,504
Chile 163 106,433 41 1,516
Mexico 267 3,987 139,288 718
Peru 325 1,437 10 25,530
0 20 40 60 80
No opinion
No
Yes
0 10 20 30 40 50
Tax
Foreign Exchange
Regulatory
Inversionista no
nacional que
invierte en:
Dividendos Ganacia de Capital
Colombia Cuatro regimenes
tibutarios
Tres regimenes
tributarios
Chile Dos regimenes
tributarios
Dos regimenes
tributarios
Mexico Régimen único Tres regimenes
tributarios
Perú Régimen único
(con variaciones en el
tiempo)
Dos regimenes
tributarios

24
• Regional growth prospects, external environment
and pressured sovereign profiles suggest volatility
• National scale issuance rating concentration
• Broaden access to local, regional and global
DCMs
• TIG
• Transition to risk based supervision and
management
• Innovation and disruption
DCM Challenges & Opportunities

25
Fitch Ratings’ credit ratings rely on factual information received from issuers and other sources.
Fitch Ratings cannot ensure that all such information will be accurate and complete. Further, ratings are inherently forward-
looking, embody assumptions and predictions that by their nature cannot be verified as facts, and can be affected by future
events or conditions that were not anticipated at the time a rating was issued or affirmed.
The information in this presentation is provided “as is” without any representation or warranty. A Fitch Ratings credit rating is
an opinion as to the creditworthiness of a security and does not address the risk of loss due to risks other than credit risk,
unless such risk is specifically mentioned. A Fitch Ratings report is not a substitute for information provided to investors by the
issuer and its agents in connection with a sale of securities.
Ratings may be changed or withdrawn at any time for any reason in the sole discretion of Fitch Ratings. The agency does not
provide investment advice of any sort. Ratings are not a recommendation to buy, sell, or hold any security.
ALL FITCH CREDIT RATINGS ARE SUBJECT TO CERTAIN LIMITATIONS AND DISCLAIMERS. PLEASE READ THESE
LIMITATIONS AND DISCLAIMERS AND THE TERMS OF USE OF SUCH RATINGS AT WWW.FITCHRATINGS.COM.

@fitchratings
fitchratings.com
New York London 33 Whitehall Street
New York, NY 10004
30 North Colonnade
Canary Wharf
London, E14 5GN


![QBE at a glance UK · QBE Insurance Group Limited A– [negative] A– [negative] bbb [negative] QBE Insurance (Europe) Limited A– [negative] a [negative] QBE Re (Europe) Limited](https://static.fdocuments.in/doc/165x107/5fa8e28b58047158406a3b4f/qbe-at-a-glance-uk-qbe-insurance-group-limited-aa-negative-aa-negative-bbb.jpg)