A versatile 2A peptide-based bicistronic protein ... · Background: The industrial workhorse...
15
Subramanian et al. Biotechnol Biofuels (2017) 10:34 DOI 10.1186/s13068-017-0710-7 RESEARCH A versatile 2A peptide-based bicistronic protein expressing platform for the industrial cellulase producing fungus, Trichoderma reesei Venkataramanan Subramanian 1* , Logan A. Schuster 1 , Kyle T. Moore 1 , Larry E. Taylor II. 1 , John O. Baker 1 , Todd A. Vander Wall 1 , Jeffrey G. Linger 2 , Michael E. Himmel 1 and Stephen R. Decker 1 Abstract Background: The industrial workhorse fungus, Trichoderma reesei, is typically exploited for its ability to produce cellu- lase enzymes, whereas use of this fungus for over-expression of other proteins (homologous and heterologous) is still very limited. Identifying transformants expressing target protein is a tedious task due to low transformation efficiency, combined with highly variable expression levels between transformants. Routine methods for identification include PCR-based analysis, western blotting, or crude activity screening, all of which are time-consuming techniques. To sim- plify this screening, we have adapted the 2A peptide system from the foot-and-mouth disease virus (FMDV) to T. reesei to express a readily screenable marker protein that is co-translated with a target protein. The 2A peptide sequence allows multiple independent genes to be transcribed as a single mRNA. Upon translation, the 2A peptide sequence causes a “ribosomal skip” generating two (or more) independent gene products. When the 2A peptide is translated, the “skip” occurs between its two C-terminal amino acids (glycine and proline), resulting in the addition of extra amino acids on the C terminus of the upstream protein and a single proline addition to the N terminus of the downstream protein. To test this approach, we have cloned two heterologous proteins on either side of a modified 2A peptide, a secreted cellobiohydrolase enzyme (Cel7A from Penicillium funiculosum) as our target protein, and an intracellular enhanced green fluorescent protein (eGFP) as our marker protein. Using straightforward monitoring of eGFP expres- sion, we have shown that we can efficiently monitor the expression of the target Cel7A protein. Results: Co-expression of Cel7A and eGFP via the FMDV 2A peptide sequence resulted in successful expression of both test proteins in T. reesei. Separation of these two polypeptides via the modified 2A peptide was ~100% efficient. The Cel7A was efficiently secreted, whereas the eGFP remained intracellular. Both proteins were expressed when cloned in either order, i.e., Cel7A-2A-eGFP (C2G) or eGFP-2A-Cel7A (G2C); however, eGFP expression and/or function- ality were dependent upon the order of transcription. Specifically, expression of Cel7A was linked to eGFP expression in the C2G orientation, whereas expression of Cel7A could not be reliably correlated to eGFP fluorescence in the G2C construct. Whereas eGFP stability and/or fluorescence were affected by gene order, Cel7A was expressed, secreted, and exhibited the expected functionality in both the G2C and C2G orientations. Conclusions: We have successfully demonstrated that two structurally unrelated proteins can be expressed in T. ree- sei using the FMDV 2A peptide approach; however, the order of the genes can be important. The addition of a single proline to the N terminus of eGFP in the C2G orientation did not appear to affect fluorescence, which correlated well with Cel7A expression. The addition of 21 amino acids to the C terminus of eGFP in the G2C orientation, however, appeared to severely reduce fluorescence and/or stability, which could not be linked with Cel7A expression. The © The Author(s) 2017. This article is distributed under the terms of the Creative Commons Attribution 4.0 International License (http://creativecommons.org/licenses/by/4.0/), which permits unrestricted use, distribution, and reproduction in any medium, provided you give appropriate credit to the original author(s) and the source, provide a link to the Creative Commons license, and indicate if changes were made. The Creative Commons Public Domain Dedication waiver (http://creativecommons.org/ publicdomain/zero/1.0/) applies to the data made available in this article, unless otherwise stated. Open Access Biotechnology for Biofuels *Correspondence: [email protected] 1 Biosciences Center, National Renewable Energy Laboratory, 15013 Denver West Parkway, Golden, CO 80401, USA Full list of author information is available at the end of the article
Transcript of A versatile 2A peptide-based bicistronic protein ... · Background: The industrial workhorse...
Subramanian et al. Biotechnol Biofuels (2017) 10:34 DOI 10.1186/s13068-017-0710-7
RESEARCH
A versatile 2A peptide-based bicistronic protein expressing platform for the industrial cellulase producing fungus, Trichoderma reeseiVenkataramanan Subramanian1* , Logan A. Schuster1, Kyle T. Moore1, Larry E. Taylor II.1, John O. Baker1, Todd A. Vander Wall1, Jeffrey G. Linger2, Michael E. Himmel1 and Stephen R. Decker1
Abstract
Background: The industrial workhorse fungus, Trichoderma reesei, is typically exploited for its ability to produce cellu-lase enzymes, whereas use of this fungus for over-expression of other proteins (homologous and heterologous) is still very limited. Identifying transformants expressing target protein is a tedious task due to low transformation efficiency, combined with highly variable expression levels between transformants. Routine methods for identification include PCR-based analysis, western blotting, or crude activity screening, all of which are time-consuming techniques. To sim-plify this screening, we have adapted the 2A peptide system from the foot-and-mouth disease virus (FMDV) to T. reesei to express a readily screenable marker protein that is co-translated with a target protein. The 2A peptide sequence allows multiple independent genes to be transcribed as a single mRNA. Upon translation, the 2A peptide sequence causes a “ribosomal skip” generating two (or more) independent gene products. When the 2A peptide is translated, the “skip” occurs between its two C-terminal amino acids (glycine and proline), resulting in the addition of extra amino acids on the C terminus of the upstream protein and a single proline addition to the N terminus of the downstream protein. To test this approach, we have cloned two heterologous proteins on either side of a modified 2A peptide, a secreted cellobiohydrolase enzyme (Cel7A from Penicillium funiculosum) as our target protein, and an intracellular enhanced green fluorescent protein (eGFP) as our marker protein. Using straightforward monitoring of eGFP expres-sion, we have shown that we can efficiently monitor the expression of the target Cel7A protein.
Results: Co-expression of Cel7A and eGFP via the FMDV 2A peptide sequence resulted in successful expression of both test proteins in T. reesei. Separation of these two polypeptides via the modified 2A peptide was ~100% efficient. The Cel7A was efficiently secreted, whereas the eGFP remained intracellular. Both proteins were expressed when cloned in either order, i.e., Cel7A-2A-eGFP (C2G) or eGFP-2A-Cel7A (G2C); however, eGFP expression and/or function-ality were dependent upon the order of transcription. Specifically, expression of Cel7A was linked to eGFP expression in the C2G orientation, whereas expression of Cel7A could not be reliably correlated to eGFP fluorescence in the G2C construct. Whereas eGFP stability and/or fluorescence were affected by gene order, Cel7A was expressed, secreted, and exhibited the expected functionality in both the G2C and C2G orientations.
Conclusions: We have successfully demonstrated that two structurally unrelated proteins can be expressed in T. ree-sei using the FMDV 2A peptide approach; however, the order of the genes can be important. The addition of a single proline to the N terminus of eGFP in the C2G orientation did not appear to affect fluorescence, which correlated well with Cel7A expression. The addition of 21 amino acids to the C terminus of eGFP in the G2C orientation, however, appeared to severely reduce fluorescence and/or stability, which could not be linked with Cel7A expression. The
© The Author(s) 2017. This article is distributed under the terms of the Creative Commons Attribution 4.0 International License (http://creativecommons.org/licenses/by/4.0/), which permits unrestricted use, distribution, and reproduction in any medium, provided you give appropriate credit to the original author(s) and the source, provide a link to the Creative Commons license, and indicate if changes were made. The Creative Commons Public Domain Dedication waiver (http://creativecommons.org/publicdomain/zero/1.0/) applies to the data made available in this article, unless otherwise stated.
Open Access
Biotechnology for Biofuels
*Correspondence: [email protected] 1 Biosciences Center, National Renewable Energy Laboratory, 15013 Denver West Parkway, Golden, CO 80401, USAFull list of author information is available at the end of the article
Page 2 of 15Subramanian et al. Biotechnol Biofuels (2017) 10:34
BackgroundTrichoderma reesei is well known for its ability to secrete cellulases at very high levels. Up to 100 g/L native cel-lulases have been reported from mutated strains [1, 2]. There have been several advances made with respect to improving T. reesei strains for expression of native cellu-lase enzymes [3–6]. These include the development of an efficient transformation system, varied selection mark-ers, and strong promoters for expression of cellulases [7]. However, the use of T. reesei as a heterologous expres-sion host has been limited to only a few select proteins (reviewed in [7]). Moreover, even successful protein-expressing strains often have very low yields.
Several factors are considered important for expression of foreign genes in filamentous fungi, such as T. reesei, including transformation efficiency of the strain, codon bias, promoter strength, gene silencing effects, GC con-tent of the gene, site of integration, copy number, and correct post-translational processing of heterologous proteins. Among these, the foremost consideration is the ability to transform the strain and identify positive trans-formants from a pool of colonies. A transformant can be typically identified by growth on selective media; how-ever, mere growth on selection media does not guaran-tee the expression of the gene of interest (GOI) nor can it be used to predict the level of expression. For example, fragmentation or rearrangement of the plasmid construct prior to integration may lead to separation of the selecta-ble marker from the GOI. As a consequence, additional techniques, such as PCR-based screening of individual transformants using gene-specific primers, western blot-ting with specific antibodies to identify the protein of interest, or activity assays must be carried out in order to verify the presence of the GOI. Whereas these techniques are currently being used in T. reesei research, they are tedious when screening hundreds of colonies to find the best expressing transformant. Depending on copy num-ber, its site(s) of integration, and the nature of the gene itself, the level of expression may be extremely low or essentially zero. The former two aspects can be addressed by targeted transformation into mutants lacking the non-homologous end-joining (NHEJ) pathway [8–11].
Using NHEJ mutant host strains, heterologous genes can be targeted into genomic locations where high express-ing genes are typically present. Another commonly used strategy to track expressibility of a GOI is to fuse it to a trackable gene (such as a fluorescent, antibiotic, or aux-otrophic marker) or a highly expressible native gene. However, such fusions may lead to alteration or even complete loss of function of the target or marker protein. Despite the availability of a few laborious (genomic DNA extraction, western blotting) and less reliable (colony PCR) techniques to identify the presence and expression of GOI, a simple, reliable, and robust way to ensure inde-pendent GOI expression (i.e, without fusion) as well as identifying a positive GOI-expressing transformant from the pool of transformants is still lacking.
In theory, the use of viral 2A peptides ensures a 1:1 expression ratio of the two linked genes. The 2A pep-tides are found in many viruses, notably positive-strand RNA viruses, such as picornaviridae [12, 13]. The foot-and-mouth disease virus (FMDV) genomes (prototypical Aphthovirus genus) contain a single, long, open reading frame that encodes a polyprotein of ~225 kDa. However, the full-length translation product is seldom found due to rapid “primary” discontinuous polyprotein transla-tion occurring at the C-terminal end of the 2A peptide sequence found within this ORF [13]. The FMDV 2A peptide contains a specific 19 amino acid sequence that “auto-separates” the viral polyproteins during transla-tion [14–16]. The mechanism of separation of the poly-proteins involves hydrolysis of the nascent polypeptide from the tRNA during ribosomal translation of the 2A peptide sequence, wherein the peptidyl (2A)-tRNAGly ester linkage to the glycyl-tRNA in the ribosomal P-site is hydrolyzed, thereby releasing the nascent polypeptide from the ribosomal translational complex. Continued synthesis of the downstream protein sequence start-ing with the sequential proline on the C terminus of the 2A peptide sequence still occurs [15]. It appears that the downstream polypeptide is never directly bound to the upstream protein through a peptide bond. Instead, the 2A sequence induces hydrolysis of the upstream protein 2A glycine (position 18 in native FMDV 2A) from its
molecular biology tool that we have implemented in this study will provide an efficient strategy to test the expression of heterologous proteins in T. reesei, while also providing a novel platform for developing this fungus as an efficient multi-protein-expressing host using a single polycistronic gene expression cassette. An additional advantage of this system is that the co-expressed proteins can be theoretically produced at equimolar ratios, as (A) they all originate from a single transcript and (B) unlike internal ribosome entry site (IRES)-mediated polycistronic expression, each cistron should be translated equimolarly as there is no ribosomal dissociation or reloading between cistrons.
Keywords: Trichoderma reesei, Foot-and-mouth disease virus (FMDV) 2A peptide, Protein expression, Cellobiohydrolase, Fungus, Biomass hydrolysis, Green fluorescence protein
Page 3 of 15Subramanian et al. Biotechnol Biofuels (2017) 10:34
tRNA. The position 19 proline tRNA still complexes with the ribosome but instead of being linked to the 18-gly-cine, it is used as the N terminus of a new polypeptide. Two independent proteins are thus produced due to the lack of formation of a peptide bond during the transla-tion process, also referred to as “ribosomal-skip” mecha-nism [15]. Referencing the 2A peptide as “self-cleaving” is somewhat of a mischaracterization, as the two translated sequences are never covalently linked. This mechanism of discontinuous protein translation has been shown to be specific to eukaryotic 80S ribosomes only (not to 70S prokaryotic ribosomes). Donnelly et al. [12] also observed ~90% cleavage activity with a 19 amino acid 2A peptide sequence, which was further enhanced to ~96% by the addition of as few as five amino acids to the N-ter-minal end of the 2A peptide [14]. Further addition of amino acids (up to 39 amino acids) to the N-terminal end resulted in increasing cleavage efficiency to ~100% [14].
The advantage of the 2A peptide system is that two or more independent proteins can be produced at near-stoichiometric levels unlike internal ribosome entry site (IRES)-mediated polycistronic expression where ribo-somes are independently recruited at distinct regions with the mRNA [14, 15, 17, 18]. Up to nine proteins have been linked and successfully co-translated and separated with 2A sequences in a methylotrophic yeast, Pichia pastoris [19]. With respect to T. reesei, the 2A peptide approach could drastically reduce the time for screen-ing of high GOI-expressing transformants if a simple marker protein was included. Here, we report successful co-expression of two independent heterologous proteins in T. reesei; cellobiohydrolase Cel7A from Penicillium funiculosum and a fluorescent marker protein eGFP, separated by a 22 amino acid modified FMDV 2A pep-tide sequence. Both proteins are produced as separate polypeptides from a single transcript with an observed 2A separation efficiency of ~100% based on western blot analysis. Availability of this molecular tool will dramati-cally improve the transformation screening efficiency and further develop T. reesei as a robust protein expression host, where multiple proteins can be expressed simulta-neously for both academic and industrial pursuits. Aside from co-expression of various industrial enzymes, this tool could be exploited for expression of complete meta-bolic pathways to generate similar stoichiometric levels of proteins for bioproducts synthesis from T. reesei.
Results and discussionAn efficient way to identify and track transformants expressing heterologous and homologous genes has been lacking in eukaryotic organisms, such as T. ree-sei. Although expressing colonies can be identified by intensively screening the transformants by western blot
analysis or protein activity assays, this is extremely dif-ficult for proteins lacking specific antibodies or with no functional activity assays. Here we have presented a sim-ple and efficient way of detecting successful expression of genes (foreign or native) using a 2A peptide-driven approach.
Transformation of FMDV 2A peptide in T. reeseiWe generated two different plasmids using pTrEno (hygromycin resistance marker and strong constitutive strong eno promoter) as the starting vector such that the eGFP and Cel7A genes were on either sides of the modi-fied 2A peptide sequence [14–16]. The two vectors con-tained the same genes in inverse order; Cel7A-2A-eGFP (C2G) or eGFP-2A-Cel7A (G2C). The constructs, when successfully expressed, should result in two proteins separated between the glycine 21 and proline 22 within the 2A peptide sequence, with the protein downstream of the 2A peptide containing an extra proline at the N terminus and the upstream protein containing an addi-tional 21 amino acids at its C-terminal end. The expres-sion cassette is as shown in Fig. 1. Transformation of both these constructs resulted in hygromycin-resistant colonies. As a first step toward predicting Cel7A protein expression via co-expression of eGFP, we tested 22 hygr colonies for eGFP expression based on fluorescence using a Safe Imager 2.0 blue light transilluminator (470 nm, ThermoFisher Scientific Inc., Grand Island, NY, USA). Although, there was noticeable visual difference between the fluorescence levels in these micro-cultures (data not shown), it was difficult to identify actual eGFP-express-ing colonies from the pool of transformants using this instrument due to low-level background fluorescence of T. reesei.
Confirmation of efficient cleavage of 2A peptide in T. reeseiSince it was difficult to positively identify eGFP-express-ing clones under blue light (background fluorescence), we identified positive Cel7A-expressing clones by west-ern blotting. Our analysis revealed that Cel7A-expressing clones were detected with a very low frequency. Only two of 12 transformants screened showed detectable Cel7A expression, to varying degrees, among each of the C2G and G2C transformants (Fig. 2). Among the C2G trans-formants, colonies A4 and A5 showed Cel7A expres-sion, with A5 being the best expressing clone (Fig. 2, left panel). Expression of Cel7A in colony A4 was extremely low. Among the G2C transformants, colonies C2 and D2 showed Cel7A expression with C2 expressing bet-ter than the D2 clone. This observation highlighted the low efficiency and high variability of protein expression in this eukaryotic system, even in hygromycin-resistant transformants. The estimated molecular weight of Cel7A,

Page 4 of 15Subramanian et al. Biotechnol Biofuels (2017) 10:34
as detected in the western blot, was ~53 kDa, which is the expected size of intact Cel7A (Fig. 2). If the 2A pep-tide had not efficiently separated, the apparent molecu-lar weight would have been ~82 kDa (52.5 kDa for Cel7A + 2.3 kDa for 2A + 26.9 kDa for eGFP). This dem-onstrated that the 2A peptide was effective in both gene arrangements.
In order to determine the consistency of fluorescence to Cel7A expression, we generated five clonal isolates for two transformants that showed varying degrees of Cel7A expression; as well as visual eGFP fluorescence from each of the 2A orientation cassettes. The selected C2G transformants were A4 (very low fluorescence) and A5 (very high fluorescence) and C2 (high fluorescence) and
Fig. 1 Constructs used in this study. a Modified FMDV 2A peptide sequence used in this study. Red arrow represents the site of ribosomal skipping. The long blue arrow represents the peptide that gets added to the C-terminal end of the upstream protein. The short blue arrow represents the amino acid (proline) that gets added to the N-terminal end of the downstream protein. b Bicistronic gene constructs for testing expression of Cel7A and eGFP protein in T. reesei. Cel7A and eGFP are separated by FMDV 2A peptide sequence in either orientation (left panel and right panel). Upon transcription of the bicistronic gene construct, a single mRNA transcript containing eGFP and Cel7A are produced, which upon translation gets cleaved after the glycine residue within the 2A peptide to yield two independent proteins. 21 amino acids of the 2A peptide get added to the pro-tein upstream of the peptide and one amino acid (proline) gets added to the downstream protein. Horizontal arrows and the numbers 1, 2, and 3, below the gene cassettes, represent PCR products that were used to confirm the presence of individual genes in the transformants. c Plasmid maps of the two constructs used in this study. The restriction site, SbfI, represents the site of linearization of the plasmid. Eno enolase, PGK1 phosphoglyc-erate kinase, HPT hygromycin phosphotransferase, term terminator

Page 5 of 15Subramanian et al. Biotechnol Biofuels (2017) 10:34
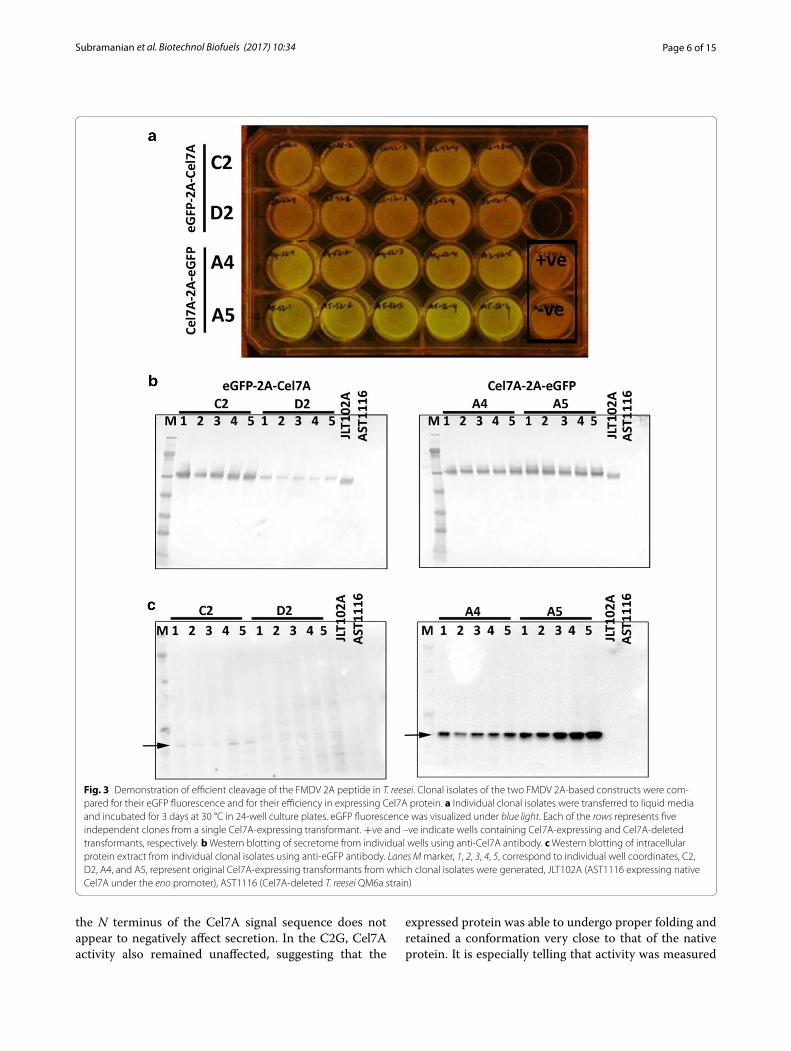
D2 (medium fluorescence) for the G2C transformants (Fig. 2). Clonal isolates were obtained by restreaking a spore suspension obtained from each of the four positive Cel7A transformants onto hygromycin selection plates. Five individual colonies arising from this restreak were inoculated into MAG medium containing hygromycin. We observed that these clonal isolates clearly displayed consistent degrees of fluorescence based on blue light visualization (Fig. 3a) that represented the varied expres-sion levels in the parental strains. Whereas A4 and A5 clones displayed better fluorescence, C2 and D2 clones showed poor fluorescence (Fig. 3a). Western blotting was performed on cell-free media, which showed that in the C2G orientation, A4 and A5 clones showed relatively high levels of Cel7A protein (Fig. 3b, right panel). On the other hand, in the G2C orientation, C2 clones showed higher Cel7A protein expression than D2 (Fig. 3b, left panel). In order to confirm if this result correlated with eGFP protein expression, we performed western blotting of intracellular protein extract using anti-eGFP antibody. It should be noted that no detectable eGFP expression was detected extracellularly in any of these clonal isolates via visual fluorescence observation or western blot analy-sis (data not shown). We observed that eGFP protein was expressed at relatively similar levels in the C2G strains A4 and A5—that is low levels in A4 and high levels in A5 (Fig. 3c, right panel). In contrast, eGFP was barely detectable in the G2C strains. Specifically, C2 showed very low eGFP levels and D2 did not show eGFP bands at the expected molecular weight (Fig. 3b, left panel). These observations highlight that the arrangement of the two genes can be critical in using 2A systems, wherein the 2A remnants can have potential deleterious effects on the target proteins. A promising observation is that
both Cel7A and the eGFP proteins were expressed at the expected molecular weight (i.e., ~53 kDa for Cel7A and ~27 kDa for eGFP). No detectable expression of an uncleaved protein product at ~82 kDa was observed in the western blots. This suggested that the 2A peptide was being cleaved at ~100% efficiency and was resulting in the generation of the two complete gene products, Cel7A and eGFP in T. reesei.
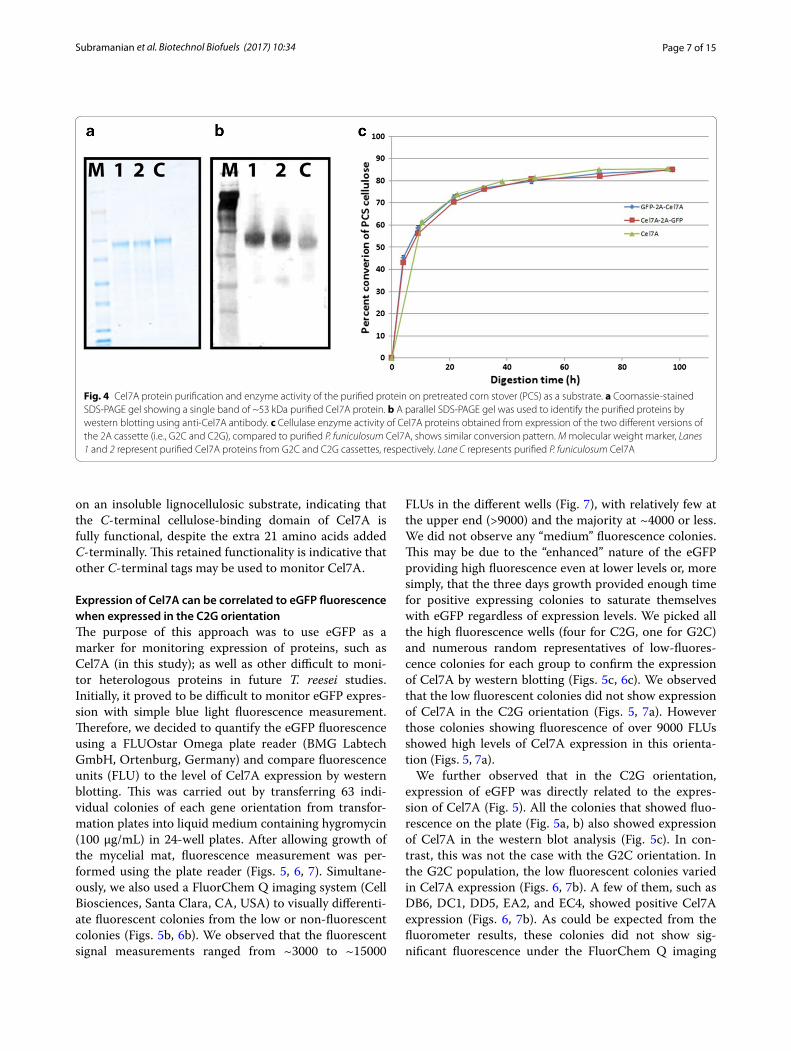
Cel7A is functional in either sequenceOnce we observed that eGFP stability/fluorescence was affected by its position within the 2A cassette, we ques-tioned whether or not the activity of Cel7A was also affected in a similar manner. To answer this question, we purified Cel7A proteins to homogeneity from either sequence using extensive Fast Protein Liquid Chroma-tography (FPLC). The specific clones used for purification were SV001 (eGFP-2A-Cel7A #C2-1, Fig. 3a) and SV004 (Cel7A-2A-eGFP #A5-4, Fig. 3a). The purified proteins were observed as single bands of ~53 kDa on SDS-PAGE (Fig. 4a, b). We performed in vitro biomass hydrolysis assays of dilute acid-pretreated corn stover using these purified Cel7A proteins plus standard endocellulase and β-d-glucosidase to quantify the cellulose conversion effi-ciency of Cel7A obtained from these two gene orienta-tions. Our analysis showed that Cel7A obtained from both orientations displayed similar conversion profiles (Fig. 4c). The rate of cellulose conversion activity of these two Cel7A variants was comparable to the rate of con-version of native P. funiculosum Cel7A (Fig. 4c). As the Cel7A contains a secretion signal peptide sequence that gets cleaved during secretion of the processed protein, the resultant final protein from the G2C is the same as the native sequence. The addition of a single proline to
Fig. 2 Screening of transformants for identification of Cel7A-expressing colonies. Individual transformant colonies arising from the two differ-ent plasmid constructs (cel7A-2A-eGFP and eGFP-2A-Cel7A) were transferred to liquid medium containing hygromycin and grown for 3 days at 30 °C. Western blotting of secretome was performed for a few of the selected colonies from the 24-well plates using anti-Cel7A antibody. Lanes. M molecular weight marker, A, B, C, and D followed by numbers represent well coordinates, C Cel7A control
Page 6 of 15Subramanian et al. Biotechnol Biofuels (2017) 10:34
the N terminus of the Cel7A signal sequence does not appear to negatively affect secretion. In the C2G, Cel7A activity also remained unaffected, suggesting that the
expressed protein was able to undergo proper folding and retained a conformation very close to that of the native protein. It is especially telling that activity was measured
Fig. 3 Demonstration of efficient cleavage of the FMDV 2A peptide in T. reesei. Clonal isolates of the two FMDV 2A-based constructs were com-pared for their eGFP fluorescence and for their efficiency in expressing Cel7A protein. a Individual clonal isolates were transferred to liquid media and incubated for 3 days at 30 °C in 24-well culture plates. eGFP fluorescence was visualized under blue light. Each of the rows represents five independent clones from a single Cel7A-expressing transformant. +ve and –ve indicate wells containing Cel7A-expressing and Cel7A-deleted transformants, respectively. b Western blotting of secretome from individual wells using anti-Cel7A antibody. c Western blotting of intracellular protein extract from individual clonal isolates using anti-eGFP antibody. Lanes M marker, 1, 2, 3, 4, 5, correspond to individual well coordinates, C2, D2, A4, and A5, represent original Cel7A-expressing transformants from which clonal isolates were generated, JLT102A (AST1116 expressing native Cel7A under the eno promoter), AST1116 (Cel7A-deleted T. reesei QM6a strain)
Page 7 of 15Subramanian et al. Biotechnol Biofuels (2017) 10:34
on an insoluble lignocellulosic substrate, indicating that the C-terminal cellulose-binding domain of Cel7A is fully functional, despite the extra 21 amino acids added C-terminally. This retained functionality is indicative that other C-terminal tags may be used to monitor Cel7A.
Expression of Cel7A can be correlated to eGFP fluorescence when expressed in the C2G orientationThe purpose of this approach was to use eGFP as a marker for monitoring expression of proteins, such as Cel7A (in this study); as well as other difficult to moni-tor heterologous proteins in future T. reesei studies. Initially, it proved to be difficult to monitor eGFP expres-sion with simple blue light fluorescence measurement. Therefore, we decided to quantify the eGFP fluorescence using a FLUOstar Omega plate reader (BMG Labtech GmbH, Ortenburg, Germany) and compare fluorescence units (FLU) to the level of Cel7A expression by western blotting. This was carried out by transferring 63 indi-vidual colonies of each gene orientation from transfor-mation plates into liquid medium containing hygromycin (100 µg/mL) in 24-well plates. After allowing growth of the mycelial mat, fluorescence measurement was per-formed using the plate reader (Figs. 5, 6, 7). Simultane-ously, we also used a FluorChem Q imaging system (Cell Biosciences, Santa Clara, CA, USA) to visually differenti-ate fluorescent colonies from the low or non-fluorescent colonies (Figs. 5b, 6b). We observed that the fluorescent signal measurements ranged from ~3000 to ~15000
FLUs in the different wells (Fig. 7), with relatively few at the upper end (>9000) and the majority at ~4000 or less. We did not observe any “medium” fluorescence colonies. This may be due to the “enhanced” nature of the eGFP providing high fluorescence even at lower levels or, more simply, that the three days growth provided enough time for positive expressing colonies to saturate themselves with eGFP regardless of expression levels. We picked all the high fluorescence wells (four for C2G, one for G2C) and numerous random representatives of low-fluores-cence colonies for each group to confirm the expression of Cel7A by western blotting (Figs. 5c, 6c). We observed that the low fluorescent colonies did not show expression of Cel7A in the C2G orientation (Figs. 5, 7a). However those colonies showing fluorescence of over 9000 FLUs showed high levels of Cel7A expression in this orienta-tion (Figs. 5, 7a).
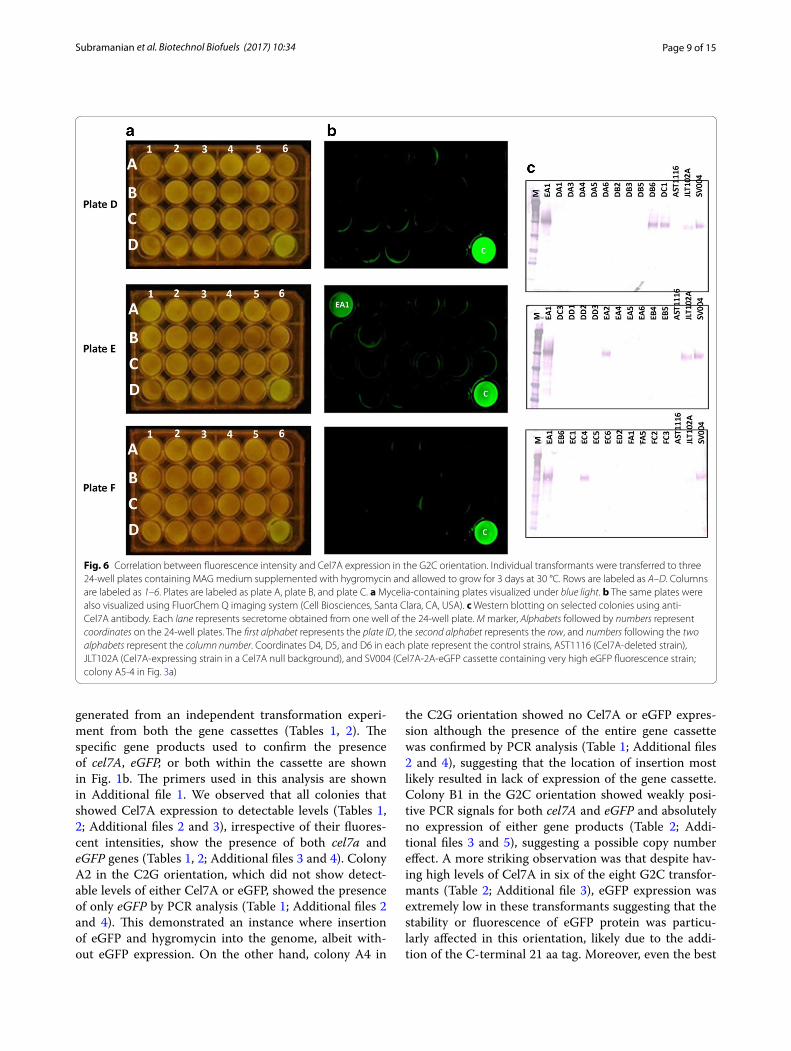
We further observed that in the C2G orientation, expression of eGFP was directly related to the expres-sion of Cel7A (Fig. 5). All the colonies that showed fluo-rescence on the plate (Fig. 5a, b) also showed expression of Cel7A in the western blot analysis (Fig. 5c). In con-trast, this was not the case with the G2C orientation. In the G2C population, the low fluorescent colonies varied in Cel7A expression (Figs. 6, 7b). A few of them, such as DB6, DC1, DD5, EA2, and EC4, showed positive Cel7A expression (Figs. 6, 7b). As could be expected from the fluorometer results, these colonies did not show sig-nificant fluorescence under the FluorChem Q imaging
Fig. 4 Cel7A protein purification and enzyme activity of the purified protein on pretreated corn stover (PCS) as a substrate. a Coomassie-stained SDS-PAGE gel showing a single band of ~53 kDa purified Cel7A protein. b A parallel SDS-PAGE gel was used to identify the purified proteins by western blotting using anti-Cel7A antibody. c Cellulase enzyme activity of Cel7A proteins obtained from expression of the two different versions of the 2A cassette (i.e., G2C and C2G), compared to purified P. funiculosum Cel7A, shows similar conversion pattern. M molecular weight marker, Lanes 1 and 2 represent purified Cel7A proteins from G2C and C2G cassettes, respectively. Lane C represents purified P. funiculosum Cel7A

Page 8 of 15Subramanian et al. Biotechnol Biofuels (2017) 10:34
system, indicating that even though they were express-ing Cel7A, eGFP was not a reliable indication of Cel7A expression. The sole high fluorescent colony (EA1) showed Cel7A expression similar to the C2G orientation (Figs. 6c, 7b). These results clearly suggest that in the G2C orientation, the fluorescence measurement cannot neces-sarily be correlated to the expression of Cel7A protein, especially in the low fluorescent clones. While we can-not explain the single high eGFP/high Cel7A clone, the overall low fluorescence, even among the Cel7A positive clones, could be explained by the fact that in the G2C ori-entation, a 21 amino acid remnant of the FMDV 2A pep-tide gets added to the C-terminal end of the processed eGFP protein (after cleavage of the 2A peptide), which is not the case with the C2G orientation. We speculate that addition of 21 amino acids to the eGFP C terminus affects
the overall stability of the protein, causes mis-folding, or interference with the fluorescence through quenching or electron transfer interference, resulting in lower levels of eGFP and/or lower fluorescence. Low anti-eGFP western blot detection suggests that degradation of eGFP from the G2C constructs is causing the discontinuity between Cel7A and eGFP protein levels in the G2C order. We can-not, however, rule out that the extra 21 amino acids on the G2C are interfering with anti-GFP antibody binding and detection. The single proline added to the N termi-nus of eGFP in the C2G orientation is much less likely to interfere with protein stability or function.
In order to determine if the lack of Cel7A or eGFP expression was due to non-insertion of gene(s) into the genome or due to fragmentation of the expression cas-sette, we performed genomic PCR analysis on colonies
Fig. 5 Correlation between fluorescence intensity and Cel7A expression in the C2G orientation. Individual transformants were transferred to three 24-well plates containing MAG medium supplemented with hygromycin and allowed to grow for 3 days at 30 °C. Rows are labeled as A–D. Columns are labeled as 1–6. Plates are labeled as plate A, plate B, and plate C. a Mycelia-containing plates visualized under blue light. b The same plates were also visualized using FluorChem Q imaging system (Cell Biosciences, Santa Clara, CA, USA). c Western blotting on selected colonies using anti-Cel7A antibody. Each lane represents secretome obtained from one well of the 24-well plate. M marker, letters followed by numbers represent coordinates on the 24-well plates. The first letter represents the plate ID, the second letter represents the row, and numbers following the two letters represent the column number. Coordinates D4, D5, and D6 in each plate represent the control strains, AST1116 (Cel7A-deleted T. reesei QM6a strain), JLT102A (AST1116 expressing native Cel7A under the eno promoter), and SV004 (Cel7A-2A-eGFP cassette containing very high eGFP fluorescence strain; colony A5-4 in Fig. 3a)
Page 9 of 15Subramanian et al. Biotechnol Biofuels (2017) 10:34
generated from an independent transformation experi-ment from both the gene cassettes (Tables 1, 2). The specific gene products used to confirm the presence of cel7A, eGFP, or both within the cassette are shown in Fig. 1b. The primers used in this analysis are shown in Additional file 1. We observed that all colonies that showed Cel7A expression to detectable levels (Tables 1, 2; Additional files 2 and 3), irrespective of their fluores-cent intensities, show the presence of both cel7a and eGFP genes (Tables 1, 2; Additional files 3 and 4). Colony A2 in the C2G orientation, which did not show detect-able levels of either Cel7A or eGFP, showed the presence of only eGFP by PCR analysis (Table 1; Additional files 2 and 4). This demonstrated an instance where insertion of eGFP and hygromycin into the genome, albeit with-out eGFP expression. On the other hand, colony A4 in
the C2G orientation showed no Cel7A or eGFP expres-sion although the presence of the entire gene cassette was confirmed by PCR analysis (Table 1; Additional files 2 and 4), suggesting that the location of insertion most likely resulted in lack of expression of the gene cassette. Colony B1 in the G2C orientation showed weakly posi-tive PCR signals for both cel7A and eGFP and absolutely no expression of either gene products (Table 2; Addi-tional files 3 and 5), suggesting a possible copy number effect. A more striking observation was that despite hav-ing high levels of Cel7A in six of the eight G2C transfor-mants (Table 2; Additional file 3), eGFP expression was extremely low in these transformants suggesting that the stability or fluorescence of eGFP protein was particu-larly affected in this orientation, likely due to the addi-tion of the C-terminal 21 aa tag. Moreover, even the best
Fig. 6 Correlation between fluorescence intensity and Cel7A expression in the G2C orientation. Individual transformants were transferred to three 24-well plates containing MAG medium supplemented with hygromycin and allowed to grow for 3 days at 30 °C. Rows are labeled as A–D. Columns are labeled as 1–6. Plates are labeled as plate A, plate B, and plate C. a Mycelia-containing plates visualized under blue light. b The same plates were also visualized using FluorChem Q imaging system (Cell Biosciences, Santa Clara, CA, USA). c Western blotting on selected colonies using anti-Cel7A antibody. Each lane represents secretome obtained from one well of the 24-well plate. M marker, Alphabets followed by numbers represent coordinates on the 24-well plates. The first alphabet represents the plate ID, the second alphabet represents the row, and numbers following the two alphabets represent the column number. Coordinates D4, D5, and D6 in each plate represent the control strains, AST1116 (Cel7A-deleted strain), JLT102A (Cel7A-expressing strain in a Cel7A null background), and SV004 (Cel7A-2A-eGFP cassette containing very high eGFP fluorescence strain; colony A5-4 in Fig. 3a)

Page 10 of 15Subramanian et al. Biotechnol Biofuels (2017) 10:34
Fig. 7 Fluorescence signal intensity of individual transformants and correlation with expression of Cel7A by western blotting. a Transformants for Cel7A-2A-eGFP were analyzed for fluorescence intensity and Cel7A expression. b Transformants for eGFP-2A-Cel7A were analyzed for fluorescence intensity and Cel7A expression. Fluorescence intensity was measured using FLUOstar Omega plate reader (BMG Labtech GmbH) and is represented using arbitrary fluorescence units. Western blotting was performed on cell-free media as shown in Figs. 4 and 5. Each bar represents data obtained for a single transformant colony. Blue bars indicate transformants showing no Cel7A expression. Yellow bars indicate transformants showing Cel7a expression. Red bars represent control strains. Controls: JLT102A (AST1116 expressing native Cel7A under the eno promoter), AST1116 (Cel7A-deleted T. reesei QM6a strain), and SV004 (AST1116 expressing Cel7A-2A-eGFP; colony A5-4 in Fig. 3a)

Page 11 of 15Subramanian et al. Biotechnol Biofuels (2017) 10:34
Cel7A-expressing transformant in this orientation (C6 and D1, Table 2; Additional file 3) showed lower fluores-cence and lower eGFP, in comparison to the best Cel7A-expressing transformants C2 and C5 from the C2G orientation (Table 1; Additional file 2).
It is known that some heterologous proteins do not express well in T. reesei unless fused to a native “leader” protein domain. We did not express eGFP as a single gene construct in order to confirm that it is expressible in T. reesei, and the fluorescence measured in the C2G
Table 1 PCR analysis of selected C2G transformants along with their protein expression and fluorescence intensity meas-urements
Fluorescent intensities are shown in arbitrary fluorescence units (FLU)
+ and − under western blot and PCR analysis columns represent presence or absence of the protein and gene, respectively, Faint represents very low, but detectable levels of the respective protein, ND denotes no data available, Controls JLT102A (AST1116 expressing native Cel7A under the eno promoter), AST1116 (Cel7A-deleted T. reesei QM6a strain), SV001 and SV002 (AST1116 expressing eGFP-2A-Cel7A; colonies C2-1 and D2-1 in Fig. 3a), and SV004 (AST1116 expressing Cel7A-2A-eGFP; colony A5-4 in Fig. 3a)
Transformants Fluorescence intensity
Western blot analysis PCR analysis
Cel7A eGFP PCR-1 PCR-2 PCR-3
A1 8393 + + + + +C2 16,062 + + + + +C4 2462 + + + + +C5 17,975 + + + + +D1 4358 + + + + +D3 7360 + + + + +A2 1976 − − − + −A4 2736 − − + + +AST1116 2130 − − − – −JLT102 2088 + − − – −SV001 ND + + − + +SV002 ND + + − + +SV004 10,539 + + + + +
Table 2 PCR analysis of selected G2C transformants along with their protein expression and fluorescence intensity meas-urements
Fluorescent intensities are shown in arbitrary fluorescence units (FLU)
Controls: JLT102A (AST1116 expressing native Cel7A under the eno promoter), AST1116 (Cel7A-deleted T. reesei QM6a strain), SV001 and SV002 (AST1116 expressing eGFP-2A-Cel7A; colonies C2-1 and D2-1 in Fig. 3a), SV004 (AST1116 expressing Cel7A-2A-eGFP; colony A5-4 in Fig. 3a)
+ and − under western blot and PCR analysis columns represent presence or absence of the protein and gene, respectively, Faint represents very low, but detectable levels of the respective protein, ND denotes no data available
Transformants Fluorescence Intensity
Western blot analysis results PCR analysis results
Cel7A eGFP PCR-1 PCR-2 PCR-3
C6 6193 + + + + +D1 6837 + + + + +C2 4194 + Faint + + +A1 4444 + Faint + + +A2 3684 + + + + +C3 3822 + + + + +C4 2099 Faint − + + +B1 2352 − − + + −AST1116 2032 − − − − −JLT102 2204 + − + − −SV001 ND + + + + +SV002 ND + + + + +SV004 13892 + + + + +
Page 12 of 15Subramanian et al. Biotechnol Biofuels (2017) 10:34
orientation could be interpreted as evidence that eGFP requires a leading peptide sequence for expression in T. reesei; however, the high level of Cel7A present in multi-ple G2C constructs negates this conclusion. In order for Cel7A to be expressed in the G2C construct, the eGFP must be translated first.
Given the theoretical equimolar expression levels of 2A peptide-linked proteins, we expected to be able to corre-late eGFP expression level measured by fluorescence to Cel7A expression level measured by western blot. Our intention was to identify colonies with varying levels of eGFP fluorescence and measure similarly varying levels of Cel7A. In all cases of high eGFP expression, we observed high Cel7A expression; however, the inverse, low/no eGFP and accompanying low/no Cel7A, was only consist-ent in the C2G case. In the other orientation (i.e., G2C), it is more stochastic, where even though eGFP fluorescence was low, Cel7a expression was still observed in some clones. This result indicates that decreased expression and/or functionality of eGFP due to added C-terminal amino acids to the final protein make the G2C orientation less reliable for transformant screening purposes. How-ever, based on Cel7A activity experiments, it is clear that Cel7A activities, in both the orientations, are the same.
ConclusionsAlthough T. reesei is known as a versatile cellulase-pro-ducing fungus and has been exploited intensively for this purpose, expressing heterologous proteins still remains a challenge in this organism. Here, we have demon-strated the use of a novel bicistronic expression platform to monitor co-expression of heterologous genes using eGFP as a marker. Our results have unequivocally dem-onstrated that two genes can be expressed successfully in T. reesei in a bicistronic manner from a single transcript using the 2A peptide approach. We have also shown that eGFP can be used as a fluorescent marker in T. reesei and that the levels of the transgene expression (in this case, cbh1) can be directly correlated to that of eGFP. We have also verified that the Cel7A activity toward pretreated corn stover is not affected by its orientation within the 2A cassette, although eGFP expression and/or stability are affected when specifically placed in the orientation that adds 21 amino acids to its C-terminal end (i.e., G2C orientation). We propose that this approach can be fur-ther extended to other cellulases in T. reesei and possibly to other transgenes, as long as addition of amino acids to the gene products’ C terminus does not affect their function. Furthermore, the 2A peptide approach can be expanded for expression of multiple proteins simultane-ously by introducing additional 2A peptide sequences between genes. Future work in our lab will involve developing this approach toward expressing complete
metabolic pathways, as well as multiple biomass conver-sion enzymes from a single transcript.
MethodsStrains and growth conditionsThe T. reesei strains AST1116 and JLT102A used in this study were routinely maintained on Mandels Andreotti minimal medium containing 5% glucose (MAG) as described in Linger et al. [5]. For strains resistant to hygromycin, MAG medium was supplemented with 100 µg/mL of this antibiotic. AST1116 was derived from T. reesei (Trichoderma reesei) QM6a by deletion of the native cbh1 gene [6]. JLT102A was derived from AST1116 by insertion of the native T. reesei cbh1 gene under the control of a constitutive eno promoter [5].
Plasmid constructionThe vector pTrEno-PF was used as a parent vector [5]. Two different FMDV 2A peptide-based constructs were designed by Genscript (Piscataway, NJ, USA). The first one, pTrEno-Cel7A-2A-eGFP (C2G) was constructed as follows. The FMDV 2A peptide sequence and an enhanced Green Fluorescent Protein (eGFP) sequence were codon optimized and synthesized by Genscript such that the 2A and the eGFP sequences were in-frame with each other. Furthermore, an XbaI site was introduced at either ends of this 2A-eGFP cassette so as to introduce this cassette into the pTrEno-PF vector into the XbaI site. Note that neither the 2A nor the eGFP sequences included a start codon. Additionally, the stop codon was also eliminated from the Cel7A gene so as to have a con-tiguous Cel7A-2A-eGFP gene sequence with one start codon at the 5′ end of Cel7A gene and a stop codon at the 3′ end of eGFP coding sequence.
The second vector, pTrEno-eGFP-2A-Cel7A (G2C), was constructed as follows by Genscript. Briefly, a codon-optimized eGFP sequence along with a 2A pep-tide sequence was synthesized with a PacI and a BamHI restriction sites flanking its 5′ and 3′ ends. This eGFP-2A cassette was introduced into the pTrEno-PF vec-tor using PacI and BamHI restriction sites. Note that BamHI restriction site was built into the parent vector by PCR. The resulting vector now had the following gene sequence eGFP-2A-Cel7A. This contiguous gene cassette had only one start codon at the 5′ end of the eGFP gene and a stop codon at the 3′ end of the Cel7A gene.
Transformation of plasmids into T. reeseiCompetent spores were prepared as described in Lin-ger et al. [5], which involved time-specific sporulation on potato dextrose agar (PDA), followed by re-sporu-lation, collection, and washing of spores before freez-ing at −80 °C as electro-competent spore stocks. 5 µg
Page 13 of 15Subramanian et al. Biotechnol Biofuels (2017) 10:34
of plasmid was linearized with SbfI and further purified using DNA clean and concentrator-5 kit (Zymo Research Corp, Irvine, CA). Frozen competent spores were thawed on ice and mixed with ~1.0 µg of the linearized plasmid. Electroporation was carried out using a Bio-Rad Gene Pulser (Bio-Rad Laboratories, Inc., Hercules, CA, USA) using the following conditions: 1.8 kV, 25 µF, 800 Ω, and incubated for few min on ice. 1 mL of ‘complete medium lactose’ medium was then added to the transformation mixture and transferred to six-well tissue culture plates and incubated at RT for 18 h to allow recovery and ger-mination of spores. 200 µL of this cell suspension was then plated on PDA containing 100 µg/mL hygromycin and 0.1% (v/v) Triton X-100 for colony size restriction (PDHX) and incubated at 30 °C in lighted incubator for 2–3 days to allow colony development.
Screening of transformants by western blottingA small piece of mycelial fragment from transformant col-onies grown on PDHX plates was transferred to 2 mL of MAG medium containing hygromycin (100 µg/mL) in a 24-well microtiter plate and incubated statically in a lighted 30 °C incubator for 3 days till a mycelial mat was observed on the liquid medium. 15 µL of cell-free culture broth (con-taining secreted proteins) was transferred to microcentri-fuge tubes containing 5 µL SDS-PAGE loading buffer and subjected to boiling at 95 °C for 10 min. This protein extract was separated on 4–12% NuPAGE gel in MOPS buffer (200 V for 50 min). Post-separation, proteins were electro-transferred onto PVDF membrane for western blot analy-sis using an iBlot2 (Thermo Fisher Scientific, Inc. Grand Island, NY, USA). For hybridization of Cel7A protein, a custom generated P. funiculosum anti-Cel7A polyclonal antibody raised in rabbit was used as primary antibody at a dilution of 1:20,000. For detection of eGFP, anti-GFP anti-body raised in mouse (Thermo Fisher Scientific Inc., Grand Island, NY, USA) was used as the primary antibody. Detec-tion of cel7A and eGFP proteins was carried out using alka-line phosphatase-conjugated anti-rabbit secondary antibody (Thermo Fisher Scientific, Inc. Grand Island, NY, USA), and HRP-conjugated anti-mouse secondary antibody (Thermo Fisher Scientific, Inc., Grand Island, NY, USA), respectively.
Cel7A purificationThe Cel7A was purified as described earlier [5]. Briefly, fermentation broths (~8–10 L) were harvested, vacuum filtered, concentrated, and then loaded onto a 26/10 Phe-nyl Sepharose Fast Flow column. Buffer A was 20 mM Bis–Tris pH 6.5 and buffer B was 20 mM Bis–Tris pH 6.5, 2.0 M (NH4)2SO4. After binding and washing, a descend-ing gradient of 80% B (1.6 M (NH4)2SO4) to 0% B over eight column volumes was used to elute the bound pro-teins from the column. Active fractions were identified
by a p-nitrophenyl-β-(1→4)-d-lactopyranoside (pNP-L) activity assay. The pNP-L-active fractions were pooled and concentrated as needed. Protein was desalted and exchanged into 20 mM Bis–Tris buffer pH 6.5. This sam-ple was then loaded onto a Tricorn 10/100 anion exchange column packed with Source 15Q and eluted with a 0–50% salt gradient over 30 column volumes. Buffers were 20 mM Bis–Tris pH 6.5 (A) and the same supplemented with 1.0 M NaCl (B). pNP-L activity was followed again to identify the active fractions. Active fractions were pooled, brought to 1.5 M (NH4)2SO4 in 20 mM Bis–Tris pH 6.5, loaded onto a Tricorn 10/100 Source-Iso column, washed, and eluted with a descending gradient from 1.6 to 0.4 M (NH4)2SO4. Active fractions were concentrated to <10 mL and subjected to size exclusion chromatography using a 26/60 Superdex 75 column and 20 mM sodium acetate buffer pH 5.0 containing 100 mM NaCl as the mobile phase. All chromatography buffers contained 0.02% (w/v) NaN3 as a microbial inhibitor. SDS-PAGE and anti-Cel7A immunoblotting were performed to assess purity.
Fluorescence quantitationA small mycelial fragment from a transformant col-ony was transferred to 24-well plates containing MAG medium (with hygromycin) and incubated for 3 days at 30 °C to allow mycelial mat formation. Following growth of the mycelial mat, plates were directly visualized in a FLUOstar Omega plate reader (BMG Labtech GmbH, Ortenburg, Germany) using excitation wavelength of 485 nm and an emission wavelength of 520 nm. Each plate included a control eGFP-Cel7A-co-expressing strain (SV004), a Cel7A-expressing strain (JLT102A), and a Cel7A-deleted strain (AST1116).
Cel7A enzyme activity measurementCellobiohydrolase (Cel7A) activity was based on the conversion of the cellulose fraction of a standard dilute acid-pretreated corn stover (PCS) using a cocktail of the subject Cel7A mixed with two other standardized cellulases. Specifically, the purified Cel7A was loaded at 28 mg/g of biomass cellulose and the two ancillary enzymes, the endoglucanase Acidothermus cellulolyticus E1 cdY245G (Cel5A, catalytic domain, Y245G mutant) and chromatographically purified β-d-glucosidase from Aspergillus niger, were loaded at 1.89 and 0.5 mg/g bio-mass cellulose, respectively.
The Cel7A activity assay was performed essentially as described in Linger et al. [5]. Briefly, the biomass sub-strate, NREL dilute acid-pretreated corn stover P050921 (59.1% glucan, 25.3% lignin, 5.1% xylan), was washed with water and then with 20 mM acetic acid/sodium acetate buffer, pH 5.0, until the pH of the wash supernatant was within 0.03 units of pH 5.0 [20]. From a slurry of this
Page 14 of 15Subramanian et al. Biotechnol Biofuels (2017) 10:34
washed biomass material, a series of biomass substrate aliquots were prepared in 2.0-mL high-performance liq-uid chromatography (HPLC) vials, in such a way that each vial contained 8.5 mg biomass cellulose. Biomass dry weights for this batch of assay vials was verified by dry weight determinations on a group of five samples co-pipetted into pre-tared vials. Adjustment of these biomass assay aliquots to a 1.7 mL final volume was done by the addition of the enzyme cocktail, which resulted in a cel-lulose concentration of 5.0 mg/mL in the assay mixture.
Assays were carried out in triplicate vials at 40 °C in 20 mM acetate buffer pH 5.0 containing 0.02% NaN3 with continuous mixing by inversion at 10 rpm while immersed in a water bath. At various times during the digestion, vials were removed from the rotator, and repre-sentative 100 μL samples containing both solids and liquid were removed from the well-mixed contents and diluted 18 folds into glass HPLC vials. The primary digestion vials were immediately resealed and returned to the rotator for continuation of the digestion process. The vials containing the samples were crimp-sealed and immersed in a boil-ing water bath to terminate the reaction. Quantification of released sugars was performed by high-performance liquid chromatography using a Bio-Rad HPX-87H column operated at 55 °C with 0.01 N H2SO4 as eluent at 0.6 mL/min and refractive index detection.
Additional files
Additional file 1. Primers used for PCR analysis.
Additional file 2. Detection of Cel7A and eGFP proteins in the selected C2G transformants. A. Extracellular Cel7A detection using anti-Cel7A anti-body. B. Intracellular eGFP detection using anti-eGFP antibody. Lanes M. Molecular weight marker; A1, C2, C4, C5,D1, D3, A2 and A4, transformant colonies; Ast, AST1114 (Cel7A deleted T. reesei QM6A strain); JLT, JLT102A (AST1116 expressing native Cel7A under the eno promoter); SV004, AST1116 expressing Cel7A-2A-eGFP.
Additional file 3. Detection of Cel7A and eGFP proteins in the selected G2C transformants. A. Extracellular Cel7A detection using anti-Cel7A anti-body. B. Intracellular eGFP detection using anti-eGFP antibody. Lanes M. Molecular weight marker; C6, D1, C2, A1, A2, C3, C4 and B1, transformant colonies; Ast, AST1114 (Cel7A deleted T. reesei QM6A strain); JLT, JLT102A (AST1116 expressing native Cel7A under the eno promoter); SV004, AST1116 expressing Cel7A-2A-eGFP.
Additional file 4. PCR analysis to determine the presence of cel7A, eGFP and both in the C2G transformants. Lanes M. Molecular weight marker (GeneRuler 1kb DNA ladder); A1, C2, C4, C5,D1, D3, A2 and A4, C2G trans-formant colonies; AST1114, Cel7A deleted T. reesei QM6A strain); JLT102A, AST1116 expressing native Cel7A under the eno promoter; SV001 and SV002, AST1116 expressing eGFP-2A-Cel7A; SV004, AST1116 expressing Cel7A-2A-eGFP.
Additional file 5. PCR analysis to determine the presence of cel7A, eGFP and both in the G2C transformants. PCR analysis to determine the presence of cel7A, eGFP and both in the G2C transformants. Lanes M. Molecular weight marker (GeneRuler 1kb DNA ladder); C6, D1, C2, C3, A1, A2 C4 and B1, G2C transformant colonies; AST1114, Cel7A deleted T. reesei QM6A strain); JLT102A, AST1116 expressing native Cel7A under the eno promoter; SV001 and SV002, AST1116 expressing eGFP-2A-Cel7A; SV004, AST1116 expressing Cel7A-2A-eGFP.
AbbreviationseGFP: enhanced green fluorescent protein; Cel7A: cellobiohydrolase I; cbh1: cellobiohydrolase I gene; MAG: Mandels Andreotti minimal medium with 5% glucose; pNP-L: p-nitrophenyl-β-(1→4)-d-lactopyranoside; HRP: horse radish peroxidase; PDHX: potato dextrose with hygromycin and Triton X-100; PVDF: polyvinylidene difluoride.
Authors’ contributionsVS was involved in conception, experimental design, plasmid construction, and authoring the manuscript. LAS and KTM were involved in carrying out screening and western blotting. LET was involved in protein purification. JOB performed the cellulase enzyme activity assay. TAV performed the T. reesei fermentations. JGL was involved in gene construct designing and guidance with transformation and expression screening. MEH was involved in concep-tion and project leadership. SRD was involved in guidance with experimental strategies, technical direction, writing, and editing the manuscript. All authors read and approved the final manuscript.
Author details1 Biosciences Center, National Renewable Energy Laboratory, 15013 Denver West Parkway, Golden, CO 80401, USA. 2 National Bioenergy Center, National Renewable Energy Laboratory, 15013 Denver West Parkway, Golden, CO 80401, USA.
AcknowledgementsThis work was supported by the U.S. Department of Energy under Contract DE-AC36–08GO28308 with the National Renewable Energy Laboratory and by the Department of Energy Office of Energy Efficiency and Renewable Energy, Bioenergy Technologies Office (BETO).
Competing interestsThe authors declare that they have no competing interests.
Availability of supporting dataAll data generated and analyzed during this study are included in this article and its supplementary information files.
FundingThis work was supported by the U.S. Department of Energy under Contract DE-AC36–08GO28308 with the National Renewable Energy Laboratory and by the Department of Energy Office of Energy Efficiency and Renewable Energy, Bioenergy Technologies Office (BETO).
Received: 1 October 2016 Accepted: 12 January 2017
References 1. Cherry JR, Fidantsef AL. Directed evolution of industrial enzymes: an
update. Curr Opin Biotechnol. 2003;14(4):438–43. 2. Schuster A, Schmoll M. Biology and biotechnology of Trichoderma. Appl
Microbiol Biotechnol. 2010;87(3):787–99. 3. Koushki M, Rouhani H, Farsi M. Genetic manipulation of fungal strains for
the improvement of heterologous genes expression (a mini-review). Afr J Biotechnol. 2011;10(41):7939–48.
4. Li J, Wang J, Wang S, Xing M, Yu S, Liu G. Achieving efficient protein expression in Trichoderma reesei by using strong constitutive promoters. Microb Cell Fact. 2012;11:84.
5. Linger JG, Taylor LE II, Baker JO, Vander Wall T, Hobdey SE, Podkaminer K, et al. A constitutive expression system for glycosyl hydrolase family 7 cellobiohydrolases in Hypocrea jecorina. Biotechnol Biofuels. 2015;8:45.
6. Singh A, Taylor LE, Vander Wall TA, Linger J, Himmel ME, Podkaminer K, et al. Heterologous protein expression in Hypocrea jecorina: a historical perspective and new developments. Biotechnol Adv. 2015;33(1):142–54.
7. Peterson R, Nevalainen H. Trichoderma reesei RUT-C30–thirty years of strain improvement. Microbiology. 2012;158(Pt 1):58–68.
8. Guangtao Z, Hartl L, Schuster A, Polak S, Schmoll M, Wang T, et al. Gene targeting in a nonhomologous end joining deficient Hypocrea jecorina. J Biotechnol. 2009;139(2):146–51.

Page 15 of 15Subramanian et al. Biotechnol Biofuels (2017) 10:34
• We accept pre-submission inquiries
• Our selector tool helps you to find the most relevant journal
• We provide round the clock customer support
• Convenient online submission
• Thorough peer review
• Inclusion in PubMed and all major indexing services
• Maximum visibility for your research
Submit your manuscript atwww.biomedcentral.com/submit
Submit your next manuscript to BioMed Central and we will help you at every step:
9. Mustalahti E, Saloheimo M, Joensuu JJ. Intracellular protein production in Trichoderma reesei (Hypocrea jecorina) with hydrophobin fusion technol-ogy. N Biotechnol. 2013;30(2):262–8.
10. Schuster A, Bruno KS, Collett JR, Baker SE, Seiboth B, Kubicek CP, et al. A versatile toolkit for high throughput functional genomics with Tricho-derma reesei. Biotechnol Biofuels. 2012;5(1):1.
11. Steiger MG, Vitikainen M, Uskonen P, Brunner K, Adam G, Pakula T, et al. Transformation system for Hypocrea jecorina (Trichoderma reesei) that favors homologous integration and employs reusable bidirectionally selectable markers. Appl Environ Microbiol. 2011;77(1):114–21.
12. Donnelly ML, Gani D, Flint M, Monaghan S, Ryan MD. The cleavage activi-ties of aphthovirus and cardiovirus 2A proteins. J Gen Virol. 1997;78(Pt 1):13–21.
13. Ryan MD, Drew J. Foot-and-mouth disease virus 2A oligopeptide medi-ated cleavage of an artificial polyprotein. EMBO J. 1994;13(4):928–33.
14. Donnelly ML, Hughes LE, Luke G, Mendoza H, ten Dam E, Gani D, et al. The ‘cleavage’ activities of foot-and-mouth disease virus 2A site-directed mutants and naturally occurring ‘2A-like’ sequences. J Gen Virol. 2001;82(Pt 5):1027–41.
15. Donnelly ML, Luke G, Mehrotra A, Li X, Hughes LE, Gani D, et al. Analysis of the aphthovirus 2A/2B polyprotein ‘cleavage’ mechanism indicates not a proteolytic reaction, but a novel translational effect: a putative ribosomal ‘skip’. J Gen Virol. 2001;82(Pt 5):1013–25.
16. Radcliffe PA, Mitrophanous KA. Multiple gene products from a single vec-tor: ‘self-cleaving’ 2A peptides. Gene Ther. 2004;11:1673–4.
17. de Felipe P, Luke GA, Hughes LE, Gani D, Halpin C, Ryan MD. E unum pluribus: multiple proteins from a self-processing polyprotein. Trends Biotechnol. 2006;24(2):68–75.
18. Hellen CU, Sarnow P. Internal ribosome entry sites in eukaryotic mRNA molecules. Genes Dev. 2001;15(13):1593–612.
19. Geier M, Fauland P, Vogl T, Glieder A. Compact multi-enzyme pathways in P pastoris. Chem Commun. 2015;51:1643–6.
20. Schell DJ, Farmer J, Newman M, McMillan JD. Dilute-sulfuric acid pretreatment of corn stover in pilot-scale reactor: investigation of yields, kinetics, and enzymatic digestibilities of solids. Appl Biochem Biotechnol. 2003;105–108:69–85.