A Two-level Pose Estimation Framework Using Majority Voting of Gabor Wavelets and Bunch Graph...
15
A Two-level Pose Estimation Framework Using Majority Voting of Gabor Wavelets and Bunch Graph Analysis J. Wu, J. M. Pedersen, D. Putthividhya, D. Norgaard, T. Moeslund and M. M. Trivedi Computer Vision and Robotics Lab University of California, San Diego La Jolla, CA, U.S.A.
-
Upload
emma-robbins -
Category
Documents
-
view
213 -
download
0
Transcript of A Two-level Pose Estimation Framework Using Majority Voting of Gabor Wavelets and Bunch Graph...

A Two-level Pose Estimation Framework Using Majority Voting of
Gabor Waveletsand Bunch Graph Analysis
J. Wu, J. M. Pedersen, D. Putthividhya, D. Norgaard, T. Moeslund and M. M. Trivedi
Computer Vision and Robotics LabUniversity of California, San Diego
La Jolla, CA, U.S.A.

INTRODUCTION
Applications:
•Intelligent meeting room
•Driver’s focus analysis
Problem setup:
•Pose is determined by both pan angle (ß) and tilt angle (α)
•For attention focus problem, both angles need to be determined in a fine scale

PROBLEM DESCRIPTION
•93 poses in total
•Pan angle goes from –900 to +900 with discrete interval of 150
•Tilt angle goes from –900 to +900
with interval steps of either 150 or 300
•For every pose, 15 images from 15 subjects are used as training samples while another 15 images from the same 15 subjects are used as the testing samples

POSE ESTIMATION FRAMEWORK
Two level structure---coarse to fine:
•First level: pose estimation is accurate up to a 3x3 neighborhood
•Second level: accurate pose is determined in the 3x3 neighborhood
First level output
Second level output

FIRST LEVEL: Multi-resolution subspace classification by majority
voting•Motivation:
–Features from one single resolution are not sufficient –Finer resolution: salient features are less addressed–Coarser resolution: loss of information
–For features from different resolutions, different sets of salient features are addressed–They are equally important for classification
•Algorithm details:–Multi-resolution feature extraction
–Gabor wavelets----multi-scale and multi-orientation analysis –Subspace feature extraction
–PCA subspace feature extraction–KDA subspace feature extraction
–Nearest prototype classification in every resolution and majority voting for classification results from different resolutions

GABOR WAVELETS ANALYSIS
• Why Gabor wavelets:– A joint spatial frequency representation – Extract the position and orientation of both global and local features as
well as preserving frequency information.
• What is Gabor wavelets:– A convolution of the image with a family of Gabor kernels – All Gabor kernels are generated by a mother wavelet by dilation and
rotation– Mother wavelet: a plane wave generated from a complex exponential
and restricted by a Gaussian envelope
2expexp,:
2 xkixkBxk
2
2
2
2
2
2exp, x
kkxkB
22~ kx
k
xkkxk
01
2
;

PCA V.S. KDA
• Why subspace analysis:– Extract the most discriminating information– Reduce the dimensionality
• PCA:– Linear transformation– The first M eigenvectors of the samples’ covariance matrix– Selects the directions that have most variance
• Why not PCA:– Not capable of extracting the non-linear structure– Not necessarily the best discriminating features for classification
• KDA:– Non-linear variant of LDA– Finds the projection according to the Fisher’s criterion, which maximizes the
Rayleigh coefficient
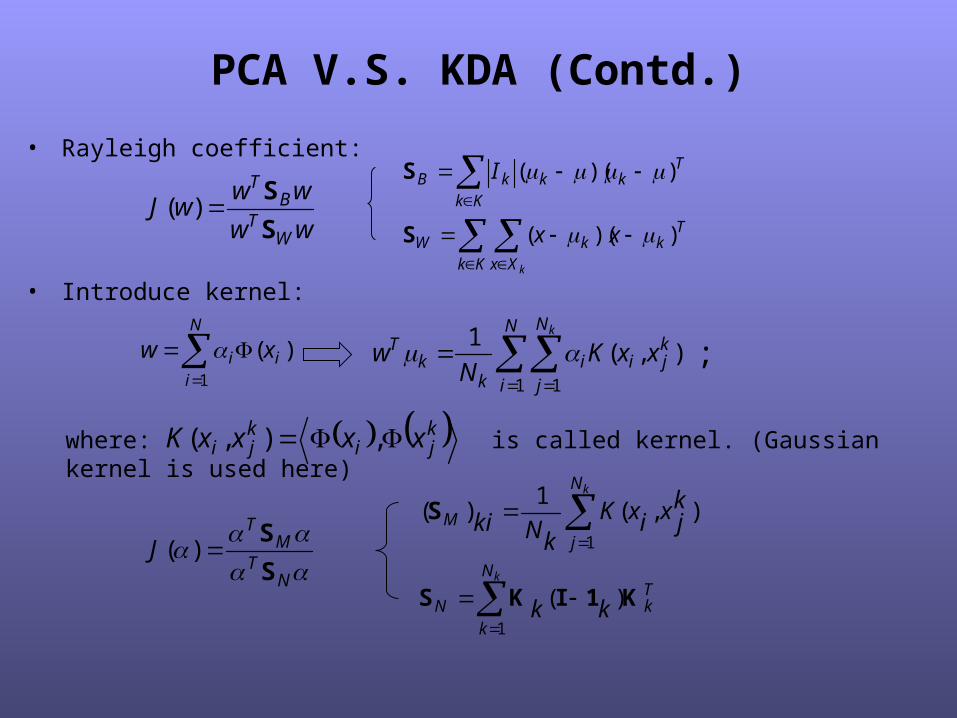
PCA V.S. KDA (Contd.)
• Rayleigh coefficient:
ww
wwwJ
WT
BT
S
S)(
Kk
TkkkB I ))(( S
Kk Xx
TkkW
k
xx ))(( S
• Introduce kernel:
N
iii xw
1
)(
N
i
N
j
kjii
kk
Tk
xxKN
w1 1
),(1 ;
kjikji xxxxK ,),(where: is called kernel. (Gaussian kernel is
used here)
NT
MT
JS
S)(
kN
jM
kjxixK
kNki
1
),(1
)(S
kN
k
TkN kk
1
)( K1IKS
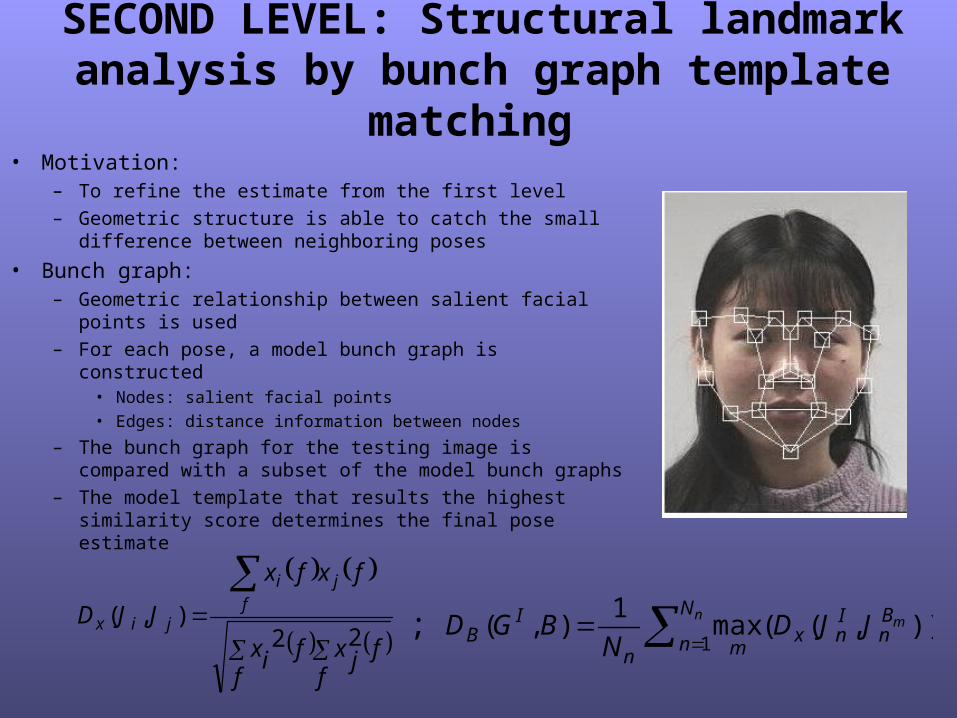
SECOND LEVEL: Structural landmark analysis by bunch graph template
matching • Motivation:
– To refine the estimate from the first level– Geometric structure is able to catch the small
difference between neighboring poses
• Bunch graph:– Geometric relationship between salient facial points
is used– For each pose, a model bunch graph is constructed
• Nodes: salient facial points• Edges: distance information between nodes
– The bunch graph for the testing image is compared with a subset of the model bunch graphs
– The model template that results the highest similarity score determines the final pose estimate
f ffjxfix
fxfx
JJD fji
jix22
),( n m
N
n
Bn
Inx
mn
IB JJD
NBGD
1)),((max
1),(;

EXPERIMENTAL EVALUATION
3X3 5X5
PCA Subspace
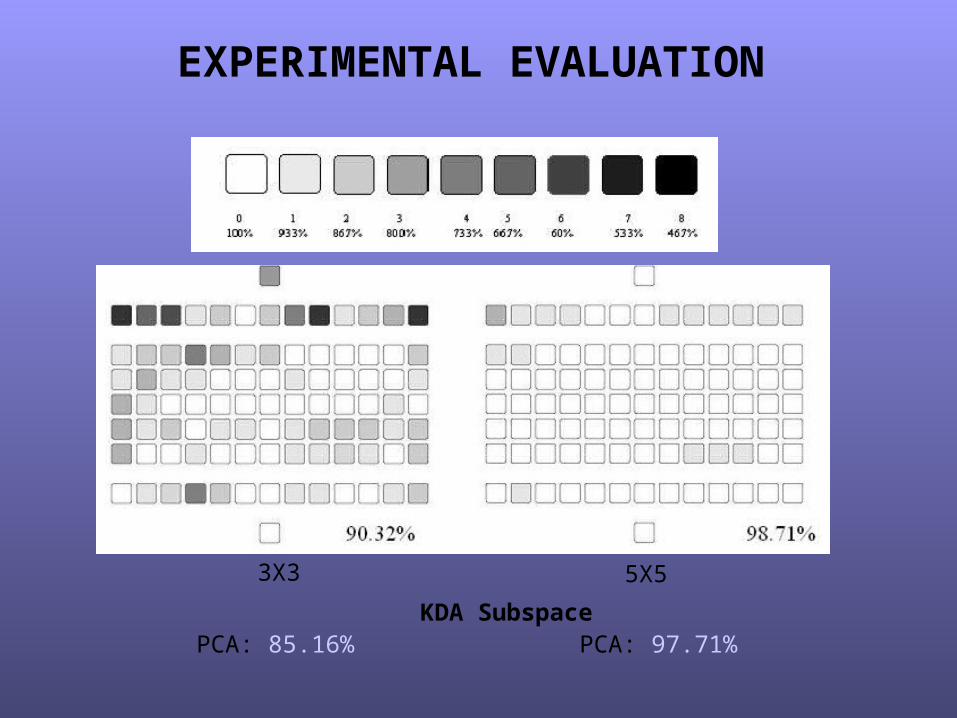
EXPERIMENTAL EVALUATION
3X3 5X5
KDA SubspacePCA: 85.16% PCA: 97.71%

SECOND LEVEL EVALUATION# % # % # % # % # % # %
0 --- 17 66.7 34 66.7 51 60.0 68 73.3 85 73.3
1 40.0 18 73.3 35 60.0 52 60.0 69 73.3 86 86.7
2 46.7 19 66.7 36 40.0 53 33.3 70 60.0 87 40.0
3 33.3 20 53.3 37 33.3 54 66.7 71 86.7 88 46.7
4 33.3 21 73.3 38 46.7 55 60.0 72 66.7 89 33.3
5 66.7 22 53.3 39 53.3 56 26.7 73 93.3 90 60.0
6 73.3 23 53.3 40 60.0 57 66.7 74 66.7 91 67.7
7 46.7 24 46.7 41 86.7 58 66.7 75 80.0 92 ----
8 73.3 25 46.7 42 66.7 59 60.0 76 46.7
9 46.7 26 40.0 43 86.7 60 73.3 77 53.3
10 20.0 27 53.3 44 80.0 61 60.0 78 73.3
11 26.7 28 66.7 45 86.7 62 40.0 79 26.7
12 46.7 29 53.3 46 66.7 63 46.7 80 73.3
13 26.7 30 53.3 47 66.7 64 26.7 81 53.3
14 53.3 31 60.0 48 80.0 65 40.0 82 67.7
15 40.0 32 46.7 49 73.3 66 66.7 83 53.3
16 80.0 33 60.0 50 67.7 67 60.0 84 86.7

SECOND LEVEL EVALUATION
58.02%

CONCLUSION AND DISCUSSION• Visual cues characterizing facial pose have unique multi-resolution
spatial frequency and structural signatures• In the first level, the statistical multi-resolution subspace analysis
gives the pose estimation with an uncertainty of ±15 degree, 90.32% accuracy is achieved
• In the second level, the structural details are exploited to eliminate the uncertainty, 58.02% accuracy is achieved
• In the first level, the face registration is done manually, automatic face registration by facial landmark detection algorithm is under investigation and some promising preliminary results have been obtained

THANK YOU!