A TRIAL BURN OF RAPE STRAW AND WHOLE CROPS …webarchive.nationalarchives.gov.uk/+/ · power plant...
83
A TRIAL BURN OF RAPE STRAW AND WHOLE CROPS HARVESTED FOR ENERGY USE TO ASSESS EFFICIENCY IMPLICATIONS B/U1/00768/00/00 URN 03/1569 Contractor Energy Power Resources Ltd Prepared by Robert Newman Subcontractors Anglian Straw Ltd The work described in this report was carried out under contract as part of the New & Renewable Energy Programme, managed by ETSU on behalf of the Department of Trade & Industry. The views and judgments expressed in this report are those of the contractor and do not necessarily reflect those of ETSU or the Department of Trade & Industry. First Published November 2003 © Crown copyright 2003
Transcript of A TRIAL BURN OF RAPE STRAW AND WHOLE CROPS …webarchive.nationalarchives.gov.uk/+/ · power plant...

A TRIAL BURN OF RAPE STRAW ANDWHOLE CROPS HARVESTED FOR
ENERGY USE TO ASSESSEFFICIENCY IMPLICATIONS
B/U1/00768/00/00URN 03/1569
ContractorEnergy Power Resources Ltd
Prepared byRobert Newman
Subcontractors
Anglian Straw Ltd
The work described in this report was carried outunder contract as part of the New & RenewableEnergy Programme, managed by ETSU on behalf ofthe Department of Trade & Industry. The views andjudgments expressed in this report are those of thecontractor and do not necessarily reflect those ofETSU or the Department of Trade & Industry.
First Published November 2003 © Crown copyright 2003
i
EXECUTIVE SUMMARY
Project Objectives
To establish if it is possible to successfully burn rape straw and whole crops, in an existing biomasspower plant and to assess the impact and implications of burning these crops. This would beundertaken by comparison with conventional cereal straw in the following main steps.
a) Select, harvest, bale and deliver suitable quantities of each straw type to the powerstation for combustion trials.
b) Undertake monitored combustion trials of cereal straw (base case), oil seed rapestraw and whole crop material.
c) Identify any impacts on fuel delivery and fuel handling equipment at the plant.
d) Identify any impact on combustion and emissions.
e) Identify the chief financial implications of utilising rape straw and whole cropmaterial.
Background
The UK produces around 15 million tonnes of straw each year of which approximately one halfis used for animal feed and bedding. A renewables industry based on straw could utilize theremaining half for energy production and provide up to 1% of the UK’s energy requirements.
If the UK is to achieve the Governments objective of a 10% contribution from renewable energyby 2010, it is clear that biomass utilization will have to increase substantially and alternatives tocereal straw such as oil seed rape straw and ‘Energy Crop’ production will have to be harnessed.
Historically grain from cereal crops has been the arable farmer’s main source of income and theincome from straw sales has been small in comparison. An increase in the availability of oilseed rape straw has occurred in recent years as a consequence of industrial oil seed rapeproduction.
Whole crops harvested specifically for energy use and rape straw were not originally considered as a fuelfor the Elean project. The availability of rape straw in the projects catchment area was originallyconsidered too low when compared to cereal straw. Experience from Denmark further suggested thatrape straw could also be much higher in chloride and sulphur compounds than the conventional wheatand barley based straw typically used. However, if rape and whole crops, harvested for energy use, werefound to be a suitable fuel, it could not only underpin the fuel resource potential for this existing plant,but also open up this potential energy resource for further biomass plant development in the UK.Adoption of these fuels would reduce the dependency and risks associated with the use of only one fueltype. It could also allow alternative periods of the year for harvesting, when equipment is not beingutilised elsewhere, to increase the availability of fuel supply.

ii
Project Staff and Contractors
A postgraduate student from Cranfield University, carried out the combustion trials on behalf ofEPR Ltd, over three twenty four hour periods between June and July 2002, as part of a biggerstudy to complete a Masters thesis. The author undertook a further and more detailed evaluation.
EPRL undertook an initial survey to establish the quantities of OSR and whole crop material andtheir availability of supply to the power station. Anglian Straw Ltd then provided suitablequantities of hesston bales, for each variety of fuel, from the field to the power station. As muchfuel of each variety was purchased to enable 24 hours of operation when supplemented with hayand cereal straw as a balancing fuel stock, see table 4.2.
The operating staff at EPR Ely Ltd undertook operation of the plant, collection of data, recordeddetails and general plant observations.
Summary Of Work
Provision of suitable supply sources was established well in advance of the trials and all fuelswere harvested and baled in the field. These fuel sources were then transported independently tothe power station and stored in the straw barns in designated sections to avoid accidental mixingwith other fuels.
The first trial was carried out on the 19th June using wheat based cereal straw. The second trialwas completed on the 17th July, using 92% OSR. The last trial was completed on the 18th Julyusing 65% whole crop fuel. Whole crop was restricted to around two thirds of fuel supply partlybecause insufficient fuel was available at the time of the test and partly because it was fearedthat the higher density grain content could cause instability in furnace combustion. Theremainder of the fuel was therefore made up of predominantly wheat straw and hay to minimisethis risk and ensure sufficient fuel for a 24-hour trial.
The methodology for completing the test work involved three separate aspects of data collection.The fist was interpretation of the various data logged parameters within the power station toallow performance and stack emissions to be evaluated. The second was the collection of cropsamples delivered to the plant to allow fuel and ash analysis. The third was the collection ofbottom ash and fly ash, from each combustion trial, for analysis.
Evaluation of the recorded and logged data was undertaken in the normal power station mannerand followed the guide lines set out in DIN 1942, which is a Europe wide accepted standard forundertaking and evaluating a boiler test.
Results
The initial survey revealed that around 60,000 tonnes of OSR straw and around 200,000 tonnesof whole crop could reasonably be available as fuel to the power station. This would more thanmatch the current cereal requirement of 200,000 tonnes.
A method of assessing each type of fuel was developed prior to the test work (refer section 3.3)and was designed to ensure that any particular impact on operation and performance was clearlyobserved and reported. Performance was assessed against these parameters:
iii
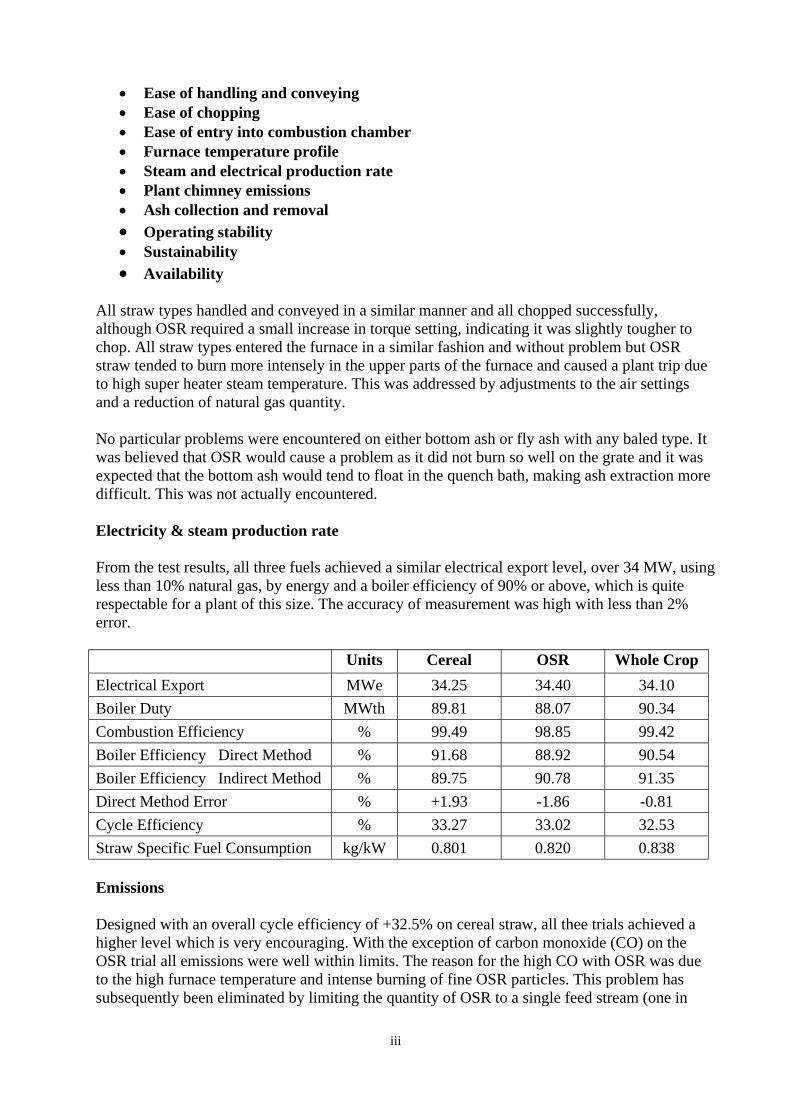
• Ease of handling and conveying• Ease of chopping• Ease of entry into combustion chamber• Furnace temperature profile• Steam and electrical production rate• Plant chimney emissions• Ash collection and removal• Operating stability• Sustainability
• Availability
All straw types handled and conveyed in a similar manner and all chopped successfully,although OSR required a small increase in torque setting, indicating it was slightly tougher tochop. All straw types entered the furnace in a similar fashion and without problem but OSRstraw tended to burn more intensely in the upper parts of the furnace and caused a plant trip dueto high super heater steam temperature. This was addressed by adjustments to the air settingsand a reduction of natural gas quantity.
No particular problems were encountered on either bottom ash or fly ash with any baled type. Itwas believed that OSR would cause a problem as it did not burn so well on the grate and it wasexpected that the bottom ash would tend to float in the quench bath, making ash extraction moredifficult. This was not actually encountered.
Electricity & steam production rate
From the test results, all three fuels achieved a similar electrical export level, over 34 MW, usingless than 10% natural gas, by energy and a boiler efficiency of 90% or above, which is quiterespectable for a plant of this size. The accuracy of measurement was high with less than 2%error.
Units Cereal OSR Whole Crop
Electrical Export MWe 34.25 34.40 34.10
Boiler Duty MWth 89.81 88.07 90.34
Combustion Efficiency % 99.49 98.85 99.42
Boiler Efficiency Direct Method % 91.68 88.92 90.54
Boiler Efficiency Indirect Method % 89.75 90.78 91.35
Direct Method Error % +1.93 -1.86 -0.81
Cycle Efficiency % 33.27 33.02 32.53
Straw Specific Fuel Consumption kg/kW 0.801 0.820 0.838
Emissions
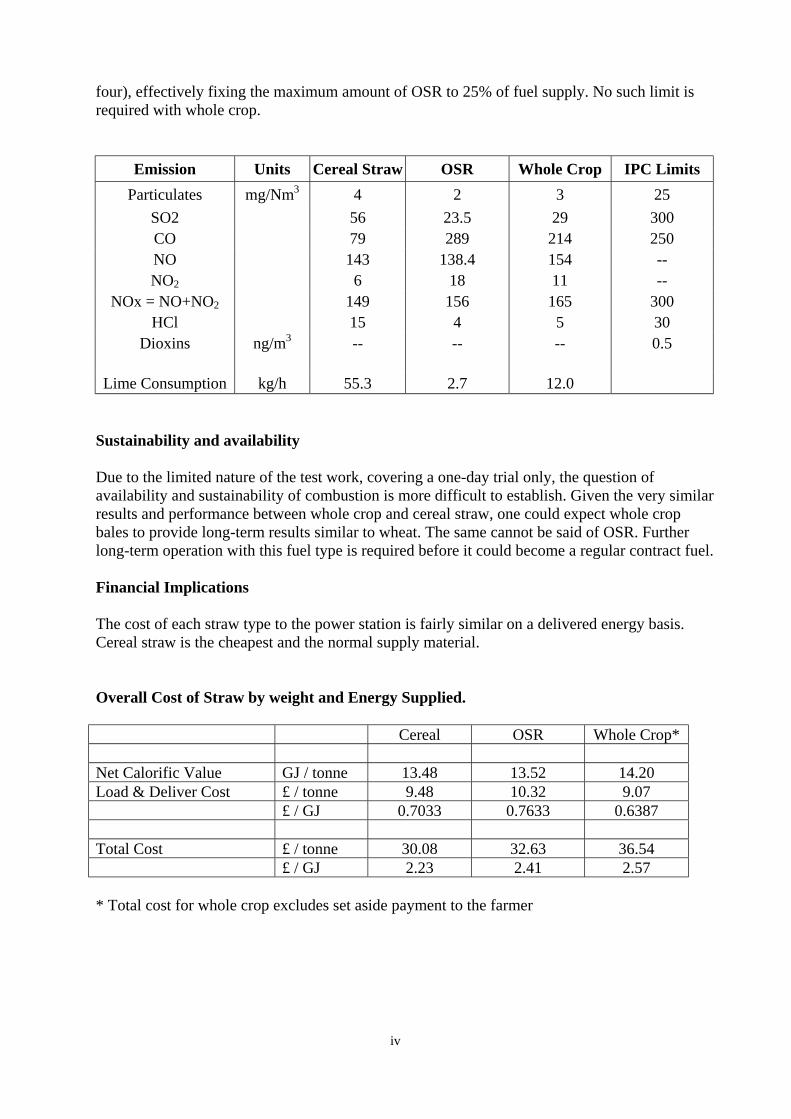
Designed with an overall cycle efficiency of +32.5% on cereal straw, all thee trials achieved ahigher level which is very encouraging. With the exception of carbon monoxide (CO) on theOSR trial all emissions were well within limits. The reason for the high CO with OSR was dueto the high furnace temperature and intense burning of fine OSR particles. This problem hassubsequently been eliminated by limiting the quantity of OSR to a single feed stream (one in
iv
four), effectively fixing the maximum amount of OSR to 25% of fuel supply. No such limit isrequired with whole crop.
Emission Units Cereal Straw OSR Whole Crop IPC Limits
Particulates mg/Nm3 4 2 3 25
SO2 56 23.5 29 300CO 79 289 214 250NO 143 138.4 154 --NO2 6 18 11 --
NOx = NO+NO2 149 156 165 300HCl 15 4 5 30
Dioxins ng/m3 -- -- -- 0.5
Lime Consumption kg/h 55.3 2.7 12.0
Sustainability and availability
Due to the limited nature of the test work, covering a one-day trial only, the question ofavailability and sustainability of combustion is more difficult to establish. Given the very similarresults and performance between whole crop and cereal straw, one could expect whole cropbales to provide long-term results similar to wheat. The same cannot be said of OSR. Furtherlong-term operation with this fuel type is required before it could become a regular contract fuel.
Financial Implications
The cost of each straw type to the power station is fairly similar on a delivered energy basis.Cereal straw is the cheapest and the normal supply material.
Overall Cost of Straw by weight and Energy Supplied.
Cereal OSR Whole Crop*
Net Calorific Value GJ / tonne 13.48 13.52 14.20Load & Deliver Cost £ / tonne 9.48 10.32 9.07
£ / GJ 0.7033 0.7633 0.6387
Total Cost £ / tonne 30.08 32.63 36.54£ / GJ 2.23 2.41 2.57
* Total cost for whole crop excludes set aside payment to the farmer

v
Conclusions
• OSR straw and whole crops are available in sufficient quantities for use as fuel in
Eastern England.
• The project has shown the technical feasibility of using, Oilseed Rape Straw and whole
crop straw as alternative or supplementary fuels for modern combustion plant designed
for cereal straw.
• OSR straw has significantly different combustion characteristics, but is suitable if
adequate adjustments are made or the amount is restricted when co-firing with cereal
straw.
• Whole crop straw is the more expensive fuel but still offers advantages financially
because it would be used as a supplement to the power station offering greater flexibility
of supply.
• Steam production rates and Electrical export levels are not affected by the use of OSR or
Whole Crop straw and plant emission levels would not be unduly compromised.

vi
GLOSSARY OF TERMS
Advanced Conversion Gasification, pyrolysis or anaerobic digestion, or any technologies with a combination thereof.
Biomass Is a fuel where at least 98% of the energy content is derived fromplant, animal matter or other substances not derived from a fossilfuel. It includes such fuels as agricultural wastes, forestry wastesor residues, sewage and energy crops.
Cereal Straw Straw produced as a by-product of a cereal crop grown forconsumption as food. Varieties include mainly wheat, barley andoats but could also include corn, maize and rye etc.
C4 The term ‘C4’ refers to plants, which have an additional metabolicpathway, for the transport of carbon dioxide, in the process ofphotosynthesis. Plants without this extra pathway are called c3,and include all U.K. crops except maize. C4 plantsphotosynthesise with greater net efficiency than C3 at high lightintensities and high temperatures. They may also utilise water withgreater efficiency. However at low temperatures, C3 plants mayoften photosynthesis with greater efficiency, although there arepossibilities for genetic selection of C4 plants with improved coldtolerance.
Cycle Efficiency The ratio of electrical power exported to net heat supplied.
DIN 1942 A Europe wide accepted standard for undertaking and evaluating asteam generating boiler test on a given fuel.
Energy Crops A plant crop grown primarily for the purpose of being used as afuel. This may be grown on set aside land provided it is not soldfor consumption as food.
Gasification The substoichiometric oxidation or steam reformation of asubstance to produce a gaseous mixture containing two or all ofthe following: oxides of carbon, methane and hydrogen.
GCV / NCV GCV = Gross calorific Value (kJ/kg or MJ/kg)NCV = Net Calorific Value (kJ/kg or MJ/kg)
NCV=GCV – 24.5 x (9 x % H2 + %H2O)
The net calorific value takes account of the latent heat loss ofevaporation of water to steam.
GSA This is a ‘Gas Suspension Absorber’ a specific type of acid gascleaning system used at the Elean Power Station. It is capable ofboth dry and semi-dry scrubbing of acid gases (SOx and HCl).
vii
Hay Straw from a non-cereal based product.
Hesston Bale A rectangular shaped bale of any given product having thefollowing dimensions:Max 1.28 x 1.33 x 2.50 metresMin 1.22 x 1.27 x 2.25 metresDensity 125-145 kg/m3
MCR Maximum Continuous Rating; this refers to the level of any plantcriteria when operating at full output. e.g., steam flow, fuel flow,air flow etc.
MWe Electrical Energy
MWth Thermal Energy
O S R Oil Seed Rape, primarily grown for seed production and used forboth human consumption and the industrial oils market. Somecrops are grown on set aside land (non food use) and are sownpredominantly in the autumn rather than the spring, which giveshigh yields of both straw and seed. OSR used at EPRL Ely andthat used for this trial is straw only, collected after harvest.
Photosynthesis Synthesis of organic compounds in green plants from water andcarbon dioxide using energy absorbed from sunlight withchlorophyll.
Pyrolysis The thermal degradation of a substance in the absence of anyoxidizing agent (other than that which forms part of the substanceitself) to produce char and one or both of gas and liquid.
Set Aside Land designated as ‘set-aside’ from food crop cultivation, forwhich the farmer has received an EU subsidy.
Straw Specific Fuel The fuel quantity required to produce 1kW of electricity; kg/kW,Consumption expressed as:
Fuel flow (kg/h)(100-% Nat Gas)/100*Exported kW/h
Where % Natural gas is % of thermal energy supplied
Triticale A common hardy hybrid variety of wheat and rye.
Vegetative Growth of plants by production of leaves, stems and roots prior tothe formation of reproductive organs.
Whole Crop A crop that contains stems, leaves and produce that has beengrown on set-aside land and therefore, under EU regulations, notavailable as a foodstuff.
viii
CONTENTS
Page No.EXECUTIVE SUMMARY
Project Objectives iBackground iProject Staff & Contractors iiSummary of Work iiResults iiConclusions v
GLOSSARY OF TERMS
1.0 REASONS FOR FUEL BASE EXPANSION
1.1 Introduction 11.2 Selection of Alternative Straw Fuels 11.3 Straw Delivery 21.4 Sources of OSR and Whole Crop 21.5 Potential Tonnages 51.6 Production 51.7 Conclusions 6
2.0 COMPARISON OF FUELS
2.1 Introduction 72.2 Straw as a Fuel 72.3 Fuel and Ash Analysis 92.4 Comments 10
3.0 OVERALL PLANT ENERGY BALANCE
3.1 Introduction 113.2 Process Description 113.3 General Comments 15
4.0 COMBUSTION TRIALS
4.1 Introduction 164.2 Assessment Criteria 164.3 Straw Details 164.4 Test Details 184.5 Trial data 214.6 Ash Produced 244.7 Comments and conclusions 26
5.0 CHIMNEY EMISSIONS
5.1 Introduction 285.2 Carbon Monoxide 28
ix
5.3 Nitrous Oxides 285.4 Oxides of Sulphur 295.5 Hydrogen Chloride 295.6 Particulates 305.7 Dioxins and Furans 305.8 Emission Control Techniques 305.9 Conclusions 32
6.0 FINANCIAL IMPLICATIONS
6.1 Straw Supply 336.2 The Price of Straw 336.3 Variations with Moisture 356.4 Variations with Straw Type 366.5 Storage and Delivery Aspects 36
7.0 COMMENTS AND CONCLUSIONS
7.1 Assessment 387.2 Overall Assessment and Conclusions 39
INDEX OF TABLES
Table 2.1 Typical Analysis of Straw 9Table 2.2 Analytical Results of Straw Samples 10Table 4.2.1 Summary of Straw Supplied 17Table 4.2.2 Mixed Fuel Analysis 18Table 4.4.1 Average Plant Operating Data 21Table 4.5.1 Analysis of Fly Ash 24Table 4.5.2 Analysis of Bottom Ash 25Table 5.1 Emission Test Results 28Table 5.4 SO2 & HCl Emissions 29Table 5.6 Particulate Emission 30Table 6.1 Basic Cost of Straw 34Table 7.2 Overall cost of straw by weight and energy supplied 40Table A5.1 Monitoring and Reporting Instruments for Emissions to Air 48Table A9.1 Whole Crop Survey 69Table A9.2 Oil Seed Rape Survey 70
INDEX OF FIGURES
Fig 1 EPR Ely, Straw Fired power Station xiFig 2 Straw Delivery at Power Station Fuel Barn 2Fig 3 Oil Seed Rape Sown 3Fig 4 UK Planting of Oil Seed Rape 3Fig 5 Oil Seed Rape in the East of England 4Fig 6 UK Set aside Area 4Fig 7 General Classification of Solid Fuels 8Fig 8 Seasonal Variation in Straw Consumption and Export Power 12Fig 9 Seasonal Variation in Straw Moisture and Plant Efficiency 12
x
Fig 10 Ely Power Station, Overall Process Flow Diagram 13Fig 11 Reinforced Transfer Conveying System 14Fig 12 Cross Conveyor and Scarifier 14Fig 13 Plant Control Room 15Fig 14 Boiler and Overall System Diagram 20Fig 15 Grate Ash from Quench Bath on Cereal Straw 26Fig 16 Bag Filter and Lime Dosing Systems 31Fig 17 Straw Cost Variations with Moisture Content 35Fig 18 Variation in Straw Consumption with Moisture Content 35Fig 19 Mimic Diagram, Feed System 51Fig 20 Mimic Diagram, Feed System – Second Overview 52Fig 21 Mimic Diagram, Water and Steam System 53Fig 22 Mimic Diagram, Flue Gas and Emissions 54Fig 23 Live Data – Trending 55Fig 24 Boiler and Overall System Diagram, Cereal Straw 58Fig 25 Boiler and Overall System Diagram, Oil Seed Rape 60Fig 26 Boiler and Overall System Diagram, Whole Crop 62Fig 27 Emission Data for Straw Type, Cereal Straw 66Fig 28 Emission Data for Straw Type, Oil Seed Rape 67Fig 29 Emission Data for Straw Type, Whole Crop 68
REFERENCES
APPENDICES
A1 Key Staff and Consultants 43A2 Details of Contractors 44A3 Elean Power Station – General Plant Description 45A4 Test Procedures 46A5 Plant Instruments 48A6 Mimic Diagrams 50A7 Overall Steam Cycles & Plant Efficiency 56A8 Emission Data 64A9 OSR and Whole Crop Survey 69

xi
1
1.0 REASONS FOR FUEL BASE EXPANSION
1.1 Introduction
The site of the power station is at Elean Business Park near Sutton, Cambridgeshire. This island adjacent to the A142 approximately 8 kilometers south west of Ely. The landscapesurrounding the site is generally level but falling gently to the North. The main road to the siteentrance is from the south of the site via a roundabout system from the A142. The site and theadjacent land were originally farmland that was later used as a military airfield. Planningpermission from East Cambridgeshire District Council was originally granted for thedevelopment in June of 1996 and construction began in summer 1998 with the first firing in late2000.
The Elean plant has been developed for baled cereal straw fuel, which is abundant in the East ofEngland. However, reliance on one fuel can be a risk. In the first year of operation, 2000/01, theheaviest rainfall since records began affected baled cereal straw supplies. This resulted in at least 25% ofthe baled straw resource being of poor quality and with moisture levels far in excess of the 26%maximum recommended. This created a shortage of suitable straw with long periods of low plant outputand several lost days operation. Each lost day cost EPR Ely approximately £50,000.
Over recent years EPR has taken a leading role in developing the Energy Crop and Biomass market andhas demonstrated an innovative approach to tackling fundamental issues. The Elean plant was thereforemade available for a monitored trial burning of both baled rape straw and baled whole crops with a viewto tackling fuel availability issues.
1.2 Selection of alternative straw fuels
Whole crops harvested for energy use and rape straw were not originally considered as a fuel for theElean project. The availability of the rape straw in the project catchment area was originally consideredtoo low compared to cereal straw. Experience from Denmark further suggested that rape straw could bemuch higher in chloride and sulphur compounds than conventional wheat and barley based straw.However, if rape and whole crops were found to be a suitable fuel, they could not only underpin the fuelresource potential for this existing plant, but also open up these potential energy resources for furtherbiomass plant development in the UK. Adoption of these fuels would reduce the dependency and risksassociated with the use of only one fuel type. It could also allow alternative periods of the year forharvesting, when equipment is not being utilised elsewhere.
The reasons for selecting OSR material are very similar to that for cereal straw but it has theadvantage of being harvested earlier, in the last two weeks of July. This is two weeks earlierthan cereal straw and would become available just as the power station is starting to run out offuel. The reasons for selecting whole crop are different. Set aside land can be used since thegrain is not produced for foodstuffs which would be of an obvious advantage to the farmer inproviding an additional income. The crop does not have to wait for the grain to ripen and socould become available earlier than straw from cereal crops. Barley is normally ready forharvest by the end of July, wheat by the end of August, with baling to the end of September andfor the rest of the year the straw has to be stockpiled. Whole crop material could becomeavailable from late June. This is very important when projecting stock levels for the powerstation; the whole bale material could save two to three months additional stockpiling andprovide fuel at a time when it is most needed.
2
The whole crop material used for the trial consisted of oats, Triticale and wheat. Oats andTriticale were selected because they are long straw varieties providing a taller crop for greateryield. Both take up nitrogen readily and therefore required less fertiliser. They could be sown inlate autumn ready for the trial the following summer.
Wheat was included, with the grain; as a small trial had been prepared the previous July as a trialcrop on set aside land. Refer to Appendix 9 for details of quantities.
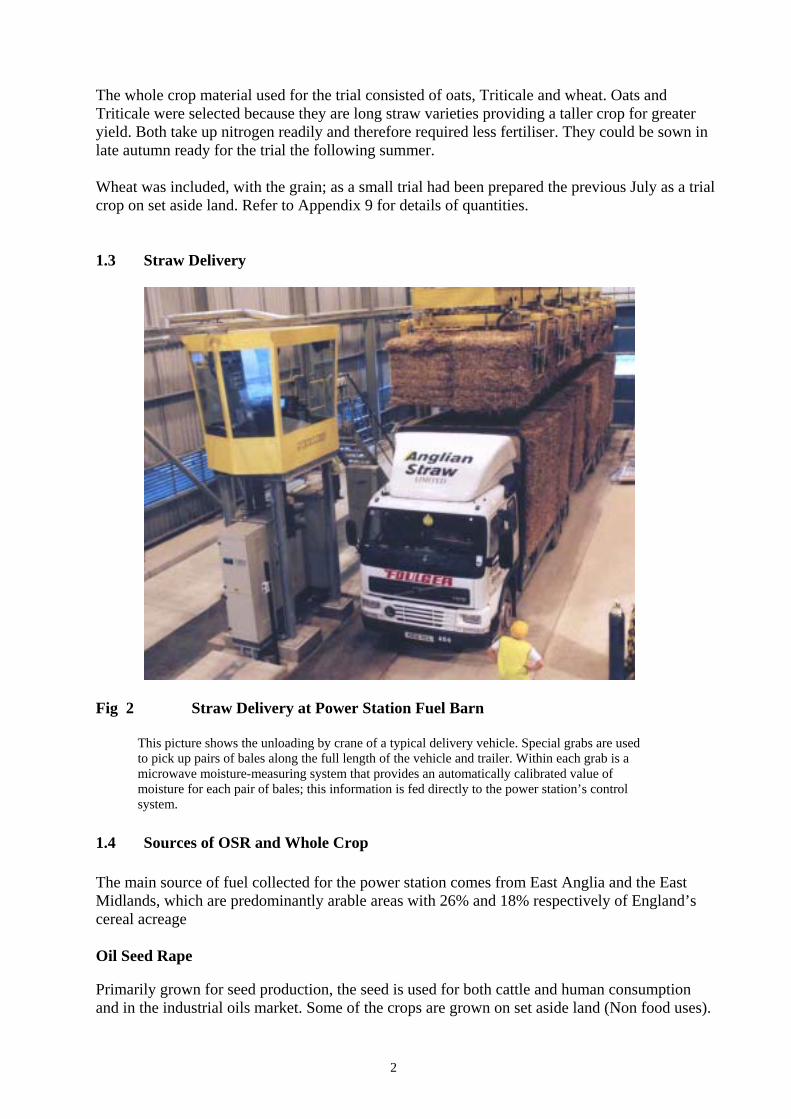
1.3 Straw Delivery
Fig 2 Straw Delivery at Power Station Fuel Barn
This picture shows the unloading by crane of a typical delivery vehicle. Special grabs are usedto pick up pairs of bales along the full length of the vehicle and trailer. Within each grab is amicrowave moisture-measuring system that provides an automatically calibrated value ofmoisture for each pair of bales; this information is fed directly to the power station’s controlsystem.
1.4 Sources of OSR and Whole Crop
The main source of fuel collected for the power station comes from East Anglia and the EastMidlands, which are predominantly arable areas with 26% and 18% respectively of England’scereal acreage
Oil Seed Rape
Primarily grown for seed production, the seed is used for both cattle and human consumptionand in the industrial oils market. Some of the crops are grown on set aside land (Non food uses).

3
The crop is predominantly autumn sown, which achieves the highest yields for both straw andseed (figure 3).
Yields of straw are variable, from 1 – 3 tonnes per ha. This depends mainly on the method ofharvesting and weather conditions at harvest. Oilseed rape is predominantly grown on theheavier soil types and is viewed as a good break crop. Since 1997 the UK area has exceededsome 400,000 ha’s (figure 4) of which the East Midlands and Eastern Region account for some50 % of national plantings (figure 5).
Figure 3 Oilseed Rape Sown (‘000 ha’s)
Figure 4 UK Planting of Oil Seed Rape (‘000 ha)
0
50
100
150
200
250
300
350
400
450
1997 1998 1999 2000 2001
Spring sown
Winter sown
0
100
200
300
400
500
600
1997 1998 1999 2000 2001
Set aside land
Non set aside Land

4
Figure 5 Oilseed Rape in the East of England (‘000 ha)
Whole Crop Potential Area Available
Since 1990 the area of set aside has increased (figure 6), with an on farm requirement of some10% or more of land having no crop established, or a non food crop such as industrial Oilseedrape or Linseed planted.
The potential in both the East Midlands and Eastern region is high. In the year 2000 these areasaccounted for 17% and 25% respectively of England’s Set Aside; this amounts to 87,174 ha and118,218 ha respectively.
Figure 6 UK Set aside Area (‘000 ha’s)
0
100
200
300
400
500
600
700
800
1990 1992 1994 1996 1998 2000
UK Set aside
0
20
40
60
80
100
120
1997 1998 1999 2000
East Midlands Region
Eastern Region
5
1.5 Potential tonnages
Oil Seed Rape (OSR)
If yields of straw are assumed as 1.5 t/ha, and with half the East Midlands and Eastern regionOilseed Rape crop being within an acceptable distance of the plant this equates to some 85,700ha, containing 129,000 tonnes of straw. In reality spring-sown crops, differing harvestingmethods, machine availability and weather conditions will reduce this figure by up to 50 %.Thus the actual amount available is more likely to be around 64,000 tonnes. The availability of OSRstraw is quite high since there are only a few competing uses and these are based mainly around the mushroom andcomposting industry. If not used as combustion fuel it would go to waste.
Whole crop
If yields are assumed to be 5 t/ha, and with half the East Midlands and Eastern Region set-asideis within an acceptable distance of the power plants, this equates to some 80,000 ha, containing400,000 tonnes. In reality this will also be reduced, some land will go into other industrial crops,some will be in long term (5 year) set aside and some farmers will not want to grow a crop asthis can provide a valuable break period between cereal crops. Thus the figure may be reducedby a further 50 % and the actual amount of land available should therefore yield some 200,000tonnes.
1.6 Production
A number of farmers were encouraged to grow whole crop material (Oats, Triticale and Wheat)specifically for this combustion trial. The land was rented from the farmers, seed purchased andthe crop was sown in the autumn of 2001. All activities associated with bringing the crop in abaled form to the power station was undertaken by Anglian Straw Ltd at a final cost to EPRL of£36.54 per tonne, including seed costs.
OSR straw was already available in sufficient quantities from farms that already supply thepower station with cereal straw. This supply was simply purchased from the farm, harvested,baled, stacked and delivered in the same way, at a cost to EPRL of £32 per tonne.
Harvesting, Baling & Storage
All crops were sprayed in the field with glyphosate, which kills the plant (desiccation),approximately 2 to 3 weeks before harvest. This allows the crop to dry out, ensuring areasonable calorific value when sent to the power station.
OSR and whole crop were harvested using standard cereal equipment, swathing machine,combined harvester and chaser. Quality control was employed immediately after baling, whichis standard practice with wheat and barley. These quality control checks for moisture, bale sizeand shape and includes a random check on weight using a purpose built bale weighing machine.
The chased bales were then either transported directly to the power station and stored in adedicated area of the straw barn or stacked ready for later transport.
Comments
In the field the OSR needed to be fully killed to prevent a high content of green straw. Greenstraw tends to biodegrade quickly in the bale and stack, which tends to heat the bales. The

6
normal spraying rates used for cereal crops and adopted for whole crop and OSR provedinsufficient for the OSR.
With the whole crop a mower was used in place rather than a swather; the mower being a highspeed reciprocating blade. Initially this caused some problems with fires in a few fields where,due to the necessity to cut low to the ground, the blade hit pieces of flint in the soil creatingexcessive sparks.
Loading, stacking and transporting baled material was much the same for all types investigatedwith no appreciable differences.
1.7 Conclusions
From this study it can be seen that these two alternative biomass sources may have greatpotential and could play an important role in diversifying the fuel supply for a single fuelbiomass power station. In theory these two sources of fuel could provide around 260,000 tonnesof biomass that would more than match the EPR Ely power station cereal straw requirements.
The cost of whole crop material was £36.50 per tonne which is much higher than cereal strawdue mainly to the fact that land was rented, seed was specially purchased, the growingharvesting and stacking had to be undertaken independently and an incentive provided toencourage the farmer. It is expected that this cost could be reduced if whole crop was to be usedon a regular basis, with support from the farm.
The original estimate of 5t/ha for whole crop was based on cereal straw values. In practice ayield of between 7 to 9 t/ha was achieved.
Set aside land also provide the farmers with an added income of £220.00 per ha, currently, inaddition to the price paid by the power station.

7
2.0 COMPARISON OF FUELS
2.1 Introduction
Operation of the Elean Power Station is based entirely on the utilization of full Hesston sizedbales of cereal straw. If other types of straw can be successfully harvested in sufficient quantityand baled to the same size then they would be welcomed and given serious consideration foruse. To ensure suitability each fuel type would naturally be compared with cereal straw in termsof calorific value, density of bale, inclusions, impact on emissions and impact on overall fuelcost.
2.2 Straw as a Fuel
Straw includes most solid plant residues gathered from crops after harvest. In comparison withfossil fuels such as coal and oil, they are low grade with high volatile content and low calorificvalue. Despite some variations between different species it is one of the more uniformagricultural products. Variations in quality, moisture and ash content, even within the samespecies occur at the time of harvesting due to location of the crop, soil conditions and storageconditions.
In comparison to coal, straw ignition temperatures and completion of combustion occur atrelatively lower temperatures; the high volatile content of straw means that a large proportion ofcombustion takes place in the gas phase; correct secondary combustion air provision is thereforeessential for efficient combustion. Low ash deformation temperatures in straw also means thatstraw ash becomes either sticky or molten at normal furnace operating temperatures. Thefurnace, boiler and particularly the super heater regions have to be specially designed to copewith these problems. Included in the design should also be a large number of soot blowers tokeep the heat transfer surfaces clean. If not, the ash would coat the tubes and dramaticallyreduce the output of the plant. The risk of blocking the flue gas passes and causing prematureshut down for ‘off-line’ cleaning is very high without an adequate ‘on-line’ soot blowingsystem.
Apart from the Elean power station the nearest major straw burning plants are in Denmark.These industrial straw combustors typically only burn Hesston straw bales with an approximateweight of 450kg to 600kg. Danish straw fired plants can be designed for the continuous feed ofeither scarified straw, (straw bales that have been shredded), or whole bales. In the UK we tendto bale to higher densities than, say in the United States and with certain types of straw or strawalternatives the weight of a standard hesston bale may exceed 800kg.
Straw is usually transported to storage soon after baling. When it is kept dry, the straw is moresuitable for energy production and it can be stored for longer. Straw storage requires a lot ofspace. It is usual to hold enough straw for several days’ operation. On delivery the bales areweighed and analysed for water content.
All feeding systems require a safety sluice outside the combustor to prevent premature ignitionof the straw and minimise the risk of fires.
Factors effecting straw fuel quality
The main quality factor for combustion of any vegetation based fuel is its dry matter contentsince wet crops use more energy in evaporation of moisture, resulting in less available energy

8
for heat or power. Straw in general is better than most biomass fuels, with an average 16%moisture at the power station, compared to say chipped wood at 30 to 40% moisture.
Other important factors include: fuel density and fuel size, which are physical characteristicsthat affect the design and the ability of the fuel transfer and handling system to supply a steadyflow of fuel. Calorific value also dictates the quantity of fuel required in the same way as fuelmoisture, which actually reduces the calorific value. In general a net calorific value of less than7.5MJ/kg requires a different type of combustor design, or an additional heat source oradditional, higher CV fuel to ensure satisfactory combustion and furnace temperature.
The following graph, Fig 7, shows the ‘General Classification of Solid Fuels’ from coke to fuelsfrom vegetation; straw obviously falling into the latter class.
���������������������������������������������������������������������������������������
������������������������
����������������������������
�������������������������������
����������������������������������������������������������������������
���������������������������������������������������
���������������
����������
��������������������������������������������������
������������������
������������������������������������
������������������������������������������������
���������������������������������������������������
���������������������������������������
��������������������������������������������
������������������������������
������������������
1.0
10.0
100.0
0 5 10 15 20 25 30 35 40 45 50 55 60 65 70 75 80 85 90 95
% Volatile Content (dry, ash free)
Car
bo
n/H
ydro
gen
Rat
io
38
37
3634
3128
2522
20
19
Approx. GCV
Anthracite
Coke
Bituminous Coal
LigniteBrown Coal
Peat
Vegetable Matter
Straw
Fig 7 General Classification of Solid Fuels

9
2.3 Fuel and Ash Analysis
The following table represents a summary of all types of straw burned at the Ely power station.
Table 2.1 Typical Analysis of Straw
Proximate Analysis, as received Range
Moisture % range 11-28 % Ave 16
Ash % range 3.2-8.2 % Ave 5.5
Volatile Matter % range 57-69 % Ave 63.5
Fixed Carbon % range 14.8-16.0 % Ave 15.2
Ultimate Analysis, dry basis
Carbon % by weight 40-48Hydrogen % by weight 5.3-6.4Nitrogen % by weight 0.3-0.9Chloride % by weight 0.1-0.6Sulphur % by weight 0.2-0.4Oxygen (by difference) % by weight 36-45
Calorific Value
GCV dry basis kJ/kg range 17,840-18,600NCV as fired kJ/kg range 12,000-15,000 KJ/kg Ave 14,000
Ash Fusion Temperatures Initial Deformation Temp °C 890-1400Hemisphere Temp °C 930-1430Fluid Temp °C 1100-1440
Note: Ash content, due to soil inclusions, may vary considerably according to ground conditions at timeof harvesting and will impact on the overall quality of the fuel.
10
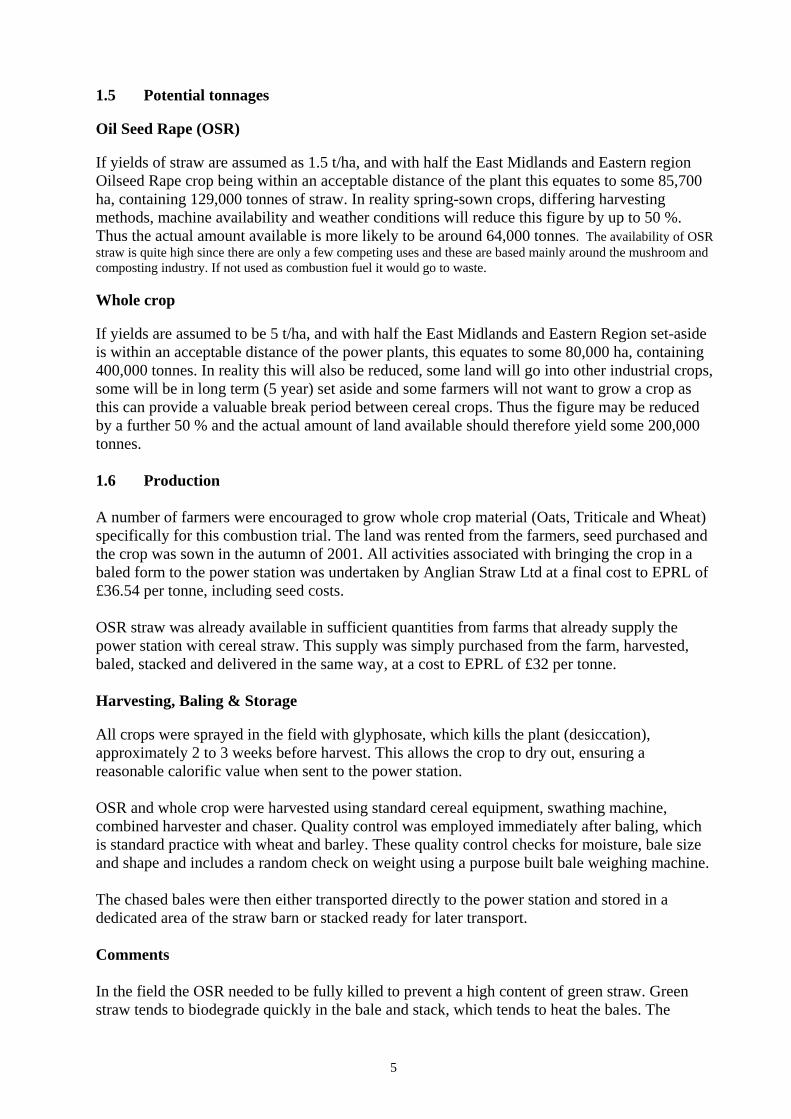
Table 2.2 Analytical Results of Straw Samples
Sample:Units Cereal
StrawOSR
StrawWholeCrop
Hay
Ultimate AnalysisCarbon % weight 36.68 35.93 37.01 33.97Hydrogen af 4.66 4.56 5.13 0.45Nitrogen 0.42 0.57 1.19 0.72Chlorine 0.36 0.38 0.10 0.22Sulphur 0.09 0.34 0.13 0.09Oxygen 37.77 38.48 37.55 36.37Ash 6.12 6.14 5.20 5.33Moisture 13.90 13.60 13.60 18.80
Calorific ValueNet CV MJ/kg, db 15.66 15.65 16.40 15.20Net CV MJ/kg, af 13.48 13.52 14.20 12.60
Main Ash Elements % weightCalcium af 0.21 0.76 0.17 0.21Magnesium 0.06 0.09 0.04 0.04Sodium 0.20 0.23 0.20 0.20Potassium 0.71 1.05 0.63 0.51Phosphorus 0.06 0.08 0.05 0.20
Note: af = as fired, db = dry basis, OSR – Oil Seed Rape, NCV– Net Calorific Value.
2.4 Comments
All of the above straw types show very little difference in chemical make up, as would beexpected of vegetation fuels of a similar nature. Chlorine, sulphur and ash are of similar levels(<0.4%) and within the range normally accepted at the power station. Both chlorine and sulphurin OSR straw are the highest, as found in trials by FLS in Denmark. Calcium and potassiumlevels are also slightly higher with OSR straw. Calcium helps with sulphur retention butpotassium can lower the deformation temperature of the ash making it slag more easily.
The Net Calorific Value of cereal straw and OSR straw are very similar at 13.5MJ/kg whilewhole crop material is 5.2% higher at 14.2 MJ/kg. This is important when realizing the deliveredcost.
11
3.0 OVERALL PLANT ENERGY BALANCE
3.1 Introduction
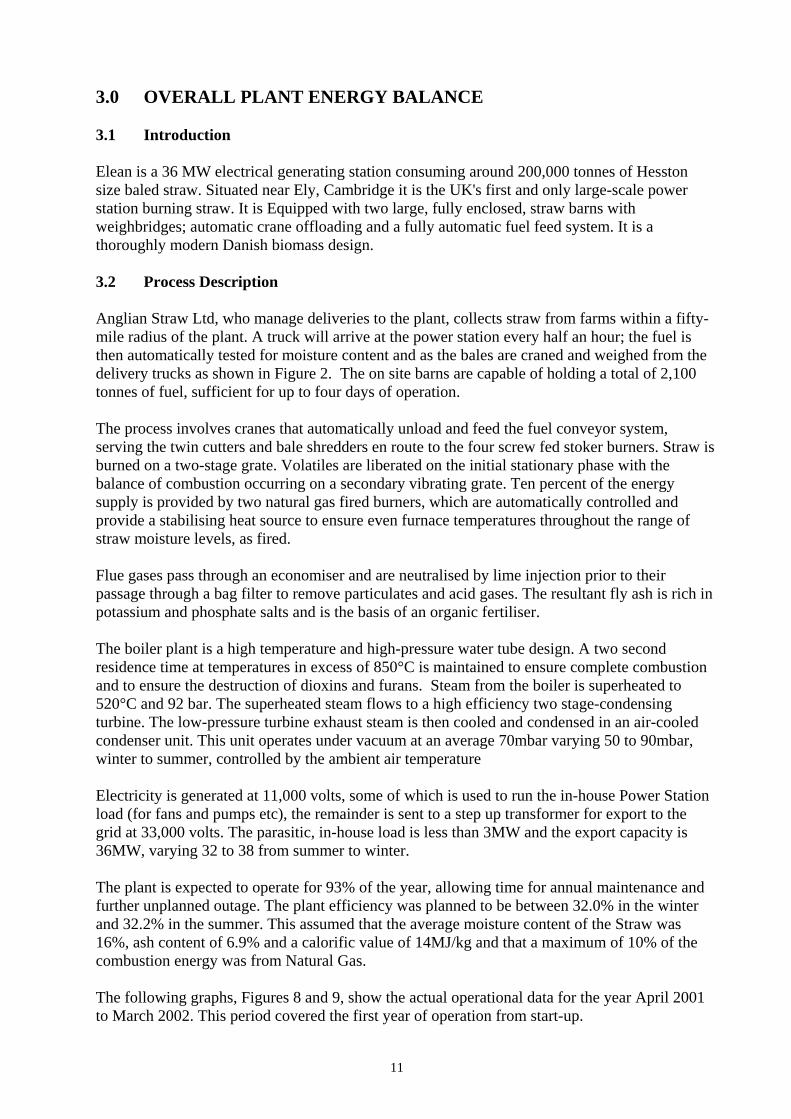
Elean is a 36 MW electrical generating station consuming around 200,000 tonnes of Hesstonsize baled straw. Situated near Ely, Cambridge it is the UK's first and only large-scale powerstation burning straw. It is Equipped with two large, fully enclosed, straw barns withweighbridges; automatic crane offloading and a fully automatic fuel feed system. It is athoroughly modern Danish biomass design.
3.2 Process Description
Anglian Straw Ltd, who manage deliveries to the plant, collects straw from farms within a fifty-mile radius of the plant. A truck will arrive at the power station every half an hour; the fuel isthen automatically tested for moisture content and as the bales are craned and weighed from thedelivery trucks as shown in Figure 2. The on site barns are capable of holding a total of 2,100tonnes of fuel, sufficient for up to four days of operation.
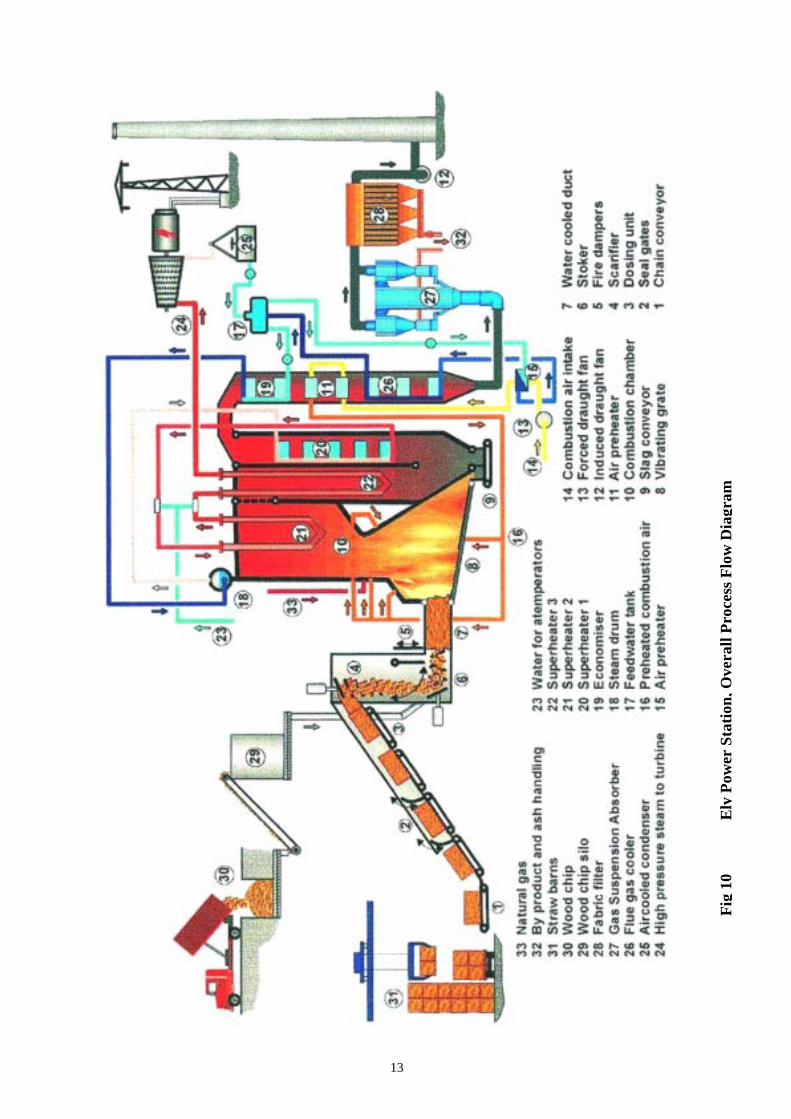
The process involves cranes that automatically unload and feed the fuel conveyor system,serving the twin cutters and bale shredders en route to the four screw fed stoker burners. Straw isburned on a two-stage grate. Volatiles are liberated on the initial stationary phase with thebalance of combustion occurring on a secondary vibrating grate. Ten percent of the energysupply is provided by two natural gas fired burners, which are automatically controlled andprovide a stabilising heat source to ensure even furnace temperatures throughout the range ofstraw moisture levels, as fired.
Flue gases pass through an economiser and are neutralised by lime injection prior to theirpassage through a bag filter to remove particulates and acid gases. The resultant fly ash is rich inpotassium and phosphate salts and is the basis of an organic fertiliser.
The boiler plant is a high temperature and high-pressure water tube design. A two secondresidence time at temperatures in excess of 850°C is maintained to ensure complete combustionand to ensure the destruction of dioxins and furans. Steam from the boiler is superheated to520°C and 92 bar. The superheated steam flows to a high efficiency two stage-condensingturbine. The low-pressure turbine exhaust steam is then cooled and condensed in an air-cooledcondenser unit. This unit operates under vacuum at an average 70mbar varying 50 to 90mbar,winter to summer, controlled by the ambient air temperature
Electricity is generated at 11,000 volts, some of which is used to run the in-house Power Stationload (for fans and pumps etc), the remainder is sent to a step up transformer for export to thegrid at 33,000 volts. The parasitic, in-house load is less than 3MW and the export capacity is36MW, varying 32 to 38 from summer to winter.
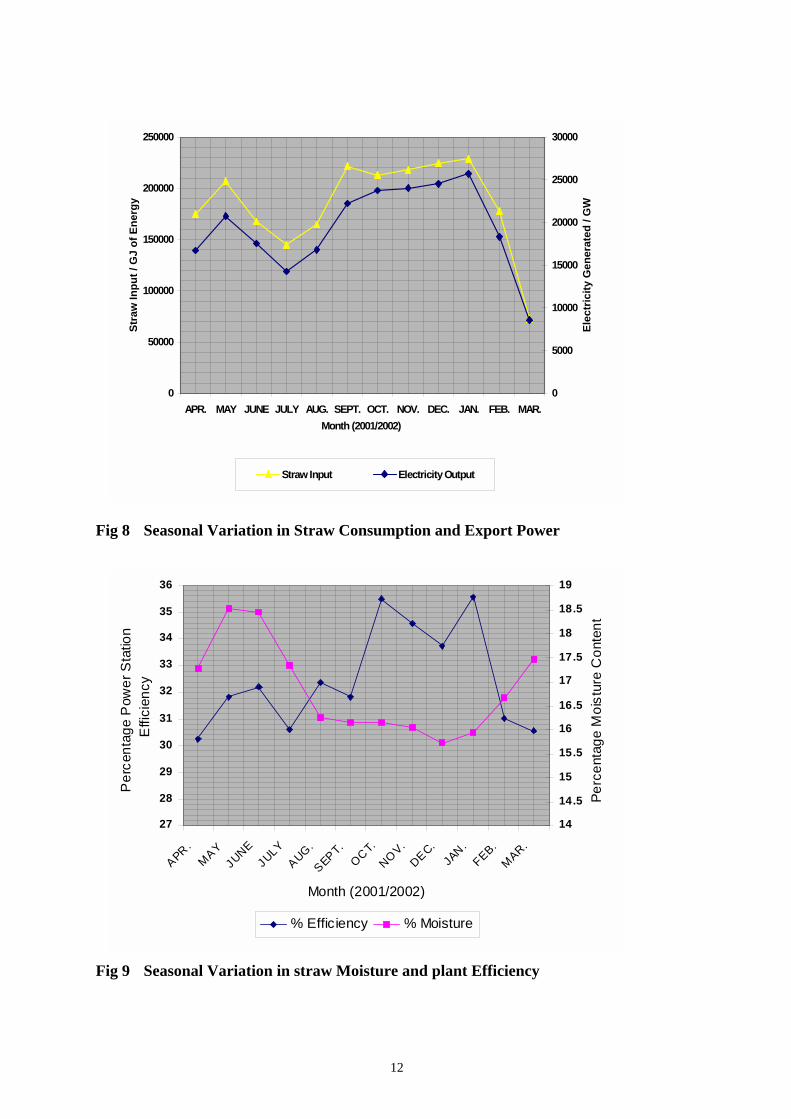
The plant is expected to operate for 93% of the year, allowing time for annual maintenance andfurther unplanned outage. The plant efficiency was planned to be between 32.0% in the winterand 32.2% in the summer. This assumed that the average moisture content of the Straw was16%, ash content of 6.9% and a calorific value of 14MJ/kg and that a maximum of 10% of thecombustion energy was from Natural Gas.
The following graphs, Figures 8 and 9, show the actual operational data for the year April 2001to March 2002. This period covered the first year of operation from start-up.
12
27
28
29
30
31
32
33
34
35
36
APR.
MAY
JUNE
JULY
AUG.
SEPT.
OC
T.
NOV.
DEC.
JAN
.
FEB.
MAR.
Month (2001/2002)
Pe
rcen
tag
e P
owe
r S
tatio
n E
ffici
ency
14
14.5
15
15.5
16
16.5
17
17.5
18
18.5
19P
erc
ent
age
Mo
istu
re C
ont
ent
% Efficiency % Moisture
Fig 8 Seasonal Variation in Straw Consumption and Export Power
Fig 9 Seasonal Variation in straw Moisture and plant Efficiency
0
50000
100000
150000
200000
250000
APR. MAY JUNE JULY AUG. SEPT. OCT. NOV. DEC. JAN. FEB. MAR.
Month (2001/2002)
Str
aw
In
pu
t /
GJ
of
En
erg
y
0
5000
10000
15000
20000
25000
30000
Ele
ctri
city
Gen
erat
ed /
GW
Straw Input Electricity Output
13
Fig
10
Ely
Pow
er S
tati
on, O
vera
ll P
roce
ss F
low
Dia
gram
14
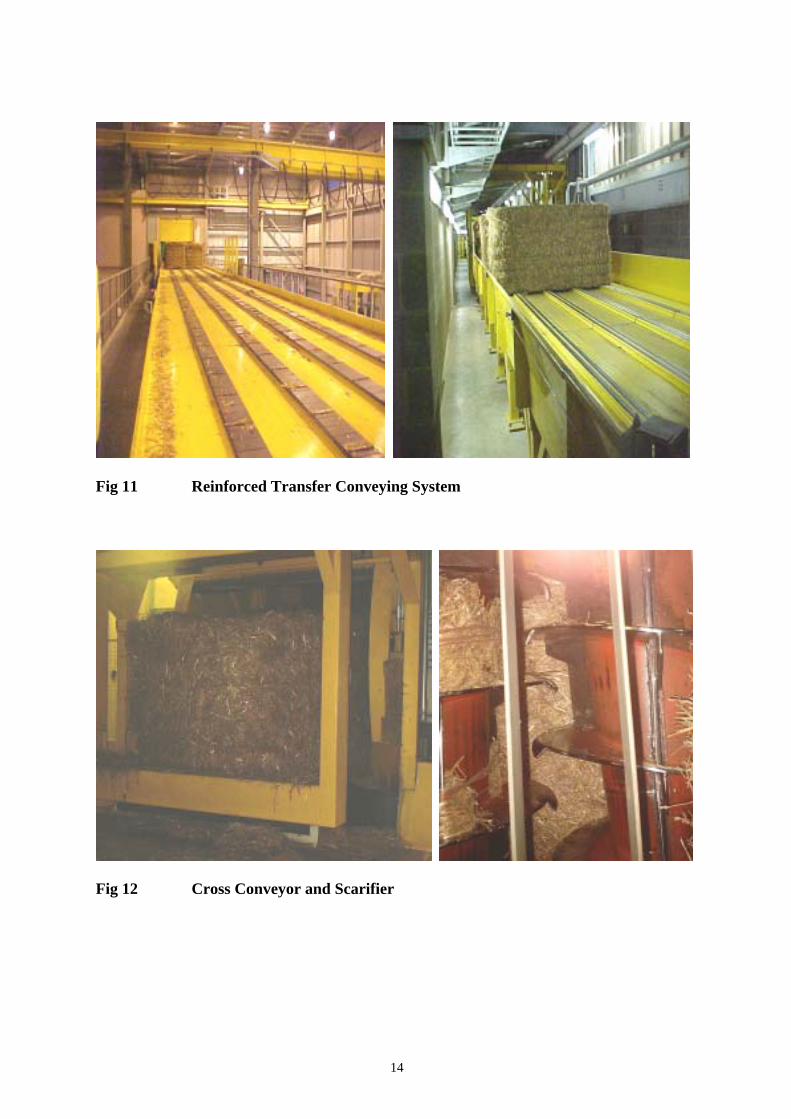
Fig 11 Reinforced Transfer Conveying System
Fig 12 Cross Conveyor and Scarifier

15
Fig 13 Plant Control Room
3.3 General Comments
The power station at Ely is a thoroughly modern design with particularly high cycle efficiency,making the most of biomass combustion in transfer to electrical power. In straight combustion,typical Waste to Energy plants achieve cycle efficiencies of 22 to 28%, poultry litter plants are24 to 27% and similar values are expected of wood fired plants.
Combined Cycle Plants and plants with combined heat and power operate at much higherefficiencies:
Combined cycle circa 40%CHP 50 to 85% depending on amount of heat exported
The reason that Ely can achieve such a high efficiency is due to its high superheated steamtemperature (525 °C) combined with a low chimney exhaust gas temperature. New designs fromDenmark are concentrating on steam temperatures in excess of 575°C, creating even highercycle efficiencies.
16
4.0 COMBUSTION TRIALS
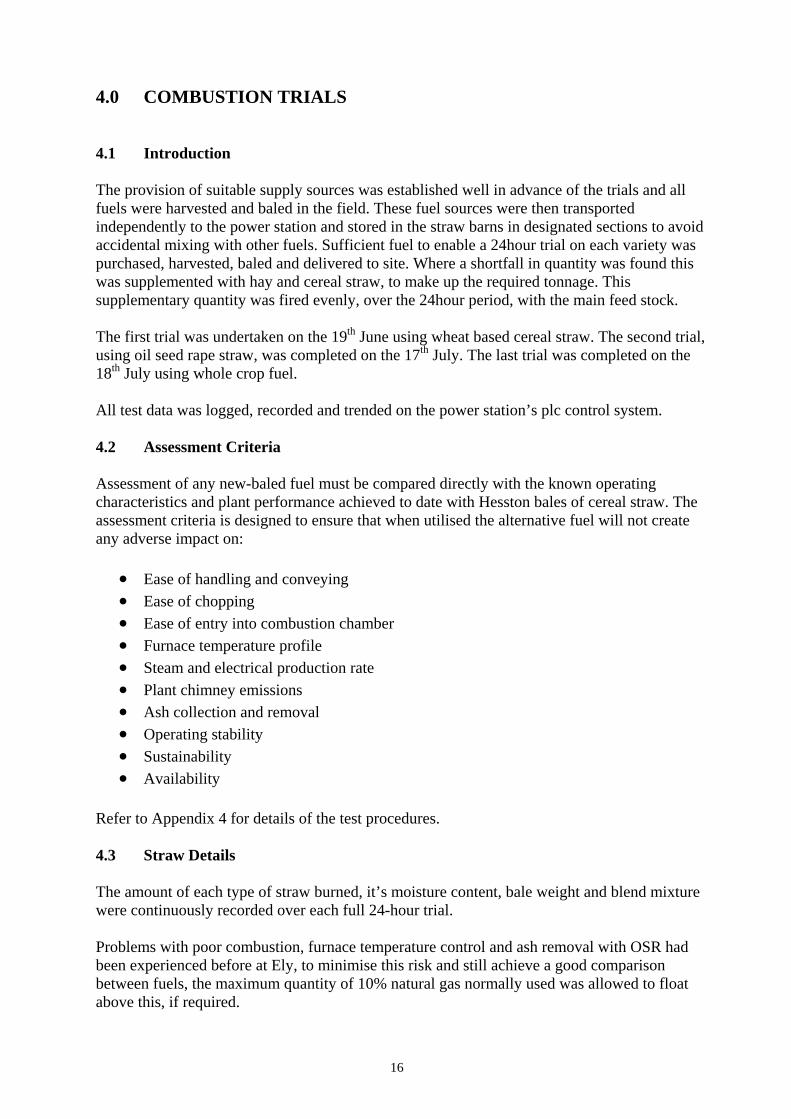
4.1 Introduction
The provision of suitable supply sources was established well in advance of the trials and allfuels were harvested and baled in the field. These fuel sources were then transportedindependently to the power station and stored in the straw barns in designated sections to avoidaccidental mixing with other fuels. Sufficient fuel to enable a 24hour trial on each variety waspurchased, harvested, baled and delivered to site. Where a shortfall in quantity was found thiswas supplemented with hay and cereal straw, to make up the required tonnage. Thissupplementary quantity was fired evenly, over the 24hour period, with the main feed stock.
The first trial was undertaken on the 19th June using wheat based cereal straw. The second trial,using oil seed rape straw, was completed on the 17th July. The last trial was completed on the18th July using whole crop fuel.
All test data was logged, recorded and trended on the power station’s plc control system.
4.2 Assessment Criteria
Assessment of any new-baled fuel must be compared directly with the known operatingcharacteristics and plant performance achieved to date with Hesston bales of cereal straw. Theassessment criteria is designed to ensure that when utilised the alternative fuel will not createany adverse impact on:
• Ease of handling and conveying
• Ease of chopping
• Ease of entry into combustion chamber
• Furnace temperature profile
• Steam and electrical production rate
• Plant chimney emissions
• Ash collection and removal
• Operating stability
• Sustainability
• Availability
Refer to Appendix 4 for details of the test procedures.
4.3 Straw Details
The amount of each type of straw burned, it’s moisture content, bale weight and blend mixturewere continuously recorded over each full 24-hour trial.
Problems with poor combustion, furnace temperature control and ash removal with OSR hadbeen experienced before at Ely, to minimise this risk and still achieve a good comparisonbetween fuels, the maximum quantity of 10% natural gas normally used was allowed to floatabove this, if required.
17
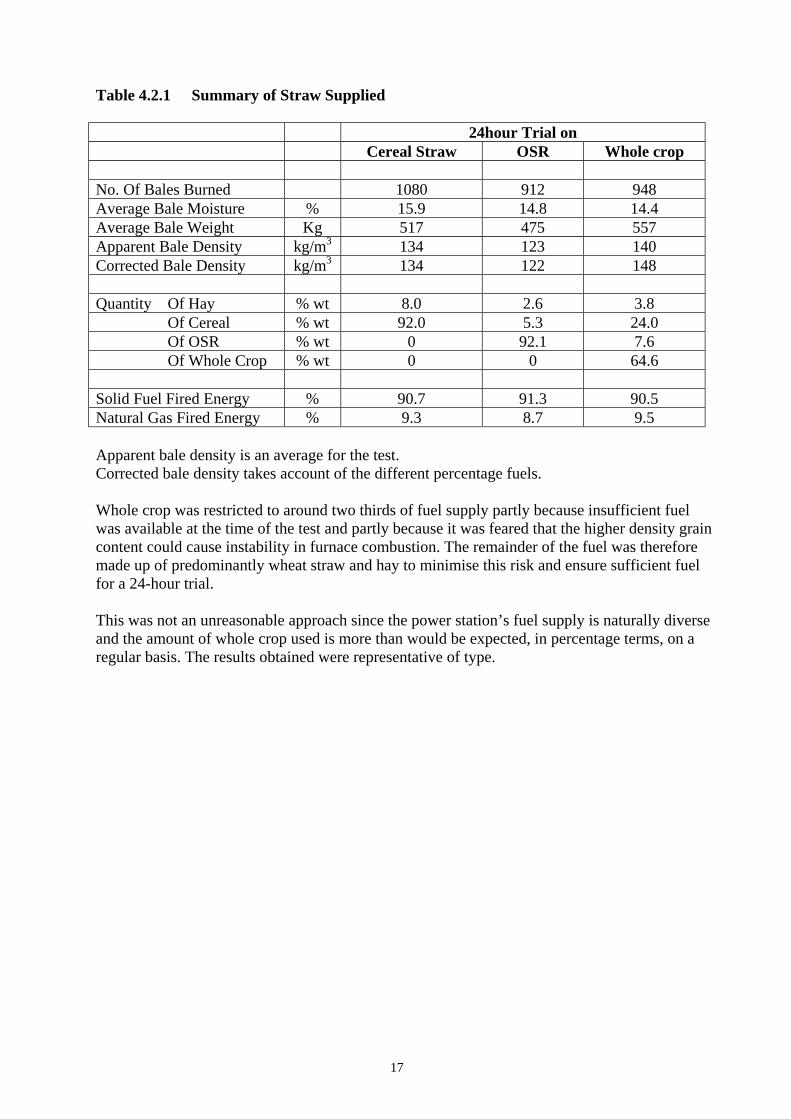
Table 4.2.1 Summary of Straw Supplied
24hour Trial onCereal Straw OSR Whole crop
No. Of Bales Burned 1080 912 948Average Bale Moisture % 15.9 14.8 14.4Average Bale Weight Kg 517 475 557Apparent Bale Density kg/m3 134 123 140Corrected Bale Density kg/m3 134 122 148
Quantity Of Hay % wt 8.0 2.6 3.8 Of Cereal % wt 92.0 5.3 24.0 Of OSR % wt 0 92.1 7.6 Of Whole Crop % wt 0 0 64.6
Solid Fuel Fired Energy % 90.7 91.3 90.5Natural Gas Fired Energy % 9.3 8.7 9.5
Apparent bale density is an average for the test.Corrected bale density takes account of the different percentage fuels.
Whole crop was restricted to around two thirds of fuel supply partly because insufficient fuelwas available at the time of the test and partly because it was feared that the higher density graincontent could cause instability in furnace combustion. The remainder of the fuel was thereforemade up of predominantly wheat straw and hay to minimise this risk and ensure sufficient fuelfor a 24-hour trial.
This was not an unreasonable approach since the power station’s fuel supply is naturally diverseand the amount of whole crop used is more than would be expected, in percentage terms, on aregular basis. The results obtained were representative of type.

18
Considering the balance of different straw types and the variations in supply moisture theaverage solid fuel fired analysis for each trial was used in the combustion and boiler plantcalculations. This analysis is provided in the following table:
Table 4.2.2 Mixed Fuel Analysis, as fired
24hour Trial onUnits Wheat Straw OSR Straw Whole Crop
Carbon % weight 35.79 35.38 36.51Hydrogen 4.57 4.49 4.92Nitrogen 0.44 0.56 0.93Chlorine 0.34 0.37 0.19Sulphur 0.09 0.31 0.13Oxygen 36.96 37.80 37.40Ash 5.94 6.03 5.52Moisture 15.88 15.06 14.40
Net CV MJ/kg, 13.16 13.29 13.83
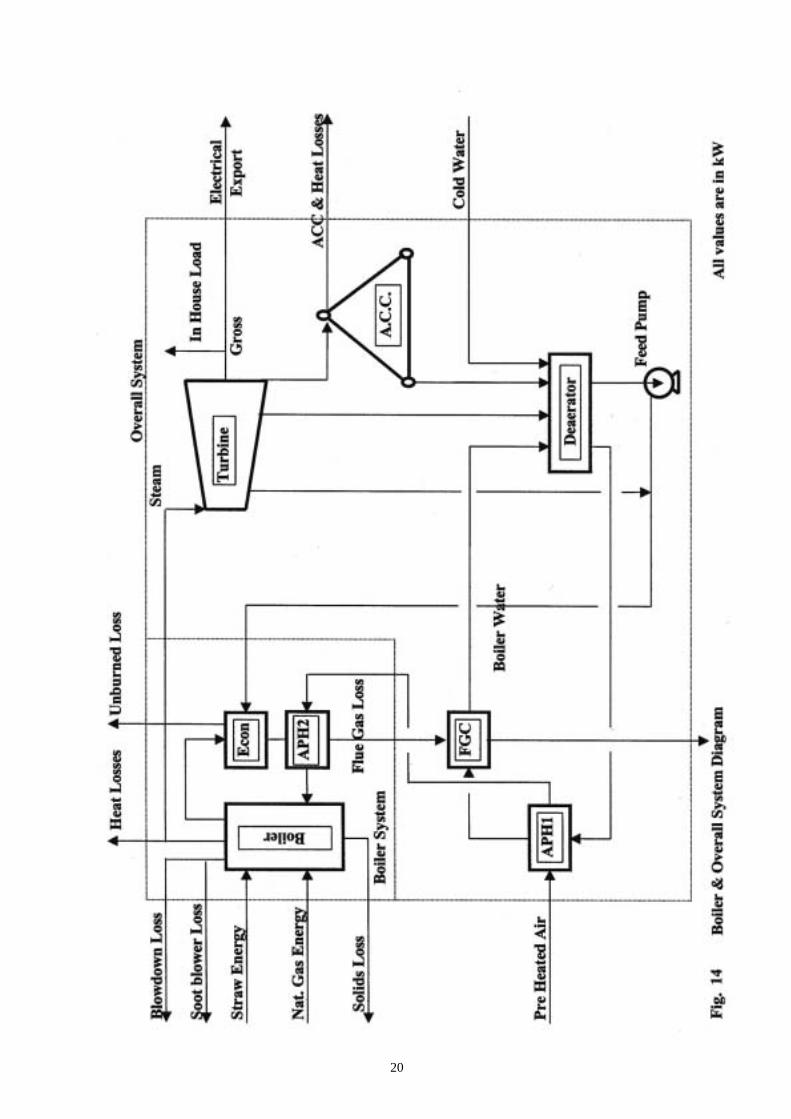
The following diagram, fig 14 shows the ‘Overall System Diagram’ for the boiler and steamcircuits. This was used in the evaluation of plant performance for each straw type and details canbe found in appendix 7.
4.4 Test Details
No particular problems were encountered with either the mechanical handling equipment (cranesand conveyors etc.,) or the scarifier, used to chop the straw. The torque on the scarifier wasincreased slightly for OSR to ensure the bales were properly chopped but this would be normalpractice on all types of baled straw and the small adjustment was well within the range of theequipment.
All three trials were conducted on a continuous basis and, apart from the OSR trial, performedvery well. All four-conveyor lines were used to supply the fuel to the four inlet burner portslocated along the front wall of the furnace. The fuel was fired into the furnace, from the burner,by an air swept spout. Each fuel type performed equally as well without any noticeableproblems.
Air settings were adjusted during the early part of each trial to manage plant output andemissions at a controllable level; these were then left to allow furnace stabilization for theremainder of each test. Soot blowing of all parts of the boiler and furnace were maintained asnormal and undertaken every 8 hours. Boiler blow down was also continued as normal.
The OSR burned more intensely in the upper parts of the furnace, resulting in higher thannormal temperatures. It did not burn quite so well on the grate producing a more powder like ashwith less slag (fused and sintered material). Air settings were adjusted as described but the fuel

19
still caused the power station to trip, half way through the test, on high super heater temperature.This appears to have been caused by the liberation of a finer ash material, which burned veryrapidly compared to cereal straw.
The plant was quickly put back on-line, further adjustments made to increase air levels at thegrate and lower down the furnace, and the test on OSR continued until the 24hour period wascompleted. Analysis of this test data was later undertaken on the last 9 hours of steady stateoperation.
20
21
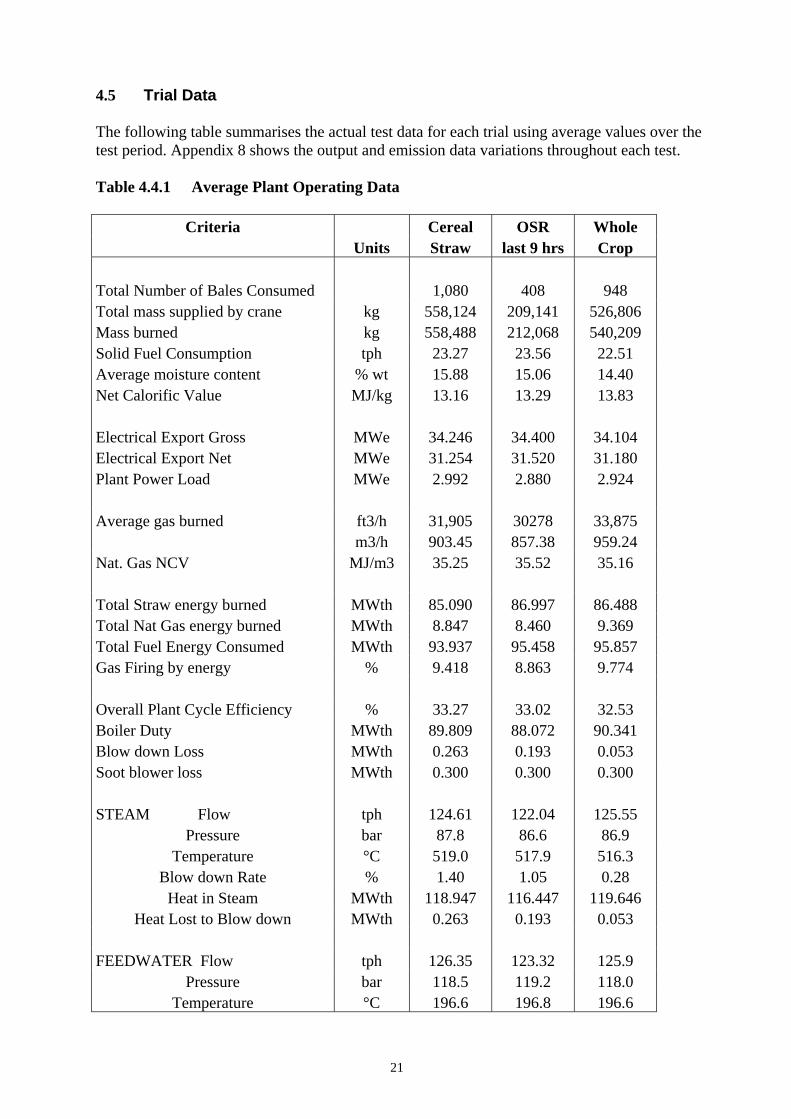
4.5 Trial Data
The following table summarises the actual test data for each trial using average values over thetest period. Appendix 8 shows the output and emission data variations throughout each test.
Table 4.4.1 Average Plant Operating Data
Criteria Cereal OSR Whole Units Straw last 9 hrs Crop Total Number of Bales Consumed 1,080 408 948 Total mass supplied by crane kg 558,124 209,141 526,806 Mass burned kg 558,488 212,068 540,209 Solid Fuel Consumption tph 23.27 23.56 22.51 Average moisture content % wt 15.88 15.06 14.40 Net Calorific Value MJ/kg 13.16 13.29 13.83 Electrical Export Gross MWe 34.246 34.400 34.104 Electrical Export Net MWe 31.254 31.520 31.180 Plant Power Load MWe 2.992 2.880 2.924 Average gas burned ft3/h 31,905 30278 33,875 m3/h 903.45 857.38 959.24 Nat. Gas NCV MJ/m3 35.25 35.52 35.16 Total Straw energy burned MWth 85.090 86.997 86.488 Total Nat Gas energy burned MWth 8.847 8.460 9.369 Total Fuel Energy Consumed MWth 93.937 95.458 95.857 Gas Firing by energy % 9.418 8.863 9.774 Overall Plant Cycle Efficiency % 33.27 33.02 32.53 Boiler Duty MWth 89.809 88.072 90.341 Blow down Loss MWth 0.263 0.193 0.053 Soot blower loss MWth 0.300 0.300 0.300 STEAM Flow tph 124.61 122.04 125.55
Pressure bar 87.8 86.6 86.9Temperature °C 519.0 517.9 516.3
Blow down Rate % 1.40 1.05 0.28Heat in Steam MWth 118.947 116.447 119.646
Heat Lost to Blow down MWth 0.263 0.193 0.053 FEEDWATER Flow tph 126.35 123.32 125.9
Pressure bar 118.5 119.2 118.0Temperature °C 196.6 196.8 196.6
22
Criteria Cereal OSR Whole Units Straw last 9 hrs Crop
Heat in Feed water MWth 29.545 28.867 29.440 Total Air Flow tph 137.84 121.284 132.48 Overall Excess Air % 21.5 17.0 18.0 Air Temperature °C 127.6 129.3 125.6 Air Humidity kg/kg da 0.0125 0.0120 0.0131 Energy in Preheated Air MWth 4.015 3.591 3.922 Econ. Gas Exit Temperature °C 233.2 199.2 198.7 Economiser Gas Exit Oxygen % vol 3.86 3.27 3.30 APH2 Exit gas temperature °C 197.0 177.6 177.7 Final Gas temperature °C 134.1 134.8 135.9 Outside Ambient Temperature °C 18.2 17.3 18.9 Air cooled condenser Vacuum bar. a 0.090 0.088 0.092
EMISSIONS Dust mg/Nm3 4 2 3SO2 56 23.5 29CO 79 289 214NO 143 138.4 154NO2 6 18 11NOx 149 156 165HCl 15 4 5
Lime Consumption kg/h 55.30 2.7 12 Fly Ash tph 0.227 0.267 0.314 Total Ash tph 1.562 1.676 1.364 Total Ash kg/kgfuel 0.0798 0.0837 0.0708 Dry Fly Ash Fraction % 14.4 16.1 23.0 Dry Bottom Ash Fraction % 85.6 83.9 77.0
Loss on Ignition Fly Ash % 0.7 0.2 0.5 Loss on Ignition Bottom Ash % 4.6 9.8 6.2 Energy loss to unburned Fly ash MWth 0.012 0.004 0.012 Bottom Ash MWth 0.461 1.034 0488 Unburned CO in Flue Gas MWth 0.027 0.097 0.072 Total Unburned Loss MWth 0.500 1.136 0.572
23
Criteria Cereal OSR Whole Units Straw last 9 hrs Crop
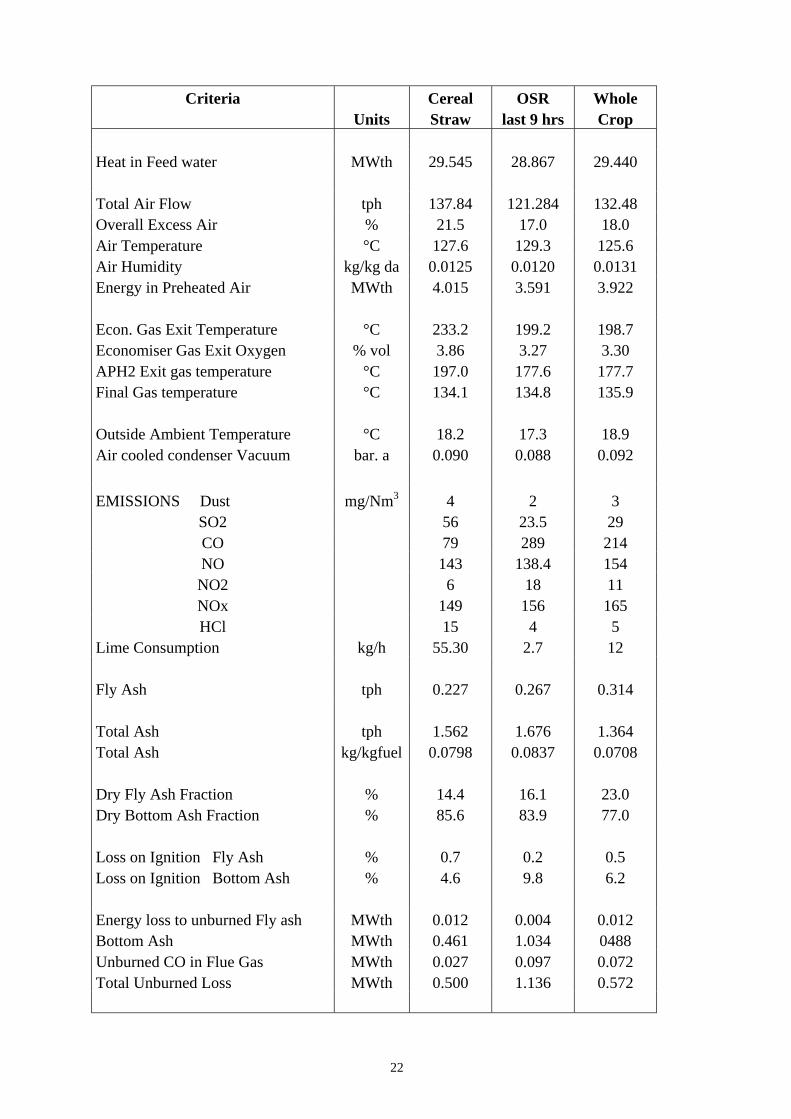
Unburned CO in Flue Gas MWth 0.027 0.097 0.072 Total Unburned Loss MWth 0.500 1.136 0.572 Overall Unburned Loss % 0.51 1.15 0.57 Combustion Efficiency % 99.49 98.85 99.43
The main point of interest from the above table is how similar the different straw typesperformed. Despite having the highest combined chlorine and sulphur content, OSR straw alsorequired the least amount of lime. This was a little surprising but would probably depend uponthe form of these compounds in the raw fuel. If these acid gas components were already in saltform such as calcium sulphate and calcium chloride then it could be expected that only a smallamount would be free for reaction.

24
4.6 Ash Produced
The following tables summarise the chemical analysis of the collected fly ash and bottom ash foreach of the three straw types.
Table 4.5.1 Analysis of Fly Ash from the Fly Ash Silo.
CriteriaUnits
Wheat Straw O S R Straw Whole Crop
Moisture % by wt 1.2 0.6 0.2(Loss on Ignition) % 0.7 0.2 0.5PH 12.3 12.3 12.2
Chloride mg/kg 147, 649 81,284 150,229Selenium 1.32 1.84 2.38Boron 128.8 154.9 200.9Cadmium 4.4 3.0 3.1Magnesium 2,360 7,630 6,250Copper 62.2 45.8 56.2Zinc 620.0 397.0 670.0Cobalt 1.3 1.4 1.1Molybdenum 46.3 36.0 30.3Iron 1,738 903 2,021Chromium 6.65 4.54 6.90Manganese 126.0 143.0 131.0Nickel 0.18 1.04 1.25Silicon 1,794 2,020 2,222Sulphur 42,163 51,986 70,919Potassium 229,000 234,000 294,000Lead 50.30 29.50 37.20Mercury 0.86 0.64 0.42Barium 72.3 82.4 73.3Aluminium 564.0 856 1,235.0Arsenic 11.20 6.57 8.23Sodium 2,470 7,200 12,600Calcium 209,781 231,933 166,352Vanadium 2.4 1.7 2.3Phosphorus 15,218 11,391 17,126Titanium <1,000 <1,000 <1,000
The main constituents in the fly ash are compounds of calcium, potassium, sulphur, phosphorusand chlorides. The toxic heavy metal content is low on all three straw types but calcium levelsare above that in the raw fuel ash due to lime addition for acid gas retention. The analysis isvery similar for all three straw types and within the variance levels normally encountered forcereal straw. Chloride levels are lowest for OSR in the fly ash but highest in the bottom ash(table 4.5.2), which reflects the amount of lime dosing encountered in the combustion test.
25
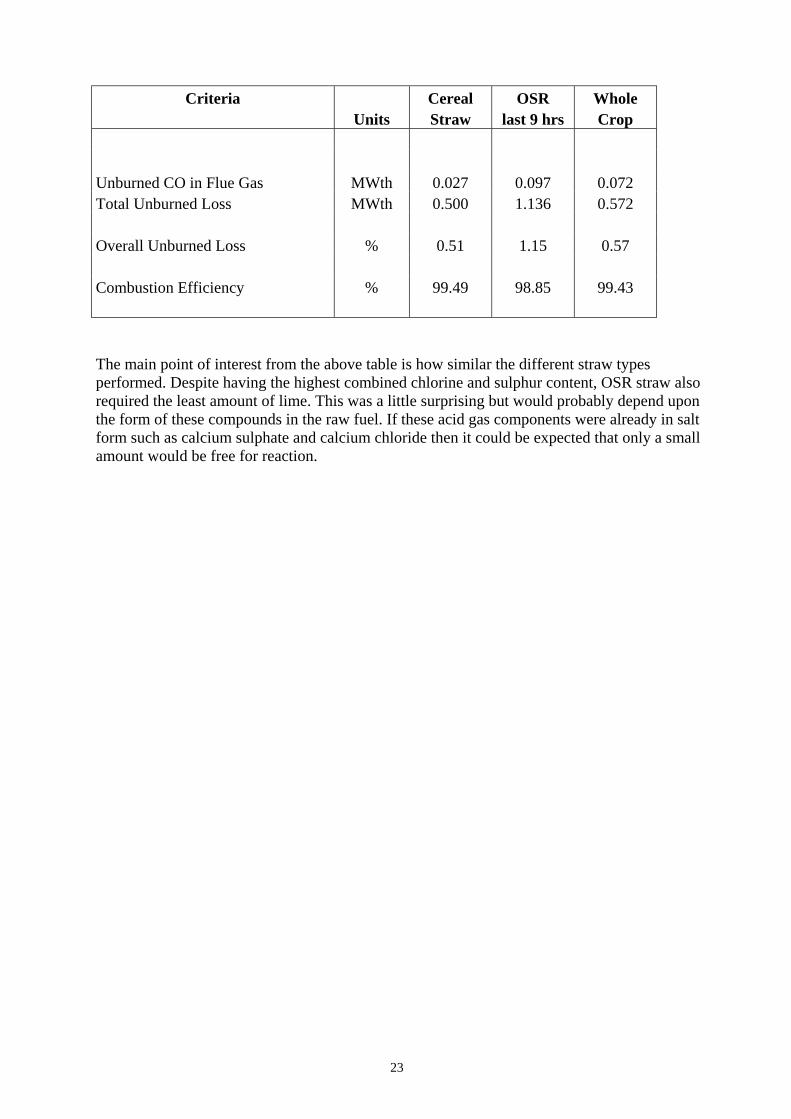
Table 4.5.2 Analysis of Bottom Ash from the Grate Quench Bath.
Criteria Units Wheat Straw O S R Straw Whole Crop
Moisture % by wt 48.0 79.9 81.4(Loss on Ignition) % 4.6 9.8 6.2pH 10.3 11.0 10.6
Chloride mg/kg 2,024 6,175 3,184Selenium <0.01 <0.01 <0.01Boron 52.3 39.6 30.1Cadmium <0.1 <0.1 <0.1Magnesium 367 0 530 460Copper 11.7 2.0 2.0Zinc 11.4 4.9 4.5Cobalt 0.8 0.1 <0.1Molybdenum 7.0 5.7 2.8Iron 1,560 108 148Chromium 4.63 3.69 2.87Manganese 284.0 12.4 14.7Nickel 1.97 0.62 0.87Silicon 897 2,172 2,245Sulphur 1,187 7,190 2,812Potassium 34,700 28,700 14,700Lead 2.12 2.62 2.47Mercury <0.02 <0.02 <0.02Barium 120.0 14.4 9.7Aluminium 1494.0 55.7 129.0Arsenic 1.05 0.48 <0.01Sodium 1,900 871 606Calcium 27,118 13,263 7,911Vanadium 3.1 0.3 0.8Phosphorus 5,634 523 1,077Titanium <1,000 <1,000 <1,000
Main points
The main constituents in the bottom ash are compounds of calcium, potassium and chlorides butat much lower levels than encountered in the fly ash. The sulphur and chloride levels beinghighest with OSR straw.
Whole crop straw produced more fly ash and the least bottom ash of all three straw types (23%and 77% by weight respectively) compared with cereal and OSR, which produced 15% fly ashand 85% bottom ash. This may be due to the inclusion of grain in the whole crop and the mannerin which it breaks up on entry to the high temperature furnace.
26
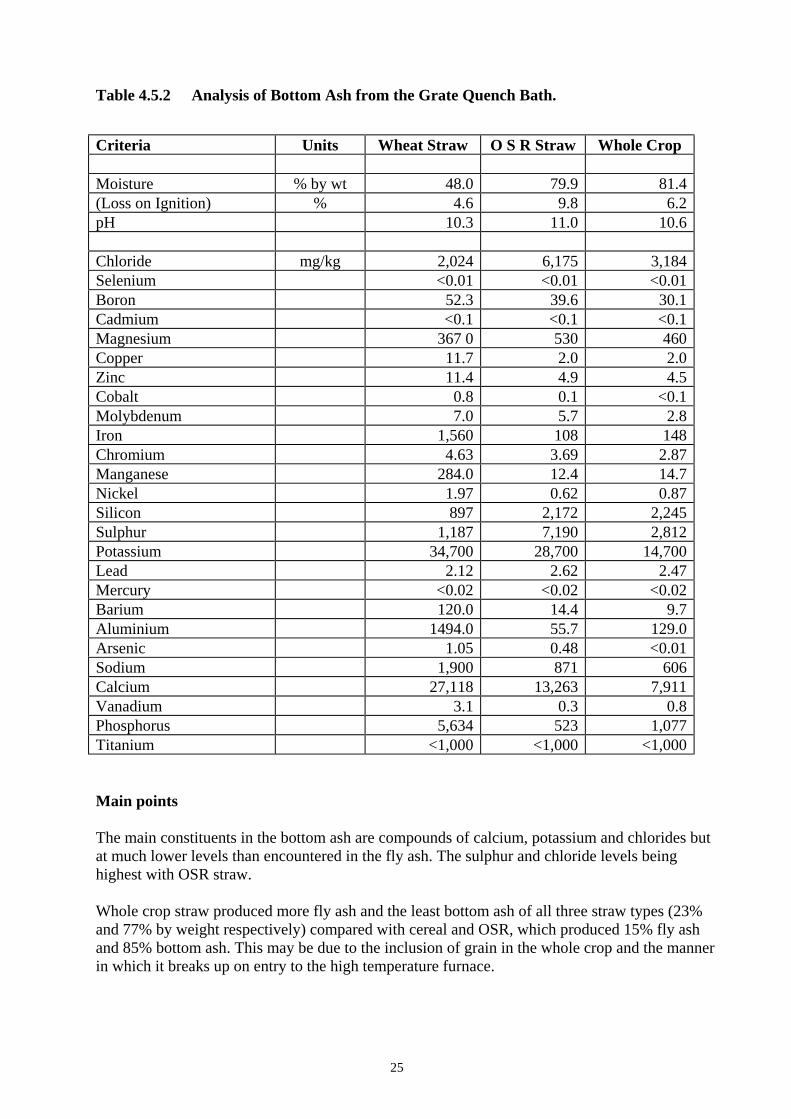
OSR straw did not produce as much slag on the grate as cereal or whole crop straw and has beenknown to cause problems with ‘floating ash’ in the quench bath, however this was notencountered during the test.
Fig 15 Grate Ash from Quench Bath on Cereal Straw
4.7 Comments and conclusions
Both cereal straw and whole crop performed well throughout. Plant emissions were well withinlimits and no problems encountered with the mechanical handling of either the fuel supply orash removal. Oil Seed Rape, however, caused several problems.
OSR was difficult to control throughout; despite re-setting the air levels to give more oxygenlower down the furnace. Occasional peaks in high temperature were followed by reducedtemperature profiles, creating stability problems for the operator, with large spikes of carbonmonoxide emissions, resulting in emission limits being exceeded.
Since the 24hour trial on OSR this material has been accepted at the power station on a fairlyregular basis. Supplying the boiler with OSR on one fuel line only has now mainly eliminatedthe problems encountered during the test. This means that a limit has been set to burn no morethan 25% OSR at any time. With two fuel lines the same problems existed.
Variations in furnace temperature and the production of carbon monoxide have effectively beendiluted giving much greater operating stability.

27
Although it was not actually observed during the test work, there have been further trips on theplant, caused by blockages in the wet bottom ash conveyor, when using OSR. This problem hasalso been overcome by limiting the supply to one line.
Plant running power for all three fuels were very similar at 8.55% of generated power, withslight variations, OSR was lower by 0.2 % and cereal straw higher by 0.2%. However thisvariation is well within normal plant variations indicating no long-term impact on power exportby burning different straw types.
28
5.0 CHIMNEY EMISSIONS
5.1 Introduction
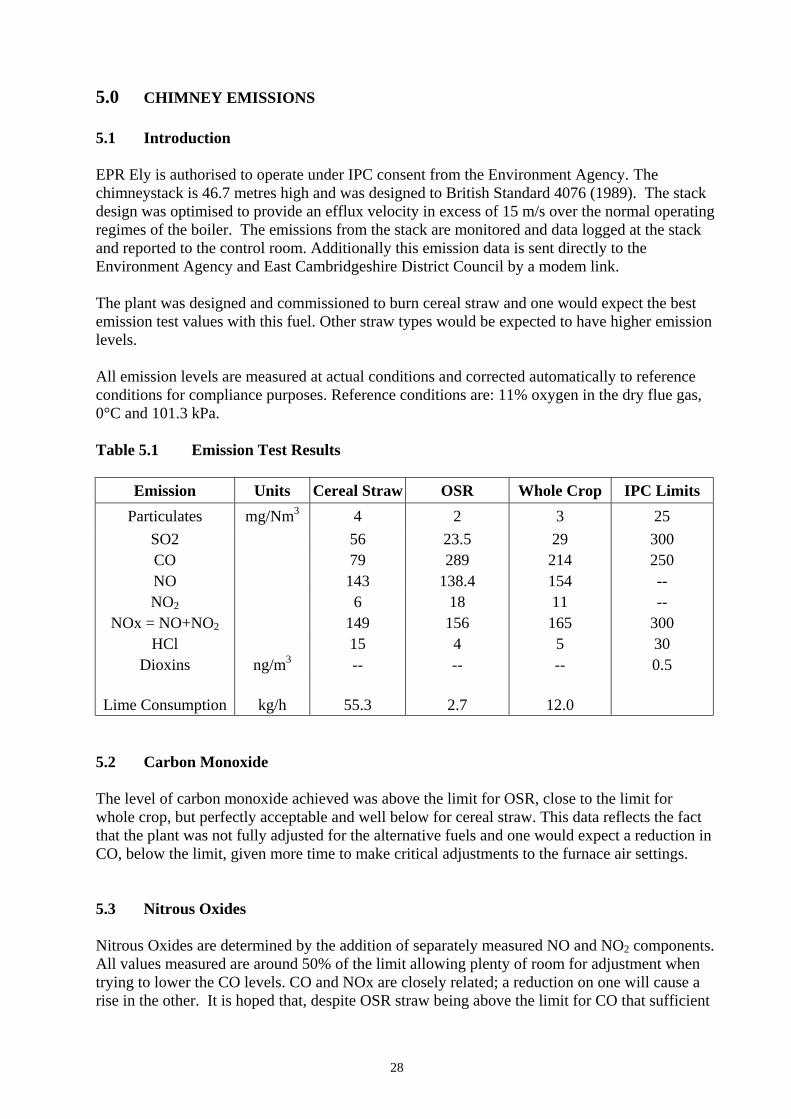
EPR Ely is authorised to operate under IPC consent from the Environment Agency. Thechimneystack is 46.7 metres high and was designed to British Standard 4076 (1989). The stackdesign was optimised to provide an efflux velocity in excess of 15 m/s over the normal operatingregimes of the boiler. The emissions from the stack are monitored and data logged at the stackand reported to the control room. Additionally this emission data is sent directly to theEnvironment Agency and East Cambridgeshire District Council by a modem link.
The plant was designed and commissioned to burn cereal straw and one would expect the bestemission test values with this fuel. Other straw types would be expected to have higher emissionlevels.
All emission levels are measured at actual conditions and corrected automatically to referenceconditions for compliance purposes. Reference conditions are: 11% oxygen in the dry flue gas,0°C and 101.3 kPa.
Table 5.1 Emission Test Results
Emission Units Cereal Straw OSR Whole Crop IPC Limits
Particulates mg/Nm3 4 2 3 25
SO2 56 23.5 29 300CO 79 289 214 250NO 143 138.4 154 --NO2 6 18 11 --
NOx = NO+NO2 149 156 165 300HCl 15 4 5 30
Dioxins ng/m3 -- -- -- 0.5
Lime Consumption kg/h 55.3 2.7 12.0
5.2 Carbon Monoxide
The level of carbon monoxide achieved was above the limit for OSR, close to the limit forwhole crop, but perfectly acceptable and well below for cereal straw. This data reflects the factthat the plant was not fully adjusted for the alternative fuels and one would expect a reduction inCO, below the limit, given more time to make critical adjustments to the furnace air settings.
5.3 Nitrous Oxides
Nitrous Oxides are determined by the addition of separately measured NO and NO2 components.All values measured are around 50% of the limit allowing plenty of room for adjustment whentrying to lower the CO levels. CO and NOx are closely related; a reduction on one will cause arise in the other. It is hoped that, despite OSR straw being above the limit for CO that sufficient
29
margin exists in the NOx level encountered to ensure both CO and NOx meet he IPC limitswhen further adjustments are made. Further work will be required to prove this.
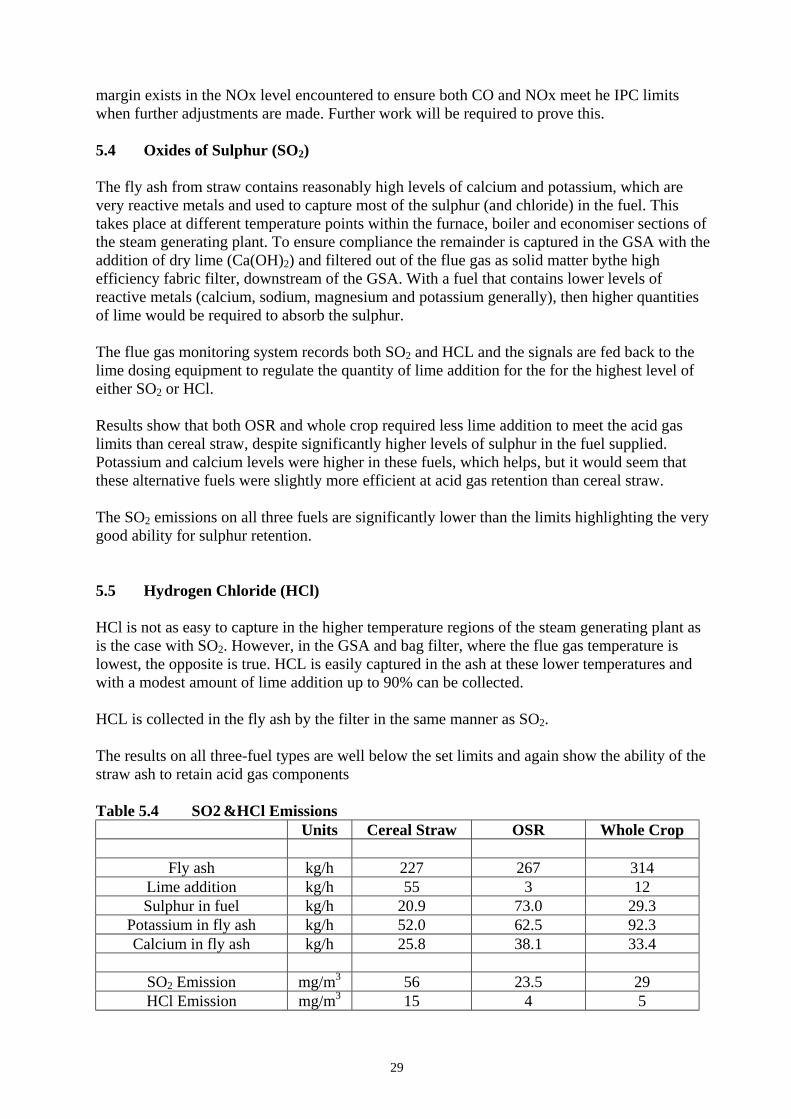
5.4 Oxides of Sulphur (SO2)
The fly ash from straw contains reasonably high levels of calcium and potassium, which arevery reactive metals and used to capture most of the sulphur (and chloride) in the fuel. Thistakes place at different temperature points within the furnace, boiler and economiser sections ofthe steam generating plant. To ensure compliance the remainder is captured in the GSA with theaddition of dry lime (Ca(OH)2) and filtered out of the flue gas as solid matter bythe highefficiency fabric filter, downstream of the GSA. With a fuel that contains lower levels ofreactive metals (calcium, sodium, magnesium and potassium generally), then higher quantitiesof lime would be required to absorb the sulphur.
The flue gas monitoring system records both SO2 and HCL and the signals are fed back to thelime dosing equipment to regulate the quantity of lime addition for the for the highest level ofeither SO2 or HCl.
Results show that both OSR and whole crop required less lime addition to meet the acid gaslimits than cereal straw, despite significantly higher levels of sulphur in the fuel supplied.Potassium and calcium levels were higher in these fuels, which helps, but it would seem thatthese alternative fuels were slightly more efficient at acid gas retention than cereal straw.
The SO2 emissions on all three fuels are significantly lower than the limits highlighting the verygood ability for sulphur retention.
5.5 Hydrogen Chloride (HCl)
HCl is not as easy to capture in the higher temperature regions of the steam generating plant asis the case with SO2. However, in the GSA and bag filter, where the flue gas temperature islowest, the opposite is true. HCL is easily captured in the ash at these lower temperatures andwith a modest amount of lime addition up to 90% can be collected.
HCL is collected in the fly ash by the filter in the same manner as SO2.
The results on all three-fuel types are well below the set limits and again show the ability of thestraw ash to retain acid gas components
Table 5.4 SO2 &HCl EmissionsUnits Cereal Straw OSR Whole Crop
Fly ash kg/h 227 267 314Lime addition kg/h 55 3 12Sulphur in fuel kg/h 20.9 73.0 29.3
Potassium in fly ash kg/h 52.0 62.5 92.3Calcium in fly ash kg/h 25.8 38.1 33.4
SO2 Emission mg/m3 56 23.5 29HCl Emission mg/m3 15 4 5

30
5.6 Particulates (Dust)
Particulate emission levels can be quite variable and dependant upon the amount of limeaddition, degree of recirculation of fly ash, whether the bags have been cleaned or about to becleaned and is also dependant upon gas volumetric flow, which affects the velocity through thebag.
The results show quite low levels of particulate emissions for all three fuels, despite differentgas flows and lime addition.
Table 5.6 Particulate Emissions
Units Cereal Straw OSR Whole CropGas Flow Tph 160 144 152Fly ash kg/h 227 267 314Lime addition kg/h 55 3 12Emission Mg/m3 4 2 3
5.7 Dioxins and Furans
Trace levels of Dioxins and Furans are found in the chimney gas, the bottom ash and fly ash. Inthe chimney gas the levels observed are a fraction of the authorised limit and in the solid ashesare no more than found in the surrounding soil. Dioxins and Furans (usually referred to asdioxins) are a family of chemicals (containing around 140 different components) based on thetri-cyclic molecule benzo-p-dioxin, which has two benzene rings, linked by two oxygen atomsand have had some or all of the hydrogen on the benzene rings replaced by chlorine.
Dioxins are usually associated with the incomplete combustion of material containing chlorineand as such are commonly associated with the ash from combustion processes, but can be foundin small traces in soils. To date only traces have been found in the previous studies of the ashesand flue gases at levels well below the emission limits, as part of the routine power stationmonitoring
Due to time and cost constraints a more detailed examination of Dioxin concentration levels atthis power station was not carried out. The cost for undertaking dioxin tests on the flue gas andashes for three different fuels would have been around £10,000.
Dioxins are usually associated with aspects of poor combustion and these can also be indicatedby high levels of CO, several times the limit and by random testing for organic hydro carbons.To ensure dioxins are adequately destroyed the furnace temperature is maintained above 850°Cfor more than two seconds and the flue gases are quickly cooled between the temperature range400 and 200°C to prevent any reforming. Control on the 850°C is by the use of natural gas,which always ensures this temperature regardless of straw moisture and furnace conditions.
5.8 Emission Control Techniques
Emissions from a biomass-fuelled boiler can be controlled by a variety of methods. The controlsystems needed depend mainly on the composition of the feedstock, variations in moisturecontent and variations in calorific value. If control is lost this can lead to increased emissionproblems, predominantly due to incomplete combustion and increased carbon monoxideemissions or excessive temperatures leading to high NOx emissions.

31
The acidic flue gas from the furnace enters the cleaning plant at the bottom of the GSA reactorwhere the gas is mixed with dry lime and with re-circulated fly ash that has been collected. Thefine lime is evenly distributed with a very large contact surface area and is carried with the fluegas through the GSA allowing a neutralising reaction to occur.
The removal of the acidic components of the flue gas is a result of the following chemicalreactions:
2 HCl + Ca (OH) 2 => CaCl2 + 2H2O SO2 + Ca (OH) 2 + H2O => CaSO3 + 2H2O
The resultant Calcium compounds are particulates and are removed in the fly ash by a fabricfilter. The purified flue gas now relieved of both the dust and acid components are released tothe atmosphere through the chimneystack well below the emission limits.
Lime is added automatically by means of a screw conveyer system and transfer pipe. Theamount to be added is determined by the control system, which measures the HCl and SO2
emissions from the stack.
Figure 16 Left: Picture of the bag filter system showing 3 of the 6 compartments.Right: Picture of the lime silo and dosing system beside the Gas SuspensionAbsorber
The plant uses a FabricleanTM Filter system. This comprises of six cleaning compartmentsarranged in parallel, which receive gases from a common inlet manifold. The flue gases fromthe furnace are drawn through the filter compartments under the influence of the InducedDraught fan.
32
The collected dust is dislodged automatically from the filter bags by short pulses of compressedair injected into each row of bags. The cleaning cycle is initiated by differential pressuremeasurements when a predetermined level of resistance is obtained over the filter.
The high efficiency fabric filter removes +99.95% of all particles from the flue gas after theGSA to fulfill the emission guarantees on particulates.
NOx levels can be controlled and maintained below emission limits by the use of specialequipment such as SCR or SNCR (selective catalytic reduction and selective non-catalyticreduction). These processes use ammonia or urea injected into the furnace and boiler sections tocapture NOx from the flue gas. This equipment is very expensive in both capital and runningcost and not available at the Ely power station. Instead, at Ely, the traditional method for NOxreduction has been adopted whereby air is entered into the furnace at different heights (stagedcombustion) with control on furnace temperature (in the range 850° to 1050°) throughout.
CO levels are maintained in a similar way by adding air at different stages to even out thecombustion rate in the furnace, without creating excessively high or excessively lowtemperatures. High temperatures lead to an increase in NOx but a reduction in CO whereas lowtemperatures lead to a reduction in NOx but an increase in CO. It is very important therefore thatgood control of the straw bale moisture content is maintained and the reason why a maximumlimit of 26% moisture is placed on bales during loading in the straw barn. High moisture canquench furnace temperatures and lead to excessive CO emissions.
5.9 Conclusions
The emission test results, table 5.1, show emissions for all straw types, in all categories, to besignificantly below limits, with the exception of carbon monoxide (CO) when burning OSRstraw.
OSR straw was known to be more difficult to burn and took the longest time to establish suitablecombustion. Sufficient room should exist within the limits of CO and NOx to enable compliancewith IPC limits provided sufficient time for tuning air settings and natural gas levels.
In conclusion all three straw types have proven sufficient merit to burn efficiently, meet IPClimits and plant output requirements.

33
6.0 FINANCIAL IMPLICATIONS
6.1 Straw supply
The cost of straw fuel is dependant upon a number of factors such as calorific value of strawtype, moisture content, soil inclusions, transport distance, cost of baling and storage andseasonality effects, which may reduce the available quantity of purchased straw to the powerstation. The power station operator requires a steady supply of suitable straw throughout theyear, at a regular known price and does not want to be unduly affected by these variations.
To smooth out the variations in delivery and delivered price Anglian Straw provide the bufferbetween the farmer and haulier on one hand and the power station demands on the other. Theylook after the whole of the supply and storage logistics and coordination requirements, ensuringand maintaining a steady, reliable and suitable supply of straw.
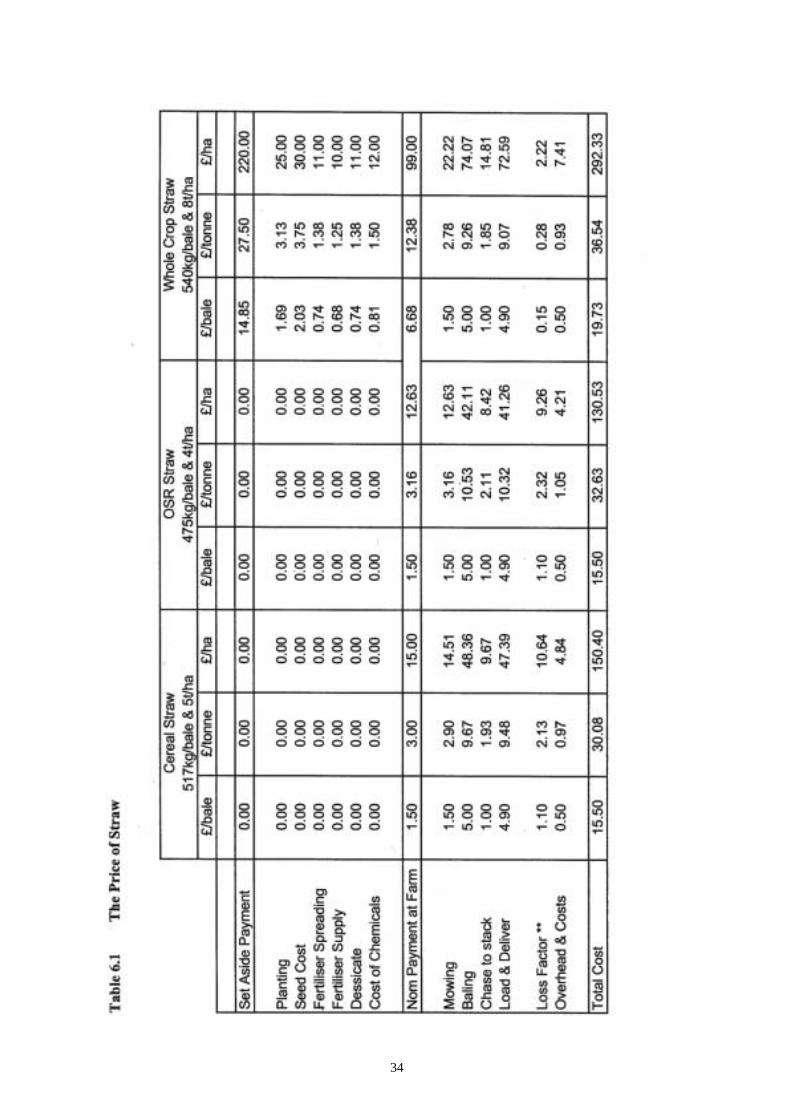
6.2 The Price of Straw
The cost of straw to the power station is currently based on the use of cereal straw at an annualaverage moisture content of 16 % by weight. The following table (table 6.1) details the currentprice of cereal straw and the price for OSR and whole Crop straws, as determined for thecombustion trials and corrected to the same basis for moisture and transport distance.
The price of OSR straw is much the same as for cereal straw at £15.50 per bale. This is notsurprising since many of the suppliers of OSR also provide much of the cereal straw. Whencompared as a price per tonne the OSR straw is not as favorable as cereal straw because theyield rate is only 4 tonne per hectare compared with cereal straw at 5 tonne per hectare.
Whole crop straw, produced on set-aside land, is far more costly to produce. The price includesa cost to the power station not normally encountered with cereal straw for seed, planting,fertilizer and chemicals for desiccation. The advantage to the farmer is that he becomes neutralto the cost of growing whole crop straw and also recovers the payment for set-aside, whichcurrently runs at £220.00 per ha. This may not be as profitable as growing grain for foodproducts but does provide a welcome use for land restricted from this purpose with a regular andpredictable income.
Table 6.1 includes a loss factor. This is an allowance for material loss due to degradation in thefield and inclement weather. Exceptional rainfall, fire and alternative supply requirements incura cost additional to the totals given in the table.
All costs quoted in table 6.1 are typical. Actual values will vary from farm to farm according tothe arrangements undertaken with the farmer, the level of split responsibility, loadingrequirements, netting requirements, delivery distances, provision of all weather sites and time ofyear.
34
35
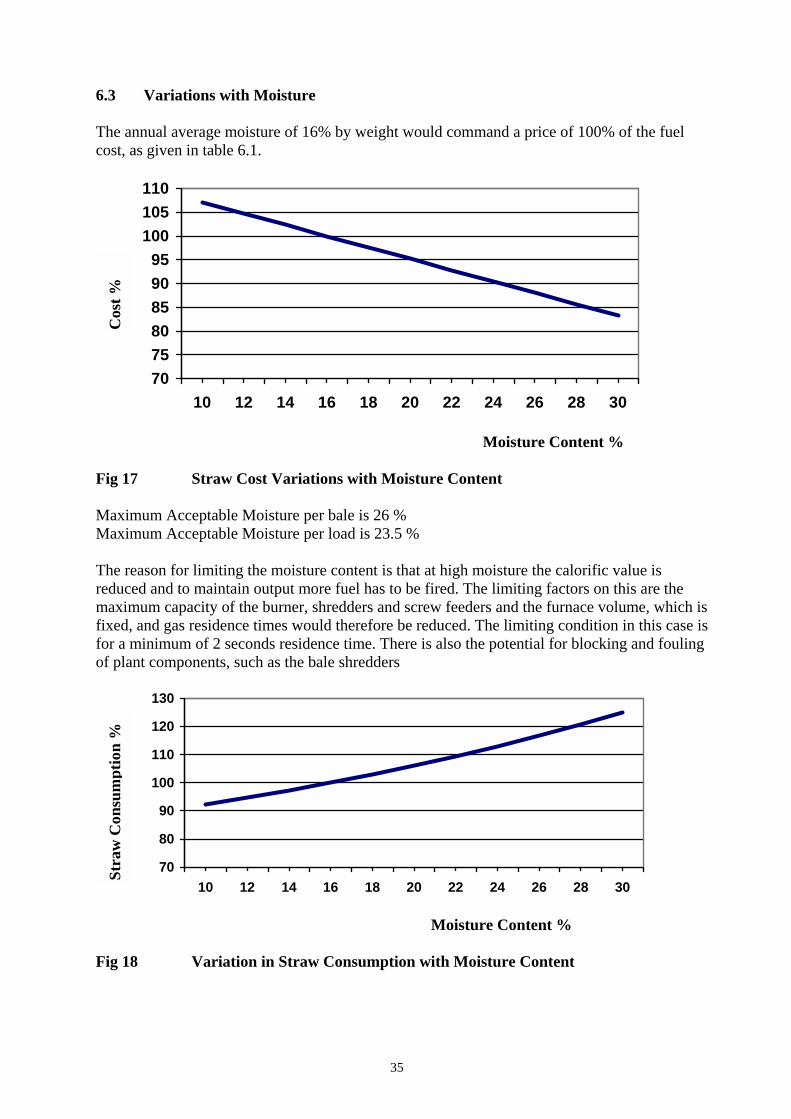
6.3 Variations with Moisture
The annual average moisture of 16% by weight would command a price of 100% of the fuelcost, as given in table 6.1.
70
75
80
85
90
95
100
105
110
10 12 14 16 18 20 22 24 26 28 30
Moisture Content %
Fig 17 Straw Cost Variations with Moisture Content
Maximum Acceptable Moisture per bale is 26 %Maximum Acceptable Moisture per load is 23.5 %
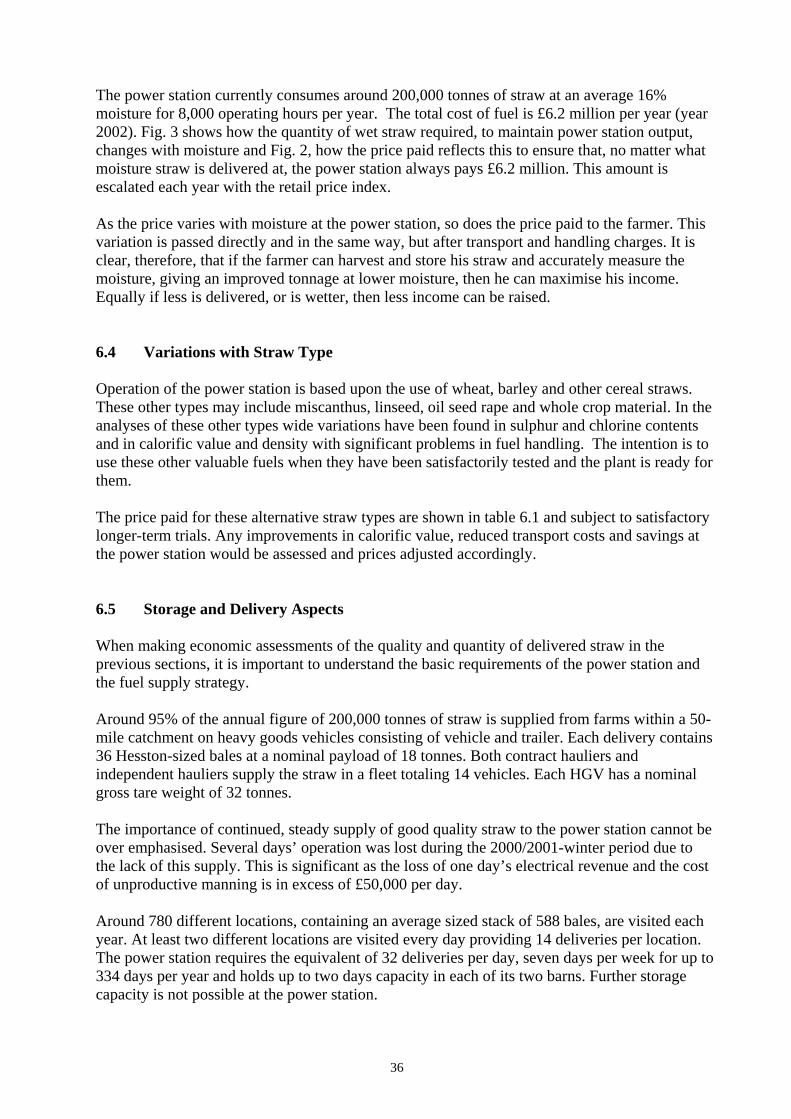
The reason for limiting the moisture content is that at high moisture the calorific value isreduced and to maintain output more fuel has to be fired. The limiting factors on this are themaximum capacity of the burner, shredders and screw feeders and the furnace volume, which isfixed, and gas residence times would therefore be reduced. The limiting condition in this case isfor a minimum of 2 seconds residence time. There is also the potential for blocking and foulingof plant components, such as the bale shredders
70
80
90
100
110
120
130
10 12 14 16 18 20 22 24 26 28 30
Moisture Content %
Fig 18 Variation in Straw Consumption with Moisture Content
Cos
t %
Str
aw C
onsu
mp
tion
%
36
The power station currently consumes around 200,000 tonnes of straw at an average 16%moisture for 8,000 operating hours per year. The total cost of fuel is £6.2 million per year (year2002). Fig. 3 shows how the quantity of wet straw required, to maintain power station output,changes with moisture and Fig. 2, how the price paid reflects this to ensure that, no matter whatmoisture straw is delivered at, the power station always pays £6.2 million. This amount isescalated each year with the retail price index.
As the price varies with moisture at the power station, so does the price paid to the farmer. Thisvariation is passed directly and in the same way, but after transport and handling charges. It isclear, therefore, that if the farmer can harvest and store his straw and accurately measure themoisture, giving an improved tonnage at lower moisture, then he can maximise his income.Equally if less is delivered, or is wetter, then less income can be raised.
6.4 Variations with Straw Type
Operation of the power station is based upon the use of wheat, barley and other cereal straws.These other types may include miscanthus, linseed, oil seed rape and whole crop material. In theanalyses of these other types wide variations have been found in sulphur and chlorine contentsand in calorific value and density with significant problems in fuel handling. The intention is touse these other valuable fuels when they have been satisfactorily tested and the plant is ready forthem.
The price paid for these alternative straw types are shown in table 6.1 and subject to satisfactorylonger-term trials. Any improvements in calorific value, reduced transport costs and savings atthe power station would be assessed and prices adjusted accordingly.
6.5 Storage and Delivery Aspects
When making economic assessments of the quality and quantity of delivered straw in theprevious sections, it is important to understand the basic requirements of the power station andthe fuel supply strategy.
Around 95% of the annual figure of 200,000 tonnes of straw is supplied from farms within a 50-mile catchment on heavy goods vehicles consisting of vehicle and trailer. Each delivery contains36 Hesston-sized bales at a nominal payload of 18 tonnes. Both contract hauliers andindependent hauliers supply the straw in a fleet totaling 14 vehicles. Each HGV has a nominalgross tare weight of 32 tonnes.
The importance of continued, steady supply of good quality straw to the power station cannot beover emphasised. Several days’ operation was lost during the 2000/2001-winter period due tothe lack of this supply. This is significant as the loss of one day’s electrical revenue and the costof unproductive manning is in excess of £50,000 per day.
Around 780 different locations, containing an average sized stack of 588 bales, are visited eachyear. At least two different locations are visited every day providing 14 deliveries per location.The power station requires the equivalent of 32 deliveries per day, seven days per week for up to334 days per year and holds up to two days capacity in each of its two barns. Further storagecapacity is not possible at the power station.
37
The main harvest period is from the end of July to the end of October, a period of around threemonths. During the harvesting period some stacks will be erected and quickly taken down tosupply the power station. At the end of the period some stacks will have to stand for theremaining nine months. The average period that a stack will stand in the field is approximatelyeight months.
OSR straw can be harvested two weeks earlier than cereal straw, which widens the harvestperiod and makes available additional fuel at a time when stocks are almost depleted.
Table 6.1 identifies the delivery cost for each straw type. A standard delivery vehicle and trailerholds 36 standard hesston bales and if these are denser the vehicle would carry a heavier loadreducing the cost of transport per tonne by undertaking fewer deliveries. OSR straw is the mostexpensive at £10.32 per tonne, whole crop the cheapest at £9.07 per tonne with cereal straw at£9.48. These prices are directly proportional to the inverse of bale density.

38
7.0 COMMENTS AND CONCLUSIONS
7.1 Assessment
A method of assessing each type of fuel was developed prior to the test work (refer section 3.3)and was designed to ensure that any particular impact on operation and performance was clearlyobserved and reported. Performance against the assessment parameters is shown below.
Ease of handling and conveying
All baled fuel types handled and conveyed in a similar manner
Ease of chopping
All baled fuel types chopped successfully although OSR required a small increase in torquesetting, indicating that OSR was slightly tougher to chop.
Ease of entry into combustion chamber
No particular problems were encountered with any baled type.
Furnace temperature profile
A similar profile was encountered with whole crop and cereal straw. OSR tended to burn moreintensively in the upper parts of the furnace and, after adjustments to the air settings, neededslightly less natural gas to maintain temperature.
Steam and electrical production rate
Steam rates of around 125tph were achieved with whole crop and cereal straw, while OSRachieved 122tph. An increase in firing rate would have adjusted this small short fall. Theelectrical generation was, however, highest with OSR and the plant parasitic load was alsolowest with OSR. Since the steam rate was lower the better electrical export can only beattributed to a better steam cycle efficiency during the test and not be directly attributable to thefuel. The slightly lower parasitic load was also due to a slightly lower firing rate.
Plant chimney emissions
With the exception of carbon monoxide when firing OSR, all plant chimney emissions werebelow the emission limits. Given sufficient time and more air and temperature adjustments thenthis too would have been brought to a value below the limits.
Ash collection and removal
No particular problems were encountered on either bottom ash or fly ash with any baled type. Itwas believed that OSR would cause a problem as it did not burn so well on the grate and it wasexpected that the bottom ash would tend to float in the quench bath, making ash extraction moredifficult. This was not actually encountered.
39
Currently the fly ash is pneumatically conveyed to a fly ash silo where it is stored prior toremoval to land fill. The wet bottom ash, containing no lime addition, is mechanicallytransported to a large hopper prior to sale as a building aggregate material. The ash quality andconsistency is very similar on all three straw types enabling the continuation of these removalroutes.
Operating stability
Each baled type took a different time for adjustments to the operation to be made, OSR beingthe most difficult. Once settled the operation of the plant became relatively stable and, althougha variety of different moistures was not encountered, it would appear that each type could haveoperated for long periods without further significant operator intervention. The ratio of naturalgas fired to solid fuel could have been further adjusted to ensure prolonged stability in the eventof differing fuel moisture, provided the maximum moisture limit, at fuel reception, of 26% byweight is adhered to.
Sustainability
Due to the limited nature of the test work, covering a one-day trial only, the question ofsustainability of combustion is more difficult to establish. Given the very similar results andperformance between whole crop and the power station’s current fuel type, wheat, one couldexpect whole crop bales to provide long-term results similar to wheat. The same cannot be saidof OSR. Further long-term operation with this fuel type is required before it could become aregular contract fuel.
Availability
Plant availability is currently around 90%, having been proven over a two-year period. Newfuels usually create new problems and any other type of baled straw would require at least3months continued use before it’s impact, if any, on the availability of the plant could be trulyassessed. From the results of these trials it would appear that the whole crop material wouldhave little impact on the long-term availability but OSR would require further work and perhapsa change in how it is fed to the furnace before its impact could be properly assessed.
7.2 Overall Assessment and Conclusions
Overall, all baled fuel types appeared to perform in a similar manner with no significanthandling, chopping or combustion problems experienced. The only real exception to this waswith OSR, which tended to burn very intensely and used slightly less natural gas to maintainfurnace temperature.
OSR was difficult to control throughout; despite re-setting the air levels to give more oxygenlower down the furnace. Occasional peaks in high temperature were followed by reducedtemperature profiles, creating stability problems for the operator, with large spikes of carbonmonoxide emissions, resulting in emission limits being exceeded.
Since the 24hour trial on OSR this material has been accepted at the power station on a fairlyregular basis. Supplying the boiler with OSR on one fuel line only has now mainly eliminatedthe problems encountered during the test. This means that a limit has been set to burn no morethan 25% OSR at any time. With two fuel lines the same problems existed.
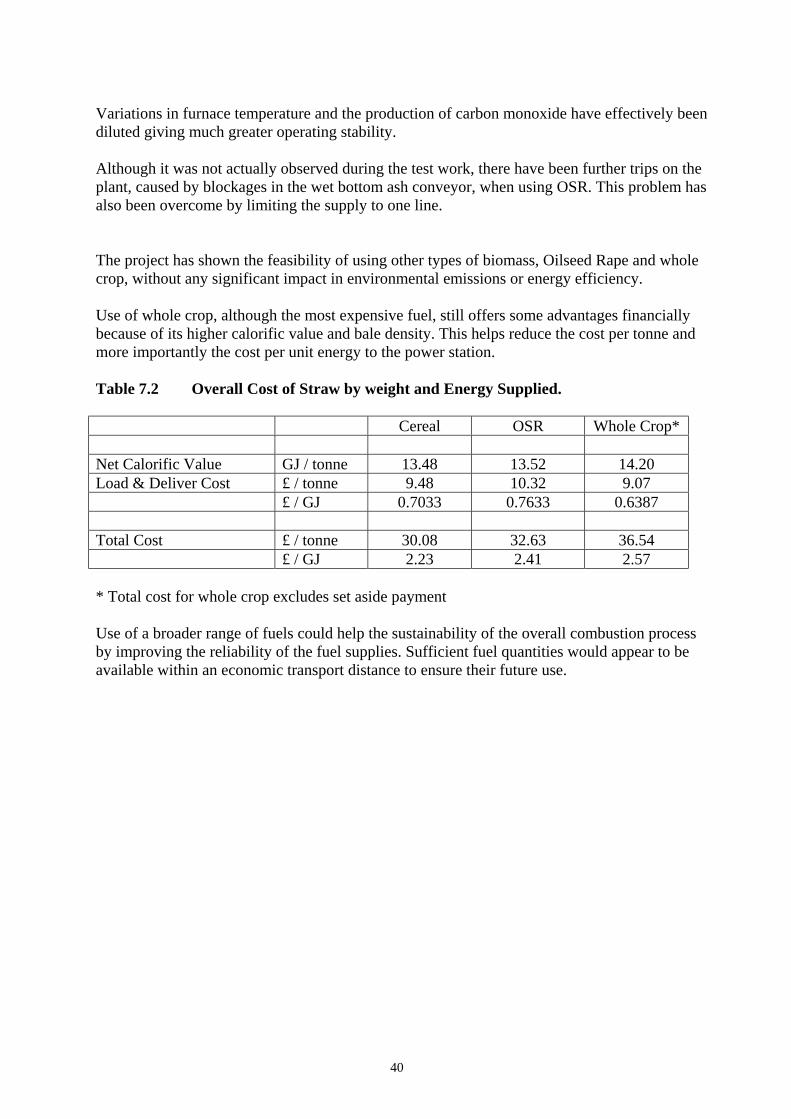
40
Variations in furnace temperature and the production of carbon monoxide have effectively beendiluted giving much greater operating stability.
Although it was not actually observed during the test work, there have been further trips on theplant, caused by blockages in the wet bottom ash conveyor, when using OSR. This problem hasalso been overcome by limiting the supply to one line.
The project has shown the feasibility of using other types of biomass, Oilseed Rape and wholecrop, without any significant impact in environmental emissions or energy efficiency.
Use of whole crop, although the most expensive fuel, still offers some advantages financiallybecause of its higher calorific value and bale density. This helps reduce the cost per tonne andmore importantly the cost per unit energy to the power station.
Table 7.2 Overall Cost of Straw by weight and Energy Supplied.
Cereal OSR Whole Crop*
Net Calorific Value GJ / tonne 13.48 13.52 14.20Load & Deliver Cost £ / tonne 9.48 10.32 9.07
£ / GJ 0.7033 0.7633 0.6387
Total Cost £ / tonne 30.08 32.63 36.54£ / GJ 2.23 2.41 2.57
* Total cost for whole crop excludes set aside payment
Use of a broader range of fuels could help the sustainability of the overall combustion processby improving the reliability of the fuel supplies. Sufficient fuel quantities would appear to beavailable within an economic transport distance to ensure their future use.
41
REFERENCES
1. ETSU B-W2-00619-REP Development of Generic Solutions for Biomass Storageand Transport.
2. ETSU B 1242 Straw Ash Characteristics.
3. ETSU B/M5/00533/16 The Fast Pyrolysis Of Oil Seed Rape
4. ETSU B/M4/00487/01 Energy and Carbon Analysis of Using Straw As A Fuel
5. ETSU B/M3/00388/39 The Analysis of Straw
42
APPENDICES
A1 KEY STAFF AND CONSULTANTS
A2 DETAILS OF CONTRACTORS
A3 ELY POWER STATION – GENERAL PLANT DESCRIPTION
A 4 TEST PROCEDURES
A5 PLANT INSTRUMENTATION
A 6 MIMIC DIAGRAMS
A7 OVERALL STEAM CYCLES & PLANT EFFICIENCY
A8 EMISSIONS DATA
A9 OSR & WHOLE CROP SURVEY
43
A1 KEY STAFF AND CONSULTANTS
John Hewson: EPR Ely, Project DirectorQualifications: MSc Energy Engineering
BSc Environmental Science
Previous Experience: John was specifically recruited by EPR to deliver the £60m Ely StrawPower Station Project. He was responsible for negotiating the contracts associated with thescheme and managed the project through financial close. He lives in East Anglia and has along-term role in the construction and future of EPR. He was responsible for the establishmentof Anglian Straw, which became the UK’s largest straw logistic company. Before joining EPR,John worked for AEP, the development arm of Compagnie Generale des Eaux, the world’slargest operator of EFW plants. As Project Manager he spent 6 years developing MSW Wasteto Energy and Biomass plants. Prior to this, he spent 10 years working for a leadingenvironmental consultancy group, culminating in the project management of two landmarkRefuse Derived Fuel power plants.
Robert Newman: EPR Ltd., Technical ManagerQualifications: BSc Mech Engineering
Previous Experience: Robert has over 30 years experience in engineering, with the last 20 yearsbeing directly involved in energy and design. As a senior engineer he has specific expertise incombustion, fuels and the efficient use of energy. Robert also has wide experience in fuelhandling and power station control systems.
Neil Goudie:
Neil is a postgraduate student at Cranfield University reading for an MSc., who undertookresponsibility for the short-term combustion trials, on EPR’s behalf, as part of a bigger study tocomplete his Masters thesis.
Andy Middleton:
As Operations Manager for Anglian Straw Ltd., Andy is responsible for all the day-to-dayoperation of ASL’s straw gathering activities. These responsibilities include the organisation ofbringing all contracted and special deliveries of baled straw to site; beginning with the crop inthe field and culminating in site storage.
44
A2 DETAILS OF CONTRACTORS
Energy Power Resources Ltd.
Energy Power Resources is the leading UK developer of renewable energy projects. It has aproven track record and a diverse portfolio; including chicken litter, straw and wood burningprojects. Currently, EPR has five biomass power stations constructed and in operation withinit’s portfolio with three further schemes at planning approval stage.
Northern Straw
Northern Straw is the largest specialist straw baling contractor and trader in the UK, balingapproximately 100,000 tpa. The company, formed almost 20 years ago, is based in Goole, EastYorkshire and employs @ 40 staff. Northern Straw’s Managing Director and co-founder isDavid Johnson a very well known figure in the industry and the President Elect of the UK Hayand Straw Merchants Association. Over the years Northern Straw has undertaken andcontributed to a number of research studies on the straw market and its utilisation, includingETSU report B/M4/00487/16/REP
Anglian Straw Ltd.
Anglian Straw is a subsidiary of EPR Ely and is the UK’s largest biomass logistics company.The company specialises in providing ‘just in time’ deliveries of biomass, particularly straw,from farmers and suppliers to end users such as energy producers.
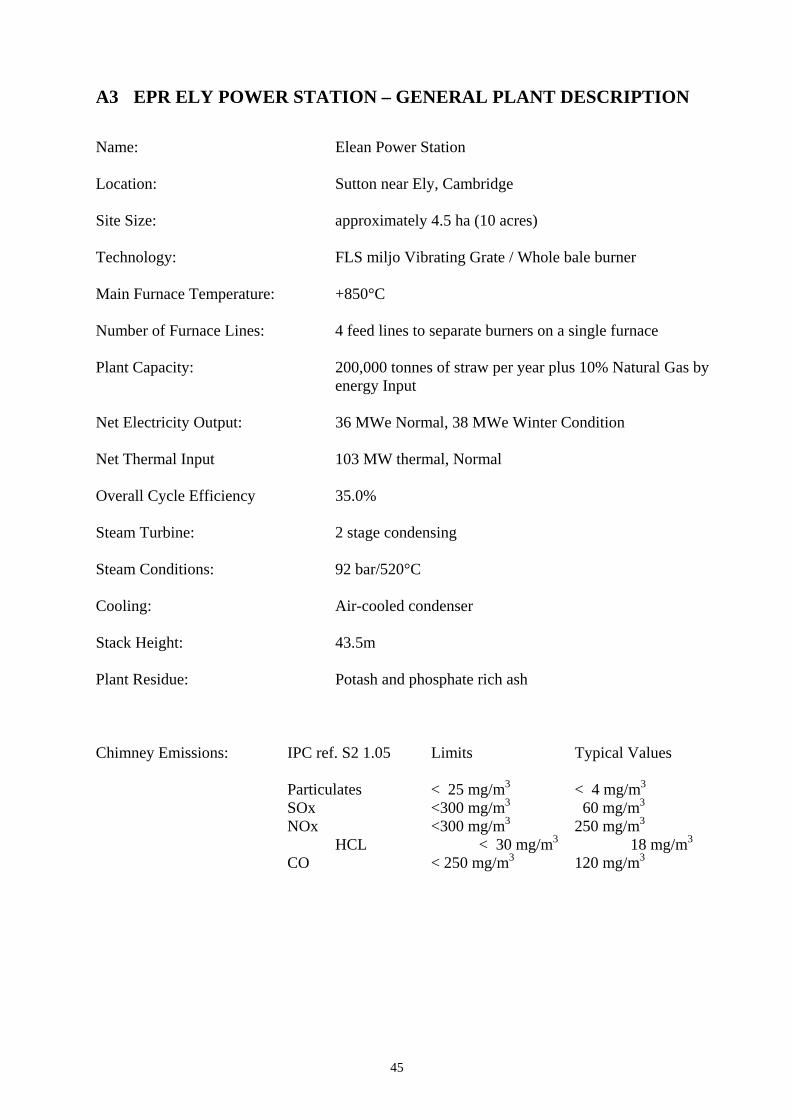
45
A3 EPR ELY POWER STATION – GENERAL PLANT DESCRIPTION
Name: Elean Power Station
Location: Sutton near Ely, Cambridge
Site Size: approximately 4.5 ha (10 acres)
Technology: FLS miljo Vibrating Grate / Whole bale burner
Main Furnace Temperature: +850°C
Number of Furnace Lines: 4 feed lines to separate burners on a single furnace
Plant Capacity: 200,000 tonnes of straw per year plus 10% Natural Gas byenergy Input
Net Electricity Output: 36 MWe Normal, 38 MWe Winter Condition
Net Thermal Input 103 MW thermal, Normal
Overall Cycle Efficiency 35.0%
Steam Turbine: 2 stage condensing
Steam Conditions: 92 bar/520°C
Cooling: Air-cooled condenser
Stack Height: 43.5m
Plant Residue: Potash and phosphate rich ash
Chimney Emissions: IPC ref. S2 1.05 Limits Typical Values
Particulates < 25 mg/m3 < 4 mg/m3
SOx <300 mg/m3 60 mg/m3
NOx <300 mg/m3 250 mg/m3
HCL < 30 mg/m3 18 mg/m3
CO < 250 mg/m3 120 mg/m3
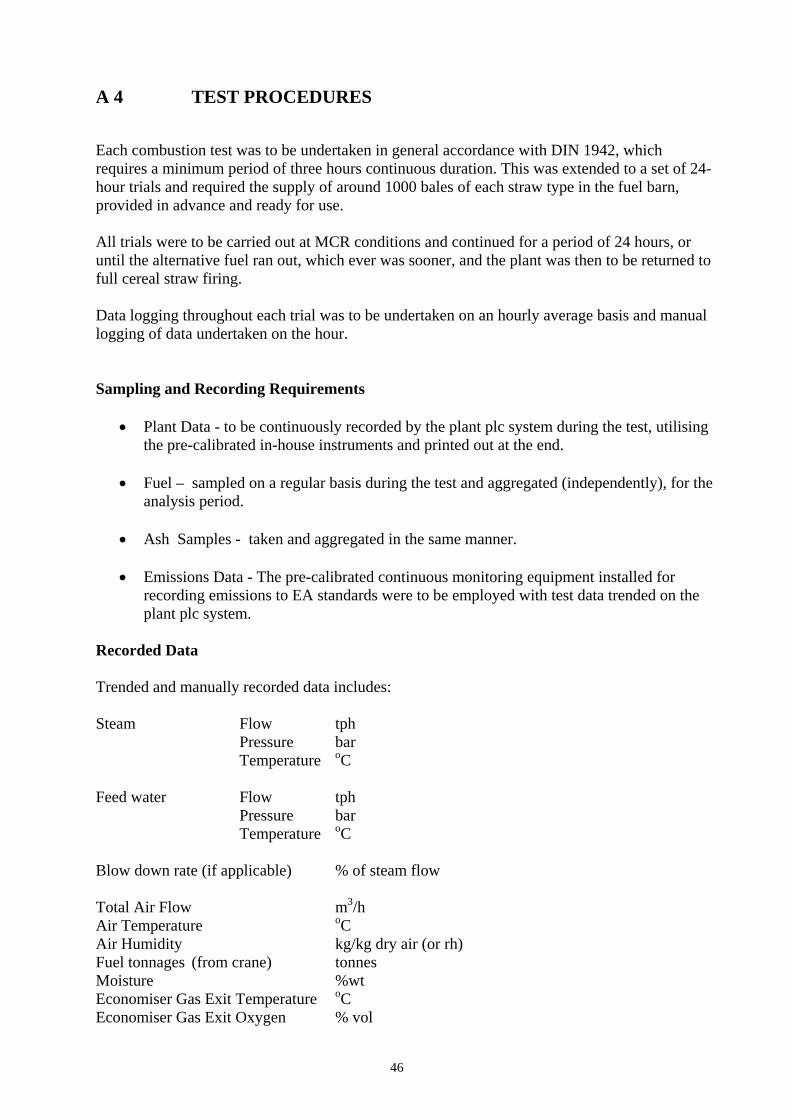
46
A 4 TEST PROCEDURES
Each combustion test was to be undertaken in general accordance with DIN 1942, whichrequires a minimum period of three hours continuous duration. This was extended to a set of 24-hour trials and required the supply of around 1000 bales of each straw type in the fuel barn,provided in advance and ready for use.
All trials were to be carried out at MCR conditions and continued for a period of 24 hours, oruntil the alternative fuel ran out, which ever was sooner, and the plant was then to be returned tofull cereal straw firing.
Data logging throughout each trial was to be undertaken on an hourly average basis and manuallogging of data undertaken on the hour.
Sampling and Recording Requirements
• Plant Data - to be continuously recorded by the plant plc system during the test, utilisingthe pre-calibrated in-house instruments and printed out at the end.
• Fuel – sampled on a regular basis during the test and aggregated (independently), for theanalysis period.
• Ash Samples - taken and aggregated in the same manner.
• Emissions Data - The pre-calibrated continuous monitoring equipment installed forrecording emissions to EA standards were to be employed with test data trended on theplant plc system.
Recorded Data
Trended and manually recorded data includes:
Steam Flow tphPressure barTemperature oC
Feed water Flow tphPressure barTemperature oC
Blow down rate (if applicable) % of steam flow
Total Air Flow m3/hAir Temperature oCAir Humidity kg/kg dry air (or rh)Fuel tonnages (from crane) tonnesMoisture %wtEconomiser Gas Exit Temperature oCEconomiser Gas Exit Oxygen % vol

47
Fly ash collected tonnesBottom ash collected tonnesElectrical Export Gross MWeElectrical Export Net MWePlant power load MWeNatural Gas Consumption ft3
Chimney Emissions:
NOx mg/Nm3 at 11% O2 refSOxHCLCOParticulates
Laboratory Analysis:
Fuel Ultimate Analysis + GCV & NCVFly Ash Analysis Carbon in ash/loss on ignitionBottom Ash Analysis Carbon in ash/loss on ignition
General:
Each trial burn was to generate data and information to enable both OSR and Whole Crop to becompared with cereal straw as an alternative fuel.
Monitoring and recording by general observation was also undertaken during combustion foridentification of any variations to normal plant operation that could impact on plant efficiency oremission levels.
Natural Gas Calorific values were to be obtained, for each day’s operation, from the supplier toestablish the correct energy input.
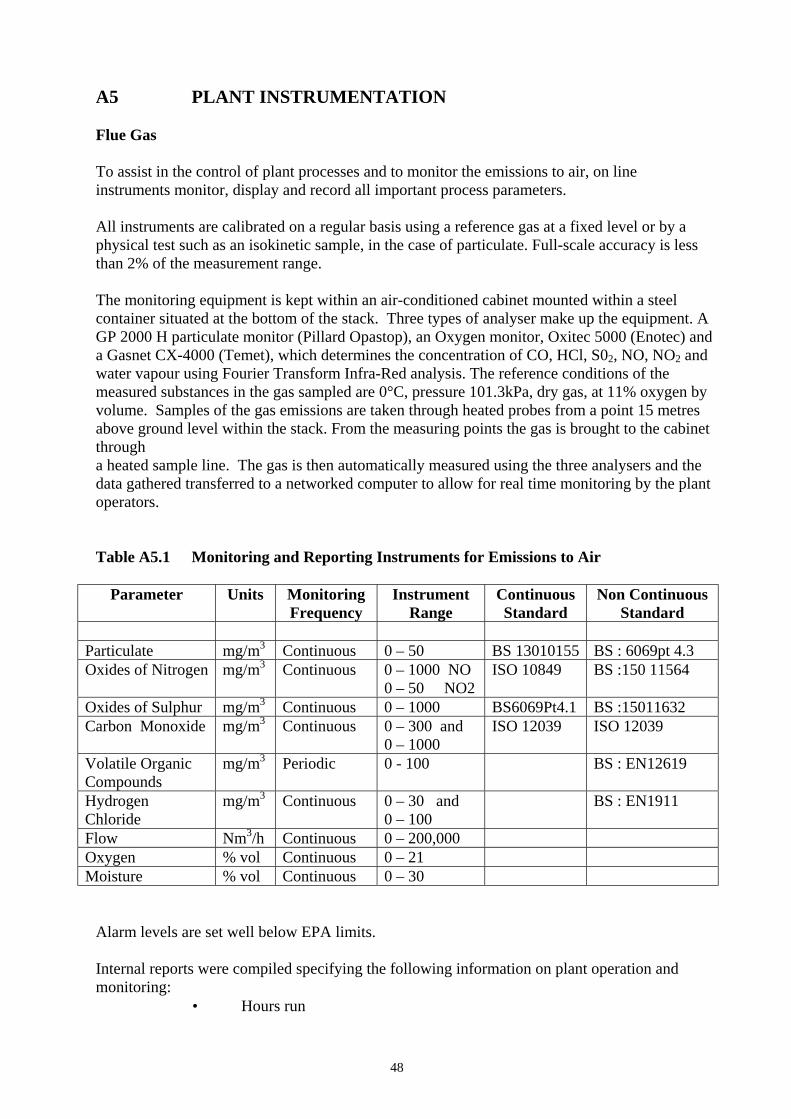
48
A5 PLANT INSTRUMENTATION
Flue Gas
To assist in the control of plant processes and to monitor the emissions to air, on lineinstruments monitor, display and record all important process parameters.
All instruments are calibrated on a regular basis using a reference gas at a fixed level or by aphysical test such as an isokinetic sample, in the case of particulate. Full-scale accuracy is lessthan 2% of the measurement range.
The monitoring equipment is kept within an air-conditioned cabinet mounted within a steelcontainer situated at the bottom of the stack. Three types of analyser make up the equipment. AGP 2000 H particulate monitor (Pillard Opastop), an Oxygen monitor, Oxitec 5000 (Enotec) anda Gasnet CX-4000 (Temet), which determines the concentration of CO, HCl, S02, NO, NO2 andwater vapour using Fourier Transform Infra-Red analysis. The reference conditions of themeasured substances in the gas sampled are 0°C, pressure 101.3kPa, dry gas, at 11% oxygen byvolume. Samples of the gas emissions are taken through heated probes from a point 15 metresabove ground level within the stack. From the measuring points the gas is brought to the cabinetthrougha heated sample line. The gas is then automatically measured using the three analysers and thedata gathered transferred to a networked computer to allow for real time monitoring by the plantoperators.
Table A5.1 Monitoring and Reporting Instruments for Emissions to Air
Parameter Units MonitoringFrequency
InstrumentRange
ContinuousStandard
Non ContinuousStandard
Particulate mg/m3 Continuous 0 – 50 BS 13010155 BS : 6069pt 4.3Oxides of Nitrogen mg/m3 Continuous 0 – 1000 NO
0 – 50 NO2ISO 10849 BS :150 11564
Oxides of Sulphur mg/m3 Continuous 0 – 1000 BS6069Pt4.1 BS :15011632Carbon Monoxide mg/m3 Continuous 0 – 300 and
0 – 1000ISO 12039 ISO 12039
Volatile OrganicCompounds
mg/m3 Periodic 0 - 100 BS : EN12619
HydrogenChloride
mg/m3 Continuous 0 – 30 and0 – 100
BS : EN1911
Flow Nm3/h Continuous 0 – 200,000Oxygen % vol Continuous 0 – 21Moisture % vol Continuous 0 – 30
Alarm levels are set well below EPA limits.
Internal reports were compiled specifying the following information on plant operation andmonitoring:
• Hours run
49
• Emissions (corrected to reference conditions)
• Flue Gas Flow (dry basis)
• Flue Gas Oxygen (dry basis)
• Flue Gas Moisture
Particulates Retrieved DCS archivesCO emissions Retrieved DCS archivesSOx emissions Retrieved DCS archivesHCl emissions Retrieved DCS archivesNOx emissions Retrieved DCS archives

50
A 6 MIMIC DIAGRAMS
The following figures illustrate the typical form of live data that is indicated on mimics providedon screen to the plant operator.
Fig 19 Feed System
Fig 20 Feed System, Second Overview
Fig 21 Water & Steam System
Fig 22 Flue Gas & Emissions
Fig 23 Trending
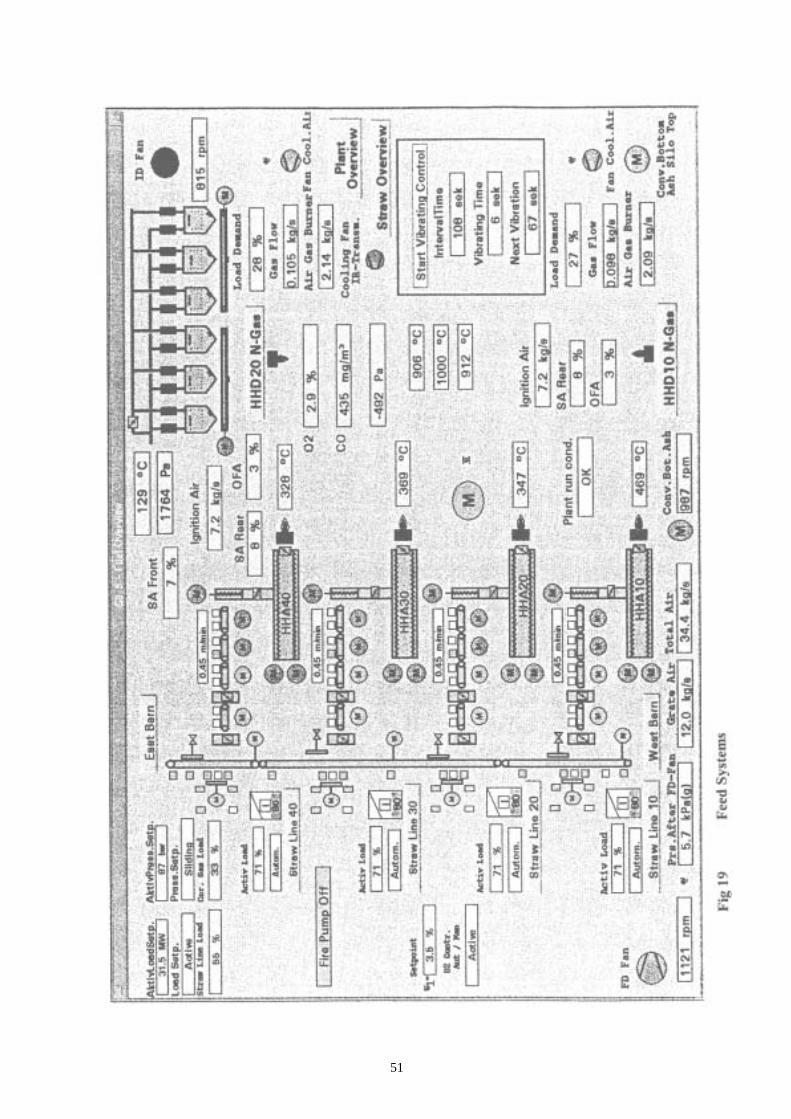
51

52
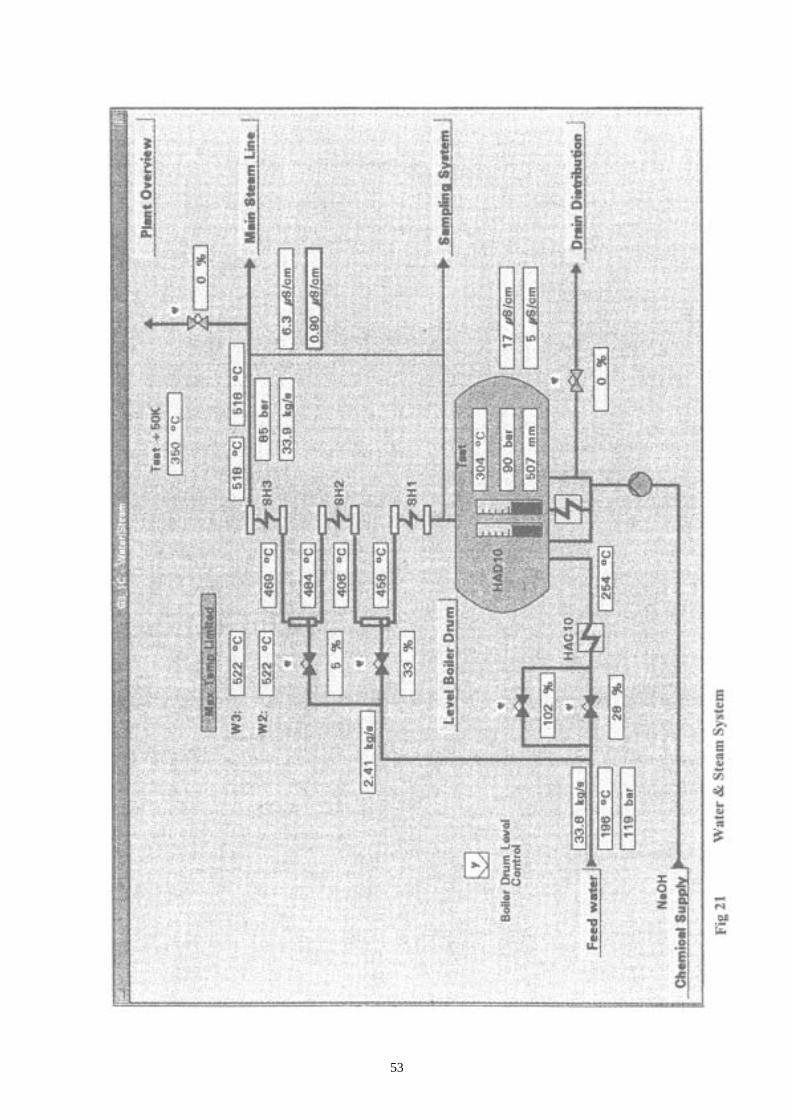
53

54

55

56
A7 OVERALL STEAM CYCLES & PLANT EFFICIENCY
• Trial On Cereal Straw
Fig 24 Boiler & Overall System DiagramSummary of Overall Energy Balance
• Trial on Oil Seed Rape
Fig 25 Boiler & Overall System DiagramSummary of Overall Energy Balance
• Trial on Whole Crop
Fig 26 Boiler & Overall System DiagramSummary of Overall Energy Balance

57
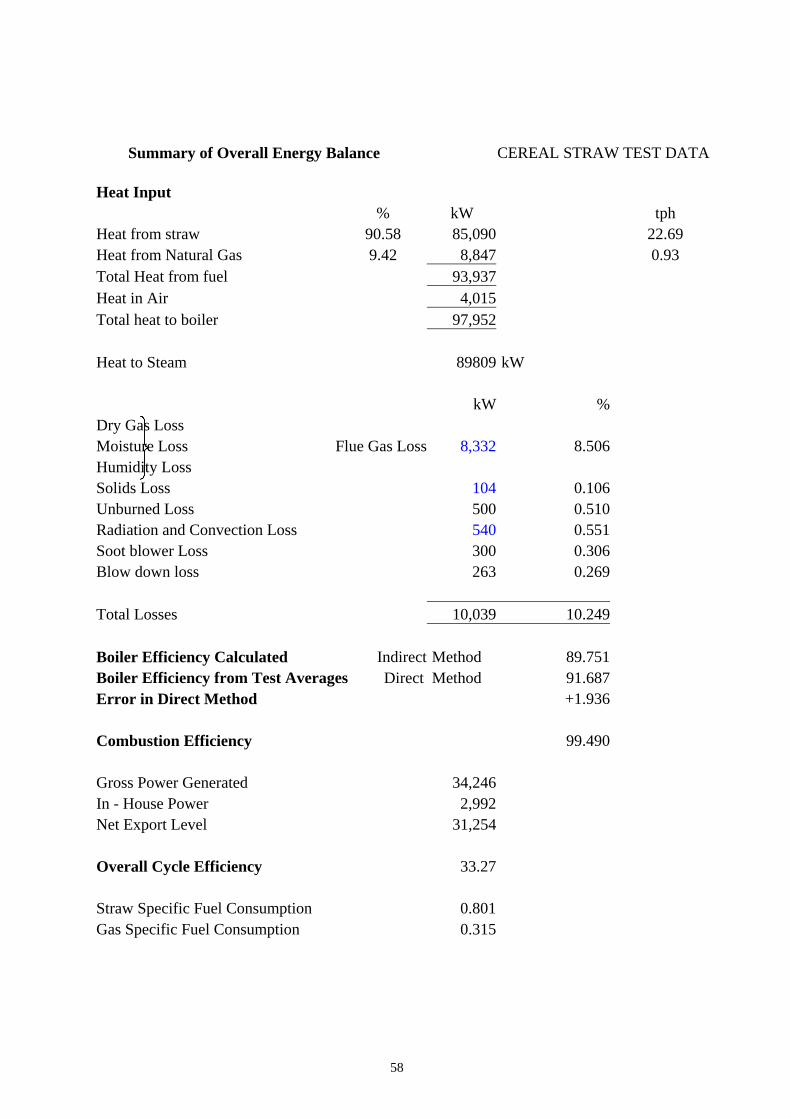
58
Summary of Overall Energy Balance CEREAL STRAW TEST DATA
Heat Input% kW tph
Heat from straw 90.58 85,090 22.69Heat from Natural Gas 9.42 8,847 0.93Total Heat from fuel 93,937Heat in Air 4,015Total heat to boiler 97,952
Heat to Steam 89809 kW
kW %Dry Gas LossMoisture Loss Flue Gas Loss 8,332 8.506Humidity LossSolids Loss 104 0.106Unburned Loss 500 0.510Radiation and Convection Loss 540 0.551Soot blower Loss 300 0.306Blow down loss 263 0.269
Total Losses 10,039 10.249
Boiler Efficiency Calculated Indirect Method 89.751Boiler Efficiency from Test Averages Direct Method 91.687Error in Direct Method +1.936
Combustion Efficiency 99.490
Gross Power Generated 34,246In - House Power 2,992Net Export Level 31,254
Overall Cycle Efficiency 33.27
Straw Specific Fuel Consumption 0.801Gas Specific Fuel Consumption 0.315
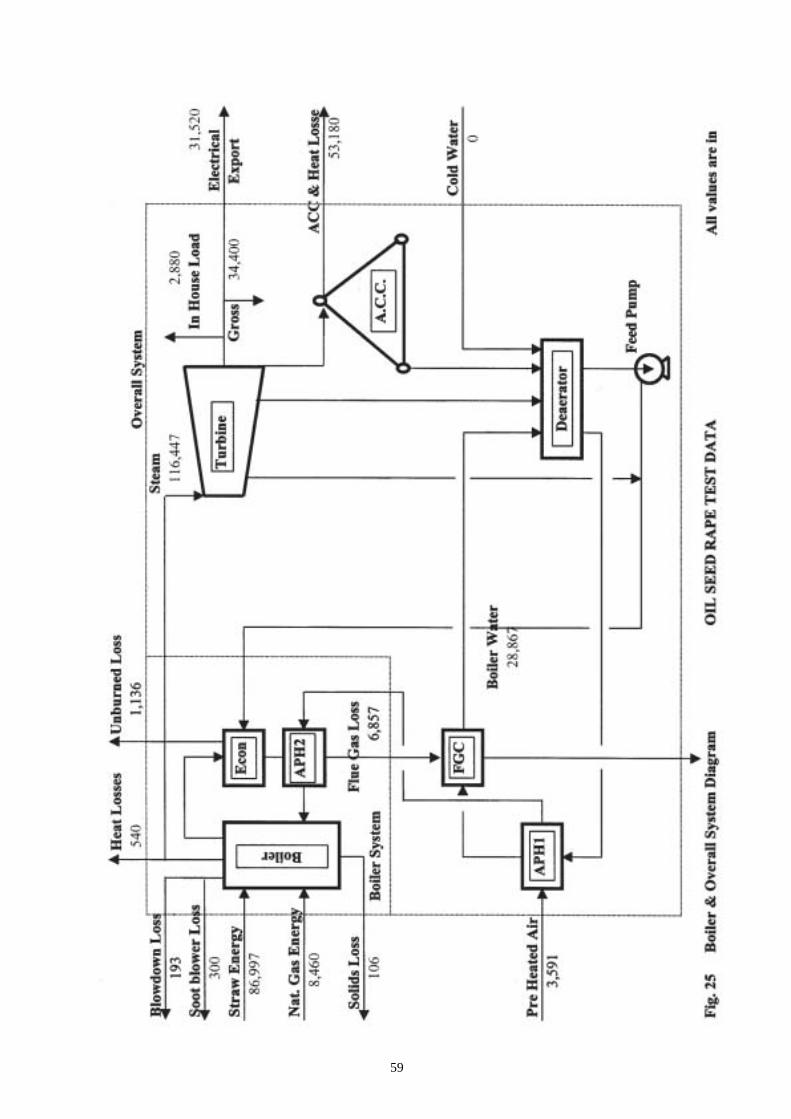
59

60
Summary of Overall Energy Balance OIL SEED RAPE TEST DATA
Heat Input% kW tph
Heat from straw 91.14 86,997 23.56Heat from Natural Gas 8.86 8,460 0.93Total Heat from fuel 95,458 24.49Heat in Air 3,591Total heat to boiler 99,049
Heat to Steam 88072 kW
kW %Dry Gas LossMoisture Loss Flue Gas Loss 6,857 6.923Humidity LossSolids Loss 106 0.107Unburned Loss 1,136 1.147Radiation and Convection Loss 540 0.545Soot blower Loss 300 0.303Blowdown loss 193 0.195
Total Losses 9,132 9.220
Boiler Efficiency Calculated (Indirect Method) 90.780Boiler Efficiency from Test Averages (Direct Method) 88.918Error in Calculation by direct Method -1.862
Combustion Efficiency 98.853
Gross Power Generated 34,400In - House Power 2,880Net Export Level 31,520
Overall Cycle Efficiency 33.02
Straw Specific Fuel Consumption 0.820Gas Specific Fuel Consumption 0.332
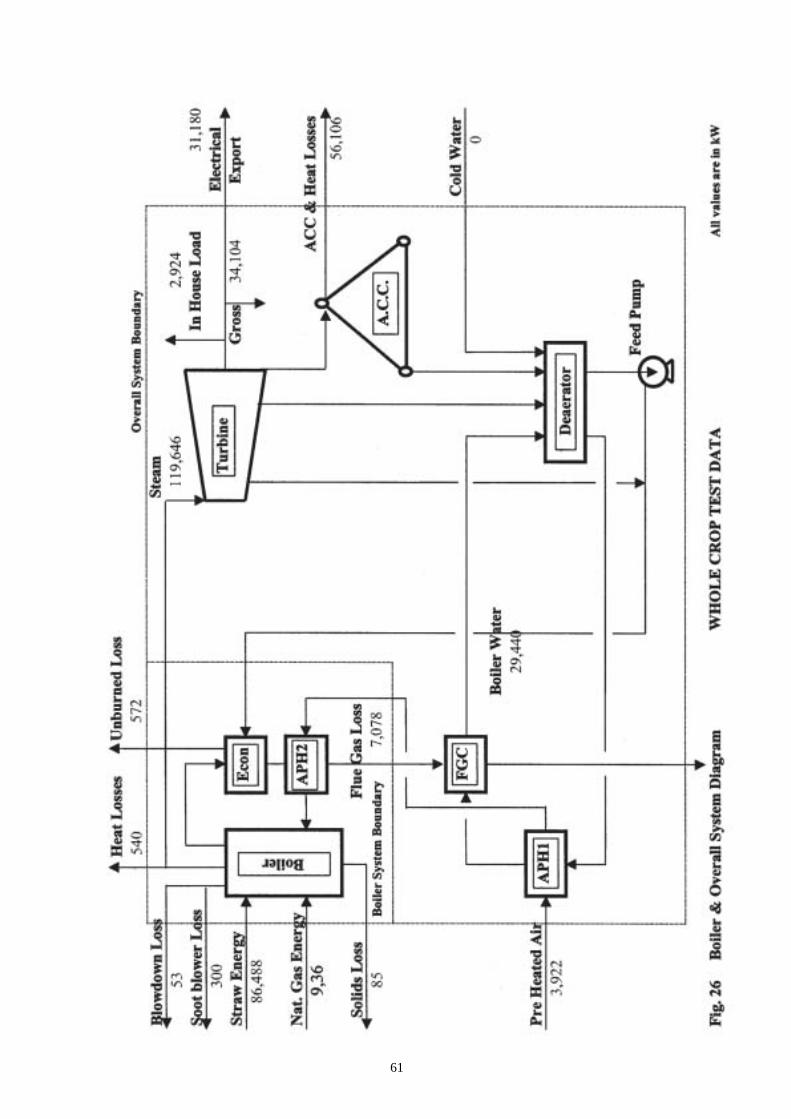
61
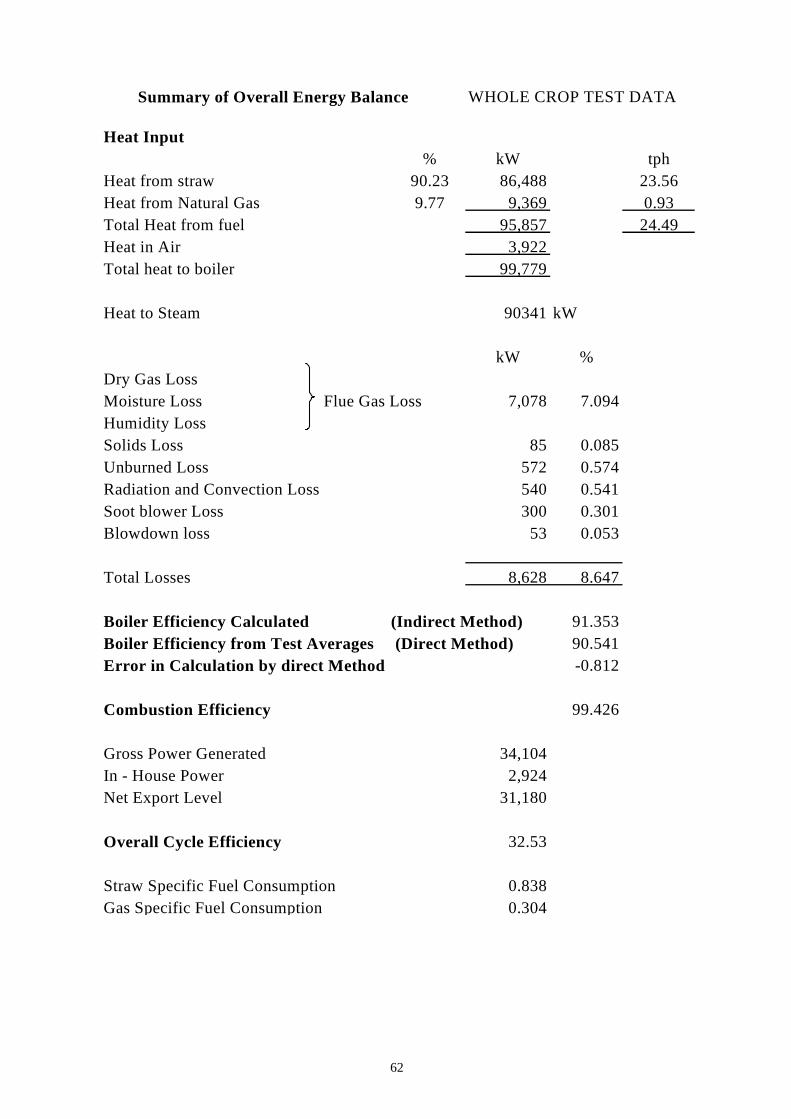
62
Summary of Overall Energy Balance WHOLE CROP TEST DATA
Heat Input% kW tph
Heat from straw 90.23 86,488 23.56Heat from Natural Gas 9.77 9,369 0.93Total Heat from fuel 95,857 24.49Heat in Air 3,922Total heat to boiler 99,779
Heat to Steam 90341 kW
kW %Dry Gas LossMoisture Loss Flue Gas Loss 7,078 7.094Humidity LossSolids Loss 85 0.085Unburned Loss 572 0.574Radiation and Convection Loss 540 0.541Soot blower Loss 300 0.301Blowdown loss 53 0.053
Total Losses 8,628 8.647
Boiler Efficiency Calculated (Indirect Method) 91.353Boiler Efficiency from Test Averages (Direct Method) 90.541Error in Calculation by direct Method -0.812
Combustion Efficiency 99.426
Gross Power Generated 34,104In - House Power 2,924Net Export Level 31,180
Overall Cycle Efficiency 32.53
Straw Specific Fuel Consumption 0.838Gas Specific Fuel Consumption 0.304

63
A8 EMISSION DATA FOR TESTED STRAW TYPES
Fig 27 Cereal Straw
Fig 28 Oil Seed Rape
Fig 29 Whole Crop
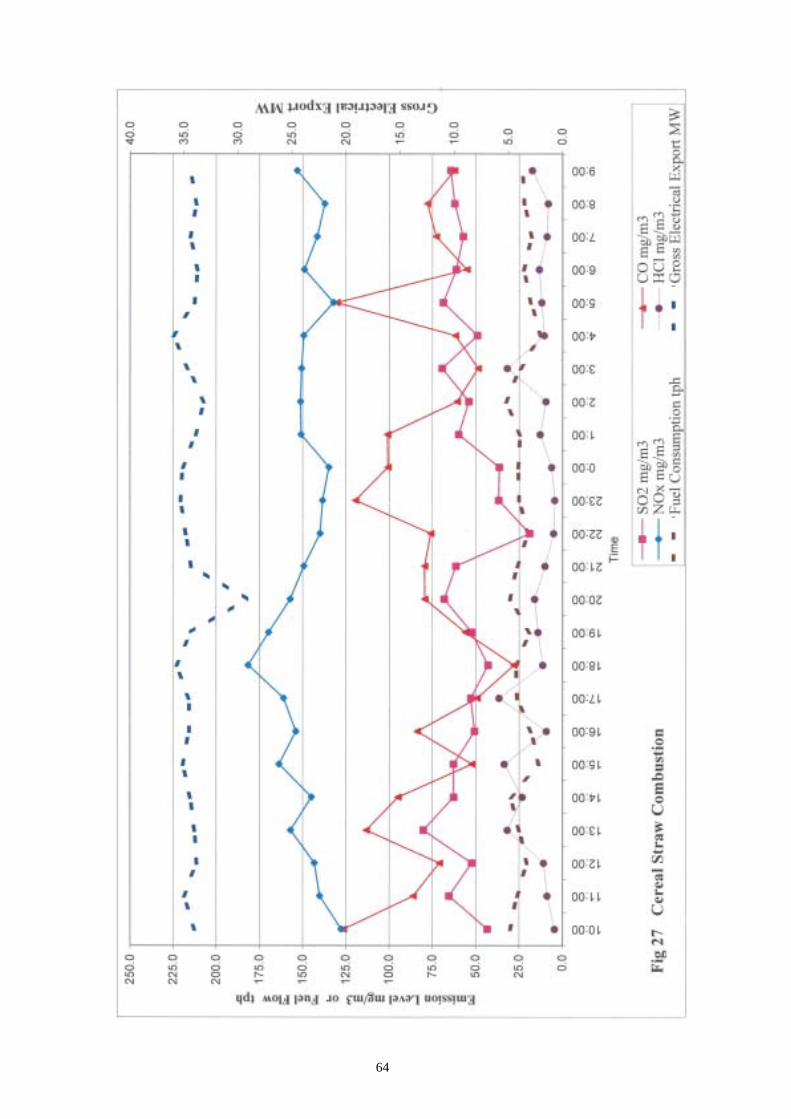
64

65

66
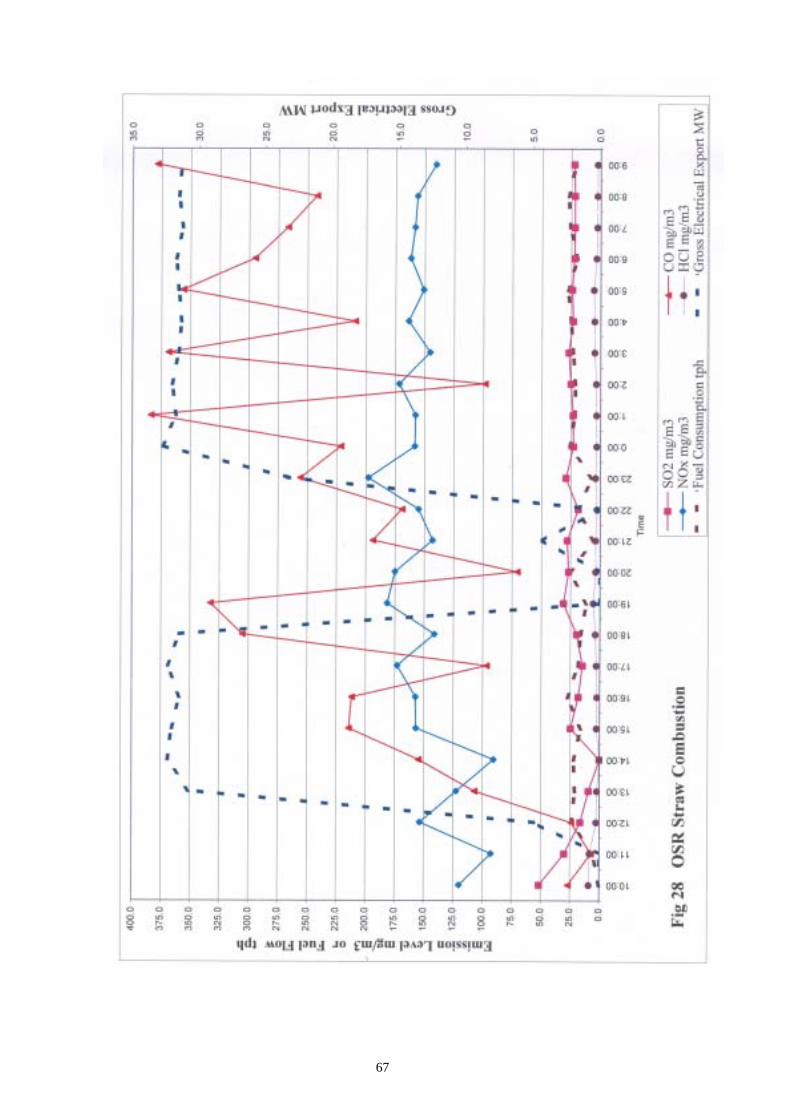
67

68

69
A9 OSR AND WHOLE CROP SURVEYS
Anglian Straw Ltd received the following response on whole crop grown on set-aside from aletter of enquiry.
Table A9.1 Whole Crop
ASL Location ha Tonnage Average
Ref No per Ha
WC001-02 Chatteris 13.06 62.6 4.79
WC002-02 Chatteris 11.45 59.2 5.17
WC004-02 Melton Mowbray 263.80 1,194.4 4.53
WC005-02 Spalding 7.49 40.8 5.45
WC006-02 Stonely, Kimbolton 16.85 116.8 6.93
WC007-02 Rockingham, Market Harborough 27.69 126.9 4.58
WC008-02 Huntingdon 5.57 46.1 8.28
WC009-02 Sutton St James, Spalding 10.65 63.6 5.97
WC010-02 Thetford 136.37 307.0 2.25
WC011-02 Upwell, Wisbech 22.86 132.6 5.80
WC012-02 Huntingdon 4.34 19.8 4.55
WC013-02 Huntingdon 1.27 23.2 18.23
WC014-02 Chatteris 6.74 41.6 6.17
WC015-02 Chatteris 8.90 69.4 7.80
WC016-02 Keisby, Bourne 28.98 141.6 4.89
WC017-02 Bury St Edmunds 11.26 63.4 5.63
WC018-02 Coveney, Ely 13.34 86.3 6.47
WC019-02 Abbotts Ripton, Huntingdon 7.47 47.6 6.37
WC020-02 Southery, Downham Market 20.14 121.8 6.05
WC021-02 Sleaford 32.33 166.1 5.14
WC022-02 Little Staughton 10.46 95.3 9.11
WC023-02 Royston 21.40 126.9 5.93
WC024-02 Market Harborough 46.29 247.3 5.34
WC025-02 Stonely, Kimbolton 34.20 224.6 6.57
WC026-02 Stonely, Kimbolton 18.67 90.1 4.83
WC027-02 Northampton 13.50 70.4 5.22
WC028-02 Riseley 13.54 81.1 5.99
WC029-02 Lincoln 21.47 101.5 4.73
WC030-02 Baston, Peterborough 13.57 55.3 4.08
WC031-02 Spalding 24.32 129.1 5.31
WC032-02 Newark 14.80 76.7 5.18
WC033-02 Ely 4.65 31.3 6.73
WC034-02 Ely 19.99 96.1 4.81
WC035-02 Ely 40.34 181.7 4.50
WC036-02 Chatteris 8.63 43.6 5.05
Totals 956.39 4,581.6 4.79
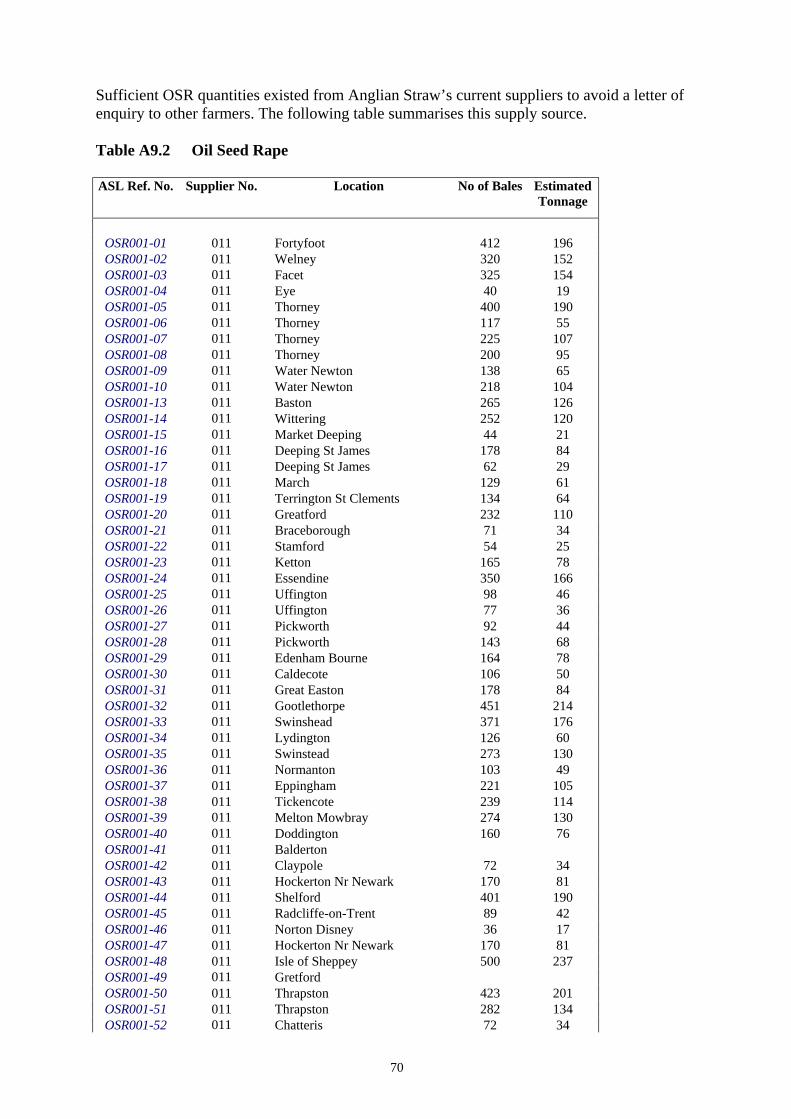
70
Sufficient OSR quantities existed from Anglian Straw’s current suppliers to avoid a letter ofenquiry to other farmers. The following table summarises this supply source.
Table A9.2 Oil Seed Rape
ASL Ref. No. Supplier No. Location No of Bales EstimatedTonnage
OSR001-01 011 Fortyfoot 412 196OSR001-02 011 Welney 320 152OSR001-03 011 Facet 325 154OSR001-04 011 Eye 40 19OSR001-05 011 Thorney 400 190OSR001-06 011 Thorney 117 55OSR001-07 011 Thorney 225 107OSR001-08 011 Thorney 200 95OSR001-09 011 Water Newton 138 65OSR001-10 011 Water Newton 218 104OSR001-13 011 Baston 265 126OSR001-14 011 Wittering 252 120OSR001-15 011 Market Deeping 44 21OSR001-16 011 Deeping St James 178 84OSR001-17 011 Deeping St James 62 29OSR001-18 011 March 129 61OSR001-19 011 Terrington St Clements 134 64OSR001-20 011 Greatford 232 110OSR001-21 011 Braceborough 71 34OSR001-22 011 Stamford 54 25OSR001-23 011 Ketton 165 78OSR001-24 011 Essendine 350 166OSR001-25 011 Uffington 98 46OSR001-26 011 Uffington 77 36OSR001-27 011 Pickworth 92 44OSR001-28 011 Pickworth 143 68OSR001-29 011 Edenham Bourne 164 78OSR001-30 011 Caldecote 106 50OSR001-31 011 Great Easton 178 84OSR001-32 011 Gootlethorpe 451 214OSR001-33 011 Swinshead 371 176OSR001-34 011 Lydington 126 60OSR001-35 011 Swinstead 273 130OSR001-36 011 Normanton 103 49OSR001-37 011 Eppingham 221 105OSR001-38 011 Tickencote 239 114OSR001-39 011 Melton Mowbray 274 130OSR001-40 011 Doddington 160 76OSR001-41 011 BaldertonOSR001-42 011 Claypole 72 34OSR001-43 011 Hockerton Nr Newark 170 81OSR001-44 011 Shelford 401 190OSR001-45 011 Radcliffe-on-Trent 89 42OSR001-46 011 Norton Disney 36 17OSR001-47 011 Hockerton Nr Newark 170 81OSR001-48 011 Isle of Sheppey 500 237OSR001-49 011 GretfordOSR001-50 011 Thrapston 423 201OSR001-51 011 Thrapston 282 134OSR001-52 011 Chatteris 72 34
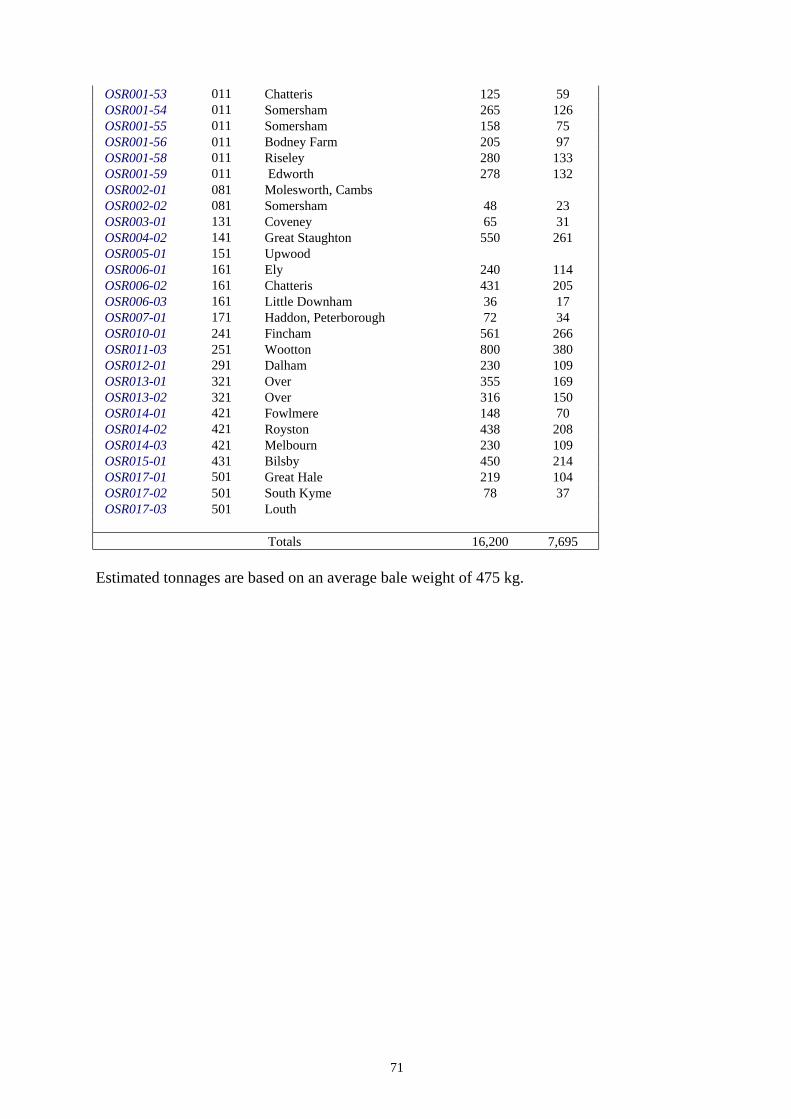
71
OSR001-53 011 Chatteris 125 59OSR001-54 011 Somersham 265 126OSR001-55 011 Somersham 158 75OSR001-56 011 Bodney Farm 205 97OSR001-58 011 Riseley 280 133OSR001-59 011 Edworth 278 132OSR002-01 081 Molesworth, CambsOSR002-02 081 Somersham 48 23OSR003-01 131 Coveney 65 31OSR004-02 141 Great Staughton 550 261OSR005-01 151 UpwoodOSR006-01 161 Ely 240 114OSR006-02 161 Chatteris 431 205OSR006-03 161 Little Downham 36 17OSR007-01 171 Haddon, Peterborough 72 34OSR010-01 241 Fincham 561 266OSR011-03 251 Wootton 800 380OSR012-01 291 Dalham 230 109OSR013-01 321 Over 355 169OSR013-02 321 Over 316 150OSR014-01 421 Fowlmere 148 70OSR014-02 421 Royston 438 208OSR014-03 421 Melbourn 230 109OSR015-01 431 Bilsby 450 214OSR017-01 501 Great Hale 219 104OSR017-02 501 South Kyme 78 37OSR017-03 501 Louth
Totals 16,200 7,695
Estimated tonnages are based on an average bale weight of 475 kg.