A Toolbox of Metrology-based Techniques for Optical System ...
42
A Toolbox of Metrology-based Techniques for Optical System Alignment SPIE Optics & Photonics San Diego, CA August 28, 2016 1 Phillip Coulter (GSFC), Raymond G. Ohl (GSFC), Peter N. Blake (GSFC), Brent J. Bos (GSFC), Gordon V. Casto (GSFC), William L. Eichhorn (GESI), Jeffrey S. Gum (GSFC), Theodore J. Hadjimichael (GSFC), John G. Hagopian (JHEL), Joseph E. Hayden (SSC), Samantha L. Hicks (GSFC), Dave Kubalak (GSFC), Kyle F. Mclean (PEMSL), Joseph McMann (SLI), Kevin Redman (SLI), Greg Wenzel (SLI), Jerrod Young (GSFC)
Transcript of A Toolbox of Metrology-based Techniques for Optical System ...

A Toolbox of Metrology-based
Techniques for Optical System
Alignment
SPIE Optics &
Photonics
San Diego, CA
August 28, 2016
1
Phillip Coulter (GSFC), Raymond G. Ohl (GSFC), Peter N. Blake (GSFC), Brent J. Bos (GSFC), Gordon V.
Casto (GSFC), William L. Eichhorn (GESI), Jeffrey S. Gum (GSFC), Theodore J. Hadjimichael (GSFC), John G.
Hagopian (JHEL), Joseph E. Hayden (SSC), Samantha L. Hicks (GSFC), Dave Kubalak (GSFC), Kyle F.
Mclean (PEMSL), Joseph McMann (SLI), Kevin Redman (SLI), Greg Wenzel (SLI), Jerrod Young (GSFC)

Outline
I. Introduction
II. Instruments
III. Analytical tools
IV. Applications
V. Conclusion

Introduction to NASA GSFC Optics Branch
The Optics branch is active in all phases of instrument and optical technology development
Design
Fabrication
Components
Optical alignment, integration and test—optical metrology
Wavefront sensing
GSFC has significant heritage in building and aligning spacecraft and space flight optical instruments
NASA GSFC Optics branch involved in instrument building and optical metrology since the 1960s
Spacecraft and instrument-level alignment, integration and testing (AI&T)
Optical component through system level characterization and alignment
Environmental testing
Mechanical system and optical alignment and verification
Pre-launch checkout – optical end-to-end testing, alignment checks to spacecraft, etc.
Recent relevant GSFC spacecraft alignment and space flight optical instrument projects
JWST ISIM, OTIS, and I&T
HST I&T and IVT
OSIRIS-Rex/OVIRS
Spitzer/IRAC
DSCVR I&T
Many sounding rocket and balloon instruments
Cassini/CIRS
Landsat/TIRS
IceSat/ATLAS
IRMOS
WMAP
COBE


Introduction Provide an overview of some modern, optical/optomechanical measurement capabilities in a “toolbox”
format
Show how metrology instruments that are typically used for large-volume applications can be also used for
optical alignment
We do not discuss interferometry or wavefront sensing and similar, optical-only techniques
– those subjects are broad and well treated by others
– we focus on techniques and instruments that are less used by optical engineers and usually not covered in
classical optical engineering curricula
– techniques that would be employed to accomplish alignment before high-precision optical
testing/verification, like interferometry or image testing
The concept of using these metrology instrument for alignment involves:
Establish and measure a fixed, stable coordinate system (CS) to bench or structure
CS is based on measurable features that are important to an optical system and transferred to metrology
references that are modeled in CAD, FEM, and ray trace software
Metrology at the component level, followed by work at the subsystem and system level
Alignment of components to the system is achieved nominally based on nominal CAD and an optical design
Optomechanical work is followed by optical testing for verification and/or tweaking to achieve tighter alignment and
performance (interferometry, wavefront sensing, other image-based techniques)
This methodology can simplify and speed up the alignment process --- i.e., reduce iterations…..

Measurement Instruments Wide variety of measurement instruments available
Laser Trackers (LT)
Laser Radar (LR)
Theodolites
Cathetometer
CMM with variety of probe types
Instruments can be classified as
Contact vs. non-contact to the article under test
Point-like (X, Y, Z) vs. angular (i.e., vector) measurements
Instruments discussed are not limited to the manufacturers shown in the following examples --- specific
instruments and manufacturers mentioned or shown do not constitute an endorsement by NASA --- many
manufacturers and models function in a similar manner and would produce similar results --- we
encourage the reader to study all available options
Measurement arms (portable CMM)
Theodolites
Total Stations
Point source microscope
Heritage optical tools --- invaluable

Laser trackers
1. Burge, J. et al., “Use of a commercial laser tracker for optical alignment,”
Proc. SPIE 6676, 2007
2. New River Kinematics, Inc., Williamsburg, Virginia, www.kinematics.com
3. S. Sandwith & R. Predmore, “Real-time 5-micron Uncertainty with Laser
Tracking Interferometer Systems using Weighted Trilateration,” New River
Kinematics, Inc. Williamsburg, Va
Laser trackers SMR & nest
Laser tracker1 is used to measure targets and surfaces
LT is a contact instrument
GSFC uses Spatial Analyzer2 software, which includes Unified Spatial
Metrology Network (USMN3; bundling) routine
Its target is a spherically mounted retro-reflector (SMR) that attaches to
magnetic nest that are interchangeable with the TB targets that are used by
the LR
Uncertainty ~<0.025mm/meter (1-sigma)
Some LTs may be used with probe, scanners and other accessories
May also be used to track hardware during “blind” precision integration
activities
Can be used to track an SMR for live position feedback
Surfaces are measured by dragging or touching the SMR in several locations
on the test object
Can be used to measure flat mirror orientation and position via “direct and
through” technique3 (uncertainties on the order of 10-15 arcsec)
Some LT models can measure flat mirror normals directly
Advantages:
Large measurement volume
High accuracy
Very flexible instrument
Multiple attachment available for some models
Tracks a moving target
Disadvantages:
Must have straight line of sight to target
Requires contact when installing SMR
Requires >1 operator usually
Laser scanner
attachment

“Laser radar”
Laser radar1 (LIDAR) is used to measure targets and surfaces
Operated with Spatial Analyzer software, USMN-compatible
Its target is diffuse surface (mechanical surface; matt finish),
reflective tooling ball, specular mirror, or high-quality tooling
hole; also useful for specular, optical surfaces
Uncertainty ~<0.025mm/meter (1-sigma)
Laser Radar scans much faster than Laser Tracker with T-
Scan or tramming
At ambient, used for:
• Prescription and alignment measurement for large optics
(radius, aperture, etc.)
• Envelope scans (hardware critical clearances)
• Tooling ball targets on large and small assemblies
• Advantages:
• Non-contact scanning capabilities
• Uses TBs which cost less than SMRs
• Large measurement volume
• Less human interaction with the test article
• Requires only 1 operator
• Disadvantages:
• Requires straight line of sight to target
• Cannot track a moving target
• Expensive
1. Metris USA, Inc., Brighton, Michigan, www.metris.com
TB & nest
Invar+BR127 gold-like blanket composite Mylar
materials test article
Laser radar (LIDAR)

Measurement Arms/Total Station
Measurement Arms Primarily a contact measurement system, but scanner heads available
Available in various arm lengths
Can measure numerous features such as TBs, SMRs, holes, and surfaces
Advantages:
Does not require direct line of sight to target
Portable
Multiple probe tips available with non-contact options
Disadvantage:
Measurement volume limited to arm length
Accuracy not as good a LT and LR systems
Measurements are made in close proximity to hardware
Uncertainty is a complex function of distance from fixed base
Total Stations Theodolite with built in distance measuring laser
Capable of measuring angle and point-like data
Non-contact instrument (except SMR measurement)
Angular measurement uncertainties same as theodolite
Range uncertainty based on target type and distance
Target types: SMR, retroreflector, any visible target measurable by the laser
Advantages:
Combined capability of angle and point-like measurements
Small and portable
Disadvantages:
Range accuracy not as good as LR and LT systems
Measurement arms1, 2
1. www.faro.com
2. www.hexagonmi.com
3. Leica Geosystems AG, Heerbrugg, Switzerland,
metrology.leica-geosystems.com

Uses precision stages to move measurement probe
Available in various measurement volumes
Contact and non-contact measurement probes available
Test accuracy as low as sub-micron level
Advantages:
Highly accurate
Many probe options including non-contact types
Disadvantages:
Limited volume
Not portable
“Line of sight” limited
Coordinate Measuring Machines (CMM)
Leitz1 Large Volume CMM
1. www.leitz-metrology.com
Measurements of
JWST primary
mirror segment
features (Tinsley,
Richmond, CA)
Probe tip
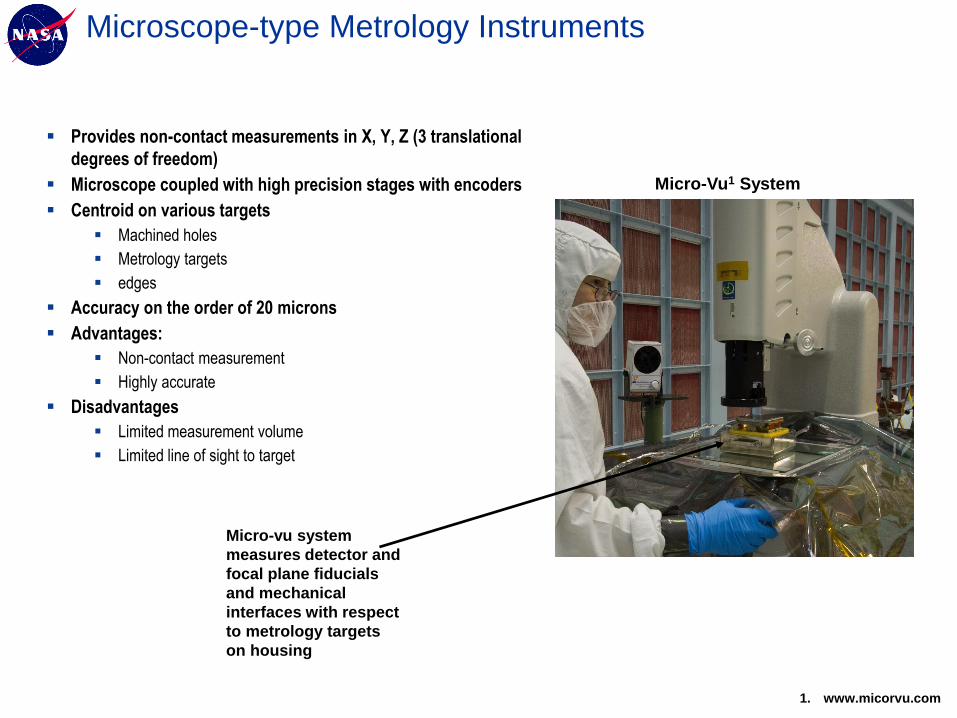
Microscope-type Metrology Instruments
Provides non-contact measurements in X, Y, Z (3 translational
degrees of freedom)
Microscope coupled with high precision stages with encoders
Centroid on various targets
Machined holes
Metrology targets
edges
Accuracy on the order of 20 microns
Advantages:
Non-contact measurement
Highly accurate
Disadvantages
Limited measurement volume
Limited line of sight to target
Micro-Vu1 System
1. www.micorvu.com
Micro-vu system
measures detector and
focal plane fiducials
and mechanical
interfaces with respect
to metrology targets
on housing

Cathetometer
Cathetometer Provides non-contact measurements
Telescope coupled with high precision stages with encoders
XY measurement results (2 degrees of freedom) --- single axis
version is more commonly available
Useful for measuring various types of features such as
pinholes and detectors
Accuracy dependent on stage encoders, target distance and
human eye
Advantages:
Virtually unlimited target types
Disadvantages:
Can suffer from cosine error if not aligned well
Longer setup time. May require theodolites
Not portable
Manual data collection
Measurement area limited to stage travel
Theodolite used to
align the cathetometer
measurement plane to
the target plane via
optical cubes
Cathetometer setup to
measure pinholes,
retroreflectors and flat
mirror center locations on
JWST ground support
equipment

Photogrammetry (“close-range”)
1. Geodetic Systems Inc., Melbourne, Florida
PG targetPG1 camera
SES chamberPG cameras
and boom
ISIM Photogrammetry (PG) is used to measure target positions
Uses specialized cameras which can be mounted or hand-held
Targets measured from many vantage points to determine
location via triangulation; VSTARS1
Its target is a retro-reflective surface with a precision mask
Scale bars or references are required around the test object
Some PG targets can be interchanged with TBs or SMRs
Uncertainty can be as low as ~0.015 mm (1-sigma; highly
dependent on test configuration)
Advantages:
– Insensitive to instabilities like vibration
– Highly flexible non-contact system
– Large volume
– Can be used under extreme conditions with proper setup
Disadvantages:
– Limited to measure PG targets only
– Not able to measure surfaces directly without special software

Produces a spherical wavefront through the system under test
Images the focal point of the return
Used to locate centers of curvature or focal point of optical surfaces
Uses an interchangeble microscope objective at the output of the PSM
Spheres such as TBs or the back surface of an SMR can be used for alignment allowing
easy measurement by LR/LT systems for metrology in the coordinate system
Can be used as a non-contact CMM probe
Can also be used as a portable imaging microscope that can be moved to any size work
piece
Can be used as an electronic autocollimator by removing the microscope objective
Advantages:
Very flexible and easy to align to optic or system
Small, portable easy to mount
Forgiving in angle
Insensitive to vibration
Disadvantages
Needs to be coupled with measurement instrument to get into a CS
Application is highly setup dependent
Point Source Microscope (PSM)1,2
Initial alignment PSM aligned to mirror CoCTB aligned to PSM focus
1. Parks & Borden, “Using the Point Source Microscope (PSM) to find conjugates of parabolic and elliptical off-axis mirrors,” Proc. SPIE 8131 (2011)
2. Parks, Robert E. "Autostigmatic microscope and how it works." Applied optics 54.6 (2015): 1436-1438.

Theodolites
Theodolites
Dot target installed to metrology nest
Theodolites are used to measure angles via auto-collimation
and targets via triangulation
Operated manually
– Angular data is analyzed with GSFC-developed routines
(linear algebra)
– Translational data reduced with commercial packages
Autocollimation: Target is a specular flat mirror (e.g., cube)
Uncertainty ~2 arc-sec (1-sigma) for a single measurements,
~<30 arc-sec (1-sigma) for a collection of measurements
Can be used to measure position via theodolite triangulation
Typical triangulation targets can be scribe, cross hair or
specular tooling ball
Advantages:
Large angular measurement range
Small and portable
High error when observing at high elevation
Disadvantages:
Tough to get into CS
Theodolite triangulation is challenging
Optical alignment cube

“Heritage” Optical Tools
Autocollimators
Used to define fixed line of sight (LOS)
Precise angle measurement
Resolution on the order of 0.01arcseconds
Small angle range on the order of arcminutes
Alignment telescope
Used to define fixed LOS
Some equipped with PIP generator for aligning optics
Some equipped with autocollimators
Allow vertical and horizontal distance measurement
Resolution on the order of 0.0025mm
Range limited to a few millimeters
Tilt level/Jig transit
Tilt level used to define horizontal plane
Measurement range from plane is 2.5mm
Measurement increment is 0.0025mm
Jig transit measures vertical planes
Jig transit has cross telescope to measure perpendicular LOS
Optical plummet
Two small autocollimating telescopes pointed up and down
Used for vertical systems
Useful with aligning elements parallel with gravity
Autocollimator
Tilt level
Jig transit
Optical plummet
Alignment Telescope

Analytical Tools
Measurement data processing
Statistical tools

Analytical tools: Measurement Data Processing Example
GSFC uses Spatial Analyzer1 (SA) software to collect and process data from LT, LR, Total station, Arms and
some theodolite data --- other, similar software packages exist from other vendors to address the same need
– Process scan data to fit to shapes and CAD models
– SA combines results from multiple instruments using USMN2 function
– Can be used to import data from other measurement instruments (Cathetometer, CMM, Arms, etc.)
– Other software packages available with similar capabilities
CMMs and measurement arms data is typical collected using manufacturers software
Theodolite angular data is processed manually using NASA GSFC created macros for Microsoft Excel3, 4
1. New River Kinematics, Inc., Williamsburg, Va.
2. S. Sandwith & R. Predmore, “Real-time 5-micron Uncertainty with Laser Tracking Interferometer
Systems using Weighted Trilateration,” New River Kinematics, Inc. Williamsburg, Va.
3. C. Aviado, J. Gill, K. Redman, and R. Ohl, Methods for correlating autocollimation of theodolites and coordinate
metrology in spacecraft systems, Proc. SPIE 6273, 62733H, 2006
4. W. Eichhorn, “Optical alignment measurements at Goddard Space Flight Center,” Applied Optics 21, 3891, 1982
Processed LR scan
data in SA for one of
the JWST primary
mirror segments
USMN result from ISIM to
OTE alignment check

Statistical Tools
To calculate measurement uncertainties measurements are typically taken in 3 sets (minimum; often 5 or more)
and from multiple stations to help reduce sources of systematic error
Microsoft Excel can be used to calculate Student’s-t1 uncertainties for low sample statistics --- other ways exist
to handle small number statistics
Custom routines can be created using MATLAB2, IDL3, and spreadsheets to calculate uncertainties
– JWST MCTU4 uncertainty propagation routine
– Used to propagate uncertainties throughout JWST databases and to estimate transformation uncertainties
SA USMN5 function calculates measurement uncertainties based on the instruments used
Other metrology software packages available with statistical functions
Custom Excel macros have been created at GSFC to calculate statistics, including student’s-t, for angular
theodolite data
1. J. Hayden et al., “Measurements and Analysis used for the Determination of the James Webb
Space Telescope Integrated Science Instrument Module Vehicle Coordinate System,” Coordinate
Metrology Society Conference, July 2010.
2. www.mathworks.com
3. www.harrisgeospatial.com
4. J. Hayden, M. Khreishi, T. Hadjimichael, and R. Ohl, Monte Carlo Method for Uncertainty
Propagation in JWST Metrology Databases, Coordinate Metrology Systems Conference, 2014.
5. S. Sandwith & R. Predmore, “Real-time 5-micron Uncertainty with Laser Tracking Interferometer Systems using
Weighted Trilateration,” New River Kinematics, Inc. Williamsburg, Va
USMN resulting point
uncertainty clouds
(exaggerated) from SA

Applications
How are these tools used to measure optical surfaces and
systems?
That’s what we really care about!
Some recent examples:
James Webb Space Telescope-ISIM to OTE
OSIRIS-Rex/OVIRS

JWST Observatory Elements and Regions
Integrated Science Instrument Module (ISIM)
- Located inside an OTE provided ISIM Enclosure
- Contains 4 Science Instruments (NIRCam, NIRSpec
MIRI, FGS / TF)
ISIM Electronics
Compartment (IEC)
Spacecraft Bus
-Contains traditional
“ambient” subsystems
Solar Array
Thermal Region 2
- Components maintained at
ambient temperatures on cold
side of the observatory
Thermal Region 1
- Components cooled to
cryogenic temperatures
Thermal Region 3
- Components maintained
at ambient temperatures
Sunshield (SS)
-5 layers to provide thermal
shielding to allow OTE and ISIM
to passively cool to required
cryogenic temperatures
Optical Telescope Element (OTE)
- 6 meter Tri-Mirror Anastigmatic
- 18 Segment Primary Mirror
OTE Backplane
/ ISIM Enclosure
OTE Deployment
Tower
OTE Secondary
Mirror
OTE Primary Mirror

JWST ISIM to PMBSS Integration: Aligning one optical
assembly to another, based on ambient metrology
references with offsets and evaluation via optical analysis In May 2016 the Integrate Science Instrument Module (ISIM)
module was integrated to the Primary Mirror Backplane Support
Structure (PMBSS)
Prior to integration extensive tolerance analyses were performed
to understand 6 DOF alignment sensitivities
ISIM alignment sensitivities were investigated as a function of
Kinematic Mount (KM) strut lengths and spherical end positions
Prior to integration a series of measurements were conducted to
predict the ISIM pose
KM strut length
Spherical seat measurements of ISIM and PMBSS
Metrology target measured on ISIM and PMBSS in separate tests
As-built ISIM performance evaluated --- offsets were not necessary
As-built OTE performance evaluated --- offsets were not necessary
During installation “Transtrack1” was used to ensure hardware safety
Measurement were conducted post-integration of ISIM to the PMBSS
structure
A network of LR systems measured both structures from multiple stations
The predictions and final post-alignment measurements checked that
ISIM-OTE met alignment requirements with margin at ambient1. Hubler, D., et al. "Using Real-Time, 6D Object
Tracking to Assemble Large Aerospace
Components." 2000 CMSC Conference Detroit,
Michigan. 2000.

JWST ISIM to PMBSS Alignment Verification
Multiple LR stations
Multiple LR stations around the PMBSS structure to reduce measurement uncertainties
USMN result showing all LR stations including shot lines to targets
Points on the outside represent scale bar checks
Some stations required the LR to be mounted on its side to allow line of sight to some of
the lower targets

JWST ISIM to PMBSS Alignment Verification
Multiple LR stations
LR was used to scan one of the JWST primary mirror segments
Goal was to:
Measure the mirror edges to help locate the position of the segment during integration to
the backplane
Measure the front surface of the mirror segment
Mirror edge measurement was successful to the requirements due to the laser beam size
Mirror scan of the front surface was successful
LR scan result

Applications: OVIRS instrument development
is an example where metrology is used more
directly for optical surface alignment

OVIRS Overview
OVIRS is a 0.4--4.3μm spectrometer on-board OSIRIS-Rex spacecraft (Origins, Spectral
Interpretation, Resource Identification, Security, Regolith Explorer)
Four key optical performance parameters
Collimation quality (angle of incidence at filter) impacts resolving power
Field of view beam footprint on asteroid
Boresight ensures overlap with other OSIRIS-REx instruments
Effective throughput impacts signal-to-noise ratio
Various measurement instruments were used throughout I&T
Laser radar
Laser Trackers
Theodolites
Interferometer
Microscope Optical CMM

Alignment process
Component level characterization
Primary and secondary mirrors (surface
error, alignment fiducials)
Field stop
Detector assembly
Characterize optical box/bench (“O-box”) to
define coordinate system an measure key
features, like interfaces to the spacecraft and
optical elements
Install and align components to bench based
on fiducials
Test system
System wavefront error at ambient
Optical boresight and ambient (and the
cryogenic operating temperature)
(Science performance at the cryogenic
operating temperature)

Mounting
Holes
Fiducials
Fiducials
X
Y
Z Mounting
Holes
Clocking Flat
Clocking Flat
Component characterization --- OAP Primary and
Secondary Mirrors --- figure, prescription, and fiducials
for six degrees of freedom positioning
Back of mirror is polished to create
a reflective surface. The normal of
the back of the mirror defines the
optical axis.
Manufacturers polished top and bottom clocking
flats to accurately clock the mirror about the
optical axis.

Mirror Characterization Test Setup
Y
Z
Mirror mounted to tip/tilt
and rotation fixture
Interferometer
Transfer cube assembly
LR3
Theodolite
aligned to PM and
Interferometer
LR used to measure
PM focus with respect
to mirror fiducials
from various stations
TB aligned to focus of PM

Mirror Characterization Test Setup
TheodoliteLaser
Radar
Interferometer
Mirror and
tip/tilt mount
Fold mirror for
clocking fiducial
measurement

Detector Characterization
• Detector opening measured with respect to metrology nest targets
• Micro-Vu microscope (“optical CMM”) was used to characterize the detector assembly prior to installation
LR Tooling balls
installed into the
metrology nests
and measured via
LR to place
detector assembly
Filter opening
measured with
respect to
metrology nests

Optical Bench (O-Box) Calibration
LR Scanned Mirror
mounting surfaces
Measured O-box
nests using LR
tooling ball mode
Measured O-box
optical cubes using
theodolites
LR Scanned Openings
LR Scanned mirror
alignment holes

OVIRS Coordinate System Definition
X
Y Z
OB metrology targets define the CS of the optical box
OC cubes are used as a reference to the boresight

Primary Mirror Alignment to Optical Box
Interferometer
Surrogate FS returns interferometer back through the PM
Optical box
PM installed
LR Tooling balls
Spherical Al coated lens
Surrogate Field stop

Secondary Mirror Alignment to the Optical Box
Interferometer
Large Flat mirror returns interferometer beam through the system.
Optical boxThe mirror is oversized
such that the interferometer can see a direct return
Surrogate FS replaced with the flight FS
Theodolite setup on the PM rear surface
Theodolite setup on the SM rear surface
Theodolites measure Obox cube with respect to the interferometer output to determine the ambient boresight

System wavefront error and boresight
• Ambient boresight measured using
theodolites in interferometer test setup
• Cryogenic boresight measured in thermal
vacuum chamber after installation of the
detector
• Measurements of OVIRS and optical
calibration GSE (optical cubes) were
made in the test chamber
• A small laser tracker was used due to
space and stability constraints
• A “Direct and Through” technique was
also used to measure one of the cube
surfaces
• A network of tie points was mounted
throughout the chamber to tie in all of the
measurements
Calibration GSE
OVIRS

Conclusions
Discussed some basic tools for measuring and aligning an optical system or instrument
Large-volume metrology tools such as LR and LT can also be useful for small-scale optical
alignment
Metrology tools, references, techniques, and data reduction algorithms must be
considered early during the planning phase of the development of an optical instrument or
telescope or precision assembly
Optical alignment is a broad subject, but we hope that this paper has added to the reader’s
toolbox a few ideas and techniques

Questions?
Thank you for your attention.
Phillip Coulter
Optics Branch
NASA Goddard Space Flight Center
Greenbelt, Maryland
tel. 301 286 9527

Acknowledgements
The author gratefully acknowledges the
collective contributions of the
Engineers working on JWST and
OSIRIS-REx and OVIRS.
This work is supported by the James
Webb Space Telescope project at NASA
Goddard Space Flight Center.

L
R
LR Reference
targets (spheres)
shown for
illustrative purpose
Active
detector
surface
LR
beam
Detector
housing
Process:
1. Laser radar (LR) measures the spherical reference
targets
2. LR beam is pointed and focused at a location on the
detectors active pixel area
3. A surface point measurement is made using the LR of
beam location on the detector surface
4. The detector captures an image of the incident beam
on the detector
5. Steps 1 through 4 are repeated while pointing the LR at
several locations on the detectors active surface area.
A minimum of 3 locations should be measured
6. The captured images are analyzed for the center of the
beam at each location. The data is combined with the
LR measurements. With multiple spots measured
other pixel locations can be interpolated from the data
Detector
Side View
Front view of the detector active area.
Typical LR measurement spots are
shown as circles.
Once the process below is complete the
active area of the detector can be
placed/aligned quickly into a system
using the LR reference targets. Also any
pixels position can be known via the LR
reference targets and the results below
CCD Mapping Using a Laser Radar

A Toolbox of Metrology-based
Techniques for Optical System
Alignment
SPIE Optics & Photonics
San Diego, CA
August 28, 2016
41
Phillip Coulter (GSFC), Peter N. Blake (GSFC), Brent J. Bos (GSFC), Gordon V. Casto (GSFC), William L.
Eichhorn (GESI), Jeffrey S. Gum (GSFC), Theodore J. Hadjimichael (GSFC), John G. Hagopian (JHEL),
Joseph E. Hayden (SSC), Samantha L. Hicks (GSFC), Dave Kubalak (GSFC), Kyle F. Mclean (PEMSL),
Joseph McMann (SLI), Raymond G. Ohl (GSFC), Kevin Redman (SLI), Greg Wenzel (SLI), Jerrod Young
(GSFC)

A Toolbox of Metrology-based
Techniques for Optical System
Alignment
SPIE Optics & Photonics
San Diego, CA
August 28, 2016
42
Phillip Coulter (GSFC), Peter N. Blake (GSFC), Brent J. Bos (GSFC), Gordon V. Casto (GSFC),
William L. Eichhorn (GESI), Jeffrey S. Gum (GSFC), Theodore J. Hadjimichael (GSFC), John G.
Hagopian (JHEL), Joseph E. Hayden (SSC), Samantha L. Hicks (GSFC), Dave Kubalak (GSFC),
Kyle F. Mclean (PEMSL), Joseph McMann (SLI), Raymond G. Ohl (GSFC), Kevin Redman (SLI),
Greg Wenzel (SLI), Jerrod Young (GSFC)