A Telemonitoring Solution to Long-Distance Running Coaching
36
A Telemonitoring Solution to Long-Distance Running Coaching Uma Balakrishnan Hannah Sarver Lucas Serven Eugene Song Electrical Engineering and Computer Sciences University of California at Berkeley Technical Report No. UCB/EECS-2016-107 http://www.eecs.berkeley.edu/Pubs/TechRpts/2016/EECS-2016-107.html May 14, 2016
Transcript of A Telemonitoring Solution to Long-Distance Running Coaching

A Telemonitoring Solution to Long-Distance Running
Coaching
Uma BalakrishnanHannah SarverLucas ServenEugene Song
Electrical Engineering and Computer SciencesUniversity of California at Berkeley
Technical Report No. UCB/EECS-2016-107
http://www.eecs.berkeley.edu/Pubs/TechRpts/2016/EECS-2016-107.html
May 14, 2016

Copyright © 2016, by the author(s).All rights reserved.
Permission to make digital or hard copies of all or part of this work forpersonal or classroom use is granted without fee provided that copies arenot made or distributed for profit or commercial advantage and that copiesbear this notice and the full citation on the first page. To copy otherwise, torepublish, to post on servers or to redistribute to lists, requires prior specificpermission.
Acknowledgement
Daniel Aranki, University of California, BerkeleyProfessor Ruzena Bajcsy, University of California, BerkeleyProfessor Ali Javey, University of California, BerkeleyDr David Liebovitz, MD, University of Chicago Medicine

A Telemonitoring Solution to Long-Distance Running Coaching
Master of Engineering Capstone Report 2016
Carlos Asuncion
with Eugene Song, Hannah Sarver, Lucas Serven, and Uma Balakrishnan
Prepared for Professors Ruzena Bajcsy and Ali Javey
Contents
Introduction 2
1 Individual Technical Contributions 6
1.1 Cadence Estimation . . . . . . . . . . . . . . . . . . . . . . . . . . . . . . . . 6
1.1.1 Problem Definition . . . . . . . . . . . . . . . . . . . . . . . . . . . . 6
1.1.2 Literature Review . . . . . . . . . . . . . . . . . . . . . . . . . . . . . 7
1.1.3 Methods . . . . . . . . . . . . . . . . . . . . . . . . . . . . . . . . . . 11
1.1.4 Experimentation and Validation . . . . . . . . . . . . . . . . . . . . . 20
1.1.5 Future Work . . . . . . . . . . . . . . . . . . . . . . . . . . . . . . . . 21
1.2 RunCoach . . . . . . . . . . . . . . . . . . . . . . . . . . . . . . . . . . . . . 22
1.2.1 Overview of RunCoach Application. . . . . . . . . . . . . . . . . . . . 22
1.2.2 Contribution to RunCoach application . . . . . . . . . . . . . . . . . 24
2 Engineering Leadership 26
2.1 Industry and Market Analysis Overview . . . . . . . . . . . . . . . . . . . . 26
2.2 Market Analysis . . . . . . . . . . . . . . . . . . . . . . . . . . . . . . . . . . 26
2.3 Porter’s Five Forces Analysis . . . . . . . . . . . . . . . . . . . . . . . . . . . 27
2.3.1 Bargaining Power of Buyers . . . . . . . . . . . . . . . . . . . . . . . 27
2.3.2 Bargaining Power of Suppliers . . . . . . . . . . . . . . . . . . . . . . 27
2.3.3 Threat of New Entrants . . . . . . . . . . . . . . . . . . . . . . . . . 27
2.3.4 Threat of Substitutes . . . . . . . . . . . . . . . . . . . . . . . . . . . 28
1

2.3.5 Rivalry Amongst Existing Competitors . . . . . . . . . . . . . . . . . 28
2.4 Technology Strategy . . . . . . . . . . . . . . . . . . . . . . . . . . . . . . . 30
2
Introduction
Our capstone team is contributing to the existing Berkeley Telemonitoring Project which is
led by PhD candidate, Daniel Aranki, advised by Dr. Ruzena Bajcsy, at UC Berkeley. The
goal of the Berkeley Telemonitoring Project is to provide a robust framework for doctors or
researchers to build secure telemonitoring applications. The goal is for this framework to be
as close to “plug and play”, meaning that the application builder needs only basic program-
ming knowledge to combine building blocks provided to implement their own telemonitoring
application [1].
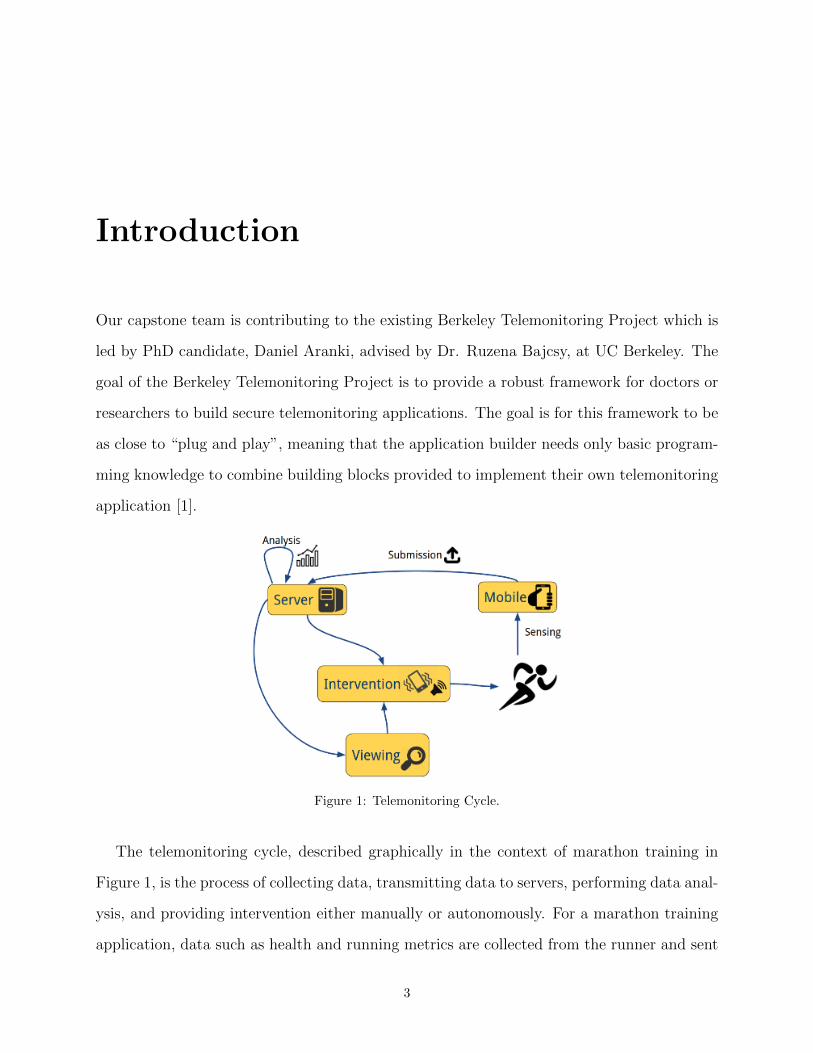
Figure 1: Telemonitoring Cycle.
The telemonitoring cycle, described graphically in the context of marathon training in
Figure 1, is the process of collecting data, transmitting data to servers, performing data anal-
ysis, and providing intervention either manually or autonomously. For a marathon training
application, data such as health and running metrics are collected from the runner and sent
3

to a remote server for analysis to produce a measure of athletic performance. Intervention to
the runner to improve performance can be done automatically with haptic feedback through
vibration or selection of music to encourage set cadence target or manually by coach who is
analyzing the collected data for a more personalized training routine.
The telemonitoring framework consist of a library of components which can be sourced
to produce a customized telemonitoring application including server side analysis tools and
client application on a mobile device[1]. Our contributions are to expand this library to add
functionality on both the server and the client. The server development consists of imple-
menting data analysis tools such as, least square regression, K-means clustering, and support
vector machines. The client development consists of adding data collection capabilities using
built-in sensors and external devices.
In order to further develop the current framework, we aim to develop our own application
for the propose of marathon training with the advice of David Liebowitz, M.D. of The
University of Chicago Medicine, who is interested in models of athletic performance with
respect of marathon training. This application will collect running metrics, e.g. cadence
and speed, and health metrics, e.g. heart rate, heart rate variability, and body temperature.
With this data we will build a model of performance and provide feedback to the runner for
improving performance, in the form of audio cues and vibration during activity.
Figure 2: Work breakdown for capstone team.
4
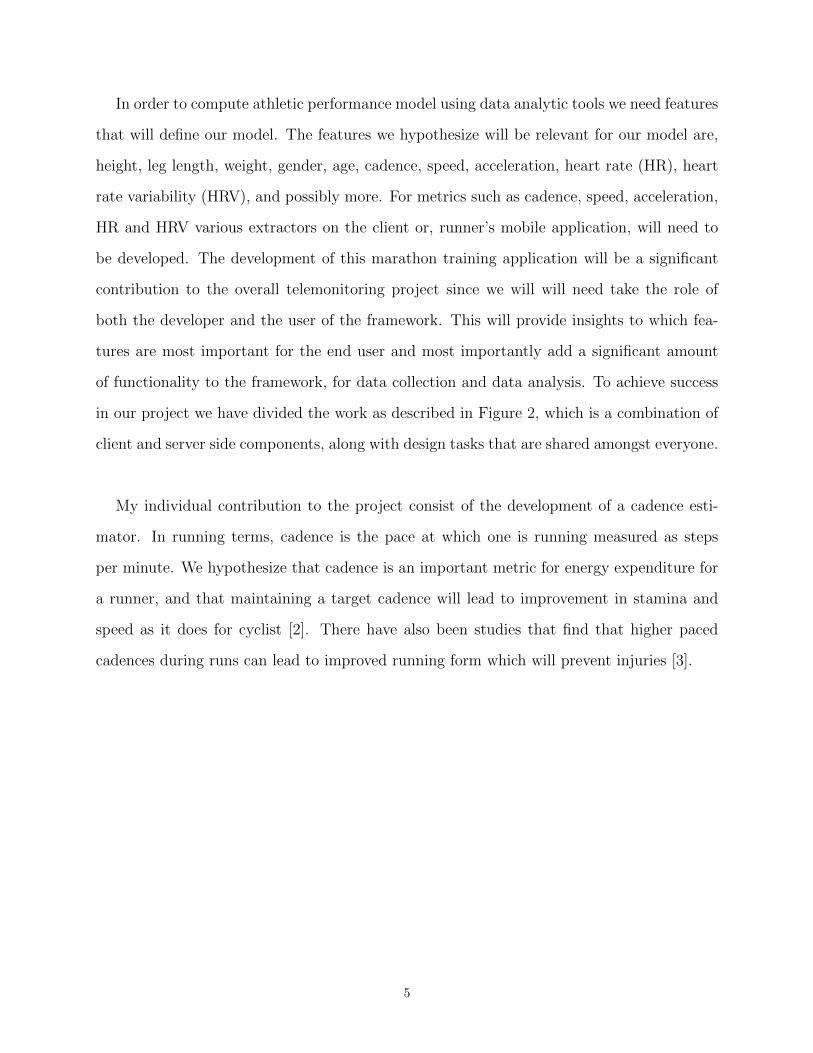
In order to compute athletic performance model using data analytic tools we need features
that will define our model. The features we hypothesize will be relevant for our model are,
height, leg length, weight, gender, age, cadence, speed, acceleration, heart rate (HR), heart
rate variability (HRV), and possibly more. For metrics such as cadence, speed, acceleration,
HR and HRV various extractors on the client or, runner’s mobile application, will need to
be developed. The development of this marathon training application will be a significant
contribution to the overall telemonitoring project since we will will need take the role of
both the developer and the user of the framework. This will provide insights to which fea-
tures are most important for the end user and most importantly add a significant amount
of functionality to the framework, for data collection and data analysis. To achieve success
in our project we have divided the work as described in Figure 2, which is a combination of
client and server side components, along with design tasks that are shared amongst everyone.
My individual contribution to the project consist of the development of a cadence esti-
mator. In running terms, cadence is the pace at which one is running measured as steps
per minute. We hypothesize that cadence is an important metric for energy expenditure for
a runner, and that maintaining a target cadence will lead to improvement in stamina and
speed as it does for cyclist [2]. There have also been studies that find that higher paced
cadences during runs can lead to improved running form which will prevent injuries [3].
5

Chapter 1
Individual Technical Contributions
As described in the Introduction section our project team will be developing a telemoni-
toring solution for long distance running coaching. My individual technical contributions
consist of design and implementation of a cadence estimator for the Berkeley Telemonitoring
framework, as well as implementation of some of the components for our marathon coaching
application, RunCoach.
1.1 Cadence Estimation
1.1.1 Problem Definition
While there are many existing commercial solutions to measuring the cadence of a runner,
either through an external device or an application using built in sensors of a smartphone,
while some of these solutions provide an interface to access cadence data for further anal-
ysis, they are in the form of web-based application program interface (API). Furthermore,
techniques used in existing solutions cadence estimations are not public information and
therefore, verification for accuracy would be fairly involved. For these reasons there is a
need for the development of a cadence estimator, which utilizes verifiable algorithms pre-
sented in academic work, for our RunCoach application. The method of cadence estimation
will maximize utilization of sensors built-in to smart phone, staying true to the theme of
the framework, and also be independent of phone orientation and not heavily constrained
6

by phones placement on body. Accelerometers measure, as their names suggest, acceleration
and have become a common sensor on smartphones. For this implementation of cadence
estimation we will assume the use of built-in accelerometers and sensor interface provided
by Android API, which is not assumed to have a uniform sampling rate [4, 5].
1.1.2 Literature Review
While the extraction of cadence from accelerometer data is not directly a studied problem,
a related problem has been explored with existing solutions, step detection. Step detection
from accelerometer data will provide us with an estimate of cadence with the frequency of
the detected steps. As mentioned step detection from accelerometer data is a studied prob-
lem with a few categories of approaches such as: peak detection, which associates steps with
peaks in the accelerometer signal [6]; threshold crossing or zero crossing, which detects a
step when the accelerometer signal crosses a threshold [7, 8]; and flat zone detection, which
considers a step to be in flat zone of the signal from an accelerometer place on the foot [9].
For our marathon training application the runner will have the smartphone in the his or
her pocket during the collect of data, and because the built in accelerometer will be utilized
for cadence estimation the exact position and orientation of smartphone and accelerometer
is not guaranteed and is subject to change during runner’s activity. This means that the
algorithm used to detect steps must be independent of orientation and exact placement of
the smartphone.
The step counting algorithm presented by Mladenov is a very promising approach for our
purposes, the algorithm is a simple peak detection process,which considers peaks above a
dynamic threshold to be steps. Also, while accelerometer on phones produce 3-D information
of accelerationthis algorithm utilizes the magnitude of the acceleration vector, meaning that
is independent of orientation and is also independent of the placement of the accelerometer
on the person [6]. This algorithm does assume that accelerometer data is sampled at a fixed
7

rate, in particular 50Hz sampling rate.
Another simple approach to step detection is a zero-crossing algorithm. This algorithm
also has a preprocessing step which consist of signal smoothing in which the values of the
of a sliding window are summed, and smoothed signal is then differentiated in an attempt
to remove error sources. The zero-crossing, or the point at which the signal crosses zero
in a positive direction, is detected in this smoothed and differentiated signal. This imple-
mentation also considers the magnitude of the acceleration vector making it independent of
orientation. The signal is then iterated through considering zero crossings of positive slope
as detected steps [8].
1.1.2.1 Chosen Step Detection Algorithm
The most promising algorithm explored is the one described by Mladenov in [6]. The first
step in this algorithm is preprocessing of the accelerometer signal to remove noise, before
detection of peaks in order to extract useful peaks from raw acceleration data. The pre-
processing consist of filtering data with a 20th order low-pass butterworth filter with cutoff
frequency at 5Hz which was found experimentally to contain walking and running informa-
tion. With a cutoff frequency of 5Hz, steps should be detectable up to 300 steps per minute
(SPM). The next step in the algorithm is to buffer acceleration values to iterate over, the
implementation in [6] has a buffer size of 100.
8
1 procedure calculatePeakMean(buffer)
2 peakCount ← 0
3 peakAccumulate ← 0
4 for (k = 1, k++, while k<length(buffer)−1) do
5 forwardSlope ← buffer[k+1] − buffer[k]
6 backwardSlope ← buffer[k] − buffer[k−1]
7 if forwadSlope < 0 AND backwardSlope > 0 then
8 peakAccumulate ← peakAccumulate + buffer[k]
9 peakCount ← peakCount +1
10 end if
11 end for
12 peakMean ← peakAccumulate/peakCount
13 return peakMean
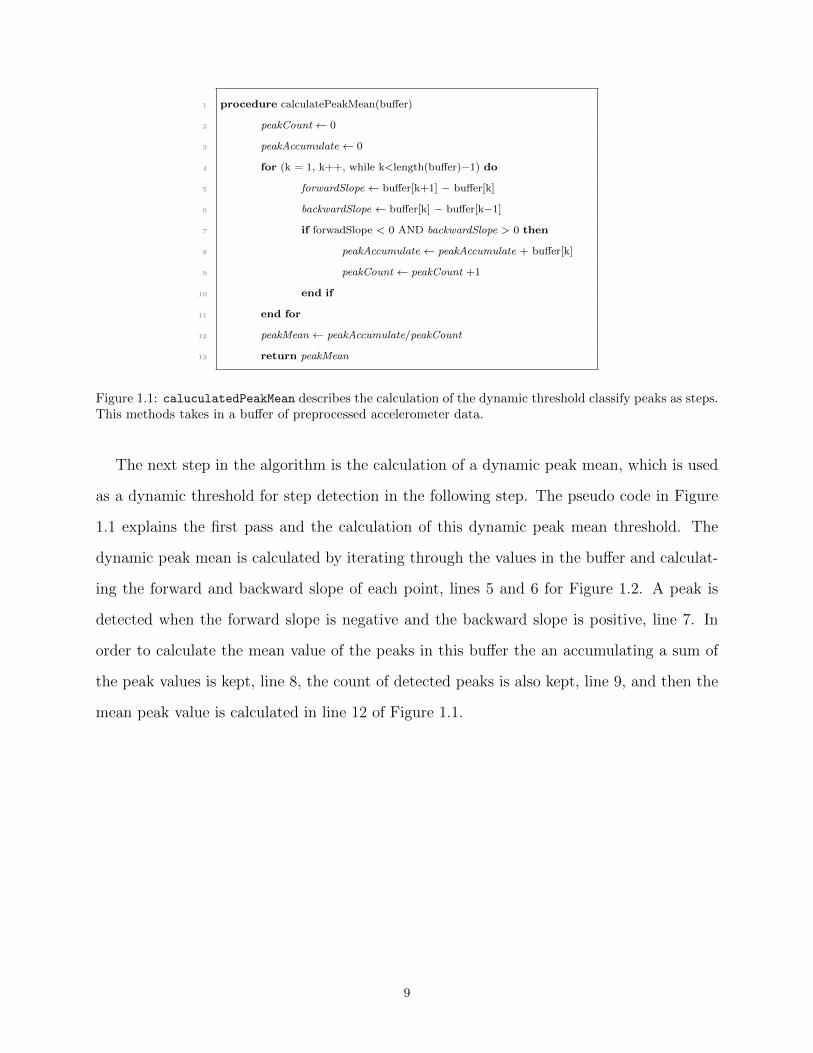
Figure 1.1: caluculatedPeakMean describes the calculation of the dynamic threshold classify peaks as steps.This methods takes in a buffer of preprocessed accelerometer data.
The next step in the algorithm is the calculation of a dynamic peak mean, which is used
as a dynamic threshold for step detection in the following step. The pseudo code in Figure
1.1 explains the first pass and the calculation of this dynamic peak mean threshold. The
dynamic peak mean is calculated by iterating through the values in the buffer and calculat-
ing the forward and backward slope of each point, lines 5 and 6 for Figure 1.2. A peak is
detected when the forward slope is negative and the backward slope is positive, line 7. In
order to calculate the mean value of the peaks in this buffer the an accumulating a sum of
the peak values is kept, line 8, the count of detected peaks is also kept, line 9, and then the
mean peak value is calculated in line 12 of Figure 1.1.
9
1 procedure countSteps(buffer, peakMean)
2 stepCount ← 0
3 for all a[k] in the buffer do
4 forwardSlope ← a[k+1] − a[k]
5 backwardSlope ← a[k] − a[k−1]
6 if forwardSlope < 0 AND backwardSlope > 0 AND a[k] >
C∗peakMean AND a[k] > K then
7 stepCount ← stepCount +1
8 end if
9 end for
10 return stepCount
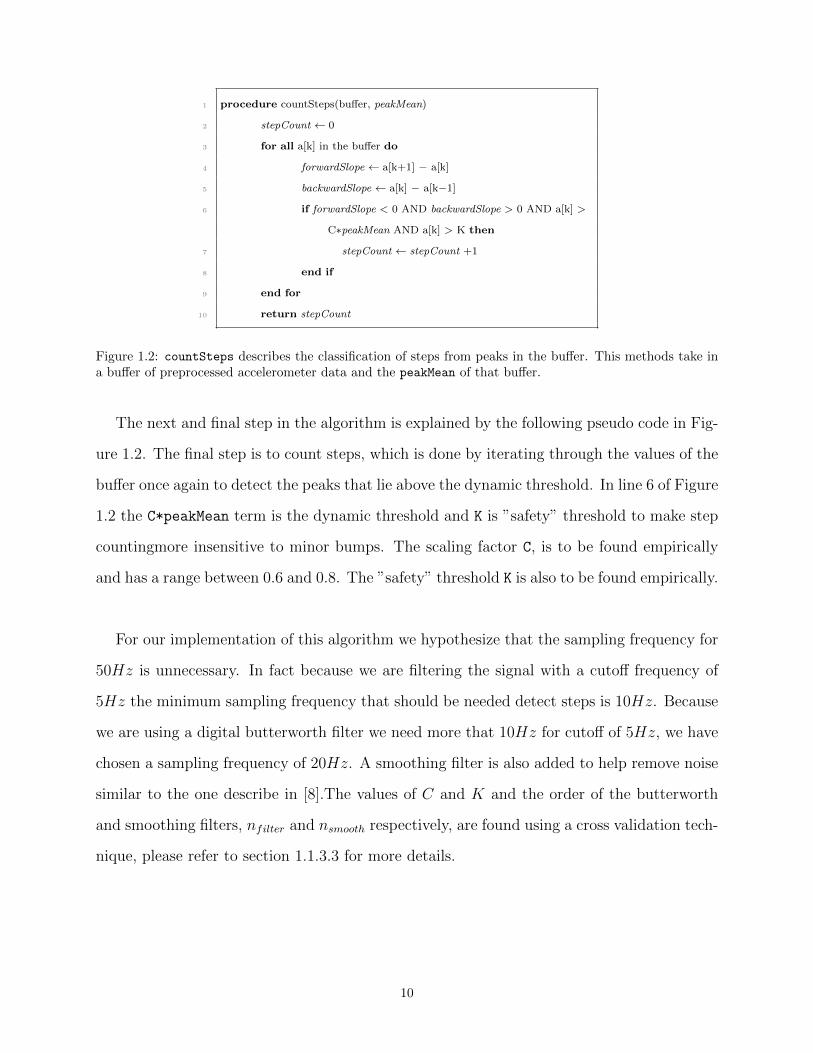
Figure 1.2: countSteps describes the classification of steps from peaks in the buffer. This methods take ina buffer of preprocessed accelerometer data and the peakMean of that buffer.
The next and final step in the algorithm is explained by the following pseudo code in Fig-
ure 1.2. The final step is to count steps, which is done by iterating through the values of the
buffer once again to detect the peaks that lie above the dynamic threshold. In line 6 of Figure
1.2 the C*peakMean term is the dynamic threshold and K is ”safety” threshold to make step
countingmore insensitive to minor bumps. The scaling factor C, is to be found empirically
and has a range between 0.6 and 0.8. The ”safety” threshold K is also to be found empirically.
For our implementation of this algorithm we hypothesize that the sampling frequency for
50Hz is unnecessary. In fact because we are filtering the signal with a cutoff frequency of
5Hz the minimum sampling frequency that should be needed detect steps is 10Hz. Because
we are using a digital butterworth filter we need more that 10Hz for cutoff of 5Hz, we have
chosen a sampling frequency of 20Hz. A smoothing filter is also added to help remove noise
similar to the one describe in [8].The values of C and K and the order of the butterworth
and smoothing filters, nfilter and nsmooth respectively, are found using a cross validation tech-
nique, please refer to section 1.1.3.3 for more details.
10
1.1.3 Methods
1.1.3.1 Approach
While there exist methods for step detection from accelerometer signals, such as the ones
presented, they assume a uniform sampling frequency. A uniform sampling rate is impor-
tant for preprocessing steps like filtering, smoothing, or differentiating to be achievable. This
means that there is design work to be done, and will not simply be a simple implementation
of an already explored algorithm, because as previously mentioned the accelerator interface
in the Android API does not guarantee a uniform sampling rate[4]. While a simple solution
would be to simply resample the signal the proceed as normal, this would not suit our needs
as we require cadence estimates during the run for feedback to runner. To mediate this
problem of non-uniform sampling rate, the proposed solution is to buffer a section of the
accelerometer data, and preform preprocessing steps and step detection on the buffered data.
In order to approach the design of a ”real time” cadence estimator based on previously
explored step detection methods a clear road map was drafted to identify the components
needed for ”real time” implementation. The road map consist of three major stages (1)
MATLAB implementation, (2) Java translation of MATLAB version, and (3) Framework
integration. The problem is first explored in MATLAB because it lends itself nicely to
numerical calculations and its simplicity allows for focus on algorithm design. During the
MATLAB phase of the cadence estimator design, the focus was on a buffering technique
to resample, filter and smooth the non-uniform acceleration signal for step detection. The
values of C, K, nfilter, and nsmooth are also explored using cross validation techniques, dur-
ing the MATLAB design phase. An intermediate Java implementation independent of the
telemonitoring framework will help separate the problems with translating to Java and the
problems of implementation specifics for Android version when integrating into the frame-
work. The final step is to integrate to telemonitoring framework as a Data Extractor for use
in performance prediction [1].
11

1.1.3.2 Data Collection Methods
In this section, the methods that were utilized in the collection of data are described. There
were two phases of data collection, for the design of the buffering method, and for the vali-
dation of the framework integrated cadence estimator. In the first phase, raw accelerometer
data and step times are collected while a person is walking. Using a simple accelerometer
logger application, raw accelerometer data is logged with the phone in the person’s pocket,
and using a separate phone the time of every fifth step is logged. The data set collected con-
sist of accelerometer data with different cadences, varying placement of pants/shorts pocket
and jacket pocket, from both genders, and for varying distances. During the second phase
of data collection, the cadence estimates from the cadence estimator are logged along with
the raw accelerometer data during the run.
The data which was collected for the first phase or the design phase was split into two
independent subsets. The first subset is to be used for parameter evaluation, as described
in section 1.1.3.3, called training set, and the second set is to be used for validation for the
found parameters and for comparison of the original and the modified algorithm which is
explored in section 1.1.3.4.
1.1.3.3 Parameter Evaluation Method
In order to fit the parameters of the algorithm, C, K, nfilter, and nsmooth, we perform an
exhaustive search for the optimal parameter values according to a random subset, the train-
ing set, of the collected accelerometer and actual step time data. The optimal parameter
values are those which produce the smallest average root mean square error of the detected
steps and the actual steps for the training data set. The validity of these found parameter
values are tested by calculating the average root mean squared error between actual steps
and detected steps for the algorithm using the values found to be optimal, for the validation
12

set.
Figure 1.3: The results of step detection algorithm with optimal parameters from training set on data fromvalidation set.
For the chosen algorithm the optimal parameter values with for out training set are found
to be nfilter = 1, nsmooth = 5, C = 0.6, K = 11. These optimal values produce an average
error of 1.14 steps between the actual and detected steps for the training set. For the valida-
tion set these parameters produce an average error of 1.5 steps, because the training data set
contains acceleromter data with actual steps ranging from 60-160 and average of 1.5 missed
steps means a range of 2.5% − 0.9% error which is negligible for cadence estimation. The
plot in Figure 1.3 shows the results of running the step detection algorithm with the found
parameters on a data from the validation set, there are 70 actual steps with 68 steps detected.
The method which has been described in this section is known as cross validation. The
purpose of leaving out a validation set is to avoid over fitting the parameters to the training
data set. If the optimizing parameters correctly detects steps from data not used for training
then these values are considered generally optimizing and do not over fit to the training data.
13

1.1.3.4 Buffer Design in MATLAB
Figure 1.4: The flow of cadence estimation from accelerometer data.
As mentioned in at the beginning of this section the bulk of the design process was explored
in MATLAB, the proposed solution that will be presented in this section is based on the
algorithm described in [6]. The basic flow of the proposed solution to an ”real time” version
of cadence estimation is depicted in Figure 1.4. First the non-uniform acceleration data
from phone is pushed to buffer as they are recieved by the accelerometer interface. The
buffered data is then resampled and preprocessed, which consists of filtering and smoothing
similar one to the ones described in [6] and [8]. The step counting algorithm discussed in
[6] is performed on the preprocessed signal. The buffer is then flushed and the processes is
repeated while the cadence estimator is running.
Figure 1.5: Naive implementation of buffer for modified algorithm.
The biggest considerations for the design of the step detecting process describe in Figure
14
1.4, are ensuring no discontinuity in time and minimizing jumps in the preprocessed accel-
eration signal. If these two considerations are taken, then the resulting signal should be a
good approximation to resampling the entire signal and preprocessing it for step detecting.
The first explored solution is to buffer samples of the acceleration signal, then resample and
preprocess the signal for step counting. This naive approach does not produce good results
due to the phase delay associated with the preprocessing steps of filtering and smoothing the
buffer signal sections, which renders first couple of samples useless for analysis as shown in
Figure 1.5. In Figure 1.5 three consecutive buffers were resampled, filtered, smoothed and
plotted, it is clear that ‘ramp up’ due to the phase lag could lead to missed peaks and thus
missed steps. The resulting preprocessed acceleration signal will also contain discontinuities
in time because this buffering and resampling technique does not keep track of the end of
the previous buffering window of time.
A solution to the problem of ‘ramp up’ is to have overlapping buffer windows for re-
sampling and preprocessing and only consider samples after the ‘ramp up’ portion for step
counting. In Figure 1.6, overlapping resampled and preprocessed buffered windows are plot-
ted to test the prospects of this proposed solution. Stitching together the middle section of
each overlapping window creates a signal which is smooth, with minor jumps in the prepro-
cessed acceleration signal, this signal is shown in Figure 1.7.
15
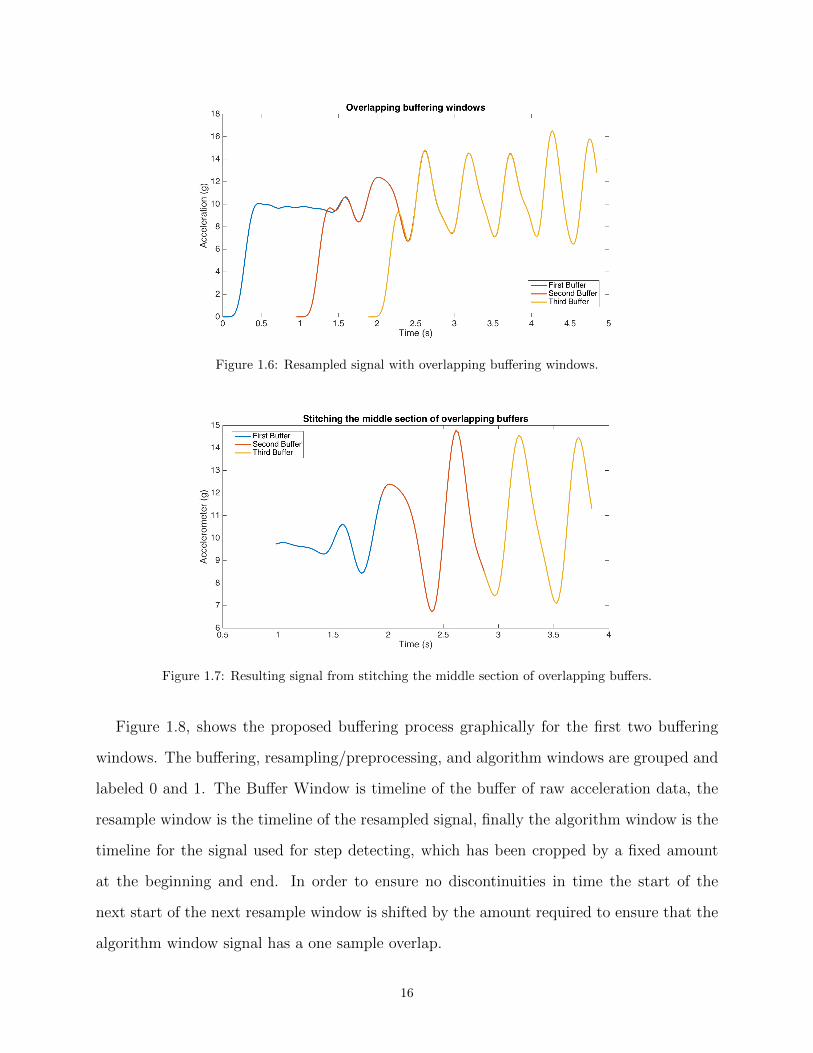
Figure 1.6: Resampled signal with overlapping buffering windows.
Figure 1.7: Resulting signal from stitching the middle section of overlapping buffers.
Figure 1.8, shows the proposed buffering process graphically for the first two buffering
windows. The buffering, resampling/preprocessing, and algorithm windows are grouped and
labeled 0 and 1. The Buffer Window is timeline of the buffer of raw acceleration data, the
resample window is the timeline of the resampled signal, finally the algorithm window is the
timeline for the signal used for step detecting, which has been cropped by a fixed amount
at the beginning and end. In order to ensure no discontinuities in time the start of the
next start of the next resample window is shifted by the amount required to ensure that the
algorithm window signal has a one sample overlap.
16

Figure 1.8: Overlapping buffer windows.
The only fixed length in the graphic in Figure 1.8 is the amount to be clipped from the
resample window to produce the alogorithm window. The timespan of the buffered data will
dictate the timespan for the resample window and the algorithm window. This was done
in the interest of modularity, in order to be able to utilize this process for implementations
which the processing of the buffered data is periodic at configurable period. A dynamic
window sizes means a clever method of calculating the required start time for the resample
window is needed. Looking back at Figure 1.8, the shift necessary to ensure no discontinuity
in time is exactly the time span of the inner algorithm window. The amount of data to
be cropped from the beginning and end of the resample window to produce the algorithm
window is constant and is set at one second. If the timespan of the resample window is
known then the time span of the Algorithm Window is also known.
ts =b(Tb − (tr,0 − tb,0))fsc
fs− 2 (1.1)
Equation 1.1 describes the shift,ts, added to start of the resampled window that will en-
sure no discontinuities in time. Tb is the time span of the buffer window, tr,0 is the starting
time of the current resamplw window, tb,e is the current starting time for the buffer window
17

and fs is the desired sampling frequency. (tr,0 − tb,0) gives the offset between of the of the
start of the buffer window and the resample window. Subtracting this offset from the times-
pan of the buffer,(Tb− (tr,0− tb,0)), gives the timespan from the start of the resample window
and the end of the buffer. Because the signal will be resampled starting from the specified
start to as much as the buffered data will allow, the samples in the resample window can
be found by flooring the product of the timespan resulting the the subtraction described
and the sampling frequency. Multiplying the number of samples in the resample window by
the sampling frequency produces the timespan of the resample window, subtracting by the
amount to be cropped results in the timespan of the algorithm window.
1.1.3.5 Evaluation of Buffer Design
Using the same data set that was used to evaluate the parameters of the chosen algorithm
the parameters of the proposed revised algorithm, with buffering, are explored utilizing the
same cross validation method described in section 1.1.3.3. For the proposed revision of the
algorithm the optimal parameter values are nfilter = 3, nsmooth = 5, C = 0.6, K = 11 which
yields an average error 1.36 between actual steps and detected steps for the training set and
an error of 0.75 for the validation set, which actually performs better than the unmodified
version.
Figure 1.9: Results from the revised version of the step detection algorithm.
18
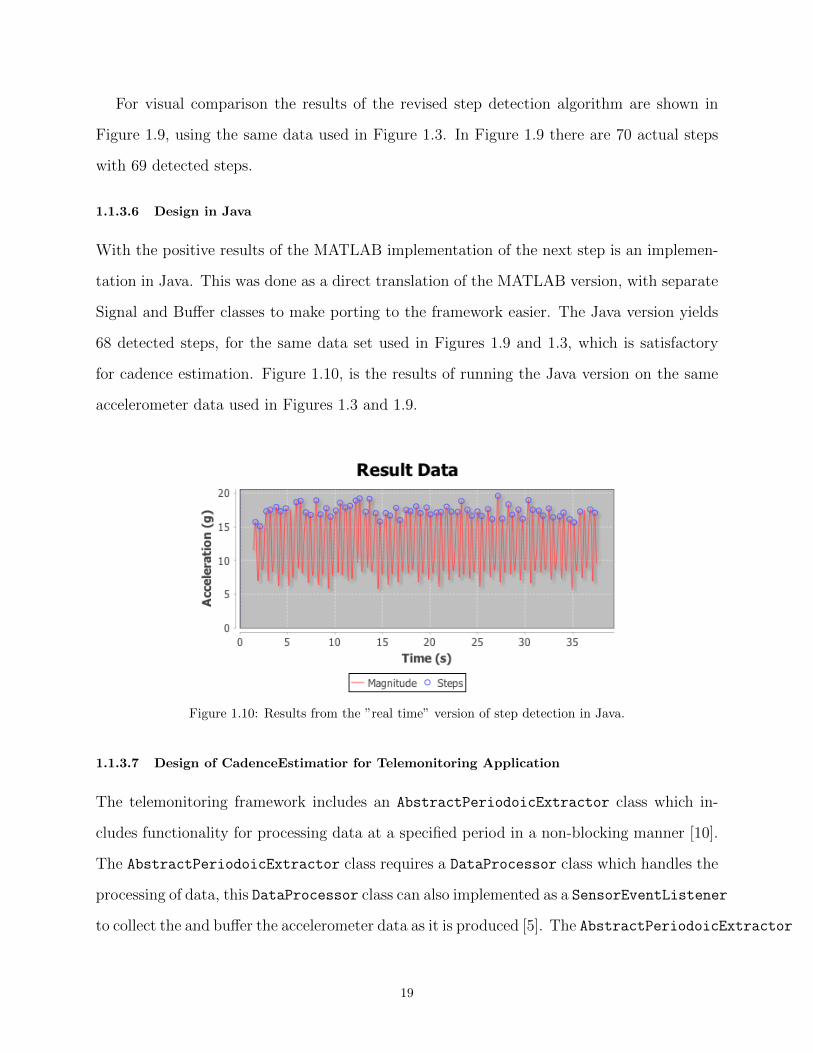
For visual comparison the results of the revised step detection algorithm are shown in
Figure 1.9, using the same data used in Figure 1.3. In Figure 1.9 there are 70 actual steps
with 69 detected steps.
1.1.3.6 Design in Java
With the positive results of the MATLAB implementation of the next step is an implemen-
tation in Java. This was done as a direct translation of the MATLAB version, with separate
Signal and Buffer classes to make porting to the framework easier. The Java version yields
68 detected steps, for the same data set used in Figures 1.9 and 1.3, which is satisfactory
for cadence estimation. Figure 1.10, is the results of running the Java version on the same
accelerometer data used in Figures 1.3 and 1.9.
Figure 1.10: Results from the ”real time” version of step detection in Java.
1.1.3.7 Design of CadenceEstimatior for Telemonitoring Application
The telemonitoring framework includes an AbstractPeriodoicExtractor class which in-
cludes functionality for processing data at a specified period in a non-blocking manner [10].
The AbstractPeriodoicExtractor class requires a DataProcessor class which handles the
processing of data, this DataProcessor class can also implemented as a SensorEventListener
to collect the and buffer the accelerometer data as it is produced [5]. The AbstractPeriodoicExtractor
19
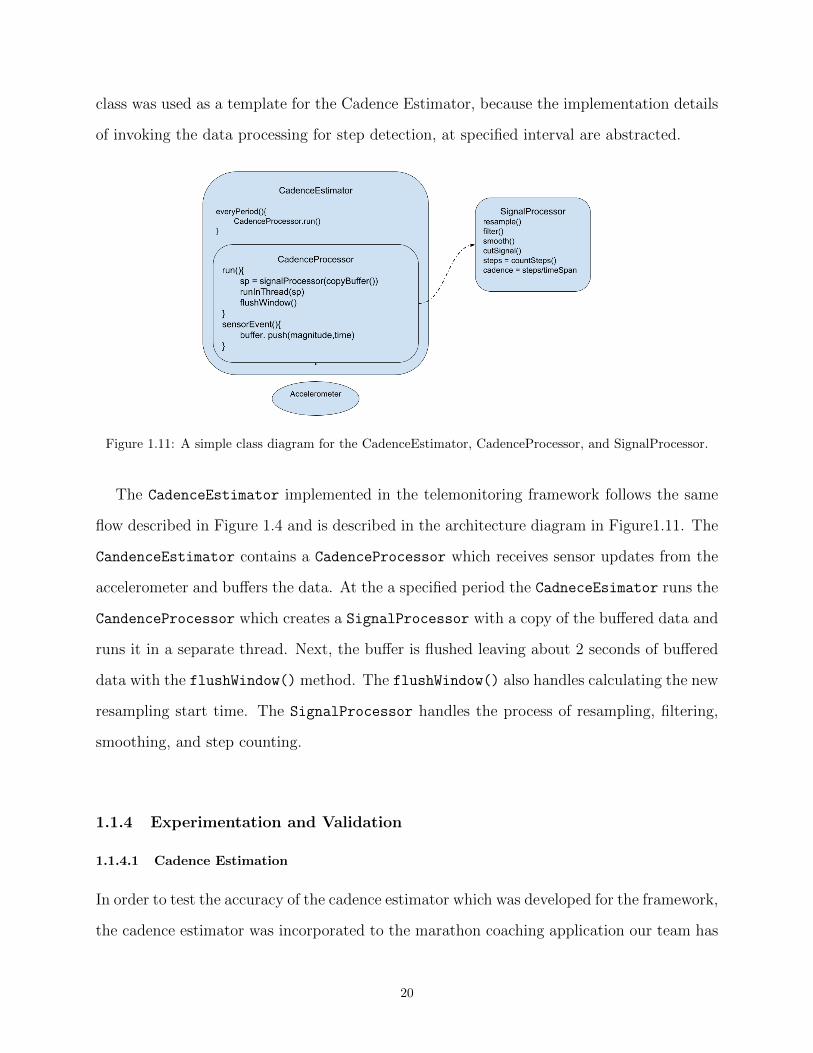
class was used as a template for the Cadence Estimator, because the implementation details
of invoking the data processing for step detection, at specified interval are abstracted.
Figure 1.11: A simple class diagram for the CadenceEstimator, CadenceProcessor, and SignalProcessor.
The CadenceEstimator implemented in the telemonitoring framework follows the same
flow described in Figure 1.4 and is described in the architecture diagram in Figure1.11. The
CandenceEstimator contains a CadenceProcessor which receives sensor updates from the
accelerometer and buffers the data. At the a specified period the CadneceEsimator runs the
CandenceProcessor which creates a SignalProcessor with a copy of the buffered data and
runs it in a separate thread. Next, the buffer is flushed leaving about 2 seconds of buffered
data with the flushWindow() method. The flushWindow() also handles calculating the new
resampling start time. The SignalProcessor handles the process of resampling, filtering,
smoothing, and step counting.
1.1.4 Experimentation and Validation
1.1.4.1 Cadence Estimation
In order to test the accuracy of the cadence estimator which was developed for the framework,
the cadence estimator was incorporated to the marathon coaching application our team has
20

developed which is introduced in the following section 1.2. The detected step times from
the cadence estimator are logged to the phone along with the raw accelerometer data, same
process described in section 1.1.3.2. The raw accelerometer data is then resampled to a
uniform sampling rate and the unmodified algorithm is used to detect steps with the optimal
parameters. Taking the time derivative of the detected steps gives an estimate of cadence
for any point in time.
Figure 1.12: The cadence estimates are plotted above for the cadence estimator implemented in the frame-work and cadence estimates from original algorithm.
In Figure 1.12 the performance of the cadence estimator is compared to cadence estimation
utilizing original unmodified step detection algorithm. The average root mean square error
between the two estimating methods using the comparison set is 21.6. While the results
with respect to the root mean squared error are not impressive the qualitative shape of both
estimation plots are similar, both fluctuate a lot.
1.1.5 Future Work
While the results, from section 1.1.4, with respect to the root mean squared error are not
impressive the qualitative shape of both estimation plots are similar, both fluctuate a lot.
This suggest that the problem might stem from the step detection algorithm. For future im-
provement of this cadence estimator different step detection algorithms can be interchanged
due to the modular design of the CadenceEstimator. Another possible source of error is
21

that our hypothesis that reducing the sampling frequency would not effect the performance
of the step counting algorithm is false. The parameters which were found to be optimal
could also be another source of error, with more data one could fit a better model.
1.2 RunCoach
As previously discussed in the Introduction section, the development of a marathon coaching
application utilizing the Berkeley Telemonitoring Project framework has been chosen as
an example application for which further development of the telemonitoring framework is
required, such as the development of a cadence estimator for the telemonitoring framework
described in section1.1. In this section an overview of the marathon coaching application,
RunCoach, is given. Individual contribution to the development of the RunCoach application
is also described in this section.
1.2.1 Overview of RunCoach Application.
Expanding on the description of the marathon coaching application described in the Intro-
duction, the RunCoach application is designed for the training of long distance running.
The training method is based on the idea that cadence is a vital metric for measuring per-
formance, and that higher paced cadences will lead to improvement in performance and
reduction of risk of injury [3].
22

Figure 1.13: Screenshot of the RunCoach application during data collection.
While the running metric of interest for measuring performance is cadence, the RunCoach
application is also capable of collecting various health and running metrics. The RunCoach
application is capable collecting heart rate, speed, distance, and energy expenditure, along
with some phone data namely battery usage and screen light usage. Heart Rate can be
collected using external bluetooth heart rate monitor or it can be estimated using video feed
from built in camera. Figure 1.13 is a screen shot of the application while data collection is
running. Current cadence estimates are displayed in the upper portion of the screen, taping
the upper portion of the screen switches the display to show current speed estimation. If a
bluetooth heart monitor is connected, heart rate information is displayed inside of the blue
heart on the right side of the screen. Elapse time is displayed in the middle and total distance
covered in shown on the bottom of the screen. A major feature in our RunCoach application
is the use of feedback in order to help improve runners performance. This feedback is given
via vibration if the runner is under the target cadence.
23
1.2.2 Contribution to RunCoach application
No training or workout assistant application would be complete without the capability to
view results of an activity and being able to view results of previously performed activities.
In this section the implementation of the post results activity screen and the methods to
populate it are described.
1.2.2.1 Results Screen
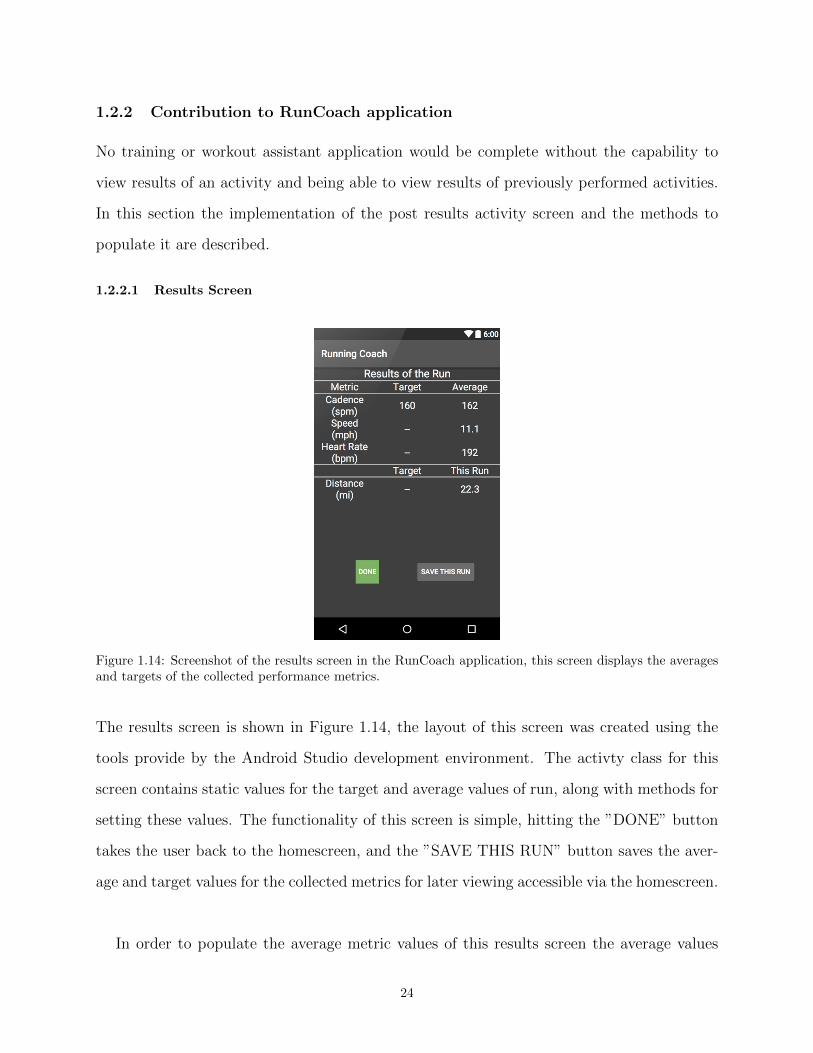
Figure 1.14: Screenshot of the results screen in the RunCoach application, this screen displays the averagesand targets of the collected performance metrics.
The results screen is shown in Figure 1.14, the layout of this screen was created using the
tools provide by the Android Studio development environment. The activty class for this
screen contains static values for the target and average values of run, along with methods for
setting these values. The functionality of this screen is simple, hitting the ”DONE” button
takes the user back to the homescreen, and the ”SAVE THIS RUN” button saves the aver-
age and target values for the collected metrics for later viewing accessible via the homescreen.
In order to populate the average metric values of this results screen the average values
24

must first be calculated. For calculating the averages event listeners were developed which
update an internal average value. For example, the average cadence listener updates its
cadence average when a new cadence value is calculated and pushed to encapsulator for
sending. Upon the completion of the run the average metric value is written to a static
value in the post results activity class. Similar listener were developed for average heart
rate, average speed, and total distance.
25

Chapter 2
Engineering Leadership
2.1 Industry and Market Analysis Overview
While there exist several smartphone based platforms that can be used to create applications
for various purposes, such as Canvas, Appery.io and Mobile Rodie ([11]) most of these offer
limited functionality and access to sensors. Additionally, these products lack the ability to
easily build predictive models for automated generation of personalized interventions. More
generally, there are no such platforms that cater to the issue of telehealth. Our telemonitoring
framework, targeted towards doctors and coaches, addresses this unmet need.
To guide the expansion of the framework, we will consider the design and implementation
of new features in the context of a commercial application that would be used by marathon
trainees. To this end, it is useful to perform a market and industry analysis on existing
fitness tracking technology. By examining consumer behavior and industry offerings, we can
better understand what functionality is missing and what features athletes desire.
2.2 Market Analysis
According to surveys ([12]) in 2014 there were more than 1200 marathon events held within
the US, with a total of 550,637 finishers. These are both all-time high statistics, with
the number of marathon finishers growing about 1.8% from 2013 to 2014. A survey of
26

marathon runners showed that 74% of them relied on wearable technology for training and
88% of them relied on said technology for motivation ([13]). Between 2014 and 2015, the
number of wearables purchased is said to have nearly tripled from 17.6 million to 51.2 million
([14]). Of Internet users who exercise between the ages of 18-34, 38% of males and 21% of
females use wearable fitness trackers ([15]). Wearable technology has clearly entered into
the mainstream, especially in the area of fitness training with fitness trackers. Marathon
runners are no exception. With their ubiquity and proclivity for training technology, they
represent an acceptable target market for our application.
2.3 Porter’s Five Forces Analysis
We will now conduct a Porter’s Five Forces analysis of our mobile application for marathon
runners to contextualize it in the industry and develop a strategy for differentiating and
promoting it ([16]).
2.3.1 Bargaining Power of Buyers
Buyers have strong bargaining power only when they are consolidated. Consumers of fitness
tracking products are numerous, but diffuse in their buying patterns. Buyers are many and
demand is great, weakening the bargaining power of buyers.
2.3.2 Bargaining Power of Suppliers
The power of suppliers refers to the power of businesses that provide materials to another
business to demand increased prices for materials ([16]). The application is developed for the
Android platform, and cell phones have become a commodity, indicating a weak bargaining
power.
2.3.3 Threat of New Entrants
New entrants have the potential to bring new ideas to a market. The market of activity
monitors poses few barriers and connected fitness trackers are projected to grow from $2
27
billion to $5.4 billion from 2014 to 2019 ([17]). With the burgeoning of the Internet of
Things, it is expected that there will be new players in many applications of telemonitoring.
Thus, the threat of new entrants is perceived to be strong.
2.3.4 Threat of Substitutes
A product from a different industry that offers the same benefits to consumers is referred
to as a substitute product. Substitute products pose a threat because there is possibility
of replacement for a company’s product ([16]). One substitute product for runners training
for marathons is meeting one-on-one or in small groups with dedicated professional trainers
and coaches. There is an approximately $1.5 billion industry existing in intensive personal
athletic training in the United States ([18]). This includes firms and independent individuals
who provide services granting personalized attention to athletes training for sports seasons
or upcoming events such as marathons. However, human trainers conducting in-person
training generate problems not seen in the activity monitor/trainer application. For example,
scheduling is a factor for this substitute, as the athlete would need to train according to the
trainer’s schedule and location. Having a human trainer is also significantly more expensive
than using an activity monitor. The application does not come with these added cost and
conditions. For these reasons we believe that the threat of substitutes is weak.
2.3.5 Rivalry Amongst Existing Competitors
Rivalry can pose a great threat when the rivals compete over price instead of features. The
market for tracking and training of fitness, including endurance running, is a crowded one.
In this market, our application will be competing with a variety of technologies, such as
smartphone apps and specialized fitness tracking hardware. We will need to ensure that
our feature offerings are differentiated in order to avoid significant threat from price-based
rivalry.
Wearable fitness tracking devices have seen widespread adoption among runners and other
athletes. There are several subcategories of device functionality in this area, ranging in
28
metrics measured, accuracy of these metrics, and price. These include step counters such as
the Fitbit One or Nike+ FuelBand at the lower end of functionality and price, GPS-based
speed and distance monitors like the Garmin ForeRunner 620 or TomTom Runner at the
higher end, and multi-functional devices like smartwatches, such as the Apple Watch or
Pebble Time that have some built-in fitness features ([19]).
Other competing fitness devices include specialized peripheral hardware, such as chest
straps to monitor heart rate, shoe inserts to track impact and step duration, and devices
that help athletes recover from training in terms of bloodflow and muscle relaxation, such as
the Firefly Recovery System ([20]). These products are more targeted at health monitoring
and feedback for runners, which we can compete with by providing without specialized
hardware outside of the mobile phone itself.
Additionally, given the demand for personal training, new products which provide per-
sonalized feedback, such as the Moov, have already begun to appear. Moov’s successful
crowdfunding campaign indicates a demand for fitness trackers that can provide this type
of feedback ([21]). Major players are pushing for greater personalization. For example, Fit-
Bit, a key player in wearable fitness tracking, acquired the startup FitStar in 2015 ([22])
which provides users with personalized instructional videos. Finally, our application will be
competing with a host of other smartphone fitness applications. A huge market for personal
fitness tracking exists in the app stores of the smartphones that so many Americans already
carry with them daily. A study ([23]) estimated that in 2012 there were over 40 thousand
health and fitness applications available for mobile phones, reaching over 500,000 active
users, and that number has only increased in the past few years. A wide variety of fitness
and run tracking, goal-setting and socially competitive, and motivational applications are
available. Some of the most popular apps specifically targeted at runners are RunKeeper,
MapMyRun, and Runtastic ([19]). On the more creative side are apps like Zombies, Run
which provides audio motivation in a narrative form, taking a runner through customizable
missions in a fictional environment.
Given the great number of players in this industry, the threat of existing rivals is strong.
29

However, given the still largely unexplored area of personalized coaching within the crowded
space of fitness tracking technology, we believe that this rivalry will primarily be features-
based.
2.4 Technology Strategy
Considering our market research and Porter’s Five Forces analysis, we have developed a
strategy for our product in order to minimize the threats posed to our product. Our strat-
egy revolves around marketing to customers based on the features offered by our product,
particularly focusing on measurement and real-time feedback regarding performance met-
rics, such as speed and cadence. For instance, despite its importance, many fitness tracking
solutions do not measure cadence. In addition, the products that do are typically not trans-
parent about the estimation algorithms used and their accuracies. Even for those that do
report accuracy, the algorithms used are still unpublished, and the accuracy of specific met-
rics, such as cadence, are conspicuously missing ([24]). Our application uses algorithms
backed by published scientific literature, and the accuracy of our implementation will be
further measured and published. Furthermore, the framework on which the application is
built includes a fault-tolerant client-server protocol for secure and convenient data syncing,
and a wide library of well-tested data collection and analytics functionality to support our
application’s features and ensure they remain reliable and easy to use. Raising the standards
of information transparency, estimation accuracy, and application reliability would not only
allow our application to gain traction in the market if we were to actively promote it, but
would also impose barriers to new entrants.
30

Bibliography
[1] D. Aranki, G. Kurillo, A. Mani, P. Azar, J. van Gaalen, Q. Peng, P. Nigam, M. P. Reddy, S.
Sankavaram, Q. Wu, and R. Bajcsy, “A telemonitoring framework for android devices,” in Proceedings
of the 1st IEEE Conference on Connected Health: Applications, Systems and Engineering Technologies,
to appear, IEEE, Jun. 2016.
[2] O. Foss and J. Hallen, “Cadence and performance in elite cyclists,” European Journal of Applied
Physiology, 2004.
[3] W. Edwards, D. Taylor, T. Rudolphi, J. Gillette, and T. Derrick, “Effects of stride length and running
mileage on a probabilistic stress fracture model,” Medicine ‘I&’ Science in Sports ‘I&’ Exercise, 2009.
[4] Google. (2016). Android API guides: Sensormanager, [Online]. Available: http://developer.android.
com/reference/android/hardware/SensorManager.html.
[5] ——, (2016). Android API guides: Sensoreventlistener, [Online]. Available: http : / / developer .
android.com/reference/android/hardware/SensorEventListener.html.
[6] M. Mladenov and M. Mock, “A step counter service for java-enabled devices using a built-in accelerom-
eter,” in Proceedings of the 1st International Workshop on Context-Aware Middleware and Services:
Affiliated with the 4th International Conference on Communication System Software and Middleware
(COMSWARE 2009), ser. CAMS ’09, Dublin, Ireland: ACM, 2009, pp. 1–5, isbn: 978-1-60558-525-3.
doi: 10.1145/1554233.1554235. [Online]. Available: http://doi.acm.org/10.1145/1554233.
1554235.
[7] N. Zhao, “Full-featured pedometer design realized with 3-axis digital accelerometer,” Analog Dialogue,
vol. 44, 2010.
[8] S. Shin, “Adaptive step length estimation algorithm using low-cost mems inertial sensors,” in IEEE
Sensors Applications Symposium, San Diego, CA: IEEE, 2007, pp. 1–5, isbn: 1-4244-0677-3. doi:
10.1109/SAS.2007.374406.
31
[9] S. Cho, K. Lee, C. Park, and J. Lee, “A personal navigation system using low-cost mems/gps/fluxgate,”
in Proceedings of the 59th Annual Meeting of The Institute of Navigation and CIGTF 22nd Guidance
Test Symposium, Albuquerque, NM: ION, 2003, pp. 122–127.
[10] B. Telemonitoring. (2016). Telemonitoring API guides: Abstractperiodicextractor, [Online]. Available:
https://telemonitoring.berkeley.edu/api/lib/client/latest/.
[11] G. Smith. (2013). 10 excellent platforms for building mobile apps, [Online]. Available: http : / /
mashable.com/2013/12/03/build-mobile-apps/#SXF0URANsqqg.
[12] Running USA. (2015). 2014 running usa annual marathon report, [Online]. Available: http://www.
runningusa.org/marathon-report-2015.
[13] Freescale. (2014). The next evolution in running, [Online]. Available: https://web.archive.org/
web/20141223192158/http://blogs.freescale.com/iot/2014/12/wearables-next-evolution-
in-running-marathon/.
[14] Gfk. (2015). Gfk forecasts 51 million wearables will be bought globally in 2015, [Online]. Available:
gfk.com/news-and-events/press-room/press-releases/pages/gfk-forecasts-51-million-
wearables-sold-globally-2015.aspx.
[15] Mintel, “Exercise trends - us - october 2014,” Mintel, Market report, 2014.
[16] M. E. Porter, “The five competitive forces that shape strategy,” Harvard Business Review, vol. 86, no.
1, pp. 78–93, 2008.
[17] Parks Associates. (2015). Global revenues from connected fitness trackers to exceed $5 billion by 2019,
[Online]. Available: http://www.parksassociates.com/blog/article/pr-march2015-whcc.
[18] D. Witter, “Ibisworld industry report 61162: Sports coaching in the us,” IBISworld, Industry report,
2015.
[19] J. Carter. (2013). 10 best running gadgets: The top tech for training, [Online]. Available: http :
//www.techradar.com/us/news/world-of-tech/roundup/10-best-running-gadgets-the-top-
tech-for-training-1157180/1.
[20] K. Alger. (2014). Training for a marathon: Tech for half marathon, marathons and beyond, [Online].
Available: http://www.t3.com/features/training-for-a-marathon-half-marathon-ultra-and-
beyond.
[21] J. Colao. (2014). Who needs kickstarter? exercise sensor moov raises $1 million in 15 days, [Online].
Available: http://www.forbes.com/sites/jjcolao/2014/03/14/exercise-sensor-moov-raises-
1-million-in-15-days-without-kickstarter/#704c414614e3.
32

[22] R. Lawler. (2015). Fitbit confirms fitstar acquisition to bring training to its fitness portfolio, [Online].
Available: http://techcrunch.com/2015/03/05/fitbit-confirms-fitstar-acquisition-to-
bring-training-to-its-fitness-portfolio/.
[23] Stanfy. (2013). Fitness in mobile: Case-study, [Online]. Available: http://www.slideshare.net/
stanfymobile/fitness-cs-22962137.
[24] Garmin. (2016). How accurate are the running dynamics from the hrm-run and how was the accuracy
tested? [Online]. Available: https://support.garmin.com/support/searchSupport/case.faces?
caseId=%7B435cc8c0-e2e1-11e3-47b1-000000000000%7D.
33