A Teacher Evaluation System That Works - ERIC · 2013-08-02 · National Institute for Excellence...
55
National Institute for Excellence in Teaching A Teacher Evaluation System at Works Glenn Daley and Lydia Kim National Institute for Excellence in Teaching 1250 Fourth Street Santa Monica, CA 90401 is Working Paper provides preliminary research results for discussion and comment. It expresses the views of its authors and does not necessarily represent the position of the National Institute for Excellence in Teaching (NIET). e paper may be cited in accordance with academic standards, but should not be reproduced without the permission of NIET. National Institute for Excellence in Teaching WORKING PAPER | August | 2010
Transcript of A Teacher Evaluation System That Works - ERIC · 2013-08-02 · National Institute for Excellence...

National Institute for Excellence in Teaching
A Teacher Evaluation System That Works
Glenn Daley and Lydia Kim
National Institute for Excellence in Teaching1250 Fourth Street
Santa Monica, CA 90401
This Working Paper provides preliminary research results for discussion and comment. It expresses the views of its authors and does not necessarily represent the position of the National Institute for Excellence in Teaching (NIET). The paper may be cited in accordance with academic standards, but should not be reproduced without the permission of NIET.
National Institute for Excellence in Teaching
W o r k I N g P A P E r | August | 2010

© 2010 National Institute for Excellence in Teaching. Do not duplicate without permission.
A TEACHER EVALUATION SYSTEM THAT WORKS
Glenn Daley and Lydia Kim
ABSTRACT
Status quo approaches to teacher evaluation have recently come under increasing
criticism. They typically assign most teachers the highest available score, provide minimal
feedback for improvement, and have little connection with student achievement growth and the
quality of instruction that leads to higher student growth. A more comprehensive approach has
been demonstrated for ten years by TAP™: The System for Teacher and Student Advancement.
This system includes both classroom observations and student achievement growth measures,
provides feedback to teachers for improvement, is aligned to professional development and
mentoring support, and provides metrics for performance-based compensation. This paper
describes the TAP system, and examines data from a large sample of teachers to assess the
distribution of TAP evaluations and their alignment to student achievement growth. We find that
TAP evaluations provide differentiated feedback, that classroom observational scores are
positively and significantly correlated with student achievement growth, that TAP teachers
increase in observed skill levels over time, and that TAP schools show differential retention of
effective teachers based on these evaluation scores.

A Teacher Evaluation System That Works 1
I. INTRODUCTION
Educators are among the most numerous of public servants, and K-12 education is one of
the most vital of all public investments. Research shows that individual teachers are the most
important school-related factor in student achievement gains, that effectiveness varies greatly
between teachers, and that differences in effectiveness are not well predicted by traditional
qualifications. Yet teacher performance in the classroom is seldom evaluated in any rigorous
way. Commonly, a teacher is observed at most once a year by a principal who rates the teacher in
the highest category unless some egregious fault is noticed. In efforts to improve educational
outcomes for students and increase accountability for teachers, the public and policymakers are
calling for a better approach to teacher evaluation, including more systematic observation of
classrooms, use of multiple measures of teacher effectiveness, and more attention to using
evidence of teacher effectiveness in improving student outcomes.
One approach with a ten-year track record is the evaluation structure integrated within
TAP™: The System for Teacher and Student Advancement (Agam, Reifsneider, & Wardell,
2006; Agam & Wardell, 2007; Schacter et al., 2002; Schiff, 2003; Solmon, White, Cohen &
Woo, 2007). The TAP system was developed by Lowell Milken and colleagues at the Milken
Family Foundation and is now managed by the National Institute for Excellence in Teaching
(NIET). Since its inception in the 2000-2001 school year, TAP has grown to serve over 7,500
teachers and 85,000 students across the country.
The TAP system centers around four core elements, of which one is instructionally
focused accountability, or in other words, teacher evaluation. This element includes a qualitative
component in which classrooms are observed a recommended four to six times a year by
multiple trained raters using a research-based rubric. It also includes a value-added component
which measures the teacher‘s and the school‘s contributions to the achievement gains of their
students. The other three core elements of TAP are integrally connected with evaluation. With
multiple career paths for teachers, each TAP school has a cadre of instructional leaders who are
trained and certified to conduct classroom observations as well as to support teachers in the
process of improvement. The element of ongoing applied professional growth means that
teachers regularly engage in collaborative professional learning based on the standards of

2 NIET Working Paper
performance that will be applied in their evaluations. And the element of performance-based
compensation means that teachers who demonstrate high-quality classroom instruction and value
added to student achievement will be rewarded for their performance.
To support and inform such an integrated system, the teacher evaluation element cannot
be trivial. It must be based on sound research; it must differentiate performance across a range
from superior to inferior teaching; and it must include observational and outcomes-oriented
assessments of teacher performance that are aligned with each other. This paper examines the
TAP structure of teacher evaluation in these terms. It addresses the following research questions:
1. Does the TAP evaluation structure differentiate on the basis of instructionally meaningful differences between teachers?
2. Do the TAP observational ratings align with value-added scores?
3. Does individual teacher performance improve over time within the TAP system?
4. Do schools in TAP see greater retention of effective teachers than ineffective teachers over time?
Section II presents historical background on teacher evaluation practice, and Section III
describes TAP‘s evaluation structure. Section IV describes the data and methods we use for an
empirical study of whether the evaluations differentiate effectiveness among teachers and show
evidence of alignment between qualitative and outcomes-oriented components. Section V
discusses the results of the empirical study, and Section VI presents conclusions.
II. BACKGROUND
Common sense tells us that teachers are important in students‘ education. A substantial
body of research over the last 20 years provides us with an estimate of how much impact teachers
have on student growth over time compared to other identifiable factors. This research shows
that individual teachers account for the largest differences between students at the end of any
given year after controlling for the differences that students bring to the classroom at the
beginning of the year (Wright, Horn, & Sanders, 1997; Rivkin, Hanushek, and Kain, 2000;
Rowan, Correnti, & Miller, 2002; Rockoff, 2004; Gordon, Kane, & Staiger 2006).
Although the technical details of statistical models differ, this evidence is essentially
based on a decomposition of the variance in student scores. Given that end-of-year scores vary

A Teacher Evaluation System That Works 3
among students, how much of that between-student difference can be attributed to specific
schooling factors or inputs such as school funding or teacher qualifications? Conducting this
analysis using average cross-sectional test score data is so difficult that it was not until the
development of longitudinal student data sets and value-added methods that researchers began to
make strong claims of finding individual teacher effects.
Using these new methods, research has shown relatively little impact for qualifications
such as traditional certification, long-term experience, and advanced degrees (Goldhaber &
Brewer, 1997; Goldhaber & Brewer, 2000; Wayne & Youngs, 2003; Gordon, Kane, & Staiger,
2006). What matters for student growth is the individual teacher‘s effectiveness in the classroom
more than the teacher‘s qualifications or other characteristics. From a policy perspective, if
teacher preparation mattered most, then we should devote more public resources to preparation
programs. If other qualifications mattered most, we should screen teachers for those
qualifications. However, since student achievement growth is more closely related to teacher
differences that are not identified by these characteristics, researchers and policymakers have
turned their attention to the individual teacher‘s performance in the classroom as the key to
improving instruction. This perspective implies that instructional practice varies among teachers
in important ways, which in turn suggests that schools need ways to evaluate and improve the
instructional practice of their teachers.
A Brief History of Classroom Performance Teacher Evaluation
The evaluation of teachers‘ classroom performance has undergone major shifts in the last
100 years. Teacher evaluation has changed along with beliefs and values concerning the role of
teachers, effective teaching, and theories of student learning (Cuban, 1993; Ellett, 1997; Ellett &
Teddlie, 2003; Shrinkfield & Stufflebeam, 1995). Until the 1950s, teacher quality was judged
from a moralistic and ethical perspective, with judgments based on the grounds of teachers‘
personal traits (Ellett & Teddlie, 2003; Good & Mulryan, 1990). In the 1950s onward, the
influence of scientific management led to measures of performance based on observable
behaviors, although the linkage between these behaviors and student outcomes was tenuous.
Over time, the accumulated knowledge from these efforts came to form the criteria used in many
teacher evaluation systems (Ellett & Teddlie, 2003). The practice of teacher classroom
evaluations came to be predominately structured as at most once or twice yearly occasions, in

4 NIET Working Paper
which an administrator briefly stopped by a classroom to complete a checklist or ratings form
(Peterson, 2004). In many places, this structure became embodied in collective bargaining
agreements and/or district and state policies. It has continued to be the dominant approach to
teacher evaluation into the 21st century (Weisberg, Sexton, Mulhern, & Keeling, 2009).
A large body of research has established the deficiencies of the typical evaluations
conducted by administrators, including critique of the rudimentary inventory of teaching skills
typically assessed, inadequate time afforded administrators to provide instructional support, poor
training, patterns of assigning uniformly high ratings, and weak relationship of principals‘
impressions of teacher quality to student achievement (Darling-Hammond, 1986; Jacob &
Lefgren, 2008; Medley & Coker, 1987; Haefele, 1993; Peterson, 2000; Scriven, 1981).
Attempts have been made to introduce more systematic classroom observation methods
into the evaluation process. The school reform efforts of the 1980s and 1990s brought about
increased attention to teacher evaluations as a critical lever for improving the quality of teaching
(Brandt, 1995; Darling-Hammond, 1990). This period saw a sharp increase in the number of
states enacting laws directed at systematizing the practice of teacher evaluations. By 1983, 26
states required teacher evaluations in some form (Wuhs & Manatt, 1983). A number of states
mandated procedures for on-the-job classroom-based teacher evaluation for the purposes of
licensure, career ladders, merit pay, and renewed certification; however, most of the state
evaluation programs launched in this era were soon dismantled or significantly scaled back
(Ellett & Teddlie, 2003). With the passage of No Child Left Behind in 2001, there continued to
be a trend of expanded state oversight and regulation of local evaluation practices, for example
by defining teacher quality, setting minimum standards for evaluator training, and requiring data
collection (Hazi and Arredondo Rucinski, 2009). Teachers unions played an integral role in
shaping policies for monitoring teacher performance; collective bargaining agreements have
defined and limited procedures for conducting evaluations, both affording teachers due process
protections and sharpening the regulatory aspects of evaluation (Mitchell et al., 1981; Shrinkfield
& Stufflebeam, 1995; Stiggins & Duke, 1988).
The resultant evaluation procedures have never been geared towards helping teachers,
individually or collectively, improve their skills. Evaluations are generally conducted as
infrequent and perfunctory events in satisfaction of bureaucratic requirements (Darling-
Hammond, 1986; Stiggins & Bridgeford, 1985; Weisberg et al., 2009). State statutes by and

A Teacher Evaluation System That Works 5
large have set a low bar for the minimum frequency of evaluations. As of 2009, less than half of
all states required evaluation for tenured teachers on at least an annual basis (Hazi & Arredondo
Rucinski, 2009). Locally defined procedures for evaluations have tended not to set a more
rigorous frequency for evaluation cycles. As of 2008, less than a quarter of the 50 largest school
systems in the United States required more than an annual evaluation of untenured or tenured
teachers, thus limiting the formal opportunities for teachers to receive feedback (Toch &
Rothman, 2008). Surveys conducted of the 100 largest school districts in the United States in
1983 and 1992 have shown most of those districts have historically deferred from setting a
minimum number of required evaluations for teachers with known deficiencies (Ellett &
Garland, 1987; Loup, Garland, Ellett, & Rugutt, 1993).
Teacher evaluations can fulfill two related purposes of personal growth and
accountability (Duke & Stiggins, 1990). Evaluations can be used to convey expectations, assess
current abilities, and plan professional development in service of developing higher levels of
professional competence. Evaluations also provide defensible and standardized information to
use in human resource decisions. Both purposes of teacher support and accountability can be
addressed in a single evaluation system if carefully designed and implemented (Darling-
Hammond, Wise, & Pease, 1983; Stronge, 1997). In practice, evaluations are rarely used to
inform teachers about instructional areas in need of improvement. Studies have established the
generally low emphasis given to instructional improvement and the poor quality of feedback
made available to teachers as a result of the evaluation (Frase & Streshley, 1994; Stiggins &
Bridgeford, 1985). A recent survey of 15,176 teachers in 12 districts found that nearly 75% of
teachers had not received specific feedback on how to improve their instructional practice; newly
inducted teachers also reported they had not received feedback on any area of performance in
need of improvement over the course of their first three years as teachers (Weisberg et al., 2009).
Furthermore, the same study found that districts rarely undertook formal dismissal procedures
for poorly performing teachers; in half of the districts studied, not a single non-probationary
teacher was dismissed on the grounds of poor performance within a five-year period (Weisberg
et al., 2009). On the whole, practices of recent decades have failed to assure the implementation
of effective teacher evaluation systems and allowed for a teaching profession with limited
opportunities for growth and little accountability.

6 NIET Working Paper
An alternative approach to the evaluation of teacher effectiveness, based on student
learning as measured by standardized tests, came to the attention of researchers and program
evaluators starting in the 1970s (Shrinkfield & Stufflebeam, 1995). However, before student
achievement gains could find acceptance for the performance evaluations of individual teachers,
it was necessary to develop much better methods for measuring teacher contributions to those
gains (Sanders & Horn, 1998). Not only has the methodology improved during the last three
decades, but the standardized tests on which the approach is based have also gone through a
process of improvement and development through the influence of Item Response Theory (Van
der Linden & Hambleton, 1997) and the rise of standards-based approaches to education and
assessment. Increasingly, there are calls to base teacher evaluations on measured student learning
in addition to—not in place of—high-quality classroom observations. This paper examines the
TAP system as an example of this combined approach to evaluation in practice.
The Importance of Differentiation of Teacher Effectiveness
Traditional school systems have not been successful at evaluating teachers. The New
Teacher Project recently published a report (Weisberg et al., 2009) showing not only that
districts fail to differentiate between teachers when assigning evaluation ratings, but also that the
ratings appear to be highly inflated. By far most teachers are rated at the very highest levels,
despite the fact that most schools are not educating their students at the very highest levels.
More specifically, the authors looked at five urban districts that use a binary
(satisfactory/unsatisfactory) rating system and five urban districts that use a multiple rating
system (3-point, 4-point, or 5-point scales). They found that these districts rated the vast majority
of tenured teachers at the highest possible point on the scale, regardless of whether it was defined
as satisfactory on a 2-point scale or outstanding on a multi-point scale. These results are
illustrated in Figure 1, below.

A Teacher Evaluation System That Works 7
Figure 1. Teacher Evaluation Ratings in Urban School Districts with 2- 3- 4- and 5-Point Rating Systems
Five Districts with a 2-Point Rating System Two Districts with a 3-Point Rating System
Two Districts with a 4-Point Rating System One District with a 5-Point Rating System
Data from Weisberg et al., (2009).
For a comparison across districts, we combined the above results for districts with
multiple-point rating systems, converting them to an equivalent 5-point scale, as seen in Figure 2
below. Scores on 3-point and 4-point scales were interpolated to the 5-point scale using a
cumulative probability density function based on the reported data. As Figure 2 shows, this
analysis results in an overall distribution that is highly skewed toward the highest ratings, with
over 60% of teachers receiving the highest rating, about 10% receiving the middle rating, and
2% receiving the lowest rating.

8 NIET Working Paper
Figure 2. Teacher Evaluations in Urban School Districts with Multiple Ratings Converted to 5-Point Equivalent Scale
0%
10%
20%
30%
40%
50%
60%
70%
Lowest Ratings Middle Ratings Highest Ratings
Perc
en
t o
f T
ea
ch
ers
Based on data from Weisberg et al., (2009). Scores on 3-point and 4-point scales have been interpolated to a 5-point scale using a cumulative probability density function based on the reported data.
We know from the research literature that differences in the effectiveness of teachers
exist and represent the single most important school-related factor affecting student learning. We
know from public data that far too many students are not achieving proficiency in core math and
English skills, even after eight years of No Child Left Behind and more years of efforts at holding
schools accountable to state standards. The teacher ratings given in the above charts are simply
incompatible with these facts about teacher effectiveness. Teacher differences matter for student
outcomes, but the graphs demonstrate that teacher differences are not being measured by
traditional, widely used methods of evaluation.

A Teacher Evaluation System That Works 9
III. THE TAP SYSTEM
The TAP system is based on four interrelated elements, designed to enhance not only
teacher performance, but also teacher job satisfaction, recruitment, and retention:
Multiple career paths. In TAP schools, skilled teachers have the opportunity to serve as master and mentor teachers, receiving additional compensation for providing high levels of support to career teachers. Master and mentor teachers form a leadership team, along with the principal, to deliver school-based professional support and conduct evaluations with a high level of expertise.
Ongoing applied professional growth. TAP teachers participate in weekly cluster group meetings, led by master and mentor teachers, in which they examine student data, engage in collaborative planning and learn instructional strategies that have been field-tested in their schools. Professional development continues into each classroom as master teachers model lessons, observe classroom instruction, and support other teachers to improve their teaching.
Instructionally focused accountability. TAP teachers are observed in classroom instruction several times a year by multiple trained observers, including principals and master and mentor teachers, using rubrics for several dimensions of instructional quality. Evaluators are trained and certified, and leadership teams monitor the reliability and consistency of evaluations in their schools.
Performance-based compensation. Teachers in TAP schools have the opportunity to earn bonuses each year based on their observed skills, knowledge, and responsibilities; their students‘ average growth in achievement; and the entire school‘s average growth in achievement. Master and mentor teachers receive additional compensation based on their added roles and responsibilities. Combining these sources, performance pay for a teacher in a TAP school can reach up to $20,000.
The integration and mutual alignment of these four elements is central to understanding
TAP (Jerald, 2009). The TAP system‘s structure of evaluation provides feedback for professional
growth, and serves as the basis for determining performance-pay awards. Simultaneously, this
evaluation structure relies on master and mentor teachers as well as principals to carry out the
observational assessments and provide personalized feedback, mentoring, training, and other
support for improvement.
The TAP evaluation structure depends on two distinct types of teacher performance
measures: a qualitative component primarily consisting of classroom observations and an
outcomes-based component consisting of the value-added analysis of student achievement
growth. Of these two measures, the first focuses on behavior and the quality of instruction and

10 NIET Working Paper
provides real-time feedback to teachers and school leaders. The second focuses on student
outcomes and provides annual validation of teacher effectiveness. Both prior year value-added
and qualitative data are used in professional development decisions and teacher incentives. In
theory, these two components should be related, since we expect high-quality teaching to result
in high student achievement gains.
The TAP Qualitative Component
The qualitative component consists of classroom observations by the principal and master
and mentor teachers in the school. Observations of classroom instruction afford a direct view
into a teacher‘s interaction with her students. However, poor observation instruments with low
reliability and validity have limited the information that can be yielded from observations
(Darling-Hammond et al., 1983). In order to create a teacher accountability system to improve
the quality of instruction, Odden and Clune (1998) urged states and school districts to identify
the knowledge and skills needed to teach successfully, and then create standards and rubrics to
measure performance in those areas. Over time, there has been improvement from the narrowly
and poorly defined criteria often relied upon in teacher evaluations to the development of more
sophisticated rubrics (see Little, 2009, for review). Studies have provided some evidence for the
validity of standards-based rubrics to measure teaching practices related to student learning
(Gallagher, 2004; Kimball, White, Milanowski & Borman, 2004), and to provide substantive
feedback to teachers and productively inform the direction of professional development
(Holtzapple, 2003; Kimball, 2002).
TAP observations are made using a research-based set of standards and rubrics that are
curriculum-independent. Although the rubrics were based on the research that existed at the time
they were developed, the experience of TAP over the last ten years provides an opportunity to
validate them with value-added student achievement results, as done in this paper.
The TAP rubrics set expectations for what effective teaching should look like. When a
TAP teacher is evaluated, he or she is given a performance rating based on the indicators in each
of four domains: designing and planning instruction, classroom learning environment,
instruction, and teaching responsibilities. All but the responsibilities domain are scored during
classroom observations. The responsibilities domain standards are assessed at the end of the
year.

A Teacher Evaluation System That Works 11
This instrument is designed to identify a range of proficiency on its various indicators.
On a 1-5 scale, a score of 1 represents unsatisfactory performance in a certain standard. A 3
represents proficiency in a certain standard. A score of 5 represents true excellence above and
beyond what is expected of a proficient teacher on a certain standard. Therefore, it is not
expected that a teacher must receive a score of 5 on every standard during an evaluation. As a
result, there is a wide distribution of teacher performance ratings in TAP schools, providing a
more accurate representation of teachers‘ abilities and effectiveness. Appendix A describes the
rubric in more detail.
Classroom observations, both announced and unannounced, are conducted a
recommended four to six times per school year by trained and certified evaluators to ensure that
evaluations are fair, accurate, and consistent. The frequency of TAP classroom evaluations is
made possible by the shared leadership model in TAP schools, which includes mentor and
master teachers in the school‘s evaluation process along with administrators.
Prior to announced observations, evaluators also conduct a pre-conference meeting to
obtain pertinent background information about the lesson plan and students involved for
additional context, and address any potential areas of concern before the lesson. After each
observation, teachers receive written and oral feedback on specific areas of strength and potential
improvement that were identified in the observation. In conjunction with each observation,
teachers are also required to complete a self-evaluation to facilitate reflection on their teaching.
At each of these opportunities, as well as in informal coaching sessions, teachers are provided
with specific support for improvement.
The scores on the 19 rubric indicators from multiple observations are combined with
seven responsibility indicators at the end of the year to create a final score for each teacher, a
Skills, Knowledge and Responsibilities (SKR) score. The SKR score is a weighted composite
that takes into account the type of teacher being observed (e.g. master, mentor, or career teacher),
the type of evaluator for each observation (e.g. master or mentor teacher or an administrator),
and the domains structuring the TAP Teaching Skills, Knowledge, and Responsibilities
Performance Standards. Appendix B describes the weighting used in the overall SKR score. A
written report is provided to teachers each year with their overall SKR ratings and their average
for each domain. Additionally, classroom-level and school-level student achievement growth are

12 NIET Working Paper
discussed with the teacher when the achievement results are returned for the year, and the
relationship between student growth and teacher skills is analyzed with teachers.
Quality Control for the TAP Observational Component
Evaluators are provided with extensive exposure to the TAP rubrics and practice in using
them to rate examples of various levels of performance using video recordings of actual lessons.
The trainings also guide evaluators in how to conduct post-conference sessions to lead teachers
to identify areas in need of improvement and of continued refinement. The trainings are planned
in two phases to allow for an intervening period, usually a duration of several months, when
evaluators can practice applying the rubric in their schools. At the conclusion of training,
evaluators‘ scoring is measured against national raters‘ scoring of videotaped lessons. To
become certified, evaluators must score within one point on each indicator and within no more
than two points from the national rating on three indicators. In addition to undergoing a quality
check on their scoring agreement, evaluators must also pass an assessment which certifies their
ability to conduct required post-conferences. Evaluators are re-certified annually and are able to
receive continual training through TAP Summer Institutes.
TAP provides structures for monitoring evaluation data in which administrators have
access to diagnostic reports, including scores by teacher, overall average scores by evaluator, and
average by evaluator on each standard and domain area. Leadership teams are trained to identify
areas of inconsistent scoring where evaluators appear to give markedly higher or lower scores
compared to other evaluators at their school. In cases where inconsistent scoring is suspected,
leadership teams are provided strategies to build understanding of the rubric, for instance, by
targeting agreement on individual standards as a meeting outcome, and conducting scoring
exercises on the standard in question as a follow-up activity. Leadership teams have access to
additional resources, such as taped lessons for group scoring sessions and outside certified
evaluators, including TAP Directors and TAP staff, to assist with calibrating scores. As part of
their duties, leadership teams are expected to work towards ensuring inter-rater reliability on a
recurring basis in their meetings by scheduling inter-rater reliability activities at least monthly.

A Teacher Evaluation System That Works 13
The TAP Component of Value-Added Outcomes
While observed classroom instruction and teacher responsibilities are incorporated into
the qualitative component of TAP evaluations, the value-added outcomes component focuses on
the teacher‘s impact on student achievement as measured by scores on the annual standardized
assessments required by each state. This does not mean that teachers simply get credit or blame
for their students‘ absolute test scores. Research shows that achievement or attainment
differences between students at the end of the year are highly correlated with differences
between those students at the beginning of the year, as reflected in previous test scores affected
by personal, home, and community differences as well as earlier educational experiences.
Controlling for those previous test scores allows a focus on student growth during the year
(Ballou, Sanders, & Wright, 2004). This is vital because the previous attainment and other
characteristics of the students assigned to a class are beyond the control of the teacher. What is
needed is a way to filter out these differences in background factors so that the growth of the
student during the year is revealed. Value-added assessment does that.
Value-added assessment is a method for measuring the contribution of teachers or
schools to the growth in the academic achievement of their students during a school year. This
involves matching each student‘s test scores to his or her own previous scores, measuring the
student‘s academic growth as the change in attainment from the beginning to the end of the year.
Thus, value-added assessment stands in contrast to attainment-based assessment, which focuses
on the student‘s academic attainment or status as of the end of the year. Through value added,
the impact of a school year on a student‘s learning can be separated from the student‘s prior
experiences in and out of school, individual characteristics, socioeconomic status, and family
conditions. As a result, schools and teachers can become more accountable for how well they
teach rather than how advantaged or disadvantaged their students were at the beginning of the
year.
The TAP value-added component provides each teacher with a classroom score showing
the teacher‘s average to student achievement during the school year. These calculations are
performed by independent providers such as SAS® EVAAS® for K-12 or the Value-Added
Research Center at the University of Wisconsin-Madison, or by state education agencies. For
TAP teacher evaluations, these statistics are converted to a 5-point scale: a 1 represents
significantly lower than one year of student growth for students of similar previous achievement,

14 NIET Working Paper
a 3 represents one year of expected academic growth for similar students, and a 5 represents
significantly higher than one year of growth for similar students.
Alignment of the TAP Evaluation Structure to Other Elements of TAP
The TAP evaluation structure was designed as part of a comprehensive system of reform.
TAP evaluations are tightly integrated with each of the other elements of TAP: Performance-
based Compensation, Ongoing Applied Professional Growth, and Multiple Career Paths.
TAP Incentives Based on Evaluations
TAP performance incentives are awarded annually based on multiple measures that
constitute the TAP evaluation structure. A recommended minimum of $2,500 is allocated for
each teacher in a school‘s performance award fund. The total fund is separated into up to six
pools, according to a teacher‘s role (i.e., career, mentor, master) and whether a teacher has the
necessary data to measure their individual classroom achievement gains. The award pool is
apportioned according to a teacher‘s SKR score, classroom achievement gains, and school
achievement gains. Each criterion must be assigned a weight that determines what percentage of
the award pool is designated for that category.
To ensure the balance of this multiple-measure system, TAP recommends that 50% be
allocated for bonuses based on the SKR score and 50% for bonuses based on value added.
Within the category of value added, 30% is typically allocated for classroom achievement gains
and 20% for schoolwide achievement gains. In the case that a teacher‘s subject or grade is not
tested, the full 50% is allocated for schoolwide gains (Figure 3). This balanced approach also
ensures that the classroom value-added measure by itself represents less than a third of the total
for any teacher in any one year. The use of multiple measures ensures that no single number
determines a teacher‘s compensation or career status.

A Teacher Evaluation System That Works 15
Figure 3. TAP Teacher Incentive Weights
Each teacher must meet minimum levels of performance to be eligible to earn portions of
the award set aside for each criterion. In order to receive the award pool designated under the
SKR score component, career teachers must earn an SKR score of no less than 2.5. Mentor
teachers are held to a higher expectation and are required to earn no less than an SKR score of
3.5. Lastly, fitting with the expertise expected, master teachers are required to earn an SKR score
of at least 4 in their evaluations. In order to earn portions of the award pool set aside for
classroom value added, all teacher types are required to have performed at the average teacher
gain in the state or comparable district, in other words, earn no less than 3. Similarly, for teachers
to earn the schoolwide value-added portion of the award pool, the school must attain a value-
added score of no less than 3, in other words achieve a year of academic growth as compared to
other schools with similar students.
Professional Development and Reciprocal Accountability Based on Evaluations
The professional development structures within TAP are designed to improve
instructional quality as part of the regular school culture. TAP‘s ongoing, job-embedded
professional development includes support mobilized by trained administrators, master teachers,
and mentor teachers. The SKR rubric used in the observations clearly outlines the practices of
effective teachers, and becomes a common language for talking about instruction among the

16 NIET Working Paper
school staff, both formally in cluster meetings and informally in teachers‘ many interactions.
Through the observation and post-observation feedback process, teachers have the opportunity to
identify areas of strength and weakness at several points in the year, which then becomes the
basis for ongoing support in the form of cluster meetings, coaching, and team teaching.
Classroom evaluation data and value-added scores guide leaders in the planning of professional
development directed toward the specific needs of the teachers in the school. Thus, the TAP
evaluation structure informs the process of collaborative teacher growth.
TAP Multiple Career Paths as an Enabling Structure
One of the critical issues in any personnel evaluation system is feasibility. If cost were no
object, we could have an expert in every classroom observing every teacher every day. To be
practical and effective, any classroom evaluation system must have an affordable structure in
place in the school with sufficient trained staff to carry out the observations, counsel teachers on
the results, and support teachers in their efforts to improve.
At the same time, there are highly skilled teachers who want to advance their careers and
earnings potential without becoming a school or district administrator. The TAP system provides
such individuals with the opportunity to become master or mentor teachers, largely responsible
along with their principals for the evaluation and professional growth elements of TAP in their
schools. Along with the certification process for evaluators, as described above, the TAP element
of multiple career paths provides a school with a cadre of trained professionals to carry out
classroom observations, lead cluster groups in professional growth based on the feedback
resulting from such observations, and mentor teachers in their professional growth process. This
is accomplished at less cost—and greater contextual awareness and effectiveness—than bringing
in outsiders to carry out classroom observations.
TAP Data Resources for Evaluation, Interpretation, and Improvement
The evaluation structure generates real-time data that school personnel can use in
decision-making. Many TAP schools opt to manage their teacher observations and performance-
based compensation calculations using a third-party Web-based application, the Comprehensive
Online Data Entry system (CODE), which was developed specifically for use in TAP schools.
Using CODE, authorized personnel can generate a number of analytical reports summarizing
A Teacher Evaluation System That Works 17
teacher performance. Reports on average total score and average on each performance standard
are available by whole staff, cluster, grade-level, subject-level, teacher type, and individual
teacher to assist with identification of the particular strengths and weaknesses that need
development within a school‘s faculty. NIET provides support to school personnel in how to
monitor and utilize data to inform school goals and planning, e.g., teachers‘ Individual Growth
Plans (IGP) and ongoing professional development within clusters.
IV. DATA AND METHODS
To answer the research questions, we examine the distributions of teacher SKR scores
and value-added scores for teachers in TAP schools during the 2006-07 and 2007-08 school
years. This gives us a sample of 1,830 teacher-level cases, with 1,432 unique teachers from 104
schools in 10 states; teachers with data for both years are counted twice, although by using
robust standard errors we avoid the assumption that the cases are all independent.
The data set comes from the CODE database used by TAP to track teacher observations
in detail along with value-added scores. The key variables are as follows:
Teacher SKR: This is an annual average of the scores received by the teacher from a
recommended four to six observations by principals and master/mentor teachers during the year.
It is also an average of the nineteen instructional rubric indicators and seven responsibility
indicators in the TAP Skills, Knowledge, and Responsibilities Performance Standards, weighted
as described in Appendix B. Because this is an average of many numbers, it is essentially a
continuous (real number) scale. For TAP evaluation and incentive purposes, it is rounded to the
nearest half-point, but the detailed records maintained by CODE allow us to use unrounded
numbers for greater precision.
Classroom Value Added: This is a whole number from 1 to 5, reflecting the achievement
growth of the teacher‘s students during one school year. As defined above in Section III, the
scores are converted from the original test score metric into an indicator of whether the teacher‘s
average student growth is significantly above or below one year‘s expected growth as compared
to the average student growth in the classrooms of other teachers with similar students.
Unfortunately, this conversion reduces the precision of our numbers. Since this variable always

18 NIET Working Paper
appears as a dependent variable in our models, its imprecision does not bias our findings.1
However, it does mean that the statistical properties of the models are less efficient than they
could be with better data. At present we do not have access to the underlying numbers for
enough teachers to conduct the analysis at that level.
Schoolwide Value Added: This is also a whole number from 1 to 5, reflecting the
achievement growth of all students in the school in tested grades and subjects. As above, this is
converted into a scale reflecting whether the school‘s average student growth is significantly
above or below one year‘s expected growth as compared to other schools with similar students.
Note that only teachers who received classroom value-added scores can be counted in
this analysis. However, the difference between high-, medium-, and low-performing schools is
based on schoolwide value-added scores that also reflect the contributions of teachers who do not
receive classroom value-added scores because they do not individually have enough students
with matched data in the scored grades or subjects.
Teacher SKR scores are centered on their school means, a process which can be thought
of as rescaling each teacher‘s SKR score with respect to the average SKR score in their school.
Mean-centering partially adjusts for any school-specific differences in how SKR scores are
assigned due to non-TAP factors or differences in TAP implementation.
Methods for Analyzing the Relationship Between SKR and Value Added
Research question (2) asks how well TAP‘s observational ratings align with student
growth outcomes. This depends on the statistical relationship between two types of measures: the
qualitative classroom evaluation resulting in SKR scores, and the outcomes-oriented value-added
assessment score. These measures differ in many ways. The former is based on standards for
teacher practice, while the latter is based on standards for student learning. The former consists
of multiple teacher observations per year, while the latter is based on an annual student
assessment. Observing the classroom allows for more nuance about the quality of instruction,
while measuring student growth gives a common metric for identifying the impact of
instructional quality.
1 Since the 1 to 5 scale is based on statistical significance, class size may be a factor that reorders these scores as
compared to the underlying scale, reducing precision. This analysis could also be slightly biased by any correlation
between class size and value added.

A Teacher Evaluation System That Works 19
Since both classroom observational rubrics and value-added statistical models are the
subject of ongoing research and occasional controversy, finding a strong relationship between
the two could be interpreted in various ways. If we were reasonably certain that the observational
rubric was the ―correct‖ measurement of performance, finding that it correlates well with value
added would serve as validation of the value-added method and model. On the other hand, with
reasonably high confidence in value added, a correlation with SKR scores would serve as
validation of the rubric that produced them. Current trends in research tend to support both types
of measures, but there is still no universal consensus on either approach. Thus, a correlation
between value added and SKR scores can be understood as parallel validation, where confidence
in both measures is reinforced by their agreement.
It is important not to expect perfect agreement between the two measures. One looks at
the classroom behavior of the teacher and the other looks at student achievement outcomes. In
theory, one affects the other, but does not perfectly predict the other. If it did, or in other words
there was a perfect correlation between the two measures, we would not need multiple measures.
We could simply choose the easiest one to implement, and let it stand for the entire evaluation of
the teacher. In reality, that is not the case, and the two different types of performance measures
should complement each other. On the other hand, if the two measures were uncorrelated or
negatively correlated, we would have to reconsider the theory and methods behind one or both of
them.
This study assumes that value added is reasonably accurate as a measure of the student
achievement outcomes that result from the teacher‘s performance during the year, and seeks to
validate the TAP observational rubric as a measure of quality teaching that leads to student
learning. However, given that the rubric is based on substantial research, finding a strong
relationship will also increase confidence in value added as an accurate measurement of the
outcomes resulting from qualitatively good instruction. The theory underlying TAP predicts that
they will be significantly correlated but not perfectly so.
Previous internal NIET studies of the correlation between SKR and value added were
limited by using only school-level data. In the data set used here, the correlation between
schoolwide value added and the average SKR score of a school is only 0.1459. That is positive,
but not significant at the school level. With teacher-level data and statistical models that

20 NIET Working Paper
distinguish between school effects and teacher effects, there is more power to find a correlation if
one exists.
We considered several statistical models to identify the relationship between value added
and SKR scores. These models rely on different assumptions about the data, so they should not
be interpreted here as equivalent analyses. Rather, they serve as tests of the sensitivity or
robustness of any findings to different assumptions.
The first of these is a simple linear regression (ordinary least squares or OLS) model:
j j jCVA SKR (1)
where CVAj is the Classroom Value Added for teacher j,
α is a regression intercept,
SKRj is the Skills, Knowledge, and Responsibilities score for teacher j,
β is the coefficient or slope on SKR, and
εj is a random disturbance or residual term.
This model has the advantage of simplicity, and OLS is widely used to provide the first
estimate of a relationship between two variables, as in this case. However, we know that TAP
schools can vary in the quality of their TAP implementation and in their overall effectiveness as
measured by the schoolwide value added. It seems likely that the relationship between CVA and
SKR might also vary between schools. Thus, we want to control for variability between schools
in some way. A simple model for doing that is to use fixed effects for schools. The advantage of
fixed effects is that it controls for all aspects of a school, observed or unobserved, that might
have an effect on classroom value-added scores that is the same for all teachers in the school.
This holds true whether or not the school effects are correlated with the other independent
variables in the model.
jk jk k jkCVA SKR (2)
where variables are defined as in (1), and
δk is the fixed effect for school k.
An alternative to the fixed effects model is the random effects model, which is sometimes
called a random intercepts model.
jk jk k jkCVA SKR (3)
where variables are defined as in (1), and

A Teacher Evaluation System That Works 21
τk is a random effect term at the school level.
This has the advantage of statistical efficiency as long as its assumptions are correct, but
it requires that the school effects not be correlated with the rest of the independent variable
expression. We used a Hausman specification test to check whether the modeling assumptions
behind this model are justified. This yielded an insignificant chi-squared statistic (Χ2=0.14),
meaning that random effects are consistent, and there is no reason to prefer fixed effects over
random effects.
Taking it a step further, we would like to know more about how schools with different
effects on the CVA-SKR relationship differ in other respects, rather than simply assigning them
an idiosyncratic effect and letting it go at that. One variable of interest for this purpose is the
school‘s overall effectiveness as measured by schoolwide value added. This immediately
presents a statistical problem to the extent that schoolwide value added and classroom value
added are correlated or are realizations of the same underlying factor.
One way to overcome this difficulty would be to use the previous school year‘s
schoolwide value added as a proxy or instrument for school effectiveness rather than the
contemporaneous schoolwide value added. However, this would only work for schools that have
been in TAP for at least a year, so the sample in the model might be biased. We test the
relationship between a school‘s experience in TAP and the correlation seen between its teachers‘
CVA and SKR scores in model (6), below.
Any concerns about using schoolwide value added in the same year as a conditioning
variable for individual value added can be dispelled by a closer look at what the two indicators
measure. Schoolwide value added is not simply the aggregate of classroom value added for two
reasons. First, schoolwide value added includes outcomes for students in the school who might
not have been counted in any teacher‘s classroom value-added score, perhaps because there were
too few students in one class with previous test data. Second, the schoolwide scores are
calculated separately from the classroom scores, and are converted to the TAP 5-point scale
based on the significance of comparisons between schools rather than between teachers. As a
result, the correlation between classroom and schoolwide value-added scores is only 0.42, which
is low enough to avoid serious problems with multicollinearity. However, the two variables are
in fact correlated, and any causal inferences based on this model need to be made with caution.

22 NIET Working Paper
A simple model controlling for schoolwide performance is a linear regression (OLS) with
schoolwide value added as a control variable:
jk jk k jkCVA SKR SWVA (4)
where variables are defined as in (1),
SWVAk is the schoolwide value added for school k, and
γ is the regression coefficient on schoolwide value added.
Models (2) through (4) allow schools or groups of schools to have different intercepts,
resulting in vertical displacements of the CVA-SKR line. However, schoolwide performance
might affect the slope of that line and not just the intercept. Following that logic, we also
estimated a hierarchical linear model (HLM) with school-specific slopes and intercepts, along
with schoolwide value added:
0
0
jk k k jk jk
k k k
k k k
CVA SKR
SWVA
SWVA
(5)
where variables are defined as in (3) and (4),
η and φ are school-level coefficients on SWVA, and
k and k are school-specific residuals.
Finally, we return to the possibility that a school‘s experience in TAP makes a difference
in the CVA-SKR relationship. This model is similar to (5), with the addition of a variable
indicating whether the school is a continuing or first-year TAP school. We also interacted that
variable with SKR, so that the two categories of schools would have different slopes in the
central CVA-SKR relationship. This model is:
jk jk k k jk jkCVA SKR CONT CONT SKR (6)
where variables are defined as in (1),
CONTk is a dummy variable indicating whether school k is continuing in TAP,
and and are regression coefficients.
The above models all assume that the outcome variable, CVA, lies on a continuous scale.
In fact, it consists of one out of five possible values on a 5-point categorical scale rather than a
continuous scale. To test whether our results depend on this assumption, we used an ordinal
logistic model. This avoids any assumptions about whether intervals on the CVA scale have any

A Teacher Evaluation System That Works 23
arithmetic meaning, and simply assumes that they are in the right order regardless of distance
apart. This model can be formalized as follows:
Pr( )
Pr( 1 )jk
jk k jk
CVA ii SKR SWVA i
(7)
where variables are defined as in (4), and
i is a classroom value-added score in the sequence {1,2,3,4,5}.
Other models are possible, but the above selection is enough to check how robust or
sensitive any findings might be to the specification of the linear model. We fitted the above
seven models in Stata using robust standard errors to account for the clustering of data.
Methods for Analyzing Differentiated Teacher Retention
We also test the hypothesis that the TAP evaluation system results in differential teacher
retention, or in other words, that higher-rated teachers tend to stay and lower-rated teachers tend
to leave. For this, we use CODE data as described above, with the additional assumption that a
teacher who appears in the CODE data in one year but drops out of the CODE data in the
subsequent year is no longer teaching in a TAP school. This assumption means that teachers who
move into administration, transfer to a non-TAP school, or take an extended leave of absence are
also included in turnover. Since leaves of absence and moves to administration are strictly
speaking not turnover, this overstates turnover. Any teacher who becomes a TAP master or
mentor teacher or transfers to another TAP school is included in retention. It is rare but possible
in the CODE system that a teacher who transfers to another TAP school is assigned a new
identification code, and is therefore wrongly counted in turnover instead of retention. Thus, our
estimates are conservative in that they may overstate turnover but are extremely unlikely to
overstate retention.
The model for this analysis is a logistic regression, with the probability of retention as the
dependent variable and the teacher‘s SKR score as the independent variable. Because there may
be schoolwide events or characteristics that affect the school‘s overall retention rate
independently from the individual teacher‘s performance, we use school-level fixed and random
effects models. A Hausman test yielded an insignificant chi-squared statistic (Χ2=0.00), meaning
that random effects are consistent. Thus, the random effects model was chosen for this analysis:

24 NIET Working Paper
Pr( 1) ( )jk jk k jkRetained F SKR (8)
where variables are defined as in (3),
Retainedj is a dummy variable indicating whether teacher j returned the next year,
and F() is the cumulative logistic distribution.
Additionally, we specified models similar to (8) in which the teacher‘s value-added score
for the current year or the previous year were included as independent variables.
V. RESULTS AND DISCUSSION
Does the TAP Evaluation System Differentiate Between Teachers?
The mean instructional rubric score for TAP teachers nationwide is 3.5 out of 5,
significantly different from the evaluation systems nationwide that rarely rate teachers below the
top two categories. The Skills, Knowledge, and Responsibilities (SKR) scores of TAP teachers
follow a mound-shaped distribution with a mean, median, and mode at a score of 3.5. Figure 4
shows this distribution in half-point increments, which is how SKR averages are rounded and
recorded for a school year.
Figure 4: Differentiated Teacher Evaluations in TAP
0%
5%
10%
15%
20%
25%
30%
35%
1.0 1.5 2.0 2.5 3.0 3.5 4.0 4.5 5.0
Percent of Teachers
Teacher Skills, Knowledge, and Responsibilities (1-5 Scale) Very few teachers receive overall scores of 1 or 5 because these are averages of many
indicators, each of which is on a 1 to 5 scale. To get an overall average of 1 on the indicators
A Teacher Evaluation System That Works 25
weighted as shown in the Appendix, a teacher would have to rate unsatisfactory on all indicators.
On the other hand, to get an overall average of 5 on the weighted indicators, a teacher would
have to rate exemplary on all indicators.
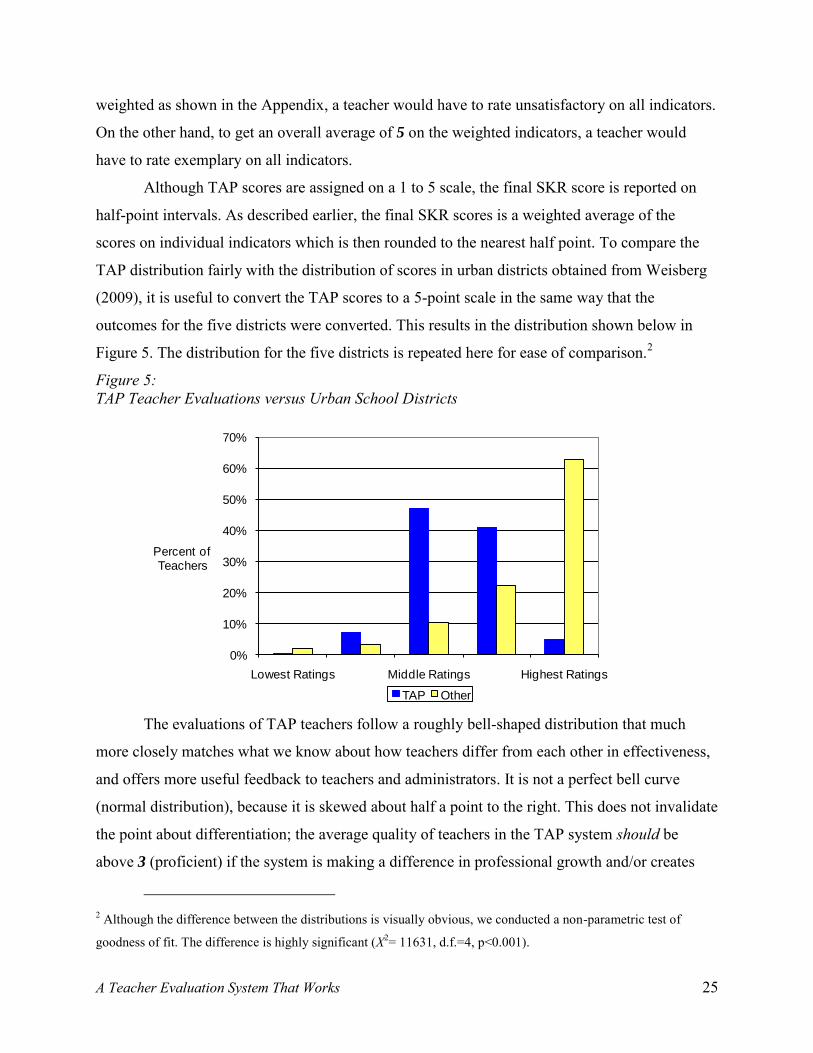
Although TAP scores are assigned on a 1 to 5 scale, the final SKR score is reported on
half-point intervals. As described earlier, the final SKR scores is a weighted average of the
scores on individual indicators which is then rounded to the nearest half point. To compare the
TAP distribution fairly with the distribution of scores in urban districts obtained from Weisberg
(2009), it is useful to convert the TAP scores to a 5-point scale in the same way that the
outcomes for the five districts were converted. This results in the distribution shown below in
Figure 5. The distribution for the five districts is repeated here for ease of comparison.2
Figure 5: TAP Teacher Evaluations versus Urban School Districts
0%
10%
20%
30%
40%
50%
60%
70%
Lowest Ratings Middle Ratings Highest Ratings
Percent of Teachers
TAP Other The evaluations of TAP teachers follow a roughly bell-shaped distribution that much
more closely matches what we know about how teachers differ from each other in effectiveness,
and offers more useful feedback to teachers and administrators. It is not a perfect bell curve
(normal distribution), because it is skewed about half a point to the right. This does not invalidate
the point about differentiation; the average quality of teachers in the TAP system should be
above 3 (proficient) if the system is making a difference in professional growth and/or creates
2 Although the difference between the distributions is visually obvious, we conducted a non-parametric test of
goodness of fit. The difference is highly significant (Χ2= 11631, d.f.=4, p<0.001).

26 NIET Working Paper
selection pressure that results in better retention of better teachers. There is evidence that both
professional growth and selection pressure are at work in TAP schools, as discussed later in this
section. The main point here is that the curve is roughly bell-shaped rather than geometrically
curving upward at the top end. Thus, the TAP system provides differentiated feedback for
teacher improvement, in contrast to the apparently inflated ratings found in many status quo
evaluation systems.
Classroom value-added scores are likewise distributed in an approximate bell curve,
again skewed toward the high side, as seen in Figure 6. Unlike the SKR scores, the comparison
implied in value-added scoring is not just among TAP teachers but also between TAP teachers
and others in their states. Thus, the fact that this distribution is skewed high indicates a higher
level of effectiveness for TAP teachers than is average for their states. Again, the key point here
is that classroom value added does not automatically award the highest scores to most teachers,
but differentiates between high and low effectiveness.
Figure 6: Distribution of Classroom Value Added for TAP Teachers in States Using EVAAS Scores, 20083
0%
10%
20%
30%
40%
50%
1 2 3 4 5
Percent of
Teachers
Classroom Value Added
Finally, schoolwide value-added scores also tend to be distributed across the spectrum,
although here there is clearly a higher percentage of TAP schools receiving 5s than for any other
score, as shown in Figure 7. This indicates a higher level of effectiveness for TAP schools than is
average for their states. However, there is a key difference between schoolwide value added and
3 Ninety-six percent of the value-added scores analyzed in this paper come from a single provider, SAS® EVAAS®
for K-12. Statistical runs excluding non-EVAAS scores did not weaken the findings.

A Teacher Evaluation System That Works 27
classroom value added that helps explain why the schoolwide distribution (Figure 7) results in a
much larger percentage of 5s than does the classroom distribution (Figure 6). The TAP 1-5 scale
for reporting value-added results is based on statistical significance, which increases with sample
size. Since schools are inevitably larger than classrooms, schoolwide scores are more likely to be
significant than classroom scores, even when the student growth is the same in both cases. This
does not represent score inflation, since a statistical confidence level of at least 95% to report a
school as a 5 is still a high hurdle. It is clear from Figure 7 that the scale identifies some schools
at every level of effectiveness.
Figure 7: Distribution of Schoolwide Value Added for TAP Schools in States Using EVAAS Scores, 2008 and 2009
7%
16%
33%
4%
41%
7%4%
21%
12%
56%
0%
10%
20%
30%
40%
50%
60%
1 2 3 4 5
Percent of Schools
Schoolwide Value Added
Schoolwide Value Added Results, 2008 and 2009(TAP schools using EVAAS value added scores)
2008 (n=116) 2009 (n=138)
Are the Qualitative Component and the Impact Component Aligned?
A higher quality of instruction in the classroom would be expected to lead to greater
student gains on standardized achievement tests. Our analysis reveals a strong relationship
between observed teacher ratings (SKR) and value-added indicators of student learning.
Figure 8 shows the relationship according to our simple regression model (Model 1). This
graph omits SKR scores below 2.5 and above 4.5 because relatively few teachers receive scores

28 NIET Working Paper
at those extremes. The figure shows the mean value-added score for each SKR score, along with
bands indicating one standard deviation (SD) above and below the mean. The regression fit line
is also shown. With a highly significant slope of 0.598, this means that for every point that a
teacher‘s SKR score improves, their value added improves on average by more than half a point.
The wide distribution of value-added scores, as shown by the SD bands, reflects the fact that
there is much more than the teacher‘s SKR influencing the growth of students in the classroom
over the course of a year; that is a strong argument for multiple measures rather than depending
on SKR or value added alone. However, the positive slope of the regression line and its statistical
significance confirm that TAP classroom evaluations are strongly related to value-added
assessments of teacher performance in terms of student growth.
Figure 8. Relationship between SKR and Value Added, Simple Regression Model
1
2
3
4
5
2.5 3.0 3.5 4.0 4.5
Teacher's Value-Added Score
Teacher's Skills, Knowledge, and Responsibilities Score
Mean
-1 SD
+1SD
Fit Line
Scores are from TAP schools for the 2006-2007 and 2007-2008 school years. n = 1,780 teachers
This relationship holds up quite robustly in our more complex models. The school fixed
effects and random effects obtain virtually the same results. In the three-variable hierarchical
model (Model 5), we see a highly significant slope of 0.522 on average. While this slope is not
quite as strong as that shown by the simpler model, it still means that an improvement of one

A Teacher Evaluation System That Works 29
SKR point results in more than half a point improvement in value added on average. The
similarity of results from these models suggests that the OLS model is sufficiently robust for this
analysis. Aside from this confirmation, the results from the hierarchical model also confirm that
the positively-sloped relationship holds up within each category of schoolwide performance.
Figures 9, 10 and 11 below show the same results as above in Figure 8, but separated by
the performance category of the school. The fit lines on these graphs reflect the OLS model
(Model 1) run separately for each category of school. They indicate that the HLM model (Model
5), combining all three categories into a single regression but estimating their slopes separately,
is appropriate. Figure 12 displays the three fit lines from a combined HLM regression.
Figure 9. Relationship between SKR and Value Added in Low-Performing Schools
1
2
3
4
5
2.5 3.0 3.5 4.0 4.5
Teacher's Value Added Score
Teacher's Skills, Knowledge, and Responsibilities Score
Mean
-1 SD
+1SD
Fit Line
Low-Performing Schools: n=449 teachers, with schoolwide value added 1 or 2

30 NIET Working Paper
Figure 10. Relationship between SKR and Value Added in Medium-Performing Schools
1
2
3
4
5
2.5 3.0 3.5 4.0 4.5
Teacher's Value Added Score
Teacher's Skills, Knowledge, and Responsibilities Score
Mean
-1 SD
+1SD
Fit Line
Medium-Performing Schools: n=649 teachers, with schoolwide value added 3
Figure 11. Relationship between SKR and Value Added in High-Performing Schools
1
2
3
4
5
2.5 3.0 3.5 4.0 4.5
Teacher's Value Added Score
Teacher's Skills, Knowledge, and Responsibilities Score
Mean
-1 SD
+1SD
Fit Line
High-Performing Schools: n=682 teachers, with schoolwide value added 4 or 5

A Teacher Evaluation System That Works 31
Figure 12. Relationship between SKR and Value Added, Hierarchical Model Fit Lines
1
2
3
4
5
1 2 3 4 5
Teacher's Value-Added Score
Teacher's Skills, Knowledge, and Responsibilities Score
In High-Performing Schools
In Medium-Performing Schools
In Low-Performing Schools
High-Performing Schools: n=682 teachers, with schoolwide value added 4 or 5 Medium-Performing Schools: n=649 teachers, with schoolwide value added 3 Low-Performing Schools: n=449 teachers, with schoolwide value added 1 or 2 Scores are from 2006-2007 and 2007-2008 school years.
The HLM model indicates that teachers in high-performing schools are more likely to
have higher individual value added than others with the same SKR at low-performing schools.
The school-level random effect is highly significant (p<0.01), as is the coefficient on schoolwide
value added (p<0.01). As discussed above in the modeling section, this result is not
mathematically trivial, which would be the case if schoolwide value added were simply the
aggregate of teacher value added. The correlation between teacher and schoolwide value added is
0.42, which may explain some but certainly not the majority of the difference between high-
performing and low-performing schools seen in Figure 12. So this result suggests that there is a
schoolwide effect on teacher effectiveness that is separate from the aggregate of teacher effects
on schoolwide effectiveness. In other words, the results of this analysis may be evidence that the
whole is indeed greater than the sum of the parts.
Model 6 tests the hypothesis that a school‘s experience in TAP also affects the slope of
the CVA-SKR relationship, since the skills of the leadership team applying the TAP rubrics in
observational evaluations should increase over time. This model shows positive but insignificant

32 NIET Working Paper
effects of being a TAP-experienced school versus a new TAP school. It turns out that TAP
experience is correlated with schoolwide value added; schools with more than one year in TAP
have schoolwide value added scores 0.567 points higher than schools with one year in TAP
(p<0.01). Thus, the coefficients on those predictors in Model 6 are not easily interpreted due to
their high correlation. However, a Wald test of joint significance shows that TAP experience and
schoolwide value added are jointly significant, and the CVA-SKR slope—the primary focus of
this analysis—remains highly significant in this model.
We tested the sensitivity of our results to the treatment of classroom value added as a
continuous scale rather than as a 5-point categorical scale. The results from the ordered logistic
regression (Model 7) are not directly comparable with the other models because the outcome is a
probability instead of a score. However, the coefficient on the teacher‘s SKR is still positive and
highly significant (log odds coefficient = 0.8597; odds ratio = 2.3626). For each increase of one
full point in the teacher‘s SKR, the odds of getting a full point higher value-added score more
than doubled. This confirms that our positive results are not simply an artifact of the linear
model, but show up even with a very different functional form.
Additional graphing exercises showing data points or quantiles of the conditional
distributions of scores proved sensitive to the fact that the value-added scale is categorical rather
than continuous. This means that the ordered logistic regression (Model 7) is the most
appropriate model among those we have highlighted. This model confirms the positive slope and
significance of the fit lines from the linear models, even though those fit lines are not to be taken
as exact outcomes. The linear models would become more precise if we used each teacher‘s
underlying value-added score instead of the 1-5 scale; we are in the process of obtaining and
organizing the data necessary to do such an analysis as a follow-up to this study.
Meanwhile, the fit lines from the linear models shown above serve as a useful heuristic, a
way to visualize the basic finding of this analysis as confirmed by the ordered logistic regression.
The relationship of interest, the coefficient on the teacher‘s SKR indicating its correspondence to
the teacher's classroom value added, is positive and highly significant. The results for all seven
models relating SKR to value added are summarized in Table 1.

A Teacher Evaluation System That Works 33
Table 1. Regression Results
Simple OLS (1)
Fixed School Effects
(2)
Random School Effects
(3)
OLS with SWVA
(4)
HLM with SWVA
(5)
Continuing vs. 1
st-Yr.
School (6)
Ordered Logistic
(7)
School Years 2006-07 2007-08
2006-07 2007-08
2006-07 2007-08
2006-07 2007-08
2006-07 2007-08
2007-08 2006-07 2007-08
n (teachers) 1830 1830 1830 1780 1780 1071 1780
R2 .0452 .2636 .2525 .2078 .2474 .3306 .0782
F 106.6 (1, 155)
***
80.57 (1, 103)
***
183.64 (2, 151)
***
Wald chi2
83.22
(1) ***
325.85
(2) ***
220.08 (3)
***
260.31 (2)
***
Coefficient on Centered SKR
.5597 (.0542)
***
.5132 (.0572)
***
.5161 (.0587)
***
.4985 (.0548)
***
.4965 (.0566)
***
.5671 (.0681)
***
.8712 (.1022)
***
Coefficient on Schoolwide VA
.3505 (.0264)
***
.3560 (.0232)
***
.3807 (.0333)
***
SD of Random Effect for School
.5501
(.0566) ***
.1780
(.0500) ***
.2676 (.0490)
***
Standard errors for coefficients and degrees of freedom for F and chi2 statistics are in parentheses.
Significance indicators: *** significant at .01 level, ** significant at .05 level, * significant at .10 level
These results provide an important validation of the qualitative and outcomes-based
indicators. They measure the same thing—excellence in teaching—from two different
perspectives: teacher behavior and student achievement outcomes. When teachers demonstrate
strong instructional skills as measured by the TAP observation methods and rubrics, their
students show higher academic growth regardless of previous achievement and socioeconomic
status.
Is There Evidence of Improvement Due to Professional Growth?
TAP results show a steady improvement in observed skills during the course of the
school year. Figure 13 shows recent improvement for teachers in TAP nationally. This shows the
improvement in instructional quality scores over a two-year period. In the data shown, despite a
slight dip over the summer, teachers demonstrated an overall path of improvement that continued
over both years.

34 NIET Working Paper
This graph is based on a sample including all TAP schools during the years 2007-2009.
We tracked a cohort of 650 teachers through observations grouped into six periods in fall, winter
and spring of the 2007-2008 and 2008-2009 school years. The cohort was composed of teachers
working in TAP schools both years, with observations in each of the observation periods.
Teachers present in only one school year or whose observations clustered around the same time
frame were excluded from the sample. Including teachers present in only some of the periods
would have complicated efforts to compare the level of instructional quality at different time
points since each average could reflect substantially different groups of teachers.
Figure 13. Improvement in Observed Teacher Skills, National Cohort, 2007-2008 and 2008-2009
3.1
3.2
3.3
3.4
3.5
3.6
3.7
3.8
3.9
Fall 2007-2008
Winter 2007-2008
Spring 2007-2008
Fall 2008-2009
Winter 2008-2009
Spring 2008-2009
Ave
rage
Po
ints
on
1-5
Sca
le
Average of Instructional Domain indicators for 2007-2009 cohort (N = 650 teachers)
The graph shows consistent within-year growth. If the SKR rubrics were arbitrary
institutional measures or the assessments of only one rater, this trend might simply represent
mere compliance. However, the SKR rubrics embody a multi-dimensional research-based
description of high-quality teaching, are aligned with year-long professional development on
strategies to improve teaching along the same dimensions, and are rated by different observers
during the year. Thus, these gains show teachers‘ responsiveness to the explicit standards and
expectations communicated to them throughout the year.
This result for SKR scores taken at multiple points during a two-year period is confirmed
by looking at annual SKR scores taken over multiple years. For the school years 2005-2006

A Teacher Evaluation System That Works 35
through 2008-2009, for teachers with matched records over consecutive years (n=4,882 teacher-
year cases), the average growth in SKR from one year to the next was 0.154 points on the 1-5
scale, or an effect size of 0.269 standard deviations of the SKR distribution. Within this overall
improvement, teachers with lower SKR scores to begin with showed the most improvement. For
teachers with previous-year SKR scores less than 3, the average one-year growth was 0.511
points, or an effect size of 0.896 standard deviations. For teachers with previous-year SKR
scores of 3 or greater, the average one-year growth was 0.111 points, or an effect size of 0.194
standard deviations. Some of the growth seen among lower-scoring teachers may be explained
by regression to the mean. However, higher-scoring teachers did not lose ground at the same
time, so regression to the mean is not the primary explanation. On average, teachers at every
performance level improved, but teachers with lower performance scores in the previous year
showed the most improvement.
Without a comparison group, we cannot show the trend attributable to TAP apart from
maturation. There is research evidence that teachers generally become more effective with each
year of experience for the first few years of their careers, and then level off after that (Gordon,
Kane & Staiger, 2006). However, the same research shows that initially low-performing teachers
are still likely to remain low-performing over time. Some of the TAP results shown here might
also be due to score inflation, although that appears unlikely due to the greater improvement
shown by lower-scoring teachers, the rigorous recertification requirements for TAP evaluators
and the attention given to interrater reliability within TAP schools. What the TAP results
demonstrate is that teachers in TAP schools improve in instructional quality over time, and that
weaker teachers improve more rapidly than do more proficient teachers. More data and research
are needed to establish how much true improvement this represents as compared to improvement
among non-TAP teachers.
Is There Evidence of Improvement Due to Differential Retention?
There is also evidence of improvement in the quality of the teaching staff at TAP schools
as a result of differences between teachers in retention and turnover related to their quality of
instruction. We tested this hypothesis with the same CODE data as described above, using Model
(8), the logistic regression of retention on SKR. The results were highly significant (p<0.001).
As illustrated in Figure 14, for each point higher that a teacher‘s SKR score is in one year, the

36 NIET Working Paper
teacher‘s odds of remaining in a TAP school the following year increase by 87% (odds ratio =
1.8699). Translating this into a difference in the probability of retention depends on which points
on the SKR scale are being compared. However, as an example, a teacher with a 4.0 SKR score
is about a third more likely to stay in TAP than a teacher with a 2.0 SKR score. Figure 15 shows
the same relationship, inverted to emphasize that teachers with lower classroom evaluation
scores are more likely to leave a TAP school.
This difference in teacher retention as it relates to quality is consistent with the theory
that the TAP system motivates good teachers to stay, while giving less effective teachers both an
opportunity to improve and an incentive not to stay where they are less likely to receive high
ratings and bonuses. Since observational ratings are correlated with student value added, this
selection process will result in a more effective teaching staff and greater student growth over
time.
Figure 14. Relationship between Teacher Ratings and Retention
25%
50%
75%
100%
1.0 1.5 2.0 2.5 3.0 3.5 4.0 4.5 5.0
Probability of Retention into Following Year
Teacher's Skills, Knowledge, and Responsibilities Score
n = 7,377 teacher-year cases from 2005 through 2009 Retention includes teachers who stayed in TAP, including master and mentor teachers. Retention does not include teachers who became administrators, moved to non-TAP schools, or left teaching.

A Teacher Evaluation System That Works 37
Figure 15. Relationship between Teacher Ratings and Turnover
0%
25%
50%
75%
1.0 1.5 2.0 2.5 3.0 3.5 4.0 4.5 5.0
Probability of Turnover Before
Following Year
Teacher's Skills, Knowledge, and Responsibilities Score
n = 7,377 teacher-year cases from 2005 through 2009 Turnover includes teachers who became administrators, moved to non-TAP schools, or left teaching. Turnover does not include teachers who stayed in TAP, including master and mentor teachers.
It is also instructive to look at the relationship between retention and value added. There
is a positive relationship, but not as strong as the above relationship with SKR scores. For every
full point higher that a teacher‘s value added is for a given year, the odds of retention into the
following year increase by 11% (odds ratio = 1.1117). In part, the weaker relationship is
probably due to the fact that fewer teachers receive classroom value-added scores than classroom
observation scores, so there is not as much data for this analysis.
However, we hypothesize that the key value-added score in teacher retention is not the
one for the year immediately preceding the teacher‘s retention decision, but the year prior to that.
Teachers do not know their value-added scores for the most recent year at the time they decide
whether to return to the school. For example, a teacher‘s value-added score for the 2007-08
school year would have been released to the teacher in approximately November 2008,
depending on the state. That is too late to influence a career decision that would have been made
between June and August 2008. To test this hypothesis, we ran the same analysis with lagged
value-added scores, e.g. the relationship between 2006-07 value added and the teacher‘s
retention from the 2007-08 school year into the 2008-09 school year. This relationship is about

38 NIET Working Paper
twice as strong as the relationship between retention and the most recent value added. For every
full point higher that a teacher‘s previous value-added score was, the odds of retention increase
by 27% (odds ratio = 1.2690).
This serves as confirmation that TAP schools are retaining higher-quality teachers, but it
also suggests a link between the teachers‘ retention decisions and the evaluation system. The
retention of higher-quality teachers may be the result of self-selection, with teachers who are
fairing poorly also being those who feel on their own teaching is not their calling. However, we
suggest that the availability of high-quality feedback facilitates more accurate self-reflection to
inform career decisions. The feedback that appears to make the strongest impression on a teacher
making a career decision at the end of a school year is the SKR score he or she received for the
year. A teacher‘s most recently disclosed value-added score, coming about six months after the
fact and six months before he or she faces a retention decision, carries less weight. But it is still
more closely related to the decision than the most recently earned, but still unknown, value-
added score for the year just ended. In other words, the SKR with its real-time feedback appears
to make a difference in whether TAP teachers choose to return. As a result of this self-selection
process, the composition of the teaching staff in a TAP school shifts over time toward more
skilled, effective teachers.
VI. CONCLUSIONS
The evidence that individual teachers matter is based on a wide body of research. It has
been established that differences in effectiveness between teachers provide the best available
explanation for differences in achievement growth between students once student background is
controlled for through value-added analysis. This being the case, one would expect a useful
teacher evaluation system to reveal those differences between teachers. One would also expect
the observational component of an evaluation system to be aligned with value-added evidence of
teacher impact on student learning.
Of course, the goal of teacher evaluation is not simply to identify differences, but to
improve the quality of teaching and learning for all students. Thus, one would also expect a
useful evaluation system to provide constructive, real-time feedback to teachers for professional

A Teacher Evaluation System That Works 39
growth during the school year in a context of applied, on-site teamwork. And there should be
evidence that the quality of teaching actually improves over time.
Our findings show that TAP provides a structure of teacher evaluation and support that
meets these criteria:
TAP evaluation scores are not all skewed at the top of the scale as in a typical
district evaluation system, but reveal a spectrum of teacher performance that better
matches what we know about the real-world distribution of teacher effectiveness.
TAP‘s procedures for quality control through extensive training and certification of
schools‘ leadership teams prepares classroom evaluators to differentiate effectiveness
among teachers using the TAP rubrics. Additionally, classroom and schoolwide value
scores assigned are distributed at every level of effectiveness. Evaluations that are not
highly inflated and that do not perpetuate inflated expectations for unvaryingly high
ratings can be used productively in human resource decisions, such as professional
development, hiring, retention, and compensation.
Classroom evaluation scores and value-added scores are well-aligned, and the
analyses conducted confirm that observed instructional quality predicts student
learning gains. In TAP schools, teachers with high value-added performance tend to
be those who demonstrate a high level of instructional quality. TAP uses multiple
measures to assess teacher performance, which provide complementary windows into a
teachers‘ performance. The strong relationship between the qualitative and value-added
components of TAP‘s evaluation structure provides parallel validation for the other as an
accurate measure of a teacher‘s instructional quality.
There is a TAP school-wide effect on performance that is different from the sum of
the teacher effects. We found school-level effects on classroom value-added when
modeled simultaneously with teacher instructional quality ratings. This suggests that
high-performing TAP schools differ from other TAP schools not simply because their
teachers are better to begin with, but because as schools they more successfully carry out
the site-based collaborative approach to growth and accountability that is expected of
TAP schools. Separately from this project, we are conducting qualitative research in TAP
schools to explore the differences between high- and low-performing schools. Based on
that work to date, we hypothesize that the high-performing schools are those with a high

40 NIET Working Paper
level of instructional leadership from principals and master and mentor teachers,
consistent implementation of the elements of TAP, and a high level of discourse about
instruction and agreement on teaching quality informed by the TAP rubrics, leading to
more consistently applied ratings and in turn supporting better instruction throughout the
school. The above finding that school-wide effects matter in analyzing teacher
effectiveness suggests that further research on this hypothesis is worthwhile.
The evidence shows growth over time in the quality and effectiveness of teaching in
TAP schools, both through the improvement of individual teachers on demonstrated
effectiveness, and through retaining more effective teachers to continue teaching in
the school. TAP‘s evaluation structure is focused on instructional effectiveness and is
integrated with a system of support for improvement. This study provides evidence that
the TAP evaluation structure in tandem with the other elements of TAP succeeds in
raising teacher and student performance.
These findings have implications for policy and practice. As educators and policymakers
work to improve the quality of education in American schools, one central focus of their efforts
is the evaluation of teachers. Although teacher evaluation by itself is sometimes criticized as
arbitrary, one-dimensional, undifferentiated, disconnected from the needs of students, and/or
unaligned with professional development opportunities for improvement, this study shows that a
well-designed system can be objective, rigorous, differentiated, multidimensional, linked to
student learning and supportive of teacher improvement.
Underlying these abstractions are many concrete details of design and implementation, as
described in Section III of this paper. Creating the capacity for evaluation and evaluation-guided
improvement in schools requires the right tools as well as the sustained engagement of teachers
and leaders. The example of TAP implies that teacher evaluation should not be pursued as a one-
time, one-size-fits-all policy prescription, but should be integrated within a comprehensive, site-
based system with specific practical elements to support teachers and improve teaching and
learning in the classroom.

A Teacher Evaluation System That Works 41
REFERENCES
Agam, K., Reifsneider, D., & Wardell, D. (2006). The Teacher Advancement Program: National
teacher attitudes. National Institute for Excellence in Teaching.
Agam, K., & Wardell, D. (2007). 2007 Annual TAP principal survey: Select findings. National
Institute for Excellence in Teaching.
Ames, C. (1992). Classrooms: Goals, structures, and student motivation. Journal of Educational
Psychology, 84(3), 261-271.
Ballou, D., Sanders, W., & Wright, P. (2004). Controlling for student background in value-added
assessment of teachers. Journal of Educational and Behavioral Statistics, 29:1, 37-65.
Belmont, J. M. (1989). Cognitive strategies and strategic learning. American Psychologist, 44(2),
142-148.
Blumenfeld, P. C. (1990). Classroom learning and motivation: Clarifying and expanding goal
theory. Journal of Educational Psychology, 84(3), 272-281.
Brandt, R. M. (1995). Teacher evaluation for Career Ladder and Incentive Pay Programs. In D.
L. Duke (Ed.), Teacher Evaluation Policy: From Accountability to Professional
Development (pp. 13-34). Albany: State University of New York Press.
Bransford, J. D., Sherwood, R. S., Vye, N. J., & Reiser, J. (1986). Teaching thinking and
problem solving: Research foundations. American Psychologist, 41(10), 1078-1089.
Brophy, J., & Good, T. (1986). Teacher behavior and student achievement. In M. Wittrock (Ed.),
Handbook of research on teaching (pp. 340-370). New York: Macmillan.
Career in Teaching Governing Panel. (1999). Teacher evaluation guide: Process for the
supervision and evaluation of district personnel teachers. Rochester: Rochester City
School District.
Cohen, E. G. (1994). Restructuring the classroom: Conditions for productive small groups.
Review of Educational Research, 64(1), 1-36.
Cuban, L. (1993). How teachers taught: Constancy and change in American classrooms 1880-
1990 2nd edition. New York: Teachers College Press.
Danielson, C. (1996). Enhancing professional practice: A framework for teaching. Alexandria,
VA: ASCD.

42 NIET Working Paper
Darling-Hammond, L., Wise, A. E., Pease, S. R. (1983). Teacher evaluation in the organizational
context: A review of the literature. Review of Educational Research, 53(3), 285-328.
Darling-Hammond, L. (1986). A proposal for evaluation in the teaching profession. The
Elementary School Journal, 86(4), 530-551.
Darling-Hammond, L. (1990). Teacher evaluation in transition: Emerging roles and evolving
methods. In J. Millman & L. Darling-Hammond (Eds.) The new teacher handbook of
teacher evaluation: Assessing elementary and secondary school teachers. Newbury Park:
Sage.
Donovan, S. Bransford, J. D., & Pellegrino, J. W. (2000). How people learn: Bridging research
and practice. Washington, D.C.: National Academic Press (Commission on Behavioral
and Social Sciences and Education National Research Council).
Duke, D. & Stiggins, R. J. (1990). Beyond minimum competence: Evaluation for professional
development. In J. Millman & L. Darling-Hammond (Eds.), The new handbook of teacher
evaluation: Assessing elementary and secondary school teachers (pp. 116-132). Newbury
Park: Sage.
Dweck, C. S. (1999). Caution—praise can be dangerous. American Educator, 23(1), 4-9.
Ellett, C. D. (1997). Classroom-based assessments of teaching and learning. In J. Stronge (Ed.)
Evaluating teaching: A guide to current thinking and practice (pp. 107-128). Thousand
Oaks: Corwin.
Ellett. C. D. & Garland, J. S. (1987). Teacher evaluation practices in our largest school districts:
Are they measuring up to ‗state-of-the-art‘ systems? Journal of Personnel Evaluation in
Education, 1(1), 69-92.
Ellet, C. D. & Teddlie, C. (2003). Teacher evaluation, teacher effectiveness, and school
effectiveness: Perspectives from the USA. Journal of Personnel Evaluation in Education,
17(1), 101-128.
Frase, L. E. & Streshly, W. (1994). Lack of accuracy, feedback and commitment in teacher
evaluation. Journal of Personnel Evaluation in Education, 8(1), 47-57.
Gallagher, H. A. (2004). Vaughn Elementary‘s innovative teacher evaluation system: Are
teacher evaluation scores related to growth in student achievement? Peabody Journal of
Education, 79(4), 79-107.
Gage, N. L., & Needels, M. C. (1989). Process-product research on teaching: A review of

A Teacher Evaluation System That Works 43
criticisms. Elementary School Journal, 89(3), 253-300.
Goe, L. (2007). The link between teacher quality and student outcomes: A research synthesis.
Washington, D.C.: National Comprehensive Center for Teacher Quality.
Goe, L., Bell, C. & Little, O. (2008). Approaches to evaluating teacher effectiveness: A research
synthesis. Washington, D.C.: National Comprehensive Center for Teacher Quality.
Good, T. L. & Mulryan, C. (1990). Teacher ratings: A call for teacher control and self-
evaluation. In J. Millman & L. Darling-Hammond (Eds.) The new teacher handbook of
teacher evaluation: Assessing Elementary and Secondary School Teachers. Newbury
Park: Sage.
Goldhaber, D. D. & Brewer, D. J. (1997). Why don‘t schools and teachers seem to matter?
Assessing the impact of unobservables on educational productivity. Journal of Human
Resources, 32(3), 505-23.
Goldhaber, D. D. & Brewer, D. J. (2000). Does teacher certification matter? High school
teacher certification status and student achievement. Educational Evaluation & Policy
Analysis, 22(2), 129-45.
Gordon, R., Kane, T. J., & Staiger, D. O. (2006). Identifying effective teachers using
performance on the job. Washington, D.C.: The Brookings Institution.
Graham, S. (1984). Teacher feelings and student thoughts: An attributional approach to affect in
the classroom. Elementary School Journal, 85(1), 91-104.
Greenwald, R., Hedges, L . V., & Laine, R. D. (1996). The effect of school resources on student
achievement. Review of Educational Research, 66(3), 361-396.
Haefele, D. L. (1993). Evaluating teachers: A call for change. Journal of Personnel Evaluation
in Education, 7(1), 21-31.
Hanushek, E. A., and Rivkin, S. G. (2006). Teacher quality. In Hanushek, E.A., and Welch, F.
(Eds.), Handbook of the economics of education. Amsterdam: Elsevier.
Hazi, H. M., & Arredondo Rucinski, D. (2009). Teacher evaluation as a policy target for
improved learning: A fifty-state review of statute and regulatory action since NCLB.
Education Policy Analysis Archives, 17(5). Available online at
http://epaa.asu.edu/epaa/v17n5/
Holtzapple, E. (2003). Criterion-related validity evidence for a standards-based teacher
evaluation system. Journal of Personnel Evaluation in Education, 17(3), 207-219.
44 NIET Working Paper
Jerald, C. (2009). Aligned by design: How teacher compensation reform can support and
reinforce other educational reforms. Washington, D.C.: Center for American Progress.
Available online at
http://www.americanprogress.org/issues/2009/07/pdf/teacher_alignment.pdf
Jacob, B. A. & Lefgren, L. (2008). Can principals identify effective teachers? Evidence on
subject performance evaluation in education. Journal of Labor Economics, 26(1), 101-
136.
Jordan, H., Mendro, R., & Weerasinghe, D. (1997). Teacher effects on longitudinal student
achievement. Dallas: Dallas Independent School District.
Kellor, E. M. (2005). Catching up with the Vaughn express: Six years of standards-based teacher
evaluation and performance pay. Education Policy Analysis Archives, 13(7). Available
online at http://epaa.asu.edu/epaa/v13n7./
Koppich, J., Asher, C., & Kerchner, C. (2002). Developing careers, building a profession: The
Rochester Career in Teaching plan. New York: National Commission on Teaching &
America‘s Future.
Krajcik, J., Blumenfeld, P. C., Marx, R. W., Bass, K. M., Fredricks, J. & Soloway, E. (1998).
Inquiry in project-based science classrooms: Initial attempts by middle school students.
Journal of the Learning Sciences, 7(3-4), 313-350.
Licht, B. G., & Dweck, C. S. (1984). Determinants of academic achievement: The interaction of
children‘s achievement orientations with skill area. Developmental Psychology, 20(4),
628-636.
Little, O. (2009). Teacher evaluation systems: The window for opportunity and reform. National
Education Association.
Loup, K. S., Garland, J. S, Ellett, C.D., & Rugutt, J. K. (1996). Ten years later: Findings from a
replication of a study of teacher evaluation practices in our 100 largest school districts.
Journal of Personnel Evaluation in Education, 10(3), 203-226.
Medley, D. M., & Coker, H. (1987). The accuracy of principals‘ judgments of teacher
performance. Journal of Education Research, 80(4), 242-247.
Kimball, S. M., White, B., Milanowski, A.T., & Borman, G. (2004). Examining the relationship
between teacher evaluation and student assessment results in Washoe County. Peabody
Journal of Education , 79(4), 54-78.

A Teacher Evaluation System That Works 45
Miller, R. (2009). Adding value to discussions about value-added. Washington, D.C.: Center for
American Progress.
Mitchell, D. E., Kerchner, C.T., Erck, W. & Pryor, G. (1981). The impact of collective
bargaining on school management and policy. American Journal of Education, 89(2),
147-188.
Odden, A., Milanowski, A. & Youngs, P. (1998). Teacher knowledge and skill assessments and
teacher compensation: An overview of the measurement and linkage issues. Journal of
Personnel Evaluation in Education, 12, 83-102.
Perkins, D. N. (1984). Creativity by design. Educational Leadership, 42(1), 18-25.
Perkins, D. N. & Simmons, R. (1988). Patterns of misunderstanding: An integrative model for
science, math, and programming. Review of Educational Research, 58(3), 303-326.
Peterson, K. D. (2000). Teacher evaluation: A comprehensive guide to new directions and
practices 2nd edition. Thousand Oaks: Corwin Press.
Peterson, K. D. (2004). Research on school teacher evaluation. NASSP Bulletin, 88(639), 60-79.
Piaget, J. (1926). The language and thought of the child. New York: Harcourt Brace.
Pressley, M., & Wharton-McDonald, R. (1997). Skilled comprehension and its development
through instruction. School Psychology Review, 26(3), 448-466.
Rivkin, E. A., Hanushek, E. A., & Kain, J. F. (2001). Teachers, schools, and academic
achievement. Washington, D.C.: National Bureau of Economic Research.
Rockoff, J. E. (2004). The impact of individual teachers on student achievement: Evidence
from panel data. The American Economic Review, 94(2), 247-252.
Rogoff, B. (1990). Apprenticeship in thinking: Cognitive development in sociocultural activity.
New York: Oxford University Press.
Rosenshine, B., & Stevens, R. (1986). Teaching functions. In M. Wittrock (Ed.), Handbook of
research on teaching 3rd edition. New York: Macmillan.
Rowan, B., Correnti, R., & Miller, R.J. (2002). What large-scale survey research tells
us about teacher effects on student achievement: Insights from the Prospects study of
elementary schools. Teachers College Record, 104, 1525-1567.
Rowley, J. B. (1999). High performance mentoring: Facilitator’s guide. Thousand Oaks: Corwin
Press.
Sanders, W. L. and Horn, S. P. (1998). Research findings from the Tennessee value-added

46 NIET Working Paper
assessment system (TVAAS) database: Implications for educational evaluation and
research. Journal of Personnel Evaluation in Education, 12(3), 247-256.
Schacter, J., Schiff, T. Thum, Y. M., Fagnano, C., Bendotti, M., Solmon, L., Firetag, K., &
Milken, L. (2002). The impact of the Teacher Advancement Program on student
achievement, teacher attitudes, and job satisfaction. National Institute for Excellence in
Teaching.
Schacter, J. & Thum, Y. M. (2004). Paying for high and low quality teachers. Economics in
Education Review, 23(4), 411-430.
Schiff, T. (2003). The Teacher Advancement Program: Attitudes of the teachers. National
Institute for Excellence in Teaching.
Scriven, M. (1981). Summative teacher evaluation. In J. Millman (Ed.) Handbook of teacher
evaluation (pp. 244-271). Beverly Hills: Sage.
Shrinkfield, A. J. & Stufflebeam, D. L. (1995). Teacher evaluation: Guide to effective practice.
Evaluation in Education and Human Services. Norwell: Kluwer Academic.
Shulman, L. S. (1987). Knowledge and teaching: Foundations of the new reform. Harvard
Education Review, 57(1), 1-22.
Slavin, R. E. (1980). Cooperative learning. Review of Educational Research, 50 (2), 315-342.
Slavin, R. E. (1990). Comprehensive cooperative learning models: Embedding cooperative
learning in the curriculum and school. In S. Sharan (Ed.), Cooperative learning: Theory
and research (pp. 262-288). New York: Praeger.
Solmon, L. C., White, J. T., Cohen, D., & Woo, D. (2007). The effectiveness of the Teacher
Advancement Program. National Institute for Excellence in Teaching.
Stiggins, R. J., & Bridgeford, N. J. (1985). Performance assessment for teacher development.
Educational Evaluation and Policy Analysis, 7(1), 85-97.
Stiggins, R. J. & Duke, D. (1988). The case for commitment to teacher growth: Research on
teacher evaluation. Albany: State University of New York Press.
Stronge, J. H. (1997). Improving schools through teacher evaluation. In J. H. Stronge (Ed.),
Evaluating teaching: A guide to current thinking and best practice. Thousand Oaks:
Corwin Press.
Swanson, H. L. (1990). Influence on metacognitive knowledge and aptitude on problem solving.
Journal of Educational Psychology, 82(2), 306-314.

A Teacher Evaluation System That Works 47
Toch, T. & Rothman, R. (2008). Rush to judgment: Teacher evaluation in public education.
Education Sector.
Van der Linden, W. J. & Hambleton, R. K. (Eds.). (1997). Handbook of modern item response
theory. New York: Springer.
Vye, N. J., Goldman, S. R., Voss, J. F., Hmelo, C., & Williams, S. (1997). Complex
mathematical problem solving by individuals and dyads. Cognition and Instruction,
15(4), 435-484.
Vygotsky, L. S. (1978). Mind in society: The development of higher psychological processes.
Cambridge: Harvard University Press.
Weiner, B. (1985). An attributional theory of achievement motivation and emotion.
Psychological Review, 92(4), 548-573.
Weisberg, D., Sexton, S., Mulhern, J., Keeling, D. (2009). The widget effect: Our national
failure to acknowledge and act on differences in teacher effectiveness. Brooklyn: The
New Teacher Project. Available online at http://widgeteffect.org/
Wittrock, M. C. (1985). Teaching learners generative strategies for enhancing reading
comprehension. Theory into Practice, 24(2), 123-126.
Wittrock, M. C. (1986). Student thought processes. In M. Wittrock (Ed.), Handbook of research
on teaching 3rd edition. New York: Macmillan.
Wittrock, M. C. (1992). Generative learning processes of the brain. Educational Psychologist,
27(4), 531-541.
Wright, P., Horn, S. P., and Sanders, W. L. (1997). Teacher and classroom context effects on
student achievement: Implications for teacher evaluation. Journal of Personnel
Evaluation in Education, 11(1): 57–67.
Wuhs, S. K., & Manatt, R. P. (1983). The pace of mandated teacher evaluation picks up.
American School Board Journal, 170(4), 28.

48 NIET Working Paper
Appendix A.
Components of the TAP Skills, Knowledge, and Responsibilities Performance Standards
The TAP Skills, Knowledge, and Responsibilities Performance Standards were developed
by the Milken Family Foundation based on a body of research identifying areas of teacher
performance related to student achievement (Schacter & Thum, 1999). The studies reviewed
included correlational studies, quasi-experimental studies, and experimental studies. Research in
teacher qualifications indicated that teacher post-baccalaureate education, teacher years of
experience, and teacher test scores had an inconsistently positive and weak relationship to
student achievement (Greenwald et al., 1996). From research on discrete behaviors and teaching
models encompassing sets of behaviors, the developers identified practices in areas such as
questioning, feedback, presentation, lesson structure and pacing, lesson objectives, and
classroom environments which were conducive to improvement in student achievement (Brophy
& Good, 1986; Gage & Needels, 1986; Rosenshine & Stevens, 1986). Research in cognitive
science and educational psychology showed improvement in student understanding across a
variety of subject areas and grade levels as a result of teaching strategies informed by theories of
student learning and greater teacher understanding of how students think and feel (Ames, 1992;
Belmont, 1989; Blumenfeld, 1990; Bransford et al., 1986; Cohen, 1994; Donovan et al., 2000;
Dweck, 1999; Graham, 1984; Krajcik et al, 1998; Licht & Dweck, 1984; Perkins, 1984; Perkins
& Simmons, 1988; Pressley & Wharton-McDonald, 1997; Piaget, 1926; Rogoff, 1990; Slavin,
1980, 1990; Swanson, 1990; Wittrock, 1985, 1986; Vye et al., 1997; Vygotsky, 1978; Weiner,
1985; Wittrock, 1992).
The TAP standards were also developed based on an extensive review of publications
from national and state teacher standards organizations. The work reviewed included guidelines
and standards developed by the Interstate New Teacher Assessment and Support Consortium
(INTASC), the National Board for Professional Teacher Standards, Massachusetts‘ Principles for
Effective Teaching, California‘s Standards for the Teaching Profession, Connecticut‘s Beginning
Educator Support Program, and the New Teacher Center‘s Developmental Continuum of
Teacher Abilities. The work of Danielson (1996) served as another resource for defining the
teaching competencies at each level of teacher performance.
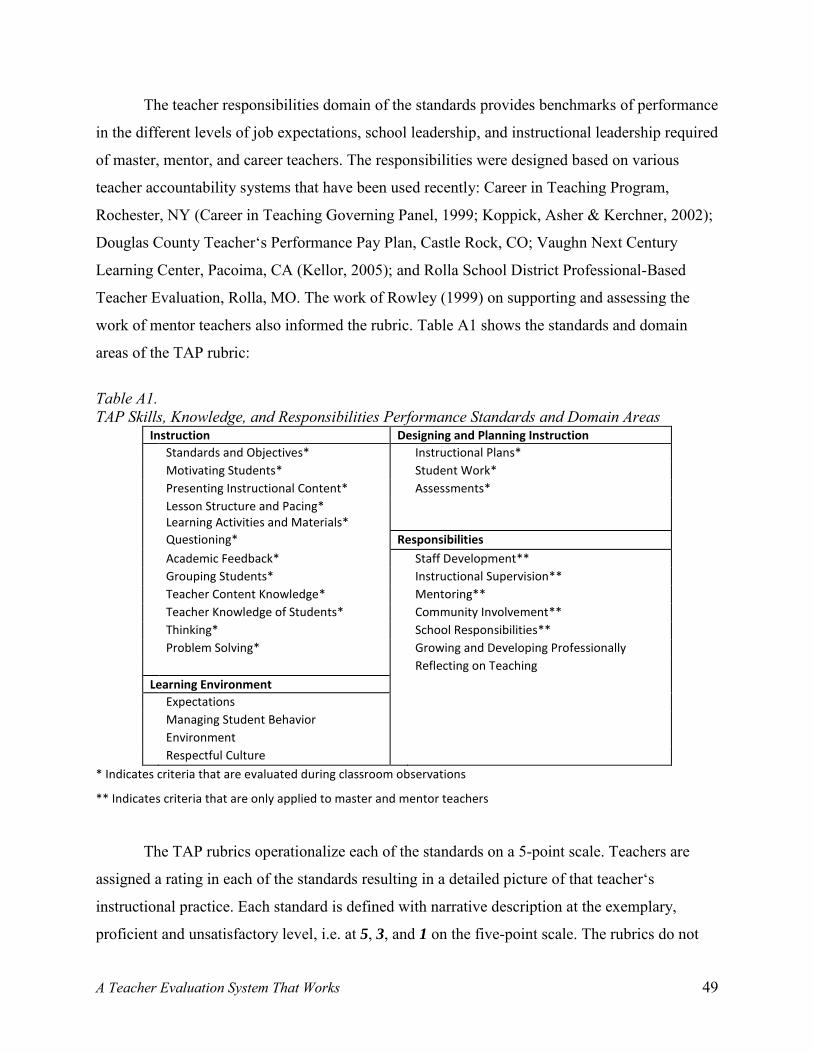
A Teacher Evaluation System That Works 49
The teacher responsibilities domain of the standards provides benchmarks of performance
in the different levels of job expectations, school leadership, and instructional leadership required
of master, mentor, and career teachers. The responsibilities were designed based on various
teacher accountability systems that have been used recently: Career in Teaching Program,
Rochester, NY (Career in Teaching Governing Panel, 1999; Koppick, Asher & Kerchner, 2002);
Douglas County Teacher‘s Performance Pay Plan, Castle Rock, CO; Vaughn Next Century
Learning Center, Pacoima, CA (Kellor, 2005); and Rolla School District Professional-Based
Teacher Evaluation, Rolla, MO. The work of Rowley (1999) on supporting and assessing the
work of mentor teachers also informed the rubric. Table A1 shows the standards and domain
areas of the TAP rubric:
Table A1. TAP Skills, Knowledge, and Responsibilities Performance Standards and Domain Areas
Instruction Designing and Planning Instruction
Standards and Objectives* Instructional Plans*
Motivating Students* Student Work*
Presenting Instructional Content* Assessments*
Lesson Structure and Pacing* Learning Activities and Materials*
Questioning* Responsibilities
Academic Feedback* Staff Development**
Grouping Students* Instructional Supervision**
Teacher Content Knowledge* Mentoring**
Teacher Knowledge of Students* Community Involvement**
Thinking* School Responsibilities**
Problem Solving* Growing and Developing Professionally
Reflecting on Teaching
Learning Environment
Expectations
Managing Student Behavior
Environment
Respectful Culture
* Indicates criteria that are evaluated during classroom observations
** Indicates criteria that are only applied to master and mentor teachers
The TAP rubrics operationalize each of the standards on a 5-point scale. Teachers are
assigned a rating in each of the standards resulting in a detailed picture of that teacher‘s
instructional practice. Each standard is defined with narrative description at the exemplary,
proficient and unsatisfactory level, i.e. at 5, 3, and 1 on the five-point scale. The rubrics do not
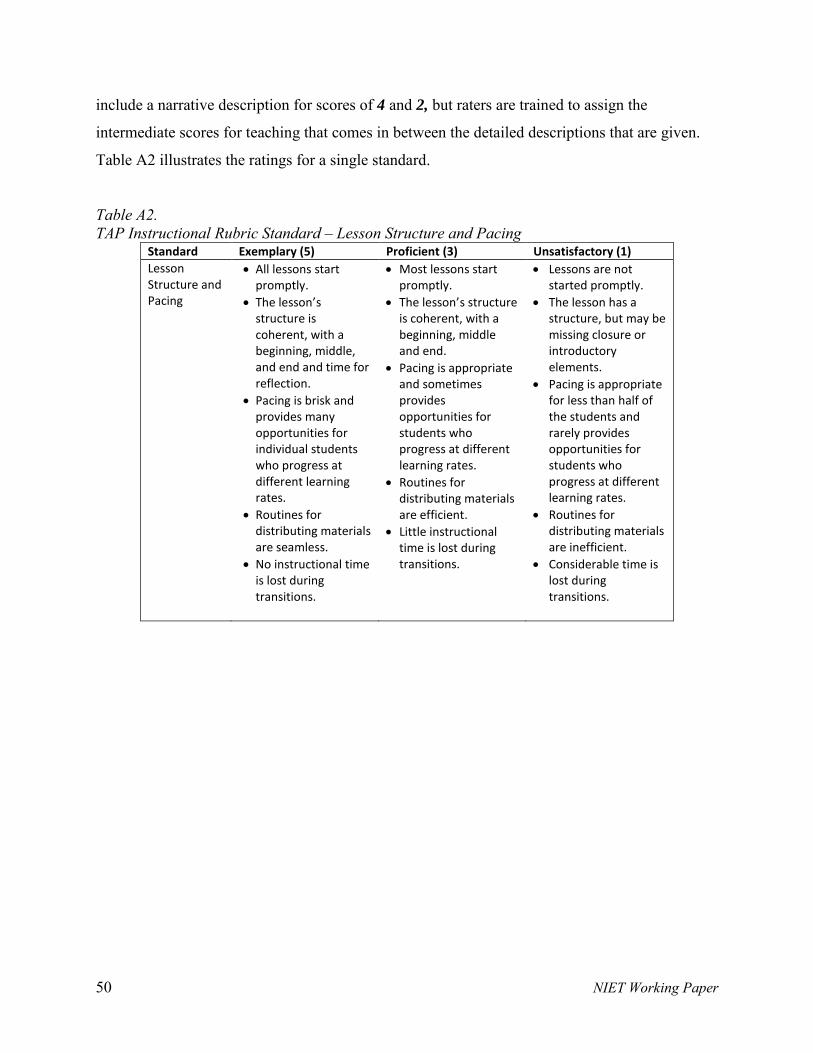
50 NIET Working Paper
include a narrative description for scores of 4 and 2, but raters are trained to assign the
intermediate scores for teaching that comes in between the detailed descriptions that are given.
Table A2 illustrates the ratings for a single standard.
Table A2. TAP Instructional Rubric Standard – Lesson Structure and Pacing
Standard Exemplary (5) Proficient (3) Unsatisfactory (1)
Lesson Structure and Pacing
All lessons start promptly.
The lesson’s structure is coherent, with a beginning, middle, and end and time for reflection.
Pacing is brisk and provides many opportunities for individual students who progress at different learning rates.
Routines for distributing materials are seamless.
No instructional time is lost during transitions.
Most lessons start promptly.
The lesson’s structure is coherent, with a beginning, middle and end.
Pacing is appropriate and sometimes provides opportunities for students who progress at different learning rates.
Routines for distributing materials are efficient.
Little instructional time is lost during transitions.
Lessons are not started promptly.
The lesson has a structure, but may be missing closure or introductory elements.
Pacing is appropriate for less than half of the students and rarely provides opportunities for students who progress at different learning rates.
Routines for distributing materials are inefficient.
Considerable time is lost during transitions.

A Teacher Evaluation System That Works 51
Appendix B.
Weighting in the Skills, Knowledge, and Responsibilities Score
In each domain of the Skills, Knowledge, and Responsibilities (SKR) rubrics,
performance ratings on the indicators comprising that domain are averaged and used to assign a
single score. Each domain average is then assigned a weight on which performance awards are
based, as shown in Table B1.
Table B1. Domain Weights by Teacher Type
Domain Weights Career Mentor Master
Designing and Planning Instruction 0.15 0.15 0.15
Learning Environment 0.05 0.05 0.05
Instruction 0.75 0.60 0.40
Responsibilities 0.05 0.20 0.40
This weighting scheme accounts for differentiation of teacher roles. Mentor and master
teachers assume additional roles and responsibilities to provide support to other teachers while
remaining classroom instructors. Accordingly, the weighting for designing and planning
instruction and learning environment is common across all three teacher types in keeping with
teachers‘ continued instruction of students in each position. As part of their roles, mentor and
master teachers assume greater responsibilities outside of the classroom assisting other teachers
and overseeing the implementation of TAP. For instance, mentor and master teachers are
provided with release time to engage in coaching and evaluation activities. The weighting for
mentor and master teachers accounts for their assumption of leadership activities through
reduced weighting in instruction and increased weighting on responsibilities.
Additionally, ratings are weighted differentially according to the evaluators‘ role, as
shown in Table B2. This weighting accounts for the varying levels of precision and knowledge
expected to have been gained in the roles of administrator, master teacher, and mentor teacher.
Master teachers can be evaluated either by mentor teachers or their master teacher peers, though
the evaluations of their administrators are accorded the most weight. At the end of the year, the
teachers‘ observation ratings are averaged with these weights to produce a SKR score.

52 NIET Working Paper
Table B2. Weighting by Evaluator Type
Career and Mentor Teachers Master Teachers
Evaluator Type Weighting Evaluator Type Weighting
Mentor 0.20 Mentor or Master 0.35
Master 0.35 Administrator 0.55
Administrator 0.35 Self-Evaluation 0.10
Self-Evaluation 0.10

ACKNOWLEDGEMENTS
We gratefully acknowledge the criticisms and suggestions provided by Richard Buddin,
Peggy Kirby, Jordan Rickles, and G. Frederick Thompson. Their contributions made this a better
paper, but they bear no responsibility for any of the remaining deficiencies. We also appreciate
the support we received from our colleagues at the National Institute for Excellence in Teaching,
especially Geneva Galloway, Teddy Broussard, and Jason Culbertson for data and details about
TAP; Anissa Rodriguez, Jana Rausch, Sarah Shoff, and Kristan Van Hook for reviewing and
editing drafts; and Tamara Schiff for overall guidance, background on the history of TAP, and
substantial contributions to the analysis and presentation of findings.
Glenn Daley [email protected]
Lydia Kim
National Institute for Excellence in Teaching 1250 Fourth Street
Santa Monica, CA 90401
The National Institute for Excellence in Teaching (NIET) was established in 2005 as an independent 501(c)(3) public charity. With a staff experienced in teaching, school leadership, program evaluation, research, and business management, NIET operates TAP and works to ensure the system‘s effectiveness and sustainability. NIET researchers study the design, operations, and impact of TAP in the context of other research literature and public policy perspectives.
For additional information on TAP, please visit http://www.tapsystem.org.