
A tale of two predictors: The impact of regulatory focus ...
171
A tale of two predictors: The impact of regulatory focus and entrepreneurial orientation on small and medium-sized enterprises Shuangfa Huang Thesis submitted in partial fulfilment of the requirements for the degree of Doctor of Philosophy May, 2018
Transcript of A tale of two predictors: The impact of regulatory focus ...

A tale of two predictors: The impact of
regulatory focus and entrepreneurial
orientation on small and medium-sized
enterprises
Shuangfa Huang
Thesis submitted in partial fulfilment of
the requirements for the degree of
Doctor of Philosophy
May, 2018

A tale of two predictors: The impact of regulatory focus and
entrepreneurial orientation on small and medium-sized
enterprises
ABSTRACT
Small and medium-sized enterprises (SMEs) contribute significantly to economic
growth and job creation. Given the importance of SMEs, this study examines the
factors that may impact their outcomes (i.e., behaviours and performance). In
particular, it examines the effects of chief executive officers’ (CEOs’) regulatory
focus and firms’ entrepreneurial orientation (EO) on SMEs. Regulatory focus theory
suggests that people can pursue their goals via a promotion focus (associated with a
concern for growth and a desire for gains) or a prevention focus (associated with a
concern for safety and a desire to avoid losses). As an individual-level motivational
characteristic, regulatory focus underlies the motives people are aiming to satisfy,
the goals they pursue, and the strategic means they prefer to implement in striving
for their goals. Since CEOs are the top decision makers, their decisions induced by
regulatory focus should have an impact on firms they lead. Additionally, EO refers
to a firm-level behavioural construct that involves three independent dimensions,
namely, innovativeness, risk-taking, and proactiveness. Since organisations often
rely on entrepreneurial activities to renew themselves, their levels of innovativeness,
risk-taking, and proactiveness should have an impact on their performance.
This study expands research on regulatory focus theory and entrepreneurial
orientation through examining (a) the effects of CEO regulatory focus on SME
performance and how the effects differ between firms operating in different
industry environments (i.e., high-tech and low-tech industries); (b) the
independent effects of firms’ levels of innovativeness, risk-taking, and proactiveness
on SME performance and how the effects differ between firms operating in different
industry environments; and (c) the influences of CEO regulatory focus on SMEs’
levels of innovativeness, risk-taking, and proactiveness. In so doing, this study also
contributes to entrepreneurship research in two ways. First, it provides insights
about how the effects of regulatory focus and the dimensions of EO on SMEs are
contingent on the industry environment in which firms operate. Second, it sheds
light on how the individual-level characteristic and firm-level behaviours differ in
explaining the variance in firm outcomes.
I collected online survey data from 110 SMEs in the UK. The empirical results
demonstrate that CEO regulatory focus is associated with SME performance.
Specifically, CEO promotion focus is positively, and CEO prevention focus is
negatively associated with SME performance. Industry environment moderates the
relationship between CEO promotion focus and SME performance. That is, CEO
promotion focus has stronger effects on SMEs in high-tech industries than those in

low-tech ones. However, a moderating role of industry environment on the
relationship between CEO prevention focus and SME performance is not observed.
The findings also suggest that the three dimensions of EO have unique effects on
SME performance. Specifically, there is an inverted U-shaped relationship between
innovativeness and SME performance, a U-shaped relationship between risk-taking
and SME performance, and a positive linear relationship between proactiveness and
SME performance. Industry environment moderates the performance effects of
innovativeness and proactiveness on SMEs except for risk-taking. In particular,
innovativeness has stronger effects on SMEs in low-tech industries, whereas
proactiveness has stronger effects on SMEs in high-tech industries. Moreover, the
empirical results demonstrate that CEO promotion focus positively impact SMEs’
levels of innovativeness and proactiveness except risk-taking, while CEO prevention
focus negatively impact SMEs’ levels of risk-taking and proactiveness except
innovativeness.
The empirical results indicate that innovativeness, risk-taking, and proactiveness
together account for 14% of the variance in SME performance, whereas CEO
promotion and prevention focus account for 6% of the variance in SME performance.
As such, firm-level entrepreneurial behaviours regarding innovativeness, risk-
taking, and proactiveness are more robust predictors in explaining the variance in
SME performance than individual-level CEO characteristic concerning promotion
and prevention focus. Additionally, the results reveal that CEO promotion and
prevention focus are the antecedents of SMEs’ entrepreneurial behaviours. While
regulatory focus and EO refer to different natures of phenomenon and represent
constructs at different levels, this study shows that both factors have substantial
impacts on organisations. Therefore, to understand the organisational outcomes of
SMEs, it is paramount to consider CEO regulatory focus and EO.

i
Author Declaration
I confirm that this thesis is composed of my original work and has not been
submitted in substantially the same form for the award of a higher degree elsewhere.
Shuangfa Huang
May 2018

ii
Acknowledgements
This thesis is dedicated to my family for their endless support and encouragement
that allowed me to pursue my dreams – big or small.
I am grateful for the guidance and support from my supervisors, Qihai Huang and
Danny Soetanto. Thank you for your support over the last four years. I also thank
colleagues in the ESI department, especially Ricardo Zozimo, Magnus George,
Lola Dada, Allan Discua Cruz, and Sarah Jack for their help in developing my
teaching and research.
I am also grateful for the support of my friends, especially Likun Mao, Yifan Li,
Diansha Wang, Shuo Yu, Bingbing Ge, Tobias Langenberg. Thank you for making
my experience at Lancaster an enjoyable one.
I offer my thanks to Alistair Anderson, who inspired me to embark upon this journey
and also directed me toward the right direction.
Finally, thanks go to all the participants who shared their time in this study as this
project could not have happened without their support.

iii
Table of contents
Author Declaration............................................................................................................ i
Acknowledgements .......................................................................................................... ii
Chapter 1: Introduction ................................................................................................... 1
1.1 Purpose of the study ......................................................................................................... 1
1.2 Structure of the thesis ...................................................................................................... 9
Chapter 2: Literature Review ....................................................................................... 11
2.1 Regulatory Focus Theory ................................................................................................ 11
2.1.1 Foundations of regulatory focus theory .................................................................... 11
2.1.1.1 The difference between promotion and prevention focus ............................ 11
2.1.1.2 Implications of promotion and prevention focus ........................................ 17
2.1.2 Regulatory focus and firm outcomes ...................................................................... 21
2.1.3 The limitations of regulatory focus ......................................................................... 24
2.2 Entrepreneurial Orientation ......................................................................................... 26
2.2.1 The historical roots and conceptual development of EO ........................................ 26
2.2.2 The limitations of EO .............................................................................................. 31
2.2.2.1 Definitional inconsistency .......................................................................... 31
2.2.2.2 The dimensionality issue ............................................................................ 32
2.2.2.3 Measurement issues ................................................................................... 34
2.2.3 EO and firm performance ....................................................................................... 38
2.3 Regulatory focus versus entrepreneurial orientation .................................................... 41
Chapter 3 Hypothesis Development........................................................................... 43
3.1 Regulatory focus and firm performance ........................................................................ 44
3.1.1 Promotion focus and firm performance .................................................................. 44
3.1.2 Prevention focus and firm performance ................................................................. 45
3.1.3 The moderating role of industry environment ........................................................ 47

iv
3.2 Entrepreneurial orientation and firm performance ...................................................... 50
3.2.1 The independent effects of innovativeness on firm performance ........................... 50
3.2.2 The independent effects of risk-taking on firm performance ................................ 51
3.2.3 The independent effects of proactiveness on firm performance ............................ 53
3.2.4 The moderating effects of industry environment ................................................... 54
3.3 Regulatory focus and entrepreneurial orientation ........................................................ 59
3.3.1 The effects of promotion focus on the three dimensions of EO .................... 59
3.3.2 The effects of prevention focus on the three dimensions of EO ................... 62
Chapter 4 Research Methodology ............................................................................... 66
4.1 Research design ............................................................................................................. 66
4.2 Sampling ........................................................................................................................ 68
4.3 Data collection ............................................................................................................... 69
4.4 Data screening ............................................................................................................... 75
4.5 Measurement ................................................................................................................. 77
4.6 Reliability and validity test ............................................................................................ 81
Chapter 5 Data Analysis and Results ......................................................................... 84
5.1 Descriptive statistics ...................................................................................................... 84
5.2 Regulatory focus and firm performance ........................................................................ 86
5.2.1 Regression Models ..................................................................................................86
5.2.2 Regression Results ................................................................................................. 88
5.2.3 Robustness checks ..................................................................................................89
5.2.4 Post-hoc test ........................................................................................................... 90
5.3 Entrepreneurial orientation and firm performance ...................................................... 92
5.3.1 Regression Models .................................................................................................. 92
5.3.2 Regression Results .................................................................................................. 94
5.2.3 Robustness checks .................................................................................................. 96
v
5.4 Regulatory focus and entrepreneurial orientation ........................................................ 99
5.4.1 Regression models ................................................................................................... 99
5.4.2 Regression results ................................................................................................. 101
5.4.3 Post-hoc test .......................................................................................................... 102
5.5 Summary ...................................................................................................................... 105
Chapter 6 Discussions and Conclusions ................................................................. 107
6.1 Discussions and contributions ..................................................................................... 108
6.1.1 Regulatory focus and firm performance ................................................................ 108
6.1.2 Entrepreneurial orientation and firm performance .............................................. 112
6.1.3 Regulatory focus and entrepreneurial orientation ................................................. 116
6.2 Managerial implications .............................................................................................. 123
6.3 Limitations and directions for future research ........................................................... 125
6.4 Conclusion ................................................................................................................... 127
References: ..................................................................................................................... 128
Appendix 1: Sample response from pilot testing ............................................................... 148
Appendix 2: Questionnaire design .................................................................................... 149
Appendix 3: Letter of invitation ........................................................................................ 154
Appendix 4: Descriptive statistics ......................................................................................155
Appendix 5: Results from normality test .......................................................................... 156
Appendix 6: Results from principal component analysis .................................................. 157
Appendix 7: Results from non-response bias test ............................................................. 158
Appendix 8: Results from common method bias test ....................................................... 159
Appendix 9: Results from reliability and validity test ....................................................... 160

vi
List of Tables
Table 2-1: The differences between promotion and prevention focus 12
Table 4-1: Profile of participants for pilot testing 71
Table 4-2: Sample characteristics 73
Table 4-3: Confirmatory factor analysis for regulatory focus 82
Table 4-4: Confirmatory factor analysis for the three dimensions of EO 83
Table 5-1: Means, Standard Deviations (SD), and Correlations of Variables 85
Table 5-2: Regressing promotion and prevention focus onto firm performance 87
Table 5-3: CEOs with varying combinations of promotion and prevention focus 90
Table 5-4: Regressing innovativeness, risk-taking, and proactiveness onto firm
performance 93
Table 5-5: Regressing innovativeness, risk-taking, and proactiveness onto
promotion and prevention focus 100
Table 5-6: Comparing the means of innovativeness, risk-taking, and proactiveness 102
Table 5-7: Summary of results from hypothesis testing 106

vii
List of Figures
Figure 1-1: Theoretical framework of the study 8
Figure 2-1: An illustration of the distinction between regulatory focus and the approach – avoidance motivations 13
Figure 2-2a-b: Reflective and formative second-order model 36
Figure 5-1: Plot of industry environment as moderator 89
Figure 5-2: Comparing the mean value of firm performance 91
Figure 5-3a-c: Plot of the effects of the dimensions of EO on firm performance 96
Figure 5-4a-c: Plot of industry environment as moderator 96
Figure 5-5: Comparing the mean value of the EO dimensions 104
1
Chapter 1: Introduction
1.1 Purpose of the study
Small and medium-sized enterprises (SMEs) play a central role in economic
development and job creation. They represent 99% of all businesses and account for
two-thirds of all employment in the private sector in the EU (Muller et al., 2017).
Indeed, SMEs are the driving force behind economic growth in many OECD
economies (OECD, 2017). Despite their significance, SMEs face challenges such as
liability of smallness (Aldrich and Auster, 1986) and lack of resources including
financial resources, knowledge, and networks (Radas and Božić, 2009; Maes and
Sels, 2014). Compared to large firms, for example, SMEs have disadvantages in
raising financial resources and attracting talent (Aldrich and Auster, 1986). As a
result, SMEs tend to have less experience and lower capabilities in innovation (Van
de Vrande et al., 2009; Nicholas et al., 2011). It should be noted that the smallness
of SMEs might allow them to respond quickly to changing market environments and
achieve greater flexibility (Hoffman et al., 1998), suggesting that it might serve as a
potential source for SMEs to gain competitive advantages over large firms.
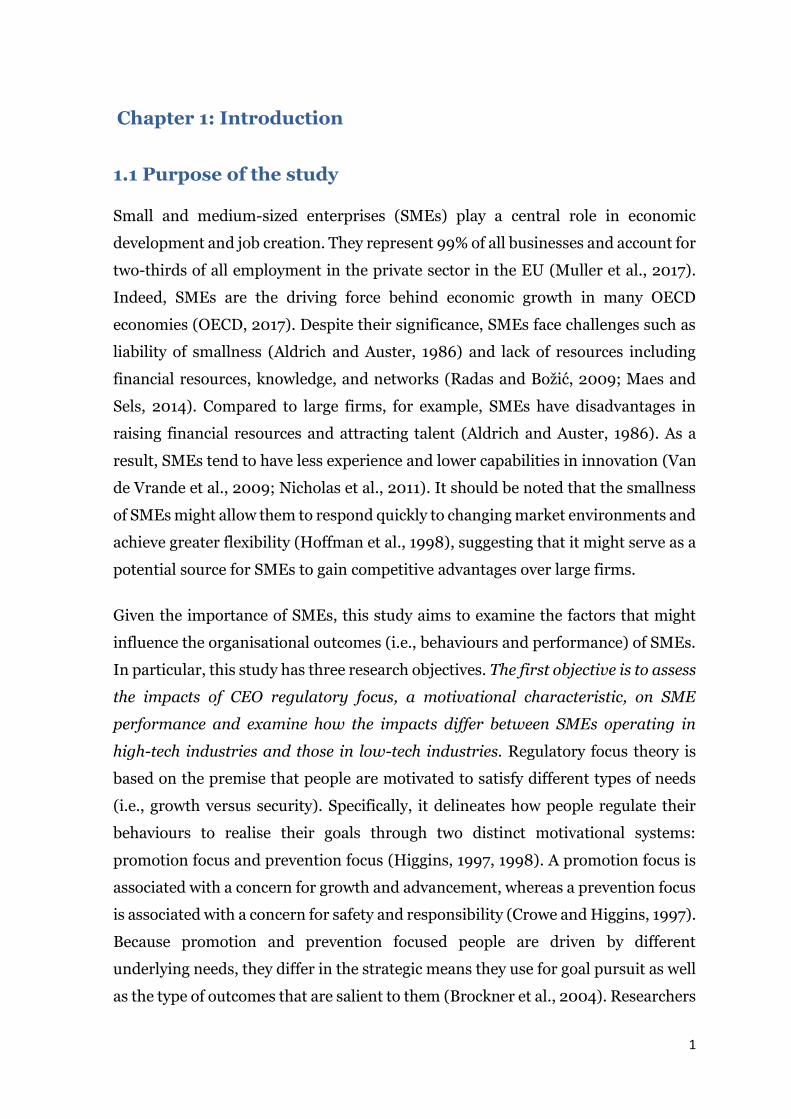
Given the importance of SMEs, this study aims to examine the factors that might
influence the organisational outcomes (i.e., behaviours and performance) of SMEs.
In particular, this study has three research objectives. The first objective is to assess
the impacts of CEO regulatory focus, a motivational characteristic, on SME
performance and examine how the impacts differ between SMEs operating in
high-tech industries and those in low-tech industries. Regulatory focus theory is
based on the premise that people are motivated to satisfy different types of needs
(i.e., growth versus security). Specifically, it delineates how people regulate their
behaviours to realise their goals through two distinct motivational systems:
promotion focus and prevention focus (Higgins, 1997, 1998). A promotion focus is
associated with a concern for growth and advancement, whereas a prevention focus
is associated with a concern for safety and responsibility (Crowe and Higgins, 1997).
Because promotion and prevention focused people are driven by different
underlying needs, they differ in the strategic means they use for goal pursuit as well
as the type of outcomes that are salient to them (Brockner et al., 2004). Researchers

2
have highlighted that regulatory focus is a motivation-based characteristic that
underlies the motives people are trying to satisfy, the goals they pursue, and the
strategic actions they prefer to implement in striving for their goals (Brockner et al.,
2004; Molden et al., 2008).
To understand the organisational outcomes of SMEs, it is critical to consider the
regulatory focus of CEOs. Regulatory focus induces people to pursue different types
of goals using distinct strategic means (Higgins, 1997, 1998), suggesting that it has
a profound impact on people’s decision making. Indeed, research in regulatory focus
theory has shown that people’s regulatory focus shapes their decisions concerning
risk-taking (Scholer et al., 2010; Hamstra et al., 2011) and pursuing changes
(Liberman et al., 1999; Fuglestad et al., 2008). As such, regulatory focus has a
significant impact on the decisions made by CEOs. Since CEOs are the top decision
maker in their firms (Finkelstein et al., 2009), the decisions that are induced by
regulatory focus should have an impact on the firms they lead. Indeed, empirical
evidence has shown that the regulatory focus of CEOs or entrepreneurs is related to
small firm performance (Wallace et al., 2010) and new venture performance
(Hmieleski and Baron 2008). The authors also suggest that the performance effects
of regulatory focus are more pronounced for firms operating in a dynamic than a
stable environment.
Although studies have shown that CEO regulatory focus influences small firm
performance, it remains unclear how the influence of regulatory focus might differ
between firms operating in different industry environments (i.e., high-tech versus
low-tech industries). As Lomberg et al., ( 2016, p. 6) pointed out, “environmental
factors such as dynamism, hostility, complexity, or munificence vary across
industries”, suggesting that firms operating in different industry environments
should face distinct challenges. To illustrate, compared to the low-tech industries,
the high-tech industries are more uncertain, more competitive, and more complex
(Moriarty and Kosnik, 1989; Qian and Li, 2003; Wu, 2012). Given that firms
operating in high-tech industries tend to face different challenges than those
operating in low-tech industries, there are reasons to expect that the performance
effects of CEO regulatory focus are likely to differ between them. Consistent with
extant research (Bierly and Daly, 2007; Rauch et al., 2009; Sarooghi et al., 2015),
this study distinguishes the industry environment in which firms operate into high-
3
tech and low-tech industries. Therefore, this study assesses how the performance
effects of CEO regulatory focus differ between SMEs in high-tech industries and
those in low-tech industries.
The second objective is to assess the effects of firms’ entrepreneurial behaviours,
including innovativeness, risk-taking, and proactiveness, on SME performance
and examine how their performance effects differ between SMEs operating in
high-tech industries and those in low-tech industries. Entrepreneurial orientation
(EO) refers to the “strategy-making practices, management philosophies, and firm-
level behaviors that are entrepreneurial in nature” (Anderson et al., 2009, p. 200).
EO is an important factor to consider because theoretical work and empirical
evidence have suggested that EO significantly impact the performance of
organisations (Lumpkin and Dess, 1996; Rauch et al., 2009; Wales, 2016). There
are two diverging views about the nature of EO: unidimensional or
multidimensional. The unidimensional EO refers to the shared variance among
innovativeness, risk-taking, and proactiveness (Miller, 1983; Covin and Slevin, 1989;
Covin and Wales, 2012), whereas the multidimensional EO entails a set of
independent dimensions (three or five dimensions depending on researchers’
conceptualisation), each of which are expected to have independent effects on
organisations (Lumpkin and Dess, 1996; Kreiser et al., 2002).
This study operationalises EO as a multidimensional construct and assesses the
independent effects of innovativeness, risk-taking, and proactiveness on SME
performance based on three reasons. Firstly, researchers have highlighted that the
dimensions of EO are independent (Lumpkin and Dess, 1996; Kreiser et al., 2002),
and that they are “more telling than the aggregate index” (Miller, 2011, p. 880). In
other words, examining the dimensions of EO independently can help to reveal their
unique effects on organisations. Secondly, recent research has shown that
“aggregating the entrepreneurial orientation dimensions into one combined
measure … can result in their independent influences being distorted or canceled
out altogether” (Dai et al., 2014, p. 519). As such, it is critical to examine the
dimensions of EO independently rather than combining them into one factor.
Thirdly, while a number of studies have explored the relationship between the
dimensions of EO and firm performance, the nature of their link remains
inconclusive because results from the empirical evidence are mixed. Some

4
researchers have found a linear relationship between the dimensions of EO and firm
performance (Hughes and Morgan, 2007; Swierczek and Ha, 2003) while others
found a curvilinear relationship (Kreiser et al., 2013). The inconsistent findings may
be due to the fact that existing studies are focusing on different industries and/or
firm contexts, such as small High-tech firms (Hughes and Morgan, 2007), medium
and large sized High-tech firms (Morgan and Strong, 2003), and SMEs (Kreiser et
al., 2013).
To contribute to EO literature, this study examines how the performance effect of
innovativeness, risk-taking, and proactiveness differ between SMEs operating in
different industry environments. Prior studies have revealed that external
environmental factors such as dynamism and hostility moderate the relationship
between EO and firm performance (Wiklund and Shepherd, 2005; Covin and Slevin,
1989). Additionally, researchers have suggested that these external environmental
factors differ between the high-tech industries and the low-tech ones (Lomberg et
al., 2016), implying that the industry environment in which firms operate is likely
to influence the performance effects of EO dimensions on SMEs. As Rauch et al.,
(2009, p. 780) noted, “industry and task environment represent different
conceptualizations of the firm’s environment, we believe both represent valuable
moderators, and continued effort along these lines are valuable in order to gain a
deeper understanding of the EO–performance relationship.” While researchers
have suggested that firms operating in high-tech industries benefit more from EO
than firms in nonhigh-tech industries (Rauch et al., 2009), it remains unclear
whether such effects hold true when the dimensions of EO are examined
independently. As such, examining the potential moderating effects of industry
environment on the relationship between EO dimensions and SME performance
could provide a more fine-grained understanding about the performance effects of
EO dimensions on SMEs.
While regulatory focus represents an individual-level construct (Higgins, 1997,
1998) and EO represents a firm-level construct (Covin and Wales, 2012), existing
studies have shown that both constructs are useful in predicting the outcomes of
organisations (Johnson et al., 2015; Rauch et al., 2009; Wales, 2016). Through
incorporating both constructs in this study, and separately assessing the
performance effects of regulatory focus and the EO dimensions on SMEs, the results

5
generated from this study might shed light on how the two constructs differ in
explaining variance in firm performance. For example, the results might provide
insights as for whether the individual-level motivational characteristic, regarding
regulatory focus, or the firm-level entrepreneurial behaviours regarding the three
dimensions of EO are a more robust predictor of SME performance.
Another reason to integrate CEO regulatory focus and the EO dimensions in this
study is that it allows for the examination of the potential relationships between
them. There are theoretical reasons to suspect that CEO regulatory focus might
shape firms’ levels of innovativeness, risk-taking, and proactiveness. Research in
upper echelons theory suggests that the characteristics of top executives (e.g., CEOs)
have profound impacts on organisational outcomes (Hambrick, 2007; Hambrick
and Mason, 1984). Specifically, characteristics such as personality, values, and
experience affect CEOs’ interpretation of the strategic situations they face that, in
turn, shapes their decisions and actions. Since CEOs occupy the highest positions
within organisations, their decisions and actions can thus significantly impact the
behaviours of the organisations they lead. In line with this view, empirical evidence
has demonstrated that a wide range of CEO characteristics are associated with the
behaviours of organisations (Busenbark et al., 2016; Wales et al., 2013b; Simsek et
al., 2010).
Additionally, there is empirical evidence suggesting that CEO regulatory focus
impacts organisational behaviours such as firms’ levels of business acquisition
(Gamache et al., 2015), new product introduction (Greenbaum, 2015) and growth-
related strategic actions (Chen et al., 2017). Because organisations are an extension
of the people who are in charge (Hambrick and Mason, 1984), the decisions and
goals of CEOs can become manifested through the behaviours undertaken by the
organisations they lead. Indeed, researchers have highlighted that firms’ strategic
behaviour “is often determined by executives on the basis of their goals and
temperament” (Miller and Friesen, 1982, p. 1). Given that regulatory focus
determines the goals CEOs pursue, and the strategic means they prefer to use
(Brockner et al., 2004; Molden et al., 2008), there are reasons to expect that CEO
regulatory focus should have an impact on firm-level behaviours. Nevertheless,
existing studies often focus on large firms (Gamache et al., 2015; Greenbaum, 2015;
Chen et al., 2017) with limited attention devoted to the SME context

6
(Kammerlander et al., 2015). Consequently, we know little about the effects of CEO
regulatory focus on the behaviours of SMEs. Given that CEOs have more managerial
discretion in smaller firms (Finkelstein et al., 2009), the effects of CEO regulatory
focus on organisational behaviours should be more salient in SMEs.
Accordingly, a final objective of this study is to examine the effects of CEO
regulatory focus on SMEs’ levels of innovativeness, risk-taking, and proactiveness.
Researchers have highlighted that “we know little about the antecedents of EO”
(Rosenbusch et al., 2013, p. 634), and that “the literature is still scarce regarding the
role of leaders’ characteristics in shaping the entrepreneurial posture of an
organization” (Pittino et al., 2017, p. 224). The current study addresses this research
gap by drawing insights from regulatory focus theory and examines how CEO
regulatory focus shapes the different entrepreneurial behaviours of SMEs. It is
worth noting that examining the effects of regulatory focus on firms’ innovativeness,
risk-taking, and proactiveness is consistent with the suggestion from Rauch et al.,
(2009, P.779) that “it may be more appropriate to study antecedences and
consequences of EO at the level of the dimensions of EO”. Nevertheless, research on
this area is largely unexplored as existing studies typically operationalise EO as a
combined factor (Wales et al., 2013a). Since the dimensions of EO are distinct,
examining the antecedents of EO at the level of individual dimensions should
generate more nuanced insights that cannot be uncovered when they are combined
as one factor.
This study focuses on the context of SMEs based on three considerations. Firstly,
CEOs have higher managerial discretion within small firms (Finkelstein and
Hambrick, 1990a). This implies that CEOs should have an even stronger influence
on SMEs than large firms, which are more likely to be managed by top management
teams. Thus, SMEs represents an ideal context to examine the effects of CEO
regulatory focus on the behaviours and performance of SMEs. Secondly, the
implications of innovativeness, risk-taking, and proactiveness are likely to differ
between SMEs and large firms. For example, since SMEs are resource constrained
(Rosenbusch et al., 2013), they may have less experience of and lower capabilities
for innovation than large firms. Also, given that SMEs tend to lack resources in
buffering losses, potential failures in their entrepreneurial activities might
significantly impact their performance or even endanger their survival. By contrast,

7
similar failures should have limited impacts on large firms, which tend to have more
resources to buffer such losses. Finally, because SMEs contribute significantly to
economic development and job creation (OECD, 2017), it is imperative to better our
understanding of the factors that might influence the behaviours or performance of
SMEs. An enhanced understanding might help SMEs to calibrate their activities to
achieve better performance.
In short, the purpose of this study is to investigate the factors that might impact the
organisational outcomes of SMEs. This study examines two important factors: CEOs’
regulatory focus (i.e., promotion and prevention focus) and firms’ entrepreneurial
behaviours (i.e., innovativeness, risk-taking, and proactiveness). It is paramount to
consider these two factors because studies have shown that they have profound
influences on organisations (Johnson et al., 2015; Rauch et al., 2009; Wales, 2016).
In particular, this study aims to address three research questions (RQ):
RQ 1. How does the CEO’s regulatory focus affect the respective SME’s
performance; and how does the effect differ between SMEs operating in high-tech
industries and those in low-tech industries?
RQ 2. How does an SME’s level of innovativeness, risk-taking, and proactiveness
impact its performance; and how does the effect differ between SMEs operating in
high-tech industries and those in low-tech industries?
RQ 3. How does the CEO’s regulatory focus influence the respective SME’s levels of
innovativeness, risk-taking, and proactiveness?
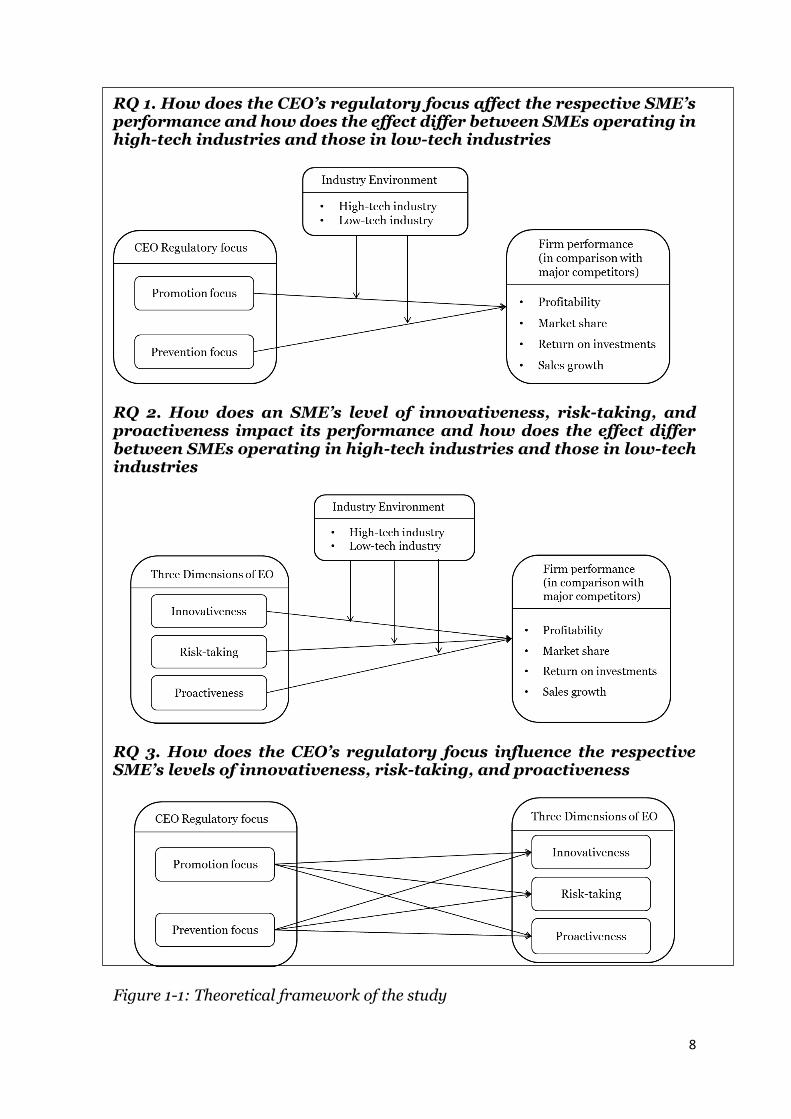
Figure 1-1 presents the theoretical models used in relation to the three research
questions and illustrates the proposed relationships of the key theoretical constructs
examined in this study. As shown in the figure, I posture that CEO promotion and
prevention focus are associated with SME performance and that their relationship
might vary between SMEs operating in high-tech industries and those in low-tech
industries. Additionally, I hypothesise that SMEs’ levels of innovativeness, risk-
taking, and proactiveness are related to SME performance, and that their
relationship might vary between SMEs operating in high-tech industries and those
in low-tech ones. Finally, I posit that CEO promotion and prevention focus are
associated with SMEs’ levels of innovativeness, risk-taking, and proactiveness.
8
RQ 1. How does the CEO’s regulatory focus affect the respective SME’s performance and how does the effect differ between SMEs operating in high-tech industries and those in low-tech industries
RQ 2. How does an SME’s level of innovativeness, risk-taking, and proactiveness impact its performance and how does the effect differ between SMEs operating in high-tech industries and those in low-tech industries
RQ 3. How does the CEO’s regulatory focus influence the respective SME’s levels of innovativeness, risk-taking, and proactiveness
Figure 1-1: Theoretical framework of the study

9
1.2 Structure of the thesis
This introductory chapter presents the rationale for conducting this study and
outlines the three key research questions it aims to address. The remainder of this
thesis is organised as follows.
Chapter 2 presents a review of the literature on regulatory focus theory and
entrepreneurial orientation in three sections. In the first section, I introduce the
theoretical foundations of regulatory focus theory and outline the major differences
between promotion and prevention focus as well as their distinct implications on
people’s decision making. After that, I discuss how people’s regulatory focus is
related to different organisational outcomes. This is followed by introducing the
limitations of existing studies that examine the effect of regulatory focus within
organisational contexts. In the second section, I introduce the historical roots and
conceptual development of the EO concepts and outline the contributions of EO to
entrepreneurship literature. I then introduce the shortcomings of existing EO
studies on issues related to definitional inconsistency, dimensionality, and
measurement. This is followed by a discussion of the performance implications of
EO and its dimensions on organisations. This chapter concludes with section three
discussing the major differences between regulatory focus and EO, as well as why
there is a potential relationship between them.
Chapter 3, the hypothesis development chapter, outlines the hypothesised
relationships proposed in this study. It is divided into three sections with each
section corresponding to one of the research questions outlined in the introductory
chapter. Specifically, drawing on existing theoretical and empirical evidence, I first
introduce the potential effects of CEO regulatory focus on SME performance and
how they are moderated by the industry environment in which SMEs operate. As
such, Hypotheses 1 to 4 are used to address research question one. After that, I
outline the potential links between the dimensions of EO and SME performance and
how they are moderated by the industry environment in which SMEs operate.
Hence, Hypotheses 5 to 10 are developed to address research question two. Finally,
I introduce the potential effects of CEO regulatory focus on SMEs’ levels of
innovativeness, risk-taking, and proactiveness. Therefore, Hypotheses 11 to 16 are
developed to address research question three.

10
Chapter 4 presents the methodology used in this research. I first discuss the
rationale for adopting a quantitative research design and using an online
questionnaire for data collection. The sampling frame and the data collection
processes, including questionnaire design, pilot testing, and formal data collection
are then introduced. After that, I discuss the procedures used to scrutinise the
quality of data collected. This is followed by introducing the measurement for all
key variables. This chapter concludes with a discussion of the different tests that are
used to examine the reliability and validity of the constructs used in this study.
Chapter 5 presents the data analysis and results from this research. It includes five
sections. In the first section, I discuss the descriptive statistics for all the key
variables used in this study. In sections two to five, I first introduce the regression
models used for hypothesis testing. This is followed by introducing the detailed
results from regression analysis, as well as the different robustness or post-hoc tests
used to scrutinise the results. All hypotheses and the results from hypothesis testing
are summarised in section five.
Chapter 6, the final chapter, presents a discussion of the findings generated from
this study. I discuss how the empirical results generated from the present study are
related to and also extend research on regulatory focus and EO. Since several
hypotheses are not supported in this study, potential explanations for the non-
findings are introduced. Additionally, the theoretical contributions in relation to
regulatory focus theory and EO, as well as their practical implications are
highlighted. This chapter concludes with a discussion of the research limitations
and the potential areas for future research.

11
Chapter 2: Literature Review
2.1 Regulatory Focus Theory
People’s tendency to approach pleasure and avoid pain is recognised as the hedonic
principle (Higgins, 1997). Psychologists often rely on this principle to explain
people’s motivation to move toward desired end-states (pleasure) and move away
from undesired end-states (pain). While the hedonic principle has contributed to
our understanding of people’s motivation, it is not without limitations because it
fails to account for how people approach desired end-states and avoid undesired
ones. Indeed, as Higgins (1998, p. 2) pointed out, “how the hedonic principle
operates might be as important in motivation as the fact that it does operate”. To
move beyond the hedonic principle, Higgins (1997, 1998) proposed regulatory focus
theory that delineates how people approach desired end-states and avoid undesired
end-states in different strategic ways.
2.1.1 Foundations of regulatory focus theory
Regulatory focus theory is based on the premises that people are concerned with
different needs and that “the hedonic principle should operate differently when
serving fundamentally different needs” (Higgins, 1997, p. 1281). For example,
researchers have differentiated the needs concerned with advancement and growth
from those concerned with security and protection. Indeed, the needs for
advancement and security are two of the most fundamental needs that people are
motivated to fulfil (Molden et al., 2008). Building on the differentiation between
different needs, regulatory focus theory distinguishes self-regulation, which refers
to the processes by which people set goals and then regulate their cognition and
behaviour to realise their goals (Bryant, 2009; Tumasjan and Braun, 2012), into two
independent regulatory systems: a promotion focus for achieving advancement and
a prevention focus for ensuring security.
2.1.1.1 The difference between promotion and prevention focus
One fundamental distinction between promotion and prevention focus is the
different needs underlying the two systems. Specifically, promotion focus concerns
advancement needs and prevention focus concerns security needs. Because of the

12
different underlying needs, promotion and prevention focus orient people to fulfil
their needs in distinct ways. In particular, the two systems differ on several aspects:
a) the preferred strategic means for goal pursuit (approach versus avoidance); b)
the strategic tendencies people exhibited in pursuing goals (eagerness versus
vigilance); and c) the type of outcomes that are salient to them (gain versus loss).
Table 2-1 summarises the key differences between promotion and prevention focus,
which are elaborated below.
Table 2-1: The differences between promotion and prevention focus
Promotion focus Prevention focus
Primary concerns /
underlying needs to
satisfy
Concerned with
advancement, growth,
and accomplishment
Concerned with security,
safety, and responsibility
Strategic preference
for goal pursuit
Prefer approach
strategies (approaching
matches to advancement
and approaching
mismatches to non-
fulfilment)
Prefer avoidance
strategies (avoiding
mismatches to security
and avoiding matches to
threat)
Strategic tendency
Inclined to insure hits
and insure against errors
of omission (Eagerness)
Inclined to insure correct
rejections and insure
against errors of
commission (Vigilance)
Salient outcomes
Sensitive to the presence
or absence of positive
outcomes (gains)
Sensitive to presence or
absence of negative
outcomes (losses)
Sources: Adapted from Higgins (1997, 1998); Crowe and Higgins (1997);
Molden et al., (2008).

13
Because promotion and prevention focus are concerned with distinct needs, both
systems entail different strategic means for goal pursuit (Higgins, 1997). Before
introducing how the strategic means differ, it is important to acknowledge that
regulatory focus is orthogonal to approach/avoidance motivation. Specifically, both
promotion and prevention focus include “both approaching desired end-states and
avoiding undesired end-states” (Johnson et al., 2015, p. 1503). That is, a promotion
focus includes striving for advancement and avoiding non-fulfilment and a
prevention focus includes striving for security and avoiding threat, as illustrated in
Figure 2-1.
Figure 2-1: An illustration of the distinction between regulatory focus and the
approach – avoidance motivations, adapted from Molden et al., (2008)
Regulatory focus theory suggests that promotion and prevention focus differ in the
preferred strategic means people use for goal pursuit. In particular, promotion
focused people prefer to approach matches to advancement and approach
mismatches to non-fulfilment, whereas prevention focused people prefer to avoid
mismatches to safety and to avoid matches to threat. Hence, whether attaining
desired end-states or preventing undesired one, a promotion focus favours
approach means whereas a prevention focus favours avoidance means. An initial
demonstration of the different strategic means preferred by promotion and

14
prevention focus comes from a study by Higgins et al., (1994). In the third study of
this paper, participants were presented with six strategies that they might use to
experience desired friendships. Three of the strategies were concerned about
approaching matches to desired friendship (e.g., to be emotionally supportive) and
the other three strategies were concerned with avoiding mismatches to friendship
(e.g., not neglecting friends). Higgins et al., (1994) found that participants with a
promotion focus concern select more approach strategies and those with a
prevention focus concern select more avoidance strategies.
Promotion and prevention focus also differ in the strategic tendencies people
exhibited in pursuing goals. Specifically, regulatory focus theory proposes that
promotion focused people are eager to attain advancement because they are
inclined to approach matches to desired end-states; whereas prevention focused
ones are vigilant to insure safety because they are inclined to avoid mismatches to
desired end-states. As Higgins (1997, p. 1285) highlighted, “individuals in a state of
eagerness from a promotion focus should want, especially, to accomplish hits and
to avoid errors of omission or misses (i.e., a loss of accomplishment). In contrast,
individuals in a state of vigilance from a prevention focus should want, especially,
to attain correct rejections and to avoid errors of commission or false alarms (i.e.,
making a mistake).” Hence, promotion focused people should exhibit a tendency to
“insure hits and insure against errors of omission” in pursuing goals, whereas
prevention focused people should exhibit a tendency to “insure correct rejections
and to insure against errors of commission” for goal pursuit.
For example, Crowe and Higgins (1997) examined people’s different strategic
tendencies using a recognition memory task. Participants first viewed a series of
nonsensical words and then were given a set of words that included words from the
original list (i.e., targets) but also new words (i.e., distractors). During the test,
participants were required to indicate either ‘yes’ or ‘no’ based on whether or not
they had seen the word. The four possible outcomes are: 1) saying ‘yes’ when the
word was presented – a hit; 2) saying ‘no’ when the word was presented – a miss; 3)
saying ‘yes’ when the word was absent – an error of commission; and 4) saying ‘no’
when the word was absent – a correct rejection. Crowe and Higgins (1997) found
that promotion focused people exhibited a risky response bias to saying ‘yes’ (i.e., a
propensity to ensure hits), whereas prevention focused people have a conservative

15
response bias to saying ‘no’ (a tendency to ensure correct rejections). Similar results
were observed in another study examining regulatory focus in a team setting.
Specifically, promotion focused teams are biased towards saying ‘yes’, whereas
prevention focused teams are biased towards saying ‘no’ (Levine et al., 2000).
Another major difference between promotion and prevention focus is their
sensitivities to either gains or losses (Higgins, 1997, 1998). Because a promotion
focus is concerned with the needs for advancement, promotion focused people are
more sensitive to gain related outcomes. In other words, the presence or absence of
positive outcomes is more salient to promotion focused people who are driven to
strive for attaining gains. The presence of positive outcomes represents a success in
their endeavour and the absence of such outcomes represents a failure (Collins,
2016). By contrast, as a prevention focus is concerned with the needs for security,
prevention focused people are more sensitive to loss related outcomes. That is, the
absence and presence of negative outcomes are more salient to prevention focused
people who are driven to protect themselves from loss. The absence of negative
outcomes represents a success in their endeavour and the presence of such
outcomes represents a failure (Collins, 2016).
The difference in people’s sensitivity to gain and loss is demonstrated in an
experimental study from Markman et al., (2005). Participants were invited to
complete a learning task and were given performance incentives framed either in
terms of gain or loss. For example, the gain related framing would emphasise
gaining points and not gaining points based on their response, whereas the loss
related framing would emphasise not losing points or losing points based on their
response. Markman et al., (2005) found that people who were primed with a
promotion focus achieved better task performance when the incentives or task
payoffs were framed in terms of gain. On the other hand, people who were primed
with a prevention focus accomplished better task performance when the incentives
or task payoffs were framed in terms of loss. Their findings demonstrate that gain
related outcomes are more salient to promotion focused people while loss related
outcomes are more salient to prevention focused people. Their results also indicate
that aligning the incentives with people’s regulatory focus have profound
implications for task performance.

16
To illustrate how the different sensitivities shape people’s decision making, imagine
the situation of evaluating potential business opportunities and deciding which one
or ones to undertake. People are likely to consider a wide range of criteria such as
the resources required, the feasibility of the opportunities, potential loss due to
failure, and potential gain, among others. A promotion focus would orient people to
weight more heavily the perceived potential gains because their underlying concern
is for preferring opportunities that provide significant potential for advancement.
On the other hand, a prevention focus would induce people to attach more
significance to the perceived potential loss because their underlying concern is for
avoiding opportunities that entail significant risk, which can lead to loss and
endanger their security. Indeed, researchers have suggested that the different
sensitivities to gains or losses partly explains why firms that are led by promotion
focused CEOs undertake higher number and value of business acquisition than
firms that are led by prevention focused CEOs (Gamache et al., 2015).
It should be acknowledged that regulatory focus has been examined both as a
chronic disposition and also as a response to situational cues (Lanaj et al., 2012).
The chronic element of regulatory focus is a stable disposition developed through
people’s developmental and achievement experiences. People’s childhood
experiences of interacting with their primary caretakers shape their regulatory focus
(Higgins and Silberman, 1998). For example, the caretaker-child interaction that
emphasises attaining accomplishments can induce a promotion focus, while an
interaction that emphasised insuring safety can induce a prevention focus.
Additionally, people’s success or failure experiences in promotion and prevention
related self-regulation affect their tendencies toward using that strategy for goal
attainment (Higgins et al., 2001). On the other hand, the situational element of
regulatory focus is more malleable (Wu et al., 2008; Gorman et al., 2012) and can
be influenced by different situational factors such as the framings of task payoffs in
laboratory settings (Shah and Higgins, 1997) and the leadership style of supervisors
(Kark and Van Dijk, 2007; Wallace et al., 2009). Following previous
entrepreneurship research (Kammerlander et al., 2015; Bryant, 2009), this study
focuses on chronic regulatory focus because it has more stable effects on people’s
behaviours.

17
2.1.1.2 Implications of promotion and prevention focus
Having discussed the key differences between promotion and prevention focus, I
now introduce the psychological and behavioural implications of the two systems,
including how they affect people’s attitude toward change versus stability, relative
emphasis on speed versus accuracy in decision making, and the propensity towards
risk-taking versus risk aversion.
One distinction between promotion and prevention focus is the sensitivity to gain
versus loss. Researchers suggest that this difference impacts people’s attitude
towards change versus stability. In general, attending to gain induces people more
toward seeking change whereas attending to loss induces them more toward
maintaining the status quo (Liberman et al., 1999; Molden et al., 2008; Collins,
2016). People often engage in behavioural regulation to bring themselves into
alignment with their preferred goal states (Scholer and Higgins, 2011). That is, they
compare their current circumstance with desired end-states and act to reduce the
discrepancy when they experience discrepancy between the two. Moving toward
improved circumstances and away from the status quo is more desirable for people
with a promotion focus, whereas maintaining satisfactory or adequate
circumstances and avoiding the presence of problems is more critical for people
with a prevention focus. Consequently, promotion focused people prefer change
while prevention focused people prefer stability.
The different attitudes toward change and status quo maintenance are illustrated
within a study conducted by Liberman et al., (1999). In particular, the authors
examined how promotion and prevention focus impacts people’s willingness to
substitute an interrupted activity for another activity and to exchange an acquired
object for a different one. They found that promotion focused people are more likely
to switch to a new task when their previous one is interrupted than prevention
focused people, who will typically resume the old task. Additionally, promotion
focused people are more likely than prevention focused people to exchange an object
they already possess for a new object. The findings highlight the important role of
promotion and prevention focus in shaping people’s tendency towards change and
stability.

18
Similar findings have been observed with respect to other situations. Compared
with promotion focused people, prevention focused ones have a stronger preference
to maintain the status quo options - staying with the original choice of investment
funds they have chosen rather than switching to potentially better ones (Chernev,
2004). In another study examining consumers’ decision about the adoption of new
products, Herzenstein et al., (2007) found that prevention focused consumers are
less willing to try and use new products than promotion focused one. Additionally,
in a longitudinal study, Fuglestad et al., (2008) found that a promotion focus is
associated with a higher tendency to initiate behaviour changes (e.g., higher quit
rates of smoking) whereas a prevention focus is related to a higher propensity to
maintain behaviour change (e.g., remain smoke-free in the follow-up period).
While both theoretical and empirical evidence suggests that, compared with
promotion focused people, prevention focused ones have a stronger preference for
stability and are less willing to consider new possibilities and change, it is important
to acknowledge that a preference for stability and the status quo does not imply
prevention focused people would not practice change. In the situation of
experiencing losses, for example, prevention focused people might activate changes
that would allow them to regain adequate status quo (Collins, 2016).
In addition to influencing people’s attitude toward change versus stability,
promotion and prevention focus also have distinct impacts on people’s relative
emphasis on speed versus accuracy in decision making. The gain related concerns
associated with promotion focus induce a preference for eager judgement strategies,
whereas the loss related concerns associated with prevention focus induce a
preference for vigilant judgment strategies (Molden et al., 2008). As a result,
promotion focused people tend to emphasise speed during goal pursuit while
prevention focused people are likely to emphasise accuracy. Förster et al., (2003)
examined such differences using simple drawing tasks. Participants were required
to connect numbered dots to form pictures. Speed was measured by the numbers of
dots participants connected within a given time, and accuracy was measured by the
numbers of dots that they failed to connect. Prioritising speed represents an
eagerness strategy to maximise potential gains, whereas prioritising accuracy
represents a vigilance strategy to minimise potential losses. Consistent with their
expectations, Förster et al., (2003) found that promotion focused participants

19
produced faster (i.e., higher quantity) outputs, whereas prevention focused
participants produced more accurate (i.e., fewer mistakes) outputs.
In another experimental study, Spanjol et al., (2011) examined how promotion and
prevention focus affects teams’ decisions on new product introduction. Using
simulation tasks that involve decisions concerning the number, types, and timing of
new product introduction, the authors found that promotion focused teams (i.e.,
both members are promotion focused) introduced higher numbers of new products
than prevention focused teams. Additionally, the speed of new product introduction
as well as the novelty of products was higher for promotion focused teams than
prevention focused teams. Their findings also demonstrate that promotion and
prevention focus have distinct influences on people’s relative emphasis on decision
making concerning speed versus accuracy with respect to introducing new products.
These findings are consistent with the results from Förster et al., (2003) who
suggested that promotion focused people emphasise speed (or quantity) while
prevention focused people emphasise accuracy (or quality) during decision making.
Additionally, promotion and prevention focus have differential effects on people’s
tendency towards risk-taking. Research in regulatory focus theory suggests that
promotion and prevention focus are related to people’s risk-taking propensity
(Bryant and Dunford, 2008). Because promotion focus is associated with an
eagerness inclination to insure hits and insure against errors of omission,
promotion focused people are likely to have a higher tendency to engage in risk-
taking. By contrast, because prevention focus is associated with a vigilant
inclination to insure correct rejections and insure against errors of commission,
prevention focused people tend to exhibit higher tendencies toward risk aversion.
Florack and Hartmann (2007) examined such differences in an experiment
involving financial investment decisions. They found that prevention focused teams
are more risk averse than promotion focused teams in their investment decisions –
represented by allocating investment to funds that have lower levels of volatility,
which indicates the level of risks involved. In another study examining how
promotion and prevention focus impacts people’s actual risky behaviour in the
context of mobility, Hamstra et al., (2011) found that promotion focus was positively,
and prevention focus was negatively associated with people’s actual risky behaviour
in speeding.

20
While a prevention focus is typically supported by cautious means that entails lower
risk, in the situation of experiencing losses, prevention focused people can also
become more risk tolerant. For example, using a stock investment scenario, Scholer
et al., (2010) examined people’s risk seeking behaviours under loss. Specifically,
after participants had experienced a loss in a previous round of investment, they
were then presented with two different investment options. One investment option
entails higher risk with a payoff that may allow participants to recover their losses
from the previous investment, whereas another investment option involved lower
risk with a payoff that nevertheless could not eliminate their previous loss. Scholer
et al., (2010) found that compared with promotion focused participants, the ones
who are primed with a prevention focus exhibited higher risk seeking tendencies
and were more willing to choose the risky option over the conservative option. As
Collins (2016, p. 17) pointed out, “the concern with avoiding loss was so great that a
prevention focus evoked a willingness to select the riskier option” that may allow
prevention focused people to escape from the situation of loss.

21
2.1.2 Regulatory focus and firm outcomes
While regulatory focus was originally developed as an individual-level construct to
explain the differences in people’s behaviours and underlying motivations,
researchers have applied it in the organisational context to understand how people’s
regulatory focus may affect the behaviours and performance of organisations. For
example, recent studies have shown that the regulatory focus of CEOs or
entrepreneurs has profound impacts on the behaviours and performance of firms
they lead (Kammerlander et al., 2015; Gamache et al., 2015; Greenbaum, 2015;
Wallace et al., 2010; Hmieleski and Baron, 2008). Such findings are not surprising
given that CEOs or entrepreneurs are the primary decision makers within their
organisations (Hambrick and Mason, 1984). As such, their regulatory focus induced
decisions should impact firms they lead.
For example, Kammerlander et al., (2015) examined the effects of CEO regulatory
focus on firms’ level of engagement in exploration and exploitation activities within
an SME context. Using survey responses from CEOs in Switzerland, the authors
found that CEOs’ level of promotion focus is positively related to firms’ level of
exploration and exploitation; and that these correlations are also enhanced under
conditions of intense competition. They also found that CEOs’ level of prevention
focus negatively affects firms’ exploration but that there is no correlation with
exploitation. Additionally, Kammerlander et al., (2015) observed that promotion
focus positively impacts organisational ambidexterity but prevention focus does not
have similar effects. Although the authors did not directly test the performance
implications of promotion and prevention focus, their empirical results implicitly
suggest that under intensive competition, firms that are led by promotion focused
CEOs may achieve better outcomes than firms that are led by prevention focused
CEOs. This is because the former firms are better positioned to balance competing
activities (exploration versus exploitation), which in turn should contribute to better
performance (Lubatkin et al., 2006; O’Reilly and Tushman, 2011).
In addition to shaping firms’ exploration and exploitation behaviours, researchers
have found that CEO regulatory focus is also associated with other organisational
behaviours such as business acquisition and new product introduction (Gamache et
al., 2015; Greenbaum, 2015). For example, Gamache et al., (2015) examined the

22
impact of CEO regulatory focus on firms’ acquisition behaviour measured by the
number and value of acquisition. The authors captured CEO regulatory focus
through a content analysis of letters to shareholders over a period of ten years.
Consistent with their hypotheses, the authors found that CEO promotion focus
positively, and CEO prevention focus negatively, impact firms’ level of acquisition.
In another study within the context of the U.S. automobile industry, Greenbaum
(2015) found that CEO promotion focus positively, and CEO prevention focus
negatively, influence the number of new products introduced by firms they lead.
While these two studies are focusing on the context of large firms (Gamache et al.,
2015; Greenbaum, 2015), it is likely that the findings should hold true within SMEs,
and perhaps even more so, given that CEOs tend to play a more dominant role in
such firms (Finkelstein et al., 2009).
Moreover, a number of studies have suggested that the regulatory focus of CEOs or
entrepreneurs are related to small firm performance (Wallace et al., 2010) and new
venture growth (Hmieleski and Baron, 2008). For example, Wallace et al., (2010)
examined the direct relationships between CEO regulatory focus and small firm
performance, suggesting that both promotion and prevention focus positively
impact firm performance, and that environmental dynamism will moderate these
impacts. Using survey data collected from both CEOs and one of their top managers,
Wallace et al., (2010) found that promotion focus positively impacts firm
performance, and that this finding is consistent when using either the self-reported
performance data from CEOs or top managers. They also found that prevention
focus negatively impacts firm performance. Nevertheless, such results are only
observed on the performance data from the top manager but not the CEO-reported
performance data. As such, the nature of the link between CEO prevention focus
and firm performance remains inconclusive.
A related study from Hmieleski and Baron (2008) argues that regulatory focus can
indirectly impact new venture growth through shaping firms’ tendencies to deviate
from their original business concepts. Specifically, the authors propose that the
impact of regulatory focus on new venture growth is mediated by firms’ deviation
from original business concepts. As Hmieleski and Baron (2008, p. 287) noted,
“entrepreneurs must deviate from their original business opportunity as the
realities of an unpredictable future unfold” during the entrepreneurial process. They

23
found that, in dynamic environments, promotion focus relates positively, and
prevention focus relates negatively, to new venture growth. Both relationships are
fully mediated by firms’ deviation from their original business concepts. However,
no significant relationship between regulatory focus and venture performance was
observed under stable environments. Together, the empirical results from Wallace
et al., (2010) and Hmieleski and Baron (2008) demonstrate that the performance
effects of regulatory focus on organisations are context dependent. That is, the
impacts of regulatory focus are contingent upon the environmental context (i.e.,
environmental dynamism) in which firms operate.

24
2.1.3 The limitations of regulatory focus
As illustrated in the previous discussions, researchers have used the individual
difference regarding regulatory focus to explain the variance in firms’ behaviours or
performance. While existing studies have generated useful insights about the effects
of regulatory focus within organisational contexts, they are not without limitations.
For example, existing studies have shown that CEO regulatory focus shapes the
strategic behaviours of large firms (Gamache et al., 2015; Greenbaum, 2015).
However, these studies only assessed the effects of CEO regulatory focus alone
without considering the potential influence of other team members. This is
problematic because large firms are likely to be managed by top management teams
(Finkelstein et al., 2009), suggesting that other team members also play a
significant role in shaping the behaviours of organisations. As such, there are
reasons to expect that the variance in the behaviours of large firms is not only a
function of individual CEOs alone but also shaped by other top management team
members. Indeed, researchers have suggested that the regulatory focus of CEOs and
CFOs are likely to interact and influence firms’ growth related activities (Chen et al.,
2017). Accordingly, it is possible that studies that examine CEO regulatory focus in
large firm contexts may incorrectly attribute the variance in firms’ behaviours to
CEO regulatory focus while part of the variance may be due to the influences from
other team members.
Additionally, existing studies on the relationship between CEO regulatory focus and
firm behaviours mainly focus on the context of large firms with limited attention
being devoted to SMEs (e.g., Kammerlander et al., 2015). The lack of studies on
smaller firms may be because the use of regulatory focus theory within
organisational contexts is still nascent (for a recent review see Johnson et al., 2015).
Because the organisational structure and managerial systems often differ between
large firms and SMEs (Aldrich and Auster, 1986), the results generated from large
firms may not hold true within SMEs. For example, researchers have highlighted
that the CEOs of small firms have higher levels of managerial discretion (Finkelstein
and Hambrick, 1990b; Finkelstein et al., 2009; Wangrow et al., 2015), suggesting
that their influence on such firms should be more salient. Accordingly, while the
findings generated from large firm contexts can shed light on the influence of CEO
regulatory focus on organisations, more research is still needed to uncover the

25
nature and extent of the influence of CEO regulatory focus on the behaviours of
SMEs.
A third limitation of existing studies of regulatory focus within organisational
contexts is that the potential interplays between promotion and prevention focus
are largely ignored. Regulatory focus theory suggests that promotion and
prevention focus represent two independent systems rather than opposite ends of a
single continuum (Higgins, 1997, 1998). In support of this view, results from a meta-
analysis of studies on regulatory focus and work-related outcomes have shown that
there is a relatively weak association between promotion and prevention focus
(Lanaj et al., 2012), suggesting that people may have varying combinations of
promotion and prevention focus. For example, people may be high or low in both
promotion and prevention focus or they may be high in one attribute and low in
another (Markovits, 2012). Nevertheless, the majority of existing studies that
examine regulatory focus within organisational contexts did not consider the
potential interplay between promotion and prevention focus, except one recent
study from Kammerlander et al., (2015). Thus, in addition to assess the direct
influence of promotion and prevention focus on the behaviours or performance of
organisations, it would be paramount to consider how the varying combinations of
promotion and prevention may influence the outcomes of organisations.

26
2.2 Entrepreneurial Orientation
Research on entrepreneurial orientation (EO) has attracted substantial attention in
the past three decades. Indeed, EO has been considered as a central concept within
entrepreneurship literature (Covin and Lumpkin, 2011). Nevertheless, debates
remain on the nature of the EO construct, its dimensionality, and the measurement
of the construct (Covin and Lumpkin, 2011; George and Marino, 2011; Covin and
Wales, 2012). Additionally, the performance implications of EO remain
inconclusive because the empirical evidence on the relationship between EO and
firm performance has been mixed (Rauch et al., 2009; Tang et al., 2008; Su et al.,
2011; Wales et al., 2013c). Before discussing the limitations of existing EO studies,
I first introduce the development of the EO concept and how it contributes to the
field of entrepreneurship research.
2.2.1 The historical roots and conceptual development of EO
The historical root of the EO concept can be traced to the strategy-making process
literature (e.g., Mintzberg 1973). In particular, Mintzberg (1973) conceived three
modes of strategy-making with one of them being the entrepreneurial mode. The
author proposed that the entrepreneurial mode of strategy-making is characterised
by the active search for new opportunities and undertaking bold decisions under
conditions of uncertainty through which organisations may make dramatic gains.
In a similar vein, Khandwalla (1976/77, p. 22) extended the concept of management
style, which refers to the “operating set of beliefs and norms about management
held by the organization’s key decision makers”. The author suggested that an
entrepreneurial management style is characterised by “bold, risky, aggressive
decision making” (Khandwalla, 1976/77, p. 25).
Building on the work of Mintzberg (1973) and others, Miller and Friesen (1982)
distinguished entrepreneurial firms from conservative firms based on the
innovation strategies firms undertake. Specifically, entrepreneurial firms are “firms
that innovate boldly and regularly while taking considerable risks in their product-
market strategies” (Miller and Friesen, 1982, p. 5), whereas conservative firms are
firms that undertake innovation mainly in response to the challenges they face.
Hence, entrepreneurial firms tend to aggressively pursue innovation unless there is

27
evidence that resources are being exhausted by too much innovation. Conversely,
conservative firms are likely to innovate in response to competitive attacks or
changing customer needs in the market environment. As such, innovation in
conservative firms tends to be reactive as it takes place only when necessary.
In a subsequent seminal work, Miller (1983, p. 771) proposed that “[a]n
entrepreneurial firm is one that engages in product-market innovation, undertakes
somewhat risky ventures, and is first to come up with ‘proactive’ innovations,
beating competitors to the punch.” While Miller never employed the term EO in this
initial work (Miller, 2011), researchers often credit him with introducing the EO
concept because this seminal work laid the foundation of EO, which was later
adopted and extended by other researchers (e.g., Covin and Slevin, 1989; Lumpkin
and Dess, 1996). In particular, Miller’s early work on EO is important in two ways.
Firstly, Miller conceived the characteristics that are essential for a firm to be labelled
as entrepreneurial. The characteristics have been widely used as the three core
dimensions of the EO construct (i.e., innovativeness, risk-taking, and
proactiveness). Secondly, Miller’s work contributes to the changing focus of
entrepreneurship from individual actors to the firm-level process. As Miller (1983,
p. 770) noted, rather than focusing on the entrepreneurs who make the strategic
decisions, “this paper shifts the emphasis somewhat, looking at the entrepreneurial
activity of the firm.”
Nevertheless, Miller’s work is not without limitations. While Miller (1983)
suggested that a firm can be characterised as entrepreneurial when it exhibits
innovativeness, risk-taking, and proactiveness concurrently, whether such
entrepreneurial behaviours should be sustained to some degree over time is
unknown. In other words, the temporal element of EO is largely ignored in the early
conceptualisation of the construct. To illustrate, it is possible that a firm may only
exhibit singular entrepreneurial behaviour, or it may exhibit entrepreneurial
behaviours occasionally or on a sustained basis. The temporal issue of EO was then
addressed by subsequent scholars (e.g., Covin and Slevin 1991).
Covin and Slevin (1991, p. 7) extended the EO concept by suggesting that
“organizations with entrepreneurial postures, are those in which particular
behavioral [sic] patterns are recurring”. The term entrepreneurial posture is

28
synonymous with the concept of EO because it represents firm-level behaviours
concerning innovativeness, risk-taking, and proactiveness. Based on this extension,
a firm can be classified as entrepreneurial only when it exhibited sustained
entrepreneurial behaviours. Additionally, the authors are explicit in pointing out
that the existence of EO requires the concurrent exhibition of all three dimensions
that are expected to co-vary. It is worth noting that Covin and Slevin (1991)
conceived EO as an independent variable that could be used to explain variation in
firm performance. Their work differs from Miller’s original work that examines the
factors and processes that lead to EO, which is operationalised as a dependent
variable.
A major shift in the conceptual development of EO comes from the work by
Lumpkin and Dess (1996, p. 137), who conceived EO as “the processes, practices,
and decision-making activities that lead to new entry”. The authors suggested that
new entry is the result of launching new or existing products into new or established
markets. Drawing on the difference between process and result, the authors
proposed that EO refers to the process and entrepreneurship refers to the outcome
of the process. More specifically, EO represents how the new entry is achieved
through a range of entrepreneurial activities, whereas entrepreneurship represents
the result of those activities. Lumpkin and Dess’s (1996) conceptualisation of EO
differs from previous works in two important aspects. First, EO is viewed as a
multidimensional construct comprised of dimensions that can vary independently.
This differs from previous views (i.e., unidimensional) that the dimensions of EO
should co-vary (Covin and Slevin, 1989). Second, the number of EO dimensions is
increased from the original three dimensions (i.e., innovativeness, risk-taking, and
proactiveness) to five dimensions with the inclusion of autonomy and competitive
aggressiveness. The dimensions of EO are elaborated later in this chapter (see
section 2.2.2.2).
In a subsequent development of EO, Kreiser et al., (2002) used a cross-cultural
sample to validate the EO measure developed by Covin and Slevin (1989). The
authors assessed the model fits when EO is operationalised as a one, two, or three
dimensional constructs. They found that EO is best operationalised as a three
dimensional construct. As Kreiser et al., (2002) highlighted, when the three
dimensions are aggregated into one, the potential independent influence of each

29
dimension on firm performance will be ignored. Additionally, their empirical results
demonstrated that the three dimensions of EO can vary independently. While the
authors’ primary purpose was to validate the EO measure, their work leads to a
unique variation in the development of EO. Specifically, EO is best operationalised
as a multidimensional construct that consists of three independently varying
dimensions: innovativeness, risk-taking, and proactiveness. This conceptualisation
represents an integration of the multidimensional view of EO (Lumpkin and Dess,
1996) with the three dimensions proposed by Miller (1983) and Covin and Slevin’s
(1989).
The conceptual development of EO has contributed to our understanding of firm-
level entrepreneurship in three ways. Firstly, the early works of EO were among the
pioneers to shift the focus of entrepreneurship research from the actor (i.e.,
entrepreneur) to the entrepreneurial activity of the firm (Zahra et al., 2013). As
Miller (1983, p. 770) pointed out, “what is most important is not who is the critical
actor, but the process of entrepreneurship itself and the organizational factors
which foster and impede it”. As such, EO serves as one of the foundations for the
development of entrepreneurship as a firm-level behavioural phenomenon (Covin
and Slevin, 1991). The conceptualisation of EO also paves the way for researchers to
investigate the antecedents and consequences of firm-level entrepreneurial
behaviours. For example, theoretical and empirical works have explored the
determinants of EO and how EO impacts the outcomes of organisations (Covin and
Slevin, 1991; Zahra, 1993; Lumpkin and Dess, 1996; Wales et al., 2013a).
Secondly, the EO construct allows researchers to make a distinction between the
process (EO) and the results from the process (entrepreneurship). It delineates the
essential factors that are required (Miller, 1983) or pertinent (Lumpkin and Dess,
1996) for firms to be classified as entrepreneurial. Specifically, it outlines the
entrepreneurial behaviours (e.g., innovativeness, risk-taking, and proactiveness)
that firms can undertake to renew themselves. In an increasingly competitive
market, it is imperative for firms to sustain their competitiveness through pursuing
entrepreneurial activities. As Covin and Lumpkin (2011, p. 862) noted, the EO
construct offers useful insights to understanding “why and how some firms are able
to regularly renew themselves via new growth trajectories while others are not".

30
Thirdly, since EO is conceived as a firm-level attribute, all firms can be plotted based
on their EO (Covin and Slevin, 1989). As such, it allows researchers to make
meaningful comparisons on firms’ extent of entrepreneurial activities. Indeed, the
EO scale offers a useful common metric that has been widely used by researchers to
assess the entrepreneurial level of firms (Rauch et al., 2009; George and Marino,
2011). This, in turn, has contributed to entrepreneurship literature as studies can
thus assess how the different levels of entrepreneurial activities might result in
variation in firm performance.
In short, there are several different conceptualisations of EO (for a recent review see
Randerson, 2016). Miller’s seminal work serves as the foundation of the EO concept.
Building upon this, researchers have conceptualised EO in different ways. Some
researchers conceive EO as a unidimensional construct comprised of three
dimensions that should co-vary (Covin and Slevin, 1989), while others
conceptualise EO as a multidimensional construct comprised of three or five
dimensions that can vary independently (Lumpkin and Dess, 1996; Kreiser et al.,
2002). As a prominent theoretical construct in the entrepreneurship literature, EO
has offered important contributions to the field of entrepreneurship research.
Nevertheless, the different conceptualisations of EO have also resulted in several
limitations and debates on this area, which are explored below.
31
2.2.2 The limitations of EO
Despite the popularity of EO, there are several limitations associated with EO
research. In particular, debates remain on whether EO is a dispositional or
behavioural phenomenon, a unidimensional or multidimensional construct, and
how to operationalise the measurement of EO. Given these issues related to EO,
Covin and Lumpkin (2011, p. 859) assert that EO is an “annoying construct” and
“for every scholar who employs the construct of EO in his or her research, there is
another scholar who simply wishes it would exit the scholarly conversation”. The
issues in relation to the definitional inconsistencies, the dimensionality of EO, and
the measurement of the construct are discussed in turn.
2.2.2.1 Definitional inconsistency
Since there is a lack of consensus on whether EO represents a dispositional or a
behavioural phenomenon (Miller, 2011; Covin and Lumpkin, 2011), researchers
have defined EO in different manners (George and Marino, 2011). For example,
some researchers define EO as “a firm-level disposition to engage in behaviors [sic]
that lead to change in the organization or marketplace” (Voss et al., 2005, p. 1134).
Dispositions refer to the “tendencies to respond to situations, or classes of situations
in a particular, predetermined manner” (House et al., 1996, p. 205). Accordingly,
when EO is conceived as a dispositional phenomenon, it represents a firm’s
tendency to act in an entrepreneurial manner. Conversely, other researchers
conceptualise EO as “a set of distinct but related behaviors [sic]” that are
entrepreneurial in nature (Pearce et al., 2010, p. 219). Researchers have highlighted
that the definitional inconsistencies of EO have undermined the credibility of EO
research and hindered the accumulation of knowledge in this area (George and
Marino, 2011; Randerson, 2016).
This study adopts the view that EO is better examined as a behavioural phenomenon
rather than as a firm-level disposition based on three reasons. Firstly, it is a firm’s
actions that make it entrepreneurial rather than its dispositions, which may or may
not be manifested into entrepreneurial behaviours (Covin and Lumpkin, 2011). For
instance, the presence of a disposition to pursue entrepreneurial endeavours may
not translate into such behaviours. Hence, while the disposition toward
entrepreneurial behaviours can be associated with EO, it is not a sufficient defining

32
factor of the concept. Indeed, researchers have highlighted that we know
entrepreneurs through their actions (Gartner, 1989), and that “behaviour [sic] is the
central and essential element in the entrepreneurial process”(Covin and Slevin, 1991,
p. 8). Following the same line, the exhibition or absence of entrepreneurial
behaviours should be a better indicator of whether a firm is entrepreneurial or not.
Secondly, examining EO as a behavioural construct can offer benefits in relation to
measuring and managing EO. As a behavioural construct, a firm’s level of EO can
be better gauged because behaviours tend to be demonstrable (Covin and Slevin,
1991). We can thus reliably distinguish entrepreneurial firms from conservative
firms through measuring their demonstrable behaviours. Conceiving EO as a
behavioural construct also allows potential intervention. That is, a firm may manage
EO to stimulate or decrease its entrepreneurial activities. For example, a firm may
cultivate an organisational environment (Fayolle et al., 2010) and strategies (Miller,
1983) to foster or alleviate its level of EO. Finally, if EO is conceived as a
dispositional construct, it becomes problematic to distinguish the concept of EO
from related entrepreneurial attributes (e.g., entrepreneurial culture), that are also
intangible in nature (Blumentritt et al., 2005).
2.2.2.2 The dimensionality issue
There are two predominant views about the dimensionality of EO: unidimensional
and multidimensional. The unidimensional view is associated with the work of
Miller (1983) and Covin and Slevin (1989) who suggested that EO is comprised of
three dimensions, namely, innovativeness, risk-taking, and proactiveness. In
particular, EO represents “the common or shared variance among risk-taking,
innovativeness, and proactiveness” (Covin and Lumpkin, 2011, p. 862). Hence, the
existence of EO requires the concurrent exhibition of all three dimensions. This
implies that a firm cannot be classified as entrepreneurial if it exhibits only one or
two of the dimensions (Miller, 1983). Innovativeness represents firms’ propensities
to engage in and support new ideas and experimentation that may lead to new
products, services and processes (Lumpkin and Dess, 1996; Wiklund and Shepherd,
2005). Risk-taking refers to the willingness to make substantial resource
commitments that have uncertain outcomes (Miller and Friesen, 1978; Rauch et al.,
2009). Proactiveness refers to the “forward-looking, first mover advantage-seeking

33
efforts to shape the environment by introducing new products or processes ahead
of the competition” (Lyon et al., 2000, p. 1056).
The multidimensional view of EO is associated with the work of Lumpkin and Dess
(1996) who suggested that EO consists of five dimensions that can vary
independently. Lumpkin and Dess (1996, p. 137) explicitly assert that all of the
dimensions “may be present when a firm engages in new entry. In contrast,
successful new entry also may be achieved when only some of these factors are
operating”. To illustrate, an entrepreneurial firm may exhibit high levels on all
dimensions, or it may have high levels on some of the dimensions but low on others.
In addition to the original three dimensions conceived by Miller (1983), Lumpkin
and Dess (1996) proposed to include competitive aggressiveness and autonomy as
two additional dimensions of EO. Competitive aggressiveness represents a firm's
tendency to directly challenge its competitors to outperform them in the
marketplace. As such, it differs to the proactiveness dimension that is more client-
oriented rather than competitor-focused (Miller, 2011). Autonomy refers to “the
independent action of an individual or a team in bringing forth an idea or a vision
and carrying it through to completion” (Lumpkin and Dess, 1996, p. 140).
Many studies have deviated from the original three or five-dimensions of EO and
have used different dimensional combinations (Wales et al., 2013a). For example,
some researchers operationalise EO as a construct comprising of only two
dimensions: proactiveness and innovativeness (Merz and Sauber, 1995; Knight,
1997) or proactiveness and risk-taking (Avlonitis and Salavou, 2007). Other
researchers used three dimensions of EO by combining the work from Miller (1983)
and Lumpkin and Dess (1996) (e.g., combining proactiveness, risk-taking, and
competitive aggressiveness) (Wales et al., 2013a). The proliferation of EO through
various dimensional combinations is likely to hinder the rigor of EO research (Basso
et al., 2009; Wales, 2016). As George and Marino (2011) noted, defining the EO
concept with only two dimensions will decrease the intension - the collection of
encompassed properties - of EO and reduce the precision of the concept. For
example, one firm may exhibit high levels of EO based on one study, but this not be
the case according to another. Also, the lack of consistency in employing these EO
dimensions makes it problematic to make meaningful comparisons of the results
from differing studies.

34
This study examines EO as a multidimensional construct that involves three core
dimensions including innovativeness, risk-taking, and proactiveness. Competitive
aggressiveness is not included in this study because it may overlap with
proactiveness (Basso et al., 2009). To illustrate, competitive aggressiveness entails
a tendency to outperform competitors in the marketplace (Lumpkin and Dess, 1996),
while proactiveness also involves a goal to beat “competitors to the punch” (Miller,
1983, p. 771). As Basso et al., (2009, p. 318) pointed out, “trying to outrun or
outperform one’s competitors is indeed a sign of proactiveness”. This implies that
there may not be a clear-cut distinction between competitive aggressiveness and
proactiveness. Also, autonomy, which is represented by the independent action of
individuals or teams to conceive and realise new ideas, is not included in this study
as it may not be accomplished and maintained at the firm level (Edmond and
Wiklund, 2010). Examining the original three dimensions of EO is also consistent
with the majority of existing EO studies (Rauch et al., 2009; Wales, 2016).
While this study adopts the multidimensional view of EO, it is important to
acknowledge that the unidimensional and multidimensional view are distinct, that
neither view is necessarily superior to the other, and that both views have
contributed significantly to the EO literature. Indeed, researchers have highlighted
that “the two predominant conceptualizations can co-exist in the literature with
each approach providing unique insights” (Wales, 2016). Nevertheless, recent
studies have suggested that it is imperative to consider the differences between the
dimensions of EO (Miller, 2011) because “aggregating the entrepreneurial
orientation dimensions into one combined measure … can result in their
independent influences being distorted or canceled [sic] out altogether” (Dai et al.,
2014, p. 519). As such, when the dimensions of EO are combined into one factor, the
uniqueness of each dimension is ignored. Accordingly, this study operationalises EO
as a multidimensional construct and examines the performance implications of
innovativeness, risk-taking, and proactiveness independently.
2.2.2.3 Measurement issues
EO can be operationalised as a reflective or formative construct (Covin and Wales,
2012). A major difference between reflective and formative constructs is the
relationship between the latent construct and its measures (Covin and Wales, 2012;
35
George and Marino, 2011). As shown in Figure 2-2 (a), when EO is operationalised
as a reflective second-order construct, the latent construct EO lead to changes in its
measures. In other words, EO is manifested through innovativeness, risk-taking,
and proactiveness, suggesting that “an increase in EO would be expected to increase
the level of each of these dimensions” (George and Marino, 2011, p. 999). As such,
the EO construct is measured by using the arithmetic average of the scores of its
three dimensions. Conversely, as shown in Figure 2-2 (b), when EO is
operationalised as a formative construct, it is formed by innovativeness, risk-taking,
and proactiveness. In other words, “EO is created by its dimensions, rather than the
dimensions being manifestations of EO” (George and Marino, 2011, p. 1000). The
majority of existing studies operationalise EO as a reflective construct. Indeed, a
recent review has revealed that 54 out of the 61 EO studies aggregated the
dimensions of EO into one factor (George and Marino, 2011).

36
Figure 2-2: (a) Reflective second-order model. (b) Formative second-order model
(George, 2011)
EO has been measured using different scale items (Covin and Wales, 2012;
Randerson, 2016), which make the comparison of EO research problematic. In a
recent review of empirical studies on EO, for example, Rauch et al., (2009) found
that the number of items used to measure innovativeness, risk-taking, and
proactiveness varied from six to eleven items. While the nine-item scale developed
by Covin and Slevin (1989) is the most widely used measure in existing EO research
37
(Rauch et al., 2009; George and Marino, 2011; Wales et al., 2013a), researchers have
noted that it also has limitations because the scale includes both dispositional and
behavioural items (Anderson et al., 2015). To illustrate, one of the items for
innovativeness assesses the extent to which firms favour innovation related
activities (disposition), and another measures firms’ actual innovation activities,
represented by changes in their product line (behaviour). However, other
researchers have argued that the presence of disposition-related items should not
undermine the quality of the scale because “the inclusion of such [disposition-
focused] items helps assure that the behaviors [sic] assessed are likely being driven
by stable response tendencies (as opposed to chance or other nonsystematic stimuli)”
(Covin and Lumpkin, 2011, p. 859).
This study operationalises innovativeness, risk-taking, and proactiveness as unique
variables rather than combining them as a single factor. This is consistent with the
suggestion from Rauch et al., (2009, p. 779) that “it may be more appropriate to
study antecedences and consequences of EO at the level of the dimensions of EO”.
As Miller (2011, p. 880) concurs, “the components of EO are more telling than the
aggregate index”. That is, combining innovativeness, risk-taking, and proactiveness
together will prevent us from gaining an understanding of the distinctiveness of the
three EO dimensions. For example, it is possible that the effects of a low score in
one of the dimensions may go unnoticed (Basso et al., 2009). Researchers have also
suggested that studies following the combined approach might “hide or inaccurately
attribute effects resulting from variations in only a single dimension of EO”
(Lomberg et al., 2016, p. 2). Assessing the dimensions of EO as unique variables is
also consistent with Covin and Wales’s (2012, p. 696) suggestion that “separately
assessing EO’s sub-dimensions using individual reflective-type scales is a
reasonable measurement approach”. This approach has been adopted in recent EO
studies (Kreiser et al., 2013; Dai et al., 2014). Following the majority of EO research
(Rauch et al., 2009; George and Marino, 2011; Wales et al., 2013a), this study uses
the nine-item measurement scale developed by Covin and Slevin (1989) to measure
the three dimensions of EO.
38
2.2.3 EO and firm performance
The performance implications of EO has been a central focus in EO research (Rauch
et al., 2009; Gupta and Wales, 2017). In general, there are two streams of research
that examine the relationship between EO and firm performance. The first stream
examines EO as a unidimensional construct and assesses how EO can have an
impact on firm performance. Theoretical arguments suggest that EO contributes to
better firm performance (Lumpkin and Dess, 1996). In a fast changing business
environment with shortened product lifecycles, the future profit streams from
existing products are uncertain. For example, the sales of existing products and
services may stagnate due to changes in consumer demands and the market
environment. As such, firms should constantly seek out new product and market
opportunities to renew themselves.
Firms may benefit from adopting an EO because, through engagement in innovation
and risk-taking efforts, and acting in anticipation of future market demand, they
can capitalise on new product and market entry opportunities (Lumpkin and Dess,
1996; Wiklund and Shepherd, 2003). The wider pool of new opportunities serves as
a potential source for firms to develop competitive advantage (Ireland et al., 2009),
thereby contribute to better performance. As such, entrepreneurial firms are likely
to outperform their conservative counterparts. Consistent with this view, a wide
range of empirical studies have proposed and demonstrated that the
unidimensional EO is positively associated with firm performance (Zahra and Covin,
1995; Wiklund, 1999; Lee and Tsang, 2001; Wiklund and Shepherd, 2003, 2005).
Indeed, a meta-analysis of the EO – firm performance relationship also revealed a
positive link between them (Rauch et al., 2009).
Nevertheless, researchers have suggested that the potential negative effects of EO
should not be ignored (Wiklund and Shepherd, 2011). From a theoretical
perspective, there are reasons to expect that high levels of EO might also have
detrimental effects on firm performance. For example, EO entails risk-taking and
innovativeness. Increasing levels of risk-taking have been associated with higher
probabilities of failure (Alvarez, 2007). Similarly, high levels of innovativeness
require firms to deviate from existing practice and venture into areas that are
beyond their current expertise (Lumpkin and Dess, 1996). As such, increasing levels
39
of innovativeness are associated with higher uncertainty of outcomes. Indeed,
research suggests that the range of possible performance outcomes tends to increase
within EO firms because not all entrepreneurial activities will turn out successfully
and lead to positive returns (Wiklund and Shepherd, 2011). Firms that engage in
high levels of entrepreneurial activities are likely to produce a distribution of
outcomes ranging from success (e.g., making profits) to failure (e.g., making losses)
in their endeavours. As a result, a high level of EO should result in a greater extent
of variation in firm performance. In line with this notion, recent empirical evidence
has shown that EO is related to greater firm performance variance (Wales et al.,
2013b).
Additionally, a number of empirical studies have revealed a curvilinear relationship
between EO and firm performance, providing further evidence that increasing levels
of EO may not lead to universally positive outcomes. Tang et al., (2008) found an
inverted U-shaped relationship between EO and firm performance among Chinese
firms. Su et al., (2011) observed an inverted U-shaped relationship between EO and
firm performance among Chinese new ventures, and a positive relationship in
established firms. Similarly, Wales et al., (2013c) found that, after a certain point,
increasing levels of EO have diminishing effects on firm performance. The authors
suggested that, on average, “a relatively low to moderate level of EO produces the
highest growth in small firms” (Wales et al., 2013c, p. 112). Together, these findings
suggest that increasing levels of EO provide benefits for organisations, but that
when levels of EO are too high, it could have detrimental effects on organisations.
The second stream of research disaggregates EO into its sub-dimensions and
assesses the independent effects of each dimension of EO on firm performance.
While this approach has the advantage of uncovering the unique effects of each EO
dimension on firm performance, it has received less attention in existing studies
(Rauch et al., 2009; George, 2011; Wales et al., 2013a). For studies that have
explored the differential effects of individual EO dimensions on firm performance,
the empirical results have been mixed. Some researchers have found that the
relationship between the different EO dimensions (i.e., proactiveness, risk-taking,
innovativeness) and firm performance is linear (Hughes and Morgan, 2007) while
others have reported a curvilinear relationship (Kreiser et al., 2013). For example,
some researchers found a positive linear relationship between risk-taking and firm

40
performance (Swierczek and Ha, 2003), while others found a negative linear link
(Hughes and Morgan, 2007), and a third group yet has suggested a curvilinear
relationship (Kreiser et al., 2013). Similarly, empirical evidence on the relationship
between proactiveness / innovativeness and firm performance has been
inconsistent. Hence, the performance implications of innovativeness, risk-taking,
and proactiveness on organisations remain inconclusive.
41
2.3 Regulatory focus versus entrepreneurial orientation
The preceding discussions suggest that while both regulatory focus and EO
represent promising predictors in explaining the variance in firm performance, the
two factors differ significantly on two aspects. Firstly, regulatory focus and EO
represent constructs at different levels. In particular, regulatory focus is an
individual-level construct that was originally conceived to explain why individuals
differ in their decision making and behaviours (Higgins, 1997, 1998; Brockner et al.,
2004). With the development of regulatory focus theory, researchers have extended
it to organisational contexts and explored how individual differences in regulatory
focus impacts the behaviours and performance of organisations (Johnson et al.,
2015). By contrast, EO is a firm-level construct that was conceptualised to delineate
the types of behaviours that are typically associated with entrepreneurial firms
(Miller, 1983, 2011). While the nature of the relationship between EO and firm
performance remains inconclusive, it is generally recognised that there is a link
between them, because the entrepreneurial activities firms pursue may allow them
to develop new products for the market, capitalise on potential new opportunities,
or establish first-mover advantage.
Secondly, regulatory focus and EO refer to different natures of phenomenon.
Regulatory focus represents a motivational characteristic associated with
individuals (Molden et al., 2008; Gamache et al., 2015). As individual-level
characteristic, the potential effects of people’s regulatory focus on organisations
may or may not be materialised. To illustrate, firms that are led by CEOs with high
levels of promotion focus may be more risk-tolerant. However, it is possible that the
lack of resources within such firms might hinder its capability to translate the risk-
taking tendencies into action. In other words, the behavioural tendency induced by
regulatory focus may not always translate into action. Additionally, there should be
some underlying mechanisms through which the performance effect of regulatory
focus can occur. For example, through influencing people’s decision making,
regulatory focus might influence the behaviours or capabilities of firms, which in
turn results in the variance in firm performance. On the other hand, EO represents
a set of entrepreneurial behaviours, including innovativeness, risk-taking, and
proactiveness that firms pursue (Lumpkin and Dess, 1996; Wales, 2016). It is fair to

42
argue that the entrepreneurial activities firms undertake should have an impact,
which may be positive, neutral or negative, on the performance of organisation.
Taken together, one may suspect that the performance effects of firm-level EO are
likely to be more salient than the performance effects of individual-level regulatory
focus.
Despite the significant difference between regulatory focus and EO, it is important
to note that a potential link may exist between these two constructs. Theoretical
arguments suggest that organisational behaviours are often a function of the people
who are in charge (Hambrick and Mason, 1984; Hambrick, 2007), implying that
CEOs should determine the activities firms undertake. In support of this view, a
wide range of empirical evidence has demonstrated that CEOs’ characteristics
significantly impact the behaviours of organisations (Busenbark et al., 2016). As
Miller and Friesen (1982) pointed out, the “goals and temperament” of CEOs
determines the strategic behaviours of firms they lead. Because regulatory focus
underlies the goals people aim to achieve as well as the strategic means they prefer
to use (Brockner et al., 2004), CEOs’ goals and strategic preferences might be
manifested through the behaviours of organisations they lead. Indeed, a number of
empirical studies have revealed that CEO regulatory focus shapes firm-level
behaviours (Gamache et al., 2015; Kammerlander et al., 2015). This empirical
evidence demonstrates that CEO regulatory focus is likely to have an impact on the
entrepreneurial behaviours of organisations.

43
Chapter 3 Hypothesis Development
The literature review chapter has illustrated that both CEO regulatory focus and the
dimensions of EO are likely to have an impact on organisations. This hypothesis
development chapter outlines the potential relationships among the focal variables,
including CEO regulatory focus, and the three dimensions of EO and firm
performance examined in this study. It is divided into three sections with each
section corresponding to one research question outlined in the introduction chapter.
Specifically, the first section presents the potential effects of CEO regulatory focus
on firm performance and how these effects vary between SMEs operating in high-
tech industries and those in low-tech industries, addressing research question one.
In response to research question two, the second section outlines the potential links
between the three dimensions of EO and firm performance as well as how their
relationships differ between SMEs operating in high-tech industries and those in
low-tech ones. The final section covers the potential relationships between CEO
regulatory focus and the three EO dimensions, addressing research question three.

44
3.1 Regulatory focus and firm performance
3.1.1 Promotion focus and firm performance
I posit that CEO promotion focus will be associated with firm performance because
it is likely to impact firms’ capabilities to (a) adapt quickly to fast changing
environment; (b) perform and balance differing and competing activities
(exploration and exploitation); and (c) identify and capitalise on new opportunities.
First, promotion focus can enhance firms’ strategic flexibility (Aaker and
Mascarenhas, 1984), which refers to the ability to adapt quickly to changes in the
environment. Research in regulatory focus theory suggests that people with high
levels of promotion focus are more open to change and new possibilities (Liberman
et al., 1999), implying that promotion focused CEOs should have more positive
attitudes towards change. As such, firms that are led by CEOs with high levels of
promotion focus will likely have higher tendencies to adjust their activities in
response to the changing environment. Consistent with this view, it has been found
that firms that are led by promotion focused entrepreneurs are more likely to adapt
their original business concept in a dynamic environment (Hmieleski and Baron,
2008). This finding demonstrates that CEO promotion focus tends to enhance firms’
ability to respond quickly to environmental changes. As firms’ success depends on
their ability to adapt quickly in the competitive environment (Hitt et al., 1998;
Nadkarni and Herrmann, 2010), it is thus expected that promotion focus should
contributes to better performance.
Second, promotion focus can influence firms’ capability to “perform differing and
often competing, strategic acts at the same time”, which refers to organisational
ambidexterity (Simsek et al., 2009, p. 865). Recent empirical evidence has shown
that CEO promotion focus positively affects organisational ambidexterity. In
particular, Kammerlander et al., (2015) found that firms that are led by promotion
focused CEOs engage in high levels of exploration and exploitation activities.
Exploration concerns activates such as “search[ing], experimentation and
variation”, whereas exploitation entails activities involving “choice, implementation
and variance reduction” (Lavie et al., 2010, p. 110). Theoretical arguments suggest
that a balance between exploration and exploitation (organisational ambidexterity)
is essential for firm success (March, 1991). Empirical studies have demonstrated
45
that firms that can balance exploration and exploitation activities are more likely to
achieve better performance (He and Wong, 2004; Atuahene-Gima and Murray,
2007; Cao et al., 2009). As promotion focus can help to induce organisational
ambidexterity, firms that are led by promotion focused CEOs should achieve
increased performance.
Finally, promotion focus might also impact firms’ capability to identify and
capitalise on new opportunities. People with high levels of promotion focus are more
opportunity oriented as they are motivated to satisfy their needs for growth (Higgins,
1997; Tumasjan and Braun, 2012). As a result, promotion focused CEOs should be
more motivated to proactively seek new opportunities. As Johnson et al., (2015, p.
1512) noted, “[i]ndividuals with a promotion focus would be more likely to search
for and identify new opportunities than those with a prevention focus.” Indeed, it
has been found that promotion focused entrepreneurs engage with a higher number
of business contacts for new information (Pollack et al., 2015) and are more likely
to identify higher quantity and quality of new opportunities (e.g., innovativeness)
(Tumasjan and Braun, 2012). Furthermore, firms that are led by promotion focused
CEOs introduce more new products (Greenbaum, 2015) and pursue higher levels
of business acquisition (Gamache et al., 2015). As promotion focus may stimulate
firms to proactively seek and pursue new opportunities, which is a critical factor for
business success (Hughes and Morgan, 2007), firms that are led by promotion
focused CEOs should have the advantage to capitalise on new opportunities which
may lead to better performance. In short, the above theoretical and empirical
arguments suggest that promotion focus will likely enhance firm-level capabilities
which, in turn, contribute to better firm performance. Therefore, it is hypothesised
that:
Hypothesis 1: CEO promotion focus will be positively associated with firm
performance.
3.1.2 Prevention focus and firm performance
Similarly, there are reasons to expect that CEO prevention focus will be associated
with firm performance. However, the effect of prevention focus on firm
performance should be negative based on three reasons. Prevention focus can

46
undermine firms’ strategic flexibility, which in turn negatively affects firm
performance. People with high levels of prevention focus prefer stability over
change (Liberman et al., 1999). As prevention focused CEOs are prone to remain at
status quo, firms that are led by such people should be less willing to change. Indeed,
it has been found that firms that are led by prevention focused entrepreneurs are
less likely to deviate from their original business concepts in dynamic environments
(Hmieleski and Baron, 2008). This finding demonstrates that prevention focused
CEOs will likely hinder firms’ ability to adapt quickly in a changing environment.
Since firms’ strategic flexibility is a critical factor for firm success (Hitt et al., 1998;
Nadkarni and Herrmann, 2010), it is thus expected that prevention focus will be
negatively associated with firm performance.
Additionally, prevention focus can affect firm-level strategic activities that, in turn,
impact firm performance. As firms’ exploration process involve experimenting with
new alternatives that are beyond their existing areas of expertise, its returns are less
certain and more remote in time (March, 1991; Lavie et al., 2010). In other words,
the exploration process involves significant changes and uncertainties. Because
prevention focused people are more likely to avoid change (Liberman et al., 1999),
CEOs with high levels of promotion focus are less willing to pursue exploration
activities. In support of this view, empirical evidence has shown that prevention
focused CEOs induce firms to engage in low levels of exploration activities
(Kammerlander et al., 2015). While the exploration process entails uncertainty, it is
essential for firm success because it allows firms to avoid the trap of suboptimal
stability (March, 1991). For example, stability may lock firm resources and activities
into products and processes that are outdated, negatively affecting firm
performance (Nerkar and Roberts, 2004).
Finally, prevention focus can undermine firms’ ability to capitalise on new
opportunities and hinder firm performance. As innovation requires firms to deviate
from existing practices (Musteen et al., 2010), it represents change. Firms that are
led by CEOs with favourable attitudes toward change are more likely to foster
innovation through exploring new products and market opportunities (Musteen et
al., 2010). Because prevention focused people have higher preferences for stability
over change, it can be expected that firms that are led by such people are less likely
to foster innovation and pursue new opportunities. Indeed, recent empirical studies

47
have found that firms that are led by prevention focused CEOs introduce lower
numbers of new products (Greenbaum, 2015) and undertake lower numbers and
values of business acquisition (Gamache et al., 2015). Researchers have highlighted
that firms with a lower tendency to undertake new opportunities and support
innovation are less likely to capitalise on emerging opportunities that can result in
lower performance (Hughes and Morgan, 2007). Given that prevention focus can
hinder firms’ tendency to support innovation and undertake new opportunities, it
should have negative effects on firm performance. Accordingly, it is hypothesised
that:
Hypothesis 2: CEO prevention focus will be negatively associated with firm
performance.
3.1.3 The moderating role of industry environment
Researchers often categorise the industry environment in which firms operate into
high-tech and low-tech industries (Bierly and Daly, 2007; Rauch et al., 2009;
Sarooghi et al., 2015). Compared to the low-tech industries, high-tech industries
entail higher levels of market and technological uncertainty (Moriarty and Kosnik,
1989). Market uncertainty arises due to rapid changes in consumer preferences and
the unpredictability of competitors’ behaviours (Khandwalla, 1972). Technological
uncertainty occurs because of the rapid changes in technology (Rosenbusch et al.,
2013). Because of the high rate and magnitude of changes associated with high-tech
industries (Wang et al., 2015; Fainshmidt et al., 2016), the span of product life cycles
is shorter in high-tech than low-tech industries (Qian and Li, 2003). Given that
high-tech industries are more uncertain and competitive than low-tech industries,
it is expected that the performance implications of promotion and prevention focus
will likely differ between firms that operate within these different industry
environments.
I propose that the positive relationship between promotion focus and firm
performance will be more pronounced for firms in high-tech industries than those
in low-tech industries. As pointed out earlier, promotion focus can enhance firms’
ability to adapt quickly in a rapid changing environment. As such, firms that are led
by CEOs with high levels of promotion focus should be more flexible in adapting
48
their activities (Hmieleski and Baron, 2008). While firms in any industry
environment may benefit from flexibility, its advantages should be more
pronounced for firms in high-tech industries because the extent of changes is higher
in such industries (Moriarty and Kosnik, 1989). Indeed, researchers have
highlighted that high levels of flexibility are required for firms to respond quickly to
changes in uncertain environments (Aaker and Mascarenhas, 1984), which is often
associated with the high-tech industries. As Halvorson and Higgins (2013, p. 4)
noted, “[p]romotion-focused leaders tend to be most effective in dynamic industries,
where it’s important to respond rapidly and innovatively to stay ahead”. In support
of this notion, researchers have found that firms that are led by promotion focused
entrepreneurs can achieve higher growth in dynamic environments (Hmieleski and
Baron, 2008).
Additionally, promotion focus is related to firms’ ability to perform and balance
exploration and exploitation activities (Kammerlander et al., 2015). Such a
capability is particularly important for firms that operate in the high-tech industries
because the rapid technological changes can erode the value of firms’ existing
capabilities and advantages (Collis, 1994). As noted by Wu (2012, p. 492), “high-
tech industries are characterized by [a] rapid rate of technological change, which
makes existing technological advantage quickly obsolete.” As a result, firms that
operate in the high-tech industries are required to “exploit existing competences for
short-term commercial benefits and simultaneously explore new competences for
long-term success” (Wang et al., 2015, p. 26). Furthermore, a shorter product life
cycle associated with the high-tech environment implies that firms’ existing
products are likely to become obsolete quickly in the marketplace (Qian and Li,
2003). That is, firms’ competitive advantages are more likely to be short-lived in
high-tech industries. Hence, the capability to identify and capitalise on new market
opportunities, which can be stimulated by promotion focus, should be more critical
for firms that operate in the high-tech industries. Therefore, it is hypothesised that:
Hypothesis 3: The positive relationship between promotion focus and firm
performance will be stronger for firms in high-tech industries than those in low-tech
industries.

49
Similarly, I posit that the negative relationship between prevention focus and firm
performance will be stronger for firms in high-tech industries than those in low-tech
ones. As prevention focus is likely to undermine firms’ ability to adapt quickly to
environmental changes (Hmieleski and Baron, 2008), firms that are led by
prevention focused CEOs should have a higher tendency towards rigidity rather
than flexibility. Researchers have highlighted that rigidities have substantial
detrimental effects on firms operating in an uncertain environment (Leonard-
Barton, 1992). Compared to the low-tech industries, the high-tech industries are
less stable. As such, the potential negative impacts that may arise due to rigidities
should be stronger for firms that operate within the high-tech industries. As
Hmieleski and Baron (2008, p. 295) pointed out, “a focus on preventing losses and
being rigid toward change (prevention focus) significantly reduces performance”.
Additionally, prevention focus undermines firms’ tendencies to engage in
exploration activities (Kammerlander et al., 2015). As the development of new
capabilities and knowledge requires exploration (March, 1991; McGrath, 2001),
firms that are led by CEOs with high levels of prevention focus will have less
opportunity to develop and extend new competences. Because the low-tech
industries are less competitive than the high-tech industries (Bierly and Daly, 2007;
Wang et al., 2015), firms that operate within the low-tech industry environment
should have lower needs to enhance their capabilities. Conversely, developing new
competences are more important for firms that operate in high-tech environments
as the value of their existing capabilities declines quickly due to environmental
changes (Collis, 1994). Furthermore, prevention focus is likely to hinder firms’
tendency to pursue new opportunities. Due to the different spans of product life-
cycles, firms that operate in low-tech industries face lower pressures to introduce
new products or services through exploiting new opportunities, whereas the
opposite is true for firms that operate in a high-tech environment. Because the
products in high-tech industries become obsolete more quickly, the absence of new
product offerings should make firms in the high-tech industries more vulnerable
(Leonard-Barton, 1992). Hence, it is hypothesised that:
Hypothesis 4: The negative relationship between prevention focus and firm
performance will be stronger for firms in high-tech industries than those in low-tech
industries.

50
3.2 Entrepreneurial orientation and firm performance
3.2.1 The independent effects of innovativeness on firm
performance
Innovation is a critical factor for firms to survive and thrive in a dynamic business
environment (Cheng et al., 2013). For example, innovation allows firms to adapt
and respond to changing customer demands, shrinking product life cycles and
growing market competition (Howell et al., 2005). It also provides firms with the
opportunity to foster business growth and generate higher profits (Wiklund et al.,
2009). Researchers have highlighted that facilitating firms’ levels of innovativeness
may lead to the development of new products that address customers’ changing
needs (Lumpkin and Dess, 1996). As such, innovative firms can differentiate
themselves from competitors through new product offerings and generate better
profits (Qian and Li, 2003). Indeed, innovation underlies firms’ differentiation
strategy that allows them to develop competitive advantage and achieve better
performance (Gatignon and Xuereb, 1997; Linton and Kask, 2017). Additionally,
innovative firms are more R&D-oriented (Gatignon and Xuereb, 1997) and are more
supportive of new ideas and experimentations (Lumpkin and Dess, 1996). The R&D
and experimenting activities represent a major source for firms to generate and
sustain innovative outputs. As a result, innovative firms are more likely to
continuously introduce new and/or refined products to meet the changing market
conditions and achieve better performance. Consistent with this view, prior
research has shown a positive relationship between innovativeness and firm
performance (Lumpkin and Dess, 2001; Hughes and Morgan, 2007).
Nevertheless, innovation is associated with substantial costs and uncertain
outcomes, which should also have an impact on firm performance. First, substantial
resources are required for firms to invest in innovation projects, undertake research
and development (R&D), and develop capabilities required for innovation (van de
Ven, 1986; Kreiser et al., 2013). Researchers have highlighted that high levels of
innovativeness requires firms to commit considerable resources and has the
potential to “compromise the ability of SMEs to meet short-term financial
obligations”(Kreiser et al., 2013, p. 276). In other words, high levels of
innovativeness may drain resources from other value-creating activities that are
critical for SMEs (Rosenbusch et al., 2011), which tend to be resource constrained.

51
Second, the outcomes of firms’ innovative efforts tend to be uncertain because
innovation requires firms to depart from established practices and experiment with
new alternatives (Lumpkin and Dess, 1996). This implies that while engaging in
experimentation might generate innovative outcomes, some of these efforts might
not yield positive results (March, 1991; Lavie et al., 2010). Accordingly, high levels
of innovativeness might have detrimental effects on SME performance because
SMEs tend to lack slack resources to buffer potential loss in the innovation process.
The preceding discussions suggest that innovativeness allows firms to address
changing customer demands with new products. At low levels of innovativeness,
firms are less likely to support new ideas and engage in experimentation (Lumpkin
and Dess, 1996), which in turn might hinder the development of new products. As a
result, firms with low levels of innovativeness are less likely to reap the benefits of
differentiation through offering new or refined products to the market place (Linton
and Kask, 2017). With the increase of innovativeness from low to moderate, firms’
performance should increase because firms are likely to generate better profits from
their innovative new products. Nevertheless, at high levels of innovativeness, the
potential costs and uncertain outcomes associated with innovative efforts might
outweigh the potential benefits. Together, these arguments imply that moderate
levels of innovativeness will likely allow SMEs to register better performance. As
such, the relationship between innovativeness and SME performance should be
curvilinear. In particular, up to a point, increasing innovativeness should lead to
enhanced firm performance, but beyond that point, further increases in
innovativeness will be associated with diminishing or even negative returns in firm
performance. Thus, it is hypothesised that:
Hypothesis 5: The relationship between innovativeness and firm performance is
an inverted U-shaped.
3.2.2 The independent effects of risk-taking on firm performance
Risk-taking is an essential element in the entrepreneurial process (Covin and Slevin,
1989; Miller, 1983). As Frishammar and Hörte (2007, p. 769) noted, “if no risks are
taken, no new products will ever be produced and launched”. Hence, for firms to
compete in a fast changing market environment, they are required to engage in risk-

52
taking. Indeed, researchers have highlighted that firms that are risk tolerant are
more likely to capitalise on emerging market opportunities that, in turn, contribute
to better firm performance (Hughes and Morgan, 2007). Theoretical arguments
underlying entrepreneurial learning also implicitly suggest that firms can benefit
from risk-taking (McGrath, 2001; Dess et al., 2003). For example, the willingness
to engage in initiatives with uncertain outcomes can foster the development of new
knowledge, routines, and capabilities that are distinctive to organisations (McGrath,
2001; Matusik, 2002). Given that firm-specific knowledge and capabilities are
valuable and difficult to imitate (Dess et al., 2003; Barney, 1991), they may serve as
a source of competitive advantage, thereby contributing to better firm performance.
While risk-taking is necessary for firms to capitalise on new opportunities and
compete in the market place, it also has potential negative effects on organisations.
For example, risk-taking is associated with a chance of failure (Lumpkin and Dess,
1996; Wiklund and Shepherd, 2003), suggesting that the resources committed to
risk-taking activities might not bear fruit. As the levels of risk increases, the
probability of failure should also increase (Alvarez, 2007). Hence, at high levels of
risk-taking, firms should face significant chances of failure. In other words, it is
possible that the investments may fail to generate desirable outcomes. Because
SMEs are resource constrained (Muller et al., 2017), the potential failure in their
risk-taking activities may result in considerable business disruptions or even
threaten firms’ survival in a competitive market place. Accordingly, high levels of
risk-taking may negatively impact firm performance. Additionally, prior research
has found that people who are risk tolerant tend to focus on the opportunities for
potential positive outcomes, while people who are risk averse tend to emphasise the
threats from potential failure (Schneider and Lopes, 1986). In the same vein, firms
with high levels of risk-taking tendencies might be over optimistic with the
opportunity presented, which can lead them to over-commit resources to projects
that are unpromising (Dai et al., 2014).
Firms with low levels of risk-taking tendencies are less willing to pursue
opportunities that involve high risks with potential high returns (Lumpkin and Dess,
1996). While the risk-averse tendency allows firms to prevent potential loss, it can
also limit firms’ chance to benefit from projects that have high returns. On the other
hand, high levels of risk-taking also have its limitations because it might endanger

53
the performance of organisations due to the higher chance of failure involved.
Accordingly, it is expected that moderate levels of risk-taking should allow firms to
achieve better firm performance. In line with this notion, prior research has found
that the relationship between risk-taking and firms’ return on assets (ROA) is
curvilinear in entrepreneurial firms. Specifically, Begley and Boyd (1987, p. 89)
found that “risk-taking has a positive effect on ROA up to a point. Beyond that point,
increases in risk-taking begin to exert a negative effect on ROA.” This empirical
evidence supports the view that moderate risk-taking should contribute to better
firm performance. Thus, it is hypothesised that:
Hypothesis 6: The relationship between risk-taking and firm performance is an
inverted U-shaped.
3.2.3 The independent effects of proactiveness on firm
performance
Proactiveness represents a tendency to introduce new products or services ahead of
competitors (Lumpkin and Dess, 1996; Keh et al., 2007). Researchers have
highlighted that proactive firms are more likely to engage in external environmental
scanning to acquire information about the changing market environment and
customer needs (Wang, 2008; Kreiser, 2011). The enhanced understanding of the
market and customer needs, in turn, allows proactive firms to satisfy unmet market
demands (Smith and Cao, 2007; Hughes and Morgan, 2007). Through developing
and launching new products ahead of the competition, proactive firms can thus
establish first-mover advantages (Wiklund and Shepherd, 2003; Zahra and Covin,
1995) and extract higher profits (Lumpkin and Dess, 1996). As a result,
proactiveness provides opportunities for firms to establish a leadership position
within their industry (Lumpkin and Dess, 2001), which subsequently contributes to
better firm performance.
Nevertheless, time and resources are required for firms to be proactive in acquiring
new market insights (Dai et al., 2014). Also, potential up-front costs may be
necessary for firms to develop the requisite capabilities for new market entry
(Kreiser et al., 2013). Because proactive firms act in anticipation of future market
demands (Keh et al., 2007), it is possible that their proactive efforts might not
always lead to positive outcomes. For example, firms’ assumptions about the future
54
market demands might prove to be incorrect. Additionally, while proactive firms
might introduce new products ahead of their competitors, the new products are not
guaranteed to be a success in a competitive market place. Given the potential costs
involved for firms to be proactive, high levels of proactiveness might have negative
effects on organisations in the situation that firms’ proactive efforts failed to
generate desirable outcomes.
Proactive firms are better placed to establish themselves as leaders rather than
followers (Venkatraman, 1989; Lumpkin and Dess, 1996) because they can establish
first-mover advantages through offering new products in the market place before
their competitors. Firms with low levels of proactiveness might have to catch up in
the market competition and continuously respond to the actions of proactive firms.
This implies that increasing levels of proactiveness should contribute to better
performance. As Dess et al., (2003, p. 370) noted, “proactively seeking new
opportunities may make a more lasting contribution to value creation than an
occasional attempt to innovate, introduce or adopt entrepreneurial ideas.”
Nevertheless, resources and efforts are required for firms to be proactive. It can thus
be expected that some of the firms’ proactive endeavours might not yield positive
results, suggesting that high levels of proactiveness might have potentially negative
effects on organisations. Therefore, it is hypothesised that:
Hypothesis 7: The relationship between proactiveness and firm performance is an
inverted U-shaped.
3.2.4 The moderating effects of industry environment
I posit that the relationship between the three dimensions of EO and firm
performance will be contingent on the industry environment (i.e., high-tech and
low-tech industries) in which firms operate. Prior studies have revealed that
environmental factors such as dynamism and hostility moderate the EO - firm
performance relationship (Wiklund and Shepherd, 2003; Covin and Slevin, 1989),
suggesting that the performance effects of EO are more pronounced in an
environment with higher levels of change and competition. Because environmental
factors such as dynamism, hostility, and complexity differ between the high-tech
and low-tech industries (Lomberg et al., 2016), it is likely that the industry

55
environment in which firms operate can also moderate the effects of the dimensions
of EO on firm performance. Empirical evidence has shown that industry
environment moderates the effects of EO on firm performance (Rauch et al., 2009).
Accordingly, there are reasons to expect that the performance effect of
innovativeness, risk-taking, and proactiveness may also differ between SMEs
operate in high-tech industries and those in low-tech industries.
I propose that the effects of innovativeness on firm performance should be stronger
in low-tech than high-tech industries for two reasons. First, new products tend to
emerge less frequently in low-tech industries than in high-tech ones (Qian and Li,
2003; Szymanski et al., 2007), suggesting that innovation is less common in low-
tech industries. As such, firms in low-tech industries may derive more benefits from
innovation than firms in high-tech industries. For example, the new products
offered by firms in low-tech industries can be better differentiated from existing
market offerings. In other words, such firms are more likely to establish the
positional advantage through differentiating their products from competitors
(Porter, 1980; Linton and Kask, 2017). Secondly, the new products developed
through innovative effects should become obsolete more slowly within low-tech
industries because such industries are associated with longer product life cycles
than high-tech ones (Qian and Li, 2003; Szymanski et al., 2007). Conversely, the
fast changing market environment associated with high-tech industries should
make existing products become obsolete quickly. This implies that the products
resulting from innovation efforts may generate more benefits for firms in low-tech
industries than those in high-tech ones. Therefore, the benefits from innovativeness
are perhaps more prominent for firms in low-tech industries than low-tech
industries.
Additionally, I expect that the potential detrimental effects of innovativeness on
firm performance will be stronger in low-tech than high-tech industries. Firms in
low-tech industries face lower pressure in modifying their products because
consumers’ preferences are less likely to change substantially (Moriarty and Kosnik,
1989; Qian and Li, 2003), suggesting that such firms should have less experience in
innovation. Because learning is best achieved through repeated efforts (March et al.,
1991), the limited experience in innovation may thus hinder firms’ development of
innovation capabilities. By contrast, researchers have highlighted that “high-tech
56
firms seem to devote greater attention to the innovativeness of their products”
(Kirner et al., 2009). Accordingly, such firms should have more experience in
innovation than firms that operate in low-tech industries. The accumulated
experience should enhance their innovation capabilities, which is critical for firms
to achieve better performance. Innovation requires firms to deviate from their
established practice (Musteen et al., 2010). As such, firms with high levels of
innovativeness will likely venture into areas that are beyond their existing areas of
expertise. As firms operating within low-tech industries have lower levels of
innovation capabilities than the high-tech firms, it is thus expected that the low-tech
firms are more likely to face setbacks when their levels of innovativeness are high.
Therefore, it is hypothesised that:
Hypothesis 8: The inverted U-shaped relationship between innovativeness and
firm performance will be stronger for firms in low-tech industries than those in
high-tech industries.
With regards to risk-taking, I posit that the relationship between risk-taking and
firm performance will be stronger in high-tech industries than in low-tech
industries. Firms in high-tech industries face higher uncertainties and competition
due to rapid changes in technology and market demand (Moriarty and Kosnik, 1989;
Qian and Li, 2003). For example, changes in technology might posit new challenges
for firms that operate in high-tech industries because they need to experiment with
new technologies. Similarly, changes in market demand imply that firms’
advantages obtained through their market offerings can be short-lived. Accordingly,
firms in high-tech industries should experience considerable risks. Conversely,
firms that operate in low-tech industries face an environment that is more certain
and less competitive because the technology and market demand are more stable.
Hence, such firms should experience a lower level of risks than those in high-tech
industries.
Firms that operate in either high-tech or low-tech industries should engage in risk-
taking to avoid missing potentially valuable opportunities (Frishammar and Hörte,
2007). Nevertheless, high levels of risk-taking activities might have negative effects
on organisations because the resources committed to risky initiatives may fail to
bear fruit due to an increased level of uncertainty involved (Alvarez, 2007).

57
Compared to the low-tech industries, the high-tech industries entail greater risks
(Szymanski et al., 2007). For example, high-tech industries are more uncertain and
more competitive than the low-tech one (Moriarty and Kosnik, 1989). Accordingly,
it is likely that firms’ risk-taking efforts are less likely to yield positive outcomes in
the competitive industry environment (i.e., high-tech industries). Conversely, the
opposite may be true for firms in low-tech industries because the industry
environment is more stable and less competitive. Therefore, risk-taking should have
higher impacts for firms operate in high-tech than low-tech industries. It is thus
hypothesised that:
Hypothesis 9: The inverted U-shaped relationship between risk-taking and firm
performance will be stronger for firms in high-tech industries than those in low-tech
industries.
I also hypothesise that the relationship between proactiveness and firm
performance will be stronger in high-tech industries than in low-tech industries.
Proactiveness allows firms to establish first-mover advantage (Lyon et al., 2000;
Keh et al., 2007), which should be beneficial for firms that operate in either high-
tech or low-tech industries. Consistent with this notion, researchers have
highlighted that “the ability to frequently challenge the status quo with new,
breakthrough ideas is critical for firm success” (Bierly and Daly, 2007, p. 499).
Nevertheless, the significance of proactiveness should differ between high-tech and
low-tech industries due to the different levels of changes involved. High-tech
industries have been characterised as highly competitive and uncertain (Moriarty
and Kosnik, 1989). High competition and uncertainty imply that firms operating in
such an environment should experience significant changes. By contrast, low-tech
industries are less competitive and more stable (Szymanski et al., 2007). As such,
the extent of changes in low-tech environments is likely to be low.
Indeed, compared to the low-tech industries, the rate and magnitude of changes are
greater within high-tech industries (Wang et al., 2015). Firms operating in fast
changing environment (i.e., high-tech industries) should have a greater need to be
proactive to develop their competitive advantage. For example, firms’ existing
competitive advantages are likely to be short-lived as their existing products will
turn obsolete quickly in a marketplace where product life cycles are short (Wu,

58
2012). While proactiveness is also beneficial for firms operating in low-tech
industries, its importance should be less prominent given that the market
environment is more stable and the product life cycles are longer. As such, fostering
high levels of proactiveness should be more critical for firms in high-tech industries
than those in low-tech ones. In other words, the potential performance effects of
proactiveness should be more salient in high-tech industries than those in low-tech
industries. Hence, it is hypothesised that:
Hypothesis 10: The inverted U-shaped relationship between proactiveness and
firm performance will be stronger for firms in high-tech industries than those in
low-tech industries.

59
3.3 Regulatory focus and entrepreneurial orientation
3.3.1 The effects of promotion focus on the three dimensions of EO
I posit that CEO promotion focus will be associated with firms’ levels of
innovativeness, risk-taking, and proactiveness. In particular, I propose that CEO
promotion focus will be positively related to firms’ engagement in innovativeness
because promotion focused CEOs tend to favour innovation and are more likely to
foster innovative efforts within firms they lead. A promotion focus is known to be
associated with a preference for change (Liberman et al., 1999; Chernev, 2004).
Promotion focused people are motivated to seek changes because the changes they
initiate might allow them to move toward growth and advancement. In other words,
changes represent an opportunity for promotion focused people to attain potential
gains that are salient to them. Indeed, researchers have found that promotion
focused people are more likely to initiate behaviour changes (Fuglestad et al., 2008).
Similarly, empirical evidence has shown that promotion focused managers are more
willing to “experiment with a wide range of alternatives and to deviate from existing
best practices” (Ahmadi et al., 2017, p. 209). Researchers have highlighted that
experimenting with alternatives and deviating from existing practices are the
essences of innovation (Musteen et al., 2010). Accordingly, CEOs with high levels of
promotion focus should have more positive attitudes toward innovation.
Researchers have found that top managers’ favourable attitudes toward innovation
positively impact the initiation, adoption decision and implementation of
innovation within their firms (Damanpour and Schneider, 2006). Given that
promotion focused CEOs tend to favour innovation, firms that are led by such
people should have a higher tendency to pursue innovation, which in turn might
generate potential gains to satisfy their needs for growth (Brockner et al., 2004). In
support of this notion, recent empirical evidence has shown that firms led by CEOs
with high levels of promotion focus engage in higher levels of exploration activities
(Kammerlander et al., 2015). The exploration process entails experimenting with
new alternatives that may lead to new products or services (March, 1991),
suggesting that it might result in innovation related outcomes. Taken together, the
theoretical and empirical evidence suggest that promotion focused CEOs should
have a favourable attitude toward innovation. As a result, they are more likely to
60
foster such activities within firms they lead because the potential gains that may be
generated from innovation can satisfy their needs for growth. Accordingly, firms
that are led by CEOs with high levels of promotion focus should exhibit higher levels
of innovativeness. Hence, it is hypothesised that:
Hypothesis 11: CEO promotion focus will be positively associated with firms’
levels of innovativeness.
I also posit that promotion focus will be positively related to firms’ pursuit of risk-
taking. Promotion focused CEOs are more risk tolerant as they tend to prefer
eagerness means in striving for gains (Crowe and Higgins, 1997). Specifically,
promotion focused people are eager to achieve advancement through maximising
the chance for gains (hits) and minimising the chance for non-gains (misses). The
eagerness inclination in striving for potential gains often induces promotion focused
people towards risk-taking. Indeed, researchers have highlighted that the
motivation to attain gains “generally translates into a more eager form of
exploration and greater risk taking” (Zhou and Pham, 2004, p. 127). Consistent with
this notion, empirical evidence has shown that promotion focused people exhibited
a risky response bias in completing different tasks (Crowe and Higgins, 1997).
Additionally, researchers have suggested that a promotion focus leads to people’s
risk-seeking behaviours, indicated by that such people have higher tendency to
overstate their task performance (Gino and Margolis, 2011). Together, these
empirical findings support the idea that promotion focused people have a higher
risk-taking propensity (Bryant and Dunford, 2008).
Given that promotion focused CEOs tend to be risk tolerant, firms that are led by
CEOs with high levels of promotion focus should have a higher tendency to engage
in risk-taking. Prior researchers have suggested that promotion focused leaders are
more likely to develop an organisational culture that encourages risk-taking and
tolerates mistakes (Kark and Van Dijk, 2007). Recent empirical evidence has
revealed that firms that are led by CEOs with high levels of promotion focus engage
in higher levels of risky activities (Kammerlander et al., 2015). Additionally,
empirical evidence has shown that promotion focused teams (i.e., both members
are promotion focused individuals) make investment decisions that involve higher
risks (Florack and Hartmann, 2007). These empirical findings provide support that

61
promotion focused CEOs are more likely to induce risk-taking within their firms to
maximise potential gains. Taken together, firms that are led by CEOs with high
levels of promotion focus should exhibit higher levels of risk-taking. Therefore, it is
hypothesised that:
Hypothesis 12: CEO promotion focus will be positively associated with firms’
levels of risk-taking.
Additionally, I propose that promotion focus will be positively related to firms’
pursuit of proactiveness. This is because promotion focused CEOs are more
opportunity oriented and are more likely to induce firms they lead to be proactive
in seeking and undertaking new product opportunities. Promotion focused people
are driven to approach matches to advancement and approach mismatches to non-
fulfilment (Higgins et al., 1994). Advancement represents gains, whereas non-
fulfilment represents non-gains. To attain potential gains, promotion focused
people are more likely to deviate from their status quo to approach their desired
end-states. In other words, they are more proactive to initiate or engage in activities
that may lead to gains. As Johnson et al., (2015, p. 1512) pointed out, people with a
promotion focus “would be more likely to search for and identify new opportunities”.
Indeed, empirical evidence has shown that promotion focused people have a higher
tendency to pursue new courses of actions (Liberman et al., 1999). Promotion
focused entrepreneurs are also more proactive in networking, indicated by a higher
number of business contacts they interact with for information (Pollack et al., 2015).
Also, prior research has suggested that promotion focus positively influences
people’s frequency to engage in proactive behaviour (Waterwall, 2017), which
“involves challenging the status quo rather than passively adapting to present
conditions” (Crant, 2000, p. 436).
Promotion focused people’s tendency to approach gains through proactively seeking
new opportunities is likely to significantly impact the firms they lead. For example,
empirical evidence has shown that firms that are led by promotion focused CEOs
are more proactive in business acquisitions as indicated by higher numbers and
values of business acquisition firms undertake (Gamache et al., 2015). Researchers
have also found that promotion focused teams are more proactive in new product
introduction captured by higher number and faster speed of new products

62
introduced under experimental settings (Spanjol et al., 2011). Additionally, a recent
empirical study has revealed that firms that are led by promotion focused CEOs are
more proactive in new product introduction (Greenbaum, 2015). Together, these
theoretical and empirical findings suggest that promotion focused CEOs’
opportunity seeking tendencies should orient firms they lead to pursue proactive
efforts for potential gains, which can satisfy their needs for advancement. As such,
firms that are led by CEOs with high levels of promotion focus should exhibit higher
levels of proactiveness. Thus, it is hypothesised that:
Hypothesis 13: CEO promotion focus will be positively associated with firms’
levels of proactiveness.
3.3.2 The effects of prevention focus on the three dimensions of EO
Similarly, there are reasons to expect that CEO prevention focus will be associated
with firms’ levels of innovativeness, risk-taking, and proactiveness. I posit that CEO
prevention focus will be negatively related to firms’ pursue of innovativeness
because prevention focused CEOs tend to prefer maintaining status quo. A
prevention focus entails a preference for stability (Liberman et al., 1999).
Prevention focused people are driven by stability because maintaining satisfactory
status quo allows them to ensure safety. Indeed, researchers have found that
prevention focused people are less likely to activate behaviour changes (Fuglestad
et al., 2008). Prevention focused managers have a lower tendency to explore new
alternatives (Ahmadi et al., 2017). However, it should be acknowledged that a
preference for stability does not imply that prevention focused people will not seek
changes. In the situation of experiencing losses, for example, prevention focused
people may initiate changes to restore adequate status quo (Collins, 2016).
Because innovation requires firms to experiment with new alternatives and deviate
from their existing practices (March, 1991; Lumpkin and Dess, 1996), the
innovation process should involve substantial changes and uncertain outcomes.
Given that prevention focused CEOs are driven to ensure their safety needs through
maintaining satisfactory status quo, CEOs with high levels of prevention focus
should have lower motivation to foster innovation within firms they lead. In line
with this view, researchers have found that prevention focused teams introduced

63
new products that are less novel than those introduced by promotion focused teams
(Spanjol et al., 2011). Recent empirical evidence has also shown that firms that are
led by CEOs with high levels of prevention focused are less likely to engage in
exploration activities (Kammerlander et al., 2015), which may lead to innovation.
Together, this theoretical and empirical evidence supports the idea that firms that
are led by CEOs with high levels of prevention focus should exhibit lower levels of
innovativeness. Accordingly, it is hypothesised that:
Hypothesis 14: CEO prevention focus will be negatively associated with firms’
levels of innovativeness.
I also propose that CEO prevention focus will be negatively related to firms’
engagement in risk-taking because prevention focused CEOs tend to be risk-averse.
Researchers suggest that prevention focused people are more sensitive to the
presence or absence of negative outcomes (Brockner et al., 2004). The sensitivity to
potential losses has implications on prevention focused people’s risk-taking
tendencies because, when evaluating new information or opportunities, they tend
to weight more heavily on the potential losses involved (Markman et al., 2005;
Molden et al., 2008). Indeed, prevention focused people’s motivation to protect
against mistakes “generally translates into a more vigilant form of exploration and
greater risk aversion” (Zhou and Pham, 2004). As a result, prevention focused
people are more risk-averse. Indeed, empirical evidence has shown that prevention
focused people exhibited a conservative response bias in completing different tasks
(Crowe and Higgins, 1997). Also, they are prone to engage in risk avoidance
behaviours (Gino and Margolis, 2011; Hamstra et al., 2011).
Given that a prevention focus is associated with a risk avoidance tendency, CEOs
with high levels of prevention focus should orient their firms to pursue activities
that involve outcomes that are more certain. In other words, they are less likely to
encourage risk-taking because such activities entail outcomes that are uncertain.
Indeed, researchers have found that the investments made by prevention focused
teams are less risky than those made by promotion focused teams (Florack and
Hartmann, 2007). Additionally, recent empirical evidence has demonstrated that
prevention focused CEOs negatively impact firms’ tendencies to engage in
exploration activities that are risky (Kammerlander et al., 2015). Taken together,

64
prevention focused CEOs are more risk-averse because they are driven to ensure
their need for safety. As a result, firms that are led by CEOs with high levels of
prevention focus should exhibit lower extent of risk-taking. Thus, it is hypothesised
that:
Hypothesis 15: CEO prevention focus will be negatively associated with firms’
levels of risk-taking.
I also hypothesise that CEO prevention focus will be negatively related to firms’
pursue of proactiveness because prevention focused CEOs tend to be reactive in
their endeavours. Prevention focused people are driven to avoid mismatches to
safety and avoid matches to threat (Higgins et al., 1994). Maintaining safety
represents non-loss while falling into threat represents a loss. Because prevention
focused people are motivated to ensure safety and avoid losses, they are oriented to
maintain satisfactory status quo rather than deviate from current states. Indeed,
researchers have found that prevention focused people are more likely to engage in
behaviours that are intended to sustain the status quo (Shin et al., 2017). In other
words, prevention focused people are less proactive to engage in behaviours that
lead to changes. As Crant (2000, p. 439) pointed out, “[l]ess proactive individuals
are passive and reactive, preferring to adapt to circumstances rather than change
them”, suggesting that prevention focused people tend to be more passive as they
prefer stability over change (Liberman et al., 1999).
Proactiveness requires firms to act in anticipation of future demand and introduce
new products or services ahead of their competitors (Lumpkin and Dess, 1996).
Given that a prevention focus is associated with a propensity to ensure safety
through maintaining status quo, firms that are led by CEOs with high levels of
prevention focus should have a lower tendency to be proactive and act in
anticipation of market demands. In other words, such firms are less likely to develop
new products or services ahead of the competition, implying lower extents of
proactiveness. Indeed, researchers have found that prevention focused teams
introduced a lower number of new products than those introduced by promotion
focused teams (Spanjol et al., 2011). Additionally, firms that are led by prevention
focused CEOs engage in lower numbers and values of business acquisitions
(Gamache et al., 2015), and introduce a lower number of new products (Greenbaum,

65
2015). Together, these findings suggest that firms that are led by CEOs with high
levels of prevention focus should exhibit lower levels of proactiveness. Accordingly,
it is hypothesised that:
Hypothesis 16: CEO prevention focus will be negatively associated with firms’
levels of proactiveness.

66
Chapter 4 Research Methodology
4.1 Research design
Research design should be guided by the type of questions the researcher intends to
answer (Bono and McNamara, 2011). As outlined in the introduction chapter, this
study aims to address three research questions. Firstly, to examine how the CEO’s
regulatory focus affects the respective SME’s performance, and how this effect
differs between SMEs in high-tech industries and those in low-tech industries.
Secondly, to assess how an SME’s levels of innovativeness, risk-taking, and
proactiveness impact its performance and how does the effect differ between SMEs
in high-tech industries and those in low-tech industries. Thirdly, to evaluate how
the CEO’s regulatory focus influences the respective SME’s levels of innovativeness,
risk-taking, and proactiveness.
Since the primary purpose of this study is to assess the potential relationships
between different variables, a quantitative approach is considered more appropriate
for this study (Creswell, 2009; Antonakis et al., 2010). A quantitative research
design allows researchers to collect quantifiable and measurable data. Such data, in
turn, can be used in statistical analysis to test the hypotheses proposed in the
preceding hypothesis development chapter. Accordingly, quantitative research
design is adopted for this study because it fits the purpose of this research.
Researchers have highlighted that, with representative samples, the generalisability
of research findings may be achieved from a quantitative study (Easterby-Smith et
al., 2012). However, it should be acknowledged that a quantitative approach is not
without limitations. For example, an in-depth and rich understanding of the
research phenomenon is unlikely to be achieved through the quantitative approach
(Jack, 2010).
Additionally, this study employed an online survey for data collection. Compared
with a paper-based survey, the online questionnaire has advantages in both cost and
flexibility (Brace, 2004). The cost involved in an online survey is relatively lower
than surveys administrated using the post, the telephone, or in person. Also, the
turnaround time of an online approach tends to be quick (Ilieva et al., 2002). Such
an approach also saves the time and effort required for respondents to return the

67
completed survey. Accordingly, it might help to encourage participation from
potential respondents. The questionnaire was operationalised through the online
platform Qualtrics. I incorporated two features of the online survey to make it more
convenient for respondents to fill in. Firstly, respondents were allowed to save the
unfinished questionnaire and then continue it later. This is based on the
consideration that CEOs tend to have a tight business schedule. Secondly, a
progression bar showing the percentage of the survey that has been filled was
featured at the end of each screen to minimise potential drop out issues due to a lack
of awareness of the progress made thus far, or a misconception that the survey is
too long to complete.

68
4.2 Sampling
To test the hypotheses developed in Chapter 3, I chose to examine SMEs operating
in England, UK. SMEs contribute significantly to the job creation and economic
development in the UK. In all private sectors in the UK, for example, 99.3% of firms
are SMEs, which account for 60% of all employment (Department for Business,
Energy & Industrial Strategy, 2016). I used the Financial Analysis Made Easy
(FAME) database, a widely used source of information on UK firms (e.g., Dada and
Fogg, 2016), as the sampling frame. FAME contains information (e.g., names,
addresses, and employee numbers) of firms operating in the UK, as well as the
contact details of these firms’ top managements such as Chief Executive Officer,
Managing Director, Business Owner, or Company Director. I employed three
criteria in selecting firms from the database: 1) firms with a primary trading address
in England, UK; 2) active firms that are not in receivership or dormant; 3) firms
with less than 250 employees in the last trading year. Based on the three criteria,
52,568 firms were identified of which 5,000 SMEs were randomly selected for this
study. However, a close examination of the data extracted from the FAME database
revealed that a significant number of firms lack contact details for CEOs. The firms
which lacked contacts details for their CEOs were then removed from the dataset.
This resulted in a sample size of 1542 firms for data collection.
69
4.3 Data collection
In the following, I present the processes involved in data collection. In particular,
the processes of questionnaire design, pilot testing, and data collection are
introduced in turn. The ethical issues about data collection are also highlighted.
QUESTIONNAIRE DESIGN In designing the survey instrument, I conducted an
extensive literature review to identify established measures for constructs used in
this study (Churchill and Iacobucci, 2006). Using existing measures can help to
ensure the construct reliability and validity (Bono and McNamara, 2011). I also
invited two CEOs and three academics to comment upon the drafts of the
questionnaire. One CEO was from the service industry, and the other was from the
manufacturing industry. They were selected because both of them have extensive
experience in their industry, 18 and 38 years respectively. Their different
backgrounds can also help to ensure that the questionnaire is examined from
different perspectives. The three academics were invited to give feedback on the
survey design, as they all have experience in conducting quantitative research.
Based on the feedback from the CEOs and academic staff, I further refined the
questionnaire with regards to the sequence of questions and survey instruction. For
example, the section about the background information of participants and
organisations was originally placed at the end of the questionnaire. Following the
suggestion of one academic, the background information section was moved to the
beginning of the survey, based on the idea that starting the survey with easy
questions might help to encourage participation. One CEO pointed out that the third
question about regulatory focus was not very clear (i.e., How often have you
accomplished things that got you "psyched'' to work even harder?). The CEO
indicated that the wording “psyched” seems unfamiliar. But based on the context of
the question, he suggested that the question was still understandable. As the
regulatory focus questionnaire has been employed in several others studies, I
decided to keep the wording.
PILOT TESTING I pre-tested the survey with a convenience sample of 12 CEOs to
avoid any potential issues that were not identified during the initial stage of the
questionnaire design process. I established connections with those CEOs through

70
the Lancaster University’s programmes, such as Entrepreneurs in Residences, and
Masterclasses. I introduced the purpose of the research project to the CEOs first and
then invited them to complete the survey and comment on any issues with regards
to the clarity of instructions, the wording of questions, the sequence of questions
and the overall survey design (Malhotra, 2006). The pilot testing revealed that on
average it took around 10 to 15 minutes to complete the online survey, except one
CEO who took around 25 minutes. During a conversation with the CEO afterwards,
he explained that he wanted to think about the survey questions carefully before
providing feedback. One sample response from the questionnaire pilot testing is
provided in Appendix 1.
The profile of CEOs who participated in the pilot testing is summarised in Table 4-
1. The CEOs were from different industry backgrounds including manufacturing,
service, and others (e.g., retailing, wholesaling, construction, and agriculture,
among others). The majority of them had served more than five years in their
organisations, with a minimum tenure of 3 years and a maximum of 35. Both male
and female CEOs were used in the pilot testing. Although the sample size was small,
the respondents and their organisation’s size were quite diverse. Hence, the sample
size used for pilot testing was considered sufficient (Grichnik et al., 2014). Since
only one minor issue was identified from the pilot testing, I then employed the
refined questionnaire for subsequent data collection. The final questionnaire is
included in Appendix 2.

71
Table 4-1: Profile of participants for pilot testing
Number Gender Age Tenure Industry Number of employees
1 Female 57 20 Manufacturing < 50
2 Male 49 12 Others < 50
3 Male 66 18 Others < 250
4 Male 31 6 Service < 10
5 Male 59 35 Manufacturing < 50
6 Male 45 7 Manufacturing < 250
7 Male 41 14 Service < 250
8 Male 45 3 Service < 10
9 Male 53 4 Service < 10
10 Male 61 8 Service < 250
11 Female 43 15 Service < 50
12 Male 53 8 Service < 250
COLLECTING DATA I invited CEOs to participate in the study through an invitation
email, which is included in Appendix 3. The research purpose was introduced in the
email and CEOs were invited to follow the embedded link to complete the online
survey. I contacted 1542 firms, but a significant number of emails bounced back to
the researcher due to reasons such as invalid email addresses, and executive has
retired or moved to another company. Some automated responses indicated that
some CEOs were out of office or on annual leave. Several respondents replied to the
invitation email and indicated that they were unable to participate in the study
because their firms were not SMEs or not located in England, UK. In total, 1,388
emails reached the target while the remaining 154 emails failed to deliver.
To encourage participation, CEOs were assured that their answers would remain
confidential and be used for academic purposes only. Also, they were informed that

72
an Executive Summary of the research findings would be provided at the end of this
study. After the initial invitation email, three rounds of follow up emails were used
to encourage participation. The emails were scheduled for two weeks, four weeks,
and five weeks after the initial invitation email. In total, 157 responses, of the initial
1,388 e-mailed, were collected within the period. The response rate is 11.3 percent,
which is comparable to similar studies using senior executives as a primary data
source (Brettel and Rottenberger, 2013; Xu, 2011). Through examining the data set,
it was found that some cases were not valid due to missing data on key variables.
These were then removed. Additionally, one response was removed due to being an
outlier. The procedures in examining outliers are discussed in the next section. In
total, 110 valid responses were used in statistical analysis for hypothesis testing.
The characteristics of all respondents were as follows. The average age of CEOs was
50.67 years, and the average tenure was 14.41 years. The sample was dominated by
male CEOs who accounted for 81.2% of all respondents. This is in line with the
findings from Global Entrepreneurship Monitor (GEM) that male business
ownership is significantly higher than female business ownership in the UK (Hart
et al., 2014). Results from the UK 2014 Small Business Survey indicate that only 18%
of SMEs are led by women (BIS, 2015). Thus, the gender ratio of this study is
representative of the intended population. The average firm age was 30.4 years. The
firms varied in size with 20% of the firms having fewer than ten employees. The
percentage of firms with 11-50 employees and 51-250 employees are 32.7% and 47.3%
respectively. The firms were from different industries: 28.2% were in
manufacturing, 48.2% were in service, and 23.6% were from other sectors. The
characteristics of the samples are summarised in Table 4-2. A more detailed,
statistical description of the sample’s characteristics is included in Appendix 4.

73
Table 4-2: Sample characteristics
Age 50.67 years
Tenure 14.41 years
Gender Male (%) 81.2%
Female (%) 18.8%
Firm age 30.4 years
Firm size 1–10 employees 20%
11–50 employees 32.7%
51–250 employees 47.3%
Industry Manufacturing (%) 28.2%
Services (%) 48.2%
Others (%) 23.6%
ETHICAL CONSIDERATIONS Ethical issues concerning informed consent and
confidentiality were taken into consideration during the data collection process.
First, informed consent was achieved through two steps. Respondents were invited
to click the link embedded within the invitation email to complete the online survey.
Given that the research purpose was introduced within the email, following the link
indicated that respondents were interested and were agreeing to participate in the
study. Furthermore, following the suggestion from a member of the University
Research Ethics Committee, a statement “Completion and return of the
questionnaire will be taken as informed consent and the questionnaires cannot then
be withdrawn” was included on the first page of the online survey. This approach
was adopted because the survey was operationalised online, and so it may be
unrealistic to require respondents to sign and return a physical consent form. It was
anticipated that such a process might heavily discourage potential respondents from
participation in the study.
Second, participants were assured the confidentiality of their response to the online
survey, which collects data in relation to the personal information of CEOs as well
as the strategic behaviours and performance of organisations. Specifically,
participants were assured that the information they provided would remain

74
confidential and that neither they and/nor their organisations would be named in
any work arising from the research. Through ensuring confidentiality in the data
collected, this might enhance respondent’s interest and participation in the study.
The contact details of the researcher and two supervisors were provided at the
beginning of the online questionnaire. This allowed potential respondents to raise
any potential issues that they might have about the project.
Finally, it is worth noting that as the contact details of CEOs were obtained from the
FAME database, some CEOs might not be interested in participating in this research
due to their tight business schedule or lack of interest. During the data collection
process, nine respondents contacted the researcher and indicated that they would
like to be removed from the emailing list. Their contact details were then removed
from the list and they were excluded from all follow up emails.

75
4.4 Data screening
MISSING DATA I used SPSS, the statistical analysis software, to examine missing
data before data analysis. The data concerning the risk-taking dimension of EO was
missing in two cases. Given that only two data points were missing, it was
considered appropriate to keep the two cases. I replaced the missing values by using
the mean value of the variable from all other valid responses. Although the mean
substitution method may reduce the variance of the variable, it is unlikely to be a
problem for this study as the level of missing data is relatively low in this study (Hair
et al., 2014).
OUTLIER The key independent and dependent variables were measured using five-
point Likert-scale. This implies that outliers are not an issue for these variables. To
illustrate, answering the survey questions at the extreme values of 1 or 5 is not
representative of an outlier. I examined the standardised scores for CEO age and
tenure to identify potential outliers. It was observed that the highest standardised
score was 2.13 for CEO age and 2.90 for CEO tenure. This implies that there were
no outliers in the two variables because their standardised scores were lower than
the threshold value of 3.29 (Tabachnick and Fidell, 2013). In addition to examining
the standardised scores, I also visually inspected the boxplots for CEO age and
tenure. The boxplots also demonstrated that there was no outlier, measured by
visibly far distance from the box. This further confirmed that outliers were not an
issue with respect to CEO age and tenure.
I also examined the standardised score for firm age. The results revealed that the
highest standardised score was 8.30, which is much higher than the second value of
3.01. The extreme value of 8.30 indicated that this case was an outlier as the value
is much higher than the threshold value of 3.29. Through examining the dataset, it
was found that the firm age for this case was 472 years. This case was then removed
from further data analysis to avoid potential distortion of the results. This leads to
a final sample size of 110 cases for further data analysis.
NORMALITY I then assessed the data normality of all variables based on the
skewness and kurtosis z- values, which are calculated by dividing the statistical
values of skewness and kurtosis by their respective standard errors. The z-values for

76
most variables were within the recommended range of +/-1.96 (Hair et al., 2014)
except for firm performance, CEO tenure, and firm age. In other words, the data for
firm performance, CEO tenure, and firm age was not normally distributed. Given
that the z-value of firm performance is -2.07, which is close to the recommended
threshold value, this variable remained unchanged. Following the suggestion from
Hair et al., (2014), I then transformed the data of CEO tenure and firm age by taking
the square root of each variable. The transformed data for CEO tenure became
normally distributed, but the transformed data on firm age still deviated from a
normal distribution. A logarithmic transformation was then applied to firm age to
overcome strong skewness (Tabachnick and Fidell, 2013). The skewness and
kurtosis z-values for CEO tenure and firm age after data transformation were within
the recommended range of +/-1.96, suggesting that the data would be acceptable
for further analysis. The detailed statistic values, standard errors, as well as z-values
for the normality test, are provided in Appendix 5.

77
4.5 Measurement
REGULATORY FOCUS While various measures have been developed to assess
people’s regulatory focus (Scholer and Higgins, 2011), the Regulatory Focus
Questionnaire (RFQ) and the General Regulatory Focus Measure (GRFM) are the
measures that have been commonly used in extant studies. Specifically, RFQ
captures people’s histories of success in achieving promotion and prevention related
goals (Higgins et al., 2001). It consists of 11 items, with six items for promotion focus
and five items for prevention focus. The GRFM captures people’s regulatory focus
by measuring the extent to which they concern promotion and prevention related
goals (Lockwood et al., 2002). It consists of 18 questions to measure promotion and
prevention focus. Consistent with prior empirical studies within the
entrepreneurship context (e.g. Bryant 2009; Kammerlander et al., 2015), I used the
RFQ to measure promotion and prevention focus as the RFQ is considered as the
“most widely appropriate of the existing measures” to capture people’s regulatory
focus (Haws et al., 2010, p. 980). CEOs were asked to provide their responses to
each item using a five-point Likert scale ranging from 1 to 5. Specific items of the
RFQ are provided in section 2 of Appendix 2. It is worth noting that several items
were reverse coded and the scores for these items were first adjusted before creating
the measures for promotion and prevention focus (i.e., taking the average of
respective items).
I assessed the measure of promotion and prevention focus using principal
component analysis (PCA) with varimax rotation technique. The results revealed an
inconsistent loading of one item on promotion focus (Item 1: “Compared to most
people, are you typically unable to get what you want out of life?”). This item was
then removed from further analysis. Removing the item was considered appropriate
because similar issues were also observed in another study which examined the
impact of CEO regulatory focus on the behaviours of organisations (i.e.,
Kammerlander et al., 2015). I then re-conducted PCA on the remaining ten items.
It was found that one item which was originally designed to measure promotion
focus was loaded on a separate factor (Item 11: “I have found very few hobbies or
activities in my life that capture my interest or motivate me to put effort into them.”).
Because a single item is insufficient to represent one factor (Tabachnick and Fidell,
2013), this item was excluded from analysis. Further PCA analysis on the remaining

78
items revealed that one item on prevention focus (Item 8: “Not being careful enough
has gotten you into trouble at times”) had to be removed because the communalities
value of 0.46 was lower than the recommended value 0.5.
The final PCA results indicated that two factors had eigenvalues over Kaiser’s
criterion of 1 and 59.5% of the variance can be explained by the two factors derived
from PCA. The factor loadings for all items range from 0.66 to 0.86, which are all
sufficient (Hair et al., 2014). The detailed results from PCA are presented in
Appendix 6. The four items for promotion focus and four items for prevention focus
were all loaded on the respective factors. The Cronbach’s Alpha was 0.64 for
promotion focus and 0.83 for prevention focus, indicating acceptable internal
reliability of the measures (Bryant, 2009; Hair et al., 2014). The results were
consistent with the study from Kammerlander et al., (2015) which also found that
promotion focus (α = 0.77) has higher internal reliability than prevention focus (α
= 0.60).
INNOVATIVENESS, RISK-TAKING, AND PROACTIVENESS Following prior
studies (Covin and Slevin, 1989; Covin and Wales, 2012; Dada and Fogg, 2016), I
employed the widely adopted nine-item scale to measure the three dimensions of
EO. In particular, each dimension of EO was measured by three items using a five-
point Likert scale. Sample items include: ‘We favour a strong emphasis on R&D,
technological leadership, and innovations’ (innovativeness); ‘When there is
uncertainty, we typically adopt a bold, aggressive posture in order to maximise the
probability of exploiting potential opportunities’ (risk-taking); and ‘We are very
often the first business to introduce new products, administrative techniques,
operating technologies, etc.’ (proactiveness). The Cronbach’s alpha is 0.77 for
innovativeness, 0.79 for risk-taking, and 0.84 for proactiveness, all well above the
recommended value of 0.7, indicating good scale reliability.
FIRM PERFORMANCE I employed four items to measure firm performance. CEOs
were required to evaluate their firms’ performance in comparison with major
competitors over the past three years on profitability, market share, return on
investments, and sales growth. This approach is considered appropriate because
prior empirical evidence has demonstrated that the performance relative to
competitors measured shows good relevance, internal consistency, and external

79
validity (Chandler and Hanks, 1993). The performance measure captures both
financial (profitability and return on investments) and non-financial performance
(market share and sales growth) (Richard et al., 2009). This is also consistent with
existing EO studies that use perceived financial and non-financial performance as
the performance indicator (Rauch et al., 2009). The items were measured by using
a five-point Likert scale (ranging from 1 = strongly disagree to 5 = strongly agree).
The average of these four items was used as the performance measure. The
Cronbach’s alpha was 0.77, indicating high scale reliability.
INDUSTRY ENVIRONMENT Following prior research, industry environment was
measured by assessing CEOs’ perceptions of the industry in which their firms
operate. For example, Bierly and Daly (2007) asked respondents to indicate whether
their industry would be characterised as a high-tech industry. I extended Bierly and
Daly’s (2007) one-item measure and used a two-item measure by asking
respondents to indicate: 1) the extent to which their primary product is high-tech or
low-tech; and 2) the extent to which their primary product is high knowledge
intensive or low knowledge intensive, based on a scale of one to five. Including one
more item to capture knowledge intensity is based on the consideration that high-
tech industries are generally more knowledge intensive than the low-tech ones
(Thornhill, 2006; Bolland and Hofer, 1998). Also, the item can better capture the
nature of the product, which refers to both goods and services, offered by firms from
the service sector. The average of the two items was used to represent the industry
environment in which firms operate. While the Cronbach’s alpha 0.55 is slightly
lower than the recommended value of 0.6, it was considered acceptable because
researchers have highlighted that a lower alpha is expected for scales that are
measured with few items (Dai et al., 2014; Morris and Pavett, 1992).
CONTROLS Several control variables were used in this study: CEO age, CEO tenure,
firm age, firm size, industry, and environmental turbulence. CEO age and tenure are
controlled because they allow CEOs to accumulate more experience, which may
influence the behaviours of firms they lead. For example, it is possible that CEOs
with more experience in innovation may have higher a tendency to foster such
activities within their firms. Also, one could argue that older CEOs might be less
motivated to pursue new opportunities because researchers have highlighted that
age is negatively associated with entrepreneurs’ focus on new opportunities (Gielnik

80
et al., 2012). Additionally, it is possible that CEOs with more experience, which
result from higher age and/or longer tenure, are more likely to have the skills in
managing their respective firms, which could have an impact on the outcome of
firms they lead. For example, researchers have highlighted that entrepreneurs’
experience is positively related to venture growth (Lee and Tsang, 2001), suggesting
that it is important to control the age and tenure of CEOs.
Firm age was calculated by the number of years the business was established
(Lubatkin et al., 2006). Older firms should have more experience in entrepreneurial
activities than younger firms. As such, firm age may influence the outcomes of firms’
different entrepreneurial activities. Firm size was measured by using the range of
full-time employees working within the business. It was controlled because firms’
capability to engage in entrepreneurial activities depends on their resources and
competencies (Covin and Slevin, 1991), which are associated with the size of
organisations. Firm size was included as dummy variables with three categories:
less than 10 employees, which served as the reference group in the model, 11-50
employees, and 51-250 employees. Consistent with previous research (Lubatkin et
al., 2006; Kammerlander et al., 2015), industry was controlled to account for
potential influences from the industry. Industry dummies include manufacturing,
service, and other businesses, which served as the reference group in the model.
Finally, environmental turbulence was controlled because changes in the
environment provides new opportunities but also entails risks (Su et al., 2011). As
such, environmental turbulence may have an impact on firm behaviours or
performance. Environmental turbulence was measured by using a six-item, five-
point scale adapted from Jaworski and Kohli (1993). The scale contained items
measuring the market and technological changes within the environment in which
firms operate. Sample items include: “Customers’ product preferences change quite
a bit over time” and “The technology in our industry is changing rapidly”. The
Cronbach’s alpha was 0.76, indicating high scale reliability.

81
4.6 Reliability and validity test
NON-RESPONSE BIAS I tested non-response bias for early and late responses
(Armstrong and Overton, 1977) on CEO age, tenure, and firm age. The underlying
assumption is that late responses might be similar to non-responses (Kanuk and
Berenson, 1975). I categorised the data into two groups based on the time of
response. The early response group has 56 cases, while the late response group has
54 cases. The results from T-test showed that all p-value > 0.10 (see Appendix 7),
suggesting that there is no significant differences between the two groups. Thus,
non-response bias was not a problem to this study.
COMMON METHOD BIAS As the survey data was self-reported by individual CEOs,
several approaches were employed to minimise the potential issue of common
method bias (Podsakoff and Organ, 1986; Podsakoff et al., 2003). Firstly,
participants were assured the anonymity and confidentiality of their responses to
reduce the effect of social desirability in answering the survey (Podsakoff et al.,
2003). Specifically, they were assured that the information they provided would
remain confidential in that their answers would not be shared with anybody and
they would not be named in any work arising from the research. Secondly, the
questions concerning the different constructs were placed in different sections of
the survey. This separation of constructs with different sets of section instructions
can help to minimise participants' perception of any direct relationship between the
constructs in the study (Podsakoff et al., 2003).
Finally, I employed Harman’s one-factor test to examine common method bias.
According to Podsakoff and Organ (1986, p. 536), when a substantial amount of
common method variance is present, “either (a) a single factor will emerge from the
factor analysis, or (b) one ‘general’ factor will account for the majority of the
covariance” among the measured variables. The results from factor analysis
indicated that six factors account for 70 per cent of the variance extracted
(eigenvalue > 1), with the first factor accounting for only 25.42 per cent of the
variance (see Appendix 8). Hence, no single factor was dominant from the factor
analysis, and no single factor represented the majority of the variance. Accordingly,
the risk of common method bias is low in this study.
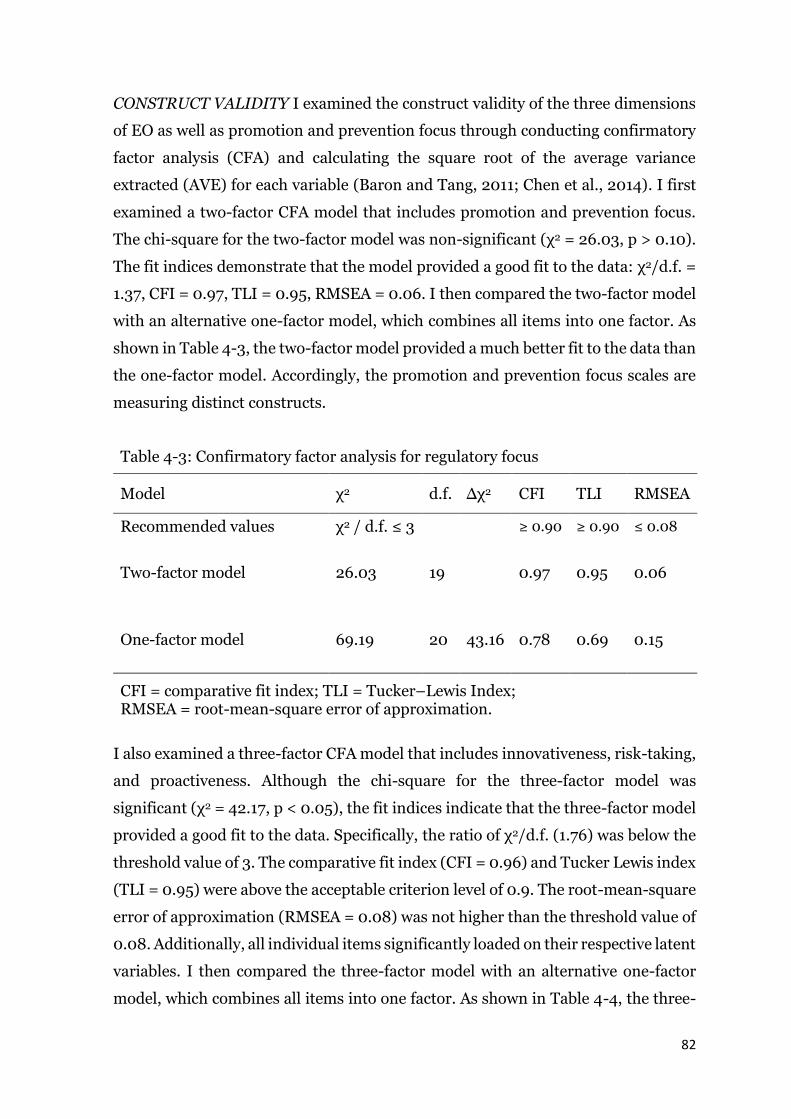
82
CONSTRUCT VALIDITY I examined the construct validity of the three dimensions
of EO as well as promotion and prevention focus through conducting confirmatory
factor analysis (CFA) and calculating the square root of the average variance
extracted (AVE) for each variable (Baron and Tang, 2011; Chen et al., 2014). I first
examined a two-factor CFA model that includes promotion and prevention focus.
The chi-square for the two-factor model was non-significant (χ2 = 26.03, p > 0.10).
The fit indices demonstrate that the model provided a good fit to the data: χ2/d.f. =
1.37, CFI = 0.97, TLI = 0.95, RMSEA = 0.06. I then compared the two-factor model
with an alternative one-factor model, which combines all items into one factor. As
shown in Table 4-3, the two-factor model provided a much better fit to the data than
the one-factor model. Accordingly, the promotion and prevention focus scales are
measuring distinct constructs.
Table 4-3: Confirmatory factor analysis for regulatory focus
Model χ2 d.f. Δχ2 CFI TLI RMSEA
Recommended values χ2 / d.f. ≤ 3 ≥ 0.90 ≥ 0.90 ≤ 0.08
Two-factor model 26.03 19 0.97 0.95 0.06
One-factor model 69.19 20 43.16 0.78 0.69 0.15
CFI = comparative fit index; TLI = Tucker–Lewis Index; RMSEA = root-mean-square error of approximation.
I also examined a three-factor CFA model that includes innovativeness, risk-taking,
and proactiveness. Although the chi-square for the three-factor model was
significant (χ2 = 42.17, p < 0.05), the fit indices indicate that the three-factor model
provided a good fit to the data. Specifically, the ratio of χ2/d.f. (1.76) was below the
threshold value of 3. The comparative fit index (CFI = 0.96) and Tucker Lewis index
(TLI = 0.95) were above the acceptable criterion level of 0.9. The root-mean-square
error of approximation (RMSEA = 0.08) was not higher than the threshold value of
0.08. Additionally, all individual items significantly loaded on their respective latent
variables. I then compared the three-factor model with an alternative one-factor
model, which combines all items into one factor. As shown in Table 4-4, the three-

83
factor model provided a much better fit to the data than the one-factor model.
Together, the results suggest that the innovativeness, risk-taking, and proactiveness
scales are measuring distinct constructs.
Table 4-4: Confirmatory factor analysis for the three dimensions of EO
Model χ2 d.f. Δχ2 CFI TLI RMSEA
Recommended values χ2 / d.f. ≤ 3 ≥ 0.90 ≥ 0.90 ≤ 0.08
Three-factor model 42.17 24 0.96 0.95 0.08
One-factor model 183.22 27 141.05 0.68 0.58 0.23
CFI = comparative fit index; TLI = Tucker–Lewis Index; RMSEA = root-mean-square error of approximation.
Additionally, I calculated the square root of the average variance extracted for
promotion focus, prevention focus, innovativeness, risk-taking, and proactiveness.
Results indicated that the square root of the AVE values were adequate (see
Appendix 9 for a summary). The AVE 0.483 for promotion focus is considered
acceptable although it is slightly lower than the recommended value of 0.5
(Tabachnick and Fidell, 2013). Taken together, the CFA and AVE results provide
support for discriminant and convergent validity of the key variables used in this
study.
84
Chapter 5 Data Analysis and Results
5.1 Descriptive statistics
Table 5-1 presents the means, standard deviation, and correlations for the variables
used in this study. The correlation between promotion and prevention focus is low
in magnitude (ρ = 0.168, p > 0.1), which is consistent with previous studies
(Kammerlander et al., 2015; Higgins et al., 2001). The correlations between
innovativeness, risk-taking, and proactiveness range from 0.47 to 0.52, suggesting
that while there is shared variance among the three dimensions of EO, substantial
independent variance also exist for each dimension. The existence of independent
variance provide further support that examining the three dimensions of EO
independently may generate useful insights that cannot be revealed when the three
dimensions are combined into one factor. The magnitudes of their correlations are
comparable to those reported by Lomberg et al., (2016) ranging from 0.44 to 0.49
and by Kreiser et al., (2013) ranging from 0.36 to 0.47. I then assessed
multicollinearity using the variance inflation factor (VIF) statistics. The lowest value
was 1.19 and the highest value was 3.01. All VIFs were substantially below the critical
value of 10 (Neter et al., 1985), suggesting that multicollinearity is not a concern for
the current study.

85
Table 5-1: Means, Standard Deviations (SD), and Correlations of Variables
M SD 1 2 3 4 5 6 7 8 9 10
1. CEO age 50.67 10.49
2. CEO tenure 14.41 9.57 .406**
3. Firm age 30.40 32.11 0.172 .344**
4. Environmental turbulence 3.71 .64 0.002 -0.165 -.189*
5. Industry environment 3.57 .99 0.071 -0.124 -0.099 .327**
6. Promotion focus 3.93 .49 -0.065 -0.011 -0.017 0.177 0.150
7. Prevention focus 3.35 .89 0.156 .219* .200* -0.097 0.082 0.168
8. Innovativeness 3.33 .85 0.183 0.059 0.007 .446** .238* .251** -0.087
9. Risk-taking 2.86 .97 0.000 -0.036 -0.109 .321** .194* 0.069 -.238* .492**
10. Proactiveness 3.21 .92 0.028 -0.065 -0.100 .265** 0.099 .295** -.223* .515** .468**
11. Firm performance 3.53 .80 0.042 0.088 0.105 -0.059 0.146 0.180 -0.065 0.098 0.056 .297**
N=110 firms; *p < .05; ** < .01 (two-tailed).
86
5.2 Regulatory focus and firm performance
5.2.1 Regression Models
The results for testing Hypotheses 1 to 4 are provided in Table 5-2. The regression
analysis used three models. Model 1 contains only the control variables and the
moderating variable. In Model 2, I added the independent variables: promotion and
prevention focus. The interaction terms were included in Model 3. Consistent with
prior research (Kammerlander et al., 2015; Aiken et al., 1991), all independent
variables were mean centred before creating the interaction terms to prevent
potential multicollinearity.

87
Table 5-2: Regressing promotion and prevention focus onto firm performance
Model 1: Model 2: Model 3:
Constant 3.06*** 2.82*** 2.73***
Controls
CEO age -0.01 0.00 0.00
CEO tenure 0.04 0.03 0.01
Firm age 0.07 0.16 0.18
Firm size (11-50) 0.02 0.00 -0.02
Firm size (51-250) 0.16 0.11 0.09
Manufacturing 0.29 0.30 0.24
Service -0.04 0.08 0.03
Environmental turbulence -0.12 -0.16 -0.18
Industry environment (High/Low-tech industry) 0.19* 0.18* 0.20*
Direct effects
Promotion focus 0.33* 0.25
Prevention focus -0.18* -0.18+
Interactions
Promotion focus x Industry environment (High/Low-tech industry) 0.42*
Prevention focus x Industry environment (High/Low-tech industry) 0.01
R² 0.11 0.16 0.22
Adjusted R² 0.03 0.07 0.12
ΔR² 0.06 0.06
F 1.36 1.75+ 2.12*
ΔF 3.23* 3.63*
†p < 0.10; *p < 0.05; ** < 0.01; *** < 0.001; unstandardized regression coefficients (two-tailed tests)

88
5.2.2 Regression Results
Hypotheses 1 and 2 tested the relationship between regulatory focus and firm
performance. Hypothesis 1 predicted that promotion focus would be positively
associated with firm performance. As shown in Model 2, promotion focus was
positively and significantly (β= 0.33, p < 0.05) related to firm performance,
providing support for Hypothesis 1. Hypothesis 2 posited that prevention focus
would be negatively related to firm performance. As also shown in Model 2,
prevention focus was negatively and significantly (β= -0.18, p < 0.05) related to firm
performance. Hence, Hypothesis 2 was supported. Compared with Model 1, Model
2, which includes promotion and prevention focus as predictors, explained an
additional 6% of the variance in firm performance.
Hypotheses 3 and 4 assessed the moderating effect of industry environment on the
relationship between regulatory focus and firm performance. Hypothesis 3
predicted that industry environment would moderate the positive relationship
between promotion focus and firm performance. As shown in Model 3, the
interaction term of promotion focus was positive and significant (β= 0.42, p < 0.05),
providing support for Hypothesis 3. The interaction term explained an additional 6%
of the variance in firm performance beyond that explained by controls, promotion
and prevention focus. Hypothesis 4 posited that the industry environment would
moderate the negative relationship between prevention focus and firm performance.
As shown in Model 3, the interaction term of prevention focus was non-significant
(β= 0.01, n.s.). As such, Hypothesis 4 was not supported.
The moderating effect of industry environment is illustrated in Figure 5-1. As shown
in the figure, the relationship between promotion focus and firm performance is
stronger for firms in high-tech industries than those in low-tech industries. The
figure also revealed a downward trend on the promotion focus – firm performance
relationship for firms in low-tech industries, implying that promotion focus might
not have a universally positive effect on firm performance. Specifically, the positive
performance effects of promotion focus might hold true only in high-tech industries
rather than in low-tech industries. The performance effects of prevention focus is
similar for firms in high-tech industries and those in low-tech industries.
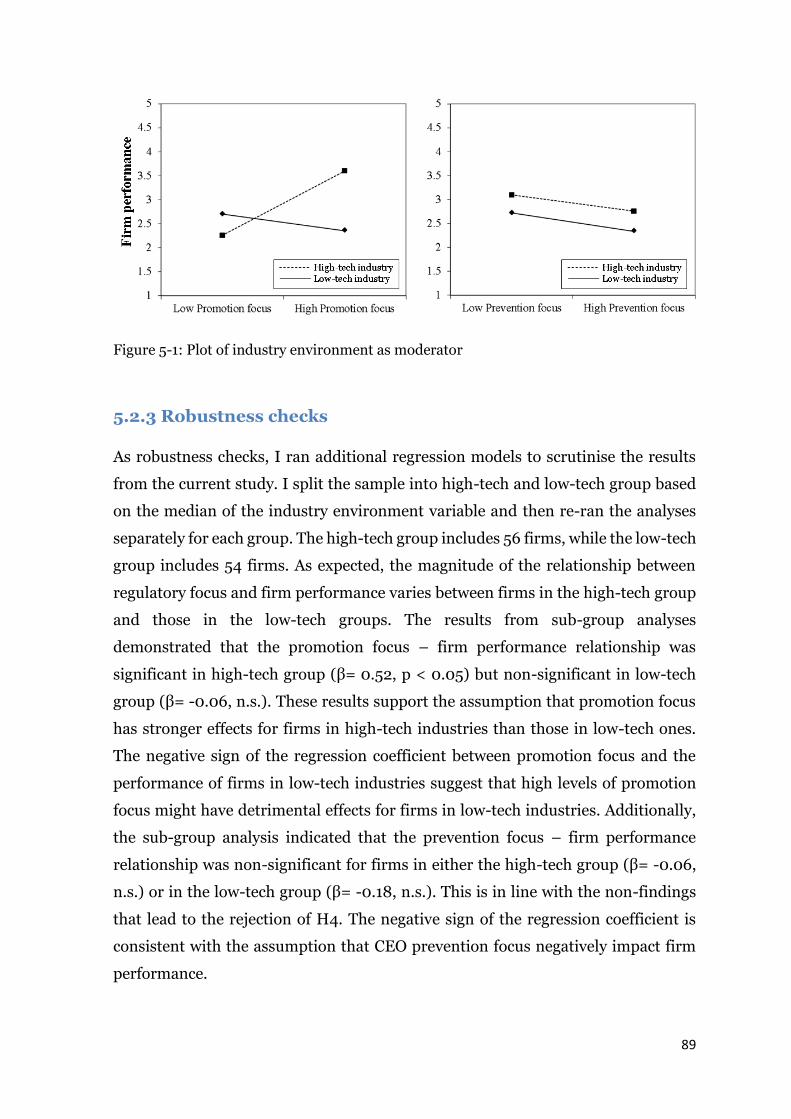
89
Figure 5-1: Plot of industry environment as moderator
5.2.3 Robustness checks
As robustness checks, I ran additional regression models to scrutinise the results
from the current study. I split the sample into high-tech and low-tech group based
on the median of the industry environment variable and then re-ran the analyses
separately for each group. The high-tech group includes 56 firms, while the low-tech
group includes 54 firms. As expected, the magnitude of the relationship between
regulatory focus and firm performance varies between firms in the high-tech group
and those in the low-tech groups. The results from sub-group analyses
demonstrated that the promotion focus – firm performance relationship was
significant in high-tech group (β= 0.52, p < 0.05) but non-significant in low-tech
group (β= -0.06, n.s.). These results support the assumption that promotion focus
has stronger effects for firms in high-tech industries than those in low-tech ones.
The negative sign of the regression coefficient between promotion focus and the
performance of firms in low-tech industries suggest that high levels of promotion
focus might have detrimental effects for firms in low-tech industries. Additionally,
the sub-group analysis indicated that the prevention focus – firm performance
relationship was non-significant for firms in either the high-tech group (β= -0.06,
n.s.) or in the low-tech group (β= -0.18, n.s.). This is in line with the non-findings
that lead to the rejection of H4. The negative sign of the regression coefficient is
consistent with the assumption that CEO prevention focus negatively impact firm
performance.

90
5.2.4 Post-hoc test
Because promotion and prevention focus represent two independent systems rather
than opposite ends of a single continuum (Higgins, 1997, 1998), researchers have
highlighted that people might have varying combinations of promotion and
prevention focus (Lanaj et al., 2012). Accordingly, I conducted post-hoc tests to
examine how firm performance might differ when firms are led by CEOs with
varying combinations of promotion and prevention focus. Consistent with prior
studies (Kammerlander et al., 2015; Markovits, 2012; Idson et al., 2000), I used the
median value of promotion and prevention focus to split the sample into four groups:
(a) high promotion focus and high prevention focus; (b) high promotion focus and
low prevention focus; (c) low promotion focus and high prevention focus; and (d)
low promotion focus and low prevention focus. Following the taxonomy provided
by Markovits (2012), I labelled the four groups as rationalists (34 cases), achievers
(23 cases), conservatives (29 cases), and indifferents (24 cases), as shown in Table
5-3.
Table 5-3: CEOs with varying combinations of promotion and prevention focus
Promotion focus
High Low
Pre
ven
tio
n f
ocu
s
Hig
h
(a) Rationalists (c) Conservatives
Lo
w
(b) Achievers (d) Indifferents
I calculated the mean values of firm performance for each of the four groups. As
illustrated in Figure 5-2, the rationalists group achieved the highest levels of firm
performance (3.65), whereas the conservatives group achieved the lowest levels of
firm performance (3.34). The indifferents group (3.63) achieved higher
performance than the group of achievers (3.48). While the four groups differ in the
mean value of firm performance, results from ANOVA analysis suggested that the
between groups difference is not-significant. The Partial eta squared is 0.03,
suggesting that 3% of the variance in firm performance is accounted for by the

91
membership of different groups with varying combinations of promotion and
prevention focus.
Figure 5-2: Comparing the mean value of firm performance

92
5.3 Entrepreneurial orientation and firm performance
5.3.1 Regression Models
The results for testing Hypotheses 5 to 10 are provided in Table 5-4. The regression
analysis used six models. Model 1 contains the control variables and the moderating
variable. For the dummy variable of firm size and industry, I used the group of fewer
than 10 employees and ‘other industry’ as the reference group. In Model 2, I added
the linear terms for innovativeness, risk-taking, and proactiveness. A positive
relationship is observed when the coefficient of the linear term is positive and
significant, whereas a negative relationship is observed when it is negative and
significant (Aiken et al., 1991). In Model 3, I included the squared terms for
innovativeness, risk-taking, and proactiveness to test for their nonlinear effects on
firm performance. A U-shaped relationship is concluded when the coefficient of the
squared term is positive and significant, whereas an inverted U-shaped relationship
is concluded when the coefficient of the squared term is negative and significant
(Aiken et al., 1991). I then included three separate models to test for the
hypothesised moderating impact of industry environment. The linear and quadratic
interaction terms for innovativeness, risk-taking, and proactiveness were included
in Model 4 to Model 6. In line with prior research (Kreiser et al., 2013; Aiken et al.,
1991), all independent variables were mean-centred before creating the interaction
terms to prevent potential multicollinearity.

93
Table 5-4: Regressing innovativeness, risk-taking, and proactiveness onto firm performance
Model 1: Model 2: Model 3: Model 4: Model 5:
Model 6:
Constant 3.54*** 3.38*** 3.51*** 3.68*** 3.48*** 3.71*** Controls
Firm age 0.10 0.21* 0.20* 0.18+ 0.21* 0.18+ Firm size (11-50) 0.02 -0.10 -0.02 0.07 -0.02 0.04 Firm size (51-250) 0.13 -0.10 -0.07 -0.04 -0.07 -0.08 Manufacturing 0.31 0.22 0.21 0.20 0.22 0.31 Service -0.01 0.19 0.22 0.19 0.23 0.26
Environmental turbulence -0.12 -0.15 -0.20 -0.23 -0.20 -0.26+
Industry environment (High/Low-tech industry) 0.18* 0.16+ 0.14 -0.02 0.12 0.07 Direct effects
Innovativeness -0.08 -0.04 -0.10 -0.05 -0.01 Risk-taking -0.03 -0.02 -0.03 -0.02 -0.03
Proactiveness 0.35** 0.32** 0.31** 0.32** 0.22+ Nonlinear effects
(Innovativeness)2 -0.19+ -0.27** -0.19+ -0.20*
(Risk-taking)2 0.14+ 0.10 0.13 0.13+
(Proactiveness)2 0.05 0.07 0.05 0.01 Interactions
Innovativeness x Industry environment (High/Low-tech industry) 0.13
(Innovativeness)2 x Industry environment (High/Low-tech industry) 0.27* Risk-taking x Industry environment (High/Low-tech industry) 0.02
(Risk-taking)2 x Industry environment (High/Low-tech industry) 0.02 Proactiveness x Industry environment (High/Low-tech industry) 0.25*
(Proactiveness)2 x Industry environment (High/Low-tech industry) 0.05 R² 0.10 0.19 0.24 0.29 0.25 0.28 Adjusted R² 0.04 0.11 0.14 0.18 0.12 0.17 ΔR² 0.09 0.05 0.05 0.00 0.04 F 1.70 2.39* 2.39** 2.62** 2.04* 2.48**
ΔF 3.69* 2.12 3.34* 0.05 2.58+
†p < 0.10; *p < 0.05; ** < 0.01; *** < 0.001; unstandardized regression coefficients (two-tailed tests)

94
5.3.2 Regression Results
Hypotheses 5 to 7 examined the independent effects of innovativeness, risk-taking,
and proactiveness on firm performance. Hypothesis 5 predicted an inverted U-
shaped relationship between innovativeness and firm performance. As shown in
Model 3, while the linear term of innovativeness was non-significant (β= -0.04, n.s.),
its squared term was negatively and marginally significant (β= -0.19, p < 0.10)
related to firm performance, providing support for Hypothesis 5. As illustrated in
Figure 5-3a, innovativeness was initially positively associated with firm
performance, but the benefits start to diminish when the levels of innovativeness
shift from moderate to high levels.
Hypothesis 6 posited an inverted U-shaped relationship between risk-taking and
firm performance. As also shown in Model 3, while the linear term of risk-taking
was non-significant (β= -0.02, n.s.), its squared term was positively and marginally
significant (β= 0.14, p < 0.10) related to firm performance. The results suggest that
the relationship between risk-taking and firm performance was in the opposite
direction. Hence, Hypothesis 6 was not supported. As Figure 5-3b shows, firm
performance decreases slightly for firms with increasing levels of risk-taking, before
increasing again when the levels of risk-taking shift from moderate to high levels.
Hypothesis 7 predicted an inverted U-shaped relationship between proactiveness
and firm performance. As shown in Model 3, the linear term of proactiveness was
positive and significant (β= 0.32, p < 0.01), while its squared term was non-
significant (β= 0.05, n.s.), suggesting that the relationship between proactiveness
and firm performance is linear rather than the proposed inverted-U shaped. As
such, Hypothesis 7 was not supported. Figure 5-3c illustrates that increasing levels
of proactiveness lead to better performance. The linear term of proactiveness
explained an additional 9% (Model 2) of the variance in firm performance beyond
that explained by controls (Model 1). The curvilinear teams of innovativeness and
risk-taking together explained an additional 5% of the variance in firm performance
(Model 3). Together, the three dimensions of EO account for 14% of the total
variance in the performance of SMEs.

95
Hypotheses 8 to 10 tested the moderating effect of industry environment on the
relationship between the individual dimensions of EO and firm performance.
Hypothesis 8 proposed that the independent effects of innovativeness will be
stronger for firms in low-tech industries than those in high-tech ones. As shown in
Model 4, the linear innovativeness - industry environment interaction term was
non-significant (β= 0.13, n.s.), while the squared interaction term was significant
(β= 0.27, p < 0.05), providing support for Hypothesis 8. Figure 5-4a illustrated the
moderating effect of industry environment on the innovativeness – firm
performance relationship between high-tech and low-tech industries. As shown in
the figure, the effect of innovativeness on firm performance is more pronounced
within low-tech industries.
Hypothesis 9 hypothesised that the independent effects of risk-taking will be
stronger for firms in high-tech industries than those in low-tech ones. As shown in
Model 5, neither the linear (β= 0.02, n.s.) innovativeness and industry environment
interaction term nor the squared (β= 0.02, n.s.) interaction term was non-
significant. As such, Hypothesis 9 was not supported. As shown in Figure 5-4b, risk-
taking has similar effects for SMEs in high-tech industries and those in low-tech
industries.
Hypothesis 10 posited that the independent effects of proactiveness will be stronger
for firms in high-tech than those in low-tech industries. As shown in Model 6, the
linear proactiveness – industry environment interaction term was significant (β=
0.25, p < 0.05), while the squared interaction was non-significant (β= 0.05, n.s.).
This result implies that industry environment only moderates the linear
relationship between proactiveness and firm performance without playing a
moderating role on the proposed inverted U-shaped relationship. Accordingly,
Hypothesis 10 was not supported. As Figure 5-4c shows, the relationship between
proactiveness and firm performance is stronger for firms in high-tech industries
than those in low-tech industries. Together, the results demonstrate that the
explanatory power of innovativeness and proactiveness, with the exception of risk-
taking, was enhanced when industry environment was included as the moderator.
In particular, compared to Model 3, the moderation model of innovativeness (i.e.,
Model 4) and proactiveness (i.e., Model 6) explained an extra 5% and 4% of the
variance in firm performance respectively.

96
Figure 5-3a-c: Plot of the effects of the dimensions of EO on firm performance
Figure 5-4a-c: Plot of industry environment as moderator
5.2.3 Robustness checks
I ran additional regression models as robustness checks to scrutinise the results
from the current study. The regression results demonstrated that the relationship
between risk-taking and firm performance was U-shaped rather than the proposed
inverted U-shaped relationship. Because researchers have highlighted that there is
a “potential for an S-shape or a series of inverse-U relationships between EO and
performance” (Tang et al., 2008, p. 232), I suspect that the risk-taking and firm
performance relationship may be more complex than originally anticipated. To
further probe the performance effects of risk-taking and to identify potential causes
for the non-findings, I first created a cubed risk-taking term. I then entered the
cubed term into a new regression model after the inclusion of the linear and squared

97
terms to test for a potential S-shaped relationship between risk-taking and firm
performance. The regression results for the cubed risk-taking term was non-
significant (β= 0.01, n.s.), suggesting the risk-taking and firm performance
relationship is quadratic rather than cubic.
I then split the sample into high-tech and low-tech groups based on the median of
the industry environment variable and then re-ran the analyses separately for each
group. The high-tech group includes 56 firms, while the low-tech group includes 54
firms. As expected, the magnitude of the relationship between the individual EO
dimensions and firm performance vary between high-tech and low-tech group.
Firstly, the results from sub-group analysis reveal that the relationship between the
squared innovativeness term and firm performance was insignificant within high-
tech group (β= -0.09, n.s.) but significant within low-tech group (β= -0.48, p < 0.05).
This finding provides further support that innovativeness has more pronounced
effects on firms in low-tech than those in high-tech industries.
Secondly, the relationship between the squared risk-taking term and firm
performance was marginally significant within the high-tech group (β= 0.22, p <
0.1) but insignificant within the low-tech group (β= 0.10, n.s.). While this result
from the sub-group analysis suggests that risk-taking has more pronounced effects
on firms in high-tech than low-tech industries, a significant result was not observed
from the full sample. Accordingly, the moderating effect of industry environment
on the relationship between risk-taking and firm performance remains inconclusive.
Thirdly, the linear relationship between proactiveness and firm performance was
significant within the high-tech group (β= 0.39, p < 0.05) but insignificant within
the low-tech group (β= 0.29, n.s.). The relationship between the squared
proactiveness term and firm performance was neither significant in the high-tech
(β= 0.02, n.s.) nor in the low-tech groups (β= 0.01, n.s.). Together, these results
suggest that the proactiveness - firm performance relationship is linear rather than
the proposed inverted U-shaped. Also, the performance effect of proactiveness is
greater on firms in high-tech than those in low-tech industries.
Given the debate about whether EO represents a unidimensional or
multidimensional construct, I performed an ad-hoc analysis to assess the effect of

98
the unidimensional EO on firm performance. The EO construct was measured by
taking the average of its three dimensions. It was then mean centred before creating
the squared term of EO and the interaction term with industry environment. I then
ran three additional models. The first model includes the controls (same as in Model
1 in Table 5-2) and the linear EO term. The squared EO term was added in the
second model, while the linear and squared interaction terms of EO and industry
environment were included in the third model.
The results demonstrate that the overall effect of EO on firm performance was
positive and marginally significant (β= 0.23, p < 0.10). In the second model that
includes both the linear and squared EO term. While the linear term was positive
and marginally significant (β= 0.24, p < 0.10), the squared term was not significant
(β= 0.05, n.s.), suggesting that the EO – firm performance relationship is linear
rather than curvilinear. In the final model that includes both the linear and squared
interaction terms, the linear interaction term was marginally significant (β= 0.24, p
< 0.10), while the squared term was not significant (β= 0.17, n.s.), suggesting that
EO has stronger performance effects on firms in high-tech than those in low-tech
industries. Together, these results demonstrated that the performance implications
of EO differ substantially, depending upon whether EO is conceptualised as a
unidimensional or multidimensional construct.

99
5.4 Regulatory focus and entrepreneurial orientation
5.4.1 Regression models
The results for testing Hypotheses 11 to 16 are provided in Table 5-5. The regression
analysis used six models. In Models 1-2, the dependent variable is innovativeness,
whereas in Models 3-4, the dependent variable is risk-taking. In Models 5-6, the
dependent variable is proactiveness. Models 1, 3, and 5 contain only the control
variables. The predicting variables promotion and prevention focus were added in
Models 2, 4, and 6.

100
Table 5-5: Regressing innovativeness, risk-taking, and proactiveness onto promotion and prevention focus
Innovativeness Risk-taking Proactiveness
Model 1: Model 2: Model 3: Model 4: Model 5: Model 6:
Constant 0.49 -0.59 2.55** 2.94** 3.12*** 1.96*
Controls
CEO age 0.01 0.01 -0.01 0.00 -0.01 0.00
CEO tenure 0.05 0.04 0.14+ 0.14+ 0.07 0.05
Firm age (log) -0.06 0.01 -0.38** -0.33* -0.38** -0.28*
Firm size (11-50) 0.26 0.24 -0.11 -0.13 0.42+ 0.39
Firm size (51-250) 0.49* 0.44+ 0.35 0.34 0.83** 0.77**
Manufacturing 0.04 0.04 -0.23 -0.20 0.25 0.26
Service -0.14 -0.04 -0.53* -0.46+ -0.62** -0.49*
Environmental turbulence 0.61* 0.57* 0.38** 0.38** 0.27* 0.22+
Direct effects
Promotion focus 0.34* -0.01 0.40*
Prevention focus -0.14 -0.18+ -0.22*
R² 0.29 0.33 0.21 0.23 0.33 0.39
Adjusted R² 0.23 0.26 0.15 0.16 0.27 0.33
ΔR² 0.04 0.03 0.06
F 5.12*** 4.88*** 3.32** 3.01** 6.16*** 6.29***
ΔF 3.07+ 1.62 4.91**
†p < 0.10; *p < 0.05; ** < 0.01; *** < 0.001; unstandardized regression coefficients (two-tailed tests)

101
5.4.2 Regression results
Hypotheses 11 to 13 examined the effects of promotion focus on firms’ levels of
innovativeness, risk-taking, and proactiveness. Hypothesis 11 stated that
promotion focus would be positively associated with innovativeness. As shown
in Model 2, there is a significant positive relationship between promotion focus
and innovativeness (β= 0.34, p < 0.05). Therefore, Hypothesis 11 is supported.
Hypothesis 12 proposed that promotion focus would be positively associated
with risk-taking. However, results do not provide support for Hypothesis 12. As
shown in Model 4, the relationship between promotion focus and risk-taking is
non-significant (β= -0.01, n.s.). Hypothesis 13 predicted that promotion focus
would be positively associated with proactiveness. Results in Model 6 indicate a
significant positive relationship between promotion focus and proactiveness (β=
0.40, p < 0.05), providing support for Hypothesis 13.
Hypotheses 14 to 16 assessed the influences of prevention focus on firms’ levels
of innovativeness, risk-taking, and proactiveness. Hypothesis 14 stated that
prevention focus would be negatively associated with innovativeness. Results in
Model 2 demonstrate that while there is a negative relationship between
prevention focus and innovativeness as predicted, the relationship is non-
significant (β= -0.14, n.s.). Hence, Hypothesis 14 is not supported. Hypothesis 15
proposed that prevention focus would be negatively associated with risk-taking.
Results in Model 4 demonstrate a marginally significant negative relationship
between prevention focus and risk-taking (β= -0.18, p < 0.10), providing support
for Hypothesis 15. Hypothesis 16 predicted that prevention focus would be
negatively associated with proactiveness. Results in Model 6 revealed a
significant negative relationship between prevention focus and proactiveness
(β= -0.22, p < 0.05), providing support for Hypothesis 16.
Compared to the baseline models (i.e., Models 1, 3, and 5), which contain only
the control variables, the models that include promotion and prevention focus as
predictors (i.e., 2, 4, and 6) have a higher explanatory power in elucidating the
variance in firms’ levels of innovativeness, risk-taking, and proactiveness. In

102
particular, promotion focus explained an additional 4% of the variance in firms’
levels of innovativeness (Model 2) while prevention focus explained an
additional 3% of the variance in firms’ levels of risk-taking (Model 4).
Additionally, promotion and prevention together explained an additional 6% of
the variance in firms’ levels of proactiveness (Model 6).
5.4.3 Post-hoc test
Similar to the regulatory focus – firm performance relationship, I also conducted
post-hoc test to examine how firms’ level of innovativeness, risk-taking, and
proactiveness might differ when they are led by CEOs with varying combinations
of promotion and prevention focus. I first calculated the mean values of
innovativeness, risk-taking, and proactiveness for each of the four groups. The
results are shown in Table 5-6.
Table 5-6: Comparing the means of innovativeness, risk-taking, and
proactiveness
Group Innovativeness Risk-taking Proactiveness
Rationalists (High promotion focus / high prevention focus)
3.51 2.78 3.39
Achievers (High promotion focus / low prevention focus)
3.65 3.30 3.57
Conservatives (Low promotion focus / high prevention focus)
3.11 2.56 2.71
Indifferents (Low promotion focus / low prevention focus)
3.03 2.90 3.19
Group total mean 3.33 2.86 3.21
To examine whether groups with high promotion focus will exhibit higher levels
of innovativeness, risk-taking, and proactiveness than groups with low

103
promotion focus, I compared the groups between rationalists and conservatives,
as well as the groups between achievers and indifferents. As shown in Table 5-6
and illustrated in Figure 5-5, the rationalists group exhibited higher levels of
innovativeness, risk-taking and proactiveness than the conservatives group.
Similar results are also observed when comparing the achievers group with the
indifferents group. Together, these results are consistent with the assumption
that CEOs with high levels of promotion focus should positively affect firms’
levels of innovativeness, risk-taking and proactiveness (Hypothesis 11 to 13).
While H12 was non-significant, based on the regression results reported in
section 5.4.2, the results from mean comparisons provide some support that
promotion focus should have a positive impact on firms’ levels of risk-taking.
To examine whether groups with high prevention focus would exhibit lower
levels of innovativeness, risk-taking, and proactiveness than groups with low
prevention focus, I compare the groups between rationalists and achievers, as
well as the groups between conservatives and indifferents. As illustrated in
Figure 5-5, the rationalists group exhibited lower levels of risk-taking and
proactiveness than the achivers group. Similar findings were also observed when
comparing the conservatives group with the indifferents group. Together, these
results are in line with the assumption that CEOs with high levels of prevention
focus should negatively impacts firms’ levels of risk-taking and proactiveness
(Hypothesis 15 and 16). The innovativeness of rationalists group (3.51) is lower
than the achievers group (3.65), which is consistent with arguments leading to
Hypothesis 14. Nevertheless, the opposite result is observed when comparing the
innovativeness between the conservatives group (3.11) and the indifferents group
(3.03). This inconsistent result might underlie the non-significant findings that
led to the rejection of H14, as reported in section 5.4.2.
Results from ANOVA analysis suggest the between groups difference for
innovativeness (p < 0.05), risk-taking (p < 0.10), and proactiveness (p < 0.05)
are all significant, suggesting that firms that are led by CEOs with varying
combinations of promotion and prevention focus differ significantly in their
levels of innovativeness, risk-taking, and proactiveness. The Partial eta squared
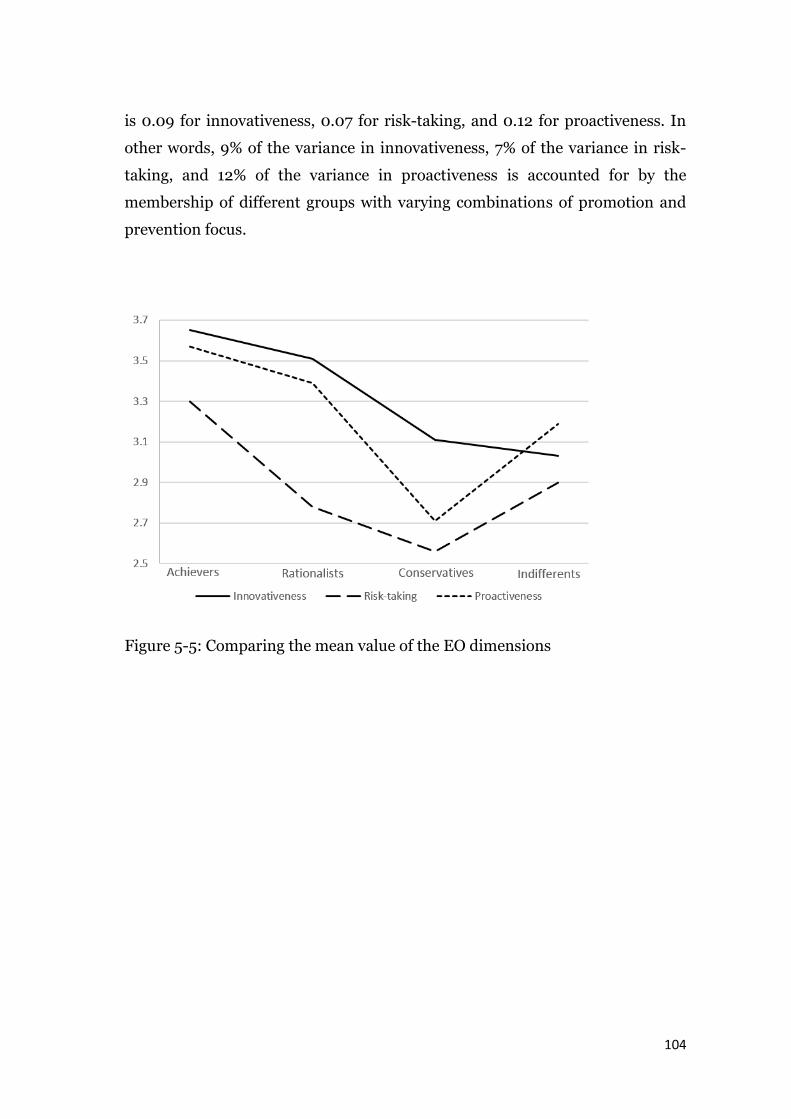
104
is 0.09 for innovativeness, 0.07 for risk-taking, and 0.12 for proactiveness. In
other words, 9% of the variance in innovativeness, 7% of the variance in risk-
taking, and 12% of the variance in proactiveness is accounted for by the
membership of different groups with varying combinations of promotion and
prevention focus.
Figure 5-5: Comparing the mean value of the EO dimensions

105
5.5 Summary
The results from hypothesis testing are summarised in Table 5-7. Hypotheses 1-
4 examined the performance effects of promotion and prevention focus and
tested how they differ between firms in high-tech industries and those in low-
tech industries. The empirical results provide some support for the effects of
promotion and prevention focus on firm performance. Whilst industry
environment moderates the promotion focus – firm performance relationship, a
similar moderation effect was not observed for the prevention focus – firm
performance relationship.
Hypotheses 5 to 10 examined the performance effects of innovativeness, risk-
taking, and proactiveness on firm performance and tested how they differ
between firms in high-tech industries and those in low-tech industries. While the
empirical results provide some support for the hypothesised relationships, the
nature of the performance effects of risk-taking and proactiveness differs from
the predictions offered in the current study. Also, the proposed moderating
effects of industry environment on the relationships between risk-taking and
firm performance as well as the relationship between proactiveness and firm
performance are not supported by this study.
Hypotheses 11 to 16 assessed the effects of promotion and prevention focus on
firms’ levels of innovativeness, risk-taking, and proactiveness. Promotion focus
positively impacts firms’ levels of innovativeness and proactiveness, excepting
risk-taking. By contrast, prevention focus negatively impacts firms’ levels of risk-
taking and proactiveness, excepting innovativeness. In the next chapter, I discuss
the implications of these results, the potential explanations for the non-findings,
and how these results are related to and also contribute to existing literature in
regulatory focus and EO.

106
Table 5-7: Summary of results from hypothesis testing
Hypotheses Predictor Dependent variable
Predicted relationship
Support
Regulatory focus Firm performance
Hypothesis 1 Promotion focus Firm performance
+ Yes
Hypothesis 2 Prevention focus Firm performance
- Yes
Hypothesis 3 Promotion focus x Industry environment
Firm performance
Moderation Yes
Hypothesis 4 Prevention focus x Industry environment
Firm performance
Moderation No
Innovativeness, risk-taking, and proactiveness Firm performance
Hypothesis 5 Innovativeness Firm performance
Inverted U-shaped
Yes
Hypothesis 6 Risk-taking Firm performance
Inverted U-shaped
No (U-shaped)
Hypothesis 7 Proactiveness Firm performance
Inverted U-shaped
No (+ Linear)
Hypothesis 8 Innovativeness x Industry environment
Firm performance
Moderation Yes
Hypothesis 9 Risk-taking x Industry environment
Firm performance
Moderation No
Hypothesis 10 Proactiveness x Industry environment
Firm performance
Moderation No
Regulatory focus Innovativeness, risk-taking, and proactiveness
Hypothesis 11 Promotion focus Innovativeness + Yes
Hypothesis 12 Promotion focus Risk-taking + No
Hypothesis 13 Promotion focus Proactiveness + Yes
Hypothesis 14 Prevention focus Innovativeness - No
Hypothesis 15 Prevention focus Risk-taking - Yes
Hypothesis 16 Prevention focus Proactiveness - Yes
107
Chapter 6 Discussions and Conclusions
This study aimed to enhance our understanding of how CEO regulatory focus and
firms’ entrepreneurial orientation (i.e., innovativeness, risk-taking, and
proactiveness) impacts SMEs. To understand the organisational outcomes of
SMEs, the regulatory focus of CEOs is an important factor to consider. This is
because regulatory focus impacts people’s decision making (Higgins 1997, 1998).
As firms’ top decision makers, CEOs’ decisions, induced by regulatory focus,
should have an impact on firms they lead. While studies have suggested that the
regulatory focus of CEOs or entrepreneurs is associated with the performance of
small firms (Hmieleski and Baron, 2008; Wallace et al., 2010), how their links
differ between firms operating in different industry environments (i.e., high-tech
versus low-tech industries) remained unclear. Additionally, although empirical
evidence has shown that CEO regulatory focus impacts the behaviours of large
firms (Gamache et al., 2015; Greenbaum, 2015; Chen et al., 2017), little is known
about the influences of regulatory focus on the entrepreneurial behaviours of
SMEs. Therefore, the current study examined the performance effects of CEO
regulatory focus on SMEs that operate in different industry environments as well
as how CEO regulatory focus shapes the entrepreneurial behaviours of SMEs.
This study also examined EO because it has been found that EO has profound
impacts on firm performance (Rauch et al., 2009). Although a number of studies
have revealed that the individual dimensions of EO are associated with firm
performance (Hughes and Morgan, 2007; Kreiser et al., 2013), the nature of their
links remain unclear because the empirical evidence has been mixed.
Additionally, while researchers have suggested that EO is more beneficial for
firms in high-tech industries (Rauch et al., 2009), it is less clear whether the
three dimensions of EO will share similar effects when they are examined
independently. Hence, the current study examined the performance effects of the
three dimensions of EO on SMEs that operate in different industry environments.
108
6.1 Discussions and contributions
6.1.1 Regulatory focus and firm performance
The first research question was about how CEO regulatory focus impacts the
performance of SMEs and how the effects vary between SMEs in high-tech
industries and those in low-tech industries (Hypotheses 1 to 4). This study found
that CEO regulatory focus is associated with the performance of SMEs. In
particular, the empirical results indicate that CEO promotion focus positively
(Hypothesis 1) and CEO prevention focus negatively (Hypothesis 2) impact SME
performance. These results are in line with the findings of Wallace et al., (2010),
who showed that CEO promotion focus is positively, and CEO prevention focus
negatively associated with small firm performance.
Additionally, the results demonstrate that the performance effect of CEO
promotion focus differs between SMEs operating in different industry
environments. Specifically, the performance effect of CEO promotion focus is
stronger for SMEs in high-tech industries than those in low-tech industries
(Hypothesis 3). CEOs with high levels of promotion focus should induce their
firms to embrace changes and seek new opportunities (Liberman et al., 1999;
Chernev, 2004; Fuglestad et al., 2008), implying that such firms have higher
levels of flexibility. Because the high-tech industries are associated with high
rates and magnitudes of changes (Wang et al., 2015; Fainshmidt et al., 2016), the
flexibility induced by promotion focus is thus more beneficial for firms that
operate in the high-tech industries. The results from the present study are
consistent with previous empirical evidence from Hmieleski and Baron (2008),
who showed that within a dynamic environment, promotion focus has positive
effects on new venture performance, whereas in a stable environment,
promotion focus has no significant effects on new venture performance.
However, the performance effects of CEO prevention focus do not differ between
SMEs in high-tech and those in low-tech industries (Hypothesis 4). CEOs with
high levels of prevention focus should orient their firms to maintain status quo
(Liberman et al., 1999; Chernev, 2004; Fuglestad et al., 2008), which may lead
109
to rigidity and hinder firm performance. Indeed, researchers have highlighted
that “being rigid toward change (prevention focus) significantly reduces
performance” (Hmieleski and Baron 2008, p. 295). Because the high-tech
industries are more dynamic than the low-tech ones, the suggestion is that being
rigid to change might be more harmful to firms that operate in the high-tech
industries. As such, I suspected that the effects of CEO prevention focus would
be stronger for firms in high-tech industries than those in low-tech ones. The
non-findings might be partly because people can have varying combinations of
promotion and prevention focus (Lanaj et al., 2012; Markovits, 2012;
Kammerlander et al., 2015), implying that the effect of prevention focus might
be attenuated by respective CEOs’ levels of promotion focus.
While results from the full sample suggested an overall positive impact of CEO
promotion focus and overall negative impact of CEO prevention focus on SME
performance, the supplement sub-group analysis (i.e., separating firms in high-
tech and those in low-tech industries into two groups) revealed a slightly
different picture. In particular, the results suggest that for SMEs in high-tech
industries, high levels of CEO promotion focus positively impact firm
performance. This is consistent with the prediction offered in the current study.
While the relationship between CEO prevention focus and SME performance is
not significant in the sub-group analysis, the negative sign of the coefficient is
also consistent with the hypothesis, which suggests that high levels of CEO
prevention focus should negatively impact firm performance.
On the other hand, for SMEs in low-tech industries, the negative sign of the
coefficient between CEO promotion focus and firm performance is quite
surprising because it implies that high levels of CEO promotion focus may have
detrimental effects on SMEs, although their relationship is not significant. The
negative performance effect of CEO promotion focus is in contrast to prior
research findings suggesting that CEO promotion focus positively impacts small
firm performance (Wallace et al., 2010). Moreover, although the CEO prevention
focus - SME performance is not significant, the negative sign of the coefficient is
in line with the hypothesis, which suggests a negative effect of CEO prevention

110
focus on SME performance. Taken together, the results from the sub-group
analysis have two important implications. Firstly, the performance effect of CEO
promotion focus differs between firms that operate in different industry
environments. Secondly, increasing levels of promotion focus might not generate
universally positive effects on organisations, as suggested by prior studies (e.g.,
Wallace et al., 2010). As such, further research is still needed to probe the
performance effects of CEO regulatory focus on organisations.
This study also assessed how CEOs with varying combinations of promotion
focus and prevention focus impact firm performance (see the post-hoc test).
Following previous studies (Markovits, 2012; Kammerlander et al., 2015), CEOs
were categorised into four groups: high promotion and high prevention focus
(rationalists), high promotion and low prevention focus (achievers), low
promotion and high prevention focus (conservatives), and low promotion and
low prevention focus (indifferents). The results from the post-hoc test revealed
that firms that are led by CEOs with high levels of both promotion and prevention
focus achieved the best performance (rationalists group: 3.65). This is followed
by the group with low levels of both promotion and prevention focus (indifferents
group: 3.63), and then the group with high promotion and low prevention
(achievers group: 3.48). Firms that are led by CEOs with low promotion focus
and high prevention focus achieved the lowest performance (conservatives group:
3.34). Since the rationalists group achieved better performance than the
remaining three groups, such results implicitly suggest that both promotion and
prevention focus might be necessary for the success of organisations. This is
because high promotion focus might induce firms to explore new opportunities,
whereas high prevention focus might orient firms to conduct the due diligence
that can enhance their chance of success in exploiting identified opportunities
(Brockner et al., 2004).
Together, the above results generated from this study have several important
contributions to research on regulatory focus theory. Firstly, in contrast to
previous research suggesting that high levels of promotion focus have universally
positive impact on firm performance (Wallace et al., 2010), the current study
111
reveals that the positive performance effect of promotion focus is contingent on
the industry environment in which firms operate. Specifically, the results from
sub-group analysis demonstrate that the positive effects of promotion focus
might hold true only for SMEs in high-tech industries. As such, this study
extends previous works by showing that, in addition to environmental dynamism
(Hmieleski and Baron, 2008; Wallace et al., 2010), the industry environment
(e.g., high-tech versus low-tech industries) in which firms operate also interacted
with promotion focus in affecting SME performance. For example, firms in high-
tech industries might achieve better performance when they are aligned with
CEOs with high levels of promotion focus.
Secondly, in contrast to previous held views that high levels of prevention focus
only have negative impacts on firm performance (Hmieleski and Baron, 2008;
Wallace et al., 2010), the results from post-hoc tests suggest that the negative
effects of prevention focus might only occur when the respective CEOs’ levels of
promotion focus are low. In other words, high levels of prevention focus might
be beneficial for organisations when it is accompanied by high levels of
promotion focus. This also implies that to realise the positive potential of high
promotion focus, it is paramount that the respective CEOs’ prevention focus is
high. The current study represents one of the first works to provide empirical
evidence supporting the suggestion that “both promotion and prevention foci are
necessary for entrepreneurial success” (Brockner et al., 2004, p. 204).
Thirdly, through examining how SME performance differs between firms that
are led by CEOs with varying combinations of promotion and prevention, the
current study addressed the call from Lanaj et al., (2012) to consider the potential
interplay between promotion and prevention focus. Indeed, the results from the
current study demonstrated that examining the performance effects of
promotion and prevention focus separately might not reveal their real impacts
on SMEs. For example, the regression results suggested that promotion focus
positively and prevention focus negatively influences firm performance.
Nevertheless, the post-hoc test uncovered that firms that are led by CEOs with
high levels of promotion and prevention focus achieved the best performance.

112
Accordingly, future studies that examine the effects of regulatory focus are
encouraged to consider how promotion and prevention focus interplay in
affecting firm outcomes rather than examining them separately.
6.1.2 Entrepreneurial orientation and firm performance
The second research question was about how SMEs’ levels of innovativeness,
risk-taking, and proactiveness affect firm performance and how the effects differ
between SMEs in high-tech industries and those in low-tech ones (Hypotheses 5
to 10). A number of empirical studies have shown an inverted U-shaped
relationship between the unidimensional EO and firm performance (Tang et al.,
2008; Su et al., 2011; Wales et al., 2013c), suggesting that moderate levels of EO
will lead to better performance. Because the unidimensional EO represents the
shared variance among innovativeness, risk-taking, and proactiveness, I thus
suspected that when the three dimensions of EO are examined separately, they
may share a similar inverted U-shaped relationship with SME performance. The
results of this study, however, demonstrate that each EO dimension has unique
effects on SME performance.
As predicted (Hypothesis 5), the empirical results indicate that there is an
inverted U-shaped relationship between innovativeness and firm performance.
That is, that up to a certain point increasing levels of innovativeness can enhance
firm performance, but that beyond that point further increases in innovativeness
are associated with diminishing returns. This result suggests that SMEs are more
likely to obtain better performance when their innovativeness is at moderate
levels than at either high or low levels. In contrast to the hypothesised inverted
U-shaped relationship between risk-taking and firm performance (Hypothesis 6),
the findings revealed a U-shaped relationship. It appears that when shifting from
low to moderate levels of risk-taking, firm performance decreases slightly; and
that it starts to increase again when shifting from moderate to high levels of risk-
taking. Additionally, the empirical results displayed a positive linear relationship
between proactiveness and firm performance rather than the proposed inverted
U-shaped relationship (Hypothesis 7). Together, the results indicate that the
three dimensions of EO have non-uniform relationships with firm performance.

113
Without assessing innovativeness, risk-taking, and proactiveness independently,
their unique effects are unlikely to be uncovered.
While the proposed inverted U-shaped relationship between risk-taking and firm
performance is not supported in this study, similar non-findings have been
observed in prior research. Specifically, Kreiser et al., (2013) proposed an
inverted U-shaped relationship between risk-taking and SMEs’ perceived sales
growth. However, their results revealed that risk-taking exhibited a negative U-
shaped relationship with the perceived sales growth. As Kreiser et al., (2013, p.
287) pointed out, “risk-taking behaviors frequently do not represent a
worthwhile endeavour for smaller firms; rather, SMEs exhibiting very low levels
of risk-taking may be able to enjoy high levels of performance”. Likewise, while
the proposed inverted U-shaped relationship between proactiveness and SME
performance is not supported, the linear result is consistent with those found in
Hughes and Morgan (2007), who showed that within young High-tech firms,
proactiveness displayed a positive linear relationship with firm performance. I
proposed an inverted U-shaped relationship between proactiveness and SME
performance because although being highly proactive allows firms to capitalise
on new product opportunities, potential costs are associated with such efforts.
The positive linear relationship identified in this study implies that the potential
benefits and advantages that might be generated through being proactive should
outweigh the potential costs involved.
Furthermore, the empirical results demonstrated that the performance effects of
innovativeness, risk-taking, and proactiveness differ between SMEs in high-tech
industries and those in low-tech industries. This finding is consistent with
Lumpkin and Dess’s (1996, p. 140) assertion that the importance of EO
dimensions “may vary independently in a given context”. In particular, this study
found that, as expected, innovativeness has stronger performance effects on
SMEs in low-tech than those in high-tech industries (Hypothesis 8). Prior
research has shown that the levels of EO are higher in small firms in high-tech
industries than those in low-tech ones (Covin et al., 1990), implicitly suggesting
that innovativeness, one dimension of EO, should also be higher for firms in

114
high-tech industries. As such, innovativeness is less of a differentiator for SMEs
in high-tech industries (Linton and Kask, 2017) because such firms are already
associated with high levels of innovativeness. In other words, SMEs in high-tech
industries are less likely to reap significant benefits from increasing levels of
innovativeness. By contrast, the opposite is true for firms in low-tech industries,
which is often associated with low level of innovativeness. Accordingly,
increasing levels of innovativeness will have more pronounced performance
effects on such high-tech firms.
While industry environment does not moderate the risk-taking and SME
performance relationship in the full sample (Hypothesis 9), the results from sub-
group analysis revealed that, as predicted, risk-taking has stronger performance
effects for firms within high-tech industries than those in low-tech industries.
Hence, further study is still required to examine whether the performance effects
of risk-taking vary between firms in different industry environments.
Furthermore, the results suggest that proactiveness has stronger performance
effects on SMEs in high-tech industries than those in low-tech ones (Hypothesis
10). Since the high-tech industries are associated with high rates of market and
technological changes (Moriarty and Kosnik, 1989; Qian and Li, 2003;
Szymanski et al., 2007), firms’ existing products should become obsolete more
quickly in such industries. The opposite is true for firms in low-tech industries,
which are more stable. Accordingly, being highly proactive is more important for
SMEs in high-tech industries than those in low-tech ones. As a result, increasing
levels of proactiveness have more pronounced effects for SMEs in high-tech than
those in low-tech industries.
Together, the empirical findings generated from this study above have three
important contributions to EO research. Firstly, this study extends prior work by
demonstrating that innovativeness (inverted U-shaped), risk-taking (U-shaped),
and proactiveness (positive linear) have unique performance effects on SMEs. As
such, the empirical results demonstrate a non-uniform relationship between the
dimensions of EO and SME performance. These findings are in contrast with to
those found in prior studies which suggest a uniform linear relationship between
115
EO dimensions and firm performance (Swierczek and Ha, 2003; Hughes and
Morgan, 2007) or a uniform curvilinear relationship between them (Kreiser et
al., 2013).
Secondly, this study uncovers that the performance effects of innovativeness,
risk-taking, and proactiveness differ between SMEs in high-tech and those in
low-tech industries. While researchers have suggested that EO “pays off more”
in high-tech than nonhigh-tech industries (Rauch et al., 2009), this study
provides empirical evidence showing that this might not hold true when
innovativeness, risk-taking, and proactiveness are examined independently.
Specifically, this study revealed that innovativeness has stronger performance
effects for SMEs in low-tech industries. By contrast, proactiveness has stronger
performance effects for SMEs in high-tech industries. The results from sub-
group analysis also provide some support that the performance effects of risk-
taking are more salient for SMEs in high-tech industries, although significant
findings were not observed in the full sample. By examining the moderating
effect of industry environment on the relationships between EO dimensions and
SME performance, this study addresses the call by Rauch et al. (2009) to
investigate how the performance effects of EO are contingent on the industry
environment in which firms operate.
Thirdly, this study contributes to EO research by demonstrating that the
performance implications of EO vary significantly depending on whether EO is
conceptualised as a unidimensional or a multidimensional construct. This study
examined EO as a multidimensional construct and found that each dimension of
EO has unique effects on SME performance. Also, the significance of each
dimension is dependent on the industry environment in which firms operate.
Results from the post-hoc analyses revealed that the unidimensional EO is
positively related to SME performance. Also, it is more beneficial for SMEs in
high-tech industries. Accordingly, without examining innovativeness, risk-
taking, and proactiveness independently, insights about their unique
performance effects and how they differ between firms in different industry
environments cannot be uncovered. As Dai et al.,, (2014) noted, when the

116
individual dimensions of EO are combined, their independent influences are
likely to be distorted or concealed.
6.1.3 Regulatory focus and entrepreneurial orientation
The final research question was about how CEO regulatory focus affects SMEs’
levels of innovativeness, risk-taking, and proactiveness. This study found that
CEO regulatory focus has substantial effects on the three dimensions of EO. The
empirical results are largely in line with the upper echelons theory, which
suggests that CEO characteristics significantly influence the outcomes of
organisations (Hambrick, 2007; Hambrick and Mason, 1984). Such findings are
not surprising given that CEOs are the primary decision makers within their
organisations, and that CEOs’ decisions induced by regulatory focus should have
an impact on organisations they lead (Finkelstein et al., 2009). For example,
CEOs’ decisions and motivations might manifest themselves through the
entrepreneurial activities undertaken by the firms they lead.
This study revealed that CEO promotion focus positively impacts firms’ levels of
innovativeness (Hypothesis 11) and proactiveness (Hypothesis 13). The findings
are largely in line with the regulatory focus theory that suggests that promotion
focused people are more willing to consider alternatives and initiate changes
(Brockner et al., 2004; Liberman et al., 1999), which tend to be the prerequisite
for firms to innovate and be proactive (Musteen et al., 2010). These findings
extend previous studies that have shown that promotion focus is positively
associated with the innovativeness of opportunities identified by entrepreneurs
(Tumasjan and Braun, 2012). In particular, the results uncover that high levels
of CEO promotion focus induce firms to support new ideas and experimentation
that are the essence of innovation. Additionally, the findings go beyond prior
research by demonstrating that for firms that are led by CEOs with high levels of
promotion focus, in addition to introducing more new products (Greenbaum,
2015), such firms also have higher tendencies to introduce products ahead of the
competition as indicated by higher levels of proactiveness.

117
Contrary to expectations, CEO promotion focus did not significantly impact
firms’ levels of risk-taking (Hypothesis 12). This is surprising given that prior
studies have shown that promotion focused people are more risk tolerant in their
financial investment decisions under experimental settings (Florack and
Hartmann, 2007); and that firms that are led by CEOs with high levels of
promotion focus engage in more exploration activities that involve higher risks
(Kammerlander et al., 2015). One potential explanation for the non-finding
might be due to the resource constrains faced by SMEs. Specifically, risk-taking
requires firms to venture into the unknown and commit significant resources to
initiatives with uncertain outcomes (Lumpkin and Dess, 1996; Wiklund and
Shepherd, 2003; Rauch et al., 2009).
Indeed, researchers have highlighted that firms that have high levels of excess
resources can afford to engage in projects that involve more risk as the slack
resources can buffer potential failure in their risk-taking efforts (Wiseman and
Bromiley, 1996). Rosenbusch et al., (2013, p. 649) concur that “firms are more
likely to take risks if they possess the resources to absorb potential losses”.
Empirical evidence has shown that firms’ level of excess resources is positively
associated with firms’ risk-taking (Singh, 1986). Among SMEs, however, it is
likely that few of them will have excess resources because they tend to be resource
short. Prior research has highlighted that “resource constraints often lead to
SMEs to be more risk-averse and less willing to invest in new technologies than
larger firms” (OECD, 2017, p. 8). As a result, although SMEs that are led by CEOs
with high levels of promotion focus are more risk tolerant, it is possible that
resource constraints can hinder their capabilities to commit resources to risk-
taking. In other words, the lack of resources might attenuate the effect of CEO
promotion focus on SMEs’ levels of risk-taking.
This study also revealed that CEO prevention focus negatively impacts firms’
levels of risk-taking (Hypothesis 15) and proactiveness (Hypothesis 16). The
empirical findings are consistent with regulatory focus theory that suggests that
a prevention focus is associated with risk-aversion and a tendency to retain
stability (Liberman et al., 1999; Florack and Hartmann, 2007; Hamstra et al.,

118
2011), because the underlying need for prevention focused people is to ensure
safety (Higgins, 1997, 1998). The findings demonstrate that firms that are led by
CEOs with high levels of prevention focus are less likely to engage in risk-taking.
As such, the results extend those by Kammerlander et al., (2015), who has shown
that CEO prevention focus negatively influences exploration activities which
imply risk-taking, because the exploration process entails uncertain outcomes
(March, 1991). Moreover, the results complement prior studies that have found
that CEO prevention focus negatively influences firms’ numbers of new product
introduction (Greenbaum, 2015). In particular, the findings show that high levels
of CEOs’ prevention focus induce firms to be less proactive in introducing new
products ahead of the competition. Taken together, the findings are not
surprising given that committing resources to risky initiatives and acting in
anticipation of future market demands all entail significant uncertainties, as such
efforts may fail to yield positive outcomes that, in turn, threaten prevention
focused people’s needs for safety.
The non-significance of the hypothesised relationship between CEO prevention
focus and firms’ levels of innovativeness (Hypothesis 14) is also interesting. I
proposed that CEO prevention focus would negatively impact firms’ levels of
innovativeness based on the consideration that prevention focused people prefer
maintaining status quo (Brockner et al., 2004; Liberman et al., 1999). This is
likely to hinder innovation because innovation requires change and
experimenting with new alternatives (Rosenbusch et al., 2011). While this study
did not find a significant effect on innovativeness, the negative sign in the
regression result is consistent with the hypothesis. The non-finding might by
explained as follows. Researchers have highlighted that in the situation of
experiencing loss, prevention focused people might deviate from their preferred
practice to regain adequate status (Scholer et al., 2010; Collins, 2016). Following
the same line, it is also possible that changes in the market environment (e.g.,
threats from competitors) might trigger prevention focused CEOs to deviate from
their preferred stability and facilitate innovation. For example, in response to
competitors’ new market offerings, firms that are led by CEOs with high levels of
prevention focus might shift their focus from maintaining status quo to

119
supporting innovation related activities to remain competitive in the
marketplace.
This study also examined how CEOs with different combinations of promotion
and prevention focus impact firms’ entrepreneurial activities (see the post-hoc
tests). In line with the assumptions, this study found that among CEOs with
strong promotion focus, firms that are led by achievers (low prevention focus)
exhibit higher levels of innovativeness, risk-taking, and proactiveness than firms
led by rationalists (high prevention focus). This might be because the rationalists
tend to face the dilemma of balancing their activities to ensure that both
advancement and safety needs are satisfied. To illustrate, CEOs with high levels
of promotion focus should induce firms to pursue entrepreneurial activities as
the potential gains can help to satisfy their needs for advancement. At the same
time, the accompanying high levels of prevention focus should orient their firms
to be cautious in their entrepreneurial activities to ensure that CEOs’ needs for
safety are not endangered (Brockner et al., 2004). As a result, the vigilant
tendency associated with high levels of prevention focus might safeguard firms
from pursuing excessive entrepreneurial activities induced by high levels of
promotion focus. This explains why firms that are led by rationalists pursue
lower levels of entrepreneurial activities than firms led by achievers.
Together, the above findings offer important contributions to research on
regulatory focus and EO. Firstly, this study extends research on regulatory focus
theory by showing that, in addition to influencing SMEs’ exploration and
exploitation activities (Kammerlander et al., 2015), CEO regulatory focus also
impacts SMEs’ entrepreneurial behaviours. This extension is important because
while studies have shown that CEO regulatory focus impacts the behaviours of
large firms (Gamache et al., 2015; Greenbaum, 2015), limited attention has been
devoted to the SME context. This study reveals that CEO regulatory focus shapes
SMEs’ levels of innovativeness, risk-taking, and proactiveness. As such, it
provides empirical evidence demonstrating the significance of regulatory focus
for understanding the entrepreneurial behaviours of SMEs. Hence, this study
120
answers calls for more research to explore how CEO regulatory focus impacts
different types of firm strategic behaviours (Gamache et al., 2015).
Secondly, this study contributes to research on EO by uncovering the links
between CEO regulatory focus and the three dimensions of EO. Researchers have
noted that “the EO phenomenon and linkages that exist between this
phenomenon and its antecedents and consequences are often poorly explained
using ‘off-the-shelf’ theories” (Covin and Lumpkin, 2011, p. 859). Additionally,
Rauch et al., (2009, p. 779) assert that “it may be more appropriate to study
antecedences and consequences of EO at the level of the dimensions of EO”. By
drawing insights from regulatory focus theory and examining the impact of CEO
regulatory focus on firms’ levels of innovativeness, risk-taking, and proactiveness,
this study addresses calls to better understand how CEO factors influence EO
(Mousa and Wales, 2012; Pittino et al., 2017). Because the different
entrepreneurial behaviours are associated with firm performance (Rauch et al.,
2009; Gupta and Wales, 2017), it is imperative to understand the potential
antecedents that might shape firms’ entrepreneurial behaviours. Nevertheless,
further study is still needed to understand the link between promotion focus and
firms’ levels of risk-taking as well as the link between prevention focus and firms’
levels of innovativeness.
Additionally, this study contributes to research in entrepreneurship by showing
that the effects of CEO regulatory focus and the dimensions of EO are context
dependent. That is, their performance effects are dependent on the industry
context in which firms operate. For example, firms that operate in high-tech
industries tend to face different types of challenges than firms that operate in the
low-tech industries, implying that firms operating in different industry contexts
should have distinct needs. As a result, the significance of CEO regulatory focus
and the dimensions of EO should vary between firms that operate in different
industry contexts. Prior studies have highlighted the importance of contexts (e.g.,
including business, social, spatial, and institutional context) for our
understanding of entrepreneurship phenomenon (Welter, 2011; McKeever et al.,
2015).
121
As Welter (2011, p. 165) noted, the contexts “provide individuals with
opportunities and set boundaries for their actions. Context can be an asset and a
liability for the nature and extent of entrepreneurship, but entrepreneurship can
also impact contexts”. This study provides empirical evidence demonstrating
that both the performance effects of CEO regulatory focus and EO dimensions
are contingent on the industry context (i.e., high-tech industries versus low-tech
industries) in which firms operate. The results indicate that the nature and/or
magnitude of the performance effects of CEO regulatory focus and EO
dimensions differ significantly between firms operating in high-tech industries
and those in low-tech one.
Finally, by assessing the performance effects of CEO regulatory focus and the EO
dimensions, as well as the potential links between them, this study also offers
contributions to the entrepreneurship literature. While CEO regulatory focus
and the three dimensions of EO represent constructs at different levels, both of
them might result in variance in SME performance. The results indicated that
innovativeness, risk-taking, and proactiveness together account for 14% of the
variance in SME performance, whereas promotion and prevention focus account
for 6% of the variance in similar outcomes. As such, this study provides empirical
evidence showing that firm-level entrepreneurial behaviours in terms of
innovativeness, risk-taking, and proactiveness are more robust predictors in
explaining the variance in SME performance than individual-level CEO
characteristic in terms of promotion and prevention focus.
The lower explanatory power associated with regulatory focus might be because
individual characteristics often influence organisational outcomes through
influencing people’s interpretations of the situations they face (Hambrick, 2007;
Hambrick and Mason, 1984). For example, through influencing people’s decision
making, regulatory focus can thus impact activities at firm-level. As such, the
performance effects of regulatory focus are realised through other underlying
mechanisms that are induced by regulatory focus. The empirical results also
revealed that CEO regulatory focus is related to the three EO dimensions. Hence,
this study provides empirical evidence showing how individual difference in CEO

122
characteristics might be useful in explaining the variance in firms’ levels of
entrepreneurial behaviours.
123
6.2 Managerial implications
The findings from this study have several practical implications for the top
managers of SMEs. Firstly, this study reveals that the positive performance
effects of promotion focus are context dependent (e.g., whether firms are in high-
tech or low-tech industries). To improve firm-level outcomes, it is imperative for
firms to align CEO promotion focus with the situations firms face. For example,
high-levels of promotion focus positively influence the performance of SMEs in
high-tech industries, but might have negative impacts on the performance of
SMEs in low-tech industries. As such, promotion focus is beneficial only when it
fits with the industry environment firms operate within (i.e., high promotion
focus in high-tech industries). The finding echoes Hmieleski and Baron’s (2008,
p. 285) suggestion that “a promotion focus will be the most effective self-
regulatory mode for entrepreneurs leading their firms within dynamic industry
environments, which are characterized by uncertainty”. Also, it is important for
executives to recognise that promotion focus might have detrimental effects on
organisations when it misfits with the industry environment (i.e., having overly
high promotion focus in low-tech industries).
Secondly, this study uncovers the fact that firms that are led by CEOs with high
levels of both promotion and prevention focus achieved the best performance,
suggesting the importance of balancing promotion and prevention focus.
Because people’s regulatory focus is relatively stable (Higgins et al., 2001;
Hmieleski and Baron, 2008), it might be unrealistic to ask people to alter such
characteristics. However, promotion focused CEOs might intentionally involve
prevention focused people in decision making processes to provide a balance for
their tendencies to explore and engage in new opportunities that might be risky.
As Brockner et al., (2004) highlighted, prevention focus might serve as “due
diligence” in the entrepreneurial process. Similarly, prevention focused CEOs
might surround themselves with promotion focused people to provide a balance
for their tendencies to maintain a status quo that might undermine a firm’s
chances to capitalise on new opportunities. For example, the results indicated
that firms that are led by prevention focused CEOs exhibited lower levels of

124
proactiveness. Involving promotion focused people in the decision making
process might help to counter such issue because promotion focus is positively
associated with firms’ levels of proactiveness.
Thirdly, the results suggest that it is not necessary or beneficial for SMEs to
exhibit high levels in all three dimensions of EO to achieve better performance.
For example, the results suggest that up to a certain point, increasing levels of
innovativeness will generate benefits for SMEs but beyond the point, further
increases will likely have detrimental effects on SME performance. It appears
that SMEs that are moderate in innovativeness will register better performance.
By contrast, the results suggest that SMEs with moderate levels of risk-taking
will experience low levels of performance. As Kreiser et al., (2013) pointed out,
low levels of risk-taking are more desirable for SMEs to achieve better
performance. Furthermore, the results suggest that proactiveness has
predominated positive effects on SME performance, suggesting that being
proactive to introduce products ahead of the competition might provide firms
with competitive advantages and contribute to better performance.
Finally, the significance of innovativeness and proactiveness differ between
SMEs in high-tech and those in low-tech industries. To enhance firm
performance, SMEs are suggested to manage their levels of entrepreneurial
activities to fit the industry environment in which they are operating. For
example, innovativeness has stronger effects for SMEs operating in low-tech
industries, suggesting that such firms can reap more benefits from increasing
levels of innovativeness. However, when the levels of innovativeness are high,
the potential detrimental effects will also be stronger for them. On the other hand,
proactiveness has a stronger effect on SMEs operating in high-tech areas. As such,
firms that operate in high-tech industries, which are often associated with high
rates and magnitudes of changes, are encouraged to be proactive in seeking and
undertaking new product opportunities. Results from sub-group analysis also
provide some evidence showing that risk-taking has a higher impact on SMEs in
high-tech industries. However, this link remains inconclusive as significant
results were not observed in the full sample.
125
6.3 Limitations and directions for future research
This study comes along with limitations which present opportunities for future
research. This study examined the impacts of CEO regulatory focus on SMEs.
The results found here might not hold true in large firms because they are often
managed by management teams (Finkelstein et al., 2009). For example, firms’
decisions to engage in entrepreneurial activities might be influenced by other
people within the top management team rather than by CEOs alone. Accordingly,
it is unclear whether CEO regulatory focus will have a similar influence on the
innovativeness, risk-taking, and proactiveness of large firms. Future
investigations targeting large firms could examine the influence of top
management teams rather than focusing on a single CEO. For example, a recent
study has shown that the regulatory focus of CEOs and CFOs can interact and
influence firms’ growth-oriented initiatives (Chen et al., 2017). In the same vein,
it would be interesting to examine how the composition of top management
teams that consist of both promotion and prevention focused people might
influence firms’ strategic behaviours.
Since this study uses cross-sectional data, the relationships identified do not
necessarily establish causality. In other words, the potential issue of reverse
causality cannot be ruled out. For example, one may argue that it is the good
performance that drives the three dimensions of EO rather than the opposite.
That is, good firm performance might provide resources for firms to be proactive
and to undertake innovative and risky initiatives. As such, future research
exploring the consequences of the three dimensions of EO are encouraged to
adopt a longitudinal design to better gauge the implications of the three
dimensions of EO on firm performance. While the subjective performance data
reported from CEOs might be prone to reporting bias, it is unlikely to undermine
the results from this study because prior research has shown that subjective
performance is highly correlated with the objective measure (Dess and Robinson,
1984). As Gupta and Wales (2017, p. 59) pointed out, “the majority of EO–
performance findings are based on subjective measurement relative to
competitors” (Gupta and Wales, 2017, p. 59).

126
Additionally, this study employed the Regulatory Focus Questionnaire (RFQ)
scale to measure CEO regulatory focus. Similar to previous empirical work (e.g.,
Kammerlander et al., 2015), I found low internal reliability on the measure of
promotion focus. In particular, two out of the six items (i.e., Items 1 and 11) were
removed to achieve satisfactory construct reliability. While the Cronbach’s Alpha
value of 0.64 is acceptable, it is still lower than the recommended value of 0.7
(Hair et al., 2014). This issue might merit further examination. Researchers are
encouraged to further assess and enhance the original RFQ scale to develop
higher levels of reliability from it.
Finally, while research in regulatory focus theory suggests that promotion focus
is associated with a risk-taking tendency, this study did not find a significant
impact of CEO promotion focus on firms’ levels of risk-taking. Similarly,
although prevention focus is known to be associated with a tendency to maintain
status quo, the proposed negative effects of CEO prevention focus on firms’ level
of innovativeness was not supported. These non-findings raise an important
question about whether the effects of CEOs’ characteristics on firm-level
outcomes are dependent on other organisational or environmental factors. For
example, it is possible that the absence of slack resources might hinder firms’
risk-taking, suggesting that the risk-taking tendencies associated with promotion
focus might not be materialised. Similarly, changes in the market environment
or threats from competitors might trigger prevention focused people to deviate
from their preferred status quo and support innovative effects. Accordingly,
further studies are required to investigate the potential boundary conditions in
which CEOs characteristics can shape firms’ strategic behaviours.

127
6.4 Conclusion
To conclude, this study demonstrates that while regulatory focus and EO refer to
different natures of phenomenon and represent constructs at different levels (i.e.,
individual-level motivational characteristic versus firm-level entrepreneurial
behaviour), both factors have profound impacts on SMEs. In particular, this
study found that CEO regulatory focus is related to the performance of SMEs.
Additionally, CEO regulatory focus has a substantial influence on SMEs’ levels of
innovativeness, risk-taking, and proactiveness. As such, this study provides
empirical evidence demonstrating the importance of regulatory focus in
understanding the organisational outcomes of SMEs. Furthermore, this study
reveals that each dimension of EO has unique performance effects on SMEs and
that their effects, except risk-taking, vary between SMEs in high-tech industries
and those in low-tech industries. Since the EO dimensions do not generate
universally positive impacts, and since their salience depends on the industry
environment in which firms operate, to enhance firm-level outcomes, it is
paramount for SMEs to match their entrepreneurial behaviours with the
industry environment they operate within. Together, this study found that
individual differences in regulatory focus and firms’ entrepreneurial behaviours
are useful predictors in explaining the variance of organisational outcomes.
Researchers are encouraged to explore the effects of regulatory focus and EO on
other strategic behaviours or outcomes of SMEs.

128
References:
Aaker, D.A., Mascarenhas, B., 1984. The need for strategic flexibility. The Journal of
Business Strategy; Cambridge 5, 74–81.
Ahmadi, S., Khanagha, S., Berchicci, L., Jansen, J.J.P., 2017. Are managers motivated
to explore in the face of a new technological change? The role of regulatory focus, fit,
and complexity of decision-making. Journal of Management Studies 54, 209–237.
Aiken, L.S., West, S.G., Reno, R.R., 1991. Multiple regression: testing and interpreting
interactions. Sage Publications, Newbury Park, Calif.
Aldrich, H., Auster, E.R., 1986. Even dwarfs started small: Liabilities of age and size
and their strategic implications. In Cummings, L.L. and Staw, B.M., Eds., in: Research
in Organizational Behavior. JAI Press, Greenwich, pp. 165–198.
Alvarez, S.A., 2007. Entrepreneurial rents and the theory of the firm. Journal of
Business Venturing, Current Research - Traditional Questions 22, 427–442.
Anderson, B.S., Covin, J.G., Slevin, D.P., 2009. Understanding the relationship
between entrepreneurial orientation and strategic learning capability: an empirical
investigation. Strategic Entrepreneurship Journal 3, 218–240.
Anderson, B.S., Kreiser, P.M., Kuratko, D.F., Hornsby, J.S., Eshima, Y., 2015.
Reconceptualizing entrepreneurial orientation. Strategic Management Journal. 36,
1579–1596.
Antonakis, J., Bendahan, S., Jacquart, P., Lalive, R., 2010. On making causal claims: A
review and recommendations. The Leadership Quarterly 21, 1086–1120.
Armstrong, J.S., Overton, T.S., 1977. Estimating nonresponse bias in mail surveys.
Journal of Marketing Research 14, 396–402.
Atuahene-Gima, K., Murray, J.Y., 2007. Exploratory and exploitative learning in new
product development: A social capital perspective on new technology ventures in
China. Journal of International Marketing 15, 1–29.

129
Avlonitis, G.J., Salavou, H.E., 2007. Entrepreneurial orientation of SMEs, product
innovativeness, and performance. Journal of Business Research 60, 566–575.
Barney, J., 1991. Firm resources and sustained competitive advantage. Journal of
Management 17, 99.
Baron, R.A., Tang, J., 2011. The role of entrepreneurs in firm-level innovation: Joint
effects of positive affect, creativity, and environmental dynamism. Journal of Business
Venturing 26, 49–60.
Basso, O., Fayolle, A., Bouchard, V., 2009. Entrepreneurial orientation: The making of
a concept. The International Journal of Entrepreneurship and Innovation 10, 313–321.
Begley, T.M., Boyd, D.P., 1987. Psychological characteristics associated with
performence in entrepreneurial firms and smaller businesses. Journal of Business
Venturing 2, 79–93.
Bierly, P.E., Daly, P.S., 2007. Alternative knowledge strategies, competitive
environment, and organizational performance in small manufacturing firms.
Entrepreneurship: Theory & Practice 31, 493–516.
BIS, 2015. Small Business Survey 2014: SME employers (No. 214). Department for
Business, Innovation & Skills (BIS).
Blumentritt, T., Kickul, J., Gundry, L.K., 2005. Building an inclusive entrepreneurial
culture: Effects of employee involvement on venture performance and innovation. The
International Journal of Entrepreneurship and Innovation 6, 77–84.
Bolland, E.J., Hofer, C.W., 1998. Future firms: how America’s high technology
companies work. Oxford University Press, New York.
Bono, J.E., McNamara, G., 2011. From the editors: Publishing in AMJ--Part 2:
Research Design. Academy of Management Journal 657–660.
Brace, I., 2004. Questionnaire design: how to plan, structure, and write survey
material for effective market research, Market research in practice series. Kogan Page,
London ; Sterling, VA.

130
Brettel, M., Rottenberger, J.D., 2013. Examining the link between entrepreneurial
orientation and learning processes in small and medium-sized enterprises. Journal of
Small Business Management 51, 471–490.
Brockner, J., Higgins, E.T., Low, M.B., 2004. Regulatory focus theory and the
entrepreneurial process. Journal of Business Venturing 19, 203–220.
Bryant, P., 2009. Self-regulation and moral awareness among entrepreneurs. Journal
of Business Venturing, Special Issue Ethics and Entrepreneurship 24, 505–518.
Bryant, P., Dunford, R., 2008. The influence of regulatory focus on risky decision-
making. Applied Psychology 57, 335–359.
Busenbark, J.R., Krause, R., Boivie, S., Graffin, S.D., 2016. Toward a configurational
perspective on the CEO: A review and synthesis of the management literature. Journal
of Management 42, 234–268.
Cao, Q., Gedajlovic, E., Zhang, H., 2009. Unpacking organizational ambidexterity:
Dimensions, contingencies, and synergistic effects. Organization Science 20, 781–796.
Chandler, G.N., Hanks, S.H., 1993. Measuring the performance of emerging
businesses: A validation study. Journal of Business Venturing 8, 391–408.
Chen, G., Meyer-Doyle, P., Shi, W., 2017. How CEO and CFO regulatory focus interact
to shape the firm’s corporate strategy (SSRN Scholarly Paper No. ID 2891263). Social
Science Research Network, Rochester, NY.
Chen, Y., Tang, G., Jin, J., Xie, Q., Li, J., 2014. CEOs’ transformational leadership and
product innovation performance: The roles of corporate entrepreneurship and
technology orientation. Journal of Product Innovation Management 31, 2–17.
Cheng, C.-F., Chang, M.-L., Li, C.-S., 2013. Configural paths to successful product
innovation. Journal of Business Research 66, 2561–2573.
Chernev, A., 2004. Goal orientation and consumer preference for the status quo.
Journal of Consumer Research 31, 557–565.

131
Churchill, G.A., Iacobucci, D., 2006. Marketing research: methodological foundations.
Dryden Press New York.
Collins, C., 2016. Regulatory focus in the context of work: The social impact of
promotion tactics. PhD thesis, The University of Chicago.
Collis, D.J., 1994. Research note: How valuable are organizational capabilities?
Strategic Management Journal 15, 143–152.
Covin, J.G., Lumpkin, G. t., 2011. Entrepreneurial orientation theory and research:
Reflections on a needed construct. Entrepreneurship: Theory & Practice 35, 855–872.
Covin, J.G., Slevin, D.P., 1991. A conceptual model of entrepreneurship as firm
behavior. Entrepreneurship: Theory & Practice 16, 7–25.
Covin, J.G., Slevin, D.P., 1989. Strategic management of small firms in hostile and
benign environments. Strategic Management Journal 10, 75–87.
Covin, J.G., Slevin, D.P., Covin, T.J., 1990. Content and performance of growth-
seeking strategies: A comparison of small firms in high- and low technology industries.
Journal of Business Venturing 5, 391–412.
Covin, J.G., Wales, W.J., 2012. The measurement of entrepreneurial orientation.
Entrepreneurship: Theory & Practice 36, 677–702.
Crant, J.M., 2000. Proactive behavior in organizations. Journal of Management 26,
435–462.
Creswell, J.W., 2009. Research design: qualitative, quantitative, and mixed methods
approaches, 3rd ed. Sage Publications, Thousand Oaks, Calif.
Crowe, E., Higgins, E.T., 1997. Regulatory focus and strategic inclinations: Promotion
and prevention in decision-making. Organizational Behavior and Human Decision
Processes 69, 117–132.
Dada, O. (Lola), Fogg, H., 2016. Organizational learning, entrepreneurial orientation,
and the role of university engagement in SMEs. International Small Business Journal
34, 86–104.

132
Dai, L., Maksimov, V., Gilbert, B.A., Fernhaber, S.A., 2014. Entrepreneurial orientation
and international scope: The differential roles of innovativeness, proactiveness, and
risk-taking. Journal of Business Venturing 29, 511–524.
Damanpour, F., Schneider, M., 2006. Phases of the adoption of innovation in
organizations: effects of environment, organization and top managers. British Journal
of Management 17, 215–236.
Department for Business, Energy & Industrial Strategy, 2016. Business population
estimates for the UK and regions 2016. Sheffield: Department for Business, Energy &
Industrial Strategy.
Dess, G.G., Ireland, R.D., Zahra, S.A., Floyd, S.W., Janney, J.J., Lane, P.J., 2003.
Emerging issues in corporate entrepreneurship. Journal of Management,
Entrepreneurship: Past Accomplishments and Future Challenges 29, 351–378.
Dess, G.G., Robinson, R.B., 1984. Measuring organizational performance in the
absence of objective measures: The case of the privately-held firm and conglomerate
business unit. Strategic Management Journal 5, 265–273.
Easterby-Smith, M., Thorpe, R., Jackson, P., 2012. Management research, 4th ed.
SAGE, Los Angeles ; London.
Edmond, P., Wiklund, J., 2010. The historic roots of entrepreneurial orientation
research. [ed] Landström, H. & Lohrke, F., in: Historical Foundations of
Entrepreneurship Research. Edward Elgar, Cheltenham, pp. 142–160.
Fainshmidt, S., Pezeshkan, A., Lance Frazier, M., Nair, A., Markowski, E., 2016.
Dynamic capabilities and organizational performance: A meta-analytic evaluation and
extension. Journal of Management Studies 53, 1348–1380.
Fayolle, A., Basso, O., Bouchard, V., 2010. Three levels of culture and firms’
entrepreneurial orientation: A research agenda. Entrepreneurship & Regional
Development 22, 707–730.
Finkelstein, S., Hambrick, D.C., 1990a. Top-management-team tenure and
organizational outcomes: The moderating role of managerial discretion.
Administrative Science Quarterly 35, 484–503.

133
Finkelstein, S., Hambrick, D.C., 1990b. Top-management-team tenure and
organizational outcomes: The moderating role of managerial discretion.
Administrative Science Quarterly 35, 484–503.
Finkelstein, S., Hambrick, D.C., Cannella, A.A., 2009. Strategic leadership: theory and
research on executives, top management teams, and boards, Strategic management
series. Oxford University Press, New York.
Florack, A., Hartmann, J., 2007. Regulatory focus and investment decisions in small
groups. Journal of Experimental Social Psychology 43, 626–632.
Förster, J., Higgins, E.T., Bianco, A.T., 2003. Speed/accuracy decisions in task
performance: Built-in trade-off or separate strategic concerns? Organizational
Behavior and Human Decision Processes 90, 148–164.
Frishammar, J., Hörte, S.Å., 2007. The role of market orientation and entrepreneurial
orientation for new product development performance in manufacturing firms.
Technology Analysis & Strategic Management 19, 765–788.
Fuglestad, P.T., Rothman, A.J., Jeffery, R.W., 2008. Getting there and hanging on: The
effect of regulatory focus on performance in smoking and weight loss interventions.
Health Psychology, Tobacco and Health Psychology 27, S260–S270.
Gamache, D.L., Mcnamara, G., Mannor, M.J., Johnson, R.E., 2015. Motivated to
acquire? The impact of CEO regulatory focus on firm acquisitions. Academy of
Management Journal 58, 1261–1282.
Gartner, W.B., 1989. “Who Is an Entrepreneur?” Is the Wrong Question.
Entrepreneurship: Theory & Practice 13, 47–68.
Gatignon, H., Xuereb, J.-M., 1997. Strategic orientation of the firm and new product
performance. Journal of Marketing Research 34, 77–90.
George, B.A., 2011. Entrepreneurial orientation: A theoretical and empirical
examination of the consequences of differing construct representations. Journal of
Management Studies 48, 1291–1313.

134
George, B.A., Marino, L., 2011. The epistemology of entrepreneurial orientation:
Conceptual formation, modeling, and operationalization. Entrepreneurship Theory
and Practice 35, 989–1024.
Gielnik, M.M., Zacher, H., Frese, M., 2012. Focus on opportunities as a mediator of the
relationship between business owners’ age and venture growth. Journal of Business
Venturing 27, 127–142.
Gino, F., Margolis, J.D., 2011. Bringing ethics into focus: How regulatory focus and risk
preferences influence (Un)ethical behavior. Organizational Behavior and Human
Decision Processes 115, 145–156.
Gorman, C.A., Meriac, J.P., Overstreet, B.L., Apodaca, S., McIntyre, A.L., Park, P.,
Godbey, J.N., 2012. A meta-analysis of the regulatory focus nomological network:
Work-related antecedents and consequences. Journal of Vocational Behavior 80, 160–
172.
Greenbaum, B.E., 2015. Eagerness vs. vigilance: the effects of CEO regulatory focus on
firm innovation behavior, error avoidance behavior and firm reputation. PhD thesis,
The University of Texas at Austin.
Grichnik, D., Brinckmann, J., Singh, L., Manigart, S., 2014. Beyond environmental
scarcity: Human and social capital as driving forces of bootstrapping activities. Journal
of Business Venturing 29, 310–326.
Gupta, V.K., Wales, W.J., 2017. Assessing organisational performance within
entrepreneurial orientation research: Where have we been and where can we go from
here? The Journal of Entrepreneurship 26, 51–76.
Hair, J.F., Black, W.C., Babin, B.J., Anderson, R.E., 2014. Multivariate data analysis,
7th ed. Pearson, Harlow.
Halvorson, H.G., Higgins, E.T., 2013. Do you play to win - or to not lose? Harvard
Business Review.
Hambrick, D.C., 2007. Upper echelons theory: An update. Academy of Management
Review 32, 334–343.

135
Hambrick, D.C., Mason, P.A., 1984. Upper echelons: The organization as a reflection of
its top managers. Academy of Management Review 9, 193–206.
Hamstra, M.R.W., Bolderdijk, J.W., Veldstra, J.L., 2011. Everyday risk taking as a
function of regulatory focus. Journal of Research in Personality 45, 134–137.
Hart, M., Levie, J., Bonner, K., Drews, C.-C., 2014. Global entrepreneurship monitor.
United Kingdom.
Haws, K.L., Dholakia, U.M., Bearden, W.O., 2010. An assessment of chronic regulatory
focus measures. Journal of Marketing Research 47, 967–982.
He, Z.-L., Wong, P.-K., 2004. Exploration vs. exploitation: An empirical test of the
ambidexterity hypothesis. Organization Science 15, 481–494.
Herzenstein, M., Posavac, S.S., Brakus, J.J., 2007. Adoption of new and really new
products: The effects of self-regulation systems and risk salience. Journal of Marketing
Research 44, 251–260.
Higgins, E.T., 1998. Promotion and prevention: Regulatory focus as a motivational
principle, in: Zanna, M.P. (Ed.), Advances in Experimental Social Psychology.
Academic Press, pp. 1–46.
Higgins, E.T., 1997. Beyond pleasure and pain. American Psychologist 52, 1280–1300.
Higgins, E.T., Friedman, R.S., Harlow, R.E., Idson, L.C., Ayduk, O.N., Taylor, A., 2001.
Achievement orientations from subjective histories of success: Promotion pride versus
prevention pride. European Journal of Social Psychology 31, 3–23.
Higgins, E.T., Roney, C.J.R., Crowe, E., Hymes, C., 1994. Ideal versus ought
predilections for approach and avoidance distinct self-regulatory systems. Journal of
Personality and Social Psychology 66, 276–286.
Higgins, E.T., Silberman, I., 1998. Development of regulatory focus: Promotion and
prevention as ways of living, in: Heckhausen, J., Dweck, C.S. (Eds.), Motivation and
Self-Regulation across the Life Span. Cambridge University Press, Cambridge, pp. 78–
113.

136
Hitt, M.A., Keats, B.W., DeMarie, S.M., 1998. Navigating in the new competitive
landscape: Building strategic flexibility and competitive advantage in the 21st century.
The Academy of Management Executive; Briarcliff Manor 12, 22–42.
Hmieleski, K.M., Baron, R.A., 2008. Regulatory focus and new venture performance: A
study of entrepreneurial opportunity exploitation under conditions of risk versus
uncertainty. Strategic Entrepreneurship Journal 2, 285–299.
Hoffman, K., Parejo, M., Bessant, J., Perren, L., 1998. Small firms, R&D, technology
and innovation in the UK: a literature review. Technovation 18, 39–55.
House, R.J., Shane, S.A., Herold, D.M., 1996. Rumors of the death of dispositional
research are vastly exaggerated. The Academy of Management Review 21, 203–224.
Howell, J.M., Shea, C.M., Higgins, C.A., 2005. Champions of product innovations:
defining, developing, and validating a measure of champion behavior. Journal of
Business Venturing 20, 641–661.
Hughes, M., Morgan, R.E., 2007. Deconstructing the relationship between
entrepreneurial orientation and business performance at the embryonic stage of firm
growth. Industrial Marketing Management 36, 651–661.
Idson, L.C., Liberman, N., Higgins, E.T., 2000. Distinguishing gains from nonlosses
and losses from nongains: A regulatory focus perspective on hedonic intensity. Journal
of Experimental Social Psychology 36, 252–274.
Ilieva, J., Baron, S., Healey, N.M., 2002. Online surveys in marketing research: Pros
and cons. International Journal of Market Research 44, 361–376.
Ireland, R.D., Covin, J.G., Kuratko, D.F., 2009. Conceptualizing corporate
entrepreneurship strategy. Entrepreneurship Theory and Practice 33, 19–46.
Jack, S.L., 2010. Approaches to studying networks: Implications and outcomes.
Journal of Business Venturing 25, 120–137.
Jaworski, B.J., Kohli, A.K., 1993. Market orientation: antecedents and consequences.
The Journal of marketing 53–70.

137
Johnson, P.D., Smith, M.B., Wallace, J.C., Hill, A.D., Baron, R.A., 2015. A review of
multilevel regulatory focus in organizations. Journal of Management 41, 1501–1529.
Kammerlander, N., Burger, D., Fust, A., Fueglistaller, U., 2015. Exploration and
exploitation in established small and medium-sized enterprises: The effect of CEOs’
regulatory focus. Journal of Business Venturing 30, 582–602.
Kanuk, L., Berenson, C., 1975. Mail surveys and response rates: A Literature review.
Journal of Marketing Research (JMR) 12, 440–453.
Kark, R., Van Dijk, D., 2007. Motivation to lead, motivation to follow: The role of the
self-regulatory focus in leadership processes. Academy of Management Review 32,
500–528.
Keh, H.T., Nguyen, T.T.M., Ng, H.P., 2007. The effects of entrepreneurial orientation
and marketing information on the performance of SMEs. Journal of Business
Venturing 22, 592–611.
Khandwalla, P.N., 1976. Some top management styles, their context and performance.
Organization & Administrative Sciences 7, 21–45.
Khandwalla, P.N., 1972. Environment and its impact on the organization. International
Studies of Management & Organization 2, 297–313.
Kirner, E., Kinkel, S., Jaeger, A., 2009. Innovation paths and the innovation
performance of low-technology firms—An empirical analysis of German industry.
Research Policy, Special Issue: Innovation in Low-and Meduim-Technology Industries
38, 447–458.
Knight, G.A., 1997. Cross-cultural reliability and validity of a scale to measure firm
entrepreneurial orientation. Journal of Business Venturing 12, 213–225.
Kreiser, P.M., 2011. Entrepreneurial orientation and organizational learning: The
impact of network range and network closure. Entrepreneurship: Theory & Practice
35, 1025–1050.
138
Kreiser, P.M., Marino, L.D., Kuratko, D.F., Weaver, K.M., 2013. Disaggregating
entrepreneurial orientation: the non-linear impact of innovativeness, proactiveness
and risk-taking on SME performance. Small Business Economics 40, 273–291.
Kreiser, P.M., Marino, L.D., Weaver, K.M., 2002. Assessing the psychometric
properties of the entrepreneurial orientation scale: A multi-country analysis.
Entrepreneurship: Theory & Practice 26, 71.
Lanaj, K., Chang, C.-H. “Daisy”, Johnson, R.E., 2012. Regulatory focus and work-
related outcomes: A review and meta-analysis. Psychological Bulletin 138, 998–1034.
Lavie, D., Stettner, U., Tushman, M.L., 2010. Exploration and exploitation within and
across organizations. The Academy of Management Annals 4, 109–155.
Lee, D.Y., Tsang, E.W.K., 2001. The effects of entrepreneurial personality, background
and network activities on venture growth. Journal of Management Studies 38, 583–
602.
Leonard-Barton, D., 1992. Core capabilities and core rigidities: A paradox in managing
new product development. Strategic Management Journal 13, 111–125.
Levine, J.M., Higgins, E.T., Choi, H.-S., 2000. Development of strategic norms in
groups. Organizational Behavior and Human Decision Processes 82, 88–101.
Liberman, N., Idson, L.C., Camacho, C.J., Higgins, E.T., 1999. Promotion and
prevention choices between stability and change. Journal of Personality and Social
Psychology 77, 1135–1145.
Linton, G., Kask, J., 2017. Configurations of entrepreneurial orientation and
competitive strategy for high performance. Journal of Business Research 70, 168–176.
Lockwood, P., Jordan, C.H., Kunda, Z., 2002. Motivation by positive or negative role
models: Regulatory focus determines who will best inspire us. Journal of Personality
and Social Psychology 83, 854–864.
Lomberg, C., Urbig, D., Stöckmann, C., Marino, L.D., Dickson, P.H., 2016.
Entrepreneurial Orientation: The Dimensions’ Shared Effects in Explaining Firm
Performance. Entrepreneurship Theory and Practice 41, 973-998.

139
Lubatkin, M.H., Simsek, Z., Ling, Y., Veiga, J.F., 2006. Ambidexterity and
performance in small-to medium-sized firms: The pivotal role of top management
team behavioral integration. Journal of Management 32, 646–672.
Lumpkin, G.T., Dess, G.G., 2001. Linking two dimensions of entrepreneurial
orientation to firm performance: The moderating role of environment and industry life
cycle. Journal of Business Venturing 16, 429–451.
Lumpkin, G.T., Dess, G.G., 1996. Clarifying the entrepreneurial orientation construct
and linking it to performance. Academy of Management Review 21, 135–172.
Lyon, D.W., Lumpkin, G.T., Dess, G.G., 2000. Enhancing entrepreneurial orientation
research: Operationalizing and measuring a key strategic decision making process.
Journal of Management 26, 1055–1085.
Maes, J., Sels, L., 2014. SMEs’ radical product innovation: The role of internally and
externally oriented knowledge capabilities. Journal of Small Business Management 52,
141–163.
Malhotra, N.K., 2006. Questionnaire design and scale development, in: Grover, R.,
Vriens, M. (Eds.), The Handbook of Marketing Research: Uses, Misuses, and Future
Advances. Sage, London, pp. 83–94.
March, J.G., 1991. Exploration and exploitation in organizational learning.
Organization science 2, 71–87.
March, J.G., Sproull, L.S., Tamuz, M., 1991. Learning from samples of one or fewer.
Organization Science 2, 1–13.
Markman, A.B., Baldwin, G.C., Maddox, W.T., 2005. The interaction of payoff
structure and regulatory focus in classification. Psychological Science 16, 852–855.
Markovits, Y., 2012. The development of regulatory foci characters and moderation
effects on satisfaction and commitment. International Journal of Psychology and
Behavioral Sciences 2, 71–80.
Matusik, S.F., 2002. An empirical investigation of firm public and private knowledge.
Strategic Management Journal 23, 457–467.

140
McGrath, R.G., 2001. Exploratory learning, innovative capacity, and managerial
oversight. Academy of Management Journal 44, 118–131.
McKeever, E., Jack, S., Anderson, A., 2015. Embedded entrepreneurship in the creative
re-construction of place. Journal of Business Venturing 30, 50–65.
Merz, G., Sauber, M.H., 1995. Profiles of managerial activities in small firms. Strategic
Management Journal 16, 551–564.
Miller, D., 2011. Miller (1983) Revisited: A reflection on EO research and some
suggestions for the future. Entrepreneurship Theory and Practice 35, 873–894.
Miller, D., 1983. The correlates of entrepreneurship in three types of firms.
Management Science 29, 770–791.
Miller, D., Friesen, P.H., 1982. Innovation in conservative and entrepreneurial firms:
Two models of strategic momentum. Strategic Management Journal 3, 1–25.
Miller, D., Friesen, P.H., 1978. Archetypes of strategy formulation. Management
Science 24, 921–933.
Mintzberg, H., 1973. Strategy-making in three modes. California Management Review
16, 44–53.
Molden, D.C., Lee, A.Y., Higgins, E.T., 2008. Motivations for promotion and
prevention. Handbook of motivation science 169–187.
Morgan, R.E., Strong, C.A., 2003. Business performance and dimensions of strategic
orientation. Journal of Business Research 56, 163–176.
Moriarty, R.T., Kosnik, T.J., 1989. High-tech marketing: Concepts, continuity, and
change. Sloan Management Review; Cambridge, Mass. 30, 7–17.
Morris, T., Pavett, C.M., 1992. Management style and productivity in two cultures.
Journal of International Business Studies 23, 169–179.
Mousa, F., Wales, W., 2012. Founder effectiveness in leveraging entrepreneurial
orientation. Management Decision 50, 305–324.

141
Muller, P., Julius, J., Herr, D., Koch, L., Peycheva, V., McKiernan, S., 2017. Annual
report on European SMEs 2016/2017. The Associated Press.
Musteen, M., Barker, V.L., Baeten, V.L., 2010. The influence of CEO tenure and
attitude toward change on organizational approaches to innovation. The Journal of
Applied Behavioral Science 46, 360–387.
Nadkarni, S., Herrmann, P., 2010. CEO personality, strategic flexibility, and firm
performance: The case of the Indian business process outsourcing industry. Academy
of Management Journal 53, 1050–1073.
Nerkar, A., Roberts, P.W., 2004. Technological and product-market experience and
the success of new product introductions in the pharmaceutical industry. Strategic
Management Journal; Chicago 25, 779.
Nicholas, J., Ledwith, A., Perks, H., 2011. New product development best practice in
SME and large organisations: theory vs practice. European Journal of Innovation
Management 14, 227–251.
OECD, 2017. Enhancing the contributions of SMEs in a global and digitalised
economy. OECD, Paris.
O’Reilly, C.A., Tushman, M.L., 2011. Organizational ambidexterity in action: How
managers explore and exploit. California Management Review 53, 5–22.
Pearce, J.A., Fritz, D.A., Davis, P.S., 2010. Entrepreneurial orientation and the
performance of religious congregations as predicted by rational choice theory.
Entrepreneurship Theory and Practice 34, 219–248.
Pittino, D., Visintin, F., Lauto, G., 2017. A configurational analysis of the antecedents
of entrepreneurial orientation. European Management Journal 35, 224–237.
Podsakoff, P.M., MacKenzie, S.B., Lee, J.-Y., Podsakoff, N.P., 2003. Common method
biases in behavioral research: A critical review of the literature and recommended
remedies. Journal of Applied Psychology 88, 879–903.
Podsakoff, P.M., Organ, D.W., 1986. Self-reports in organizational research: Problems
and prospects. Journal of Management 12, 531.

142
Pollack, J.M., Forster, W.R., Johnson, P.D., Coy, A., Molden, D.C., 2015. Promotion-
and prevention-focused networking and its consequences for entrepreneurial success.
Social Psychological and Personality Science 6, 3–12.
Porter, M.E., 1980. Competitive strategy: techniques for analyzing industries and
competitors. Free Press, New York.
Qian, G., Li, L., 2003. Profitability of small- and medium-sized enterprises in high-tech
industries: the case of the biotechnology industry. Strategic Management Journal 24,
881–887.
Radas, S., Božić, L., 2009. The antecedents of SME innovativeness in an emerging
transition economy. Technovation 29, 438–450.
Randerson, K., 2016. Entrepreneurial orientation: do we actually know as much as we
think we do? Entrepreneurship & Regional Development 28, 580–600.
Rauch, A., Wiklund, J., Lumpkin, G. t., Frese, M., 2009. Entrepreneurial orientation
and business performance: An assessment of past research and suggestions for the
future. Entrepreneurship Theory and Practice 33, 761–787.
Richard, P.J., Devinney, T.M., Yip, G.S., Johnson, G., 2009. Measuring organizational
performance: Towards methodological best practice. Journal of Management 35, 718–
804.
Rosenbusch, N., Brinckmann, J., Bausch, A., 2011. Is innovation always beneficial? A
meta-analysis of the relationship between innovation and performance in SMEs.
Journal of Business Venturing 26, 441–457.
Rosenbusch, N., Rauch, A., Bausch, A., 2013. The mediating role of entrepreneurial
orientation in the task environment–performance relationship: A meta-analysis.
Journal of Management 39, 633–659.
Sarooghi, H., Libaers, D., Burkemper, A., 2015. Examining the relationship between
creativity and innovation: A meta-analysis of organizational, cultural, and
environmental factors. Journal of Business Venturing 30, 714–731.

143
Schneider, S.L., Lopes, L.L., 1986. Reflection in preferences under risk: Who and when
may suggest why. Journal of Experimental Psychology: Human Perception and
Performance 12, 535–548.
Scholer, A.A., Higgins, E.T., 2011. Promotion and prevention systems. In Vohs, K.D.
and Baumeister, R.F., Handbook of Self-Regulation: Research, Theory, and
Applications, 2nd ed. Guilford Press, New York.
Scholer, A.A., Zou, X., Fujita, K., Stroessner, S.J., Higgins, E.T., 2010. When risk
seeking becomes a motivational necessity. Journal of Personality and Social
Psychology 99, 215–231.
Shah, J., Higgins, E.T., 1997. Expectancy × value effects: Regulatory focus as
determinant of magnitude and direction. Journal of Personality and Social Psychology
73, 447–458.
Shin, Y., Kim, M.S., Choi, J.N., Kim, M., Oh, W.-K., 2017. Does leader-follower
regulatory fit matter? The role of regulatory fit in followers’ organizational citizenship
behavior. Journal of Management 43, 1211–1233.
Simsek, Z., Heavey, C., Veiga, J.F., Souder, D., 2009. A typology for aligning
organizational ambidexterity’s conceptualizations, antecedents, and outcomes. Journal
of Management Studies 46, 864–894.
Simsek, Z., Heavey, C., Veiga, J.J.F., 2010. The impact of CEO core self-evaluation on
the firm’s entrepreneurial orientation. Strategic Management Journal 31, 110–119.
Singh, J.V., 1986. Performance, slack, and risk taking in organizational decision
making. The Academy of Management Journal 29, 562–585.
Smith, K.G., Cao, Q., 2007. An entrepreneurial perspective on the firm-environment
relationship. Strategic Entrepreneurship Journal 1, 329–344.
Spanjol, J., Tam, L., Qualls, W.J., Bohlmann, J.D., 2011. New product team decision
making: Regulatory focus effects on number, type, and timing decisions. Journal of
Product Innovation Management 28, 623–640.

144
Su, Z., Xie, E., Li, Y., 2011. Entrepreneurial orientation and firm performance in new
ventures and established firms. Journal of Small Business Management 49, 558–577.
Swierczek, F.W., Ha, T.T., 2003. Entrepreneurial orientation, uncertainty avoidance
and firm performance: An analysis of Thai and Vietnamese SMEs. The International
Journal of Entrepreneurship and Innovation 4, 46–58.
Szymanski, D.M., Kroff, M.W., Troy, L.C., 2007. Innovativeness and new product
success: insights from the cumulative evidence. Journal of the Academy of Marketing
Science 35, 35–52.
Tabachnick, B.G., Fidell, L.S., 2013. Using multivariate statistics, 6th ed, Always
learning. Pearson, Boston, Mass.
Tang, J., Tang, Z., Marino, L.D., Zhang, Y., Li, Q., 2008. Exploring an inverted U-
Shape relationship between entrepreneurial orientation and performance in Chinese
ventures. Entrepreneurship: Theory & Practice 32, 219–239.
Thornhill, S., 2006. Knowledge, innovation and firm performance in high- and low-
technology regimes. Journal of Business Venturing 21, 687–703.
Tumasjan, A., Braun, R., 2012. In the eye of the beholder: How regulatory focus and
self-efficacy interact in influencing opportunity recognition. Journal of Business
Venturing 27, 622–636.
van de Ven, A.H., 1986. Central problems in the management of innovation.
Management Science 32, 590–607.
Van de Vrande, V., de Jong, J.P.J., Vanhaverbeke, W., de Rochemont, M., 2009. Open
innovation in SMEs: Trends, motives and management challenges. Technovation 29,
423–437.
Venkatraman, N., 1989. Strategic orientation of business enterprises: The construct,
dimensionality, and measurement. Management Science 35, 942–962.
Voss, Z.G., Voss, G.B., Moorman, C., 2005. An empirical examination of the complex
relationships between entrepreneurial orientation and stakeholder support. European
Journal of Marketing 39, 1132–1150.

145
Wales, W.J., 2016. Entrepreneurial orientation: A review and synthesis of promising
research directions. International Small Business Journal 34, 3–15.
Wales, W.J., Gupta, V.K., Mousa, F.-T., 2013a. Empirical research on entrepreneurial
orientation: An assessment and suggestions for future research. International Small
Business Journal 31, 357–383.
Wales, W.J., Patel, P.C., Lumpkin, G.T., 2013b. In pursuit of greatness: CEO
narcissism, entrepreneurial orientation, and firm performance variance. Journal of
Management Studies 50, 1041–1069.
Wales, W.J., Patel, P.C., Parida, V., Kreiser, P.M., 2013c. Nonlinear effects of
entrepreneurial orientation on small firm performance: The Moderating role of
resource orchestration capabilities. Strategic Entrepreneurship Journal 7, 93–121.
Wallace, J.C., Johnson, P.D., Frazier, M.L., 2009. An examination of the factorial,
construct, and predictive validity and utility of the regulatory focus at work scale.
Journal of Organizational Behavior 30, 805–831.
Wallace, J.C., Little, L.M., Hill, A.D., Ridge, J.W., 2010. CEO regulatory foci,
environmental dynamism, and small firm performance. Journal of Small Business
Management 48, 580–604.
Wang, C.L., 2008. Entrepreneurial orientation, learning orientation, and firm
performance. Entrepreneurship: Theory & Practice 32, 635–657.
Wang, C.L., Senaratne, C., Rafiq, M., 2015. Success traps, dynamic capabilities and
firm performance. British Journal of Management 26, 26–44.
Wangrow, D.B., Schepker, D.J., Barker III, V.L., 2015. Managerial discretion: An
empirical review and focus on future research directions. Journal of Management 41,
99–135.
Waterwall, B.P., 2017. Understanding the effects of regulatory focus on proactive
behavior (D.B.A.). Louisiana Tech University, United States -- Louisiana.
Welter, F., 2011. Contextualizing entrepreneurship—Conceptual challenges and ways
forward. Entrepreneurship Theory and Practice 35, 165–184.

146
Wiklund, J., 1999. The sustainability of the entrepreneurial orientation--performance
relationship. Entrepreneurship: Theory & Practice 24, 39–50.
Wiklund, J., Patzelt, H., Shepherd, D.A., 2009. Building an integrative model of small
business growth. Small Business Economics 32, 351–374.
Wiklund, J., Shepherd, D., 2005. Entrepreneurial orientation and small business
performance: a configurational approach. Journal of Business Venturing 20, 71–91.
Wiklund, J., Shepherd, D., 2003. Knowledge-based resources, entrepreneurial
orientation, and the performance of small and medium-sized businesses. Strategic
Management Journal 24, 1307–1314.
Wiklund, J., Shepherd, D.A., 2011. Where to from here? EO-as-experimentation,
failure, and distribution of outcomes. Entrepreneurship: Theory & Practice 35, 925–
946.
Wiseman, R.M., Bromiley, P., 1996. Toward a model of risk in declining organizations:
An empirical examination of risk, performance and decline. Organization Science 7,
524–543.
Wu, C., McMullen, J.S., Neubert, M.J., Yi, X., 2008. The influence of leader regulatory
focus on employee creativity. Journal of Business Venturing 23, 587–602.
Wu, J., 2012. Technological collaboration in product innovation: The role of market
competition and sectoral technological intensity. Research Policy 41, 489–496.
Xu, Y., 2011. How important are Entrepreneurial Social Capital and Knowledge
Structure in New Venture Innovation? Journal of Management Policy and Practice 12,
11–24.
Zahra, S.A., 1993. A conceptual model of entrepreneurship as firm behavior: A critique
and extension. Entrepreneurship: Theory & Practice 17, 5–21.
Zahra, S.A., Covin, J.G., 1995. Contextual influences on the corporate
entrepreneurship-performance relationship: A longitudinal analysis. Journal of
Business Venturing 10, 43–58.

147
Zahra, S.A., Randerson, K., Fayolle, A., 2013. Part I: The evolution and contributions of
corporate entrepreneurship research. M@ n@ gement 16, 362–380.
Zhou, R., Pham, M.T., 2004. Promotion and prevention across mental accounts: When
financial products dictate consumers & investment goals. Journal of Consumer
Research 31, 125–135.
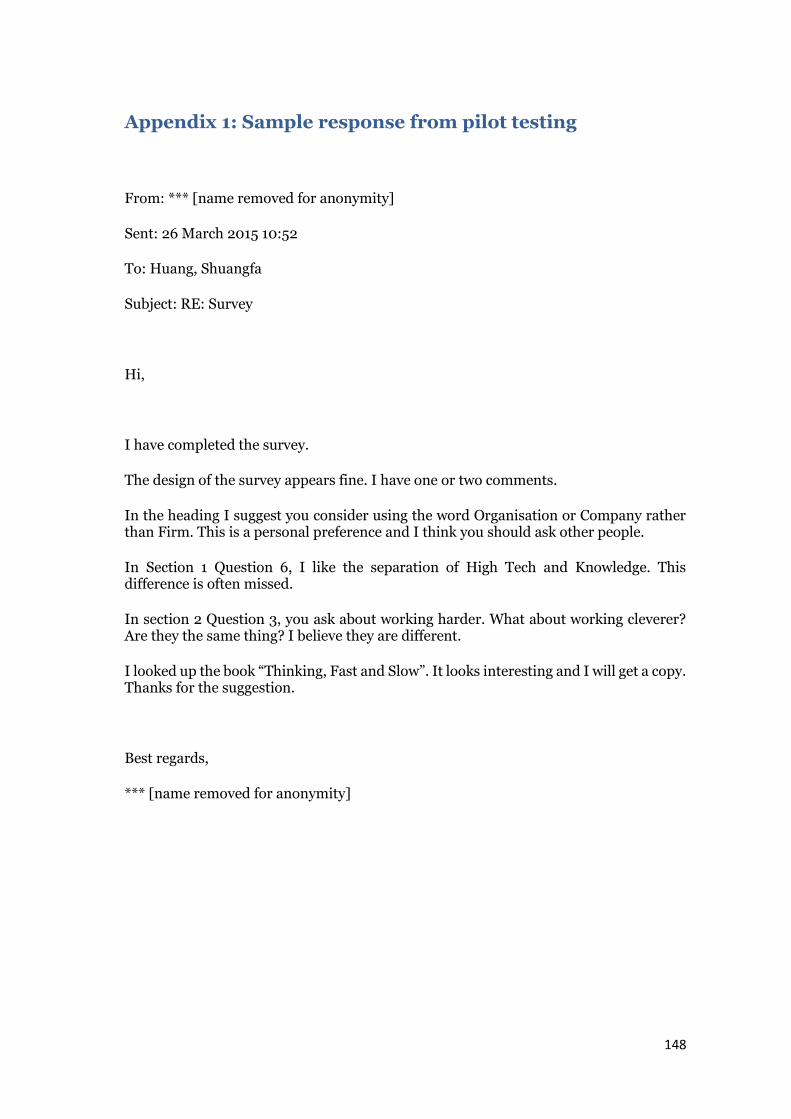
148
Appendix 1: Sample response from pilot testing
From: *** [name removed for anonymity]
Sent: 26 March 2015 10:52
To: Huang, Shuangfa
Subject: RE: Survey
Hi,
I have completed the survey.
The design of the survey appears fine. I have one or two comments.
In the heading I suggest you consider using the word Organisation or Company rather than Firm. This is a personal preference and I think you should ask other people.
In Section 1 Question 6, I like the separation of High Tech and Knowledge. This difference is often missed.
In section 2 Question 3, you ask about working harder. What about working cleverer? Are they the same thing? I believe they are different.
I looked up the book “Thinking, Fast and Slow”. It looks interesting and I will get a copy. Thanks for the suggestion.
Best regards,
*** [name removed for anonymity]

149
Appendix 2: Questionnaire design
A SURVEY ASSESSING THE IMPACT OF CEO
ON THE PRODUCT INNOVATION OF SMES
Guidelines to the questionnaire:
1. The term product refers to both goods and services.
2. Questions can be answered by simply ticking a number or providing a simple one
word answer.
3. Questions are grouped in eight sections and can be completed in 15 minutes.
4. When you arrive at the final 'thank you' page, you will know that your responses
have been recorded on our database.

150
SECTION 1: COMPANY BACKGROUND & RESPONDENT PROFILE
1. When was this business founded? 7. What is your current age:
__________
__________
2. What is your industry? 8. What is your gender:
Manufacturing
Male
Service
Female
Others
9. Level of education:
3. Number of employees? Postgraduate degree
1- 10
Degree or higher degree
11-50
A level
51-250
GCSE
More than 250
Other
4. Sales revenue?
No formal qualifications
Less than £1.5 million 10. What is your main role
in the business?
Less than £7.5 million Chairman
Less than £37.5 million Managing Director
More than £37.5 million Executive Director
5. Percentage change in sales revenues in the past 3 years?
Non-executive Director
(fill one) Owner-Manager
Growth _____%
Partner
OR Decrease _____%
Other (Please specify)
6. Your primary product is:
__________
(Please tick one number on each row) 11. Number of years with this company?
High Tech 1 2 3 4 5 Low Tech __________
Customised 1 2 3 4 5 Standardised 12. Number of years working in current industry?
High knowledge intensive
1 2 3 4 5
Low knowledge intensive
__________

151
SECTION 2: YOUR ATTITUDE TOWARD EXPLORATION & LEARNING
This set of questions asks you about specific events in your life. Please indicate your answer to each question by ticking the appropriate number below it.
1. Compared to most people, are you typically unable to get what you want out of life?
7. Do you often do well at different things that you try?
1 2 3 4 5 1 2 3 4 5
never or seldom
sometimes very often
never or seldom
sometimes very often
2. Growing up, would you ever "cross the line'' by doing things that your parents would not tolerate?
8. Not being careful enough has gotten you into trouble at times.
1 2 3 4 5 1 2 3 4 5 never
or seldom sometimes very
often never
or seldom sometimes very
often
3. How often have you accomplished things that got you "psyched'' to work even harder?
9. When it comes to achieving things that are important to me, I find that I don't perform as well as I ideally would like to do.
1 2 3 4 5 1 2 3 4 5
never or seldom
sometimes very often
never true
sometimes true
very often true
4. Did you get on your parents' nerves often when you were growing up?
10. I feel like I have made progress toward being successful in my life.
1 2 3 4 5 1 2 3 4 5
never or seldom
sometimes very often
certainly false
certainly true
5. How often did you obey rules and regulations that were established by your parents?
11. I have found very few hobbies or activities in my life that capture my interest or motivate me to put effort into them.
1 2 3 4 5 1 2 3 4 5
never or seldom
sometimes very often
certainly false
certainly true
6. Growing up, did you ever act in ways that your parents thought were objectionable?
1 2 3 4 5
never or seldom
sometimes very often

152
SECTION 3: STRATEGIC PREFERENCE OF YOUR FIRM
To what extent do you agree with the following statements in relation to your firm’s strategic preference?
Strongly disagree
Strongly agree
We favour a strong emphasis on R&D, technological leadership, and innovations
1 2 3 4 5
My firm has many new lines of products marketed in the past 3 years
1 2 3 4 5
Changes in our product lines have usually been quite dramatic
1 2 3 4 5
We have a strong propensity for high-risk projects (with chances of very high returns)
1 2 3 4 5
We believe, owing to the nature of the environment, that bold, wide-ranging acts are necessary to achieve the firm's objectives
1 2 3 4 5
When there is uncertainty, we typically adopt a bold, aggressive posture in order to maximise the probability of exploiting potential opportunities
1 2 3 4 5
We initiate actions to which competitors then respond 1 2 3 4 5
We are very often the first business to introduce new products, administrative techniques, operating technologies, etc.
1 2 3 4 5
We typically adopt a very competitive, "undo-the-competitors" posture
1 2 3 4 5

153
SECTION 4: BUSINESS ENVIRONMENT
To what extent do you agree with the following statements in relation to your business environment?
Strongly disagree
Strongly
agree
The technology in our industry is changing rapidly 1 2 3 4 5
Technological changes provide big opportunities in our industry
1 2 3 4 5
A large number of new product ideas have been made possible through technological breakthroughs in our industry
1 2 3 4 5
Customers’ product preferences change quite a bit over time 1 2 3 4 5
Our customers tend to look for new products all the time 1 2 3 4 5
We are witnessing demand for our products from customers who never bought them before
1 2 3 4 5
SECTION 5: FIRM PERFORMANCE
To what extent do you agree that in comparison with your major competitors over the past three years:
Strongly disagree
Strongly
agree
Your company has higher profitability 1 2 3 4 5
Your company has higher market share 1 2 3 4 5
Your company has higher return on investments 1 2 3 4 5
Your company has higher sales growth 1 2 3 4 5

154
Appendix 3: Letter of invitation
Dear xxx (name of respondent),
You are invited to participate in a study from Lancaster University. The study aims to
assess the impact of individual and firm learning on SMEs’ innovation. The findings can help
to inform you the influence of different learning behaviours on your organisation.
We recognise the value of your time and shall update you with an Executive Report on the
findings of the study. Information you provide will remain confidential and individual firms
will not be identified in any of the study findings. Questions can be completed in 15 minutes.
Please follow this link to complete the survey.
Thank you for your participation.
Best Regards,
Shuangfa Huang
Institute for Entrepreneurship and Enterprise Development
Lancaster University Management School
Lancaster University
Lancaster, UK
LA1 4YX
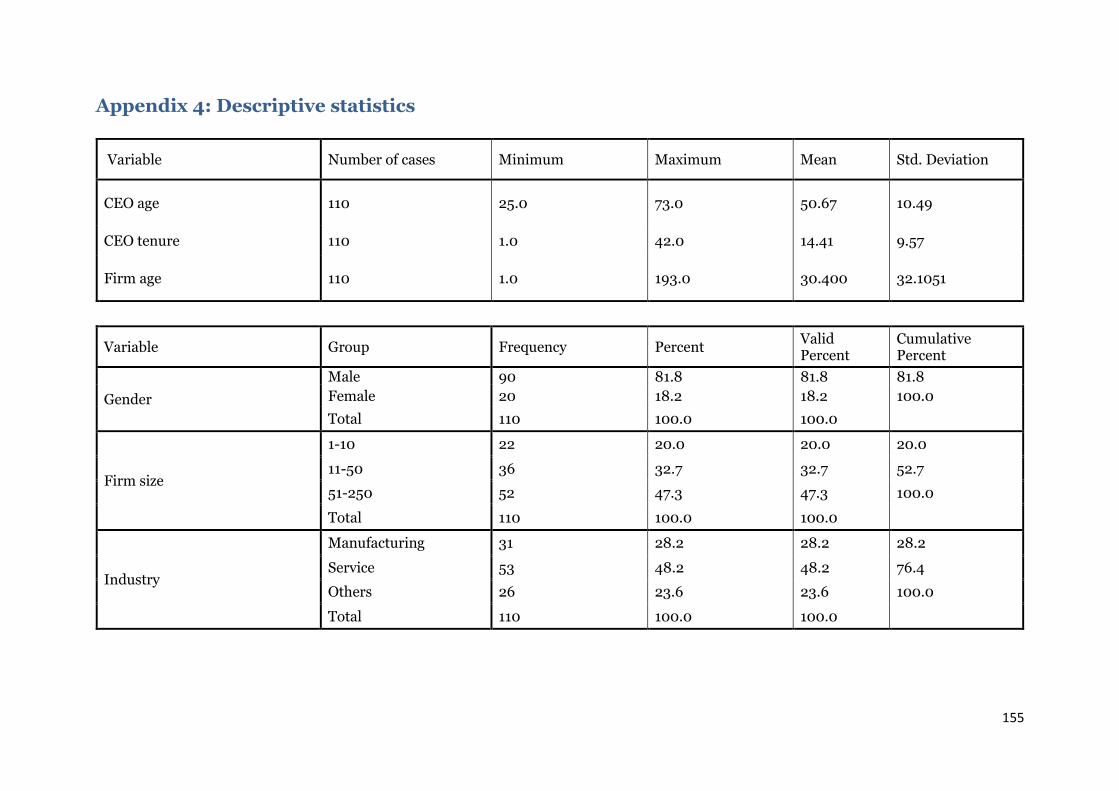
155
Appendix 4: Descriptive statistics
Variable Number of cases Minimum Maximum Mean Std. Deviation
CEO age 110 25.0 73.0 50.67 10.49
CEO tenure 110 1.0 42.0 14.41 9.57
Firm age 110 1.0 193.0 30.400 32.1051
Variable Group Frequency Percent Valid Percent
Cumulative Percent
Gender
Male 90 81.8 81.8 81.8
Female 20 18.2 18.2 100.0
Total 110 100.0 100.0
Firm size
1-10 22 20.0 20.0 20.0
11-50 36 32.7 32.7 52.7
51-250 52 47.3 47.3 100.0
Total 110 100.0 100.0
Industry
Manufacturing 31 28.2 28.2 28.2
Service 53 48.2 48.2 76.4
Others 26 23.6 23.6 100.0
Total 110 100.0 100.0

156
Appendix 5: Results from normality test
Construct
N Skewness Kurtosis
Statistic Statistic Std. Error
z-value (recommended value: +/-1.96) Statistic Std. Error
z-value (recommended value: +/-1.96)
Innovativeness 110 -.107 .230 -.462 -.486 .457 -1.064
Risk-taking 110 -.053 .230 -.231 -.772 .457 -1.689
Proactiveness 110 -.069 .230 -.301 -.314 .457 -.688
Firm performance 110 -.477 .230 -2.069 .223 .457 .488
Promotion focus 110 -.052 .230 -.227 -.260 .457 -.569
Prevention focus 110 -.144 .230 -.624 -.422 .457 -.923
CEO age 110 -.412 .230 -1.786 -.103 .457 -.225
CEO tenure (square root transformation)
110 -.216 .230 -.939 -.699 .457 -1.528
Firm age(logarithmic transformation)
110 -.433 .230 -1.880 .711 .457 1.556
Valid N (listwise)
110

157
Appendix 6: Results from principal component analysis
Total Variance Explained
Component
Initial Eigenvalues Extraction Sums of Squared Loadings Rotation Sums of Squared Loadings
Total % of Variance Cumulative % Total % of Variance Cumulative
% Total
% of Varianc
e Cumulative
%
1 2.939 36.735 36.735 2.939 36.735 36.735 2.769 34.616 34.616
2 1.821 22.767 59.503 1.821 22.767 59.503 1.991 24.887 59.503
3 .826 10.323 69.825
4 .605 7.564 77.390
5 .567 7.087 84.477
6 .531 6.634 91.111
7 .384 4.804 95.915
8 .327 4.085 100.000
Extraction Method: Principal Component Analysis.
Component Matrixa Rotated Component Matrixa
Component
Component 1 2 1 2
PRO3 .010 .730 PRO3 -.275 .676 PRO7 .344 .664 PRO7 .058 .746 PRO9 .484 .510 PRO9 .247 .658 PRO10 .477 .554 PRO10 .223 .696 PRE2 .755 -.409 PRE2 .855 -.082 PRE4 .820 -.226 PRE4 .843 .111 PRE5 .697 -.104 PRE5 .683 .176 PRE6 .793 -.227 PRE6 .819 .100 Extraction Method: Principal Component Analysis. 2 components extracted.
Extraction Method: Principal Component Analysis. Rotation Method: Varimax with Kaiser Normalization. Rotation converged in 3 iterations.

158
Appendix 7: Results from non-response bias test
Group Statistics N Mean Std. Deviation Std. Error Mean
CEO Age Early 56 50.018 9.977 1.333 Late 54 51.352 11.053 1.504
Tenure Early 56 13.027 9.465 1.265 Late 54 15.852 9.547 1.299
Firm age Early 56 30.375 31.682 4.234 Late 54 30.426 32.836 4.468
Independent Samples Test
Levene's Test for Equality of Variances
t-test for Equality of Means
F Sig. t df Sig. (2-tailed)
Mean Differenc
e
Std. Error
Difference
95% Confidence Interval of the
Difference
Lower Upper
CEO Age Equal variances assumed 2.530 .115 -.665 108 .507 -1.334 2.006 -5.311 2.643
Equal variances not assumed
-.664 105.968 .508 -1.334 2.010 -5.319 2.651
Tenure Equal variances assumed .005 .945 -1.558 108 .122 -2.825 1.813 -6.419 .768
Equal variances not assumed
-1.558 107.779 .122 -2.825 1.813 -6.419 .769
Firm age Equal variances assumed .008 .927 -.008 108 .993 -.051 6.152
-12.244
12.142
Equal variances not assumed
-.008 107.436 .993 -.051 6.156 -
12.253 12.151

159
Appendix 8: Results from common method bias test
Total Variance Explained
Component
Initial Eigenvalues Extraction Sums of Squared Loadings Rotation Sums of Squared Loadings
Total % of
Variance Cumulative % Total % of
Variance Cumulative % Total % of
Variance Cumulative %
1 5.339 25.423 25.423 5.339 25.423 25.423 2.913 13.872 13.872
2 3.042 14.484 39.907 3.042 14.484 39.907 2.808 13.373 27.245
3 2.326 11.078 50.984 2.326 11.078 50.984 2.585 12.310 39.555
4 1.513 7.206 58.190 1.513 7.206 58.190 2.300 10.953 50.509
5 1.362 6.486 64.676 1.362 6.486 64.676 2.074 9.877 60.385
6 1.117 5.319 69.996 1.117 5.319 69.996 2.018 9.610 69.996
7 .950 4.524 74.520
8 .703 3.346 77.865
9 .632 3.010 80.875
10 .605 2.882 83.757
11 .499 2.376 86.133
12 .454 2.163 88.297
13 .425 2.024 90.320
14 .401 1.910 92.230
15 .319 1.517 93.747
16 .281 1.340 95.087
17 .270 1.287 96.374
18 .249 1.185 97.558
19 .203 .968 98.526
20 .163 .777 99.302
21 .146 .698 100.000
Extraction Method: Principal Component Analysis.

160
Appendix 9: Results from reliability and validity test
Constructs and items Factor loading
Cronbach's alpha
Average variance extracted (AVE)
Promotion focus 0.644 0.483
How often have you accomplished things that got you "psyched'' to work even harder? 0.676
Do you often do well at different things that you try? 0.746
When it comes to achieving things that are important to me, I find that I don't perform as well as I ideally would like to do. 0.658
I feel like I have made progress toward being successful in my life. 0.696
Prevention focus 0.829 0.580
Growing up, would you ever "cross the line'' by doing things that your parents would not tolerate? 0.855
Did you get on your parents' nerves often when you were growing up? 0.843
How often did you obey rules and regulations that were established by your parents? 0.683
Growing up, did you ever act in ways that your parents thought were objectionable? 0.819

161
Entrepreneurial Orientation
EO – Innovativeness 0.770 0.598
We favour a strong emphasis on R&D, technological leadership, and innovations. 0.738
My firm has many new lines of products marketed in the past 3 years. 0.811
Changes in our product lines have usually been quite dramatic. 0.770
EO – Proactiveness 0.790 0.619
We initiate actions to which competitors then respond 0.781
We are very often the first business to introduce new products, administrative techniques, operating technologies, etc. 0.820
We typically adopt a very competitive, "undo-the-competitors" posture 0.758
EO – Risk taking 0.840 0.672
We have a strong propensity for high-risk projects (with chances of very high returns) 0.807
We believe, owing to the nature of the environment, that bold, wide-ranging acts are necessary to achieve the firm's objectives 0.805
When there is uncertainty, we typically adopt a bold, aggressive posture in order to maximise the probability of exploiting potential opportunities 0.846 Firm performance (in comparison with your major competitors over the past three years): 0.768 0.598
Your company has higher profitability 0.841
Your company has higher market share 0.622
Your company has higher return on investments 0.850
Your company has higher sales growth 0.759