A tale of shales: the relative roles of production ...
45
A tale of shales: the relative roles of production, decomposition, and dilution in the accumulation of organic-rich strata, Middle–Upper Devonian, Appalachian basin Bradley B. Sageman a, * , Adam E. Murphy b , Josef P. Werne c , Charles A. Ver Straeten d , David J. Hollander e , Timothy W. Lyons f a Department of Geological Sciences, Northwestern University, Evanston, IL 60208, USA b Millbrook School, School Road, Millbrook, NY 12545, USA c Department of Marine Biogeochemistry and Toxicology, Netherlands Institute for Sea Research (NIOZ), P.O. Box 59, 1790 AB Den Burg, Texel, The Netherlands d Center for Stratigraphy and Paleontology, New York State Museum, The State Education Department, Albany, NY 12230, USA e College of Marine Science, University of South Florida, St. Petersburg, FL 33701, USA f Department of Geological Sciences, University of Missouri, Columbia, MS 65211, USA Received 31 July 2001; received in revised form 10 June 2002 Abstract A new consensus on the processes responsible for organic carbon burial in ancient epeiric seas has emerged. More firmly grounded in the uniformitarian framework of modern oceanography and biogeochemistry, this consensus recognizes the interdependent roles of sedimentation, primary production, and microbial metabolism in favor of earlier end-member models (e.g., ‘‘production vs. preservation’’). In this study, one of the classic stratigraphic sequences upon which the ‘‘preservation’’ end-member was based is re-interpreted in light of this new consensus. The study employs an extensive new sedimentological – biogeochemical database from cores drilled in western New York. The database spans over 500 m and 15 my of Devonian deposition in the Appalachian basin and provides a framework for comparative study of organic matter burial. The major conclusions are: (1) few organic-rich units were deposited under pervasive anoxic – sulfidic water columns; (2) establishment and breakdown of seasonal thermoclines, on annual or longer timescales, were the predominant mode of stratification; and (3) under such conditions, remineralization of bio-limiting nutrients may have played a key role in organic matter burial by creating a ‘‘eutrophication pump.’’ This pump may have augmented an already rising nutrient inventory such that productivity levels exceeded the threshold required for development of suboxic to anoxic conditions in sediments, and episodically in bottom waters. A final conclusion asserts that the master variable for organic matter accumulation was relative sea-level change, which exerted influence on clastic dilution, preservation, and production processes. Sea-level rise events led to sediment starvation and organic carbon concentration in distal basin sediments, as well as to decreased effectiveness of seasonal mixing and thus longer build-up intervals for remineralized nutrients. Episodic mixing of nutrient-enriched bottom waters led to enhanced production. Ultimately, increased clastic sediment delivery and water column mixing during relative sea-level fall diluted surface sediment 0009-2541/03/$ - see front matter D 2003 Elsevier Science B.V. All rights reserved. doi:10.1016/S0009-2541(02)00397-2 * Corresponding author. E-mail address: [email protected] (B.B. Sageman). www.elsevier.com/locate/chemgeo Chemical Geology 195 (2003) 229 – 273
Transcript of A tale of shales: the relative roles of production ...

A tale of shales: the relative roles of production, decomposition,
and dilution in the accumulation of organic-rich strata,
Middle–Upper Devonian, Appalachian basin
Bradley B. Sagemana,*, Adam E. Murphyb, Josef P. Wernec,Charles A. Ver Straetend, David J. Hollandere, Timothy W. Lyonsf
aDepartment of Geological Sciences, Northwestern University, Evanston, IL 60208, USAbMillbrook School, School Road, Millbrook, NY 12545, USA
cDepartment of Marine Biogeochemistry and Toxicology, Netherlands Institute for Sea Research (NIOZ), P.O. Box 59,
1790 AB Den Burg, Texel, The NetherlandsdCenter for Stratigraphy and Paleontology, New York State Museum, The State Education Department, Albany, NY 12230, USA
eCollege of Marine Science, University of South Florida, St. Petersburg, FL 33701, USAfDepartment of Geological Sciences, University of Missouri, Columbia, MS 65211, USA
Received 31 July 2001; received in revised form 10 June 2002
Abstract
A new consensus on the processes responsible for organic carbon burial in ancient epeiric seas has emerged. More firmly
grounded in the uniformitarian framework of modern oceanography and biogeochemistry, this consensus recognizes the
interdependent roles of sedimentation, primary production, and microbial metabolism in favor of earlier end-member models
(e.g., ‘‘production vs. preservation’’). In this study, one of the classic stratigraphic sequences upon which the ‘‘preservation’’
end-member was based is re-interpreted in light of this new consensus. The study employs an extensive new sedimentological–
biogeochemical database from cores drilled in western New York. The database spans over 500 m and 15 my of Devonian
deposition in the Appalachian basin and provides a framework for comparative study of organic matter burial. The major
conclusions are: (1) few organic-rich units were deposited under pervasive anoxic–sulfidic water columns; (2) establishment
and breakdown of seasonal thermoclines, on annual or longer timescales, were the predominant mode of stratification; and (3)
under such conditions, remineralization of bio-limiting nutrients may have played a key role in organic matter burial by creating
a ‘‘eutrophication pump.’’ This pump may have augmented an already rising nutrient inventory such that productivity levels
exceeded the threshold required for development of suboxic to anoxic conditions in sediments, and episodically in bottom
waters. A final conclusion asserts that the master variable for organic matter accumulation was relative sea-level change, which
exerted influence on clastic dilution, preservation, and production processes. Sea-level rise events led to sediment starvation and
organic carbon concentration in distal basin sediments, as well as to decreased effectiveness of seasonal mixing and thus longer
build-up intervals for remineralized nutrients. Episodic mixing of nutrient-enriched bottom waters led to enhanced production.
Ultimately, increased clastic sediment delivery and water column mixing during relative sea-level fall diluted surface sediment
0009-2541/03/$ - see front matter D 2003 Elsevier Science B.V. All rights reserved.
doi:10.1016/S0009-2541(02)00397-2
* Corresponding author.
E-mail address: [email protected] (B.B. Sageman).
www.elsevier.com/locate/chemgeo
Chemical Geology 195 (2003) 229–273

organic content such that respiratory demand could be met by increased oxygen supply, thus terminating deposition of strata
enriched in organic carbon.
D 2003 Elsevier Science B.V. All rights reserved.
Keywords: Shales; Middle–Upper Devonian; Appalachian basin
1. Introduction
Ancient organic carbon-rich facies have long
attracted geological interest (e.g., Pompeckj, 1901;
Grabau, 1913; Schuchert, 1915). In the latter half of
the 20th century, this interest was intensified
through the efforts of the petroleum industry to
understand the nature and origin of source rock
facies. This resulted in application of the latest
geological technologies to the study of fine-grained
strata and oxygen-deficient basins (Demaison and
Moore, 1980), and significantly advanced the field.
Reports on organic carbon-rich deposits from practi-
cally every marine and lacustrine environment
where they form and virtually every geologic age
in which they occur, including the modern, can now
be found in the literature. In these studies, some of
the first biogeochemical techniques were developed
and integrated with stratigraphic and sedimentologic
observations. In recent decades, it has been increas-
ingly recognized that organic matter (OM) burial in
marine sediments represents an important variable
in linked global biogeochemical cycles and is thus
critical to understanding the history of oceans, the
atmosphere, and climate change (e.g., Arthur et al.,
1988; Berner, 1990; Berner and Canfield, 1989;
Van Cappellen and Ingall, 1994). Integrated strati-
graphic and biogeochemical databases have played
a key role in this work. The first major objective of
this paper is to document the development of one
such new database from geochemical analysis of
core samples representing fine-grained basinal
deposits of the Devonian Appalachian basin, west-
ern New York State. This database is specifically
designed to address the causes of extensive burial
of organic matter in shallow epicontinental seas
(V 300 m at maximum highstands) during the
mid- to Late Devonian greenhouse and the conse-
quences of this process for marine ecosystems and
climate change.
The critical questions in all studies of geological
processes focus on the controlling or limiting factors
that govern the rate, direction, and magnitude of
change. Over the past two decades, a general con-
sensus has emerged about the controls on organic
matter burial in which three factors are acknowl-
edged as fundamental to the formation of almost all
organic carbon-rich facies (e.g., Suess, 1980; Emer-
son, 1985; Emerson and Hedges, 1988; Arthur and
Sageman, 1994; Canfield, 1994; Wignall, 1994;
Tyson, 1995). They are primary photosynthetic pro-
duction, bacterial decomposition, and bulk sedimen-
tation rate, or dilution (Fig. 1). These controls can be
correspondingly thought of as the rate at which
carbon is fixed and exported from surface waters,
the rate at which it is remineralized to CO2 in the
water column and sediments, and the rate at which
organic carbon is buried relative to the flux of
detrital dilutants (processes represented geochemi-
cally in Fig. 2).
Despite this consensus, significant differences
remain among researchers concerning the relative
importance of each of these processes. Although
modern data suggest that OM concentration increases
with increasing bulk sedimentation rate (Bralower and
Thierstein, 1984; Henrichs and Reeburgh, 1987; Betts
and Holland, 1991), at least up to a threshold of
dilution (Ibach, 1982; Tyson, 1995), most ancient
organic-rich deposits in epeiric settings appear to have
accumulated under very low bulk sedimentation rates.
If ancient depositional environments were perma-
nently anoxic, this appears to outweigh modulation
of concentration by sedimentation effects (Stein,
1986, 1990; Tyson, 1995, 2001), but many epiconti-
nental basin deposits show evidence of at least inter-
mittent, if not frequent events of oxygenation
(Sageman et al., 1991; Oschmann, 1991; Wignall,
1994). It has also been suggested that high primary
production dominates in controlling ancient organic
matter burial (Pedersen and Calvert, 1990). However,
B.B. Sageman et al. / Chemical Geology 195 (2003) 229–273230

data from high sedimentation regimes, such as the
modern continental margins on which the productivity
hypothesis is based, may provide a biased view of OC
accumulation processes in ancient epeiric seas (Tyson,
2001). Recently, the impact of changes in planktonic
ecosystems on OM accumulation and autodilution
processes (Tyson, 1995; Werne et al., 2000), changes
in organic matter type and reactivity on preservational
potential (Gong and Hollander, 1996), variations in
water depth and its effect on OM delivery flux to the
sea floor (e.g., Sarnthein et al., 1992; Tyson, 2001),
and the contribution of bacterially sourced OM to
bulk sedimentary OC (e.g., Kuypers et al., 2002) have
received increasing attention. Clearly, there is a con-
tinuum of processes that vary among different depo-
sitional environments and geological periods. In each
case, the relative importance of these different pro-
cesses must be independently evaluated, if possible.
The second major objective of this study is the
development/refinement of a proxy methodology
(see Fig. 2) to assess the relative roles of organic
matter production, decomposition, and dilution in
ancient OC-rich strata.
Integration of these two objectives in the context of
a detailed stratigraphic and sedimentologic framework
for a thick sequence of fine-grained strata in the
Devonian Appalachian basin allows a comparative
approach. This ‘‘tale of shales’’ encompasses the full
range of changes experienced in the distal (basinal)
facies tract. Based on this comparison, a new deposi-
tional model for Late Devonian black shales of the
Appalachian basin is proposed. Description of this
model is the third major objective of the paper. The
model takes into account the sea-level history, paleo-
geography, and paleoclimate of the basin, as well as
hypotheses about water depth, seasonal stratification,
and the frequency and effectiveness of water column
mixing. The central feature of this depositional model,
and that which represents a departure from prior
models for these Devonian black shales, is the role
played by microbial communities (Fig. 2) in the
breakdown of sedimentary OM and release of bio-
Fig. 1. The three fundamental processes that regulate burial of organic matter in marine sediments. The proximate controls on these processes
are listed below the dashed line in each box. Note linkages between proximate controls (thin arrows), such as relative sea-level and export
production, which both influence benthic redox conditions, which, in turn, may influence recycling of nutrients (see text for further discussion).
B.B. Sageman et al. / Chemical Geology 195 (2003) 229–273 231

limiting nutrients (Murphy et al., 2000b). For this
reason, the study is included in a volume on ‘‘Isotopic
Records of Microbially Mediated Processes,’’ even
though isotopic data comprise only one source of
information in our multi-proxy reconstruction of
organic matter burial.
2. Geological background
The stratigraphy of Middle–Upper Devonian rocks
of the eastern United States has been extensively
studied for many decades. Detailed lithic correlations
extend from proximal facies of the Catskill delta
Fig. 2. Illustration of the photosynthetic fixation of carbon in marine organic matter, and its subsequent remineralization under dominant
microbial regimes (aerobic, anaerobic-denitrifying, anaerobic sulfate-reducing, and anaerobic-fermentative) is shown in relation to
biogeochemical proxies used in this study. Increased accumulation of the indicated proxies is interpreted to reflect the relative (temporal)
dominance of different processes in time-averaged mudstone samples. Changes in the ratios of Ti and Si to Al are interpreted to reflect changes
in detrital delivery (e.g., Bertrand et al., 1996). Accumulation of a series of redox-sensitive metals reflects the succession of microbial regimes
under which OM is degraded (Berner, 1980): Mn accumulation typically indicates oscillating redox conditions (Calvert and Pedersen, 1996);
similarly, oscillation through the zone of denitrification may result in relative increases in the value of V+Cr (Piper, 1994); pyrite Fe and Mo
accumulate under sulphate reducing conditions, but are influenced also by changes in sedimentation rate (Raiswell et al., 1988; Canfield et al.,
1996; Lyons, 1997; Raiswell and Canfield, 1998; Emerson and Huested, 1991; Crusius et al., 1996; Piper, 1994; Helz et al., 1996); significant
depletion of d34Spyr is generally indicative of prolonged euxinia (Lyons, 1997). If there are no major changes in OM source (Meyers, 1994),
increases in C/N and C/P ratios of preserved OM may reflect decompositional losses of N and P due to microbial processes (Aller, 1994; Van
Cappellen and Ingall, 1994; Ingall and Jahnke, 1997). Changes in OM source or in primary production rates, as well as variations in basin
circulation (i.e., downward advection of O2 and upwelling of respired CO2), may result in variations in the d13C composition of preserved bulk
OM (Scholle and Arthur, 1980; Kump and Arthur, 1999) or in individual organic compounds (Hayes et al., 1987, 1990).
B.B. Sageman et al. / Chemical Geology 195 (2003) 229–273232

(eastern New York), through the axial part of the
basin, across the peripheral bulge (e.g., Cincinnati
Arch), and into the cratonic basin of western Ken-
tucky and southern Indiana/Illinois (Ettensohn,
1985a,b; Ettensohn et al., 1988; Woodrow et al.,
1988). Dominant marine lithofacies in the eastern part
of this region (i.e., central to western New York
representing the Appalachian foredeep to peripheral
bulge) consist of medium gray to gray burrowed
mudstones. Interbedded with the dominant mudstones
are silty mudstone, siltstone, and sandstone intervals,
interpreted to reflect regional shallowing, and finely
laminated, dark gray to black, organic carbon-rich
clay shales or mudstones, commonly associated with
thin beds of skeletal carbonate and interpreted to
reflect relative deepening (Ettensohn, 1985a,b; Etten-
sohn et al., 1988; Woodrow et al., 1988).
In this study, data were collected from six black
mudstone units spanning latest Eilfelian through ear-
liest Famennian time at two locations representing
the distal part of the Appalachian foreland basin
(Figs. 3 and 4). Earlier publications have described
the geologic background for this study area in depth
(Murphy et al., 2000a,b; Werne et al., 2002), and
only the most pertinent aspects will be reviewed here.
The black mudstones studied in detail include those
of the Marcellus subgroup, the Geneseo, Middlesex,
and Rhinestreet formations, as well as the Pipe Creek
Formation and an interval of organic-rich facies in
the uppermost Hanover Formation that together cor-
respond to the lower and upper Kellwasser horizons
(Murphy et al., 2000c) (Figs. 3 and 4). Each of these
organic-rich intervals has been interpreted to coincide
with a relative deepening event based on biostrati-
Fig. 3. Schematic cross section (A–AV) of the Catskill Delta Complex in New York (see inset map) showing core locations relative to major
facies (modified from House and Kirchgasser, 1993).
B.B. Sageman et al. / Chemical Geology 195 (2003) 229–273 233

B.B. Sageman et al. / Chemical Geology 195 (2003) 229–273234

B.B. Sageman et al. / Chemical Geology 195 (2003) 229–273 235

graphic correlation to proposed global eustatic events
(i.e., Johnson and Sandberg, 1988), as well as
regional sea-level reconstructions based on lithofacies
and stratigraphic architecture (Brett, 1995; Brett and
Baird, 1986; House and Kirchgasser, 1993; Ver
Straeten and Brett, 1995) (Figs. 3 and 4). These
deepening events may be related to the evolution of
the Appalachian basin as suggested by Ettensohn
(1985a,b) and Ettensohn et al. (1988). These papers
present a tectono-stratigraphic model in which an
active orogenic phase led to rapid subsidence in the
foreland basin and black mudstone deposition. Sub-
sequently, during the tectonic quiescence phase, ero-
sion of the orogen resulted in basin filling with dark
gray to gray mudstones until the terrigneous flux was
reduced enough to allow carbonate platform develop-
ment (Figs. 3 and 4). This subsidence model explains
many patterns of sedimentation in the Eifelian
through early Frasnian part of the section, but evi-
dence discussed in Werne et al. (2002) suggests that
eustasy also played a key role in basin history,
especially for the post-Geneseo black mudstones.
The long-term relationship between sea-level, terri-
genous supply to the basin, and OM burial is
illustrated in Fig. 4, with plots of weight percent
total organic carbon (TOC), a 10-point moving
average of Ti/Al ratio, and a composite relative
sea-level curve.
The current consensus on paleogeography for the
study interval places the basin at approximately 30–
35j south of the equator (Witzke and Heckel, 1988;
van der Voo, 1993; Scotese and McKerrow, 1990).
The mid- to Late Devonian corresponds to the latter
part of the Paleozoic greenhouse based on Berner’s
(1990) estimate of 4–12 times present-day pCO2
values. Therefore, the basin probably lay within an
expanded subtropical zone. Paleoclimatic indicators
suggest warm but seasonally variable, arid to semi-
arid conditions subject to significant storm activity
(Woodrow et al., 1973; Heckel and Witzke, 1979;
Scotese et al., 1985; Woodrow, 1985; Witzke and
Heckel, 1988). This setting is consistent with sedi-
mentologic evidence of storm wave base in the basin
(e.g., Brett et al., 1986; McCollum, 1988; Prave et al.,
1996; Schieber, 1999). Numerous lines of evidence
suggest that climate cooled during the mid- to Late
Devonian (Scotese and McKerrow, 1990; Copper,
1986; Buggisch, 1991; Isaacson et al., 1997). This
trend is important insofar as it would have increased
seasonal differences in evaporation/precipitation and
surface-water temperature. In modern subtropical to
temperate oceans, the warm season is characterized by
a thin mixed layer and shallow thermocline (f 20–40
m). During the cool season, as the frequency and
intensity of mixing increases and water densities
change, the mixed layer can expand to depths of over
140 m, and depending on the relative temperatures of
the deep and surface layers, the thermocline may
dissipate altogether.
The importance of thermal stratification in the
marine oxygen budget has long been recognized
(e.g., Fleming and Revelle, 1939) and was recently
reviewed in a volume on continental shelf anoxia
(Tyson and Pearson, 1991). Because the Appalachian
basin was most likely at shelfal depths for much of
its history and had open connections to the global
Devonian ocean, the establishment and breakdown of
seasonal thermoclines should be considered as an
alternative to the conventional ‘‘nearly permanent’’
pycnocline model (Ettensohn, 1985a,b).
Fig. 4. Overview of data for Akzo and West Valley cores includes lithology (based on high-resolution core descriptions), TOC (dashed line
shows 1% level separating gray from dark gray and black mudstones), CaCO3, d13Corg, Ti/Al ratio (10-point moving average; black
arrows = decrease in Ti/Al associated with TOC increase; gray arrows = increase in Ti/Al associated with TOC decrease; white arrows = no
correlation), and interpreted relative sea-level curve. Lithostratigraphy and biostratigraphy follow Rickard (1975), House and Kirchgasser
(1993), Kirchgasser et al. (1994), Ver Straeten et al. (1994), and Klapper and Becker (1999); sea-level curve is based on combination of
lithofacies (House and Kirchgasser, 1993; Brett and Baird, 1996), trends in CaCO3 and Ti/Al, and regional stratigraphy (Fig. 3), and
includes labels for correlative eustatic events of Johnson and Sandberg (1988). Tectophases of Ettensohn (1985a,b) are shown next to sea-
level curve (note possible re-interpretation of Tectophase II initiation based on Ti/Al data), and are illustrated (facing page) in a series of
cross-sectional cartoons (based on Ver Straeten, Devonian paleogeographic map of New York State illustrates three major hypsometric
zones (terrestrial, shelfal, basinal), and highlights the interpreted expansion of the shelfal zone during relative sea-level fall and basin filling
(modified from Dennison, 1985; McGhee and Sutton, 1985); note correlation of positions ‘‘a’’ and ‘‘b’’ in tectophase cartoons and
paleogeographic map. N.F. = no fossils; US =Union Springs Member of Bakoven Formation; PY= Penn Yan Formation. Lithologic key
applies to Figs. 4–10.
B.B. Sageman et al. / Chemical Geology 195 (2003) 229–273236

3. Materials and proxy methods
The data presented herein include geochemical
analyses of samples from two cores drilled in west-
ern New York. Akzo core #9455 (donated by the
Akzo Nobel Salt) was drilled in the Genesee valley,
Livingston, NY, and includes the interval from the
Onondaga Limestone through the Rhinestreet Shale
(Figs. 3 and 4). West Valley core NX-1 (loaned for
sampling by the New York State Geological Survey)
was drilled some 50 miles west of the Akzo site, in
Cattaraugus, NY, and includes the interval from the
Rhinestreet Shale through the Dunkirk Formation
(Figs. 3 and 4). Together, these cores preserve a
pristine record of latest Eifelian through earliest
Famennian strata.
Each core was measured and described at mm- to
cm-scale for lithologic, sedimentologic, and paleon-
tologic observations (e.g., rock color, lithology, sedi-
mentary structures, ichnofabric and ichnotaxa, and
identifiable macrofossils). Subsamples for geochem-
istry and petrography were cut from the cores at 1-m
spacing throughout (Fig. 4), and at 10–20 cm
spacing in the intervals spanning black mudstones
(Figs. 5–10). Thin sections were analyzed using
standard petrographic techniques, and selected sec-
tions were examined under scanning electron micro-
scope for grain textures and surface features.
Selected subsamples were analyzed commercially
for organic petrography using standard methods of
maceral preparation and identification (Durand,
1980; Stach et al., 1982); point counting yielded
quantification of two major classes of identifiable
kerogen elements (macerals): (1) amorphous, fluo-
rescent liptinite–vitrinite, characteristic of algal-
derived OM, and (2) vitrinite–inertinite, a nonfluor-
escent, highly structured, optically opaque maceral
representing cellulose-rich, woody and herbaceous
materials derived from land plants.
Geochemical proxies for production, dilution, and
microbial decomposition are based on elemental and
isotopic data as explained in Fig. 2. More detailed
discussion of these proxy methods, as well as
descriptions of sample preparation and analytical
techniques for each method can be found in Murphy
et al. (2000a,b), Werne et al. (2002), and references
therein.
4. Results and discussion
One of the key contributions of the large geo-
chemical database developed in this project is the
establishment of proxy baselines against which rela-
tive trends can be assessed. Table 1 summarizes
values for the mean and one standard deviation of
proxy data in samples with TOC content less than 1
wt.%. These samples correspond to the gray shale
facies of Brett et al. (1991) interpreted to represent
deposition under normal marine, well-oxygenated
conditions, and thus represent ‘‘continental’’ values
for metals and other elements. Hereafter, these values
will be referred to as ‘‘GSM’’ (gray shale mean) or
‘‘1r-GSM’’ (one standard deviation of the gray shale
mean). In Figs. 5–10, proxy data are shown relative to
GSM with shading for 1r-GSM so that the extent of
Table 1
Gray shale mean (GSM) and one standard deviation for selected proxies in mudrock samples with %TOCV 1 (limestones excluded) from the
Akzo and West Valley cores, respectively
TOC CaCO3 Ti/Al Si/Al Mo V+Cr Mn d34S d13C Corg/
Ntot
Corg/
Ptot
Akzo Mean 0.5 13.63 0.045 3.14 0.22 203.6 419.1 � 9.05 � 29.1 6.6 25
r 0.18 15.3 0.0059 0.36 1.06 48.9 120.7 10.19 0.89
N 227 227 227 227 227 227 223 23 227
West Valley Mean 0.45 3.5 0.054 4.24 0.96 210.5 444.9 � 9.05 � 30.6 6.6 25
r 0.26 5.6 0.0081 1.28 2.35 58.5 152.5 10.19 0.58
N 141 141 141 141 141 141 138 23 17
Mean Corg/Ntot values for efficiently buried (gray shale) OM based on modern Redfield ratio. Mean Corg/Ptot based on averages from gray
mudstones with Corg/Porg =FRedfield (106). DOP values, where available, are shown with dysoxic–oxic boundary (0.45) and dysoxic–anoxic
boundary (0.75) based on Raiswell et al. (1988).
B.B. Sageman et al. / Chemical Geology 195 (2003) 229–273 237

anomalies from background continental or ‘‘oxic’’
conditions can be quantified and compared. Note that
baseline values are calculated separately for the Akzo
and West Valley cores. The difference in some mean
proxy values between the cores (in particular, CaCO3,
Ti/Al, Si/Al) is interpreted to reflect a secular shift in
dilution related to westward progradation of the Cats-
kill Delta complex.
4.1. Marcellus subgroup
The Marcellus subgroup (Ver Straeten et al., 1994)
conformably overlies the Seneca member of the
Onondaga Limestone in the study area and includes
(Fig. 5): the 30-cm Bakoven member of the Union
Springs Formation, a highly organic-rich, black cal-
careous mudstone–marlstone with interlaminated
skeletal lags composed of abundant styliolinids and
fragments of rhynchonellid brachiopods; the 10-cm
Hurley member, a medium gray concretionary,
micritic limestone horizon that is bioturbated and
contains abundant crinoid and styliolinid debris; and
four informal members of the Oatka Creek Forma-
tion. These informal members include (Fig. 5): (1)
the 35-cm bioclastic Cherry Valley Limestone, a
medium-gray packstone composed dominantly of
skeletal debris from styliolinids, corals, brachiopods,
and crinoids (incised into the Hurley member); (2)
the 170-cm Berne member, a medium dark gray,
organic-rich mudstone with poorly laminated to bur-
rowed horizons, styliolinid debris, and small brachio-
pods and bivalves; (3) the 45-cm Halihan Hill bed, a
highly bioturbated bioclastic limestone with abundant
styliolinids and macrofauna including brachiopods,
bryozoans, small bivalves and gastropods; and (4)
the f 9-m-thick unnamed member, a highly organic-
rich, laminated silty mudstone with scattered stylio-
linids and fish debris. The Marcellus subgroup is
overlain by the basal Stafford Limestone member and
dark gray mudstones of the Skaneateles Formation
(Figs. 4 and 5).
Framboidal and euhedral pyrite occur throughout
the laminated organic-rich facies, and the upper con-
tacts of limestones overlain by organic-rich mudstones
are commonly pyritized hardgrounds (Ver Straeten et
al., 1994). Most contacts in the Marcellus subgroup
are relatively sharp, but the boundary between the
Hurley member and the Cherry Valley Limestone is
quite irregular and shows evidence of incision.
Regional observations indicate an erosional uncon-
formity at this contact (Ver Straeten et al., 1994). The
biostratigraphy of the Marcellus subgroup is not very
well resolved (Ver Straeten et al., 1994); representa-
tives of late Eifelian and early Givetian conodont and
ammonoid biozones have been identified within the
interval (e.g., Klapper, 1971, 1981; House, 1981), but
the exact placement of the Eifelian–Givetian boun-
dary remains unclear. These observations reflect a
relative degree of conformity through the interval
(e.g., conodont biozones australis and kockelianus
are 0.6–0.7 my in duration according to the Tucker
et al., 1998 timescale, therefore the lacuna associated
with the Cherry Valley unconformity is probably
relatively small), but they also suggest significant
condensation.
The Oatka Creek Formation was recently described
and analyzed in detail by Werne et al. (2002), and the
Union Springs Formation was investigated by Mur-
phy (2000). As shown in Figs. 4 and 5, these two units
have the highest TOC content recorded in this entire
study, with values up to f 18%. At the time of
Marcellus subgroup deposition, the Akzo core site
was as much as 400 km from the eastern shoreline of
the basin (Dennison, 1985), and the depth of the basin
depocenter is estimated to have been in excess of 150
m by Ettensohn (1985a).
4.1.1. Dilution/condensation
The 10-point moving average of Ti/Al in Fig. 4
shows a distinctive decrease associated with Marcel-
lus subgroup black mudstones and a subsequent
increase in the overlying dark gray to gray mudrocks
of the Skaneateles Formation, suggesting that silici-
clastic sediment starvation is associated with OC
enrichment. The detailed data in Fig. 5 show that Ti/
Al ratios in most samples of the Marcellus subgroup
are below the GSM for the Akzo core, but there are
some notable exceptions. For example, the Cherry
Valley Limestone–Hurley member shows the highest
Ti/Al value recorded in the entire data set, which is
clearly the cause of the elevated values in the basal
points of the moving average calculation. The base of
the Cherry Valley Limestone is incised and has been
interpreted to reflect an unconformity formed during a
lowstand between the relative sea-level rise events
that deposited the Union Springs and Oatka Creek
B.B. Sageman et al. / Chemical Geology 195 (2003) 229–273238

Fig. 5. Data for the Marcellus subgroup
include proxies for dilution/condensation (Ti/
Al, Si/Al, and CaCO3 relative to TOC; also
shown are thin section photomicrographs
illustrating increased silt content associated
with TOC enrichment in unnamed member),
redox conditions and dominant microbial
processes (Mn, V+Cr, Mo, DOP, and d34Spyrrelative to TOC), and production/nutrient
cycling (d13Corg, Corg/Ntot, and Corg/Ptotrelative to TOC). Members of the Union
Springs and Oatka Creek formations are
indicated by abbreviations as follows: B—
Bakoven member; CV/H—Cherry Valley,
Hurley members; B—Berne member; H—
Halihan Hill member; U—unnamed member.
B.B.Sagem
anet
al./Chem
icalGeology195(2003)229–273
239

formations (i.e., between eustatic events Id and Ie,
Fig. 4).
Another characteristic that is inconsistent with the
bulk of observations in this study is the pattern of Ti/
Al within the unnamed member. Although the lowest
Ti/Al value in this interval coincides with a shift to
maximum TOC levels (where there are no changes
in lithology or sedimentary structures), Ti/Al values
do not remain low through this interval. An explan-
ation may be found in the Si/Al data. In contrast to
Ti/Al, the Si/Al ratio tracks TOC enrichment quite
well, showing significant increases above GSM in
the unnamed member, and some of the highest
values recorded in the study occur within the Bako-
ven member (Fig. 5). Observations of thin section
photomicrographs show dense concentrations of styl-
iolinids along laminae of the Bakoven member and
maximum silt concentrations occur in the zone of
maximum TOC of the unnamed member (Fig. 5).
SEM photomicrographs reveal these silt grains to be
subangular, and some show pitted surface textures,
suggesting eolian origin. Based on these observa-
tions, Werne et al. (2002) argued that the concen-
tration of eolian silt grains became enriched due to
decrease in the flux of non-eolian siliciclastic and
carbonate sediment. Therefore, maximum TOC
enrichment correlates with maximum sediment star-
vation. In addition to the quartz silt, grains bearing
Ti may also have been transported to the basin by
eolian processes (Bertrand et al., 1996), a factor that
could explain why Ti/Al does not remain at mini-
mum values through the zone of maximum TOC in
the unnamed member.
The high concentration of styliolinids in the
Bakoven member probably reflects the same mech-
anism, although their low abundance in the unnamed
member suggests significant differences between the
two units. Differential preservation of carbonate
might explain this relationship, but the scattered
styliolinids of the unnamed member do not show
signs of dissolution, and redox indicators (described
below) suggest conditions were similar during dep-
osition of the two units (both anoxic–sulfidic). An
alternate explanation is that ecological differences
prevented styliolinids from flourishing during depo-
sition of the unnamed member (styliolinids are
interpreted to represent protist zooplankton; Yochel-
son and Lindemann, 1986). The basinal depocenter
for the Bakoven member is much farther east than
that of the Oatka Creek Formation (Pepper and de
Witt, 1951). As a result, the Akzo site may have
been closer to the western peripheral bulge of the
basin and therefore shallower during Bakoven dep-
osition.
4.1.2. Decomposition/redox state
Although OC concentrations achieve peak values
in the intervals for which there is evidence of
maximum condensation, TOC levels are relatively
high throughout the Marcellus subgroup. The role
played by preservation in this high burial flux is
indicated by selected redox-sensitive elements. For
example, Mn concentrations are quite high in the
upper Onodaga Limestone (>1000 ppm), most likely
due to the preferential incorporation of Mn in the
carbonate lattice under oxic conditions. Mn values
fall to F 200 ppm throughout the Marcellus sub-
group, a level significantly below the GSM for Mn
(Fig. 5). This suggests that oxygen deficiency domi-
nated during Marcellus deposition. The degree of
oxygen deficiency is indicated by the remaining
proxies.
The V+Cr proxy is significantly elevated above
GSM in the Bakoven member and the zone of
maximum starvation of the unnamed member. It has
been suggested that enrichment in V +Cr could indi-
cate oscillation of redox conditions in the water
column and sediment through the zone of denitrifica-
tion (suboxic). The strong correlation of V +Cr with
indicators of condensation in the unnamed member
also suggests there may be a sedimentation effect.
However, the fact that V +Cr is even more enriched in
the Bakoven member, interpreted to have been depos-
ited further up the western ramp than in the basin
depocenter, may be consistent with the hypothesis of
oscillating redox conditions, since a shallower site
would have been subject to more frequent water
column disturbance.
DOP is elevated throughout the Marcellus sub-
group to levels suggesting lower dysoxic to anoxic
conditions (Raiswell et al., 1988), but again it is
difficult to separate the effects of sedimentation rate
from redox controls, especially since variations in the
overall high DOP values closely track the zones of
maximum starvation. The enrichment of Mo within
the Bakoven and unnamed members shows one of
B.B. Sageman et al. / Chemical Geology 195 (2003) 229–273240

the most marked deviations from GSM values, and
although condensation is also implicated in this
pattern, anoxic–sulfidic conditions are required for
Mo accumulation (e.g., Emerson and Huested, 1991;
Dean et al., 1999; Lyons et al., 2002, this volume).
This conclusion is confirmed finally by the d34Spyrdata, which show values depleted to <� 25xin the
Bakoven member and to almost � 40x in the
unnamed member, suggesting open system (water
column) pyrite formation (Lyons, 1997). Interest-
ingly, the maximum depletion in d34Spyr occurs as
TOC and Mo values are declining in the uppermost
samples of the unnamed member due to increased
bulk sedimentation.
4.1.3. Production/nutrient cycling
Petrographic analysis of preserved OM in one
sample of Marcellus subgroup black mudstones
indicated 100% amorphous marine material among
the macerals with trace palynomorphs as accessories.
Organic compound analyses of the distributions and
relative abundances of short- (15, 17, and 19 car-
bons) and long-chain (27, 29, and 31 carbons) n-
alkanes in the Seneca, Bakoven, Hurley–Cherry
Valley, and lowermost Berne members indicate that
short alkanes are consistently an order of magnitude
more abundant than long ones in organic-rich facies;
the reverse is true for the carbonate facies (Murphy,
2000). These observations, suggesting increased ter-
restrial organic matter supply to the basin during
limestone deposition and algal predominance over
terrestrial input in the preserved organic matter of the
black mudstone facies, are consistent with the inter-
preted sea-level history (Fig. 4). Because organic
matter input during mudstone deposition was pre-
dominantly derived from marine phytoplankton, it is
assumed its original elemental composition approxi-
mated the marine Redfield ratio (Redfield et al.,
1963).
With the exception of a few samples in the
Hurley–Cherry Valley carbonates, the carbon iso-
topic composition of bulk organic matter varies by
1xor less around a mean value of � 30xthrough-
out the Marcellus subgroup and shows no trend that
is correlative with other proxies (Fig. 5). This mean
value is slightly depleted relative to GSM for d13Corg
in the Akzo core (� 29.1x), but the GSM value is
clearly influenced by samples overlying the Hamilton
Group, as well as those of the Moscow Formation,
which are relatively enriched in 13C (Fig. 4). In fact,
despite high-frequency variability associated with
facies changes, the average value of d13Corg for
mudstones in the lower Hamilton Group (Marcellus
subgroup and Skaneateles Formation) does not show
a major secular trend. Although the range of sample-
to-sample variation increases markedly in the units
overlying the Oatka Creek Formation (Fig. 4), the C-
isotope composition of organic matter in Marcellus
subgroup black mudstones is essentially identical
within error.
The ratio of carbon to nitrogen (Corg/Ntot) in OM
is quite high in the limestone facies (>200), which is
consistent with a higher proportion of terrestrial OM
and/or extensive decomposition of more labile
marine OM. Average Corg/Ntot values in the black
mudstones range between 30 and 50, with the high-
est values corresponding to the zones of maximum
TOC enrichment. These values are five to seven
times greater than the Redfield ratio. Within the
unnamed member, Corg/Ntot correlates well with
TOC, V +Cr, and Mo. The ratio of TOC to total
phosphorous (Corg/Ptot) is used rather than Corg/Porg(Van Cappellen and Ingall, 1994) because reminer-
alized P is not necessarily released to the overlying
water column, but may instead become immobilized
in sediments in inorganic form (e.g., Fillipelli, 1997).
Thus, the Corg/Ptot ratio provides a conservative
estimate of remineralized P. It shows a pattern of
enrichment similar to Corg/Ntot in the black mudstone
facies, with values in excess of 1500 in the Bakoven
and levels of over 200 in the unnamed member.
According to Table 1, the GSM for Corg/Ptot is f 25.
This value is derived as follows: OM in gray mud-
stones was probably relatively rapidly buried and
thus likely experienced the lowest levels of P remi-
neralization (a test of H/C ratios confirmed this,
showing greater H-richness in gray mudstone sam-
ples). Therefore, it is likely that the Corg/Porg values
of gray mudstones reflect the most well-preserved
primary organic matter in the study. The Corg/Porg of
such samples is almost identical to the Redfield
value (F 106), and the corresponding value for
Corg/Ptot in these samples is f 25. Values of Corg/
Ptot in the unnamed member are approximately 10
times greater than this value, and 60–70 times
higher in the Bakoven.
B.B. Sageman et al. / Chemical Geology 195 (2003) 229–273 241

4.1.4. Summary
The entire Marcellus subgroup appears to be
condensed relative to gray mudstone in the Akzo
core. The close correspondence between maximum
TOC enrichment and evidence for maximum starva-
tion without any other changes in lithology in the
core of the unnamed member suggest that this zone
represents the maximum flooding surface of sea-level
rise event Ie (Johnson and Sandberg, 1988). Thus,
the decrease in bulk sedimentation (including the
complete shut down of carbonate) probably played
a significant role in TOC enrichment (Werne et al.,
2002). The degree to which excess Si in the zone
of maximum TOC enrichment is attributable to bio-
genic production (i.e., Schieber et al., 2000) is not
known, although observations thus far suggest that
eolian silt is a significant factor. Although C/N/P
elemental data suggest decompositional release of
nutrients from OM, there is no isotopic evidence
for enhanced production in the Marcellus subgroup
black mudstones. The redox-sensitive proxies, how-
ever, indicate that anoxic conditions dominated dur-
ing deposition of the Marcellus subgroup, with
euxinic conditions a common occurrence in the
Bakoven member and unnamed member of the Oatka
Creek Formation.
4.2. Geneseo Formation
The Geneseo Formation is an approximately 8-m-
thick black, finely laminated, organic-rich, mudrock
with several marlstone beds in the upper half (Fig. 6).
It is similar in its general lithic and faunal character
to the black mudstones of the Marcellus subgroup.
Unlike the Marcellus, however, it is slightly calca-
reous throughout and does not achieve even half the
TOC values seen in the Bakoven member or Oatka
Creek Formation. Two peaks in TOC content to
about 6% in the lower and upper parts of the unit
are separated by a zone of increased carbonate
content with two marlstone beds. The mudrocks
contain common styliolinids and scattered thin Leio-
rhynchus shells, as well as euhedral and framboidal
pyrite.
In the region from the Genesee Valley to the west,
the Geneseo Formation is underlain by gray mud-
stones of the Windom member, Moscow Formation,
and overlain by gray mudstones of the Penn Yan
Formation. At the Windom–Geneseo contact, there is
a major unconformity represented by the Leicester
Pyrite, a F 10-cm-thick reworked lag deposit of
pyritized skeletal fragments and burrow casts (Brett
and Baird, 1996). To the east this unconformity
expands to include the Tully Limestone, which
represents carbonate platform deposition at the end
of Tectophase II (Fig. 4). Following Tully deposition,
the Geneseo Formation was deposited during the
Taghanic sea-level rise (event IIa, Fig. 4) that ini-
tiated Tectophase III and is therefore analogous to the
Marcellus subgroup in the Ettensohn (1985a,b) tec-
tono-stratigraphic model. At the time of deposition,
the Akzo core site was at least 250 km from the
eastern shoreline (Brett and Baird, 1996), and water
depths are estimated to have been over 200 m
(Ettensohn, 1985a). The Geneseo corresponds to the
disparalis biozone; based on both conodont and
goniatite biostratigraphy (Kirchgasser et al., 1994)
the Givetian–Frasnian stage boundary is placed at
the upper contact. According to the recent Tucker et
al. (1998) timescale, the Geneseo represents f 1 my
of deposition. The Geneseo Formation was recently
described and analyzed in detail by Murphy et al.
(2000b).
4.2.1. Dilution/condensation
The long-term trend in Ti/Al shows a minimum
value in the upper Windom member and then a
secular increase in Ti relative to Al across the Give-
tian–Frasnian boundary and through the Genesee
Group (Fig. 4). This increase is interrupted at the
base of the Geneseo, where Ti/Al values drop before
continuing to rise. The detailed data in Fig. 6 show
that Ti/Al is below GSM for the Akzo core through
most of the Geneseo, has a weakly inverse relation-
ship with %TOC, and gradually rises above the GSM
by the end of Geneseo deposition. With the exception
of the mid-Geneseo, the Si/Al ratio tracks the long-
term trend in Ti/Al. For example, Si/Al data show an
increase from below GSM in the lower Geneseo to
anomalously high values in association with mid-
Geneseo marls (Fig. 6). Ratios of Si/Al return to sub-
GSM levels in the upper part of the unit before they
resume tracking the rise in Ti/Al in the lower Penn
Yan Formation. Thin section photomicrographs con-
firm the presence of quartz silt in the middle Gen-
seso, but unlike the Marcellus subgroup, this zone is
B.B. Sageman et al. / Chemical Geology 195 (2003) 229–273242

Fig. 6. Data for the Geneseo Forma-
tion include proxies for dilution/con-
densation (Ti/Al, Si/Al, and CaCO3
relative to TOC; also shown are thin
section photomicrographs illustrating
increased silt content associated with
TOC enrichment), redox conditions
and dominant microbial processes
(Mn, V +Cr, Mo, DOP, and d34Spyrrelative to TOC), and production/
nutrient cycling (d13Corg, Corg/Ntot,
and Corg/Ptot relative to TOC).
B.B.Sagem
anet
al./Chem
icalGeology195(2003)229–273
243

characterized by a decrease in %TOC rather than an
increase. Carbonate appears to act as a minor dilutant
in the upper half of the Geneseo, where it varies
antithetically with %TOC.
4.2.2. Decomposition/redox state
Concentrations of redox-sensitive proxies suggest
oxygen deficiency during deposition of the Geneseo
Formation, but to a much lesser degree than the
Marcellus subgroup. For example, Mn concentrations
are below GSM through most of the interval shown
in Fig. 6 (with the exception of burrowed marlstone
beds), but they only rarely exceed the range of
1r-GSM. If depletion in Mn is a function of duration
of anoxia (Calvert and Pedersen, 1996), these data
suggest that anoxic conditions were relatively short-
lived. Levels of V +Cr are slightly above GSM in
the upper Windom and lower Geneseo, but show
marked enrichment in association with the zones of
maximum TOC (Fig. 6), where they vary antitheti-
cally with Mn. A similar pattern of enrichment is
seen in the Mo data but the maximum values aref 30 ppm (f 10 times less than maximum Mo
values in the Marcellus subgroup). Values for DOP
are consistently lower than the 0.45 level, suggesting
pervasively oxic conditions or rapid siliciclastic sed-
imentation under euxinic conditions. Although pyrite
sulfur isotope values are depleted in the Geneseo
relative to the Windom member, no measured values
exceeded 1r-GSM for d34Spyr. Together, these data
indicate that anoxic–sulfidic conditions did occur
during Geneseo deposition but with much lower
frequency and/or duration than during Marcellus
time. The mean condition was probably closer to
suboxic.
4.2.3. Production/nutrient cycling
Petrographic analysis of preserved OM in a sample
of Geneseo black mudstones indicated 100% amor-
phous kerogen in the macerals with trace palyno-
morph accessories, suggesting dominance of marine
OM. Similar analyses of Moscow and Penn Yan gray
mudstones showed 95% amorphous kerogen with
about 5% structured woody material in the macerals.
Molecular analyses of the distribution/relative abun-
dance of n-alkanes provide supporting data for dis-
tinguishing terrestrial and marine contributions. The
combined abundances of C17 and C19 (normalized to
total lipid extract) are assumed to represent the
‘‘marine’’ fraction compared to the combined, nor-
malized abundances of C27 and C29, assumed to
represent the ‘‘terrigenous’’ fraction (Murphy, 2000).
In the Geneseo black mudstones, there is a decrease in
the terrestrial fraction, but more significant is the
approximate 100% increase in the marine fraction
(Murphy et al., 2000b). Thus, at the Akzo location,
OM in both gray and black facies is most likely
dominantly sourced from marine photoautotrophs,
but there appears to have been a relative increase in
the marine OM flux during Geneseo black mudstone
deposition.
Among the most distinctive features of the Gene-
seo data set is the f 2xdepletion in d13Corg values
from about � 28xto � 30xassociated with or-
ganic carbon accumulation (Fig. 6). This depletion
appears to begin in the uppermost Windom and
continues through most of the Geneseo Formation
until values shift back to � 28xin the Penn Yan
Formation. The Geneseo is also characterized by
significant shifts in the burial ratios of C/N/P. As
shown in Fig. 6, Corg/Ntot shows a pattern very similar
to that of %TOC, with values rising from Redfield
levels of f 6 to f 30 in the lower and upper
organic-rich zones (at least a fourfold increase). The
pattern of Corg/Ptot is also correlated with changes in
TOC but shows enrichment from Redfield equivalent
levels of 25 to >300 (over 10 times Redfield level).
Because of arguments discussed above showing that
terrestrial OM did not increase in the organic-rich
units, increase in the Corg/Ntot ratio must reflect
elemental fractionation during pre-burial decomposi-
tion and early diagenesis.
4.2.4. Summary
Multi-proxy data for the black mudstones of the
Geneseo Formation differ significantly from those of
the Marcellus subgroup. Levels of TOC are enriched
well above GSM, but are much lower than those of
the Marcellus. Like the Oatka Creek Formation
(Werne et al., 2002), there is little evidence of bio-
turbation in the Geneseo mudstones and only a sparse
benthic fauna (cf. Thompson and Newton, 1987),
but the geochemical evidence does not indicate
euxinic depositional conditions. The critical question
is whether these two intervals are analogous, as
suggested by the Tectophase model.
B.B. Sageman et al. / Chemical Geology 195 (2003) 229–273244

Fig. 7. Data for the Middlesex Formation
include proxies for dilution/condensation (Ti/
Al, Si/Al, and CaCO3 relative to TOC), redox
conditions and dominant microbial processes
(Mn, V +Cr, Mo, DOP, and d34Spyr relative toTOC), and production/nutrient cycling
(d13Corg, Corg/Ntot, and Corg/Ptot relative to
TOC).
B.B.Sagem
anet
al./Chem
icalGeology195(2003)229–273
245

The first major difference between the Marcellus
and the Geneseo manifests in sedimentation proxies.
The general correspondence of decreased Ti/Al with
increased TOC observed in most black shales in the
study interval (Fig. 4) argues for a condensation
effect in OM accumulation. However, there are
nuances in the Ti/Al data. For example, the data in
Fig. 6 show a correspondence between minimum Ti/
Al levels and the initiation of enhanced OM accu-
mulation at the base of the Geneseo Formation. Yet
the record in Fig. 4 indicates that this pattern is a
short-term fluctuation in a longer-term trend of
increasing Ti/Al that actually begins in the Moscow
Formation. Although short-term trends in Ti/Al
appear to be consistent with a condensation interpre-
tation, the longer-term trends need to be addressed:
why does Ti/Al ratio reach its absolute minimum in
the Moscow Formation, a late highstand (Brett and
Baird, 1996) where one would expect siliciclastic
flux to be highest, and then show an overall increase
across the transition from Tectophase II to III which
represents a major transgression? We address this
question below in Section 5.
The interpretation of Si/Al ratio is another differ-
ence between the Marcellus and the Geneseo inter-
vals. In the middle part of the Geneseo Formation, Si/
Al increases to levels above 1r-GSM, as it does in
the unnamed member of the Oatka Creek Formation,
but rather than correlating with a shift to maximum
TOC values, there is a marked decrease in TOC (Fig.
6). At the onset of this Si/Al increase and TOC
decrease, there is a small spike in the Ti/Al ratio
followed by a return to values below 1r-GSM. The
Ti/Al decrease is concomitant with a rise in CaCO3
values (Fig. 6), and is followed by a gradual increase
in Ti/Al through the remainder of the unit (corre-
sponding to basinward progradation of the shoreline).
Increase in CaCO3 levels was not observed in asso-
ciation with increased Si/Al in the Marcellus; how-
ever, a thin section photomicrograph from within the
zone of elevated Si/Al shows an increase in the quartz
silt fraction, just like the unnamed member of the
Oatka Creek Formation. A possible explanation for
the CaCO3 and TOC trends is closer proximity to the
western carbonate shelf during Geneseo deposition,
resulting in a greater potential flux of CaCO3 to the
basin, and thus dilution of TOC by carbonate in the
condensed beds of the maximum flooding interval. If
the increase in Si/Al was due to excess biogenic Si as
a result of a major increase in production (or a shift in
community composition) at this time, one might also
expect TOC levels to rise.
The final factor that differs markedly in the
Geneseo data set manifest in the d13Corg data. While
there is no clear trend exceeding 1r-GSM for bulk
d13Corg through the Marcellus subgroup, there is a
definite negative shift of f 2xassociated with OC
burial in the Geneseo Formation (Fig. 6). Murphy et
al. (2000b) explained this shift as a consequence of
mixing isotopically light respired CO2(aq) into surface
waters during seasonal mixing events (e.g., Saelen
et al., 1998).
4.3. Middlesex, Rhinestreet, Pipe Creek, and Hanover
formations
In the interval overlying the Geneseo Formation,
there are four distinct zones of OC enrichment with
characteristics that are similar to one another and
distinct from both the Geneseo and Marcellus black
mudstones. In the interest of brevity, the proxy data
for these Frasnian units will be presented as a group
with attention drawn to similarities and differences
among them that are instructive to this study.
The Middlesex Formation (Figs. 4 and 7) is an
approximately 5-m-thick interval of interlaminated
dark gray and brownish-black noncalcareous mud-
stone that marks the base of the Sonyea Group and
is the first of the Frasnian organic-rich units in western
New York (e.g., Rickard, 1975). In general, it is not as
organic-rich as the units previously discussed, with
average TOC levels of about 3 wt.%. However, there
are several thin intervals at the base and top of the unit
in which TOC levels rise to 4–6 wt.% (Fig. 7). In
western New York, the Middlesex is underlain by the
West River Formation—a dominantly medium gray,
organic-poor, noncalcareous mudstone containing rare
styliolinids and bivalvesUand overlain by the Cash-
aqua Formation—a greenish-gray claystone with
some slightly calcareous intervals and abundant pyri-
tized burrow casts. The goniatite and conodont bio-
stratigraphy for this interval is presented in House and
Kirchgasser (1993). Middlesex deposition is thought
to have occurred during relative sea-level rise (House
and Kirchgasser, 1993) and thus represents deeper
water deposition than the over- and underlying strata
B.B. Sageman et al. / Chemical Geology 195 (2003) 229–273246

Fig. 8. Data for the Rhinestreet Formation
include proxies for dilution/condensation
(Ti/Al, Si/Al, and CaCO3 relative to TOC),
redox conditions and dominant microbial
processes (Mn, V + Cr, Mo, DOP, and
d34Spyr relative to TOC), and production/
nutrient cycling (d13Corg, Corg/Ntot, and Corg/
Ptot relative to TOC).
B.B.Sagem
anet
al./Chem
icalGeology195(2003)229–273
247

Fig. 9. Data for the Pipe Creek Formation
include proxies for dilution/condensation
(Ti/Al, Si/Al, and CaCO3 relative to TOC),
redox conditions and dominant microbial
processes (Mn, V + Cr, Mo, DOP, and
d34Spyr relative to TOC), and production/
nutrient cycling (d13Corg, Corg/Ntot, and Corg/
Ptot relative to TOC).
B.B.Sagem
anet
al./Chem
icalGeology195(2003)229–273
248

of the Cashaqua (Sonyea Group) and West River
(Genesee Group) formations.
The Rhinestreet Formation in the study area is a
lithologically complex interval, about 25 m thick,
including mainly interbedded brownish-black, non-
calcareous, laminated mudstone and silty, gray mud-
stone (Figs. 4 and 8). Organic carbon levels are lower
than in any of the units discussed thus far (average
1.8–2.0%; maximum 3.5%), yet they are signifi-
cantly enriched above 1r-GSM. The Rhinestreet is
the basal formation of the middle Frasnian West Falls
Group in western New York (Rickard, 1975) and is
underlain by the upper Cashaqua Formation—a
slightly calcareous, medium gray to greenish-gray
claystone, and overlain by the Gardeau Forma-
tion—a silty, medium gray mudstone. In the Akzo
core, the Rhinestreet Formation is not formally sub-
divided as it is in central New York, where four
distinct black shale tongues have been defined (the
Moreland, Dunn Hill, Roricks Glen, and Corning
members; McGhee and Sutton, 1985). It is likely,
however, that the four intervals of maximum %TOC
identified in the Akzo core (Fig. 8) correspond to
these black shale members. The goniatite and con-
odont biostratigraphy for this interval is presented in
House and Kirchgasser (1993). The Rhinestreet For-
mation is thought to represent deposition during
transgression to highstand (House and Kirchgasser,
1993) and thus was deposited in waters deeper than
either the underlying Cashaqua Formation (Sonyea
Group) or the overlying Gardeau Formation (West
Falls Group). However, maximum Rhinestreet sea-
level is interpreted to have been lower than that of
underlying Middlesex and Geneseo black shales
(Ettensohn, 1985a,b). The member-level fluctuations
in the Rhinestreet Formation between black shale and
gray silty facies were interpreted by Ettensohn
(1985b) to represent the interplay of high-frequency
sea-level oscillations and cycles of uplift and erosion
in the Acadian highlands, which together produced a
series of relatively low-duration, alternating episodes
of basinal sediment starvation and active prograda-
tion of the deltaic complex.
Two additional conspicuous, regionally extensive
organic-rich units in the study interval are the Pipe
Creek and Dunkirk formations (Figs. 3 and 4). The
interval containing these units includes the Frasnian–
Famennian stage boundary, as defined by conodont
biostratigraphy (Over, 1997). This boundary lies
within organic-rich beds of the upper Hanover For-
mation rather than in the Dunkirk Formation. Based
on distinctive positive shifts in the d13Corg record,
Murphy et al. (2000c) established that the Pipe Creek
and upper Hanover intervals represent the North
American expression of the well-known European
Kellwasser events associated with the Frasnian–
Famennian (F–F) mass extinction. Thus, detailed
sampling was focused on the upper Hanover interval
rather than the Dunkirk Formation.
The interval containing the lower Kellwasser Hori-
zon spans, in stratigraphic ascent, the fine-grained
sandstone of the uppermost Nunda Formation, the
laminated black mudstone of the Pipe Creek Forma-
tion, and the silty, greenish-gray mudstone of the
lowermost Hanover Formation (Fig. 9). TOC content
rises from < 1 wt.% in the Nunda to an average
off 4 wt.% in the Pipe Creek, and then falls back to
< 1 wt.% in the Hanover. The upper Kellwasser
Horizon spans lithologic transitions between silty
greenish-gray mudstone and laminated black mud-
stone in the upper Hanover Formation (Fig. 10).
Concentrations of TOC increase from near-zero to
an average of f 3 wt.% in the upper Kellwasser
black mudstone, dropping back to an average of < 1
wt.% above the stage boundary. Goniatite and con-
odont biostratigraphy for these two units are pre-
sented in House and Kirchgasser (1993) and Over
(1997).
The overall depositional architecture of the Fras-
nian through the lowermost Famennian section
reflects basinward progradation of the Catskill Delta
complex (Fig. 3). The relative deepening events that
led to deposition of organic-rich units have been
interpreted to result from renewed tectonic activity
in the Acadian orogen, resulting in foreland basin
subsidence that temporarily interrupted clastic infill-
ing of the basin (tectophase model: Ettensohn,
1985a,b). It has been suggested, however, that only
two intervals in the Devonian stratigraphic succes-
sion of the Appalachian basin show strong evidence
of peripheral bulge uplift (the Wallbridge and
Taghanic unconformities) indicating lithospheric flex-
ure related to foreland subsidence (Hamilton-Smith,
1993), and only one of these (the Taghanic) corre-
sponds to a black shale in the study interval. Every
major black shale discussed herein does, however,
B.B. Sageman et al. / Chemical Geology 195 (2003) 229–273 249

Fig. 10. Data for the upper Hanover
Formation include proxies for dilution/con-
densation (Ti/Al, Si/Al, and CaCO3 relative
to TOC), redox conditions and dominant
microbial processes (Mn, V +Cr, Mo, DOP,
and d34Spyr relative to TOC), and produc-
tion/nutrient cycling (d13Corg, Corg/Ntot, and
Corg/Ptot relative to TOC).
B.B.Sagem
anet
al./Chem
icalGeology195(2003)229–273
250

correspond with a proposed eustatic rise based on
study of other sedimentary successions (Johnson and
Sandberg, 1988). Subsidence of the foreland basin
was clearly essential for accommodation of the basin
fill, and although it is impossible to precisely quan-
tify the relative contributions of tectonic and eustatic
mechanisms to the rate of change in accommodation
during each event of organic-rich deposition, the
continuous westward shift of the depocenter during
the Frasnian suggests a diminished role for tectonic
subsidence during this time.
4.3.1. Dilution/condensation
Several factors suggest increasing dilution in the
Frasnian section. Among the geological observations
for this are the increased thickness of gray shales
(Cashaqua, Angola, Hanover formations), the appear-
ance of silty to sandy facies (e.g., Nunda Formation),
and the westward migration of the shoreline (Denni-
son, 1985). Geochemical data also reflect higher
detrital input. With the exception of one concretion-
ary carbonate horizon in the Middlesex Formation,
CaCO3 values fall to less than 10% in most Frasnian
units, with a GSM of 3.5% in the West Valley core (a
74% decrease from Akzo GSM for CaCO3). Coinci-
dentally, GSM values for Ti/Al and Si/Al increase by
17% and 26%, respectively, between the Akzo and
West Valley cores (although the West Valley location
is farther west, the progradation of the depositional
system would have likely made the two localities
quite similar in terms of transport distance from
shore). As in the Marcellus and Geneseo formations,
the detailed data in Figs. 7–10 show a decrease in
Ti/Al to below 1r-GSM associated with the onset
of each organic-rich interval. The pattern is even
better illustrated in the 10-point moving average plot
(Fig. 4), where clear decreases in Ti/Al precede each
black mudstone interval, and increased Ti/Al is asso-
ciated with subsequent gray mudstone deposition in
most cases. These data suggest that relative conden-
sation continues to play a role in the accumulation
of OM.
With the exception of the Middlesex Formation,
Si/Al ratios display a pattern opposite to the Marcel-
lus and Geneseo formations (Figs. 7–10). In the
Middlesex, Si/Al values exceed 1r-GSM, and this
increase (to 4.5, a value similar to Oatka Creek)
parallels an increase in TOC content. In the overlying
organic-rich units, Si/Al values decrease to GSM or
fall below 1r-GSM in association with organic-rich
deposition (Figs. 8–10). This pattern could either
reflect decreased sensitivity of the Si/Al proxy under
conditions of net increase in detrital flux, a secular
decrease in the background eolian Si flux due to a
change in climate (cooler? wetter?), or a major
change in the contribution of biogenic Si during
Frasnian black mudstone deposition.
4.3.2. Decomposition/redox state
Redox-sensitive proxies in Frasnian organic-rich
units generally show patterns similar to those of the
Geneseo Formation. For example, Mn values con-
sistently fall to levels below 1r-GSM in association
with increased TOC content and increase in adjacent
gray mudstones. Evidence for significant oscillation
in redox conditions, which might allow for enhanced
precipitation of Mn, is suggested by the peak value
of almost 1200 ppm immediately overlying the F–F
black mudstones in the upper Hanover interval (Fig.
10); the concomitant increase in CaCO3 suggests that
Mn was deposited as Mn-carbonate. The V +Cr
proxy shows enrichment to levels above 1r-GSMin association with increased TOC in the Middlesex
and Rhinestreet formations. There is no obvious
V+Cr trend in the Pipe Creek Formation, but the
data in the upper Hanover interval again suggest high
frequency oscillations (Fig. 10). Molybdenum is
enriched to Geneseo-like levels (15–30 ppm) in
samples of the Frasnian black mudstone, but on
average, Mo levels are only slightly enriched above
1r-GSM. Interestingly, maxima in V+Cr appear to
lag behind maxima for Mo content by in the Mid-
dlesex and Rhinestreet. Lastly, d34Spyr values in the
Frasnian black mudstone show slight depletion rela-
tive to GSM but are generally within 1r-GSM.
Together, these data favor nitrate reduction over
sulfate reduction as the dominant anaerobic metabo-
lism, suggesting prevalence of dysoxic conditions
during black mudstone deposition.
4.3.3. Production/nutrient cycling
Petrographic analysis of preserved OM in samples
from Middlesex, Rhinestreet, Pipe Creek, and upper
Hanover black mudstones indicates 95% amorphous
kerogen with trace palynomorphs and acritarchs and
5% herbaceous structured material. Samples from
B.B. Sageman et al. / Chemical Geology 195 (2003) 229–273 251

adjacent gray mudstones were generally identical to
the black facies, although two samples from Hanover
gray mudstones had OM constituents that were 90%
amorphous, 5% herbaceous, and 5% woody. Overall,
Frasnian mudstones are characterized by continued
dominance of marine OM.
Perhaps the most significant differences between
the Frasnian organic-rich units and those of the Gen-
eseo and Marcellus are the positive excursions in
d13Corg that characterize events of enhanced OM
burial. In the Middlesex Formation, the C-isotope shift
is about 1x. This shift is associated with increases in
the Corg/Ntot and Corg/Ptot ratios up to maximum values
of 3� and 10� (Redfield) background, respectively.
In the Rhinestreet Formation, a positive shift in d13Corg
of over 1xis followed by a negative shift of about
2x, then another positive shift of at least 3x(Fig. 8).
Organic-rich intervals in the Rhinestreet also show
correlative increases in Corg/Ntot and Corg/Ptot ratios
that reach maximum values of 7–9� and 6–10�(Redfield) background, respectively. Comparing these
two intervals, the major difference appears to be the
trend toward isotopic depletion and a greater increase
in Corg/Ntot in the Rhinestreet Formation.
In association with the lower and upper Kellwasser
horizons, there are positive d13Corg shifts of at least
4x(Figs. 4, 9, and 10). These events exceed the
range of any other isotopic shifts recorded in this
study. Associated with each are increases in Corg/Ntot
and Corg/Ptot ratios. In the Pipe Creek Formation, the
maximum values are about 6� and 15� (Redfield)
background, respectively, and in the upper Hanover
Formation, they are about 4.5� and 16�, respec-
tively. Like the Middlesex and Rhinestreet formations,
the changes in Corg/Ntot and Corg/Ptot ratios track the
increases in %TOC quite closely.
4.3.4. Summary
Frasnian organic-rich mudstones differ in several
important respects from those of the Marcellus and
Geneseo formations. Even though it appears that
OM accumulation was initiated by, or associated
with, siliciclastic sediment starvation as before, the
evidence suggests that detrital flux was generally
higher than during deposition of the underlying
organic-rich units. This relationship may account
for lower average TOC levels in Frasnian black
mudstones. Indicators of increased dilution, as well
as redox-sensitive proxies that suggest a relatively
low frequency and/or duration of anoxic conditions
favorable to OM preservation (i.e., Hartnett et al.,
1998), suggest that enhanced production may have
contributed significantly to the formation of the
organic-rich strata. Evidence supporting this conclu-
sion may be found in the positive excursions in
d13Corg that occur in association with Frasnian black
mudstone units.
5. Summary and conclusions
Devonian organic-rich deposits have played an
influential part in the long history of black shale
studies. Throughout this history, the cause of OM
burial in the Appalachian foreland basin has been
attributed to enhanced preservation under anoxic
conditions due to long-term stability of a pycnocline
within a relatively deep water column (Pompeckj,
1901; Twenhofel, 1915; Byers, 1977; Ettensohn,
1985a,b; Ettensohn and Barron, 1981; Potter et al.,
1982; Brett et al., 1991; Kepferle, 1993). In recent
years, however, evidence has accumulated that does
not support this interpretation (e.g., Pashin and
Ettensohn, 1991; Schieber, 1999; Murphy et al.,
2000a,b), suggesting a need to reassess the dominant
paradigm. Initially stimulated by the unconventional
conclusions of Kauffman (1981) on the Jurassic
Posidoneinschiefer, this challenge to the ‘‘stagnant
basin’’ model has been repeated in numerous studies
of ancient (e.g., Sageman, 1985; Wignall and Hallam,
1991; Oschmann, 1991) and modern (Pedersen and
Calvert, 1990) organic-rich sedimentation.
The conventional stagnant basin model has re-
flected, in part, a lack of detailed information from
individual organic-rich units. However, the detailed
data presented herein show a systematic range of
variations, with three main types of black mudstones
identified based on the following characteristics: (1)
maximum TOC levels, strong evidence for frequent
sulfide in the water column, and no preferential
change in d13Corg (Marcellus); (2) moderate TOC
levels, evidence for infrequent sulfide in the water
column, and a distinct negative shift in d13Corg
(Geneseo); and (3) low to moderate TOC concen-
trations, evidence for infrequent sulfide in the water
column, and distinct positive shifts in d13Corg (Mid-
B.B. Sageman et al. / Chemical Geology 195 (2003) 229–273252

dlesex–Hanover). The succession of changes in these
mudstones tracks a long-term trend in basin evolu-
tion, the progradation of the Catskill delta, and thus
suggests that dilution was a predominant control on
OC burial flux.
5.1. Dilution/condensation
The regional geologic data (Fig. 3) indicate that
deposition of each black mudstone was associated
with shoreline transgression (Rickard, 1975). These
data also confirm the progressive basinward progra-
dation resulting from filling of the foreland (Fig. 3).
This observation suggests gradual eustatic fall,
decaying subsidence of the foreland basin, or a
combination of both. Regardless of the cause, relative
sea-level shallowed through time as the flux of
detrital material to the basin increased (note that the
lithofacies baselines in the plot for ‘‘Relative Sea-
level’’ in Fig. 4 are slanted, reflecting this long-term
trend; in addition, dashed lines that diverge from
lithofacies patterns are based on the Ti/Al curve; see
discussion below). This conclusion is supported by
observed changes in detrital or detrital-influenced
elements. For example, average CaCO3 content
decreases markedly above the Genesee Group (Fig.
4), whereas average Ti and Si contents increase from
the Akzo to the West Valley cores (Table 1; note that
the average value for %Al is identical between the
two cores). The Ti/Al ratio was employed as a key
proxy for detrital input in this study based on the
bulk of our observations. However, before the major
interpretations are discussed, some explanation of the
Ti/Al proxy is needed.
In most pelagic marine sediments, the source of
excess Ti is interpreted to be predominantly eolian
(Boyle, 1983; Schimmield, 1992; Bertrand et al.,
1996). Accordingly, trends of increased Ti/Al (and
decreased Si/Al) in organic-rich intervals have been
noted in some studies (Caplan and Bustin, 1996;
Wortmann et al., 1999). In our study, comparison of
petrographic data, Si/Al ratio, and trends in Ti/Al
did not support the conclusion of eolian flux as
the sole source of Ti-bearing grains in the Appa-
lachian basin. Although it is possible that the
Si/Al enrichment may reflect a biogenic source
(Schieber et al., 2000), and the absence of a
sustained minimum of Ti/Al in the unit most likely
to represent maximum condensation (Marcellus)
could imply an added source of eolian Ti, for the
most part trends in Ti/Al match the regional strati-
graphic trends mentioned above. It seems probable,
given Schieber’s (1999) interpretation that a signifi-
cant portion of fine-grained transport to the distal
basin occurs by gravity flows, that supply of
heavier mineral grains derived from fluvial sources
would vary in proportion to their abundance and
basinward delivery on the adjacent shelf. Thus,
increased Ti concentration relative to background
Al would reflect relative sea-level fall and progra-
dation and vice versa.
A further window into the controls on Ti supply to
the basin is suggested by the apparently anomalous
pattern of Ti/Al across the transition from Tectophase
II to III (Fig. 4). Ti/Al reaches a minimum value in
the Moscow Formation, and then increases across the
Taghanic unconformity and through the Genesee
Group showing relatively little association to major
facies changes (although there is a small decrease at
the onset of Geneseo deposition). A possible explan-
ation for this is that the lowest secular Ti/Al values
correspond to the last phase of tectonic quiescence,
when topographic gradients and terrestrial input were
at a minimum. Perhaps the tectonic driver for fore-
land subsidence that initiated Tectophase III (colli-
sion and uplift in the Acadian orogen) actually
started during Moscow deposition and began to
influence sedimentation in the basin before it influ-
enced subsidence (through elevated topography,
enhanced weathering of source rocks, increased gra-
dients, and higher fluxes of Ti to the basin). This
effect, however, was later balanced against the rate of
increase in accommodation (due to foreland subsi-
dence and eustatic sea-level rise) which first led to
clastic cut-off and development of a carbonate plat-
form in the basin depocenter to the east (Tully
Limestone). With continued subsidence the platform
was drowned, the depocenter migrated westward, and
widespread deposition of organic-rich mudstones
occurred (Geneseo Formation). The long-term trend
in Ti/Al provides supporting evidence that ultimately
the flux of siliciclastic material from the newly
uplifted orogen overwhelmed the subsidence/eustatic
effect and diluted OM leading to gray shale deposi-
tion in the Penn Yan Formation (note a similar
pattern in the Skaneateles Formation, Fig. 4).
B.B. Sageman et al. / Chemical Geology 195 (2003) 229–273 253

Thus, this shallow, hemipelagic but mud-domi-
nated succession is interpreted to be distinct from the
environments sampled by Caplan and Bustin (1996)
and Wortmann et al. (1999), and changes in Ti/Al
ratio are interpreted to reflect changes in bulk
sedimentation, with baseline shifts controlled by
changes in long-term basin evolution. The short-term
decrease in Ti/Al that accompanies the onset of each
black mudstone suggests that condensation was
important in the initiation of OM burial (Fig. 4).
However, OM burial does not correlate with each
decrease in Ti/Al (Fig. 4), indicating that other
factors are also necessary for OC accumulation to
occur. Note that cases of decrease in Ti/Al without
OC enrichment correspond to periods of relative low
sea-level in the basin and may reflect higher fre-
quency relative sea-level changes (i.e., subsequences:
Brett, 1995).
5.2. Decomposition/redox state
The data for redox-sensitive proxies allow delin-
eation of predominant microbial regimes based on
time-averaged accumulation of key reaction products.
These data indicate that anoxic–sulfidic conditions
were only dominant in the water column during
deposition of two relatively thin stratigraphic inter-
vals: the Bakoven member and the unnamed member
of the Oatka Creek Formation (Fig. 5). These truly
euxinic units accumulated during the maximum deep-
ening of the Appalachian basin within the studied
interval (Fig. 4). All other black mudstones showed
significantly decreased levels of the proxies indicat-
ing sulfate reduction, and are interpreted to have
experienced a range a conditions from oxic to sub-
oxic, with relatively infrequent anoxic–sulfidic con-
ditions in the water column. This may suggest a more
prominent role for nitrate reduction, especially con-
sidering a predominantly oscillating redox system. It
also raises the question of enhanced production
because, despite the evidence for infrequent sulfide
in the water column, TOC levels are nonetheless
relatively enriched above GSM. Overall, the redox
evidence suggests that water column stratification
(e.g., a near permanent halocline) was not a stable
feature of the water column. A more likely scenario
to account for the redox data is the development of
summer thermoclines, which under greenhouse cli-
mate conditions may have been only partially mixed
for periods of years to 100’s of years.
5.3. Production/nutrient cycling
In all of the studied black mudstones, the ratios of
C/N and C/P show significant decoupling relative to
a Redfield base level. This decoupling covaries
closely with the trends in %TOC, suggesting a
relationship between decompositional remineraliza-
tion of OM, release of nutrients, and higher burial
fluxes of OC. If such nutrients were recycled to the
surface waters, as might occur during seasonal (or
longer term) mixing events that broke down thermal
stratification, there would be an internal mechanism
for enhanced phytoplanktic production, which in
light of observed trends in all proxies would provide
an explanation for increased burial fluxes of OC.
Although this model is internally consistent, and
provides a reasonable explanation for many proxy
observations, it does not offer a conventional explan-
ation for the carbon isotope data. The potential
controls on d13C of preserved OM include changes
in the isotopic composition of the carbon reservoir
supplying autotrophs, changes in the size of the
reservoir utilized by autotrophs, changes in the extent
of fractionation from that reservoir during photosyn-
thesis due to variations in autotroph growth rate or
cell geometry (Bidigare et al., 1997; Popp et al.,
1998), or changes in heterotrophy, which confers an
additional carbon isotopic fractionation between
volatilized waste and refractory waste and biomass
(DeNiro and Epstein, 1978). Phytoplankton discrim-
inate in favor of 12C during photosynthesis, and
geologically protracted events of enhanced primary
production are typically characterized by burial of
light carbon, which tends to shift the CO2(aq) reser-
voir toward 13C, and consequently preserved d13Corg
toward more enriched values (e.g., Scholle and
Arthur, 1980).
Higher nutrient availability should have increased
phytoplanktonic growth rates, decreased photosyn-
thetic isotope fractionation, and led to 13C-enriched
biomass. However, in the Marcellus subgroup, there
is no preferred trend, and in the Geneseo the
opposite trend is observed. Changes in reservoir size
and heterotrophy can be ruled out as dominant
causes for observed changes in d13Corg. Although
B.B. Sageman et al. / Chemical Geology 195 (2003) 229–273254

basin volume may have varied due to changing sea-
levels, there is no reason to assume the basin became
isolated from the atmosphere, and the rate of change
in basin volume must have been considerably less
than the air–sea mixing rate for CO2. As for hetero-
trophy, although the d13Corg of bioturbated sediments
may be enriched by about 1xrelative to adjacent
laminated sediments (e.g., Pratt, 1984; Murphy et al.,
1998), the extent of fractionation and lack of corre-
lation between trends in d13Corg and bioturbation
in the Akzo and West Valley cores argue against
this as a dominant mechanism. Changes in carbon
sources with different isotopic compositions are
suggested for some intervals by the data in Fig. 4.
For example, some of the most enriched d13Corg
values are correlated with the maximum secular
lowstand when the supply of terrestrially derived
OM to the basin would have been highest (Moscow
Formation). Conversely, many of the most depleted
values in the Hamilton Group correspond to carbo-
nate beds that probably include material derived
from the carbonate platform that lay cratonward of
the Appalachian foredeep (Brett and Baird, 1996).
Note that this trend is observed mainly during the
falling sea-level stage of the Hamilton Group, does
not apply to post-Geneseo deposits with low carbo-
nate content, and there is no correlation of CaCO3
and d13Corg within black mudstones. In fact, Murphy
et al. (2000b) demonstrated that the depletion in bulk
d13Corg within the Geneseo was attributable to
changes in the marine algal contribution to preserved
OM.
A possible explanation of short-term changes in
the d13Corg record comes from consideration of the
effect of seasonal instability in the water column.
Murphy et al. (2000b) argued that the 13C-depleted
OM of the Geneseo could reflect a change in the
d13C of CO2(aq), as would occur if bottom waters rich
in isotopically depleted respired CO2 were mixed to
the surface (e.g., Saelen et al., 1998; Rohl et al.,
2001). In order for a depleted signal to be preserved,
this process would have to have overwhelmed the
effects of enhanced nutrient supply and rapid growth.
Murphy et al. (2000b) hypothesized that this might
occur if productivity during water column mixing
events was N-limited. There are two pieces of
evidence that provide support for this possibility:
(1) while there is at least a 10-fold increase in P-
release from OM relative to C associated with
maximum OC burial, there is only f 3–4-fold
increase in N-release (Fig. 6); and (2) it is likely
that the bottom water nitrate reservoir would have
been at least somewhat depleted by denitrification
between mixing events. This latter contention is
based on data from the modern oceanic oxygen
minimum zone, where NO32�/PO4
3� ratios may be
significantly less than the typical f 16:1 as a con-
sequence of denitrification (Tyrrell and Law, 1997).
Denitrification is a more efficient metabolic pathway
for bacteria than is sulfate reduction (Stumm and
Morgan, 1981), so if nitrate is abundant in oxygen-
depleted bottom waters, denitrification may be the
dominant anaerobic metabolism. If this were the case
during Geneseo deposition, it would explain the lack
of evidence for persistently or pervasively sulfidic
conditions in bottom waters, as bacterial sulfate
reduction may have been a process of secondary
importance relative to nitrate reduction and denitrifi-
cation.
Thus, it may be that NO32� availability limited
productivity immediately following water column
mixing, leaving unused PO43 � and isotopically
depleted CO2(aq) in surface waters to be utilized over
time as N-fixation made more nitrate available. This
would likely cause a more protracted duration of
elevated productivity than is typical of algal blooms,
and a lower rate of productivity than might be
expected to result from rapid nutrient infusion, allow-
ing the isotopic composition of upwelled CO2(aq) to
exert the dominant control on the d13C of carbon
being fixed as biomass. OM flux to the sediment
would be sufficiently high, however, to keep the
entire sediment column anoxic despite the frequent
presence of O2 in bottom waters. In the units over-
lying the Geneseo Formation, this same process may
have occurred, but a critical threshold was reached
after which the influence of increased production on
C-isotope fractionation dominated over the influence
of upwelled CO2(aq) (e.g., Middelburg et al., 1991).
In the case of the Rhinestreet Formation, oscillation
of d13Corg from relatively enriched to depleted sug-
gests shifting dominance between the two modes.
There is a final factor to consider in explaining the
Frasnian isotopic record. If Frasnian sea-level rise
events were eustatic, and the process accounting for
OM burial in the Appalachian basin was repeated at
B.B. Sageman et al. / Chemical Geology 195 (2003) 229–273 255

all latitudes with seasonal variability, then the
enriched d13Corg values in these black mudstones
might also reflect shifts in the global carbon reservoir
related to net OM burial. Global carbon burial, for
whatever cause, is the preferred interpretation of the
intercontinentally expressed d13Corg shifts at the two
Kellwasser horizons (e.g., McGhee, 1996; Joachim-
ski, 1997).
Remineralization of OM and increased nutrient
recycling have been discussed as a possible explan-
ation for organic-rich deposits ranging from Paleo-
zoic to Pleistocene age (Middelburg et al., 1991;
Ingall et al., 1993; Calvert et al., 1996; Caplan and
Bustin, 1996, 1999). The Devonian is a somewhat
unique period, however, because the diversification
and spread of vascular plants during this time is
believed to have resulted in a significant increase in
aluminosilicate weathering rates and thus greater
fluxes of nutrients to the world’s oceans (Berner,
1997). As a result, increased flux of terrestrially
derived nutrients has been proposed to account for
increases in Late Devonian productivity and con-
sequent OC burial events (Algeo et al., 1995;
Joachimski et al., 2001). Although it is likely that
the global inventory of primary production did
increase during this time, there are several problems
with the terrestrial nutrient hypothesis as a prox-
imate explanation for the narrow stratigraphic inter-
vals of OC-enriched mudstones in the distal
Appalachian basin. Fluvial nutrient delivery is typ-
ically confined to near-estuarine environments,
except at the mouths of continental-scale watersheds
like the Amazon River (Van Der Zwann and
Jorissen, 1991). Watersheds of this scale seem
unlikely given the geographic proximity of the
Acadian orogen and the Appalachian foreland
basin, as well as the interpreted paleolatitude and
prevailing climate. It is difficult to envision why, in
the early stages of the spread of vascular plants,
riverine nutrient flux to distal basin sites would
have increased during short intervals, and especially
those characterized by rising sea-levels. Coastal
nutrient confinement should have been enhanced
by the marine transgressions associated with black
mudstone deposition, when a higher proportion of
the riverine nutrient load was fixed by increased
production in expanded estuaries. Finally, in the
data compilation of Retallack (1997), several indi-
cators of large vascular plant development for
which there are data points through our study
interval (e.g., maximum thickness of fossils stems
and trunks, coal seam thickness, total floral diver-
sity) do not show major increases until mid- to
Late Frasnian time or thereafter. Although the
evolution of vascular land plants was surely under-
way by the Late Eifelian, and a trend of increase in
silicate weathering, nutrient release, net global pri-
mary production, and concomitant CO2 drawdown
had probably begun (Berner, 1997), this set of
processes is unlikely to have provided the proxi-
mate mechanism for OC-rich mudstone deposition
in the Appalachian basin.
5.4. A synthetic depositional model
The depositional model that we propose as the
best explanation for the origin of the studied organic-
rich mudstones has three master controlling varia-
bles:
Seasonal thermoclines: Evidence for wave base
impingement in distal fine-grained facies (e.g.,
Schieber, 1999), for benthic colonization events
by opportunistic species (e.g., Thompson and
Newton, 1987; Brett and Baird, 1997), and lack
of evidence for long-term anoxic–sulfidic con-
ditions in the black mudstones (except Marcellus)
are consistent with the conclusions of Tyson and
Pearson (1991) that seasonal dysoxia–anoxia
related to thermal stratification is a more actual-
istic model for the behavior of ancient epeiric seas
at shelfal depths. Climatic cooling on the back-
ground of a Paleozoic greenhouse, which has
been suggested for the Eifelian–Famennian inter-
val (Scotese and McKerrow, 1990; Copper, 1986;
Buggisch, 1991; Isaacson et al., 1997) and is
consistent with the observations of Berner (1997)
concerning pCO2 trends, would have enhanced
seasonality, and thus progressively increased the
stratification-mixing effect during the study inter-
val.
Nutrient supply: The data indicating predominance
of algal OM in mudstone facies suggests that use of
the Redfield ratio as a C/N/P baseline is reason-
able. Marked decoupling of C/N/P is observed in
every black mudstone in this study, suggesting
B.B. Sageman et al. / Chemical Geology 195 (2003) 229–273256

release of a potential reservoir of the bio-limiting
nutrients N and P, which under the conditions
described above could have periodically upwelled
to drive excess new production. In addition, this
instability would provide a mechanism for pre-
venting the scavenging of PO43� by Fe-oxyhydr-
oxides that occurs at stable chemoclines (e.g.,
McManus et al., 1997). If the global nutrient
inventory was already somewhat higher due to
increased terrestrial supply (Algeo et al., 1995),
perhaps in situ recycling was just sufficient to drive
additional production over the threshold to produce
bottom water anoxia (Nijenhuis et al., 2001),
although Martin (1996) indicated that most of the
Devonian was characterized by oligotrophic con-
ditions. Interestingly, the change to dominance of
eutrophic conditions noted by Martin (1996)
coincides with the shift to positive isotopic
excursions in the Frasnian black mudstones
described herein. If seasonality increased during
the study interval, as suggested above, then
nutrient release may also have increased, thus
accounting for the increase in productivity through
time. Alternatively, this is the interval in which
Retallack (1997) showed the greatest changes in
the terrestrial flora, suggesting increased terrige-
nous nutrient flux.
Relative sea-level: The master proximate variable
that initiated, as well as regulated the nature and
extent of excess OM burial was relative sea-level
change. A combination of tectonic subsidence and
eustasy controlled changes in accommodation
space, which determined the depth of the water
column, the volume of bottom and surface waters,
and thus the relative effectiveness of seasonal (or
longer term) mixing events and concentrations of
microbial reaction products like respired CO2,
nitrate, and phosphate (Fig. 2). When water depth
was at a maximum during Marcellus deposition,
seasonal mixing rarely penetrated the bottom
waters and euxinic conditions prevailed. With the
secular decrease in relative sea-level through time
(Fig. 4), the effectiveness of annual mixing
increased and the ‘‘productivity–anoxia feedback’’
mechanism (Ingall et al., 1993) became a key
factor in maintaining high burial fluxes of OC.
During this secular decrease in relative sea-level,
short-term sea-level rise events were the catalysts
for OM burial as they caused sediment starvation
and OC concentration in surface sediments. This
led to bottom water O2 depletion, progression to
nitrate and/or sulfate-reducing conditions, and
enhanced OM remineralization (Fig. 2), which
under conditions of oscillating seasonal dysoxia–
anoxia primed the eutrophication pump. Cessation
of this process was forced by dilution, as the
increasing flux of siliciclastics associated with
short-term relative sea-level fall progressively
lowered surface sediment OC concentrations until
demand for O2 was met by new supply from
seasonal mixing.
The study of OM burial in depositional systems of
the deep past has advanced rapidly in recent decades,
and our current understanding of processes (Figs. 1
and 2) provides an excellent framework within which
to approach the problem. However, our inability thus
far to precisely constrain time within many organic-
rich intervals under study makes it impossible to
determine accurate accumulation rates, which would
help address some of the most critical unknowns. We
are left to analyze relative trends, which in the context
of multi-proxy data sets composed of well-chosen
independent and dependent parameters provides a
reasonable basis for the development of interpreta-
tions. As always, however, the limiting factor in these
interpretations is the relative strength or ‘‘uniformi-
tarian confidence’’ of the assumptions that must be
made in the process. In this study, some of the
assumptions that are currently most difficult to test,
and need the most attention in the future, concern: (1)
Devonian primary producers and bacterial commun-
ities, their C/N/P and d13C characteristics, and their
relative contributions to preserved OM; (2) sources
and relative contributions of bio-limiting nutrients;
and (3) spatial consistency of trends in geochemical
parameters.
The data set discussed herein is representative of a
single region where a set of specific environmental
conditions determined the relative sensitivity of geo-
chemical proxies. While some of these proxies (Mo,
d13C) are likely to vary consistently as proximity to the
Appalachian foreland decreases, others (Ti/Al) may
not. Further work on OM burial during the late Devon-
ian must extend the sampling of organic-rich units to
the margins of the Appalachian basin and beyond, and
B.B. Sageman et al. / Chemical Geology 195 (2003) 229–273 257

it is hoped that the data presented herein will provide a
useful framework for spatial comparisons.
Acknowledgements
This study was supported with funds from the
National Science Foundation (EAR-9725441), as well
as a Northwestern University Research Grant. The
project was conducted in collaboration with a
paleobiologic study by Dr. Carlton Brett (University
of Cincinnati) and we thank him for both logistical
support and helpful discussions. We wish to acknowl-
edge the analytical efforts of XRAL for ICP-MS data,
Mike Darnell of the Houston Advanced Research
Center for organic petrography, and staff at the
Biogeochemistry Lab of Indiana University for sulfur
isotopic analyses. The Akzo Nobel Salt Co. and the
State Geological Survey of New York were instru-
mental in providing needed core material. Finally,
thanks also go to Juergen Schieber and an anonymous
reviewer for helpful reviews of the manuscript. [EO]
Table A1
Data tabulation for Marcellus subgroup study interval
Depth
(m)
OC
(wt.%)
CaCO3
(wt.%)
Al
(wt.%)
Ti
(wt.%)
Si
(wt.%)
V
(ppm)
Cr
(ppm)
Mn
(ppm)
Mo
(ppm)
Fe-hcl
(wt.%)
Fe-pyr
(wt.%)
DOP Ntot
(wt.%)
Ptot(wt.%)
d13Corg
(xvs.
PDB)
d13Spyr(xvs.
CDT)
328.17 9.81 2.21 8.03 0.31 21.3 166 77 226 28 1.18 2.03 0.63 0.027 � 29.48
328.36 3.24 8.50 8.85 0.31 23 195 98 200 47 1.14 1.86 0.62 0.024 � 30.39
328.57 5.84 1.45 8.17 0.32 22.2 225 103 169 79 1.48 4.81 0.77 0.021 � 30.01
328.72 4.27 10.85 � 29.46
328.92 2.71 14.93 8.39 0.33 22.1 155 149 235 5 1.44 0.58 0.29 0.016 � 23.74
329.14 2.72 18.80 � 30.82
329.28 5.24 0.00 � 30.12
329.48 0.8 52.31 3.43 0.14 10.5 55 13 417 2 0.91 1.00 0.52 0.015 � 30.33 � 32.9
329.68 0.49 74.70 0.76 0.04 2.46 12 3 523 1 0.26 0.24 0.48 0.023
329.89 2.17 42.70 3.49 0.15 10.8 57 37 437 2 0.87 0.78 0.47 0.21 0.022 � 30.86
330 2.04 33.24 � 29.22
330.1 4.11 8.64 8.44 0.29 24.8 148 91 208 18
330.2 1.42 51.69 � 30.31
330.37 4.56 4.63 9.39 0.29 25.4 172 55 212 31 1.06 2.31 0.69 0.018 � 29.76
330.46 6.09 1.38 � 29.62
330.53 4.62 0.83 0.27 � 29.50
330.62 5.83 0.41 � 29.98
330.73 3.74 0.76 � 29.62
330.94 5.19 0.76 8.8 0.3 26.2 196 98 147 68 0.93 3.35 0.78 0.017 � 29.65 � 28.93
331.14 5.84 2.83 � 29.40
331.34 4.53 4.56
331.6 5.12 1.59 � 30.20
331.71 6.81 0.00 � 29.63
331.8 5.21 0.14 0.27 � 30.05
332.05 8.21 0.76 7.84 0.35 25.5 252 75 161 169 0.93 4.46 0.83 0.026 � 29.72
332.15 3.68 3.25 8.74 0.3 26.6 183 98 189 27 0.89 1.65 0.65 0.018 � 29.44
332.26 8.31 0.00 � 29.58
332.46 10.14 1.45 � 29.97
332.72 8.61 0.97 7.89 0.32 26.9 331 86 140 236 0.79 4.79 0.86 0.47 0.025 � 29.99 � 32.89
332.92 8.25 1.17 � 29.87
333.12 8.68 0.00 7.61 0.32 26.4 277 85 146 173 0.67 4.55 0.87 0.033 � 29.69 � 33.56
333.38
Appendix A
B.B. Sageman et al. / Chemical Geology 195 (2003) 229–273258

Depth
(m)
OC
(wt.%)
CaCO3
(wt.%)
Al
(wt.%)
Ti
(wt.%)
Si
(wt.%)
V
(ppm)
Cr
(ppm)
Mn
(ppm)
Mo
(ppm)
Fe-hcl
(wt.%)
Fe-pyr
(wt.%)
DOP Ntot
(wt.%)
Ptot(wt.%)
d13Corg
(xvs.
PDB)
d13Spyr(xvs.
CDT)
333.59 14.18 1.59 6.15 0.26 21.7 382 65 129 279 0.42 5.93 0.93 0.67 0.035 � 29.50
333.85 6.68 1.87 7.79 0.28 26.4 275 87 135 93 0.61 5.04 0.89 0.038 � 29.62
334.06 7.25 0.00 � 29.77
334.24
334.43 9.01 0.00 0.42 � 29.85
334.63 11.19 1.11 6.29 0.27 23.1 328 54 120 251 0.36 7.56 0.95 0.027 � 29.43
334.86 11.25 4.22 � 29.79
335.05 12.84 0.00 � 29.74
335.26 9.86 0.90 6.09 0.28 24.4 337 71 147 206 5.15 1.00 � 29.76
335.46 11.71 0.00 � 30.15
335.67 12.01 0.35 � 29.37
335.87 9.51 0.00 6.32 0.29 26.1 310 53 154 192 0.50 5.41 0.92 0.38 0.035 � 29.58 � 28.21
336.06 9.87 0.00
336.27 11.17 0.00 6.02 0.27 23.6 363 71 135 234 0.35 5.05 0.94 0.033 � 29.59
336.48 9.99 0.00 0.39 � 29.89
336.69 17.3 0.97 6.48 0.26 20.6 421 58 129 394 0.58 6.35 0.92 0.74 0.03 � 29.74
336.89
337.09 11.7 0.00 6.5 0.29 23.4 383 65 125 229 0.51 6.22 0.92 0.42 0.029 � 29.41
337.2 8.4 0.00 6.34 0.19 17.2 210 44 178 53 0.31 0.32 � 29.71
337.3 2.19 15.06 9.11 0.33 26 204 60 154 24 0.50 1.58 0.76 0.029 � 9.9
337.41 5.87 0.41 7.82 0.32 23.6 150 68 185 16 � 30.75
337.5 7.18 0.35 7.47 0.29 21.9 172 85 199 20 0.51 1.56 0.75 0.30 0.029 � 29.74 � 7.76
337.6 6.65 18.31 � 29.57
337.72 9.74 6.77 � 29.53
337.83 4.89 34.00 5.21 0.2 14.9 192 59 252 56 0.57 1.62 0.74 0.51 0.019 � 30.29
337.93 3.96 26.53 � 30.08
338.13 7.23 1.52 � 29.70
338.31 7.2 0.00 7.11 0.32 21.8 158 83 216 14 0.67 1.30 0.66 0.013
338.53 4.81 4.28 8.54 0.38 24.1 150 85 186 15 0.68 1.80 0.73 0.36 0.03 � 30.17
338.73 7.95 1.04 8.67 0.34 24.4 265 101 165 60 0.51 2.28 0.82 0.026 � 29.74
338.92 0.81 30.20 6.46 0.24 17.1 95 58 262 3 0.47 1.87 0.80 � 29.58
339.11 1.19 20.45 7.37 0.29 20.6 108 50 211 3 0.54 1.95 0.78 0.008 � 30.45 � 14.06
339.31 0.39 75.94 1.85 1.00 0.016
339.51 6.12 5.11 0.47 � 30.14
339.71 3.77 8.15 8.47 0.33 22.3 280 77 140 51 0.50 2.55 0.84 0.005
339.89 2.48 34.20
340.09 1.04 62.26 2.08 0.08 6.45 52 5 216 11 0.30 0.67 0.69 0.015 � 30.23
340.31 6.86 0.00 � 29.84
340.5 1.95 24.05 6.99 0.3 18 129 80 194 6 0.49 1.38 0.74 0.029 � 29.17
340.71 2.42 7.67 � 29.13
340.87 2.75 10.99 8.7 0.38 21.7 198 91 189 6 0.47 1.85 0.80 0.032 � 30.20 � 1.9
341.09 0.39 75.18 0.23 0.02 0.75 4 0 173 1 0.11 1.72 0.94 0.305 � 31.90 13.41
341.24 0.26 76.84 0.26 0.02 0.71 11 4 265 2 0.21 1.09 0.84 0.299 � 6.66
341.26 0 89.16 109 11 0 0.49 0.06 � 31.19 � 13.94
341.31 2.21 83.83 0.65 0.03 3.76 157 30 177 46 0.67 0.31 � 30.58
341.36 10.13 45.41 2.63 0.14 10.9 617 66 126 202 � 30.37
341.41 13.44 40.92 0.78 0.69 � 30.36 � 25.93
341.46 3.37 85.75 0.52 0.02 2.4 186 30 184 61 � 30.42
341.51 8.35 61.58 0.73 0.66 � 30.49
341.56 14.74 34.75 3.04 0.14 10.8 743 70 122 298 � 30.57
341.61 18.08 20.92 0.81 0.66 � 30.73 � 24.35
Table A1 (continued)
(continued on next page)
B.B. Sageman et al. / Chemical Geology 195 (2003) 229–273 259

Depth
(m)
OC
(wt.%)
CaCO3
(wt.%)
Al
(wt.%)
Ti
(wt.%)
Si
(wt.%)
V
(ppm)
Cr
(ppm)
Mn
(ppm)
Mo
(ppm)
Fe-hcl
(wt.%)
Fe-pyr
(wt.%)
DOP Ntot
(wt.%)
Ptot(wt.%)
d13Corg
(xvs.
PDB)
d13Spyr(xvs.
CDT)
341.66 13.02 42.66 2.55 0.12 9.45 786 66 99 213 � 30.65
341.71 17.25 13.67 � 30.26
341.76 2.25 51.66 4.74 0.18 9.93 250 40 111 9 0.52 0.12 � 30.20
341.81 0.12 93.16 0.29 0.02 � 29.94 � 17.96
341.86 0 95.50 0.17 0 1.02 6 2 176 0 � 30.01
Table A1 (continued)
Table A2
Data tabulation for Geneseo Formation study interval
Depth
(m)
OC
(wt.%)
CaCO3
(wt.%)
Al
(wt.%)
Ti
(wt.%)
Si
(wt.%)
V
(ppm)
Cr
(ppm)
Mn
(ppm)
Mo
(ppm)
Fe-hcl
(wt.%)
Fe-pyr
(wt.%)
DOP Ntot
(wt.%)
Ptot(wt.%)
d13Corg
(xvs.
PDB)
d34Spyr(xvs.
CDT)
160.16 0.79 4.25 � 28.75
160.36 0.83 7.58 7.49 0.42 25.4 129 82 338 0 1.66 0.54 0.25 0.081 0.0488 � 28.01
160.55 0.88 9.00 � 27.85
160.74 0.88 8.25 8.01 0.43 25.5 133 86 325 0 0.923 0.557 0.38 0.087 0.0425 � 28.09
160.95 0.75 8.58 � 28.28
161.14 0.64 7.67 0.075 � 27.94
161.34 0.83 7.83 8.94 0.46 25.8 145 72 345 0 1.48 0.645 0.3 0.0346 � 27.79
161.37 � 15.04
161.54 0.89 6.08 0.089 � 29.10
161.74 0.65 6.58 � 29.18
161.94 0.58 6.33 7.1 0.33 19.4 115 51 592 1 1.88 0.624 0.25 0.067 0.0397 � 28.50
162.14 0.74 4.25 � 29.08
162.31 0.91 2.67 0.090 � 29.42
162.51 1.02 2.50 � 29.19
162.72 1.84 2.08 9.12 0.4 24.1 183 99 341 15 1.76 1.15 0.39 0.141 0.0676 � 29.51
162.91 0.83 37.75 � 29.66
163.12 1.05 29.33 8.13 0.37 24.7 258 98 273 33 1.66 0.429 0.21 0.097 � 30.14
163.31 3.96 8.50 8.04 0.37 24.3 312 46 302 23 1.5 0.574 0.28 0.0573 � 30.44
163.52 1.23 20.33 0.095 � 30.14
163.74 0.91 31.58 � 30.06
163.96 2.38 10.08 0.129 � 29.79
164.15 4.47 8.50 4.95 0.22 14.3 100 55 671 7 1.1 1.06 0.49 0.0655 � 29.89
164.36 3.61 16.33 0.154 � 30.11 � 9.75
164.48 � 14.5
164.51 3.83 17.25 � 30.16
164.7 5.79 4.33 6.76 0.3 21.9 133 55 372 6 1.35 0.976 0.42 0.262 0.0908 � 30.16
164.89 4.89 34.08 � 28.80
165.08 4.67 9.83 0.252 � 30.36
165.34 4.79 1.25 � 30.06
165.53 5.79 1.58 0.186 � 30.13
165.74 5.59 8.42 7.18 0.3 24 179 78 356 16 1.35 1.17 0.46 0.0909 � 30.17
165.95 4.69 12.08 0.153 � 30.18
166.14 6.11 13.92 � 30.02 � 14.6
166.33 4.13 38.00 6.81 0.26 25.5 169 45 336 9 0.745 0.554 0.43 0.194 � 29.55
166.53 1.25 62.58 � 29.94
166.73 1.93 31.33 0.126 � 29.61
166.9 2.83 21.50 6.29 0.27 24.3 269 47 303 28 1.21 0.487 0.29 � 30.09
167.1 6.4 13.92 0.388 � 29.98
167.31 1.96 37.92 � 29.80
B.B. Sageman et al. / Chemical Geology 195 (2003) 229–273260

Depth
(m)
OC
(wt.%)
CaCO3
(wt.%)
Al
(wt.%)
Ti
(wt.%)
Si
(wt.%)
V
(ppm)
Cr
(ppm)
Mn
(ppm)
Mo
(ppm)
Fe-hcl
(wt.%)
Fe-pyr
(wt.%)
DOP Ntot
(wt.%)
Ptot(wt.%)
d13Corg
(xvs.
PDB)
d34Spyr(xvs.
CDT)
167.53 1.87 31.83 6.45 0.23 24.7 212 84 349 18 1.14 0.45 0.28 0.116 0.0664 � 29.92
167.73 2.87 21.17 � 29.99
167.92 3.52 15.42 0.162 � 29.77
168.1 3.72 12.67 � 29.97
168.24 3.1 15.00 5.73 0.24 22 154 67 465 22 1.42 0.695 0.33 0.163 0.0713 � 30.21
168.38 3.31 15.67 � 30.30
168.55 2.16 12.33 0.137 � 29.88
168.61 2.61 13.92 7.79 0.34 23.6 155 86 448 7 1.11 0.611 0.35 0.0647 � 30.04
168.8 3 12.92 0.183 � 30.11
169.02 4.82 11.00 8.63 0.36 23.6 163 92 430 3 1.32 1.09 0.45 0.0888 � 29.26
169.21 4.1 15.00 0.148 � 30.05
169.42 4.12 13.33 � 30.10
169.62 4.84 9.08 8.54 0.32 26 166 96 254 4 0.871 0.603 0.41 0.148 0.0737 � 29.93
169.83 4.6 8.58 � 29.75
170.03 5.11 8.67 0.165 � 29.83
170.24 4.49 14.33 8.37 0.32 25.8 150 92 320 2 1.14 0.834 0.42 0.0870 � 29.60
170.45 4.31 18.67 0.199 � 29.51
170.65 2.94 17.08 � 29.48
170.76 4.26 16.00 8.33 0.32 24.1 155 88 436 0 1.23 0.821 0.4 0.185 0.1169 � 29.41
170.97 2.84 24.42 � 29.20
171.17 2.1 14.17 0.138 � 29.28
171.36 2.53 16.17 � 29.26
171.46 1.67 11.25 8.42 0.4 24.1 156 100 360 0 1.89 0.733 0.28 0.127 0.1442 � 29.41
171.57 1.39 0.17 � 29.41 5.5
171.78 1.18 4.25 0.113 � 29.40
171.98 1.1 5.67 � 29.52
172.16 0.48 9.00 8.97 0.38 25.1 167 56 348 0 1.75 1.83 0.51 0.062 0.0949 � 28.92
172.37 0.47 6.58 � 28.91 5.53
172.58 0.53 5.42 0.071 � 30.91
172.77 0.54 5.58 8.88 0.4 25.9 161 99 300 0 2.28 0.772 0.25 0.0939 � 31.50
172.97 0.36 4.25 0.051 � 27.94
173.17 0.35 3.42 � 28.18
173.37 0.36 3.42 8.96 0.32 25 167 84 281 0 2.07 1.49 0.42 0.051 � 28.09
173.55 12.01
173.57 0.37 3.67 � 27.61
173.64 0.35 2.75 9.34 0.41 26.3 170 105 267 1 0.053 � 27.73
173.84 0.31 2.67 9.49 0.37 25.7 177 58 263 0 2.39 0.341 0.12 0.0938 � 27.51
174.03 0.32 2.50 0.041 � 27.58
174.45 0.45 8.64 8.42 0.39 23.7 150 93 406 0 � 27.65
Table A2 (continued)
Table A3
Data tabulation for Middlesex Formation study interval
Depth (m) OC (wt.%) CaCO3 (wt.%) Ntot (wt.%) Ptot (wt.%) d34Spyr (xvs. CDT)
114.57 1.09 1.25 0.14
114.65 0.3 1.00 0.04
114.72 0.47 1.17 0.08
114.9 0.52 0.00 0.10 0.047 � 9.39
114.97 0.79 0.17 0.14
115 0.41 0.67 0.08
115.04 0.85 1.25 0.16
(continued on next page)
B.B. Sageman et al. / Chemical Geology 195 (2003) 229–273 261

Depth (m) OC (wt.%) CaCO3 (wt.%) Ntot (wt.%) Ptot (wt.%) d34Spyr (xvs. CDT)
115.11 0.51 0.00 0.11
115.19 0.95 1.50 0.17
115.23 0.11 0.92 0.02
115.28 0.49 1.08 0.04
115.31 1.18 1.17 0.07 0.046
115.34 0.56 0.00 0.02
115.37 1.04 0.83 0.05
115.4 0.59 0.00 0.03
115.42 0.97 0.08 0.08
115.48 0.67 0.92 0.04
115.54 2.52 0.25 0.14
115.62 3.99 1.25 0.17 � 15.42
115.71 3.61 1.17 0.20 0.041
115.81 2.68 1.25 0.12
115.91 1.8 0.75 0.11
116.08 0.43 0.58 0.07 0.050
116.16 0.74 1.17 0.15
116.22 0.53 0.08 0.10
116.26 0.62 1.17 0.12
116.31 0.31 0.00 0.06 0.049
116.36 0.39 0.75 0.06
116.4 0.69 0.33 0.10 � 6.99
116.47 0.33 1.33 0.05
116.53 0.73 0.17 0.13 0.055
116.62 0.65 1.08 0.12
116.77 1.55 1.33 0.30
116.92 2.12 0.00 0.34 0.063
117.22 3.23 0.00 0.22
117.37 2.59 0.17 0.13
117.57 2.16 0.58 0.12 0.040
117.72 1.11 0.67 0.06
117.87 1.58 1.08 0.12
118.02 1.7 0.83 0.12 � 18.56
118.18 1.76 0.58 0.13 0.046
118.46 2.65 0.67 0.16
118.61 2.31 0.00 0.11
118.8 2.6 0.75 0.16 0.039
118.95 2.8 1.00 0.19
119.1 3.19 0.00 0.26
119.26 2.64 0.00 0.17
119.4 3.29 0.83 0.19 0.037 � 17.93
119.7 2.55 0.08 0.18
119.86 2.68 0.00 0.14
120.02 3.42 0.58 0.18 0.041
120.17 2.75 0.00 0.12
120.32 3.45 0.58 0.19
120.47 3.23 1.17 0.15
120.63 3.25 3.50 0.19 0.044
120.93 3.09 5.08 0.16
121.08 1.91 77.41 0.09
121.2 5.25 5.83 0.26 0.044
121.35 5.93 2.17 0.21 � 13.81
121.5 2.64 0.75 0.14
121.78 0.73 2.50 0.07 0.053
Table A3 (continued)
B.B. Sageman et al. / Chemical Geology 195 (2003) 229–273262

Depth (m) OC (wt.%) CaCO3 (wt.%) Ntot (wt.%) Ptot (wt.%) d34Spyr (xvs. CDT)
121.91 0.55 3.33 0.06
122.23 0.44 3.50 0.06
122.34 0.66 2.25 0.10 0.050
122.49 0.69 3.17 0.10
122.64 0.48 3.67 0.08
122.79 0.48 2.75 0.07
122.94 0.6 3.58 0.08 0.053
123.24 0.65 2.50 0.12
123.4 1.13 4.67 0.19
123.56 0.68 3.17 0.12 0.048
123.71 1.01 3.92 0.10
123.86 1.49 5.08 0.14 � 17.87
123.95 0.92 6.00 0.09
124.09 0.19 4.17 0.04 0.043
124.24 0.25 4.08 0.05
124.39 0.37 3.08 0.07 � 17.03
124.54 0.32 7.33
127.49 � 17.34
Depth
(m)
OC
(wt.%)
CaCO3
(wt.%)
Al
(wt.%)
Ti
(wt.%)
Si
(wt.%)
V
(ppm)
Cr
(ppm)
Mn
(ppm)
Mo
(ppm)
d13Corg
(xvs. PDB)
114.25 8.59 0.40 28.10 151 51 333 0 � 28.04
115.44 8.32 0.41 28.70 158 79 284 0 � 29.55
116 0.24 1.25 8.15 0.38 26.5 164 90 264 0
116.57 1.04 0.42 7.63 0.35 29.00 184 84 279 1 � 29.22
117.07 2.62 0.00 7.26 0.37 28.3 297 95 187 20
117.77 8.22 0.37 27.50 178 84 216 5 � 28.89
118.31 2.26 0.00 7.8 0.38 26.3 175 103 193 2
119 6.96 0.35 29.80 289 72 208 17 � 29.15
119.55 2.52 0.75 7.47 0.41 27.6 268 95 186 19
120.2 7.34 0.35 28.80 180 73 187 13 � 28.92
120.78 3.66 5.58 7.11 0.32 26.00 149 92 263 5
121.4 6.35 0.34 27.1 124 64 209 7 � 28.87
121.66 1.63 0.58 6.24 0.43 29.30 106 77 185 15
122.08 0.58 2.92 7.38 0.43 28.70 129 90 274 0
122.55 6.77 0.4 30.8 117 69 297 1 � 30.68
123.09 0.36 4.08 8.81 0.46 25.9 146 102 383 0
123.68 8.37 0.4 28 136 86 325 0 � 29.99
124.8 7.72 0.38 26.1 133 73 382 0 � 30.12
125.96 7.45 0.41 27 119 72 311 0 � 29.49
Table A3 (continued)
Table A4
Data tabulation for Rhinestreet Formation study interval
Depth (m) OC (wt.%) CaCO3 (wt.%) Ntot (wt.%) Ptot (wt.%) d34Spyr (xvs. CDT)
31.75 0.2 0.33
31.8 0.72 0.33 0.06 0.040
31.83 0.87 0.50 � 20.35
31.88 0.85 0.67 0.02
31.98 0.5 0.75
32.09 0.88 0.58
32.12 0.87 0.58 0.04 0.040
32.15 1.16 0.83
(continued on next page)
B.B. Sageman et al. / Chemical Geology 195 (2003) 229–273 263

Depth (m) OC (wt.%) CaCO3 (wt.%) Ntot (wt.%) Ptot (wt.%) d34Spyr (xvs. CDT)
32.19 0.7 0.75
32.27 1 1.25 0.06 0.040
32.36 0.59 1.92
32.4 0.98 0.67
32.45 0.67 4.83 0.02 0.040
32.52 1.05 0.67
32.59 0.67 2.75 0.03
32.67 1.81 1.25
32.74 2.78 0.75
32.84 3.54 0.83 0.06 0.040
32.91 2.93 2.17
33.09 1.99 2.42 0.05
33.25 2.13 1.83
33.43 2.29 0.50
33.46 1.89 0.50 0.06 0.090
33.54 1.02 0.92
33.64 1.05 0.33 0.07
33.67 1.18 0.42
33.74 2.14 0.67
33.82 1.59 0.58 0.04 0.090
33.88 1.55 0.42
33.99 1.15 0.50
34.06 0.95 0.42 0.02
34.25 0.93 9.00
34.34 0.28 2.25 0.01 0.070
34.5 0.69 0.58
34.68 1.18 0.42 0.02
34.75 2.07 0.33
34.86 1.71 0.33 0.03 0.050
34.93 2 0.33
34.97 1.13 0.42 0.02
35.05 1.17 0.67
35.46 0.68 0.50 � 15.61
35.65 0.74 0.25 0.02 0.045
35.85 1.74 0.33
35.96 2.15 0.50 0.04
36.18 2.83 0.58
36.39 2.83 0.83
36.59 3.07 1.83 0.09 0.040 � 24.33
36.8 2.73 2.00
37.03 2.26 0.42
37.25 1.32 0.67 0.05
37.5 2 3.92
37.73 1.43 0.75
37.98 1.46 3.08 0.05 0.040
38.22 1.21 2.75
38.38 1.23 0.50 0.03
38.68 1.89 4.42
38.93 1.3 0.50 0.03 0.040
39.04 1.91 0.33
39.25 1.96 0.33
39.39 1.76 0.33 0.05
39.65 1.41 2.50
39.9 1.7 0.58
Table A4 (continued)
B.B. Sageman et al. / Chemical Geology 195 (2003) 229–273264

Depth (m) OC (wt.%) CaCO3 (wt.%) Ntot (wt.%) Ptot (wt.%) d34Spyr (xvs. CDT)
39.98 1.8 0.50 0.04 0.040
40.24 1.91 1.17 � 17.29
40.5 1.79 0.25
40.6 1.66 0.50 0.05
40.78 1.28 4.17
41.14 1.01 1.92
41.2 1.18 0.42 0.03 0.040
41.35 1.29 1.17
41.61 1.28 2.58
41.81 2 0.33 0.04
42.05 2 0.58 0.04 0.040
42.26 1.56 2.00
42.44 0.85 1.83 0.03
42.65 1.37 1.92
42.9 1.37 0.67 0.05 0.040
43.1 1.38 1.50
43.29 1.61 2.42
43.5 1.4 0.58 0.05
43.7 1.5 1.17
43.9 1.56 0.75
44.05 1.52 0.33 0.05 0.040
44.25 1.18 2.17
44.46 0.26 2.67
44.66 0.33 3.50 0.03 0.040 � 10.42
44.86 0.48 1.25
45.13 0.47 0.92
45.35 0.47 2.83 0.04 0.040
45.54 0.57 2.33
45.74 1.14 1.00
45.94 1.65 0.58 0.05
46.15 2.45 0.67 � 16.84
46.35 2.04 0.58 0.05 0.040
46.56 1.55 0.92
46.77 0.78 5.25
46.93 0.63 6.08 0.04
47.13 0.59 5.17
47.33 0.37 4.67
47.74 0.41 1.92 0.03 0.040
47.94 0.43 3.92
48.35 0.45 1.83 0.04
48.54 0.42 3.25
48.73 0.62 2.50 � 8.37
48.94 0.66 2.42 0.04 0.040
49.14 0.67 1.83
49.34 0.52 2.25 0.04
49.54 0.63 3.17
49.74 0.83 2.42
49.89 0.93 0.83 0.02 0.040
50.11 1.83 1.33
50.32 1.73 1.00 0.04
50.52 1.73 1.42
50.69 0.8 1.00 0.03 0.040
Table A4 (continued)
(continued on next page)
B.B. Sageman et al. / Chemical Geology 195 (2003) 229–273 265

Table A4 (continued)
Depth (m) OC (wt.%) CaCO3 (wt.%) Ntot (wt.%) Ptot (wt.%) d34Spyr (xvs. CDT)
51.09 0.93 2.17
51.27 1.25 2.42 0.04
51.66 1.49 0.25
51.84 1.72 0.42 0.05 0.037
52.23 2.18 0.42
52.42 2.3 0.50 0.06
52.62 2.62 0.50
52.82 3.14 0.50
52.99 3.22 0.75 0.08 0.033
53.38 3.4 0.50
53.58 3.15 1.00
53.78 3.26 1.08 0.07 � 10.40
53.97 2.36 0.58
54.16 1.7 1.75
54.37 1.98 1.50 0.06 0.030
54.58 3.03 1.58
54.98 2.64 3.25 0.08
55.19 1.74 4.42
55.6 0.63 7.08 0.04 0.040
55.78 0.51 4.83
55.98 0.43 7.25 0.03
56.19 0.4 7.83
56.37 0.36 5.83 0.04 0.050
56.59 0.35 8.92 0.06 � 14.71
57.57 0.4733 6.00
58.74 0.3495 5.12
Depth
(m)
Al
(wt.%)
Ti
(wt.%)
Si
(wt.%)
V
(ppm)
Cr
(ppm)
Mn
(ppm)
Mo
(ppm)
d13Corg
(xvs. PDB)
31.45 9.84 0.47 29.20 195 87 355 0 � 28.58
32.57 9.03 0.46 25.40 165 81 328 0 � 28.56
33.71 8.91 0.45 26.30 166 78 268 2 � 29.07
34.79 11.2 0.52 24.5 218 94 271 0 � 27.00
36.16 8.32 0.41 25.9 180 87 329 5 � 29.75
37.31 8.98 0.40 25.80 282 103 202 4 � 29.16
38.46 9.12 0.43 22.7 195 88 279 8 � 30.3
39.59 8.64 0.40 25.20 165 84 373 0 � 29.37
40.69 9.21 0.43 24.5 166 85 421 0 � 29.36
41.86 8.52 0.4 26.1 168 86 251 12 � 30.01
43 8.77 0.4 25.6 179 87 249 30 � 29.83
44.11 8.4 0.4 22.8 196 83 262 15 � 29.97
45.32 9.79 0.39 24.6 175 93 294 0 � 29.93
46.43 8.68 0.38 23.1 191 91 280 2 � 28.91
47.54 7.81 0.4 24.7 138 68 463 0 � 29.22
48.67 8.92 0.39 22.5 158 89 394 0 � 28.93
49.81 8.42 0.39 21.6 204 93 381 1 � 29.05
50.88 8.91 0.41 23.7 202 90 317 2 � 29.03
52.02 8.68 0.39 26 289 94 219 9 � 28.49
53.19 8 0.34 26.9 226 78 187 24 � 28.38
54.22 8.05 0.36 25 147 82 301 1 � 28.18
55.38 7.62 0.34 23.3 133 80 511 0 � 29.75
56.49 7.25 0.38 24.9 119 67 469 0 � 29.39
57.57 7.37 0.38 25.4 127 80 476 0 � 30.13
58.74 7.76 0.42 23.9 138 88 491 0
B.B. Sageman et al. / Chemical Geology 195 (2003) 229–273266
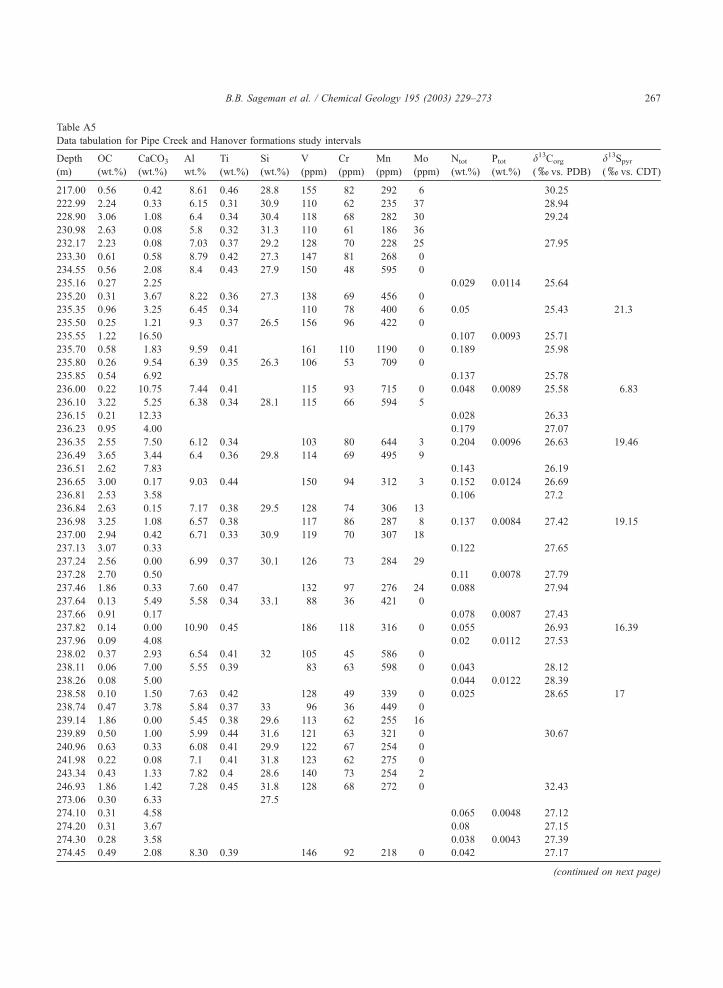
Table A5
Data tabulation for Pipe Creek and Hanover formations study intervals
Depth
(m)
OC
(wt.%)
CaCO3
(wt.%)
Al
wt.%
Ti
(wt.%)
Si
(wt.%)
V
(ppm)
Cr
(ppm)
Mn
(ppm)
Mo
(ppm)
Ntot
(wt.%)
Ptot(wt.%)
d13Corg
(xvs. PDB)
d13Spyr(xvs. CDT)
217.00 0.56 0.42 8.61 0.46 28.8 155 82 292 6 � 30.25
222.99 2.24 0.33 6.15 0.31 30.9 110 62 235 37 � 28.94
228.90 3.06 1.08 6.4 0.34 30.4 118 68 282 30 � 29.24
230.98 2.63 0.08 5.8 0.32 31.3 110 61 186 36
232.17 2.23 0.08 7.03 0.37 29.2 128 70 228 25 � 27.95
233.30 0.61 0.58 8.79 0.42 27.3 147 81 268 0
234.55 0.56 2.08 8.4 0.43 27.9 150 48 595 0
235.16 0.27 2.25 0.029 0.0114 � 25.64
235.20 0.31 3.67 8.22 0.36 27.3 138 69 456 0
235.35 0.96 3.25 6.45 0.34 110 78 400 6 0.05 � 25.43 � 21.3
235.50 0.25 1.21 9.3 0.37 26.5 156 96 422 0
235.55 1.22 16.50 0.107 0.0093 � 25.71
235.70 0.58 1.83 9.59 0.41 161 110 1190 0 0.189 � 25.98
235.80 0.26 9.54 6.39 0.35 26.3 106 53 709 0
235.85 0.54 6.92 0.137 � 25.78
236.00 0.22 10.75 7.44 0.41 115 93 715 0 0.048 0.0089 � 25.58 6.83
236.10 3.22 5.25 6.38 0.34 28.1 115 66 594 5
236.15 0.21 12.33 0.028 � 26.33
236.23 0.95 4.00 0.179 � 27.07
236.35 2.55 7.50 6.12 0.34 103 80 644 3 0.204 0.0096 � 26.63 � 19.46
236.49 3.65 3.44 6.4 0.36 29.8 114 69 495 9
236.51 2.62 7.83 0.143 � 26.19
236.65 3.00 0.17 9.03 0.44 150 94 312 3 0.152 0.0124 � 26.69
236.81 2.53 3.58 0.106 � 27.2
236.84 2.63 0.15 7.17 0.38 29.5 128 74 306 13
236.98 3.25 1.08 6.57 0.38 117 86 287 8 0.137 0.0084 � 27.42 � 19.15
237.00 2.94 0.42 6.71 0.33 30.9 119 70 307 18
237.13 3.07 0.33 0.122 � 27.65
237.24 2.56 0.00 6.99 0.37 30.1 126 73 284 29
237.28 2.70 0.50 0.11 0.0078 � 27.79
237.46 1.86 0.33 7.60 0.47 132 97 276 24 0.088 � 27.94
237.64 0.13 5.49 5.58 0.34 33.1 88 36 421 0
237.66 0.91 0.17 0.078 0.0087 � 27.43
237.82 0.14 0.00 10.90 0.45 186 118 316 0 0.055 � 26.93 � 16.39
237.96 0.09 4.08 0.02 0.0112 � 27.53
238.02 0.37 2.93 6.54 0.41 32 105 45 586 0
238.11 0.06 7.00 5.55 0.39 83 63 598 0 0.043 � 28.12
238.26 0.08 5.00 0.044 0.0122 � 28.39
238.58 0.10 1.50 7.63 0.42 128 49 339 0 0.025 � 28.65 � 17
238.74 0.47 3.78 5.84 0.37 33 96 36 449 0
239.14 1.86 0.00 5.45 0.38 29.6 113 62 255 16
239.89 0.50 1.00 5.99 0.44 31.6 121 63 321 0 � 30.67
240.96 0.63 0.33 6.08 0.41 29.9 122 67 254 0
241.98 0.22 0.08 7.1 0.41 31.8 123 62 275 0
243.34 0.43 1.33 7.82 0.4 28.6 140 73 254 2
246.93 1.86 1.42 7.28 0.45 31.8 128 68 272 0 � 32.43
273.06 0.30 6.33 27.5
274.10 0.31 4.58 0.065 0.0048 � 27.12
274.20 0.31 3.67 0.08 � 27.15
274.30 0.28 3.58 0.038 0.0043 � 27.39
274.45 0.49 2.08 8.30 0.39 146 92 218 0 0.042 � 27.17
(continued on next page)
B.B. Sageman et al. / Chemical Geology 195 (2003) 229–273 267

References
Algeo, T.J., Berner, R.A., Maynard, J.B., Scheckler, S.E., 1995.
Late Devonian oceanic anoxic events and biotic crises: ‘‘rooted’’
in the evolution of vascular land plants? GSA Today 5, 64–66.
Aller, R.C., 1994. Bioturbation and remineralization of sedimentary
organic matter: effects of redox oscillation. Chem. Geol. 114,
331–345.
Arthur, M.A., Sageman, B.B., 1994. Marine black shales: a review
of depositional mechanisms and significance of ancient depos-
its. Annu. Rev. Earth Planet. Sci. 22, 499–551.
Arthur, M.A., Dean, W.E., Pratt, L.M., 1988. Geochemical and
Table A5 (continued)
Depth
(m)
OC
(wt.%)
CaCO3
(wt.%)
Al
wt.%
Ti
(wt.%)
Si
(wt.%)
V
(ppm)
Cr
(ppm)
Mn
(ppm)
Mo
(ppm)
Ntot
(wt.%)
Ptot(wt.%)
d13Corg
(xvs. PDB)
d13Spyr(xvs. CDT)
274.55 2.12 0.75 0.121 0.0335 � 27.6
274.63 0.24 7.42 0.021 � 27.65 10.89
274.70 3.48 6.25 0.296 � 27.6
274.75 0.86 2.58 0.103 0.0032 � 27.7
274.79 3.69 6.83 0.217 � 26.97
274.83 4.16 6.75 6.39 0.34 118 88 466 3 0.184 � 26.25 � 14.88
274.93 0.47 19.92 21.4
275.17 3.94 5.17 0.178 0.0157 � 26.58
275.32 3.41 4.42 0.16 � 26.87
275.47 3.61 3.17 6.90 0.32 122 93 306 5 0.148 0.0155 � 27.49
275.67 3.64 2.67 0.132 � 27.95
275.83 4.29 3.17 29.7 0.142 0.0191 � 28.41
275.98 3.35 2.00 6.81 0.31 121 94 312 2 0.121 � 28.63
276.13 3.35 1.58 0.127 0.0112 � 28.85
276.25 3.81 1.58 0.143 � 28.71
276.40 4.41 2.17 6.23 0.3 109 86 309 1 0.163 0.0116 � 28.57
276.43 4.75 1.51 27.7
276.50 4.51 2.08 0.151 � 28.84
276.65 3.97 2.08 0.125 � 28.72
276.80 5.40 1.75 6.92 0.34 120 97 326 0 0.152 0.0155 � 29.11 � 13.71
276.95 3.64 1.50 0.132 � 29.09
277.10 3.69 1.08 27.5 0.153 � 29.07
277.25 3.96 0.92 7.26 0.36 125 98 277 2 0.159 0.0155 � 29.07
277.40 4.43 1.17 0.17 � 28.84
277.55 3.52 0.58 0.13 0.0137 � 28.62
277.71 4.01 0.58 6.96 0.34 119 88 267 2 0.138 � 28.88
277.85 2.71 1.00 0.103 0.0195 � 29.2
278.01 0.44 3.42 3.99 0.27 55 54 391 0 0.021 � 29.13 � 0.61
278.16 1.69 0.25 0.083 0.0246 � 29.14
278.31 2.29 0.42 8.04 0.41 136 99 309 0 0.096 � 29.3
278.41 1.39 0.92 0.055 � 29.46
278.51 1.62 0.75 25.7 0.065 0.0128 � 29.59
278.61 2.05 0.25 0.089 � 29.53
278.73 2.60 0.33 8.11 0.44 143 106 284 15 0.126 � 29.6
278.83 2.51 0.25 0.143 0.0187 � 29.4
278.98 0.90 0.75 0.071 � 29.4
279.08 0.76 1.50 0.079 0.0224 � 29.21
279.23 0.78 1.58 4.97 0.34 74 65 310 0 0.084 � 29.31
279.33 0.83 1.42 0.095 � 29.36
279.43 0.57 2.50 0.069 0.0220 � 29.41
279.86 1.06 1.68 34.4
280.23 0.49 0.33 10.40 0.51 191 121 360 0 0.061 0.0298 � 29.31
280.32 0.57 1.33 0.074 � 29.53
280.50 0.65 0.17 0.084 � 29.76
280.60 0.69 0.33 9.49 0.49 171 110 350 0 0.094 0.0298 � 29.6 � 6.52
B.B. Sageman et al. / Chemical Geology 195 (2003) 229–273268
climatic effects of increased marine organic carbon burial at the
Cenomanian/Turonian boundary. Nature 335, 714–717.
Berner, R.A., 1980. Early diagenesis: a theoretical approach. In:
Holland, H.D. (Ed.), Princeton Series in Geochemistry. Prince-
ton Univ. Press, Princeton. 237 pp.
Berner, R.A., 1990. Atmospheric carbon dioxide levels over Pha-
nerozoic time. Science 249, 1382–1386.
Berner, R.A., 1997. The rise of plants and their effect on weathering
and atmospheric CO2. Science 276, 544–546.
Berner, R.A., Canfield, D.E., 1989. A new model for atmospheric
oxygen over Phanerozoic time. In: Miles, D.L. (Ed.), Water–
Rock Interaction. WRI-6, Proceedings - International Symposi-
um on Water–Rock Interaction, vol. 6, pp. 73–74.
Bertrand, P., Shimmield, G., Martinez, P., Grousset, F., Jorissen, F.,
Paterne, M., Pujol, C., Bouloubassi, I., Buat Menard, P., Pey-
pouquet, J.P., Beaufort, L., Sicre, M.A., Lallier-Verges, E., Fos-
ter, J.M., Ternois, Y., 1996. The glacial ocean productivity
hypothesis: the importance of regional temporal and spatial
studies. Mar. Geol. 130, 1–9.
Betts, J.N., Holland, H.D., 1991. The oxygen content of the ocean
bottom waters, the burial efficiency of organic carbon, and the
regulation of atmospheric oxygen. Palaeogeogr. Palaeoclimatol.
Palaeoecol. 97, 5–18.
Bidigare, R.R., Fluegge, A., Freeman, K.H., Hanson, K.L., Hayes,
J.M., Hollander, D.J., Jasper, J.P., King, L.L., Laws, E.A.,
Milder, J., Millero, F.J., Pancost, R., Popp, B.N., Steinberg,
P.A., Wakeham, S.G., 1997. Consistent fractionation of 13C in
nature and in the laboratory: growth-rate effects in some hap-
tophyte algae. Glob. Biogeochem. Cycles 11 (2), 279–292.
Boyle, E.A., 1983. Chemical accumulation variation under the Peru
current during the last 130,000 years. J. Geophys. Res. 88,
7667–7680.
Bralower, T.J., Thierstein, H.R., 1984. Organic carbon and metal
accumulation rates in Holocene and mid-Cretaceous sediments:
paleoceanographic significance. In: Brooks, J., Fleet, A.J.
(Eds.), Marine Petroleum Source Rocks. Geological Society
London Special Publication, vol. 26, pp. 345–369.
Brett, C.E., 1995. Sequence stratigraphy, biostratigraphy, and taphon-
omy in shallow marine environments. Palaios 10, 597–616.
Brett, C.E., Baird, G.C., 1986. Symmetrical and upward shallowing
cycles in the Middle Devonian of New York State and their
implications for the punctuated aggradational cycle hypothesis.
In: Arthur, M.A., Garrison, R.E. (Eds.), Special Section: Mi-
lankovitch Cycles Through Geologic Time. Paleoceanography,
vol. 1, pp. 431–445.
Brett, C.E., Baird, G.C., 1996. Middle Devonian sedimentary cycles
and sequences in the northern Appalachian Basin. In: Witzke,
B.J., Ludvigson, G.A., Day, J. (Eds.), Paleozoic Sequence Strat-
igraphy: Views from the North American Craton. Special Paper -
Geological Society of America, vol. 306, pp. 213–241.
Brett, C.E., Baird, G.C., 1997. Epiboles, outages, and ecological
evolutionary bioevents: taphonomy, ecological, and biogeo-
graphic factors. In: Brett, C.E., Baird, G.C. (Eds.), Paleontolog-
ical Events, Stratigraphic, Ecological and Evolutionary Implica-
tions. Columbia Univ. Press, New York, pp. 249–284.
Brett, C.E., Baird, G.C., Miller, K.B., 1986. Sedimentary cycles and
lateral facies gradients across a Middle Devonian shelf-to-basin
ramp, Ludlowville Formation, Cayuga Basin. New York State
Geological Association, 58th Annual Meeting: Field Trip
Guidebook, pp. 81–127.
Brett, C.E., Dick, V.B., Baird, G.C., 1991. Comparative taphonomy
and paleoecology of Middle Devonian dark gray and black
shales facies from western New York. In: Landing, E., Brett,
C.E. (Eds.), Dynamic Stratigraphy and Depositional Environ-
ments of the Hamilton Group (Middle Devonian) in New
York State, Part II. New York State Museum Bulletin, vol. 469,
pp. 5–36.
Buggisch, W., 1991. The global Frasnian–Famennian ‘‘Kellwasser
Event’’. Geol. Rundsch. 80, 49–72.
Byers, C.W., 1977. Biofacies patterns in euxinic basins: a general
model. In: Cook, H.E., Enos, P. (Eds.), Deep Water Carbonate
Environments. Society of Economic Paleontologists and Miner-
alogists, Tulsa, pp. 5–17.
Calvert, S.E., Pedersen, T.F., 1996. Sedimentary geochemistry of
manganese: implications for the environment of formation of
manganiferous black shales. Econ. Geol. 91, 36–47.
Calvert, S.E., Bustin, R.M., Ingall, E.D., 1996. Influence of water
column anoxia and sediment supply on the burial and preserva-
tion of organic carbon in marine shales. Geochim. Cosmochim.
Acta 60, 1577–1593.
Canfield, D.E., 1994. Factors influencing organic carbon preserva-
tion in marine sediments. Chem. Geol. 114, 315–329.
Canfield, D.E., Lyons, T.W., Raiswell, R., 1996. A model for iron
deposition to euxinic Black Sea sediments. Am. J. Sci. 296,
818–834.
Caplan, M.L., Bustin, R.M., 1996. Factors governing organic mat-
ter accumulation and preservation in a marine petroleum source
rock from the Upper Devonian to Lower Carboniferous Exshaw
Formation, Alberta. Bull. Can. Pet. Geol. 44, 474–494.
Caplan, M.L., Bustin, R.M., 1999. Devonian–Carboniferous Hang-
enberg mass extinction event, widespread organic-rich mudrock
and anoxia: causes and consequences. Palaeogeogr. Palaeocli-
matol. Palaeoecol. 148 (4), 187–207.
Copper, P., 1986. Frasnian–Famennian mass extinction and cold-
water oceans. Geology 14, 835–839.
Crusius, J., Calvert, S., Pedersen, T., Sage, D., 1996. Rhenium and
molybdenum enrichments in sediments as indicators of oxic,
suboxic and sulfidic conditions of deposition. Earth Planet.
Sci. Lett. 145, 65–78.
Dean, W.E., Piper, D.Z., Peterson, L.C., 1999. Molybdenum accu-
mulation in Cariaco basin sediment over the past 24 k.y.: a record
of water-column anoxia and climate. Geology 27, 507–510.
Demaison, G.J., Moore, G.T., 1980. Anoxic environments and oil
source bed genesis. Am. Assoc. Pet. Geol. Bull. 64, 1179–1209.
DeNiro, M.J., Epstein, S., 1978. Influence of diet on the distribution
of carbon isotopes in animals. Geochim. Cosmochim. Acta 42,
495–506.
Dennison, J.M., 1985. Catskill Delta shallow marine strata. In:
Woodrow, D.L., Sevon, W.D. (Eds.), The Catskill Delta. Geo-
logical Society of America, Special Paper, vol. 201, pp. 91–106.
Durand, B. (Ed.), 1980. Kerogen: Insoluble Organic Matter from
Sedimentary Rocks. Ed. Technip, Paris, p. 519.
Emerson, S., 1985. Organic carbon preservation in marine sedi-
ments. In: Sundquist, E.T., Broecker, W.S. (Eds.), The Carbon
B.B. Sageman et al. / Chemical Geology 195 (2003) 229–273 269

Cycle and Atmospheric CO2: Natural Variations Archean to
Present. Geophysical Monograph, vol. 32, pp. 78–87.
Emerson, S., Hedges, J.I., 1988. Processes controlling the organic
carbon content of open ocean sediments. Paleoceanography 3,
621–634.
Emerson, S.R., Huested, S.S., 1991. Ocean anoxia and the concen-
trations of molybdenum and vanadium in seawater. Mar. Chem.
34, 177–196.
Ettensohn, F.R., 1985a. The Catskill Delta complex and the Aca-
dian Orogeny: a model. In: Woodrow, D.L., Sevon, W.D. (Eds.),
The Catskill Delta. Geological Society of America, Special Pa-
per, vol. 201, pp. 39–49.
Ettensohn, F.R., 1985b. Controls on development of Catskill Delta
complex basin-facies. In: Woodrow, D.L., Sevon, W.D. (Eds.),
The Catskill Delta. Geological Society of America, Special Pa-
per, vol. 201, pp. 65–77.
Ettensohn, F.R., Barron, L.S., 1981. Depositional model for the
Devonian–Mississippian black shales of North America: A pa-
leoclimatic–paleogeographic approach. In: Roberts, T.J. (Ed.),
GSA Field Trip Guidebook, Cincinnati, 1981. American Geo-
logical Institute, Falls Church, VA, pp. 344–361.
Ettensohn, F.R, Miller, M.L., Dillman, S.B., Elam, T.D., Geller,
K.L., Swager, G., Markowitz, G.D., Woock, F.D., Barron,
L.S., 1988. Characterization and implications of the Devon-
ian–Mississippian black shale sequence, eastern and central
Kentucky, U.S.A.: pycnoclines, transgression, and tectonism.
In: McMillan, N.J., Embry, A.F., Glass, D.J. (Eds.), Devonian
of the World, II. Canadian Society of Petroleum Geologists,
Memoir, vol. 14, pp. 323–345.
Fillipelli, G., 1997. Controls on the phosphorus concentration and
accumulation in marine sediments. Mar. Geol. 139, 231–240.
Fleming, R.H., Revelle, R., 1939. Physical Processes in the Ocean.
In: Trask, P.D. (Ed.), Recent marine sediments. American Asso-
ciation Petroleum Geologists, Tulsa, OK, pp. 48–141.
Gong, C., Hollander, D.J., 1996. Differential contribution of bacteria
to sedimentary organic matter in oxic and anoxic environments,
Santa Monica Basin, California. Org. Geochem. 26, 545–563.
Grabau, A.W., 1913. Principles of Stratigraphy. Seiler, New York.
1185 pp.
Hamilton-Smith, T., 1993. Stratigraphic effects of the Acadian or-
ogeny in the autochthonous Appalachian basin. In: Roy, D.C.,
Skehan, J.W. (Eds.), The Acadian Orogeny: Recent Studies in
New England, Maritime Canada, and the Autochthonous Fore-
land. Geological Society of America, Special Paper, vol. 275,
pp. 153–164. Boulder, CO.
Hartnett, H.E., Keil, R.G., Hedges, J.I., Devol, A.H., 1998. Influ-
ence of oxygen exposure time on organic carbon preservation in
continental margin sediments. Nature 391, 572–574.
Hayes, J.M., Takigiku, R., Ocampo, R., Callot, H., Albrecht, P.,
1987. Isotopic compositions and probable origins of organic
molecules in the Eocene Messel Shale. Nature 329, 48–51.
Hayes, J.M., Freeman, K.F., Popp, B.N., Hoham, C.H., 1990.
Compound specific isotopic analysis: a novel tool for recon-
struction of ancient biogeochemical processes. Org. Geochem.
16, 1115–1128.
Heckel, P.H., Witzke, B.J., 1979. Devonian world paleogeography
determined from distribution of carbonates and related lithic
paleoclimatic indicators. Paleontological Association, Special
Paper, vol. 23, pp. 99–123.
Helz, G.R., Miller, C.V., Charnock, J.M., Mosselmans, J.F.W., Pat-
trick, R.A.D., Garner, C.D., Vaughan, D.J., 1996. Mechanism of
molybdenum removal from the sea and its concentration in
black shales: EXAFS evidence. Geochim. Cosmochim. Acta
60, 3631–3642.
Henrichs, S.M., Reeburgh, W.S., 1987. Anaerobic mineralization of
marine sediment organic matter: rates and the role of anaerobic
processes in the oceanic carbon economy. Geomicrobiol. J. 5,
191–238.
House, M.R., 1981. Lower and Middle Devonian goniatite biostra-
tigraphy. In: Oliver Jr., W.A., Klapper, G. (Eds.), Devonian
Biostratigraphy of New York, Part 1. International Union of
Geological Sciences, Subcommission on Devonian Stratigraphy,
Washington, DC, pp. 33–37.
House, M.R., Kirchgasser, W.T., 1993. Devonian goniatite biostra-
tigraphy and timing of facies movements in the Frasnian of
eastern North America. In: Hailwood, E.A., Kidd, R.B. (Eds.),
High Resolution Stratigraphy. Geological Society Special Pub-
lication, vol. 70, pp. 267–292.
Ibach, L.E.J., 1982. Relationship between sedimentation rate and
total organic carbon content in ancient marine sediments. Am.
Assoc. Pet. Geol. Bull. 66, 170–188.
Ingall, E., Jahnke, R., 1997. Influence of water-column anoxia on
the elemental fractionation of carbon and phosphorus during
sediment diagenesis. Mar. Geol. 139, 219–229.
Ingall, E.D., Bustin, R.M., Van Cappellen, P., 1993. Influence of
water column anoxia on the burial and preservation of carbon
and phosphorus in marine shales. Geochim. Cosmochim. Acta
57, 303–316.
Isaacson, P.E., Grader, G.W., Diaz-Martinez, E., 1997. Late Devon-
ian glaciation (Famennian) in Gondwana and forced marine re-
gression in North America, Geological Society of America, 1997
Annual Meeting. Abstr. Programs - Geol. Soc. Am. 29 (6), 117.
Joachimski, M.M., 1997. Comparison of organic and inorganic
carbon isotope patterns across the Frasnian–Famennian boun-
dary. Palaeogeogr. Palaeoclimatol. Palaeoecol. 132, 133–145.
Joachimski, M.M., Ostertag-Henning, C., Pancost, R.D., Strauss,
H., Freeman, K.H., Littke, R., Sinninghe Damste, J.S., Racki,
G., 2001. Water column anoxia, enhanced productivity and con-
comitant changes in d13C and d34S across the Frasnian–Famen-
nian boundary (Kowala–Holy Cross Mountains/Poland). Chem.
Geol. 175, 109–131.
Johnson, J.G., Sandberg, C.A., 1988. Devonian eustatic events in
the western United States and their biostratigraphic responses.
In: McMillan, N.J., Embry, A.F., Glass, D.J. (Eds.), Devonian of
the World, III: Calgary, Alberta. Canadian Society of Petroleum
Geologists, Memoir, vol. 14, pp. 171–178.
Kauffman, E.G., 1981. Ecological reappraisal of the German Pos-
idonienschiefer (Toarcian) and the stagnant basin model. In:
Gray, J., Boucot, A.J., Berry, W.B.N. (Eds.), Communities of
the Past. Hutchinson Ross Publ., Stroudsburg, pp. 311–381.
Kepferle, R.C., 1993. A depositional model and basin analysis for
the gas-bearing black shale (Devonian and Mississippian) in the
Appalachian Basin. In: Roen, J.B., Kepferle, R.C. (Eds.), Petro-
leum Geology of the Devonian and Mississippian Black Shale
B.B. Sageman et al. / Chemical Geology 195 (2003) 229–273270

of Eastern North America. U.S. Geological Survey Bulletin,
vol. 1909, pp. F1–F23.
Kirchgasser, W.T., Over, D.J., Woodrow, D.L., 1994. Frasnian
(Upper Devonian) strata of the Genesee River Valley, western
New York state. In: Brett, C.E., Scatterday, J. (Eds.), New York
State Geological Association, 66th Annual Meeting Field Trip
Guidebook, pp. 325–358.
Klapper, G., 1971. Sequence within the conodont genus Polygna-
thus in the New York lower Middle Devonian. Geol. Palaeontol.
5, 59–79.
Klapper, G., 1981. Review of New York Devonian conodont bio-
stratigraphy. In: Oliver Jr., W.A., Klapper, G. (Eds.), Devonian
Biostratigraphy of New York, Part 1. International Union of
Geological Sciences, Subcommission on Devonian Stratigraphy,
Washington, DC, pp. 57–66.
Klapper, G., Becker, R.T., 1999. Comparison of Frasnian (Upper
Devonian) conodont zonations. Boll. Soc. Paleontol. Ital. 37,
339–348.
Kump, L.R., Arthur, M.A., 1999. Interpreting carbon-isotope excur-
sions: carbonates and organicmatter. Chem.Geol. 161, 181–198.
Kuypers, M.M.M., Blokker, P., Hopmans, E.C., Kinkel, H., Pan-
cost, R.D., Schouten, S., Sinninghe Damste, J., 2002. Archeal
remains dominate marine organic matter from the early Albian
ocean anoxic event Ib. Palaeogeography, Palaeoclimatology, Pa-
laeoecology 185, 211–234.
Lyons, T.W., 1997. Sulfur isotopic trends and pathways of iron
sulfide formation in upper Holocene sediments of the anoxic
Black Sea. Geochim. Cosmochim. Acta 61, 3367–3382.
Lyons, T.W., Werne, J.P., Hollander, D.J., 2002. Contrasting sulfur
geochemistry and Fe/Al and Mo/Al ratios across the last oxic-to-
anoxic transition in the Cariaco Basin, Venezuela. Chem. Geol.
195, 131–157 (this volume).
Martin, R.E., 1996. Secular increase in nutrient levels through the
Phanerozoic: implications for productivity, biomass, and diver-
sity of the marine biosphere. Palaios 11, 209–219.
McCollum, L.B., 1988. A shallow epeiric sea interpretation for an
offshore Middle Devonian black shale facies in eastern North
America. In: McMillan, N.J., Embry, A.F., Glass, D.J. (Eds.),
Devonian of the World II. Canadian Society of Petroleum Geol-
ogists, Memoir, vol. 14, pp. 347–355.
McGhee Jr., G.R., 1996. The Late Devonian Mass Extinction: The
Frasnian/Famennian Crisis. Columbia Univ. Press, New York.
303 pp.
McGhee, G.R., Sutton, R.G., 1985. Late Devonian marine ecosys-
tems of the lower West Falls Group in New York. In: Woodrow,
D.L., Sevon, W.D. (Eds.), The Catskill Delta. Geological Soci-
ety of America, Special Paper, vol. 201, pp. 199–210.
McManus, J., Berelson, W.M., Coale, K.H., Johnson, K.S., Kilgore,
T.E., 1997. Phosphorus regeneration in continental margin sedi-
ments. Geochim. Cosmochim. Acta 61, 2891–2907.
Meyers, P.A., 1994. Preservation of elemental and isotopic source
identification of sedimentary organic matter. Chem. Geol. 114,
289–302.
Middelburg, J.J., Calvert, S.E., Karlin, R., 1991. Organic-rich tran-
sitional facies in silled basins: response to sea-level change.
Geology 19, 679–682.
Murphy, A.E., 2000. Physical and biogeochemical mechanisms
of black shale deposition, and their implications for ecolog-
ical and evolutionary change in the Devonian Appalachian
basin. Unpublished PhD dissertation, Northwestern University,
363 pp.
Murphy, A.E., Sageman, B.B., Hollander, D.J., 1998. Interpreting
sea-level change from carbon isotopic shifts in organic matter:
examples from the Devonian Appalachian Basin. Abstr. Pro-
grams-Geol. Soc. Am. 30, 396.
Murphy, A.E., Sageman, B.B., Hollander, D.J., Ver Straeten, C.A.,
2000a. Organic carbon burial and faunal dynamics in the Appa-
lachian basin during the Devonian (Givetian – Famennian)
greenhouse: an integrated paleoecological/biogeochemical ap-
proach. In: Huber, B., MacLeod, K., Wing, S. (Eds.), Warm
Climates in Earth History. Cambridge Univ. Press, Cambridge,
UK, pp. 351–385.
Murphy, A.E., Sageman, B.B., Hollander, D.J., Lyons, T.W.,
Brett, C.E., 2000b. Black shale deposition in the Devonian
Appalachian Basin: siliciclastic starvation, episodic water-col-
umn mixing, and efficient recycling of biolimiting nutrients.
Paleoceanography 15, 280–291.
Murphy, A.E., Sageman, B.B., Hollander, D.J., 2000c. Eutrophica-
tion by decoupling of the marine biogeochemical cycles of C, N,
and P: a mechanism for the Late Devonian mass extinction.
Geology 28, 427–430.
Nijenhuis, I.A., Becker, J., DeLange, G.J., 2001. Geochemistry of
coeval sediments in Mediterranean ODP cores and a land sec-
tion: implications for sapropel formation models. Palaeogeogr.
Palaeoclimatol. Palaeoecol. 165, 97–112.
Oschmann, W., 1991. Anaerobic–poikiloaerobic–aerobic: a new
facies zonation for modern and ancient neritic redox facies.
In: Einsele, G., Ricken, W., Seilacher, A. (Eds.), Cycles and
Events in Stratigraphy. Springer-Verlag, Berlin, pp. 565–571.
Over, D.J., 1997. Conodont biostratigraphy of the Java Formation
(Upper Devonian) and the Frasnian–Famennian boundary in
western New York State. In: Klapper, G., Murphy, M.A, Tal-
ent, J.A. (Eds.), Paleozoic Sequence Stratigraphy, Biostrati-
graphy and Biogeography: Studies in Honor of J. Granville
(‘‘Jess’’) Johnson. Geological Society of America, Special Paper,
vol. 321, pp. 161–177.
Pashin, J.C., Ettensohn, F.R., 1991. Paleoecology and sedimentol-
ogy of the dysaerobic Bedford fauna (Late Devonian), Ohio and
Kentucky (USA). Palaeogeogr. Palaeoclimatol. Palaeoecol. 91,
470–483.
Pedersen, T.F., Calvert, S.E., 1990. Anoxia vs. productivity: what
controls the formation of organic-carbon-rich sediments and
sedimentary rocks? Am. Assoc. Pet. Geol. Bull. 74, 454–466.
Pepper, J.F., de Witt Jr., W., 1951. The stratigraphy of the Perrys-
burg Formation of Late Devonian age in western and west-cen-
tral New York. U.S. Geological Society Oil and Gas Investiga-
tions Chart OC-45, 2 sheets.
Piper, D.Z., 1994. Seawater as the source of minor elements in
black shales, phosphorites and other sedimentary rocks. Chem.
Geol. 114, 95–114.
Pompeckj, J.F., 1901. Die Juraablagerungen zwischen Regensburg
und Regenstauf. Geogr. Jahrb. 14, 139–220.
Popp, B.N., Laws, E.A., Bidigare, R.R., Dore, J.E., Hanson, K.L.,
Wakeham, S.G., 1998. Effect of phytoplankton cell geometry on
B.B. Sageman et al. / Chemical Geology 195 (2003) 229–273 271

carbon isotopic fractionation. Geochim. Cosmochim. Acta 62,
69–77.
Potter, P.E., Maynard, J.B., Pryor, W.A., 1982. Appalachian gas
bearing shales: statement and discussion. Oil Gas J. 80, 290–318.
Pratt, L.M., 1984. Influence of paleoenvironmental factors on
preservation of organic matter in the Middle Cretaceous Green-
horn Formation, Pueblo, CO. Am. Assoc. Pet. Geol. Bull. 68,
1146–1159.
Prave, A.R., Duke, W.L., Slattery, W., 1996. A depositional model
for storm- and tide-influenced prograding siliciclastic shorelines
from the Middle Devonian of the central Appalachian foreland
basin USA. Sedimentology 43, 611–629.
Raiswell, R., Canfield, D.C., 1998. Sources of iron for pyrite for-
mation in marine sediments. Am. J. Sci. 298, 219–245.
Raiswell, R., Buckley, F., Berner, R.A., Anderson, T.F., 1988. De-
gree of pyritization of iron as a paleoenvironmental indicator of
bottom water oxygenation. J. Sediment. Petrol. 58, 812–819.
Redfield, A.C., Ketchum, B.H., Richards, F.A., 1963. The influ-
ence of organisms on the composition or seawater. In: Hill,
M.N. (Ed.), The Sea, vol. 2. Wiley-Interscience, New York,
pp. 26–77.
Retallack, G.J., 1997. Early forest soils and their role in Devonian
global change. Science 276, 583–585.
Rickard, L.V., 1975. Correlation of the Devonian rocks in New
York State. New York Museum and Science Service, Map and
Chart Series, No. 24.
Rohl, H.-J., Schmid-Rohl, A., Oschmann, W., Frimmel, A.,
Schwark, L., 2001. The Posidonia shale (Lower Toarcian) of
SW Germany: an oxygen-depleted ecosystem controlled by
sea-level and palaeoclimate. Palaeogeogr. Palaeoclimatol. Palae-
oecol. 165, 27–52.
Sageman, B.B., 1985. High-resolution stratigraphy and paleobiol-
ogy of the Hartland Shale Member: analysis of an oxygen-de-
ficient epicontinental sea. In: Pratt, L.M., Kaufmann, E.G., Zelt,
F.B. (Eds.), Fine-Grained Deposits and Biofacies of the Creta-
ceous Western Interior Seaway: Evidence of Cyclic Sedimentary
Processes. Society Economic Paleontologists and Mineralogists
Field Trip Guidebook, vol. 4, pp. 110–121.
Sageman, B.B., Wignall, P.B., Kauffman, E.G., 1991. Biofacies
models for organic-rich facies: tool for paleoenvironmental
analysis. In: Einsele, G., Seilacher, A., Ricken, W. (Eds.),
Cycles and Events in Stratigraphy. Springer Verlag, Berlin,
pp. 542–564.
Saelen, G., Tyson, R.V., Talbot, M.R., Telnaes, N., 1998. Evi-
dence of recycling of isotopically light CO2(aq) in stratified
black shale basins: contrasts between the Whitby Mudstone
and Kimmeridge Clay formations, United Kingdom. Geology
26, 747–750.
Sarnthein, M., Pflaumann, U., Ross, R., Tiedemann, R., Winn, K.,
1992. Transfer functions to reconstruct ocean palaeoproductiv-
ity: a comparison. In: Summerhayes, C.P., Prell, W.L, Emeis,
K.-C. (Eds.), Upwelling Systems: Evolution Since the EarlyMio-
cene. Geological Society London Special Publication, vol. 64,
pp. 411–427.
Schieber, J., 1999. Distribution and deposition of mudstone facies
in the Upper Devonian Sonyea Group of New York. J. Sedi-
ment. Res. 69, 909–925.
Schieber, J., Krinsley, D., Riciputi, L., 2000. Diagenetic origin of
quartz silt in mudstones and implications for silica cycling.
Nature 406, 981–985.
Scholle, P.A., Arthur, M.A., 1980. Carbon isotope fluctuations in
Cretaceous pelagic limestones: potential stratigraphic and petro-
leum exploration tool. Am. Assoc. Pet. Geol. Bull. 64, 67–87.
Scotese, C.R., McKerrow, W.S., 1990. Revised world maps and
introduction. In: McKerrow, W.S., Scotese, C.R. (Eds.), Paleo-
zoic Paleogeography and Biogeography. Geological Society,
Memoir, vol. 12, pp. 1–21.
Scotese, C.R., Barrett, S.F., Van der Voo, R., 1985. Silurian and De-
vonian base maps. Philos. Trans. R. Soc. Lond., B 309, 57–77.
Schuchert, C., 1915. The conditions of black shale deposition as
illustrated by Kuperschiefer and Lias of Germany. Proc. Am.
Philos. Soc. 54, 259–269.
Schimmield, G.B., 1992. Can sediment geochemistry record
changes in costal upwelling palaeoproductivity? Evidence from
Northwest Africa and the Arabian Sea. In: Summerhayes, C.P.,
Prell, W.L., Emeis, K.-C. (Eds.), Upwelling systems: evolution
since the early Miocene. Geological Society Special Publication,
vol. 28, pp. 29–46.
Stach, E., Mackowsky, M.T., Teichmueller, M., Taylor, G.H.,
Chandra, D., Teichmueller, R., 1982. Stach’s Textbook of Coal
Petrology. Schweizerbart’sche Verlagbuchhandlung, Stuttgart.
569 pp.
Stein, R., 1986. Surface-water paleo-productivity as inferred from
sediments deposited in oxic and anoxic deep-water environ-
ments of the Mesozoic Atlantic Ocean. In: Degens, E.T.,
Meyers, P.A., Brasell, S.C. (Eds.), Biogeochemistry of Black
Shales: Case Studies From a Workshop. Mitteilungen aus dem
Geologisch-Palaeontologischen Institut der Universitaet Ham-
burg, vol. 60, pp. 55–70.
Stein, R., 1990. Organic carbon/sedimentation rate relationship and
its paleoenvironmental significance for marine sediments. Geo-
Mar. Lett. 10, 851–867.
Stumm, W., Morgan, J.J., 1981. Aquatic Chemistry: An Introduc-
tion Emphasizing Chemical Equilibria in Natural Waters. Wiley,
New York, p. 780.
Suess, E., 1980. Particulate organic carbon flux in the oceans: sur-
face productivity and oxygen utilization. Nature 288, 260–263.
Thompson, J.B., Newton, C.R., 1987. Ecological reinterpretation of
the dysaerobic Leiorhyncus fauna, Upper Devonian Geneseo
black shale, central New York. Palaios 2, 274–281.
Tucker, R.D., Bradley, D.C., Ver Straeten, C.A., Harris, A.G.,
Ebert, J., McCutcheon, S.R., 1998. New U–Pb zircon ages
and the duration and division of Devonian time. Earth Planet.
Sci. Lett. 158, 175–186.
Twenhofel, W.H., 1915. Notes on black shale in the making. Am. J.
Sci. 40, 272–280.
Tyrrell, T., Law, C.S., 1997. Low nitrate-phosphate ratios in the
global ocean. Nature 387, 793–796.
Tyson, R.V., 1995. Sedimentary Organic Matter: Organic Facies
and Palynofacies. Chapman & Hall, London. 615 pp.
Tyson, R.V., 2001. Sedimentation rate, dilution, preservation and
total organic carbon: some results of a modeling study. Org.
Geochem. 32, 333–339.
Tyson, R.V., Pearson, T.H., 1991. Modern and ancient continental
B.B. Sageman et al. / Chemical Geology 195 (2003) 229–273272

shelf anoxia: an overview. In: Tyson, R.V., Pearson, T.H. (Eds.),
Modern and Ancient Continental Shelf Anoxia. Geological
Society Special Publication, vol. 58, pp. 1–24.
Van Cappellen, P., Ingall, E.D., 1994. Benthic phosphorus regener-
ation, net primary production, and ocean anoxia: a model of the
coupled marine biogeochemical cycles of carbon and phospho-
rus. Paleoceanography 9, 677–692.
Van der Voo, R., 1983. Paleomagnetic constraints on the assembly
of the Old Red Continent. Tectonophysics 91, 271–283.
Van Der Zwann, G.J., Jorissen, F.J., 1991. Biofacial patterns in
River induced shelf anoxia. In: Tyson, R.V., Pearson, T.H.
(Eds.), Modern and Ancient Continental Shelf Anoxia. Geolog-
ical Society Special Publication, vol. 58, pp. 65–82.
Ver Straeten, C.A., Brett, C.E., 1995. Lower and Middle Devonian
foreland basin fill in the Catskill Front: stratigraphic synthesis,
sequence stratigraphy, and the Acadian Orogeny. In: Garver, J.I.,
Smith, J.A. (Eds.), New York State Geological Association, 67th
Annual Meeting Field Trip Guidebook, pp. 313–356.
Ver Straeten, C.A., Griffing, D.H., Brett, C.E., 1994. The lower part
of the Middle Devonian Marcellus ‘‘Shale’’, central to western
New York State: stratigraphy and depositional history. In: Brett,
C.E., Scatterday, J. (Eds.), New York State Geological Associa-
tion, 66th Annual Meeting Field Trip Guidebook, pp. 271–321.
Werne, J.P., Hollander, D.J., Lyons, T.W., Peterson, L.C., 2000.
Climate-induced variations in productivity and planktonic eco-
system structure from the Younger Dryas to Holocene in the
Cariaco Basin, Venezuela. Paleoceanography 15, 19–29.
Werne, J.P., Sageman, B.B., Lyons, T.W., Hollander, D.J., 2002. An
integrated assessment of a ‘‘type euxinic’’ deposit: evidence for
multiple controls on black shale deposition in the middle Dev-
onian Oatka Creek Formation. Am. J. Sci. 302, 110–143.
Wignall, P.B., 1994. Black Shales. Clarendon Press, Oxford. 127 pp.
Wignall, P.B., Hallam, A., 1991. Biofacies, stratigraphic distribu-
tion, and depositional models of British onshore Jurassic black
shales. In: Tyson, R.V., Pearson, T.H. (Eds.), Modern and An-
cient Continental Shelf Anoxia. Geological Society Special Pub-
lication, vol. 58, pp. 291–309.
Witzke, B.J., Heckel, P.H., 1988. Paleoclimatic indicators and in-
ferred Devonian paleolatitudes of Euramerica. In: McMillan,
N.J., Embry, A.F., Glass, D.J. (Eds.), Devonian of the World,
I. Canadian Society of Petroleum Geologists, Memoir, vol. 14,
pp. 49–63.
Woodrow, D.L., 1985. Paleogeography, paleoclimate, and sedimen-
tary processes of the Late Devonian Catskill Delta. In: Wood-
row, D.L., Sevon, W.D. (Eds.), The Catskill Delta. Geological
Society of America, Special Paper, vol. 201, pp. 51–63.
Woodrow, D.L., Fletcher, F.W., Ahrnsbrak, W.F., 1973. Paleo-
geography and paleoclimate at the depositional sites of the
Devonian Catskill and Old Red Facies. Geol. Soc. Amer. Bull.
84, 3051–3064.
Woodrow, D.L., Dennison, J.M., Ettensohn, F.R., Sevon, W.T.,
Kirchgasser, W.T., 1988. Middle and Upper Devonian stratig-
raphy and paleogeography of the central and southern Appala-
chians and eastern Midcontinent, U.S.A. In: McMillan, N.J.,
Embry, A.F., Glass, D.J. (Eds.), Devonian of the World, I.
Canadian Society of Petroleum Geologists, Memoir, vol. 14,
pp. 277–301.
Wortmann, U.G., Hesse, R., Zacher, W., 1999. Major element anal-
ysis of cyclic black shales: paleoceanographic implications for
the Early Cretaceous deep western Tethys. Paleoceanography
14, 525–541.
Yochelson, E.L., Lindemann, R.H., 1986. Considerations on the
systematic placement of the Styliolines (incertae sedis: Devon-
ian). In: Hoffman, A., Nitecki, N.H. (Eds.), Problematic Fossil
Taxa. Oxford Monographs in Geology and Geophysics, vol. 5,
pp. 45–58.
B.B. Sageman et al. / Chemical Geology 195 (2003) 229–273 273