A T L A N T I C O C E A NC A P E R O U G E P E N I N S U L A B r c h 5 B a y Piller Bay G R O A I S...
1
( ( ( ( ( ( ( ( # 56 o 00' 51 o 00' Coles Pond N O R T H E R N P E N I N S U L A CONCHE HARBOUR C O N C H E P E N I N S U L A CAPE ROUGE HARBOUR C A P E R O U G E P E N I N S U L A Birch Ba y Piller Bay G R O A I S I S L A N D B E L L I S L A N D G R E Y I S L A N D S A T L A N T I C O C E A N 55 o 30' 51 o 00' 55 o 30' 50 o 45' 50 o 45' 56 o 00' 500 5 0 0 75 0 5 00 250 7 5 0 7 50 750 5 0 0 2 50 7 5 0 7 50 2 5 0 5 0 0 250 7 50 750 7 5 0 750 50 0 750 250 500 5 0 750 750 250 50 0 7 50 750 750 750 7 5 0 750 75 0 25 0 50 750 250 75 0 5 0 0 75 0 5 00 500 500 5 0 0 50 5 0 50 50 5 00 500 2 5 0 25 0 2 50 2 5 0 250 2 50 250 2 50 5 0 50 5 00 5 00 5 0 0 5 0 0 500 5 0 0 5 0 0 5 0 50 5 0 5 0 5 0 250 2 5 0 2 50 25 0 250 250 750 7 5 0 75 0 2 5 0 250 250 25 0 2 5 0 7 5 0 7 5 0 750 2 5 0 250 250 5 0 50 5 0 50 50 0 5 00 500 2 50 2 5 0 2 50 7 5 0 750 2 5 0 750 75 0 750 500 25 0 953001 953000 872020 872019 783699 783696, 97 783695 783698 2 5 0 25 0 5 0 50 5 0 5 0 50 50 5 0 50 50 5 0 50 50 5 0 50 50 50 5 0 50 5 0 50 5 0 50 2 5 0 25 0 250 25 0 250 250 2 5 0 250 250 25 0 250 2 50 2 50 2 5 0 2 5 0 75 0 50 0 50 0 500 50 0 50 0 50 0 50 0 5 00 5 00 50 0 5 0 0 5 0 0 5 00 50 0 500 500 50 0 50 0 5 0 0 5 0 0 500 500 5 0 0 50 0 5 00 250 250 GRANULAR-AGGREGATE RESOURCES OF THE GROAIS ISLAND MAP AREA (NTS 2L/13) OPEN FILE 002L/13/0014 MAP 2008-37 LEGEND Sample types (based on laboratory sieve analysis - see Table 1) Sample Symbol Definition Note This is a composite legend for all granular-aggregate resource maps. All aggregate zones and sample types shown in the legend may not appear on this map. Aggregate zone classification is based on airphoto interpretation, field investigation and sieve analyses. Areas outside the coloured zones have no known potential for granular materials; however silty tills, rock rubble suitable for fill, and bedrock suitable for aggregate may be present. Classification criteria used on this map do not consider current or conflicting land uses, nor do they guarantee either access to, or the quality of, the material located within these zones. Multiple samples taken from the same site in different years are listed in order from oldest to youngest. Multiple samples taken at the same site in the same year are listed in order, from the top of the exposure to bottom. G E O L O G I C A L S U R V EY N E W F O U N D L A N D A N D L A B R A D O R 1864 Table 1: Exposure thickness (Exp), estimated deposit thickness (Dep), petrographic number (PN), grain-size percentages (based on percent retained on the 63 mm down to the -0.062 mm mesh sieves) and gravel (Grv), sand and silt-clay (SL-CL) content of sample material collected in NTS area 2L/13. GRAIN-SIZE ANALYSES Commonly gravel or sand, having silt-clay content < 5 percent. Deposits are commonly graded and stratified. Commonly till, poorly graded and of variable grain size, having a silt-clay content (> 5 and < 15 percent) and stone size exceeding allowable limits for most geotechnical purposes (except subgrade uses) without processing (i.e., washing, screening or crushing). Commonly silty till, silt or clay samples, having silt-clay content > 15 percent. ZONES OF AGGREGATE POTENTIAL Contains granular materials; probability of locating economic deposits is moderate to high Contain thin (less than 2 m) or discontinuous granular materials; also includes areas where extent of thicker deposits could not be determined by field investigation; probability of locating economic deposits is moderate to low May contain granular materials but deposits are not substantiated by field investigation; probability of locating economic deposits is moderate to low Material of granular composition (e.g., sandy tills and colluvium) that generally contains up to 8 percent silt-clay content, but could be improved for higher grade uses by washing or screening Contains sand-size granular materials; high potential for economic exploitation of sand; low to moderate potential for coarser granular materials Eskers: sinuous ridges of granular materials; moderate to high potential for economic exploitation Study Area within the dashed outline In addition to this map data, a granular-aggregate database is accessible in the Geoscience Resource Atlas of Newfoundland and Labrador (http://gis.geosurv.gov.nl.ca) for all granular-aggregate maps and sample data. The database provides information on more than 13 000 samples collected from 230, 1:50 000-scale-map areas in Newfoundland and Labrador. This map was originally produced in a series of blueline maps from airphoto interpretation and field work (Environmental Geology Section, 1983). In some map areas additional sample data was collected after the publication date. The location of roads added to topographic map base are approximate. Elevation in feet above mean sea level. Contour interval 50 feet. Digital Cartography by T.J. Sears, Geological Survey, Department of Natural Resources, Government of Newfoundland and Labrador. Copies of this map may be obtained from the Geoscience Publication and Information Section, Geological Survey, Department of Natural Resources, Government of Newfoundland and Labrador, P.O. Box 8700, St. John’s, NL, Canada, A1B 4J6. This map is subject to review and revision. Comments to the author concerning errors or omissions are invited. Base from maps published by Surveys and Mapping Branch, Department of Natural Resources, Ottawa, Canada. OPEN FILE 002L/13/0014 This map supercedes Map 82-133, Open File NFLD/1300. PUBLISHED 2008 REFERENCES Environmental Geology Section Note Open File reports and maps issued by the Geological Survey Division of the Newfoundland and Labrador Department of Natural Resources are made available for public use without being formally edited or peer reviewed. They are based upon preliminary data and evaluation. The purchaser agrees not to provide a digital reproduction or copy of this product to a third party. Derivative products should acknowledge the source of the data. Disclaimer The Geological Survey, a division of the Department of Natural Resources (the “authors and publishers”), retains the sole right to the original data and information found in any product produced. The authors and publishers assume no legal liability or responsibility for any alterations, changes or misrepresentations made by third parties with respect to these products or the original data. Furthermore, the Geological Survey assumes no liability with respect to digital reproductions or copies of original products or for derivative products made by third parties. Please consult with the Geological Survey in order to ensure originality and correctness of data and/or products. <><><><> 2008: Granular-aggregate resources of the Groais Island map area (NTS 02L/13). Government of Newfoundland and Labrador, Department of Natural Resources, Geological Survey, Map 2008-37, Open File 002L/13/0014. 1983: 1:50 000 scale aggregate resource maps outlining zones of aggregate potential within a 6-km-wide corridor in Newfoundland. Newfoundland Department of Mines and Energy, Mineral Development Division, Open File NFLD/1300. Kirby, F.T., Ricketts, R.J. and Vanderveer, D.G. 1983: Inventory of aggregate resources in Newfoundland and Labrador; information report and index maps. Newfoundland Department of Mines and Energy, Mineral Development Division, Report 83-2, 36 pages. Recommended citation Ricketts, M.J. E-mail: [email protected] Website: http://www.nr.gov.nl.ca/mines&en/geosurvey/ MAP 2008-37 GROAIS ISLAND NEWFOUNDLAND & LABRADOR 1 0 1 2 3 4 0.5 Kilometres 2 L / 1 3 Sample Exp Dep PN 63 32 16 8 4 2 1 0.5 0.25 0.125 0.062 <0.062 Grv Sand SL-CL 783695 4.0 4.0 30 7.0 43.6 21.8 12.5 5.5 4.3 2.1 0.9 1.0 0.7 0.2 0.4 89.0 10.5 0.5 783696 5.0 8.0 28 0.0 17.1 17.8 12.4 8.2 11.7 14.3 13.0 4.2 0.9 0.2 0.2 53.4 46.3 0.2 783697 0.7 0.7 0 0.0 0.0 0.0 0.0 5.0 1.3 2.6 13.6 63.6 11.6 1.0 1.2 3.8 94.8 1.5 783698 1.0 1.0 0 0.0 0.0 0.0 0.0 17.5 20.9 21.1 14.7 9.4 7.0 3.2 6.1 13.2 80.0 6.9 783699 4.0 4.0 28 29.8 31.3 9.7 6.0 3.8 3.9 4.3 6.3 3.6 0.7 0.3 0.4 79.5 20.0 0.5 872019 1.8 5.0 51 11.7 18.5 16.8 21.0 11.6 6.7 4.7 5.5 2.9 0.3 0.2 0.2 76.6 23.1 0.3 872020 5.5 8.0 58 18.9 14.7 12.6 13.3 7.7 12.7 9.8 3.8 2.3 1.8 0.8 1.5 65.4 32.9 1.7 953000 3.8 4.0 47 19.2 7.5 18.5 32.2 19.1 2.5 0.3 0.1 0.2 0.2 0.1 0.1 91.7 8.2 0.1 953001 8.0 8.0 37 0.0 10.5 28.4 29.2 15.0 12.2 2.6 0.3 0.5 0.8 0.2 0.1 79.4 20.3 0.2 1L 2L 1K 2F 2E 1N 11I 2K 2C 2D 2N 1M 12I 2M 11J 11P 12J 12B 12A 11O 12H 12P 12G 12O N E W F O U N D L A N D INDEX MAP 0 80 km Grain-size results from the 63, 32, 16 and 8 mm mesh sieves were obtained at the sample site location by sieving between 10 and 15 kg of material. A 500 to 1000 gm split of the <8 mm material (sand-silt-clay) was retained for laboratory sieve analysis. Laboratory sieve analyses included the use of seven sieves with mesh openings of 4, 2, 1, 0.5, 0.25, 0.125, 0.062 and the -0.062 mm pan fraction. Samples were wet and/or dry sieved (Kirby et al., 1983) depending on silt-clay content and consolidation of particles. et al.,
Transcript of A T L A N T I C O C E A NC A P E R O U G E P E N I N S U L A B r c h 5 B a y Piller Bay G R O A I S...
(((
(
(
(((
#
56o00'51o00'
Coles Pond
N O
R
T
H E
R
N
P
E
N I
N
S
U L
A
CONCHEHARBOUR
C O
N C
H E
P
E N
I N
S U
L A
CAPE ROUGEHARBOUR
C A P E R O U G E P E N I N S U L A
Bir
ch
Bay
Piller Bay
G R O A I S
I S L A N D
B E L L I S
L A N D
G R E Y I S L A N D S
A T L A N T I C O C E A N
55o30'51o00'
55o30'50o45'50o45'
56o00'
500
500
750
500
250
750
750
750
500
250
750
750
250
500
250
750
750
750
750
500
750
250
500
5075
0750
250
500
750
750
750
750
750
750
750
250
50
750
250
750
500
750
500
500
500
500
50
50
50
50
500
500
250
250
250
250
250
250
250
250
50
50
500
500
500
500
500
500
500 50
50
50
50
50
250
250
250
250
250
250
750
750
750
250
250
250
250
250
750
750
750
250
250
250
50
50
50
50
500
500
500
250
250
250
750
750
250
750
750
750
500
250
953001953000872020
872019
783699
783696, 97783695
783698
250
250
50
50
50
50
5050
50
50
50
50
50
50
50
50
50
50
50
50
50
50
50
50
250
250
250
250
250
250
250
250
250
250
250
250
250
250
250
750
500
500
500
500
500
500
500
500
500
500
500
500
500
50 0
500
500 50
0
50 0
500
500
500
500
500
500
500
250
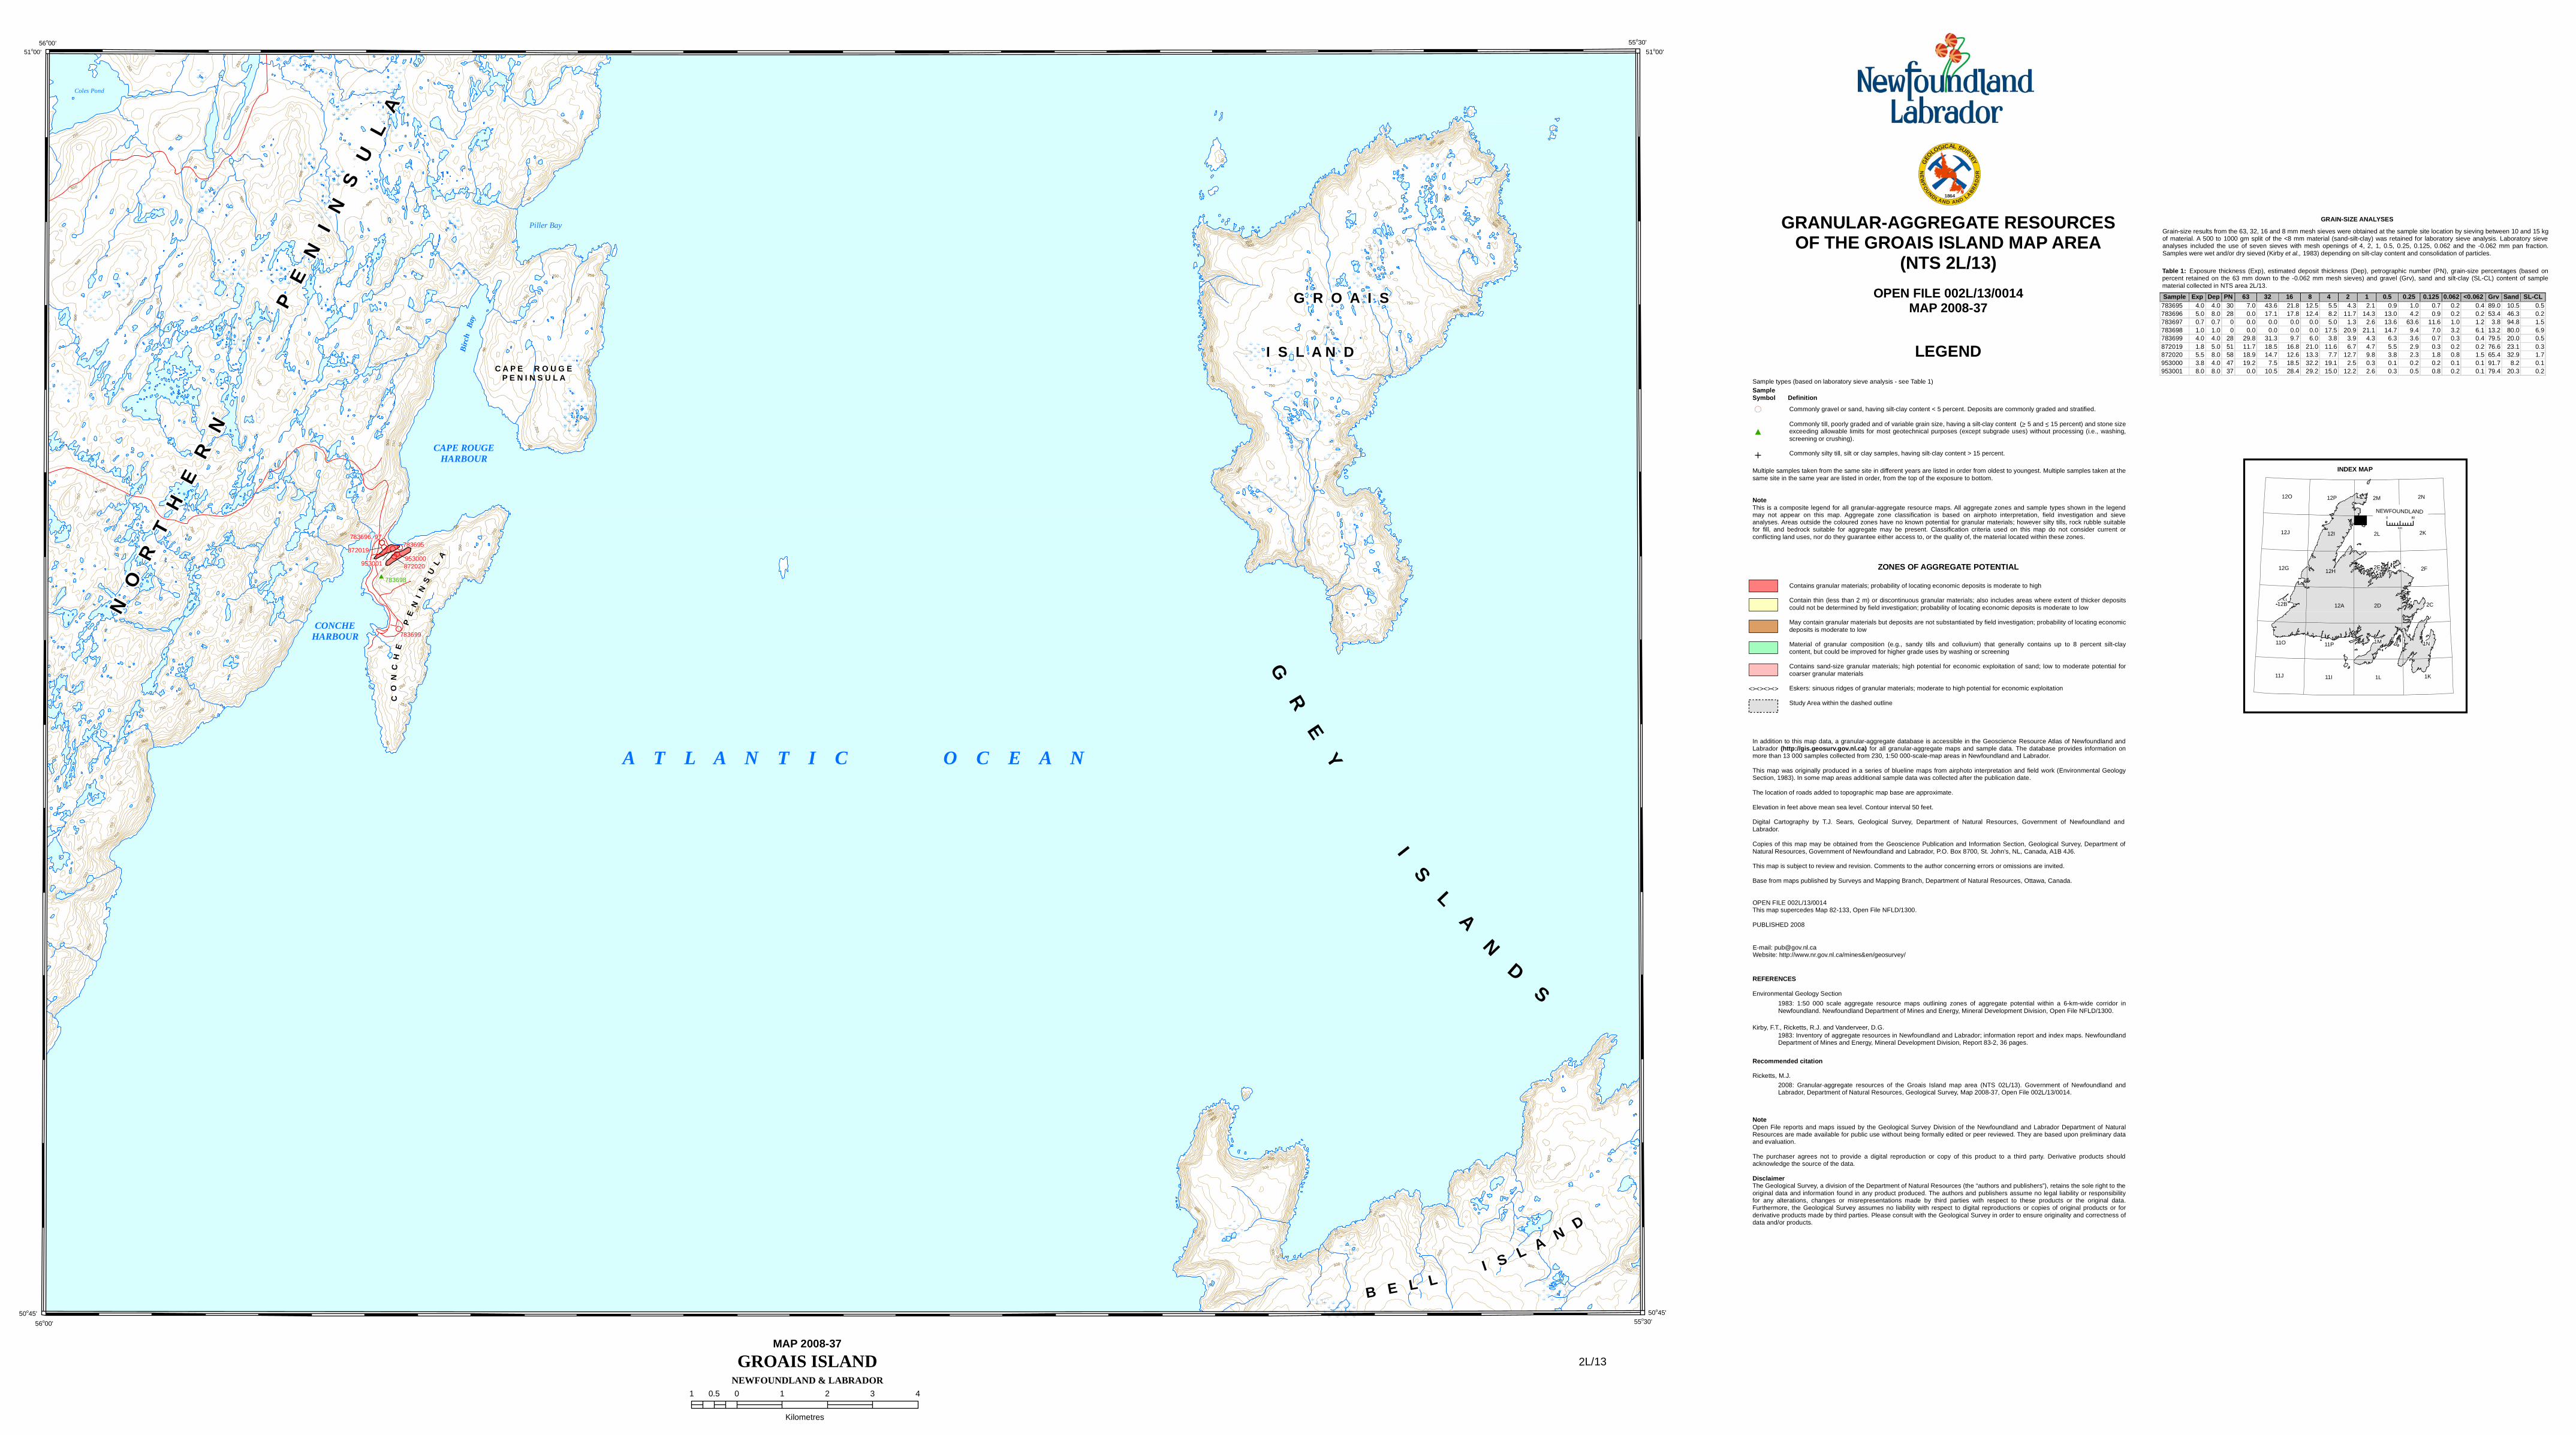
250 GRANULAR-AGGREGATE RESOURCESOF THE GROAIS ISLAND MAP AREA
(NTS 2L/13)OPEN FILE 002L/13/0014
MAP 2008-37
LEGENDSample types (based on laboratory sieve analysis - see Table 1)SampleSymbol Definition
NoteThis is a composite legend for all granular-aggregate resource maps. All aggregate zones and sample types shown in the legendmay not appear on this map. Aggregate zone classification is based on airphoto interpretation, field investigation and sieveanalyses. Areas outside the coloured zones have no known potential for granular materials; however silty tills, rock rubble suitablefor fill, and bedrock suitable for aggregate may be present. Classification criteria used on this map do not consider current orconflicting land uses, nor do they guarantee either access to, or the quality of, the material located within these zones.
Multiple samples taken from the same site in different years are listed in order from oldest to youngest. Multiple samples taken at thesame site in the same year are listed in order, from the top of the exposure to bottom.
GEOLOGICAL
SURVEY
NE
WFO
UNDLAND
AND LABRA
DO
R
1864
Table 1: Exposure thickness (Exp), estimated deposit thickness (Dep), petrographic number (PN), grain-size percentages (based onpercent retained on the 63 mm down to the -0.062 mm mesh sieves) and gravel (Grv), sand and silt-clay (SL-CL) content of samplematerial collected in NTS area 2L/13.
GRAIN-SIZE ANALYSES
Commonly gravel or sand, having silt-clay content < 5 percent. Deposits are commonly graded and stratified.
Commonly till, poorly graded and of variable grain size, having a silt-clay content (> 5 and < 15 percent) and stone sizeexceeding allowable limits for most geotechnical purposes (except subgrade uses) without processing (i.e., washing,screening or crushing).
Commonly silty till, silt or clay samples, having silt-clay content > 15 percent.
ZONES OF AGGREGATE POTENTIAL
Contains granular materials; probability of locating economic deposits is moderate to high
Contain thin (less than 2 m) or discontinuous granular materials; also includes areas where extent of thicker depositscould not be determined by field investigation; probability of locating economic deposits is moderate to low
May contain granular materials but deposits are not substantiated by field investigation; probability of locating economicdeposits is moderate to low
Material of granular composition (e.g., sandy tills and colluvium) that generally contains up to 8 percent silt-claycontent, but could be improved for higher grade uses by washing or screening
Contains sand-size granular materials; high potential for economic exploitation of sand; low to moderate potential forcoarser granular materials
Eskers: sinuous ridges of granular materials; moderate to high potential for economic exploitation
Study Area within the dashed outline
In addition to this map data, a granular-aggregate database is accessible in the Geoscience Resource Atlas of Newfoundland andLabrador (http://gis.geosurv.gov.nl.ca) for all granular-aggregate maps and sample data. The database provides information onmore than 13 000 samples collected from 230, 1:50 000-scale-map areas in Newfoundland and Labrador.
This map was originally produced in a series of blueline maps from airphoto interpretation and field work (Environmental GeologySection, 1983). In some map areas additional sample data was collected after the publication date.
The location of roads added to topographic map base are approximate.
Elevation in feet above mean sea level. Contour interval 50 feet.
Digital Cartography by T.J. Sears, Geological Survey, Department of Natural Resources, Government of Newfoundland andLabrador.
Copies of this map may be obtained from the Geoscience Publication and Information Section, Geological Survey, Department ofNatural Resources, Government of Newfoundland and Labrador, P.O. Box 8700, St. John’s, NL, Canada, A1B 4J6.
This map is subject to review and revision. Comments to the author concerning errors or omissions are invited.
Base from maps published by Surveys and Mapping Branch, Department of Natural Resources, Ottawa, Canada.
OPEN FILE 002L/13/0014This map supercedes Map 82-133, Open File NFLD/1300.
PUBLISHED 2008
REFERENCES
Environmental Geology Section
NoteOpen File reports and maps issued by the Geological Survey Division of the Newfoundland and Labrador Department of NaturalResources are made available for public use without being formally edited or peer reviewed. They are based upon preliminary dataand evaluation.
The purchaser agrees not to provide a digital reproduction or copy of this product to a third party. Derivative products shouldacknowledge the source of the data.
DisclaimerThe Geological Survey, a division of the Department of Natural Resources (the “authors and publishers”), retains the sole right to theoriginal data and information found in any product produced. The authors and publishers assume no legal liability or responsibilityfor any alterations, changes or misrepresentations made by third parties with respect to these products or the original data.Furthermore, the Geological Survey assumes no liability with respect to digital reproductions or copies of original products or forderivative products made by third parties. Please consult with the Geological Survey in order to ensure originality and correctness ofdata and/or products.
<><><><>
2008: Granular-aggregate resources of the Groais Island map area (NTS 02L/13). Government of Newfoundland andLabrador, Department of Natural Resources, Geological Survey, Map 2008-37, Open File 002L/13/0014.
1983: 1:50 000 scale aggregate resource maps outlining zones of aggregate potential within a 6-km-wide corridor inNewfoundland. Newfoundland Department of Mines and Energy, Mineral Development Division, Open File NFLD/1300.
Kirby, F.T., Ricketts, R.J. and Vanderveer, D.G.1983: Inventory of aggregate resources in Newfoundland and Labrador; information report and index maps. NewfoundlandDepartment of Mines and Energy, Mineral Development Division, Report 83-2, 36 pages.
Recommended citation
Ricketts, M.J.
E-mail: [email protected]: http://www.nr.gov.nl.ca/mines&en/geosurvey/
MAP 2008-37
GROAIS ISLANDNEWFOUNDLAND & LABRADOR
1 0 1 2 3 40.5
Kilometres
2L/13
Sample Exp Dep PN 63 32 16 8 4 2 1 0.5 0.25 0.125 0.062 <0.062 Grv Sand SL-CL 783695 4.0 4.0 30 7.0 43.6 21.8 12.5 5.5 4.3 2.1 0.9 1.0 0.7 0.2 0.4 89.0 10.5 0.5 783696 5.0 8.0 28 0.0 17.1 17.8 12.4 8.2 11.7 14.3 13.0 4.2 0.9 0.2 0.2 53.4 46.3 0.2 783697 0.7 0.7 0 0.0 0.0 0.0 0.0 5.0 1.3 2.6 13.6 63.6 11.6 1.0 1.2 3.8 94.8 1.5 783698 1.0 1.0 0 0.0 0.0 0.0 0.0 17.5 20.9 21.1 14.7 9.4 7.0 3.2 6.1 13.2 80.0 6.9 783699 4.0 4.0 28 29.8 31.3 9.7 6.0 3.8 3.9 4.3 6.3 3.6 0.7 0.3 0.4 79.5 20.0 0.5 872019 1.8 5.0 51 11.7 18.5 16.8 21.0 11.6 6.7 4.7 5.5 2.9 0.3 0.2 0.2 76.6 23.1 0.3 872020 5.5 8.0 58 18.9 14.7 12.6 13.3 7.7 12.7 9.8 3.8 2.3 1.8 0.8 1.5 65.4 32.9 1.7 953000 3.8 4.0 47 19.2 7.5 18.5 32.2 19.1 2.5 0.3 0.1 0.2 0.2 0.1 0.1 91.7 8.2 0.1 953001 8.0 8.0 37 0.0 10.5 28.4 29.2 15.0 12.2 2.6 0.3 0.5 0.8 0.2 0.1 79.4 20.3 0.2
1L
2L
1K
2F2E
1N
11I
2K
2C2D
2N
1M
12I
2M
11J
11P
12J
12B 12A
11O
12H
12P
12G
12O
NEWFOUNDLAND
INDEX MAP
0 80
km
Grain-size results from the 63, 32, 16 and 8 mm mesh sieves were obtained at the sample site location by sieving between 10 and 15 kgof material. A 500 to 1000 gm split of the <8 mm material (sand-silt-clay) was retained for laboratory sieve analysis. Laboratory sieveanalyses included the use of seven sieves with mesh openings of 4, 2, 1, 0.5, 0.25, 0.125, 0.062 and the -0.062 mm pan fraction.Samples were wet and/or dry sieved (Kirby et al., 1983) depending on silt-clay content and consolidation of particles.et al.,