A System of Equations Model of UK Tourism Demand in Neighbouring Countries
13
A system of equations model of UK tourism demand in neighbouring countries MARIA DE MELLO, ALAN PACK* and M. THEA SINCLAIRz Nottingham University Business School, University of Nottingham, Jubilee Campus, Wollaton Road, Nottin gham NG8 1BB, UK and *Department of Econo mics, University of Kent, Canterbury, Kent CT2 7NP, UK This paper uses a system of equations model to examine tourism demand during periods of destination country transition and integration into the wider international community. The Almost Ideal Demand System model is applied to the UK demand for to urism i n the neig hbo uring desti na tions, France, Spain and Portugal. Spain and Portugal are interesting cases as, during the period under consideration, they exp erie nced a pro cess of tra nsi tion from eco nomies wit h cha rac ter ist ics typ ical of dev elopi ng coun tries, on ly ente ring the World Bank’s industrializ ed countries classi®cation in the 1980s. The paper examines the evolution of tourism demand during these countries’ transition from `developing’ to `developed’ status. Considera- tion of France as a neighbouring destination also allows the behaviour of tourism demand to be compared between relatively rich and poor countries. The results show the extent to which the cross-country behaviour of demand becomes more or less similar over time with respect to changes in expenditure and e V ective prices. The expenditure elasticities are greater for Spain than France during the initial period, indi cating that tour ism can assist countr ies to `cat ch-u p’ with their richer neigh- bours. However, this outcome is not always the case and may not persist, as Portugal had a low initial expenditure elasticity and Spain’s relatively high expenditure elas- tic ity decreased over time. Destinations’ sen sit ivi ty to changes in their own and competitors’ prices can also change over time, as indicated by the increases in the own- and cross-price elasticities for Spain, compared with the decreases for France and Port ug al. The cros s-pr ice elas tici ty esti mates indi cate subs titu tabi lity betwee n the immediate neighbours, Portugal and Spain, and France and Spain. I. INTRODUCTION Tourism has important impacts on the economies of both deve loping and indu stri alized coun tries, resu lting i n job creation, additional income for the private and public sec- tor s, fo reig n curre ncy rece ipt s, hig her inv est me nt and gro wth. Ind eed, tou rism has acted as a cat aly st to eco - nomic restructuring in many recipient countries, assisting a shift away from primary sector activities, towards greater reliance on services and manufacturing. Given the scale of tour ism’s cont ribu tion to the mac roecono m y over time, kno wled ge con cer ning the na ture of the demand upon which it is based is of both theoretical and practical rele- vance. It is well known that tourism demand is responsive to such variables as income, relative prices and exchange rates. Wh at is not known is how the res pon siv ene ss of demand to changes in these variables alters during a coun- try ’s economic trans iti on and int egr ati on into the wide r intern at ion al community. For example, does to urism demand res pond more to chang es in inc ome duri ng the Applied Economics ISSN 0003±6846 print/ ISSN 1466±4 283 onlin e # 2002 Taylor & Francis Ltd http://www.tandf.co.uk/journals DOI: 10.108 0 /00036 84011004 931 0 Applied Economics, 2002, 34, 509±521 509 z Correspondin g author.
-
Upload
gojmir-juznic -
Category
Documents
-
view
220 -
download
0
Transcript of A System of Equations Model of UK Tourism Demand in Neighbouring Countries

8/6/2019 A System of Equations Model of UK Tourism Demand in Neighbouring Countries
http://slidepdf.com/reader/full/a-system-of-equations-model-of-uk-tourism-demand-in-neighbouring-countries 1/13

8/6/2019 A System of Equations Model of UK Tourism Demand in Neighbouring Countries
http://slidepdf.com/reader/full/a-system-of-equations-model-of-uk-tourism-demand-in-neighbouring-countries 2/13
initial or subsequent years? Does the sensitivity of tourism
demand to changes in its own prices, or those of its com-
petitors, change between diV erent periods?
Further questions concern the degrees of complementar-
ity or substitutability between tourism destinations and the
extent to which these change during periods of economic
transition. Complementarity occurs if holidays in diV erent
destinations are purchased as a package. Alternatively,
there may be an intense degree of competition between
destinations (Tsai and Wang, 1998). Relationships of com-
plementarity or substitutability may change over time as
lower income destinations emerge from relative poverty to
achieve a higher level of development. Little information is
available about this issue. It is not known, for example,
whether lower income destinations tend to become more
or less competitive over time, either relative to other devel-
oping countries or relative to more industrialized nations.
DiV erent models have been used to estimate tourism
demand and some types of model are more appropriate
for examining the above questions than others. The vast
majority of studies of tourism demand have relied on single
equation models of demand, estimated within a static con-
text (for e xample, Loeb, 1982; Uysal and Crompton, 1984;
Gunadhi and Boey, 1986). These models are not derived
from consumer demand theory and fail to quantify the
changes in demand behaviour that occur over time.
Innovations in the methodology were subsequently intro-
duced in the form of single equation models of demand
estimated using an error correction methodology
(Syriopoulos, 1995; Vogt and Wittayakorn, 1998). More
recently, Song et al. (2000) used a general to speci®c,
error correction model to estimate the UK demand for
tourism in the form of visits per capita to outbound desti-nations and demonstrated that the model has good fore-
casting ability. This modelling approach has the advantage
of explicit treatment of the time dimension of tourism
demand behaviour and allows for improved econometric
estimation of the speci®ed equations.
A third approach to tourism demand estimation in-
volves system of equations models such as the Almost
Ideal Demand System (AIDS) approach (White, 1982;
O’Hagan and Harrison, 1984; Syriopoulos and Sinclair,
1993; Papatheodorou, 1999). The AIDS model embodies
the principles of consumer demand theory and is appropri-
ate for estimating tourism demand in the form of expendi-ture shares in a range of destinations, to which the major
shares of expenditure are attributed. The de®nition of tour-
ism demand as expenditure shares rather than visits is
appropriate in the context of the microeconomic founda-
tions of the model. Moreover expenditure has a direct eco-
nomic impact on each destination. The model is more
appropriate for estimating tourism demand in a small num-
ber of destinations, owing to the limitations on the degrees
of freedom in the context of a large number of independent
variables. The AIDS approach is particularly useful for
testing the properties of homogeneity and symmetr
which are basic to consumer demand theory. Hence,
provides a stronger theoretical basis for estimating th
cross-price elasticities of demand than the single equatio
approach.
This paper will use the AIDS model to examine tourism
demand by the UK in the neighbouring destination
France, Spain and Portugal. The UK is relevant as it is major origin country for tourism in the destinations unde
consideration. France, Spain and Portugal are key destina
tions within Europe, accounting for over one-third of a
receipts from tourism in the European Union in 1997. Th
absolute value of their receipts from tourism is very high, a
over £98 million in 1997. The choice of the countries a
destinations for analysis is also appropriate owing to the
position as geographic neighbours. Complementarity o
substitutability in tourism demand, as indicated by th
signs of the cross-price elasticities of demand, is of particu
lar relevance in this context. The paper pays attention t
this issue, which has not previously been examined for thcase of neighbouring countries using a system of equation
approach.
Spain and Portugal are interesting cases for considera
tion owing to their position as economies in transition du
ing the period under consideration. At the beginning of th
period, in 1969, they displayed classic symptoms of unde
development: high dependence on agriculture and ®shin
lack of industrialization, low income and low standards o
education, health provision and other indicators of soci
welfare. By 1997, the ®nal year of the period under study
they had joined the ranks of the more developed Europea
economies. Hence, an innovative feature of the paper is iexamination of the evolution of tourism demand durin
these countries’ transition from `developing’ to `develope
status.
A number of related issues are examined within th
paper. For example, given the common characteristics o
underdevelopment that Portugal and Spain shared at th
beginning of the sample period and similarities in the
evolution in the ensuing period (including entry into th
European Union, with increased co-ordination of ®sc
and monetary policies along with funding for tourism
related infrastructure), it might be supposed that tourism
demand would evolve similarly in the two countries. Thpaper will examine whether this, in fact, occurred and wi
estimate the responsiveness of demand to changes in i
determinants for each country. The consideration o
France as a neighbouring destination enlarges the scop
of the study to allow for comparison of the behaviour o
tourism demand between a developed country and i
poorer neighbours. It also permits examination of th
extent to which the behaviour of demand becomes mor
or less similar over time with respect to changes in expen
diture, prices and exchange rates. Thus, the study provid
510 M. De Mello et a

8/6/2019 A System of Equations Model of UK Tourism Demand in Neighbouring Countries
http://slidepdf.com/reader/full/a-system-of-equations-model-of-uk-tourism-demand-in-neighbouring-countries 3/13
useful information, at the cross-country level, about
changes in a major activity within each of the economies.
The period under study is subdivided into two periods,
1969±1979 and 1980±1997. This is due to the structural
break that occurred between 1979 and 1980, concurrent
with Spain and Portugal’s moves towards integration
with the wider European community. The responsiveness
of tourism demand will be compared for the two periods by
means of the estimation of income, own-price and cross-
price elasticities for each destination, for each period.
These provide useful information concerning the changes
that occurred between the initial and subsequent periods of
the overall transition. The estimated model will also be
used to forecast tourism demand, thereby providing addi-
tional guidance concerning the overall model ®t, as well as
its ability to supply accurate forecasts of demand.
The paper proceeds as follows. Section II provides the
derivation of the AIDS model which is used to estimate
tourism demand in France, Spain and Portugal. The
third section speci®es the model and explains the variables
included in it. The results obtained from estimating the
model for the period 1969±1997 are provided in the fourth
section, which also includes forecasts of tourism demand
for the years 1995±1997, based on the estimation of the
model for the period 1969±1994. The ®fth section of the
paper provides and interprets the elasticity values obtained
from the model. The ®nal section discusses the implications
of the results for the higher and lower income destinations
during the periods of economic transition and provides
some conclusions.
I I . D E R I VA T I O N O F T H E M O D E L
The AIDS model that is used to estimate the system of
tourism demand equations for the countries under consid-
eration is based on the theory of consumer demand, invol-
ving utility maximization for given prices and a given
budget. The model can be viewed as an extension (includ-
ing price-eV ects) of the Working±Leser model which relates
the budget share of commodity i , wi , to the logarithm of the
total expenditure x, such that wi ˆ ¬i ‡ i ln x. The model
rests upon a particular class of preferences, the PIGLOG 1
class, which are represented via a cost or expenditure func-tion de®ning the minimum expenditure required for gain-
ing a speci®c level of utility at given prices. As Muellbauer
(1976) showed, the PIGLOG class of preferences permits
an exact aggregation over consumers without imposing
identical preferences.
The derivation of the AIDS model (Deaton an
Muellbauer, 1980a; 1980b) establishes the following bas
equations for the demand for commodity i :
wi ˆ ¬i ‡X
j
® ij ln p j ‡ i lnx
P
± ²i ; j ˆ 1; . . . ; n …
where
ln P ˆ ¬0 ‡X
k
¬k ln pk ‡ 12
Xk
Xr
® ¤k ln pk ln pr
k; r ˆ 1; . . . ; n …2
In a tourism analysis context, i is a destination countr
among a group of n alternative destinations demanded b
tourists from a speci®c origin. The dependent variable w
represents destination i ’s share of the origin’s tourism
budget allocated to the set of n destinations. This share
variability is explained by the price of tourism … p† in i an
in alternative destinations j and by the per capita expend
ture …x† allocated to the group of n destinations, de¯ate
by price index P. The model is based on the followinassumptions:
(i) all budget shares sum to unity, the adding-u
restriction, which requires that:Xi
¬i ˆ 1X
i
i ˆ 0X
i
® ij ˆ 0; for all j
(ii) a proportional change i n all prices and expenditur
has no eV ect on the quantities purchased, the homo
geneity restriction, which requires:
X j
® ij ˆ 0 f or all i
(iii) consumers’ choices are consistent, the symmetr
restriction, which requires:
® ij ˆ ® ji for all i ; j
(iv) a rise in prices results in a fall in demand, th
negativity restriction, which requires the necessar
condition of negative own-price elasticities for a
destinations.
The restrictions on the parameters comply with th
assumptions and ensure that Equation 2 de®nes P as
linear homogeneous function of individual prices. If pricare relatively collinear, `P will be approximately propo
tional to any appropriately de®ned price index, for e
ample, the one used by Stone’ (Deaton and Muellbaue
1980a, p. 76).2 Hence, the de¯ator P in Equation 2 can b
simpli®ed using the Stone price index,
UK tourism demand in neighbouring countries 51
1PIGLOG denotes logarithm of price independent generalized linearity.
2If prices are not collinear, the linear approximation of the AIDS model obtained through the use of the Stone price index can bias th
estimation of the parameters in the budget share equations. However, the bias is likely to be more important in micro rather than iaggregate data, as shown by Pashardes (1993).

8/6/2019 A System of Equations Model of UK Tourism Demand in Neighbouring Countries
http://slidepdf.com/reader/full/a-system-of-equations-model-of-uk-tourism-demand-in-neighbouring-countries 4/13
ln P¤ ˆX
i
wBi ln pi …3†
where wBi is the budget share of destination i in the base
year. With this simpli®cation the AIDS model can be
rewritten in the following form:
wi ˆ ¬¤i ‡ X
j
® ij ln p j ‡ i lnx
P¤± ² i ; j ˆ 1; . . . ; n …4†
The model assumes separability between consumption and
labour supply and excludes quantity constraints. It also
assumes that consumers’ expenditure is allocated to groups
of commodities in a multi-stage budgeting process, imply-
ing that each group of preferences is independent of other
groups.
Equation 4 speci®es a model in the linear±log form
which prevents the direct interpretation of its coecients
as elasticities. However, the interpretation of the signs and
values of the model’s coecients gives a preliminary indi-
cation of how the dependent variable reacts to changes in
its determinants. The coecients of the price variables …® ij †represent the absolute change in the expenditure share allo-
cated to commodity i due to a 1% change in the price of
commodity j , ceteris paribus. For i ˆ j , the sign of the
coecient of the own-price variable is expected to be nega-
tive according to the theory of negativity which quali®es i
as a normal good in economic terminology. For i 6̂ j , the
sign of the coecient is expected to be positive if i and j are
substitutes, and negative if i and j are complements. The i
coecients represent the absolute change in the i th expen-
diture share given a 1% change in real per capita expendi-
ture, prices being held constant. Generally, in an AIDS
model framework, a coecient i > 0 gives rise to an
expenditure elasticity above unity, and a coecient i < 0
gives rise to an expenditure elasticity in the interval (0,1). In
the ®rst case, the demand for commodity i would be expen-
diture (income) elastic and in the second case, expenditure
(income) inelastic. In economic terminology, commodities
with income-elastic demands are quali®ed as `luxuries’ and
commodities with income-inelastic demands are quali®ed
as `necessities’. This quali®cation indicates that while a
`luxury’ good can be given up when restrictions on income
are imposed and its budget allocation redistributed to other
purposes, a `necessary’ good is essential to consumers and
budget restrictions aV ect only slightly the demand for thistype of good. In this sense, an income-inelastic good
… i < 0† is likely to have few competitors while an
income-elastic … i > 0† good is likely to have many. In a
tourism demand context, this could indicate a more stable
demand for destinations for which i < 0, compared with a
more unstable demand for destinations for which i >This quali®cation seems to be more adequate in a tourism
context than the more general demand theory terminolog
which would qualify a tourism destination, in the ®rst cas
as a `necessity’ and in the second, as a `luxury’.
As mentioned above, Equation 4 speci®es a linear-lo
functional form and hence, the relevant elasticities canno
be directly accessed in the parameter estimates. The elast
city values are calculated using the model’s estimates a
follows:3
Expenditure elasticities:
"i ˆ1
·wwi
dwi
d ln x‡ 1 ˆ
i
·wwi
‡ 1
Uncompensated own-price elasticities:
"ii ˆ1
·wwi
dwi
d ln pi
¡ 1 ˆ® ii
·wwi
¡ i
wBi
·wwi
¡ 1
Uncompensated cross-price elasticities:
"ij ˆ1
·wwi
dwi
d ln p j
ˆ® ij
·wwi
¡ i
wB j
·wwi
Compensated own-price elasticities:
".
ii ˆ "ii ‡ wBi "i ˆ
® ii
·wwi
‡ wBi ¡ 1
Compensated cross-price elasticities:
".
ij ˆ "ij ‡ wBi "i ˆ
® ii
·wwi
‡ wB j
where ·wwi represents the sample’s average share of destin
tion i …i ˆ 1; . . . ; n† and wB j represents the share of destina
tion j … j ˆ 1; . . . ; n† in the base year.
I I I . V A R I A B L E D E F I N IT I O N S A N D M O D E L
S P E C I F I C A T I O N
The UK demand for tourism in France, Spain an
Portugal is estimated using the system of Equations
allowing for possible nonconstancy of the real expenditu
coecient over the sample period. Changes in the coe
cient can occur if tourists’ allocation of expenditure aV ected, over time, by factors that modify the politic
and economic relationships between origin and destin
tions and among the destinations themselves. As th
model involves three destination countries, the system ha
three equations:
512 M. De Mello et a
3The elasticities quantify the sensitivity of tourism demand to changes in the expenditure budget (expenditure elasticities), prices in th
destination under consideration (own-price elasticities) and prices in alternative destinations (cross-price elasticities). Compensated prielasticities allow for the eV ects of changes in real income which accompany price changes, while uncompensated price elasticities ontake account of price changes.

8/6/2019 A System of Equations Model of UK Tourism Demand in Neighbouring Countries
http://slidepdf.com/reader/full/a-system-of-equations-model-of-uk-tourism-demand-in-neighbouring-countries 5/13
wP ˆ ¬P ‡ ® PPPP ‡ ® PS PS ‡ ® PF PF ‡ PE
‡ 0P‰SE Š ‡ ¯ PD ‡ PT ‡ uP
wS ˆ ¬S ‡ ® SPPP ‡ ® SS PS ‡ ® SF PF ‡ S E
‡ 0S ‰SE Š ‡ ¯ S D ‡ S T ‡ uS
wF
ˆ ¬F
‡ ® FP
PP
‡ ® FS
PS
‡ ® FF
PF
‡ F
E
‡ 0F ‰SE Š ‡ ¯ F D ‡ F T ‡ uF
8>>>>>>>>>>>>>><>>>>>>>>>>>>>>:
…5†
The dependent variables are each destination’s share of the
UK tourism budget allocated to the region. A better under-
standing of the evolution of the three countries’ tourism
shares is obtained from Figs 1 to 3, which plot these vari-
ables over time.
The independent variables are the eV ective prices of
tourism in each destination, the UK real expenditure allo-
cated to all destinations per capita of the UK population, a
dummy variable D and a trend variable T . The eV ective
price of tourism in country i and the UK real per capita
expenditure are de®ned as follows:
Pi ˆ lnCPI i =CPI UK
Ri
´and E ˆ ln
Xi
E i =UKP
P¤
0B@
1CA
where i ˆ F (France), S (Spain), and P (Portugal), Ri is th
exchange rate between country i and the UK, CPI is th
consumer price index of the countries involved, E i is th
UK tourism expenditure in country i , UKP is the Upopulation and P¤ is the Stone price index de®ned
Equation 3. The data for UK tourism expenditure, disag
gregated by destinations and measured in million pound
sterling, were obtained from one common source, th
Business Monitor MA6 (1970±1993) continued as Trav
Trends (1995±1998). Data for the UK population, pric
indexes and exchange rates, were obtained from th
International Financial Statistics (IMF, 1989±1997).
A structural break in the in¯uence of UK real per capit
expenditure on the dependent variables separates th
sample period into two subperiods, 1969±1979 and 1980
1997. Important events that contributed to the structurbreak are Spain’s membership of EFTA in 1980 and Spai
and Portugal’s negotiations for EC membership whic
started, for Portugal, in October 1978 and for Spain
mid-1979, marking this year as the turning point from iso
lation to partnership in one of the biggest potential marke
in the world. This view can be illustrated by the statemen
of Jose  da Silva Lopes (1996, 136):
One of the most important consequences of these nego
tiations was the ending of a secular separation betwee
the Spanish and the Portuguese economies. From a
economic point of view the two countries had, tradtionally, lived back to back. Before membership of th
EC, both countries allowed more trading concessions t
any other country than to its neighbour. In 1973 Spai
tried to negotiate with Portugal the creation of a
Iberian common market, but Portugal declined. Th
Portuguese authorities believed that the diV erences
dimension and strength between the two economi
were such that their integration would only be admissib
in a vast multilateral framework where other in¯uence
and powers could also be present.
Events of such importance aV ecting Spain and Portug
inevitably aV ected France and, hence, the distribution oexpenditure among the countries. Thus, a dummy variab
S , assuming the value 1 in the years 1980±1997 and 0 othe
wise, is multiplied by the variable E to account for th
structural break detected. This new variable is denoted a
SE . Support for the inclusion of this variable was als
provided by statistical …F † tests.
The dummy variable D accounts for several events th
appeared to have in¯uenced the UK demand for tourism i
France, Spain and Portugal during the period 1975±198
The ®rst was the political turmoil that followed th
UK tourism demand in neighbouring countries 51
Fig. 1. Tourism expenditure share of France
Fig. 2. Tourism expenditure share of Spain
Fig. 3. Tourism expenditure share of Portugal
8/6/2019 A System of Equations Model of UK Tourism Demand in Neighbouring Countries
http://slidepdf.com/reader/full/a-system-of-equations-model-of-uk-tourism-demand-in-neighbouring-countries 6/13
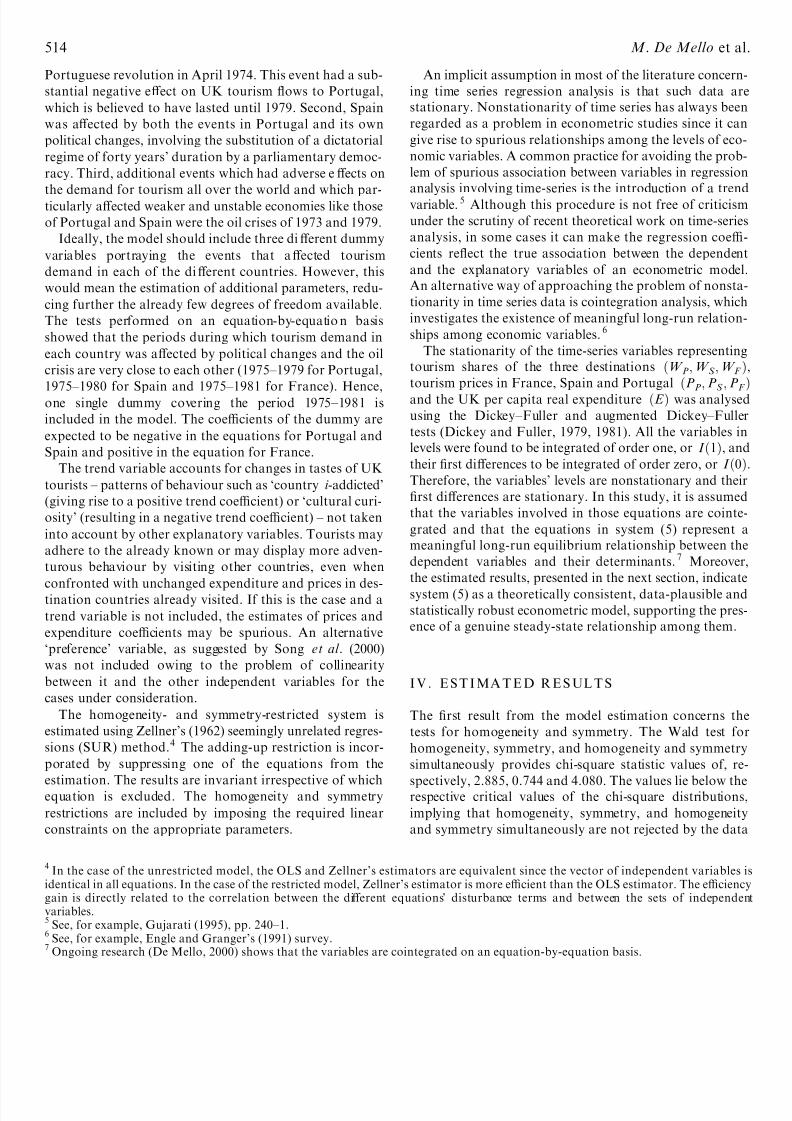
Portuguese revolution in April 1974. This event had a sub-
stantial negative eV ect on UK tourism ¯ows to Portugal,
which is believed to have lasted until 1979. Second, Spain
was aV ected by both the events in Portugal and its own
political changes, involving the substitution of a dictatorial
regime of forty years’ duration by a parliamentary democ-
racy. Third, additional events which had adverse eV ects on
the demand for tourism all over the world and which par-ticularly aV ected weaker and unstable economies like those
of Portugal and Spain were the oil crises of 1973 and 1979.
Ideally, the model should include three diV erent dummy
variables portraying the events that aV ected tourism
demand in each of the diV erent countries. However, this
would mean the estimation of additional parameters, redu-
cing further the already few degrees of freedom available.
The tests performed on an equation-by-equatio n basis
showed that the periods during which tourism demand in
each country was aV ected by political changes and the oil
crisis are very close to each other (1975±1979 for Portugal,
1975±1980 for Spain and 1975±1981 for France). Hence,one single dummy covering the period 1975±1981 is
included in the model. The coecients of the dummy are
expected to be negative in the equations for Portugal and
Spain and positive in the equation for France.
The trend variable accounts for changes in tastes of UK
tourists ± patterns of behaviour such as `country i -addicted’
(giving rise to a positive trend coecient) or `cultural curi-
osity’ (resulting in a negative trend coecient) ± not taken
into account by other explanatory variables. Tourists may
adhere to the already known or may display more adven-
turous behaviour by visiting other countries, even when
confronted with unchanged expenditure and prices in des-tination countries already visited. If this is the case and a
trend variable is not included, the estimates of prices and
expenditure coecients may be spurious. An alternative
`preference’ variable, as suggested by Song et al. (2000)
was not included owing to the problem of collinearity
between it and the other independent variables for the
cases under consideration.
The homogeneity- and symmetry-restricted system is
estimated using Zellner’s (1962) seemingly unrelated regres-
sions (SUR) method.4 The adding-up restriction is incor-
porated by suppressing one of the equations from the
estimation. The results are invariant irrespective of whichequation is excluded. The homogeneity and symmetry
restrictions are included by imposing the required linear
constraints on the appropriate parameters.
An implicit assumption in most of the literature concern
ing time series regression analysis is that such data a
stationary. Nonstationarity of time series has always bee
regarded as a problem in econometric studies since it ca
give rise to spurious relationships among the levels of eco
nomic variables. A common practice for avoiding the prob
lem of spurious association between variables in regressio
analysis involving time-series is the introduction of a tren
variable. 5 Although this procedure is not free of criticism
under the scrutiny of recent theoretical work on time-seri
analysis, in some cases it can make the regression coe
cients re¯ect the true association between the dependen
and the explanatory variables of an econometric mode
An alternative way of approaching the problem of nonsta
tionarity in time series data is cointegration analysis, whic
investigates the existence of meaningful long-run relation
ships among economic variables.6
The stationarity of the time-series variables representin
tourism shares of the three destinations …W P; W S ; W Ftourism prices in France, Spain and Portugal …PP; PS ; PF
and the UK per capita real expenditure …E † was analyse
using the Dickey±Fuller and augmented Dickey±Full
tests (Dickey and Fuller, 1979, 1981). All the variables i
levels were found to be integrated of order one, or I …1†, an
their ®rst diV erences to be integrated of order zero, or I …0
Therefore, the variables’ levels are nonstationary and the
®rst diV erences are stationary. In this study, it is assume
that the variables involved in those equations are coint
grated and that the equations in system (5) represent
meaningful long-run equilibrium relationship between th
dependent variables and their determinants.7 Moreove
the estimated results, presented in the next section, indica
system (5) as a theoretically consistent, data-plausible anstatistically robust econometric model, supporting the pre
ence of a genuine steady-state relationship among them.
I V . E S T I MA T E D R E S UL T S
The ®rst result from the model estimation concerns th
tests for homogeneity and symmetry. The Wald test fo
homogeneity, symmetry, and homogeneity and symmetr
simultaneously provides chi-square statistic values of, r
spectively, 2.885, 0.744 and 4.080. The values lie below threspective critical values of the chi-square distribution
implying that homogeneity, symmetry, and homogeneit
and symmetry simultaneously are not rejected by the dat
514 M. De Mello et a
4In the case of the unrestricted model, the OLS and Zellner’s estimators are equivalent since the vector of independent variables
identical in all equations. In the case of the restricted model, Zellner’s estimator is more ecient than the OLS estimator. The eciencgain is directly related to the correlation between the diV erent equations’ disturbance terms and between the sets of independevariables.5
See, for example, Gujarati (1995), pp. 240±1.6
See, for example, Engle and Granger’s (1991) survey.7
Ongoing research (De Mello, 2000) shows that the variables are cointegrated on an equation-by-equation basis.

8/6/2019 A System of Equations Model of UK Tourism Demand in Neighbouring Countries
http://slidepdf.com/reader/full/a-system-of-equations-model-of-uk-tourism-demand-in-neighbouring-countries 7/13
at the 5% signi®cance level. This ®nding indicates ration-
ality of consumer behaviour and accords with
Papatheodorou’ s (1999) result.
The coecient estimates, asymptotic t-values (in par-
entheses), R2 and Durbin±Watson (DW) statistics are pro-
vided, in Table 1, for three diV erent versions of the model:
unrestricted, homogeneity-restricte d (H), and homogene-
ity- and symmetry-restricted …H ‡ S†. The symbols * and* indicate the 1% and 5% signi®cance levels.
For the restricted model …H ‡ S†, the explanatory vari-
ables are all signi®cant at the 5% level or less, except for
the price of Portugal in the equation for France and theprice of France, trend and real expenditure variables in the
equation for Portugal.8 All the regressions are signi®cant
overall, with high explanatory power for the independent
variables included in the model.9 The DW test is incon-
clusive. However, in the equation-by-equatio n estimation
of the unrestricted model with OLS, both the Lagrange
multiplier and the DW tests reject serial correlation. As
Deaton and Muellbauer (1980b) pointed out, imposing
homogeneity may generate positive serial correlation.
However, if this is the case, it occurs in the equations for
Spain and France but not in that for Portugal.10 In fact, for
the former two countries, the values of the DW statistic for
the model under homogeneity fall when compared with
those obtained from the unrestricted single equation
model. Moreover, these same values fall further when w
consider the model constrained by homogeneity and sym
metry simultaneously. The equation for Portugal impli
the opposite behaviour.
Forecasting results
A further indicator of the `goodness of ®t’ of the model
provided by the model’s ex post forecasting performanc
Forecasting was undertaken by estimating the model fo
the period 1969±1994 and using the estimated coecien
to forecast tourism demand for the years 1995±1997. Th
forecasting performance can be evaluated by the summar
statistics, mean absolute sum of squared errors (MABSE
and root mean sum of squared errors (RMSE). The actu
and predicted values of tourism demand, as measured b
the destination shares for France, Spain and Portugal, ar
provided in Table 2, along with the values of the summar
statistics.
It is evident that the values of tourism demand that wer
forecast by using the model are very close to the actu
values, for each country and each year. All of the forecas
ing errors are lower than 0.05 and the values of th
MABSE and RMSE are also low, indicating that the mod
el’s overall forecasting ability is very good. This result con
®rms the ®nding by Song et al. (2000) that econometr
UK tourism demand in neighbouring countries 51
Table 1. AIDS model estimation results
Model ¬i ® Pj ® Sj ® Fj i 0i ¯ i i R
2 DW
P Unrestricted 0.092 70.065 0.073 70.018 70.010 0.005 70.017 0.001 0.85 1.75(5.17)
*
(72.23)*
(2.39)*
(70.51) (70.81) (1.10) (73.60)*
(0.88) 9Restric ted (H) 0.093 70.064 0.077 70.013 70.010 0.006 70.018 0.001 0.85 1.78
(5.33)*
(72.25)*
(2.71)*
(70.40) (70.80) (1.54) (73.73)*
(0.82) 8Restricted (H+S) 0.091 70.072 0.072 70.0004 70.010 0.006 70.018 0.001 0.85 1.79
(6.01)
*
(7
2.99)
*
(2.95)
*
(7
0.02) (7
0.99) (1.73) (7
4.28)
*
(1.17) 7S Unrestricted 0.412 70.068 70.375 0.526 0.111 70.035 70.053 70.011 0.88 1.87(7.44)
*
(70.07) (73.92)*
(4.75)*
(2.90)*
(72.57)*
(3.52)*
(72.28)*
3Restric ted (H) 0.404 70.023 70.427 0.450 0.105 70.047 70.051 70.007 0.86 1.71
(7.03)*
(70.24) (74.56)*
(4.28)*
(2.66)*
(73.87)*
(73.24)*
(71.65) 8Rest ric ted (H +S) 0.38 7 0.07 2 70.453 0.381 0.127 70.048 70.049 70.011 0.86 1.57
(7.86)*
(2.95)*
(75.62)*
(5.19)*
(4.26)*
(4.45)*
(3.53)*
(73.85)*
1F Unrestricted 0.496 0.072 0.301 70.508 70.101 0.031 0.071 0.009 0.85 1.98
(9.60)*
( 0.85) (3.39)*
(74.92)*
(72.83)*
(2.38)*
(5.02)*
(2.14)*
4Restricted (H) 0.504 0.087 0.350 70.437 70.096 0.042 0.068 0.006 0.83 1.76
(9.41)*
( 0.99) (4.01)*
(74.46)*
(72.60)*
(3.65)*
(4.69)*
(1.50) 5Restricted (H+S) 0.522 70.000 4 0.381 70.380 70.117 0.043 0.067 0.009 0.82 1.62
(11.6)*
(70.02 ) (5.19)*
(75.22)*
(74.27)*
(4.24)*
(5.17)*
(3.59)*
7
8The equation for Portugal shows evidence of collinearity between the trend variable and the real expenditure variable. When th
equation is estimated without the trend, the coecient of the expenditure variable is positive and signi®cant but when the trend variabis included, the estimated coecient of the expenditure variable changes sign and becomes insigni®cant.9
For the system under analysis, the null hypothesis of all coecients being zero is rejected by the Wald test. The Wald statistic value fothis hypothesis is 245.5(0.000) .10
In the equation for Portugal the Wald test would reject homogeneity at the signi®cance level of 72% while in the equations for Francand Spain it would reject the hypothesis at the 11% level.
8/6/2019 A System of Equations Model of UK Tourism Demand in Neighbouring Countries
http://slidepdf.com/reader/full/a-system-of-equations-model-of-uk-tourism-demand-in-neighbouring-countries 8/13
models are capable of providing accurate forecasts of tour-
ism demand.
Interpretation of the coecient values
The regression coecients in Table 1 can be interpreted as
follows: ceteris paribus, ® ij measures the absolute change in
the i th expenditure share following a 1% change in p j , and
the coecients, i and … i ‡ 0i † measure the absolute
change in country i ’s share per 1% change in UK real
per capita expenditure in the period 1969±1979 and in the
period 1980±1997, respectively. For Portugal, both of the
latter values are insigni®cant, so that changes in UK real
per capita expenditure do not signi®cantly aV ect thePortuguese share. However, these coecient estimates are
signi®cant for France and Spain.
If i > 0, the share wi increases with E and if i < 0, the
share wi decreases when E increases. In demand theory
terms, this would indicate tourism in Spain to be a `luxury’
and tourism in France to be a `necessity’. An alternative
terminology might be to categorize Spain as a `primary’
(®rst choice or preference) destination and France as a
`secondary’ (second choice or preference), meaning that
consumers would prefer to direct additional expenditure
towards Spain rather than France. Generally, a coecient
i > 0 gives rise to positive expenditure elasticities aboveunity, and a coecient i < 0 gives rise to expenditure
elasticities in the interval (0, 1). This means that for each
1% increase in the UK expenditure allocated to this region,
the share of Spain (France) would respond with a more
(less) than 1% increase, which con®rms UK tourists’ pre-
ference for Spain when their budget increases.
The values of the coecient for the intercept dummy
variable, D, demonstrated that the Spanish and Portuguese
political changes and the oil crises that took place in the
period 1975±1981 had a negative eV ect on Spain and
Portugal and a net positive eV ect on France. Hence,
the period 1975±1981, UK tourists’ preferences movein favour of France, relative to Portugal and Spain. Th
coecients of the trend variable can be interpreted a
the annual average change in the expenditure share
which would take place in the absence of change in th
other explanatory variables. France’s share increase
while Spain’s share decreases by approximately th
same amount. The increase in the Portuguese share
insigni®cant.
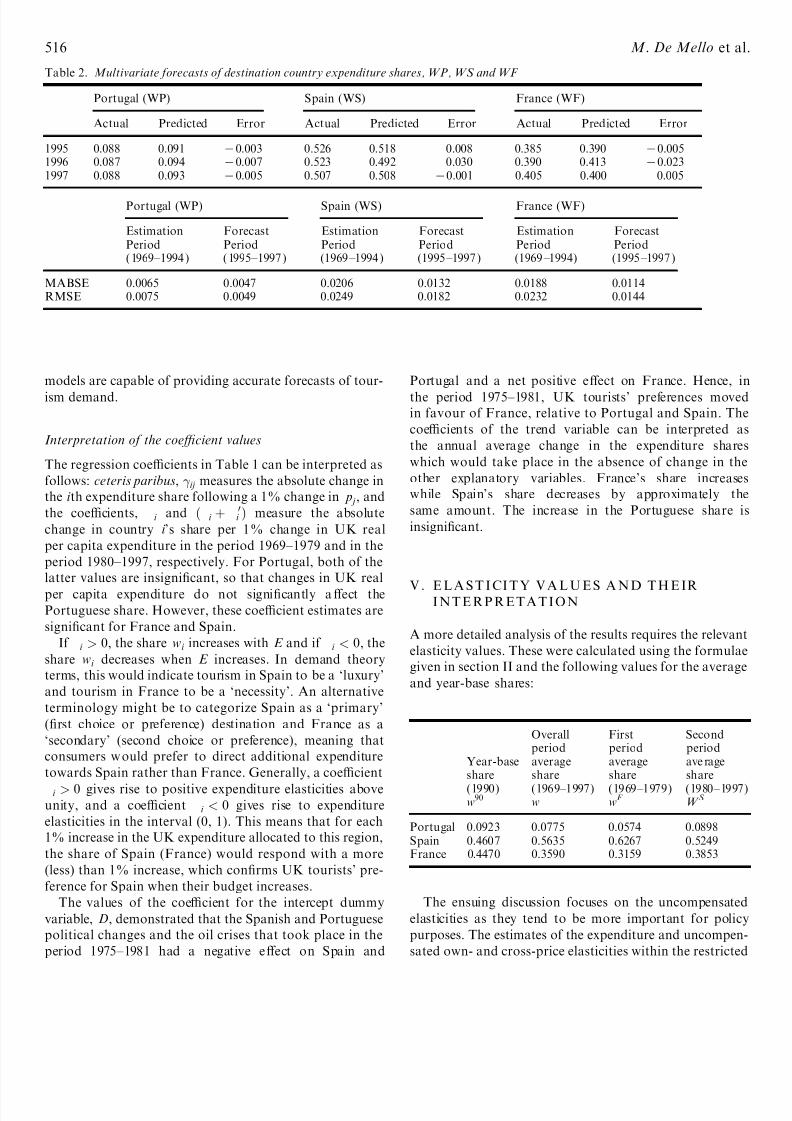
V . E L A S T I CI T Y V A L U E S A N D T H E IRI N T E R P R E T A T I O N
A more detailed analysis of the results requires the relevan
elasticity values. These were calculated using the formula
given in section II and the following values for the averag
and year-base shares:
The ensuing discussion focuses on the uncompensate
elasticities as they tend to be more important for polic
purposes. The estimates of the expenditure and uncompen
sated own- and cross-price elasticities within the restricte
516 M. De Mello et a
Table 2. Multivariate forecasts of destination country expenditure shares, WP, WS and WF
Portugal (WP) Spain (WS) France (WF)
Actual Predicted Error Actual Predicted Error Actual Predicted Error
1995 0.088 0.091 70.003 0.526 0.518 0.008 0.385 0.390 70.0051996 0.087 0.094 70.007 0.523 0.492 0.030 0.390 0.413 70.0231997 0.088 0.093 70.005 0.507 0.508 70.001 0.405 0.400 0.005
Portugal (WP) Spain (WS) France (WF)
Estimation Forecast Estimation Forecast Estimation ForecastPeriod Period Period Period Period Period( 1969±1994 ) ( 1995±1997 ) (1969 ±1994 ) (1995 ±1997 ) (1969 ±1994) (1995 ±1997 )
MABSE 0.0065 0.0047 0.0206 0.0132 0.0188 0.0114RMSE 0.0075 0.0049 0.0249 0.0182 0.0232 0.0144
Overall First Secondperiod period period
Year-base average average ave rageshare share share share
(1990) (1969±1997) (1969±1979) (1980±1997w90 w wF W S
Portugal 0.0923 0.0775 0.0574 0.0898Spain 0.4607 0.5635 0.6267 0.5249France 0.4470 0.3590 0.3159 0.3853

8/6/2019 A System of Equations Model of UK Tourism Demand in Neighbouring Countries
http://slidepdf.com/reader/full/a-system-of-equations-model-of-uk-tourism-demand-in-neighbouring-countries 9/13
model (H ‡ S) and respective t-values are presented in
Table 3.11
Expenditure elasticities
The expenditure elasticities relating to the UK demand fortourism diV er considerably between the neighbouring
countries; those for Portugal and France are below unity
while that for Spain is above unity. All the estimated
expenditure elasticities are statistically signi®cant at the
1% level. Given the estimated values of the standard devi-
ation of the expenditure elasticity for Portugal (0.182 in the
®rst period, and 0.094 in the second), the null hypothesis of
a unit expenditure elasticity for Portugal in both periods,
could not be rejected. However, the same hypothesis tested
for the other two countries was conclusively rejected by the
data. Therefore, the UK tourism demand is expenditure
elastic for Spain, is expenditure inelastic for France andis not signi®cantly diV erent from unity for Portugal.
Consequently, the UK expenditure share of France is less
responsive to variations in UK real tourism expenditure
than those of Spain or Portugal. Given the relatively low
estimated value of this elasticity when compared with those
of its neighbours, France is likely to bene®t/lose less from
increases/decreases in UK total tourism expenditure than
Spain or Portugal. The values of the expenditure elas-
ticities indicate France to be a `secondary’ destina-
tion …0 < "F < 1† while Spain can be viewed as a `primary’
destination …"S > 1†.
An interesting aspect is the diV erence in the magnitudes
of the expenditure elasticities for Spain and France
between the ®rst and second periods. The responsiveness
of the UK demand for Spain to changes in real expenditure
seems to decrease while that of France seems to increase
from the ®rst to the second period. This implies that, for
the most recent two decades (the second period), France
and Spain have been moving in opposite directions
relation to their roles as `primary’ and `secondary’ de
tinations. This view can be further supported by the diV e
ences in the uncompensated and compensated own- an
cross-price elasticities observed in the ®rst and second pe
iods for these two countries.
Own-price elasticities
The uncompensated own-price elasticities are all negativ
as expected for normal commodities for which deman
responds negatively to increases in prices. In the cases o
Portugal and France, the value of the own-price elasticit
decreases from the ®rst to the second period while in th
case of Spain an increase is observed. The absolute magn
tude of the decrease for Portugal is greater (70.44) tha
that for France (70.14) or the increase for Spain (0.12
Hence the impact of the changes in prices on the Udemand for tourism in these three destinations varies no
only across countries but also between the two period
considered. In the period 1969±1979, the UK demand fo
tourism is more responsive to changes in Portuguese an
French prices (a 1% change in prices of France or Portug
induces a demand decrease of more than 2%, ceteris pa
ibus) than to price changes in Spain. However, in the perio
1980±1997, the UK demand for tourism is more responsiv
to price variations in Spain than in France or Portugal. Th
second period values of the own-price elasticities also ind
cate that changes in eV ective prices in France and Spai
have a greater impact on the UK demand for tourism tha
would result from equivalent changes in Portugal. For a
three countries in both periods, the positive returns tha
could be gained from increases in the UK tourism budge
would not compensate the adverse eV ects of increase
prices.
UK tourism demand in neighbouring countries 51
11Given the elasticities’ de®nition in Section II, their variances, based on which the t-values are calculated, are computed as follow
VAR…"i † ˆ …1=wi †2
VAR… i †; VAR…"ii † ˆ …1=wi †2
VAR…® ii † ‡ …wBi =wi †
2VAR… i † ¡ 2‰w
Bi =…wi †
2ŠCOVAR…® ii ; i †; VAR…"…ij † ˆ …1=wi †
2VA
…® ij †‡ …wB
j =wi †2
VAR… i † ¡ 2‰wB j =…wi †
2ŠCOVAR…® ij ; i †:
Table 3. Expenditure and uncompensated price elasticities (restricted model )
Cross-price elasticitesExpenditure Own-priceelasticities elasticities PP PS PF
First Second First Second First Second First Second First Second
W P 0.82 0.95 72.24 71.80 X X 1.35 0.83 0.07 0.02(4.5) (10.1) (75.5) (76.7) (2.8) (2.8) (0.2) (0.1)
W S 1.203 1.157
1.827
1.93 0.10 0.12 X X 0.52 0.66(25.2) (26.9) (712.9) (711.7) (2.6) (2.7) (4.7) (5.0)
W F 0.63 0.81 72.04 71.90 0.03 0.02 1.38 1.08 X X(7.3) (24.5) (79.3) (710.4) (0.4) (0.3) (5.6) (5.3)
8/6/2019 A System of Equations Model of UK Tourism Demand in Neighbouring Countries
http://slidepdf.com/reader/full/a-system-of-equations-model-of-uk-tourism-demand-in-neighbouring-countries 10/13
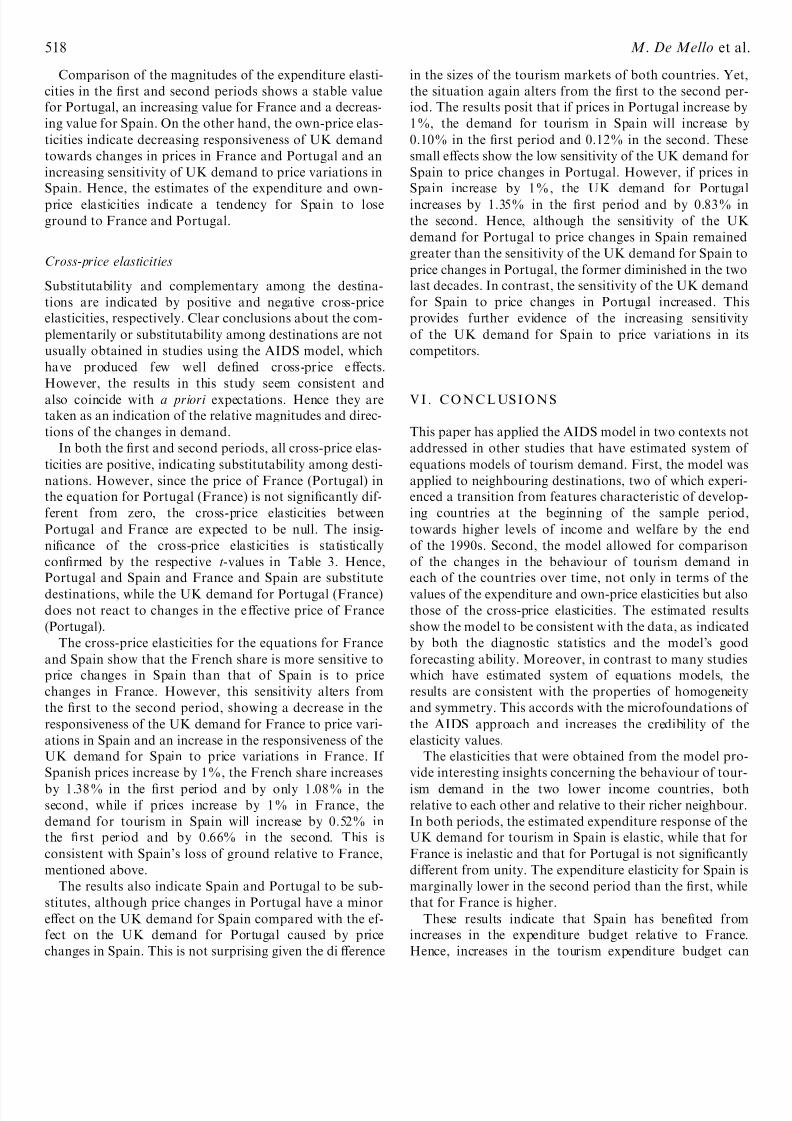
Comparison of the magnitudes of the expenditure elasti-
cities in the ®rst and second periods shows a stable value
for Portugal, an increasing value for France and a decreas-
ing value for Spain. On the other hand, the own-price elas-
ticities indicate decreasing responsiveness of UK demand
towards changes in prices in France and Portugal and an
increasing sensitivity of UK demand to price variations in
Spain. Hence, the estimates of the expenditure and own-
price elasticities indicate a tendency for Spain to lose
ground to France and Portugal.
Cross-price elasticities
Substitutability and complementary among the destina-
tions are indicated by positive and negative cross-price
elasticities, respectively. Clear conclusions about the com-
plementarily or substitutability among destinations are not
usually obtained in studies using the AIDS model, which
have produced few well de®ned cross-price eV ects.
However, the results in this study seem consistent and
also coincide with a priori expectations. Hence they are
taken as an indication of the relative magnitudes and direc-
tions of the changes in demand.
In both the ®rst and second periods, all cross-price elas-
ticities are positive, indicating substitutability among desti-
nations. However, since the price of France (Portugal) in
the equation for Portugal (France) is not signi®cantly dif-
ferent from zero, the cross-price elasticities between
Portugal and France are expected to be null. The insig-
ni®cance of the cross-price elasticities is statistically
con®rmed by the respective t-values in Table 3. Hence,
Portugal and Spain and France and Spain are substitute
destinations, while the UK demand for Portugal (France)does not react to changes in the eV ective price of France
(Portugal).
The cross-price elasticities for the equations for France
and Spain show that the French share is more sensitive to
price changes in Spain than that of Spain is to price
changes in France. However, this sensitivity alters from
the ®rst to the second period, showing a decrease in the
responsiveness of the UK demand for France to price vari-
ations in Spain and an increase in the responsiveness of the
UK demand for Spain to price variations in France. If
Spanish prices increase by 1%, the French share increases
by 1.38% in the ®rst period and by only 1.08% in thesecond, while if prices increase by 1% in France, the
demand for tourism in Spain will increase by 0.52% in
the ®rst period and by 0.66% in the second. This is
consistent with Spain’s loss of ground relative to France,
mentioned above.
The results also indicate Spain and Portugal to be sub-
stitutes, although price changes in Portugal have a minor
eV ect on the UK demand for Spain compared with the ef-
fect on the UK demand for Portugal caused by price
changes in Spain. This is not surprising given the diV erence
in the sizes of the tourism markets of both countries. Ye
the situation again alters from the ®rst to the second pe
iod. The results posit that if prices in Portugal increase b
1%, the demand for tourism in Spain will increase b
0.10% in the ®rst period and 0.12% in the second. Thes
small eV ects show the low sensitivity of the UK demand fo
Spain to price changes in Portugal. However, if prices i
Spain increase by 1%, the UK demand for Portug
increases by 1.35% in the ®rst period and by 0.83% i
the second. Hence, although the sensitivity of the U
demand for Portugal to price changes in Spain remaine
greater than the sensitivity of the UK demand for Spain t
price changes in Portugal, the former diminished in the tw
last decades. In contrast, the sensitivity of the UK deman
for Spain to price changes in Portugal increased. Th
provides further evidence of the increasing sensitivit
of the UK demand for Spain to price variations in i
competitors.
V I . C O N C L US I O N S
This paper has applied the AIDS model in two contexts no
addressed in other studies that have estimated system o
equations models of tourism demand. First, the model wa
applied to neighbouring destinations, two of which exper
enced a transition from features characteristic of develop
ing countries at the beginning of the sample perio
towards higher levels of income and welfare by the en
of the 1990s. Second, the model allowed for compariso
of the changes in the behaviour of tourism demand
each of the countries over time, not only in terms of th
values of the expenditure and own-price elasticities but alsthose of the cross-price elasticities. The estimated resul
show the model to be consistent with the data, as indicate
by both the diagnostic statistics and the model’s goo
forecasting ability. Moreover, in contrast to many studie
which have estimated system of equations models, th
results are c onsistent with the properties of homogeneit
and symmetry. This accords with the microfoundations o
the AIDS approach and increases the credibility of th
elasticity values.
The elasticities that were obtained from the model pro
vide interesting insights concerning the behaviour of tou
ism demand in the two lower income countries, botrelative to each other and relative to their richer neighbou
In both periods, the estimated expenditure response of th
UK demand for tourism in Spain is elastic, while that fo
France is inelastic and that for Portugal is not signi®cant
diV erent from unity. The expenditure elasticity for Spain
marginally lower in the second period than the ®rst, whi
that for France is higher.
These results indicate that Spain has bene®ted from
increases in the expenditure budget relative to Franc
Hence, increases in the tourism expenditure budget ca
518 M. De Mello et a

8/6/2019 A System of Equations Model of UK Tourism Demand in Neighbouring Countries
http://slidepdf.com/reader/full/a-system-of-equations-model-of-uk-tourism-demand-in-neighbouring-countries 11/13
assist poor countries to `catch-up’ with their richer counter-
parts. However, unlike Spain, Portugal did not bene®t sig-
ni®cantly from increases in the UK expenditure budget, so
that the two Iberian countries have experienced diV erent
patterns of behaviour over time. These ®ndings are clearly
relevant to policy-makers who are concerned with the
responsiveness of tourism demand to changes in expendi-
ture. For example, Portugal’s lack of signi®cant gains fromincreases in the expenditure budget, along with Spain’s
apparently declining share, corroborated by the negative
sign of the trend coecient, merit further attention by
the relevant tourism authorities.
The estimates of the uncompensated own-price elastici-
ties for the ®rst period show Spain to be a less price elastic
destination than France but in the second period they are
more similar. This indicates that the price sensitivity of
tourism demand can vary signi®cantly over time.
Although UK tourists remain more sensitive to price
changes in France than in Spain, they are becoming
increasingly sensitive to price changes in Spain, implyingthat Spain may experience more instability of demand rela-
tive to France if this trend continues. The sensitivity of the
UK demand for Spain is increasing in response not only to
changes in its own-price but also to changes in the prices of
its competitors, France and Portugal, as is shown by the
values of the cross-price elasticities in the ®rst and second
periods. In contrast, the sensitivity of the UK demand for
France and Portugal to price changes in Spain demon-
strates a tendency to diminish between the ®rst and second
periods.
Portugal is a small country, in terms of tourism, com-
pared with its neighbours. This fact, combined with thepolitical and historical events that contributed to its lag-
ging behind other European countries in development
terms, may explain Portugal’s late awareness of its tourism
potential. However, calculations based on World Tourism
Organisation data (1999a, 1999b) show that between 1985
and 1997, tourism in Portugal has increased faster (except
for France in terms of arrivals and for the Netherlands in
terms of receipts) than any other western or southern con-
tinental European country. In fact, tourist arrivals in
Portugal increased by 60% between 1987 and 1996, only
surpassed by France with an increase of 69%, and
Portugal’s tourism receipts increased by 275% between1985 and 1997, only surpassed by the Netherlands with
an increase of 288% in the same period. Furthermore,
Portugal’s share of international tourist arrivals has
exceeded 1.5% since 1990, classifying the country as one
of the 20 most visited countries in the world (WTO, 1996).
Nevertheless, in terms of receipts, the picture is less favour-
able as Portugal drops to a position below 25 among the
most important tourism destinations. In terms of touri
arrivals in Portugal, Spain is the most important origin
followed by the UK, while in terms of receipts, the UK
the most important origin (Instituto Nacional d
Estatistica, 1975±1997). Spanish tourists in Portugal a
mainly short-term visitors who enter the country in hug
numbers but spend very little. UK tourists display th
opposite behaviour, entering the country in smaller numbers (roughly, 10% of the Spanish tourists, according t
the DireccË a Äo-Geral do Turismo12) but spending more tim
and money during their longer-term visits.
Although Portugal undertook a major eV ort of mod
ernization in an attempt to adjust to its EU partners’ deve
opment levels, this eV ort, in tourism terms, has only bee
noticeable during the 1990s. For most of the sample period
the data re¯ect an attractive but relatively underdevelope
country. There are, of course, places in Portugal with th
cosmopolitan environment seen in similar destinatio
countries but they tend to be too crowded for tourists look
ing for a minimum of quality to accompany rising servicprices. These features are not easy to capture in the mode
given the data available, and may be one of the reason
for the statistical performance of the equation fo
Portugal, rendering the elasticities estimates more dicu
to interpret.
However, there is sucient evidence to indicate th
changes that Portugal has been experiencing in touris
terms. For instance, although the expenditure elasticity o
the UK demand for Portugal is not signi®cantly diV eren
from unity in both periods, its estimate increases from th
®rst period to the second. If additional observations coul
provide signi®cant con®rmation of this tendency, thwould mean that an increase in the UK tourism budge
allocated to the region would be accompanied by a large
share for Portugal in the second period ceteris paribu
con®rming a growing UK preference for Portugal an
assisting the country to `catch-up’ with its richer neigh
bours. The own-price elasticity is signi®cant in both per
ods and clearly portrays a diminishing sensitivity of th
UK demand for Portugal with respect to price changes i
this destination country. In fact, from the ®rst to the sec
ond period, this elasticity estimate drops sharply to a valu
even below that of France, while Spain shows an increas
in its second period own-price elasticity estimate.The cross-price elasticities provide useful informatio
about the interrelationships between the destinations. Th
cross-price elasticities between Portugal and France ind
cate the lack of sensitivity of the UK demand for Portuga
(France) to price changes in France (Portugal ) since fo
both periods, the cross-price elasticity of the UK deman
for Portugal (France) with respect to price changes
UK tourism demand in neighbouring countries 51
12DireccË a Äo-Geral do Turismo, Foreign arrivals, in http://www.world-tourism.org/portugal/htm/stat_uk.htm

8/6/2019 A System of Equations Model of UK Tourism Demand in Neighbouring Countries
http://slidepdf.com/reader/full/a-system-of-equations-model-of-uk-tourism-demand-in-neighbouring-countries 12/13
France (Portugal) is not signi®cantly diV erent from zero.
The case is diV erent for the cross-price elasticities estimates
between Spain and Portugal. For both periods and in both
countries, the UK demand for tourism in one country
responds signi®cantly to price changes in the other.
However, as expected, the UK demand for Spain is only
marginally aV ected by price changes in its smaller neigh-
bour, while the UK demand for Portugal is responsive to
price changes in Spain, particularly in the ®rst period.
In the second period, the UK demand for tourism in
Portugal responds less to price changes in Spain than in
the ®rst period, which indicates that Portugal may have
achieved more stability as a UK tourism destination,
along with greater independence from price changes in
Spain.
Political changes are likely to have an adverse eV ect
on tourism demand, as indicated by the negative coecient
on the dummy variable for Spain and Portugal whose
average shares decreased during the period 1974Ð1978,
while that of France increased. The estimated coecient
for the trend variable also shows an increasing average
share of UK tourism expenditure for France, while
Spain’s share tends to decrease. This further con®rms the
already stated loss of ground of Spain to France and indi-
cates that countries cannot rely on continuing gains from
tourism.
The application of the AIDS model has provided new
information about the behaviour of tourism demand dur-
ing the development process. For example, it has shown
that although lower income countries can bene®t from
increases in the expenditure budget relative to their neigh-
bours, they will not do so automatically. Portugal and
Spain, for example, failed to achieve similar gains fromincreases in the UK tourism budget. Exploration of the
reasons why some lower income countries experience dis-
proportionate gains from rises in tourism expenditure is a
topic for investigation, as is the reasons why countries can
fail to maintain their advantageous position. The study has
also shown that competition for international tourism
demand, rather than complementarity, characterized the
neighbouring countries under consideration. Investigation
of the degree to which competitiveness rises or falls as other
countries attain more similar levels of development is a
further topic for research.
A C K N O W L E D G E M E N T S
The authors thank anonymous referees for constructive
comments on earlier versions of this paper.
R E F E R E N C E S
Barten, A. P. (1977) The system of consumer demand functionsapproach: a review, in Frontiers of Quantitative Economics,
Michael D. Intriligator (Ed.) North-Holland PublishiCompany, Amsterdam.
Business Monitor MA6 (1970-1993) Overseas Travel and TourismGovernment Statistical Service, Central Statistical OcHMSO, London.
Deaton, A. and Muellbauer, J. (1980a) Economics and ConsumBehaviour, Cambridge University Press, Cambridge.
Deaton, A. and Muellbauer, J. (1980b) An Almost Ideal DemanSystem, The American Economic Review, 70, 312±26.
De Mello, M. (2001) Theoretical and empirical issues in tourismdemand analysis, PhD thesis, mimeo, Tourism and TravResearch Institute, University of Nottingham.
Dickey, D. A. and Fuller, W. A. (1979) Distributions of the estmators for autoregressive time series with a unit root, Journof the American Statistical Association, 74, 427±31.
Dickey, D. A. and Fuller, W. A. (1981) Likelihood ratio statistifor autoregressive time series with a unit root, Econometric49, 1057±72.
Engle, R. F. and Granger, C. W. J. (eds.) (1991), Long-ruEconomic Relations: Readings in Cointegration, OxfoUniversity Press, Oxford.
Government Statistical Service, Travel Trends: A Report on th1994 (1995/6/7) International Passenger Survey, CentrStatistical Oce, HMSO, London.
Gujarati, D. N. (1995) Basic Econometrics, 3rd ed., McGraw-HiNew York.
Gunadhi, H. and Boey, C. (1986) Demand elasticities of tourismin Singapore, Tourism Management, 7, 239±53.
Instituto Nacional de Estatistica (1975±1997) Estatisticas dTurismo, Instituto Nacional de Estatistica, Lisbon.
International Monetary Fund (1989±1997) International FinanciStatistics Yearbook, International Monetary FunWashington, DC.
Loeb, P. D. (1982) International travel to the United States: aeconometric evaluation, Annals of Tourism Research, 9, 7±2
Lopes, J. S. (1996) A Economia Portuguesa Desde 1960, GradivLisbon.
Muellbauer, J. (1976) Community preferences and the represen
tative consumer, Econometrica, 44, 979±99.O’Hagan, J. and Harrison, M. (1984) Market shares of US touriexpenditure in Europe: an econometric analysis, ApplieEconomics, 16, 919±31.
Papatheodorou, A. (1999) The demand for international tourisin t he Mediterranean region, Applied Economics, 31, 619±3
Pashardes, P. (1993) Bias in estimation of the Almost IdeDemand System with the Stone index approximatioEconomic Journal , 103, 908±16.
Song, H., Romilly, P. and Liu, X. (2000) An empirical study outbound tourism demand in the UK, Applied Economic32, 611±24.
Syriopoulos, T. (1995) A dynamic model of demand fMediterranean tourism, International Review of AppliEconomics, 9, 318±36.
Syriopoulos, T. and Sinclair, M.T. (1993) An econometric studof tourism demand: the AIDS model of US and Europeatourism in Mediterranean countries, Applied Economics, 21541±52.
Tsai, P.-L. and Wang, K.-L. (1998) Competitiveness of intenational tourism in Taiwan: US versus Japanese visitorApplied Economics, 30, 631±41.
Uysal, M. and Crompton, J. (1984) Determinants of demand fointernational tourism ¯ows to Turkey, Tourism Managemen5, 288±97.
Vogt, M.G. and Wittayakorn, C. (1998) Determinants of thdemand for Thailand’s exports of tourism, ApplieEconomics, 30, 711±15.
520 M. De Mello et a

8/6/2019 A System of Equations Model of UK Tourism Demand in Neighbouring Countries
http://slidepdf.com/reader/full/a-system-of-equations-model-of-uk-tourism-demand-in-neighbouring-countries 13/13
World Tourism Organisation (1996) Datos Esenciales, WTO,Madrid
World Tourism Organisation (1999a) Destination Country TotalsAccording to a Single Indicator ± International TourismReceipts 1985±1997 , WTO, Madrid.
World Tourism Organisation (1999b) Destination Country TotalsAccording to a Single Indicator ± Arrivals of Tourists fromAbroad 1987±1996, WTO, Madrid.
White, K. J. (1982) The demand for international travel: system-wide analysis for US travel to Western EuropDiscussion Paper No. 82±28, University of BritiColumbia, Vancouver.
Zellner, A. (1962) An ecient method of estimating seemingunrelated regressions and test for aggregation biaJournal of the American Statistical Association, 57, 34868.
UK tourism demand in neighbouring countries 52