
A System Dynamics Decision Cockpit For A Container Terminal: The Case ... · A System Dynamics...
10
A System Dynamics Decision Cockpit For A Container Terminal: The Case Of Voltri Terminal Europe Abstract - The evolution of market features imposed by globalization and production delocalization phenomena in the last decades, has determined the need for ports to quickly react to market changes in order to capture and manage the increasing quantity of global freight. Moreover, due to the highly dynamic and stochastic context, ports have to face with a real time planning of their work so to perform operations in the most efficient way. For instance, a ship’s delay or a truck’s strike can modify the operative scenario, consequently imposing to rescheduling container terminal activities. In this context the System Dynamics (SD) paradigm can usefully help in efficiently modeling the port activities in order to take the right decisions under different scenarios. Moreover the system dynamics model can be efficiently integrated with an ERP system in order to receive real time data and, through a suitable SD decision cockpit – which allows an easy management of huge amount of dynamic data –, carry out what-if analysis to take the most appropriate decision for a particular port context. The paper presents the case of Voltri Terminal Europe – VTE, one of the biggest container terminal in the Mediterranean area, located in the Genoa port. The goal of the paper is to model, through a system dynamics approach, VTE operations and, thanks to an efficient decision cockpit connected with an ERP system, provide a support for its management. Keywords - systems dynamics, container terminal modelling, decision cockpit, ERP. I. INTRODUCTION The significant traffic development triggered by worldwide phenomena that have characterized the market in the last decades (such as globalization, market liberalization and production delocalization) has highly increased the complexity of the port context. Claudia Caballini is with CIELI – Italian Centre of Excellence in Integrated Logistics of the University of Genoa, Via Opera Pia 15, 16145, Genoa, ITALY (email: [email protected]). Enrico Briano is also from DIP Consortium, New Voltri Terminal, Office Tower, 16158 Genoa GE, Italy (email: [email protected] ). Marco Mosca is with DIPTEM – Department of Production Engineering, Thermoenergetics and Mathematical Models of the University of Genoa, Via Opera Pia 15, 16145, Genoa, ITALY (phone: +39 010 3532883; fax: +39 010 317750, email: [email protected] ). Roberto Revetria is with DIPTEM – Department of Production Engineering, Thermoenergetics and Mathematical Models of the University of Genoa, Via Opera Pia 15, 16145, Genoa, ITALY (phone: +39 010 3532883; fax: +39 010 317750; email: [email protected] ). In particular, in order to remain competitive on the market, ports have to quickly react to market changes and to efficiently manage an increasing volume of goods. So, in the current dynamic and stochastic environment, it is more and more fundamental the possibility to dispose of appropriate Decision Support Systems (DSS) such as decision cockpits, able to guide port terminal managers in taking the most suitable decision in every moment. In order to do that, decision cockpits must be integrated with ERP and other managing systems, so to always working on real updated data. The paper presents the case of Voltri Terminal Europe, one of the most efficient and big gateway container terminal in the Mediterranean, with a total throughput of about 1 million TEUs in 2007. The paper is organized as follows. Section I presents an introduction regarding the context of reference, while section II provides a description of VTE main features. Section III highlights the state of the art about system dynamics decision cockpits. The particular system dynamics model and its correlated decision cockpit are described in section IV. In section V a different approach is presented based on traditional regressive meta-modelling applied in order to identify relationships among port KPIs. In section VI an optimization of the model with the goal of finding out the optimal number of terminal resources that minimizes the total costs is provided. Finally section VII presents some final conclusions and future research perspectives. II. VOLTRI TERMINAL EUROPE DESCRIPTION Voltri Terminal Europe (Figure 1) is located in the Port of Genoa, which represents the most important Italian port in terms of cargo handled. This is due to its favorable location, near the big consumer markets of central Europe and in good position in respect to the mother routes of the big containership coming from Far East. The terminal is provided with 10 quay cranes, 23 RTG cranes, 32 straddle carriers, 64 tractors and 3 RMG for the railway traffics. On the sea side the terminal can dispose of 5 berths capable of handling 3 rd generation vessels. The terminal area is divided into two parts, the inner one is dedicated to import cargo while the seaside one is for the export freight. Besides the terminal can Enrico Briano, Claudia Caballini, Marco Mosca and Roberto Revetria INTERNATIONAL JOURNAL OF MATHEMATICS AND COMPUTERS IN SIMULATION Issue 2, Volume 3, 2009 55
Transcript of A System Dynamics Decision Cockpit For A Container Terminal: The Case ... · A System Dynamics...

A System Dynamics Decision Cockpit For A Container Terminal: The Case Of Voltri
Terminal Europe
Abstract - The evolution of market features imposed by globalization and production delocalization phenomena in the last decades, has determined the need for ports to quickly react to market changes in order to capture and manage the increasing quantity of global freight. Moreover, due to the highly dynamic and stochastic context, ports have to face with a real time planning of their work so to perform operations in the most efficient way. For instance, a ship’s delay or a truck’s strike can modify the operative scenario, consequently imposing to rescheduling container terminal activities. In this context the System Dynamics (SD) paradigm can usefully help in efficiently modeling the port activities in order to take the right decisions under different scenarios. Moreover the system dynamics model can be efficiently integrated with an ERP system in order to receive real time data and, through a suitable SD decision cockpit – which allows an easy management of huge amount of dynamic data –, carry out what-if analysis to take the most appropriate decision for a particular port context. The paper presents the case of Voltri Terminal Europe – VTE, one of the biggest container terminal in the Mediterranean area, located in the Genoa port. The goal of the paper is to model, through a system dynamics approach, VTE operations and, thanks to an efficient decision cockpit connected with an ERP system, provide a support for its management. Keywords - systems dynamics, container terminal modelling, decision cockpit, ERP.
I. INTRODUCTION The significant traffic development triggered by
worldwide phenomena that have characterized the market in the last decades (such as globalization, market liberalization and production delocalization) has highly increased the complexity of the port context.
Claudia Caballini is with CIELI – Italian Centre of Excellence in
Integrated Logistics of the University of Genoa, Via Opera Pia 15, 16145, Genoa, ITALY (email: [email protected]).
Enrico Briano is also from DIP Consortium, New Voltri Terminal, Office Tower, 16158 Genoa GE, Italy (email: [email protected]).
Marco Mosca is with DIPTEM – Department of Production Engineering, Thermoenergetics and Mathematical Models of the University of Genoa, Via Opera Pia 15, 16145, Genoa, ITALY (phone: +39 010 3532883; fax: +39 010 317750, email: [email protected]).
Roberto Revetria is with DIPTEM – Department of Production Engineering, Thermoenergetics and Mathematical Models of the University of Genoa, Via Opera Pia 15, 16145, Genoa, ITALY (phone: +39 010 3532883; fax: +39 010 317750; email: [email protected]).
In particular, in order to remain competitive on the market, ports have to quickly react to market changes and to efficiently manage an increasing volume of goods. So, in the current dynamic and stochastic environment, it is more and more fundamental the possibility to dispose of appropriate Decision Support Systems (DSS) such as decision cockpits, able to guide port terminal managers in taking the most suitable decision in every moment. In order to do that, decision cockpits must be integrated with ERP and other managing systems, so to always working on real updated data.
The paper presents the case of Voltri Terminal Europe, one of the most efficient and big gateway container terminal in the Mediterranean, with a total throughput of about 1 million TEUs in 2007.
The paper is organized as follows. Section I presents an introduction regarding the context of reference, while section II provides a description of VTE main features. Section III highlights the state of the art about system dynamics decision cockpits. The particular system dynamics model and its correlated decision cockpit are described in section IV. In section V a different approach is presented based on traditional regressive meta-modelling applied in order to identify relationships among port KPIs. In section VI an optimization of the model with the goal of finding out the optimal number of terminal resources that minimizes the total costs is provided. Finally section VII presents some final conclusions and future research perspectives.
II. VOLTRI TERMINAL EUROPE DESCRIPTION Voltri Terminal Europe (Figure 1) is located in the
Port of Genoa, which represents the most important Italian port in terms of cargo handled. This is due to its favorable location, near the big consumer markets of central Europe and in good position in respect to the mother routes of the big containership coming from Far East.
The terminal is provided with 10 quay cranes, 23 RTG cranes, 32 straddle carriers, 64 tractors and 3 RMG for the railway traffics. On the sea side the terminal can dispose of 5 berths capable of handling 3rd generation vessels. The terminal area is divided into two parts, the inner one is dedicated to import cargo while the seaside one is for the export freight. Besides the terminal can
Enrico Briano, Claudia Caballini, Marco Mosca and Roberto Revetria
INTERNATIONAL JOURNAL OF MATHEMATICS AND COMPUTERS IN SIMULATION
Issue 2, Volume 3, 2009 55
dispose of a vast dry port area with about 20.000 square meters of warehouses and about 7.000 square meters of offices.
Figure 1: A view of VTE
VTE is characterised by a good operational efficiency,
immediate berthing, fast vessel turnaround time and fast gate clearance (it takes less than an hour for a complete cargo cycle including documentation, discharging of export and loading of import). Moreover the terminal presents an internal security service which controls the terminal 24 hours a day. A control room, manned 24 hours a day by the terminal security staff, assures the surveillance of the whole territory. In fact, Genoa Port Authority has fixed strict procedures to grant permissions to enter the port area after VTE approval. Each container arriving at the terminal is subject to a strict control of the relative documentation and seal. A scanner provided by Italian Customs, which allows the X-ray inspection of the containers, is available at the terminal. Besides, in order to increase the terminal security, several inspections of the goods stored in containers are performed on a random basis.
The terminal presents extensive shipping connections (Figure 2) with all the world regions (Far East, Middle East, North, Central/South America) and dedicated direct road and rail connections provide access to a wide inland transportation network. It boasts more than 30 shipping companies as customers, most of which are worldwide ones.
Figure 2: VTE maritime connections
VTE is provided with good railway network
connections with the biggest European customers;
instead, regarding the road mode, the terminal is connected with the main southern European markets within a maximum of two days trip.
III. SYSTEM DYNAMICS DECISION COCKPITS The authors propose a System Dynamics (SD)
approach in order to model the VTE container terminal and develop a decision cockpit useful for managing at best all its activities minimizing the associated times and costs.
The choice of utilizing the SD paradigm derives from the fact that for complex systems, such as the port one, it is very difficult to collect real data regarding its functioning. So in this case, when it is necessary to understand the impact on the system of a particular decision, it is better to analyze its internal structures and all the interrelations among its variables and so derives possible ways of answers of the system to particular solicitations. This is exactly what SD is able to guarantee, describing the systems in terms of stocks and flows.
Moreover the SD approach has been combined with a Balanced Scorecard (BSC) methodology in order to derive all the necessary KPIs useful to develop a proper decision cockpit to support terminal managers and stakeholders.
Unlike other traditional performance measurement systems, the BSC approach has the advantage to consider both financial and non financial performance indicators, through a balanced set of lead and lag indicators, whose results can be simultaneously evaluated, so to implement the proper actions in order to pursue the business strategy. In order to develop a correct System Dynamics model, a detailed causal loop analysis has to be developed. Feedback loops depict the effects of policies affecting the dynamics of strategic resources, such as corporate image, liquidity, accounts receivable and workers.
Strategic assets are modelled as stocks (or levels) of available tangible or intangible factors in a given time, while their dynamics depend on the value of the corresponding inflows and outflows. Flows are modelled as “valves” where decision makers can act through their policies, in order to influence the dynamics of each strategic asset, and then, through them, business performance drivers and outcome indicators.
In literature many examples of successful applications of the joint applications of the two approaches can be found.
Bianchi and Montemaggiore [13] integrated the Balanced Scorecard approach with the System Dynamics methodology in order to measure the performances of a water distribution system by analyzing the cause and effect relationships among the key variables. In the case proposed, strategic mapping and simulation through the SD methodology has proved to successfully enhance managers learning and capability to identify causal relationships between policy levers and company performance, and better communicate strategy with stakeholders. The model discussed also provides
INTERNATIONAL JOURNAL OF MATHEMATICS AND COMPUTERS IN SIMULATION
Issue 2, Volume 3, 2009 56

research insights into policies aimed at handling the demand profile and the “seasonality” factor, on both the supply and demand sides.
Also Akkermans and Van Oorschot [22] integrated BSC approach with SD: the first one underlined five evident limitations, in terms of representing feedback loops, time delays between cause and effects, mechanism for validation, links between strategy and operations and balancing the system boundaries. SD then was utilized to overcome these limitations applying it to a model, which studies the behaviour of an organization of a large insurance company.
Chang, Hong and Lee [23] proposed the System Dynamics approach in order to develop a DSS (Decision Support System) devoted to analyze and solve the problems that affected the coral reef in the coastal zone of Kenting, Taiwan. The model proved to be able to solve the coastal zone management problems thanks to the breaking down of the system into four different submodels: socio-economic, environmental, biological, and management, joined together for allowing integrated assessment of the particular problem.
Strohhecher [14] developed a cockpit using the Balanced Scorecard methodology in order to analyze performances in a laboratory experiment: the task was to implement a given strategy as best as possible, so translating it into operational decisions over a period of 10 years. The experiment group was equipped with a BSC management cockpit that was carefully tailored to the strategy, while the control group had to rely on traditional reports as information source. The experiment was conducted as a computer aided simulation experiment, following similar research conducted by other authors and a simulator specifically developed for the case was used. By design, the case study description and the strategy map reflected the causal relationships modeled in the micro-world. Participants decided on four parameters while implementing strategy. These parameters included the target margin markup, target number of employees, marketing budget and expenditures for research and development of the business concept and technology. All 4 parameters influenced variables that related to 12 strategic issues and finally had an effect on various performance measures. To ease the comparability of the subjects an overall performance measure was calculated, which was aggregating strategic goals – sales revenues, profitability and market share. Having made their decisions, participants could continue by simulating one quarter ahead. The simulator allowed to report the simulation results to the individual participant by two different means: traditional reports and a BSC. The BSC management cockpit reduced the number of measures displayed compared to the reports cockpit. Between November 2005 and January 2007 a total of ten experiments were performed, each involving 13 to 29 participant, and the results showed that the mean SSP (Standardized Simulation Performance) of the treatment group with a BSC available was in 7 out of 10 experiments higher than in the control group. Only in
three experiments, the subjects using traditional reports showed a higher performance. To test, whether the differences were statistically significant or not, statistical tests were applied. Implementing the t-test, in fact, the hypothesis that there was no difference between the standardized performance of the BSC users and the report users were clearly rejected. Both the differences in the mean values and the variances were highly significant. As a consequence, it can be assumed that the hypothesis, which postulates a superior performance of BSC users compared to non-users, has been strengthened.
IV. MODEL DESCRIPTION Here after a description of the System Dynamics
model implemented in Powersim Studio 7 Express will be provided. It has been chosen to utilize Powersim instead of other system dynamics simulation softwares (such us I-Think/Stella or Vensim) because it provides lots of useful functionalities, such us the optimizer, which is directly integrated inside the software, and the possibility to create complex decision cockpits.
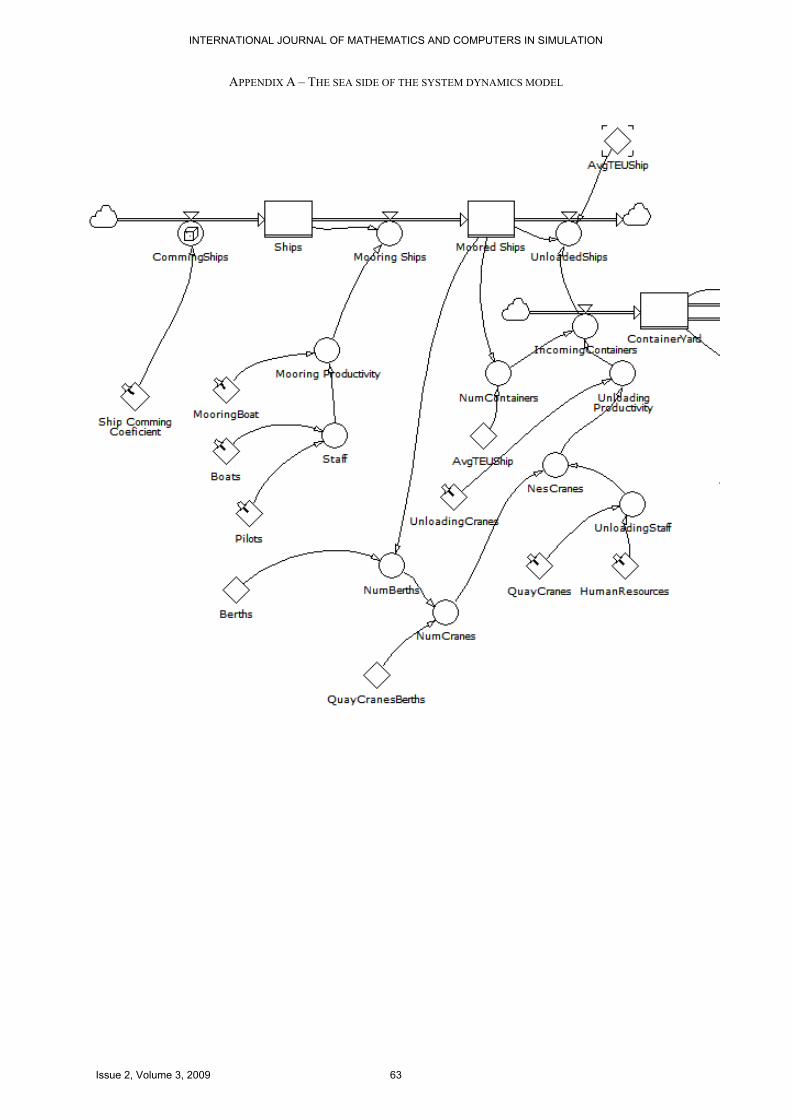
Basically a container terminal can be divided into three main parts, according to the particular set of activities that must be executed: a sea-side part where ships arriving by sea are loaded and unloaded; a yard area, where containers are properly organized and stored and finally a shore-side part that regards the terminal connections with the inland territory by means of road and rail transportation modes (Figure 5). In our model it has been decided to focus only on the first and third parts, leaving out the one concerning the yard management.
Figure 5: A scheme of VTE layout
The part of the model related to sea side concerns the
processes related to the container ships mooring/ unmooring together with the containers loading/unloading activities (Figure 6).
Voltri Terminal Europe is provided with 5 berths, meaning that a maximum number of 5 vessels can be served at once. When a container vessel arrives, a pilot and a boat pull it towards one of the available berth where it will be discharged by one or more quay cranes. More in particular these handling means pick up containers from ship bays and put them down onto trailers (that are specific trucks for containers handling),
INTERNATIONAL JOURNAL OF MATHEMATICS AND COMPUTERS IN SIMULATION
Issue 2, Volume 3, 2009 57

which bring them in the container terminal yard. Here a certain number of gantry cranes operate, picking containers up from trailers and placing them in blocks. Often, in order to speed up operations, it is necessary to re-arrange containers placements in the yard also utilizing reach stackers. After having been discharged and placed in the yard, containers wait until they are carried on a train or external trucks for continuing their import trip in the hinterland. In same cases they can wait for being loaded on another vessel (transhipment).
It is worth underlining that the here presented model is focused on the import flow but analogous processes -expect for the inverse order- take place for the export flows, in which containers arrive from the land side by rail or road and continue their transportation via sea.
The SD model, as can be seen in Appendix A and B, is composed by a certain numbers of flows/rates, levels/stocks, auxiliary variables and constants which describe the whole process as a continuous flow of items (in this case containers and trucks/trains) that accumulate in different parts of the model according to particular decision rules and logics.
The model takes care of the number of resources – both in terms of human operators and mechanical means – needed to perform all the required operations and their relative productivity, which represent a constraint to the speed of items processed by the terminal.
The first part of the model, shown in Appendix A, is characterized by three levels: ‘Ships’, ‘Moored Ships’ and ‘Container Yard’ (this last one represents the connection with the second part of the model). The type of these levels is the reservoir, that means that it cannot be depleted below zero. In the ‘Ship’ level the number of incoming ships is accumulated. Incoming ships are moored only if there are available berths and so the number of moored ships accumulates in the ‘Moored Ships’ level. ‘Container Yard’ level gives, at any time, the total number of containers that are present in the yard, summing ingoing containers and subtracting outgoing ones.
The ‘Ship Coming Coefficient’ is a constant which provides the number of incoming ship per day and it represents an input to the auxiliary variable ‘Coming Ships’. Since it is not possible to know beforehand the exact number of ships coming in a particular day, in the ‘Coming Ships’ flow the exponential random function is utilized (EXPRND('Ship Coming Coefficient')). This function generates random numbers that are exponentially distributed with a mean value of ‘Ship Coming Coefficient’. So, in a simulation period, a different number of ships will arrive every day.
The constants ‘Boats’ and ‘Pilots’ contain the number of boats and pilots at the terminal disposal. Pilots function is to pull ships to the berths, with the help of a boat. In auxiliary ‘Staff’ is used a formula, which defines the availability of mooring staff considering that for one boat two pilots are needed. The constant ‘Mooring Boat’ represents the number of ships that can be served by the mooring staff per day. So, the mooring productivity is obtained by multiplying the available
number of mooring staff by the mooring staff productivity. The auxiliary ‘Mooring Productivity’ is an input to the rate ‘Mooring Ships’, where coming ships from the level ‘Ships’ pass in the status of ‘Moored Ships’ with a speed defined by the auxiliary ‘Mooring Productivity’.
When ships are moored to the berths, the loading/unloading operations can start. The “Berth” constant defines how many ships can be served at the same time. The available number of quays (total and per berth) are stored in the constants ‘Quay Cranes’ and ‘Quay Cranes Berths’. Each quay cranes is operated by a human operator (the total number of human operators is stored in the constant ‘Human Resources’). The minimum between the number of available quay cranes and corresponding human operators defines the unloading staff (auxiliary ‘Unloading Staff’).
The constant ‘Unloading Cranes’ represents how many containers can be unloaded by one quay crane in the time unit. This allows to calculate the unloading productivity (auxiliary ‘Unloading Productivity’) by multiplying the ‘Unloading Cranes’ by the available unloading staff. Finally, to estimate the number of incoming containers rate in the yard, it is necessary to know how many containers there are in each ship. This latter information is an average value stored in the constant ‘AvgTEUShips’.
In Appendix B the second part of the SD model, regarding the terminal connections with its hinterland by road or rail, is provided. As it can be noticed, this sub-model can be further divided in two sections: one regarding the railway mode and the other one related to the road transportation.
Two separate flows from the container one have been created: one for empty trains and the other one for empty trucks. As far as regards the trains flow, the ‘ArrivingTrain’ rate determine how many empty trains arrive per day, in particular time intervals. The number of arrived trains is accumulated in the ‘EmptyTrain’ level. The auxiliary ‘TrainTEU’ converts the number of empty trains in containers by multiplying the first by the average number of container per one train (the constant ‘AvgTEUTrain’). So, the auxiliary ‘TrainTEU’ provides the number of containers that should be taken out from the yard. On the other side there is a constraint on the number of containers that can be handled in the time unit by a RMG-Rail Mounted Gantry (provided by the auxiliary ‘LoadingRMG’). The auxiliary ‘Loading productivity’ is null if there are no train arriving, and more specifically, if ‘TrainTEU’ is bigger than ‘Loading Staff’ multiplied by the Loading RMG’, ‘Loading productivity’ corresponds to the second term of comparison otherwise to ‘TrainTEU’.
Finally, the ‘Loading to Train’ rate, that is an outgoing flow from the level ‘ContainerYard’, provides the ‘Loading productivity’ value if the container yard is not empty and there are empty trains available, otherwise it returns zero.
The truck loading section is similar to the rail one; the main difference regards the arrivals logic. In the
INTERNATIONAL JOURNAL OF MATHEMATICS AND COMPUTERS IN SIMULATION
Issue 2, Volume 3, 2009 58
auxiliary ‘RandomNum’ is utilized a random function, which generates a series of random numbers that are distributed according to a uniform distribution, with a minimum and maximum values. This means that every day a different number of trucks will arrive in an interval included between a minimum and a maximum number.
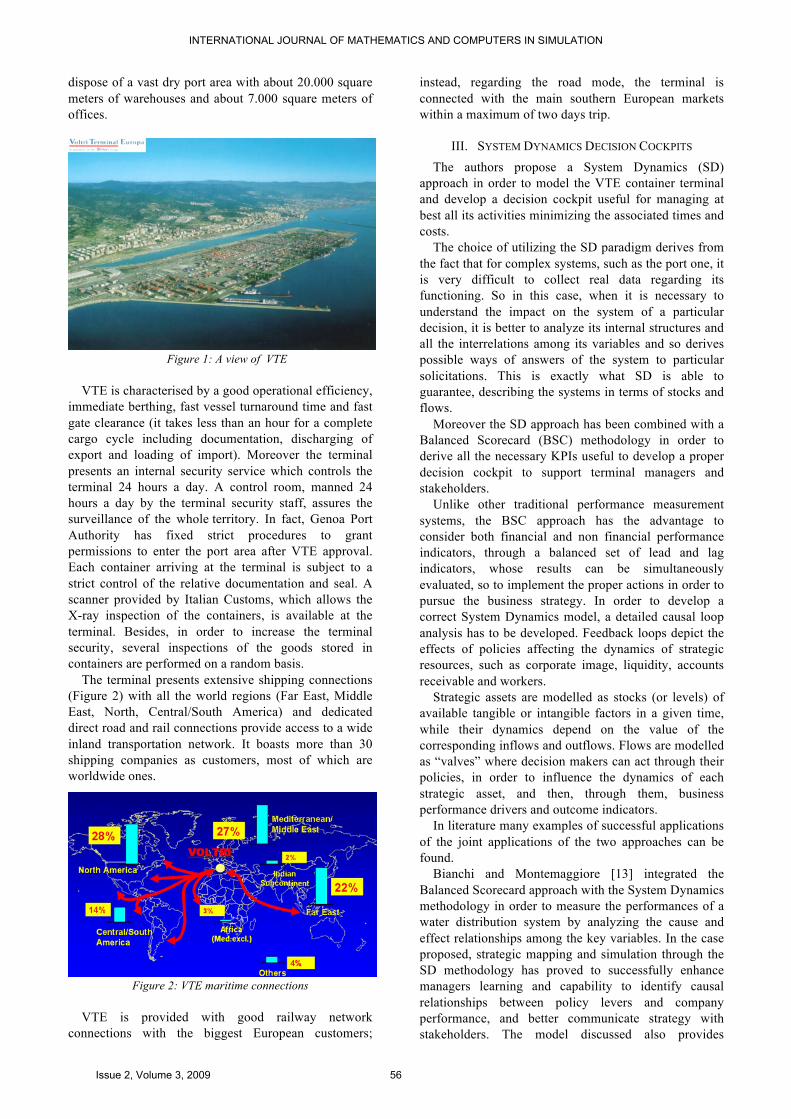
After having built the System Dynamics model, a specific decision cockpit has been developed, again utilizing Powersim Studio.
The goal of this cockpit is to manage at best VTE operations and increase its performances. As previously stated, a cockpit is an interface that allows to evaluate and understand data and future trends in a clear, immediate and comprehensible way. In particular it gives the possibilities to carry out “what-if” analysis on the model in an easy and quick manner with the goal of taking the best decision as soon as possible.
The particular VTE decision cockpit supporting the SD model of VTE is fed with ERP data of the real terminal. In this way the simulation model constantly works with real data, enabling decision makers to proper evaluating the effects of particular actions on a real context and so taking the most appropriate decision.
In Figure 6 two main interfaces of the VTE decision cockpit are shown.
Figure 6: VTE decision cockpit interfaces
V. REGRESSIVE AND ARTIFICIAL NEURAL NETWORKS META-MODELS
The System Dynamics approach is not the only one to understand and study the complex relationships among the KPIs regarding a particular system, as faced also in [18]. There are in fact other tools, such as regressive and artificial neural networks meta-models. A simulation meta-model – or a response surface in the simplest case – is an approximation of the input/output function implied by the underlying simulation model. Its
behavior can be represented as a black-box or a function y = (x1, x2, …, xn), with n model input parameters. The objective of a meta-model is to accurately reproduce the simulation over wide ranges of interest, and to help in simulation analysis thanks to its higher transparency and easier handling in respect to the original simulation model. Computer simulation can be used to define interconnections between independent and dependent KPIs; in similar way such relationships can be built by applying the Design of Experiment technique (i.e. Central Composite Design in order to fit a 2nd order response surface) to the simulation output. For specific opportunity reasons the use of a complete simulation model sometimes is not applicable due to its high costs; in this case raw data coming up from KPIs records could be used directly to identify the hidden relationship by applying regressive multivariate analysis in the form of Linear Regression. Linear Regression simply means that the functional relationship between KPIdep and the regressors can (KPIindep,k) be expressed by a linear equation or, in other words, a sum of terms including the error (1).
(1)
The method used to find the coefficients bj and bij of the model equation (1) is called “least squares estimation”. This means that the error term used in the model equations is defined as the difference between observed response variable {KPIDEP} and estimated KPIDEP for a given setting of the KPIIDEP,k at each data point. The total error must somehow be defined by summing over all the data points or “cases”. Since it is assumed a random distribution of the individual errors with a mean of zero, a simple sum would ideally lead to zero. At least it leads to negative and positive differences canceling each other out. This can be avoided by squaring the errors for each data point and summing these squares. The desired optimum regression model then has to give a minimum for this sum of squared errors. Suffice it to say that the starting point of the calculations is the matrix notation (2) for the system of sample equations, where k are the total KPIINDEP and n is the total number of data set available.
(2) By using a quick notation it is possible to rewrite the (2) in the compact form of (3) and present some interesting calculations on it (bold small letters or words denote vectors, bold capital letters symbolize matrices): y=Xb + err (3) Finally, the vector of the estimated coefficients b is given by (4) where X’ denotes the transposed matrix and X-1 denote the inverse of matrix X:
INTERNATIONAL JOURNAL OF MATHEMATICS AND COMPUTERS IN SIMULATION
Issue 2, Volume 3, 2009 59

b = (X’X)-1 X’y (4) Second order regression meta-models sometimes suffer from lack of performances when used with data affected from high order relationship; in this case a different approach should be used. For the particular purpose of this application a special feature of the Artificial Neural Networks (ANN) may be used in order to approximate the unknown relationship between dependent KPIs and independent ones. ANN differs from conventional techniques because it is not required to specify the nature of the relationships involved. Starting from simple identification of the inputs and outputs the MLP’s main strength lies in its ability to model problems of different levels of complexity, ranging from a simple parametric model to a highly flexible, nonparametric model. For example, an MLP that is used to fit a nonlinear regression curve, using one input, one linear output, and one hidden layer with a logistic transfer function, can function like a polynomial regression or least squares spline. It has some advantages over the competing methods. Polynomial regression is linear in parameters and thus is fast to fit but suffers from numerical accuracy problems if there are too many wiggles. Smoothing splines are also linear in parameters and do not suffer from numerical accuracy problems but pose the problem of deciding where to locate the knots. MLP with nonlinear transfer function, on the other hand, are genuinely nonlinear in the parameters and thus require longer computational processing time. They are more numerically stable than high-order polynomials and do not require knot location specification like splines. However, they may encounter local minima problems in the optimization process.
VI. OPTIMIZATION AND RISK MANAGEMENT The purpose of this section is to find out the optimal
and most robust policies regarding VTE management, according to some assumptions.
In order to do that it has been utilized the genetic algorithms optimizer and the risk analysis tool embedded in Powersim Studio. More in detail the software gives the possibility to find the best set of decisions to achieve a given objective while keeping the risk below a given threshold. Assumptions can be defined as fixed values or probability distributions, if they refer to uncertain factors.
Figure7: The optimization process in Powersim software Moreover in Powersim there are two calculation
methods available for the Risk Management tool: the “Estimate” and the “Confidence level”. With the first one, it must select an estimate to calculate each objective. The optimization will then compare the value of this estimate to the target of the objective when optimizing. Instead, using the Confidence Level calculation method, the optimization will search for a set of decisions that fulfils the objectives within a specified confidence level.
The case here proposed has the aim to optimize, with the estimation method, an objective function regarding the total costs minimization, in relation to the daily ship arrival coefficient, supposed to vary exponentially. The optimization analysis will find an optimal policy in terms of minimum number of terminal resources (human resources and operational means), so allowing the terminal costs minimization. However, an expected event, such as a big delay in a ship arrival, can greatly affect the result. So a risk assessment analysis is fundamental to prevent such a risk. For instance it can be searched a resource management policy that fulfils a minimizing cost objective with a 90% of certainty.
It has been decided to consider only the costs that have to be incurred by the terminal operator, such as the ones related to operational means and human resources. In other words, all the costs sustained by other port stakeholders such as the Port Authority (that for instance has to face the mooring and piloting costs) will not be taken into account in this analysis.
More specifically there will be considered the costs related to:
• RMG cranes; • human operators working on RMG; • quay cranes; • human operators working on quay cranes; • reach stackers; • human operators working on reach stackers.
INTERNATIONAL JOURNAL OF MATHEMATICS AND COMPUTERS IN SIMULATION
Issue 2, Volume 3, 2009 60

It has been supposed that all the terminals handling means are characterized by a life cycle of 20 years; so the purchase, maintenance and fuel costs are supposed to be spread over this period.
The ship arrival coefficient has been considered as an assumption making the arrival rate coefficient varying exponentially with a value of 0,3.
Concerning the decisions variables it has been decided to take into consideration the number of: RMG cranes, human operators working on RMG, quay cranes, human operators working on quay cranes, reach stackers, human operators working on reach stackers (corresponding to the terms costs).
The optimization runs have been conducted utilizing, for the genetic algorithm set-up, a generation of 10 people and 10 seeds and using 10 replications.
Table 1 shows the results obtained (so the optimal solutions) by varying the rate of the arriving ships from 5 to 10 ships/day. As it can be noticed, the total cost increases from about 7,171 million Euro up to 8,411 million Euro (+17.3%) because more resources are needed to manage the bigger flow of incoming ships. However this is not a considerable increase, taking into account that the number of ships to be served at the terminal has doubled. This is due to the fact that the more expensive handling means, that correspond to RMG and quay cranes, have been affected only by a little increase, so allowing to keep down the total costs. At the same time the almost doubling of other resources like reach stackers - that have a low unit cost - had a very small impact on the terminal container total costs.
Table 1: Total costs and number of terminal resources under
two different ship arrival scenarios
Ship Arrival
Rate=5 Ship Arrival
Rate=10
RMG 2,44 2,80
RMG operators 3,81 8,33
quay cranes 6,32 6,74
quay crane operators 7,61 18,29
reach stackers 10,57 18,80
reach stacker operators 20,67 22,79
Total costs 7.171.631,25 €/year
8.411.171,26 €/year
VII. CONCLUSIONS This study has shown the effectiveness of the
application of Systems Dynamics in treating complex decision making problems concerning the port sector, where a strict interaction with ERP and Data Warehouse can play a crucial role.
The development of a proper decision cockpit, also making use of the Balanced Scorecard approach, proved to be very useful in conducting quick and useful “what-
if” analysis with the final goal of helping the terminal managers in taking the most appropriate decisions under different operative scenarios.
Moreover, the proposed approach can be regarded as a practical application of the Business Performance Management paradigm that will represent the upcoming evolution of the more recent ERP Systems, especially in the field of maritime applications.
Current and future research will be focused on an extension of the model in order to take into account also the yard dynamics and the export flow.
ACKNOWLEDGMENTS The authors would like to thank Dana Grigorjeva and
Francesca Oliva for their support to this work.
REFERENCES [1] C. Forgia, R. Revetria, “System Dynamics and Regressive Meta-
Modeling Applied Methodology for Improving Management Performances in Services Industry: a Case Study in Supply Chain and Highway Maintenance”, Proceedings of Spring Simulation Multiconference, April 14 - April 17, Ottawa, Canada, 2008;
[2] T. Davenport, "Putting the Enterprise into the Enterprise Systems" Harvard Bus. Rev. July 12, 131, 1998;
[3] P. F. Drucker, J. A. Ness, T. G. Cucuzza, R.Simons, A.Dbvlla, Kaplan R., Norton D., Eccles R. G., (1998) "Harvard Business Review on Measuring Corporate Performance", Harward Business School Press, ISBN 0-87584-882-6;
[4] Forrester J. W. (1961) “Industrial Dynamics” Pegasus Communication, 479 pp. ISBN 1883823366 ;
[5] Kamath M., Dalal N., Sivaraman E., Kolarik W. (2004) "Toward an Integrated Framework for Modeling Enterprise Processes" Communications of the ACM, March 2004/Vol. 47. No. 3 83-87;
[6] Kaplan R. S., Norton D. P. (2004)"Strategy Maps: Converting Intangible Assets into Tangible Outcomes", Harvard Business School Press, ISBN 1591391342;
[7] R. Revetria, R. Mosca, C. Forgia (2005) “Top Down Modeling and Montecarlo Simulation for Financial & Cost Control In Complex Projects” Proceedings of Modelling, Identification & Control, Innsbruck A, January;
[8] R. Revetria, R. Mosca, M. Schenone (2005) "Improve Supply Chain Management using neural networks and regressive KPI relationship metamodels" Proceedings of CASYS 2005, Liège (BE), August;
[9] Ruth M., Hannon B. (1997) “Modeling Dynamic Economic Systems (Modeling Dynamic Systems)”, Springer Verlag, 339 pp. ISBN 038794849X;
[10] Steppan D. D., Werner J., Yeater R. P., (1998) Essential Regression and Experimental Design for Chemists and Engineers, Gibsonia, PA Bethel Park, PA Moundsville, WV June 1998;
[11] Zrimsek B., (2002) "ERP II: The Boxed Set" Gartner Group, Stamford, CT Mar4;
[12] N. Bellomo, V. Coscia, M. Delitala, On the Mathematical Theory of Vehicular Traffic Flow I. Fluid Dynamic and Kinetic Modelling, Math. Mod. Meth. App. Sc., Vol. 12, No. 12 (2002) 1801-1843;
[13] Bianchi C. & Montemaggiore G.B., “Enhancing Strategy Design and Planning in Public Utilities through “Dynamic” Balanced Scorecards: Insights from a Project in a City Water Company”; System Dynamics Review vol.24 n.2, Summer 2008;
[14] Strohhecker J. Does “A Balanced Scorecard Management Cockpit Increase Strategy Implementation Performance”, July 2007;
[15] Kaplan, R. S., & Norton, D. P.; The Balanced Scorecard – Measures that Drive Performance. Harvard Business Review, Vol. 70, 71–79,1992;
[16] Kaplan, R. S., & Norton, D. P.; The Balanced Scorecard: Translating Strategy into Action. Boston, Mass.: Harvard Business School Press,1996;
[17] Kaplan, R. S., & Norton, D. P.; Using the Balanced Scorecard as a Strategic Management System. Harvard Business Review, Vol. 74, 75–85; 1996;
INTERNATIONAL JOURNAL OF MATHEMATICS AND COMPUTERS IN SIMULATION
Issue 2, Volume 3, 2009 61

[18] Revetria R., A System Dynamics Model for Supporting Harbor Logistics Monitoring Proceedings of 24th International Annual Port Conference, 17- 19 February, Hilton Green Plaza, Alexandria – Egypt, 2008;
[19] Revetria R., Oliva F., Taskov S. (2008) Application of Artificial Neural Networks for Business Process Meta-Modeling for Leading ERP Implementation, Accepted for Pubblication in WSEAS Transactions of Systems, ISSN: 1109-2777;
[20] Revetria R..,Giribone P., Oliva F., Catania A. (2007) Models For Supporting Sea Transportation Evolution: A Case Study For An International Harbor System WSEAS Transaction of Systems ISSN 1109-2777 Issue 4, Volume 6, April 2007 pp. 668-677;
[21] Shahzad B., Afzal Safvi S. (2008) Effective risk mitigation: a user prospective, NAUN International Journal of Mathematics And Computers In Simulation, ISSN: 1998-0159, Issue 1, Volume 2, 2008, pp. 70-80.
[22] Akkermans, H.A., Oorschot, K.E. van (2005). Relevance assumed: A case study of balanced scorecard development using system dynamics. Journal of the Operational Research Society, 56(8),2005; pp-931-941
[23] Chang Y.C., Wong F.W., Lee M.T., A system dynamic based DSS for sustainable coral reef management in Kenting coastal zone, Taiwan, Science Direct Ecological Modeling, Volume 211 – Issues 1-2, 24 February 2008, pp.153-168
Enrico Briano was born in 1980, June 3rd, in Finale Ligure (Italy) and completed his studies in Management Engineering at the University of Genoa in November 2004, when he took the degree. From May to July 2002 he took part at the international program IEPAL - Intensive Educational Program in Advanced Logistic, promoted by DIP - Production Engineering Department of Genoa University, in collaboration with the Stevens Institute of Technology, Boston College and University of Florida - Centre of Simulation, where, in cooperation with Venice Port Authority, he studied a problem solving case for goods procurement inside the city of Venice. He had a working experience in 2004-2005 with Piaggio Aero Industries, Genoa Plant, for reengineering the productive process of an executive aircraft. From 2005 to 2008 he worked as ERP consultant in the GDO field and developed HLA (High Level Architecture) Virtual Reality Simulators for port operators’ training. He also developed Decision Support Systems using System Dynamics for maintenance in the transportation field, in cooperation with some of the most important Italian motorway management companies. He also developed simulators for vehicular traffic flows using Java™ for several municipalities in northern Italy. He is a 3rd year PhD student in Mathematical Engineering and Simulation at the University of Genoa and cooperates with the Department of Production Engineering, Thermoenergetics and Mathematical Models in the same University. Eng. Briano is also senior partner and Consulting & ERP Business Unit Delivery Manager of DIP (Development of Innovative Projects) Consortium and Senior Partner of 3B Studio. In 2008 he became certified IPMA Project Manager and Lead Auditor for ISO 27001 normative on Information Security Management Systems for Italian Naval Bureau (RINA). Claudia Caballini was born in Cremona (Italy) in 1980. In 2004 she obtained her degree in Management Engineering (5 years) at the Faculty of Engineering of Genoa University (Italy) with full marks. From February to April 2003 she took part at the international program IEPAL - Intensive Educational Program in Advanced Logistic,
promoted by DIP - Production Engineering Department of Genoa University, in collaboration with the Stevens Institute of Technology, Boston College and University of Florida - Centre of Simulation, during which she reinforced her competences in integrated logistics also utilizing Arena software. From 2004 to 2006 she had a working experience in Costa Cruise Company and then she worked in a consulting project for the processes reengineering of an American company. Since January 2007 she is working at CIELI – Italian Centre of Excellence in Integrated Logistics - of Genoa University as a PhD student, where she also actively collaborate with DIPTEM - Department of Production Engineering, Thermoenergetics and Mathematical Models of the University of Genoa. Marco Mosca got his Engineering Degree in 1999 at the Faculty of Engineering of Genoa University (Italy) with full marks. Currently is a PhD student with a special interest in Simulation, Transportation and Supply Chain management. He is also currently employed at Tbd Bombardier Transportation. He is authors of many papers on Applied Simulation. Roberto Revetria earned his degree in mechanical engineering at the University of Genoa and completed his master thesis in Genoa Mass Transportation Company developing an automatic system integrating ANN (Artificial Neural Networks) and simulation with an ERP (Enterprise Resource Planning) for supporting purchasing activities. He had consulting experience in modeling applied to environmental management for the new Bosch plant facility TDI Common Rail Technology in construction near Bari. During his service in the Navy as officer, he was involved in the development of WSS&S (Weapon System Simulation & Service) Project. He completed is PhD in Mechanical Engineering in 2001 defending his Doctoral thesis on “Advances in Industrial Plant Management” by applying Artificial iontelligence and Distributed Simulation to several Industrial Cases. Since 1998 is active in Distributed Simulation by moving US DoD HLA (High Level Architecture) Paradigm from Military to Industrial application. In 2000 he succesfully led a research group first demonstrating practical application of HLA in not dedicated network involving a 8 International University Group. He is currently involved, as reseacher, in the DIPTEM of Genoa University, working on advanced modeling projects for Simulation/ERP integration and DSS/maintenance planning applied to industrial case studies (Contracting & Engineering and Retail companies). He is active in developing projects involving simulation with special attention to Distributed Discrete Event and Agent Based Continuous Simulation (SwarmSimulation Agents). He is teaching Modelling & Simulation, VV&A, Distributed Simulation (HLA), Projecty Management in Master Courses Worldwide and he is teaching Industrial Plants Design and Maintenance Management in University of Genoa Masters' Courses. He is member of SCS, IASTED, ACM, ANIMP, AICE, MIMOS and Liophant Simulation Club. He is Associated Professor in Mechanical Engineering and Logistics.
INTERNATIONAL JOURNAL OF MATHEMATICS AND COMPUTERS IN SIMULATION
Issue 2, Volume 3, 2009 62
APPENDIX A – THE SEA SIDE OF THE SYSTEM DYNAMICS MODEL
INTERNATIONAL JOURNAL OF MATHEMATICS AND COMPUTERS IN SIMULATION
Issue 2, Volume 3, 2009 63

APPENDIX B – THE SHORE SIDE OF THE SYSTEM DYNAMICS MODEL
INTERNATIONAL JOURNAL OF MATHEMATICS AND COMPUTERS IN SIMULATION
Issue 2, Volume 3, 2009 64