A synthetic intrabody based selective and generic ... fileβarr1 Fab V 2 Rpp + - + - + - B1_I9...
19
In the format provided by the authors and unedited. A synthetic intrabody based selective and generic inhibitor of GPCR endocytosis Eshan Ghosh, Ashish Srivastava, Mithu Baidya, Punita Kumari, Hemlata Dwivedi, Kumari Nidhi, Ravi Ranjan, Shalini Dogra, Akiko Koide, Prem N. Yadav, Sachdev S. Sidhu, Shohei Koide and Arun K. Shukla © 2017 Macmillan Publishers Limited, part of Springer Nature. All rights reserved. SUPPLEMENTARY INFORMATION DOI: 10.1038/NNANO.2017.188 NATURE NANOTECHNOLOGY | www.nature.com/naturenanotechnology 1
-
Upload
hoanghuong -
Category
Documents
-
view
236 -
download
0
Transcript of A synthetic intrabody based selective and generic ... fileβarr1 Fab V 2 Rpp + - + - + - B1_I9...

In the format provided by the authors and unedited.Supplementary information
A synthetic intrabody based selective and generic inhibitor of GPCR endocytosis
Eshan Ghosh, Ashish Srivastava, Mithu Baidya, Punita Kumari, Hemlata Dwivedi, Kumari Nidhi, Ravi
Ranjan, Shalini Dogra, Akiko Koide, Prem N. Yadav, Sachdev S. Sidhu, Shohei Koide and Arun K. Shukla
© 2017 Macmillan Publishers Limited, part of Springer Nature. All rights reserved.
SUPPLEMENTARY INFORMATIONDOI: 10.1038/NNANO.2017.188
NATURE NANOTECHNOLOGY | www.nature.com/naturenanotechnology 1

GST + - + - GST-ERK2 - + - + Fab-CTL + + - - Fab30 - - + +
βarr1
GST-ERK2 IP: G
S be
ads
Supplementary Figure 1. Potentiation of βarr1-ERK2 interaction by Fab30. Potentiation of βarr1-ERK2 interaction by Fab30 visualized in ELISA based assay (Fig. 1c) was also apparent in coimmunoprecipitation (coIP) experiment. Purified βarr1 and GST-ERK2 were incubated together in presence of Fab-CTL or Fab30 followed by coIP using GS beads. Subsequently, βarr1-ERK2 interaction was visualized by Western blotting. Image presented in the upper panel shows a representative blot from six independent experiments. The lower panel shows densitometry based quantitation (average ± SEM) of six experiments analyzed using unpaired t-test (***P<0.001).
60
80
100
120
140
160
Fab30 - +
***
arr1
-ER
K2 in
tera
ctio
n(%
nor
mal
ized
)
© 2017 Macmillan Publishers Limited, part of Springer Nature. All rights reserved.
NATURE NANOTECHNOLOGY | www.nature.com/naturenanotechnology 2
SUPPLEMENTARY INFORMATIONDOI: 10.1038/NNANO.2017.188

a
V2Rpp - + - + - + - + B1*_K11 B1*_I9 B1*_G7 B1*_D 4
Fab-CTL Fab 30 B1*_O15 B1*_L12
IP: P
rote
in L
bead
s
βarr1
Fab
V2Rpp - + - + - + - +
βarr1
Fab
βarr1 + + + + + + + + GST-ERK2 - + - + - + - + GST + - + - + - + -
Fab_B1*_G7 Fab-CTL
54 kDa
Fab_B1*_L12 Fab_B1*_I9
WB: βarr1 IP: GS beads
βarr 1
GST-ERK2
GST
Ponceau stain IP: GS beads
b
Supplementary Figure 2. Selectivity of Fabs against V2Rpp-bound conformation of βarr1 and their ability to potentiate βarr1-ERK2 interaction. a, A set of Fabs selected against V2Rpp-βarr1-Fab30 complex were tested in a coimmunoprecipitation (coIP) experiment in order to evaluate their specificity for active βarr1 conformation. Purified Fabs were incubated with βarr1 in absence or presence of V2Rpp followed by coIP using protein L beads. Interaction of Fabs with βarr1 was visualized by SimplyBlue staining of the gel. A control Fab (Fab-CTL) that does not interact with βarr1 was used as a negative control. Parts of this image (highlighted in red box) are presented in Fig. 1b (Fab30) and Fig. 2b (Fab 12). b, Similar to ELISA experiment presented in Fig. 2b, coimmunoprecipitation assay also revealed the ability of Fab12 to potentiate βarr1-ERK2 interaction. This coIP experiment was performed essentially in a similar fashion as described earlier in the Supplementary Figure 1. *P<0.05, One-Way ANOVA (average±SEM; n=3).
Fab_C
TL
Fab_B
1*_G
7
Fab_B
1*_I9
Fab_B
1*_L
1250
100
150
200
250
300 *
*
*
arr1
-ER
K2 in
tera
ctio
n(%
nor
mal
ized
)
© 2017 Macmillan Publishers Limited, part of Springer Nature. All rights reserved.
NATURE NANOTECHNOLOGY | www.nature.com/naturenanotechnology 3
SUPPLEMENTARY INFORMATIONDOI: 10.1038/NNANO.2017.188

βarr1
Fab
V2Rpp + - + - + -
Fab 30 B1_L12 B1_I9
IP: P
rote
in L
bea
ds
b
B1_G7 B1_H8 B1_I9 B1_J10 B1_K11 B1_L12 Fab-CTL
IP: P
rote
in L
bea
ds
βarr1
βarr2
a
Fab
Supplementary Figure 3. Selectivity of a set of Fabs against βarr1. a, set of Fabs selected against basal conformation of βarr1 were tested in a coimmunoprecipitation experiment in order to evaluate their specificity for βarr1 over βarr2. Purified Fabs were incubated with equal concentrations of either βarr1 or βarr2 followed by coIP using protein L beads. Interaction of Fabs with βarrs was visualized by SimplyBlue staining of the gel. A control Fab (Fab-CTL) that does not interact with βarr1 was used as a negative control. A part of this image (highlighted in red box) is presented in Fig. 2c. b, βarr1 selective Fabs, Fab9 and Fab12, recognized both, the basal and V2Rpp bound conformation of βarr1 equally well as assessed by coIP experiment carried out essentially in a similar fashion as described in panel a. Fab30, which selectively recognizes V2Rpp bound βarr1 conformation was used as a positive control.
© 2017 Macmillan Publishers Limited, part of Springer Nature. All rights reserved.
NATURE NANOTECHNOLOGY | www.nature.com/naturenanotechnology 4
SUPPLEMENTARY INFORMATIONDOI: 10.1038/NNANO.2017.188

a
b c
d e
βarr1
Fab
βarr2
B2_B5 B2_A3 Fab-CTL
IP: P
rote
in L
bea
ds
Supplementary Figure 4. Interaction and specificity of a set of Fabs selected against βarr2. a, A set of Fabs after three rounds of library sorting against βarr2 were tested for their isoform selectivity in the ELISA assay. Purified βarr1 and βarr2 were immobilized in 96 well MaxiSorp plates followed by incubation with purified Fabs. Subsequently, the interaction of Fabs with βarrs was visualized using HRP-coupled protein L. *P<0.05; **P<0.01; ***P<0.001, One-Way ANOVA (average ± SEM; n=5; comparison between “none” and βarr2). b, Selectivity of Fab A3, c, Fab C6 and d, Fab D7 for βarr2 over βarr1 measured by dose response ELISA. Varying concentrations of βarrs were immobilized on MaxiSorp ELISA plates followed by incubation with purified Fabs. After rigorous washing steps, interaction of Fabs with βarrs was visualized using HRP-coupled protein-L. Data in panel b,c and d represents average ± SEM of three independent experiments each carried out in duplicate. e, Selectivity of FabA3 and FabB5 for βarr2 over βarr1 measured in HEK-293 cell lysate expressing either βarr1 or βarr2 by coimmunoprecipitation. Purified Fabs were incubated with cell lysate followed by coIP with protein L beads and the interaction of βarrs with Fabs were visualized by Western blotting.
*** ***
**
**
* *
200 400 600 800 1000-20
0
20
40
60
80
100
120
arr1
arr2
[arr1/2] (nM)
Fab_
B2_A
3- a
rr in
tera
ctio
n(%
nor
mal
ized
)
200 400 600 800 1000-20
0
20
40
60
80
100
120
arr1
arr2
[arr1/2] (nM)
Fab_
B2_C
6- a
rr in
tera
ctio
n(%
nor
mal
ized
)
200 400 600 800 1000-20
0
20
40
60
80
100
120
arr1
arr2
[arr1/2] nM
Fab_
B2_D
7- a
rr in
tera
ctio
n(%
nor
mal
ized
)
© 2017 Macmillan Publishers Limited, part of Springer Nature. All rights reserved.
NATURE NANOTECHNOLOGY | www.nature.com/naturenanotechnology 5
SUPPLEMENTARY INFORMATIONDOI: 10.1038/NNANO.2017.188

Supplementary Figure 5. Effect of ScFv5 on βarr2-β2 adaptin/JNK3 interaction. Purified clathrin (1-363), β2 adaptin (592-951) and JNK3 were immobilized on MaxiSorp ELISA plates. Subsequently, the wells were incubated with V2Rpp-bound βarr2 (biotinylated) in presence of varying amounts of ScFv5. After extensive washing steps, βarr2-clathrin/β2 adaptin/JNK3 interactions were detected using HRP-coupled streptavidin. Data represent average±SEM of four independent experiments, each performed in duplicate. Data are normalized with respect to no ScFv5 condition as reference for each interaction (i.e. 100 **P<0.01; Two-Way ANOVA; comparison between clathrin and β2 adaptin or clathrin and JNK3.
-10 -9 -8 -7 -6 -50
20
40
60
80
100
120 arr2-clathrinarr2-2 adaptin
Log [ScFv5] M
arr
2-cl
athr
in/
2 ad
aptin
inte
ract
ion
(% n
orm
aliz
ed)
-10 -9 -8 -7 -6 -50
20
40
60
80
100arr2-JNK3
arr2-clathrin
Log [ScFv5] M
arr2
-cla
thrin
/JN
K3 in
tera
ctio
n(%
nor
mal
ized
)
© 2017 Macmillan Publishers Limited, part of Springer Nature. All rights reserved.
NATURE NANOTECHNOLOGY | www.nature.com/naturenanotechnology 6
SUPPLEMENTARY INFORMATIONDOI: 10.1038/NNANO.2017.188

- ScFv ScFv3 ScFv5 ScFv-CTL IP
: Pro
tein
L b
eads
βarr1
βarr2
ScFv
a
Supplementary Figure 6. ScFv5 selectively recognizes βarr2 and does not interfere with V2R-βarr2 interaction. a, ScFv5 maintains the selectivity for βarr2 as measured by coimmunoprecipitation assay. Purified ScFv5 was incubated with equal concentrations of either purified βarr1 or βarr2 followed by coIP using Protein L beads. The interaction of ScFv5 with βarrs was visualized by Simply Blue staining. A control ScFv (ScFv-CTL) that does not bind βarr2 was used a negative control. ScFv3 represents the single chain version of Fab_B2_A3 (described in Supplementary Figure 4). A part of this image highlighted in a red box is presented in Fig. 3a. b, Uniform cytoplasmic distribution of ScFv5-YFP as visualized by confocal microscopy. HEK-293 cells expressing βarr2-mCherry and ScFv5-YFP were imaged using live cell confocal microscopy set-up. The scale bar is 10μm.
b
© 2017 Macmillan Publishers Limited, part of Springer Nature. All rights reserved.
NATURE NANOTECHNOLOGY | www.nature.com/naturenanotechnology 7
SUPPLEMENTARY INFORMATIONDOI: 10.1038/NNANO.2017.188

Supplementary Figure 7. Effect of V2Rpp on βarr2-ScFv5 interaction. Purified ScFvs (CTL or 5) were incubated with βarr2 in presence or absence of V2Rpp. After 1h incubation at room-temperature, pre-equilibrated protein L beads were added to the reaction mix and allowed to tumble for 1h. Afterwards, the beads were washed extensively, bound proteins were eluted using SDS gel loading buffer, and the interaction was visualized by Western blotting. A representative image is shown in the upper panel, and densitometry based quantification of four independent experiments are presented in the lower panel. Data were normalized with respect to βarr2-ScFv5 interaction in the absence of V2Rpp (treated as 100%) (**P<0.01, One-way ANOVA; comparison between -/+ V2Rpp).
020406080
100120140160
V2Rpp - + - +ScFv-CTL + + - - ScFv5 - - + +
**
Inte
ract
ion
of a
rr2 w
ithSc
Fv5
(% n
orm
aliz
ed)
WB: βarr2 IP: Prot. L
V2Rpp - + - + ScFv-CTL + + - - ScFv5 - - + +
Ponceau S staining
βarr2
ScFv
© 2017 Macmillan Publishers Limited, part of Springer Nature. All rights reserved.
NATURE NANOTECHNOLOGY | www.nature.com/naturenanotechnology 8
SUPPLEMENTARY INFORMATIONDOI: 10.1038/NNANO.2017.188

Supplementary Figure 8. ScFv5 as intrabody inhibits agonist induced V2R internalization. HEK-293 cells expressing V2R, βarr2-mcherry and ScFv5-YFP were stimulated with AVP (100nM) and imaged for 10 minutes by confocal microscopy. Colocalization of βarr2-mCherry and ScFv5-YFP at the membrane is observed within 2 minutes of agonist stimulation as expected. However, even after prolonged agonist exposure up to 10 minutes, they both remain at the membrane suggesting the lack of V2R internalization in ScFv5 expressing cells. Scale bar is 10μm.
150 sec 180 sec 210 sec 240 sec
300 sec 330 sec 360 sec 390 sec
420 sec 450 sec 480 sec 510 sec
540 sec 570 sec 600 sec 630 sec
120 sec ScFv5 βarr2
© 2017 Macmillan Publishers Limited, part of Springer Nature. All rights reserved.
NATURE NANOTECHNOLOGY | www.nature.com/naturenanotechnology 9
SUPPLEMENTARY INFORMATIONDOI: 10.1038/NNANO.2017.188
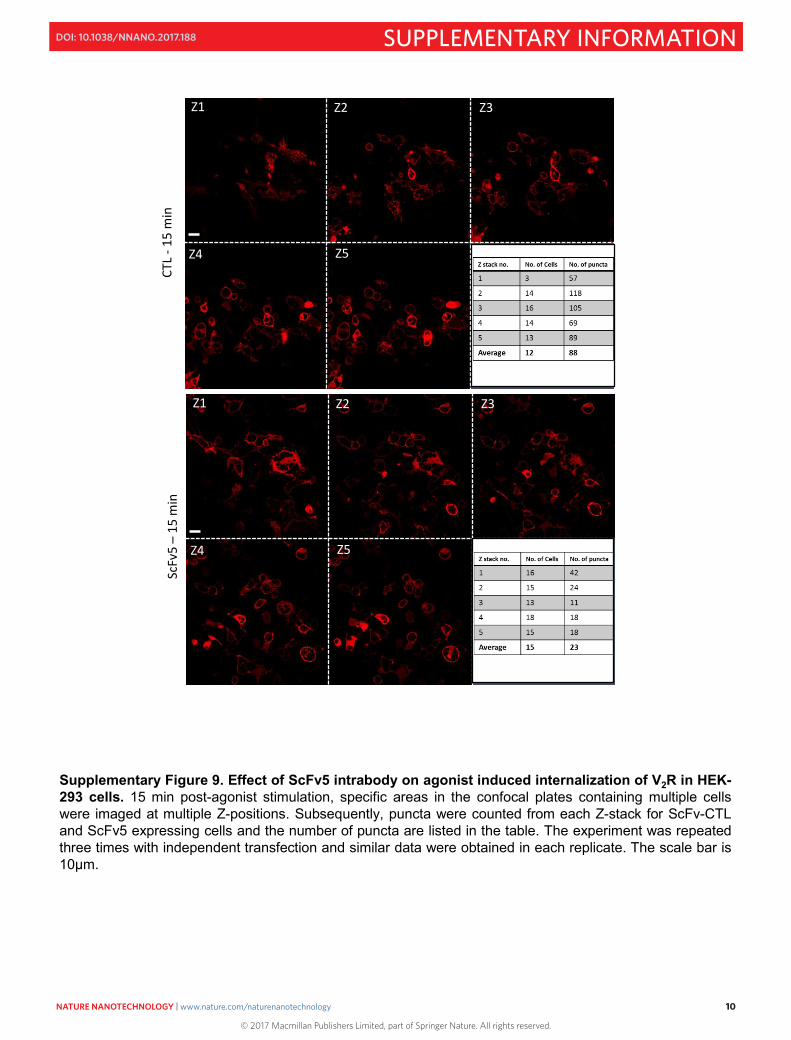
Supplementary Figure 9. Effect of ScFv5 intrabody on agonist induced internalization of V2R in HEK-293 cells. 15 min post-agonist stimulation, specific areas in the confocal plates containing multiple cells were imaged at multiple Z-positions. Subsequently, puncta were counted from each Z-stack for ScFv-CTL and ScFv5 expressing cells and the number of puncta are listed in the table. The experiment was repeated three times with independent transfection and similar data were obtained in each replicate. The scale bar is 10μm.
CTL
- 15
min
Z1 Z2 Z3
Z4 Z5
ScFv
5 –
15 m
in
Z1 Z2 Z3
Z4 Z5
© 2017 Macmillan Publishers Limited, part of Springer Nature. All rights reserved.
NATURE NANOTECHNOLOGY | www.nature.com/naturenanotechnology 10
SUPPLEMENTARY INFORMATIONDOI: 10.1038/NNANO.2017.188

Supplementary Figure 10. Effect of ScFv5 intrabody on agonist induced internalization of V2R in HEK-293 cells. 30 min post-agonist stimulation, specific areas in the confocal plates containing multiple cells were imaged at multiple Z-positions. Subsequently, puncta were counted from each Z-stack for ScFv-CTL and ScFv5 expressing cells and the number of puncta are listed in the table. The experiment was repeated three times with independent transfection and similar data were obtained in each replicate. The scale bar is 10μm.
CTL
- 30
min
Z1 Z2 Z3
Z4 Z5
ScFv
5 –
30 m
in
Z1 Z2 Z3
Z4 Z5
© 2017 Macmillan Publishers Limited, part of Springer Nature. All rights reserved.
NATURE NANOTECHNOLOGY | www.nature.com/naturenanotechnology 11
SUPPLEMENTARY INFORMATIONDOI: 10.1038/NNANO.2017.188

Supplementary Figure 11. Effect of ScFv5 intrabody on agonist induced internalization of V2R in HEK-293 cells. 45 min post-agonist stimulation, specific areas in the confocal plates containing multiple cells were imaged at multiple Z-positions. Subsequently, puncta were counted from each Z-stack for ScFv-CTL and ScFv5 expressing cells and the number of puncta are listed in the table. The experiment was repeated three times with independent transfection and similar data were obtained in each replicate. The scale bar is 10μm.
CTL-
45
min
Z1 Z2 Z3
Z4 Z5
ScFv
5 –
45 m
in
Z1 Z2 Z3
Z4 Z5
© 2017 Macmillan Publishers Limited, part of Springer Nature. All rights reserved.
NATURE NANOTECHNOLOGY | www.nature.com/naturenanotechnology 12
SUPPLEMENTARY INFORMATIONDOI: 10.1038/NNANO.2017.188

0
20
40
60
80
100
120
Agonist (min) 15 30 45
Tota
l num
ber o
f pun
cta
(for a
ppro
ximat
ely
100
cells
)(%
nor
mal
ized
)
0
20
40
60
80
100
120CTLScFv5
**
Num
ber o
f pun
cta
per c
ell
(% n
orm
aliz
ed)
Supplementary Figure 12. Quantitation of ScFv5 mediated inhibition of V2R endocytosis. The left panel shows the number of puncta counted for approximately 100 cells across the entire cell volume (i.e. five different Z-stacks). The values at each time-point are individually normalized with reference to the ScFv-CTL (100%). The right panel shows the combined number of puncta counted at three different time points across the entire cell volume and normalized with reference to the ScFv-CTL (100%) (**P<0.01; unpaired t-test).
© 2017 Macmillan Publishers Limited, part of Springer Nature. All rights reserved.
NATURE NANOTECHNOLOGY | www.nature.com/naturenanotechnology 13
SUPPLEMENTARY INFORMATIONDOI: 10.1038/NNANO.2017.188

Supplementary Figure 13. ScFv5 intrabody does not colocalize with internalized βarr2. A population of V2R in HEK-293 cells expressing βarr2-mcherry and ScFv5-YFP escapes the endocytosis blockade by ScFv5 and gets internalized as evident by formation of endocytotic vesicles (shown in boxes). Such vesicles however are not stained by ScFv5-YFP. Scale bar is 10μm and DAPI is used for nuclear staining. The lower panel shows a line scan analysis of a selected region of the cells (indicated by yellow line). For this, a line was drawn across the image, where βarr2 puncta (endosomal vesicles) were visible. Fluorescence intensity was calculated along this line from both channels (βarr2-mCherry and ScFv5-YFP) using the Plot Profile function in the Image J software. Pixel intensity values were then plotted using GraphPad Prism.
1 2
1
2
1 2
1
2
βarr2 ScFv5 Merged Merged + DAPI
0
20
40
60
80
100 arr2-mCherryScFv5-YFP
Fluo
resc
ence
inte
nsity
(arb
itrar
y un
its)
© 2017 Macmillan Publishers Limited, part of Springer Nature. All rights reserved.
NATURE NANOTECHNOLOGY | www.nature.com/naturenanotechnology 14
SUPPLEMENTARY INFORMATIONDOI: 10.1038/NNANO.2017.188

Supplementary Figure 14. ScFv5 does not influence agonist induced ERK phosphorylation for a broad set of GPCRs. Densitometry based quantitation of agonist-induced ERK activation data presented in Fig. 5a-f. Data represent average ± SEM of four (β2AR), five (M2R), five (D1R), three (D2R), three (D3R) and two (D4R) independent experiments.
0 5 10 15 20 25 300
20
40
60
80
100
120
140CTLScFv5
Agonist induced ERK phosphorylationM2R
Time (min)Ph
osph
o-ER
K/To
tal-E
RK
(% n
orm
aliz
ed)
0 5 10 15 20 25 300
20
40
60
80
100
120
140CTLScFv5
Agonist induced ERK phosphorylation2AR
Time (min)
Phos
pho-
ERK/
Tota
l-ER
K(%
nor
mal
ized
)
0 5 10 15 20 25 300
20406080
100120140160180
CTLScFv5
Agonist induced ERK phosphorylationD2R
Time (min)
Phos
pho-
ERK/
Tota
l-ER
K(%
nor
mal
ized
)
0 5 10 15 20 25 300
20
40
60
80
100
120
140CTLScFv5
Agonist induced ERK phosphorylationD3R
Time (min)
Phos
pho-
ERK/
Tota
l-ER
K(%
nor
mal
ized
)
0 5 10 15 20 25 300
20
40
60
80
100
120
140CTLScFv5
Agonist induced ERK phosphorylationD4R
Time (min)
Phos
pho-
ERK/
Tota
l-ER
K(%
nor
mal
ized
)
0 5 10 15 20 25 300
20
40
60
80
100
120
140CTLScFv5
Agonist induced ERK phosphorylationD1R
Time (min)
Phos
pho-
ERK/
Tota
l-ER
K(%
nor
mal
ized
)
ns
ns
ns
ns
ns ns
ns
ns
ns
ns
ns ns
© 2017 Macmillan Publishers Limited, part of Springer Nature. All rights reserved.
NATURE NANOTECHNOLOGY | www.nature.com/naturenanotechnology 15
SUPPLEMENTARY INFORMATIONDOI: 10.1038/NNANO.2017.188

0 10 20 30 40 50 6070
80
90
100 CTLScFv5
ns ns
Time (min)
M1R
inte
rnal
izat
ion
(% n
orm
aliz
ed)
0 10 20 30 40 50 6070
80
90
100 CTLScFv5
ns ns
Time (min)
M4R
inte
rnal
izat
ion
(%no
rmal
ized
)
Supplementary Figure 15. ScFv5 does not inhibit the internalization of M1R and M4R. Two different subtypes of the human Muscarinic receptor namely M1R and M4R were expressed in HEK-293 cells with or without ScFv5 intrabody and carbachol induced receptor internalization was measured by whole cell surface ELISA assay. Data represent average ± SEM of five independent experiments each carried out in duplicate and normalized with the signal at 0 min of agonist stimulation (treated with 100%).
© 2017 Macmillan Publishers Limited, part of Springer Nature. All rights reserved.
NATURE NANOTECHNOLOGY | www.nature.com/naturenanotechnology 16
SUPPLEMENTARY INFORMATIONDOI: 10.1038/NNANO.2017.188

Supplementary Figure 16. Effect of ScFv5 on the human transferrin receptor internalization as assessed by FACS. HEK-293 cells expressing the recombinant human transferrin receptor (hTfr1) 1 were incubated with DyLight-488-conjugated holo-transferrin (100μg/ml) for 30 min on ice (for ligand binding). Subsequently, the cells were warmed to 37°C and incubated for additional 30 min (to promote ligand uptake and receptor internalization). Subsequently, the cells were gently acid-washed (to remove the remaining surface-bound, non-internalized ligand) followed by FACS analysis. Data points represent average ± SEM of three independent experiments, each carried out with approximately 5000 cells. Data in the lower panel are normalized with respect to ScFv-CTL (treated as 100%). ns, non-significant; unpaired t-test.
0
20
40
60
80
100
120
CTLScFv5
ns
Mea
n Fl
uros
cent
Inte
nsity
(% n
orm
aliz
ed)
0
20
40
60
80
100
120
CTLScFv5
ns
Tran
sfer
rin p
ositiv
e ce
lls(%
nor
mal
ized
)
ScFv-CTL ScFv5
DyLight-488 DyLight-488
© 2017 Macmillan Publishers Limited, part of Springer Nature. All rights reserved.
NATURE NANOTECHNOLOGY | www.nature.com/naturenanotechnology 17
SUPPLEMENTARY INFORMATIONDOI: 10.1038/NNANO.2017.188

Supplementary Figure 17. Effect of ScFv5 on transferrin receptor internalization as assessed by confocal microscopy. HEK-293 cells expressing the recombinant human transferrin receptor 1 (hTfr1) were incubated with DyLight-488-conjugated holo-transferrin (100μg/ml) for 30 min on ice (for ligand binding). Subsequently, the cells were warmed to 37°C and incubated for additional 30 min (to promote ligand uptake and receptor internalization). Subsequently, the cells were gently acid-washed (to remove the remaining surface-bound, non-internalized ligand) followed by visualization using confocal microscopy. Left panel shows a representative image from two independent experiments, and in every experiment, several fields with multiple cells were imaged at multiple Z-sections. The scale bar is 10μm. The lower panel shows quantitation of internalized transferrin (as a readout of hTfr1 internalization) by counting punctate structures (either manually or using Image J software). More than 100 cells from different fields and separate experiments were counted for each sample, and data are normalized with respect to ScFv-CTL (treated as 100%). ns, non-significant; unpaired t-test.
0
20
40
60
80
100
120
ScFv-CTLScFv5
Tran
sfer
rin u
ptak
e(%
nor
mal
ized
)
ns
ScFv
5 CT
L
0 min 30 min
© 2017 Macmillan Publishers Limited, part of Springer Nature. All rights reserved.
NATURE NANOTECHNOLOGY | www.nature.com/naturenanotechnology 18
SUPPLEMENTARY INFORMATIONDOI: 10.1038/NNANO.2017.188

Fabs Selection target Binding preference
Referred to as
Fab_B1*_D4 βarr1 +V2Rpp +Fab30
V2Rpp+βarr1
Fab_B1*_G7 V2Rpp+βarr1
Fab_B1*_I9 V2Rpp+βarr1
Fab_B1*_K11 ND
Fab_B1*_L12 V2Rpp+βarr1 Fab12 in Fig. 2B
Fab_B1*_O15 ND
Supplementary Table S1. Details of different Fabs generated and characterized in this study. βarr1 – βarrestin1; βarr2 – βarrestin2; ND = not detected.
a
b
c
Fabs Selection target Preference Referred to as
Fab_B1_G7 βarr1 ND
Fab_B1_H8 ND
Fab_B1_I9 βarr1>>>βarr2 Fab9 in Fig. 2C
Fab_B1_J10 ND
Fab_B1_K11 ND
Fab_B1_L12 βarr1>>>βarr2
Fabs Selection target Preference Referred to as
Fab_B2_A3 βarr2 βarr2>>>βarr1
Fab_B2_B5 βarr2>>>βarr1 Fab 5
Fab_B2_C6 βarr2>>>βarr1
Fab_B2_D7 βarr2>>>βarr1
Fab_B2_E7 βarr2>>βarr1
Fab_B2_F8 βarr2>>βarr1
© 2017 Macmillan Publishers Limited, part of Springer Nature. All rights reserved.
NATURE NANOTECHNOLOGY | www.nature.com/naturenanotechnology 19
SUPPLEMENTARY INFORMATIONDOI: 10.1038/NNANO.2017.188

![Wireless Intrabody Communication System for Neurals-space.snu.ac.kr/bitstream/10371/9064/1/[2006_12].pdf · 2019-04-29 · Wireless Intrabody Communication System for Neural Prosthesis](https://static.fdocuments.in/doc/165x107/5e8f4a74b4c94e0aca037d7d/wireless-intrabody-communication-system-for-neurals-spacesnuackrbitstream1037190641200612pdf.jpg)