A Synthetic Community System for Probing Microbial Interactions Driven by...
14
A Synthetic Community System for Probing Microbial Interactions Driven by Exometabolites John L. Chodkowski, a Ashley Shade a,b Department of Microbiology and Molecular Genetics, Michigan State University, East Lansing, Michigan, USA a ; Department of Plant, Soil and Microbial Sciences, Program in Ecology, Evolutionary Biology, and Behavior, The DOE Great Lakes Bioenergy Center, and The Plant Resilience Institute, Michigan State University, East Lansing, Michigan, USA b ABSTRACT Though most microorganisms live within a community, we have mod- est knowledge about microbial interactions and their implications for community properties and ecosystem functions. To advance understanding of microbial interac- tions, we describe a straightforward synthetic community system that can be used to interrogate exometabolite interactions among microorganisms. The filter plate system (also known as the Transwell system) physically separates microbial popula- tions, but allows for chemical interactions via a shared medium reservoir. Exome- tabolites, including small molecules, extracellular enzymes, and antibiotics, are as- sayed from the reservoir using sensitive mass spectrometry. Community member outcomes, such as growth, productivity, and gene regulation, can be determined us- ing flow cytometry, biomass measurements, and transcript analyses, respectively. The synthetic community design allows for determination of the consequences of microbiome diversity for emergent community properties and for functional changes over time or after perturbation. Because it is versatile, scalable, and accessible, this synthetic community system has the potential to practically advance knowledge of microbial interactions that occur within both natural and artificial communities. IMPORTANCE Understanding microbial interactions is a fundamental objective in microbiology and ecology. The synthetic community system described here can set into motion a range of research to investigate how the diversity of a microbiome and interactions among its members impact its function, where function can be measured as exometabolites. The system allows for community exometabolite profil- ing to be coupled with genome mining, transcript analysis, and measurements of member productivity and population size. It can also facilitate discovery of natural products that are only produced within microbial consortia. Thus, this synthetic community system has utility to address fundamental questions about a diversity of possible microbial interactions that occur in both natural and engineered ecosys- tems. KEYWORDS Burkholderia, Chromobacterium, Pseudomonas syringae, community ecology, microbial metabolomics, model microbial systems, synthetic communities T here is modest knowledge about how microorganisms interact with each other in their native habitats and whether these microbial interactions have implications for emergent community or ecosystem properties. Microorganisms can communicate chemically, and these chemical interactions underlay a range of relationships from commensalism to antagonism (1–3). Because of the specificity of many microbe- microbe relationships, it is thought that most microorganisms produce certain chemical products only within a particular consortium (1, 4–7). However, understanding of relatively well-described microbial interactions often is incomplete. For example, sen- Received 29 September 2017 Accepted 24 October 2017 Published 14 November 2017 Citation Chodkowski JL, Shade A. 2017. A synthetic community system for probing microbial interactions driven by exometabolites. mSystems 2:e00129-17. https://doi.org/10.1128/mSystems.00129-17. Editor Pieter C. Dorrestein, University of California, San Diego Copyright © 2017 Chodkowski and Shade. This is an open-access article distributed under the terms of the Creative Commons Attribution 4.0 International license. Address correspondence to Ashley Shade, [email protected]. Introducing a new synthetic community system for interrogating exometabolite interactions among microbes METHODS AND PROTOCOLS Novel Systems Biology Techniques crossm November/December 2017 Volume 2 Issue 6 e00129-17 msystems.asm.org 1 on June 20, 2018 by guest http://msystems.asm.org/ Downloaded from
Transcript of A Synthetic Community System for Probing Microbial Interactions Driven by...
A Synthetic Community System forProbing Microbial Interactions Driven byExometabolites
John L. Chodkowski,a Ashley Shadea,b
Department of Microbiology and Molecular Genetics, Michigan State University, East Lansing, Michigan, USAa;Department of Plant, Soil and Microbial Sciences, Program in Ecology, Evolutionary Biology, and Behavior, TheDOE Great Lakes Bioenergy Center, and The Plant Resilience Institute, Michigan State University, East Lansing,Michigan, USAb
ABSTRACT Though most microorganisms live within a community, we have mod-est knowledge about microbial interactions and their implications for communityproperties and ecosystem functions. To advance understanding of microbial interac-tions, we describe a straightforward synthetic community system that can be usedto interrogate exometabolite interactions among microorganisms. The filter platesystem (also known as the Transwell system) physically separates microbial popula-tions, but allows for chemical interactions via a shared medium reservoir. Exome-tabolites, including small molecules, extracellular enzymes, and antibiotics, are as-sayed from the reservoir using sensitive mass spectrometry. Community memberoutcomes, such as growth, productivity, and gene regulation, can be determined us-ing flow cytometry, biomass measurements, and transcript analyses, respectively.The synthetic community design allows for determination of the consequences ofmicrobiome diversity for emergent community properties and for functional changesover time or after perturbation. Because it is versatile, scalable, and accessible, thissynthetic community system has the potential to practically advance knowledge ofmicrobial interactions that occur within both natural and artificial communities.
IMPORTANCE Understanding microbial interactions is a fundamental objective inmicrobiology and ecology. The synthetic community system described here can setinto motion a range of research to investigate how the diversity of a microbiomeand interactions among its members impact its function, where function can bemeasured as exometabolites. The system allows for community exometabolite profil-ing to be coupled with genome mining, transcript analysis, and measurements ofmember productivity and population size. It can also facilitate discovery of naturalproducts that are only produced within microbial consortia. Thus, this syntheticcommunity system has utility to address fundamental questions about a diversity ofpossible microbial interactions that occur in both natural and engineered ecosys-tems.
KEYWORDS Burkholderia, Chromobacterium, Pseudomonas syringae, communityecology, microbial metabolomics, model microbial systems, synthetic communities
There is modest knowledge about how microorganisms interact with each other intheir native habitats and whether these microbial interactions have implications for
emergent community or ecosystem properties. Microorganisms can communicatechemically, and these chemical interactions underlay a range of relationships fromcommensalism to antagonism (1–3). Because of the specificity of many microbe-microbe relationships, it is thought that most microorganisms produce certain chemicalproducts only within a particular consortium (1, 4–7). However, understanding ofrelatively well-described microbial interactions often is incomplete. For example, sen-
Received 29 September 2017 Accepted 24October 2017 Published 14 November 2017
Citation Chodkowski JL, Shade A. 2017. Asynthetic community system for probingmicrobial interactions driven byexometabolites. mSystems 2:e00129-17.https://doi.org/10.1128/mSystems.00129-17.
Editor Pieter C. Dorrestein, University ofCalifornia, San Diego
Copyright © 2017 Chodkowski and Shade.This is an open-access article distributed underthe terms of the Creative Commons Attribution4.0 International license.
Address correspondence to Ashley Shade,[email protected].
Introducing a new synthetic communitysystem for interrogating exometaboliteinteractions among microbes
METHODS AND PROTOCOLSNovel Systems Biology Techniques
crossm
November/December 2017 Volume 2 Issue 6 e00129-17 msystems.asm.org 1
on June 20, 2018 by guesthttp://m
systems.asm
.org/D
ownloaded from
sitive mass spectrometry was employed to discover new components of an interactionbetween Bacillus subtilis and Streptomyces coelicolor (7), which suggested that knowl-edge of this interaction was limited despite having been studied previously. Investiga-tions of microbial exometabolite production have been predominantly focused on theanalysis of a single taxon or pairs (8–10) of microbial taxa rather than on multimemberprofiling (11). However, the collective abilities of microbiomes to produce and exploitextracellular enzymes have been hypothesized to be key in discriminating situations inwhich microbial community structure has implications for ecosystem processes likecarbon and nitrogen cycling (12, 13). These studies and others suggest that mostmicrobial interactions remain obscure and that improved understanding of some ofthese interactions likely will provide important insights into microbial communityfunctions.
Synthetic microbial systems recently have garnered reinvigorated interest becauseof their potential to address fundamental unknowns in microbial ecology, engineering,and systems and synthetic biology (4, 7, 14). Synthetic microbial systems are a keyapproach used in microbial ecology to understand how microbial interactions lead toemergent properties of communities, such as resistance and resilience (7). For example,synthetic communities have been assembled from marine waters onto artificial parti-cles to observe community primary succession and the resulting functional changes inmodel heterotrophic particles (15) and phototrophic biofilms (16), spatially constrainedsynthetic communities have been used to investigate reciprocal syntrophy (17), andcomputationally modeled synthetic communities have been applied to predict cocul-ture growth given the metabolic needs of the members (18). Other recent work useda combination of metabolic flux analysis and multimember coculture to determine thatthe net outcome of complex interactions between an antagonist and a syntroph wasnot necessarily the sum of all expected pairwise outcomes, especially given particularspatial arrangements of the members (19). Other synthetic microbial systems areengineered to control and manipulate genetic circuitry toward required functions (20).These studies and others demonstrate that synthetic microbial communities can beapplied in diverse and creative ways to provide insights into the dynamic biological andecological interactions of microbiomes (21, 22), with the anticipation that these insightsthen can be applied to manage these communities toward desired outcomes.
We have developed a simple synthetic community system to interrogate exome-tabolite interactions among microbial community members. This synthetic communitysystem permits direct investigation of chemical interactions among microorganisms viasecondary metabolites, signaling molecules, and other exometabolites and allows forobservation of behaviors that only occur when those microorganisms exist as part of aparticular consortium. This system combines concepts and tools from systems biology,microbiology, biochemistry, genomics, and ecology and can provide both top-downand bottom-up approaches to investigate key questions in synthetic microbial ecology(7). Thus, it can advance understanding of microbial interactions within diverse naturaland artificial microbiomes. It can also facilitate discovery of novel microbial productsthat are made given certain community memberships.
RESULTSDescription of the synthetic community experimental system. The apparatus of
the experimental system is a sterile microtiter plate. In the plate, each well has a0.22-�m-pore filter bottom and the plate fits into a shared medium reservoir. The poresize of the filters physically separates each member from its neighbors but permitsresource and metabolite sharing through the reservoir. This allows for observation ofoutcomes of chemical interactions between members. It is ready fabricated andcommonly used for eukaryotic tissue culture. Any comparable product could be usedfor the synthetic community; we have used plates from Millipore (Darmstadt, Germany).Isolates from the habitat of interest are arrayed randomly into the plate, with a singlemember occupying each well at a known initial density or population size. The totalnumber of wells occupied by an isolate can be used to calculate its proportional
Chodkowski and Shade
November/December 2017 Volume 2 Issue 6 e00129-17 msystems.asm.org 2
on June 20, 2018 by guesthttp://m
systems.asm
.org/D
ownloaded from
contribution to the total community. The plate, with its combination and arrangementof isolates, represents the level of the experimental unit and is replicated. The plates areincubated with gentle shaking to homogenize member access to media and exome-tabolites and to omit spatial effects (19). Because the filter bottom of one well isremoved and used for transfer of media to the reservoir, as many as 95 uniquemembers can be included in one consortium.
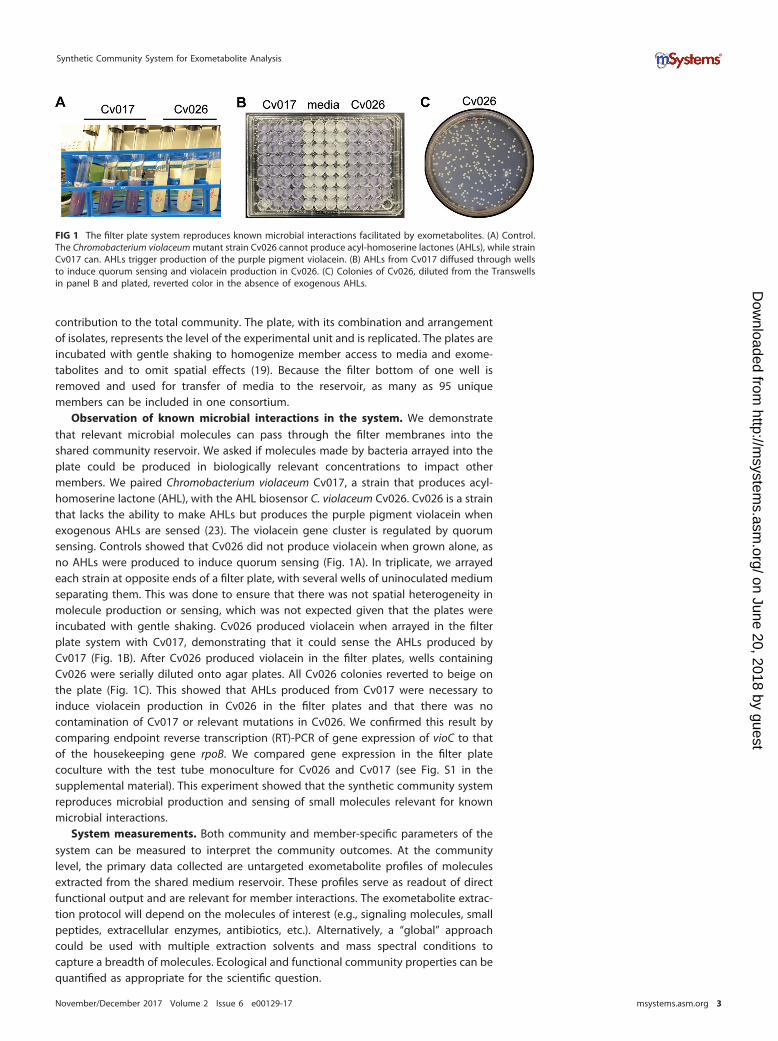
Observation of known microbial interactions in the system. We demonstratethat relevant microbial molecules can pass through the filter membranes into theshared community reservoir. We asked if molecules made by bacteria arrayed into theplate could be produced in biologically relevant concentrations to impact othermembers. We paired Chromobacterium violaceum Cv017, a strain that produces acyl-homoserine lactone (AHL), with the AHL biosensor C. violaceum Cv026. Cv026 is a strainthat lacks the ability to make AHLs but produces the purple pigment violacein whenexogenous AHLs are sensed (23). The violacein gene cluster is regulated by quorumsensing. Controls showed that Cv026 did not produce violacein when grown alone, asno AHLs were produced to induce quorum sensing (Fig. 1A). In triplicate, we arrayedeach strain at opposite ends of a filter plate, with several wells of uninoculated mediumseparating them. This was done to ensure that there was not spatial heterogeneity inmolecule production or sensing, which was not expected given that the plates wereincubated with gentle shaking. Cv026 produced violacein when arrayed in the filterplate system with Cv017, demonstrating that it could sense the AHLs produced byCv017 (Fig. 1B). After Cv026 produced violacein in the filter plates, wells containingCv026 were serially diluted onto agar plates. All Cv026 colonies reverted to beige onthe plate (Fig. 1C). This showed that AHLs produced from Cv017 were necessary toinduce violacein production in Cv026 in the filter plates and that there was nocontamination of Cv017 or relevant mutations in Cv026. We confirmed this result bycomparing endpoint reverse transcription (RT)-PCR of gene expression of vioC to thatof the housekeeping gene rpoB. We compared gene expression in the filter platecoculture with the test tube monoculture for Cv026 and Cv017 (see Fig. S1 in thesupplemental material). This experiment showed that the synthetic community systemreproduces microbial production and sensing of small molecules relevant for knownmicrobial interactions.
System measurements. Both community and member-specific parameters of thesystem can be measured to interpret the community outcomes. At the communitylevel, the primary data collected are untargeted exometabolite profiles of moleculesextracted from the shared medium reservoir. These profiles serve as readout of directfunctional output and are relevant for member interactions. The exometabolite extrac-tion protocol will depend on the molecules of interest (e.g., signaling molecules, smallpeptides, extracellular enzymes, antibiotics, etc.). Alternatively, a “global” approachcould be used with multiple extraction solvents and mass spectral conditions tocapture a breadth of molecules. Ecological and functional community properties can bequantified as appropriate for the scientific question.
FIG 1 The filter plate system reproduces known microbial interactions facilitated by exometabolites. (A) Control.The Chromobacterium violaceum mutant strain Cv026 cannot produce acyl-homoserine lactones (AHLs), while strainCv017 can. AHLs trigger production of the purple pigment violacein. (B) AHLs from Cv017 diffused through wellsto induce quorum sensing and violacein production in Cv026. (C) Colonies of Cv026, diluted from the Transwellsin panel B and plated, reverted color in the absence of exogenous AHLs.
Synthetic Community System for Exometabolite Analysis
November/December 2017 Volume 2 Issue 6 e00129-17 msystems.asm.org 3
on June 20, 2018 by guesthttp://m
systems.asm
.org/D
ownloaded from
Member-specific data can also be collected from the synthetic system. As a proxy formember success in the system, growth and viability can be determined using eitherlive/dead staining with flow cytometry or dilution to extinction of plated well contents.As a measurement of member production, biomass can be assessed. At the end of theexperiment, planktonic cells can be vacuumed onto the filters, and then the collectionof filters for each member can be excised, dried, and weighed with a microbalance.Alternatively, total protein accumulation could be assayed per well. Growth andbiomass are quantified relative to control conditions within the experimental design. Tocouple regulation with functional output, member transcript sequencing can be per-formed to explore linkages between gene regulation and exometabolite production.Transcript data also can inform the upregulation of cryptic pathways or help to identifyexometabolites from the untargeted analysis. Biomass for each member can be re-moved from wells by pipetting and then combined and flash-frozen for RNA extraction.Optimally, member genome sequences would be available to be used as references fortranscript assembly and analysis.
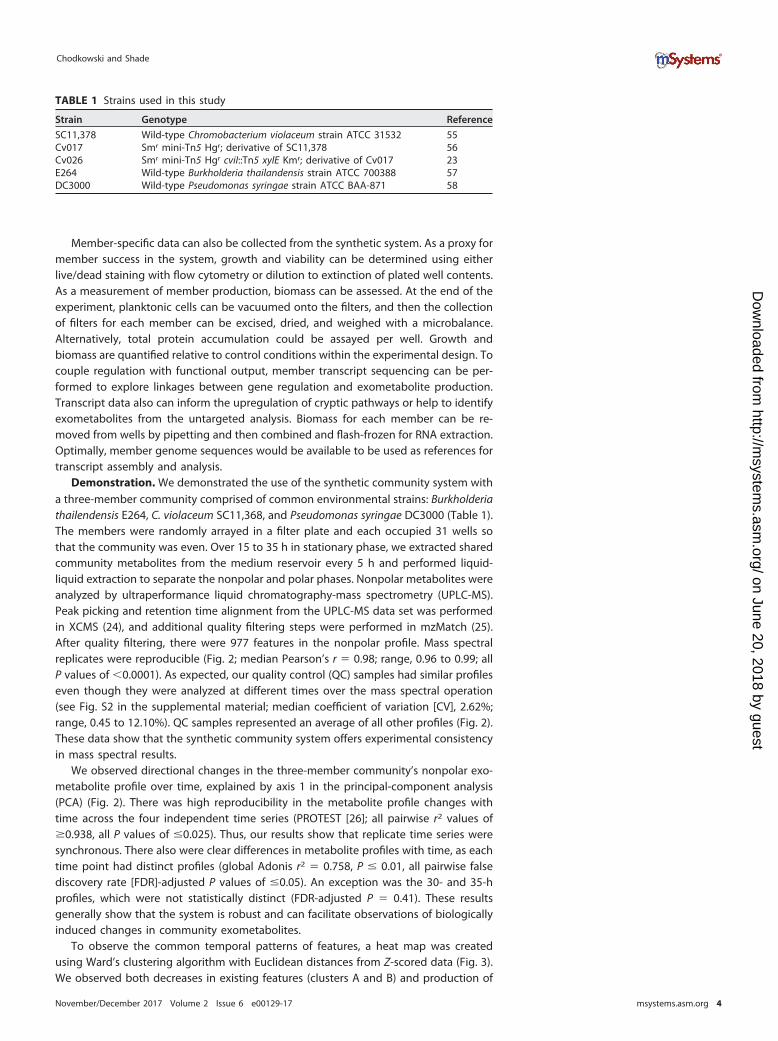
Demonstration. We demonstrated the use of the synthetic community system witha three-member community comprised of common environmental strains: Burkholderiathailendensis E264, C. violaceum SC11,368, and Pseudomonas syringae DC3000 (Table 1).The members were randomly arrayed in a filter plate and each occupied 31 wells sothat the community was even. Over 15 to 35 h in stationary phase, we extracted sharedcommunity metabolites from the medium reservoir every 5 h and performed liquid-liquid extraction to separate the nonpolar and polar phases. Nonpolar metabolites wereanalyzed by ultraperformance liquid chromatography-mass spectrometry (UPLC-MS).Peak picking and retention time alignment from the UPLC-MS data set was performedin XCMS (24), and additional quality filtering steps were performed in mzMatch (25).After quality filtering, there were 977 features in the nonpolar profile. Mass spectralreplicates were reproducible (Fig. 2; median Pearson’s r � 0.98; range, 0.96 to 0.99; allP values of �0.0001). As expected, our quality control (QC) samples had similar profileseven though they were analyzed at different times over the mass spectral operation(see Fig. S2 in the supplemental material; median coefficient of variation [CV], 2.62%;range, 0.45 to 12.10%). QC samples represented an average of all other profiles (Fig. 2).These data show that the synthetic community system offers experimental consistencyin mass spectral results.
We observed directional changes in the three-member community’s nonpolar exo-metabolite profile over time, explained by axis 1 in the principal-component analysis(PCA) (Fig. 2). There was high reproducibility in the metabolite profile changes withtime across the four independent time series (PROTEST [26]; all pairwise r2 values of�0.938, all P values of �0.025). Thus, our results show that replicate time series weresynchronous. There also were clear differences in metabolite profiles with time, as eachtime point had distinct profiles (global Adonis r2 � 0.758, P � 0.01, all pairwise falsediscovery rate [FDR]-adjusted P values of �0.05). An exception was the 30- and 35-hprofiles, which were not statistically distinct (FDR-adjusted P � 0.41). These resultsgenerally show that the system is robust and can facilitate observations of biologicallyinduced changes in community exometabolites.
To observe the common temporal patterns of features, a heat map was createdusing Ward’s clustering algorithm with Euclidean distances from Z-scored data (Fig. 3).We observed both decreases in existing features (clusters A and B) and production of
TABLE 1 Strains used in this study
Strain Genotype Reference
SC11,378 Wild-type Chromobacterium violaceum strain ATCC 31532 55Cv017 Smr mini-Tn5 Hgr; derivative of SC11,378 56Cv026 Smr mini-Tn5 Hgr cviI::Tn5 xylE Kmr; derivative of Cv017 23E264 Wild-type Burkholderia thailandensis strain ATCC 700388 57DC3000 Wild-type Pseudomonas syringae strain ATCC BAA-871 58
Chodkowski and Shade
November/December 2017 Volume 2 Issue 6 e00129-17 msystems.asm.org 4
on June 20, 2018 by guesthttp://m
systems.asm
.org/D
ownloaded from
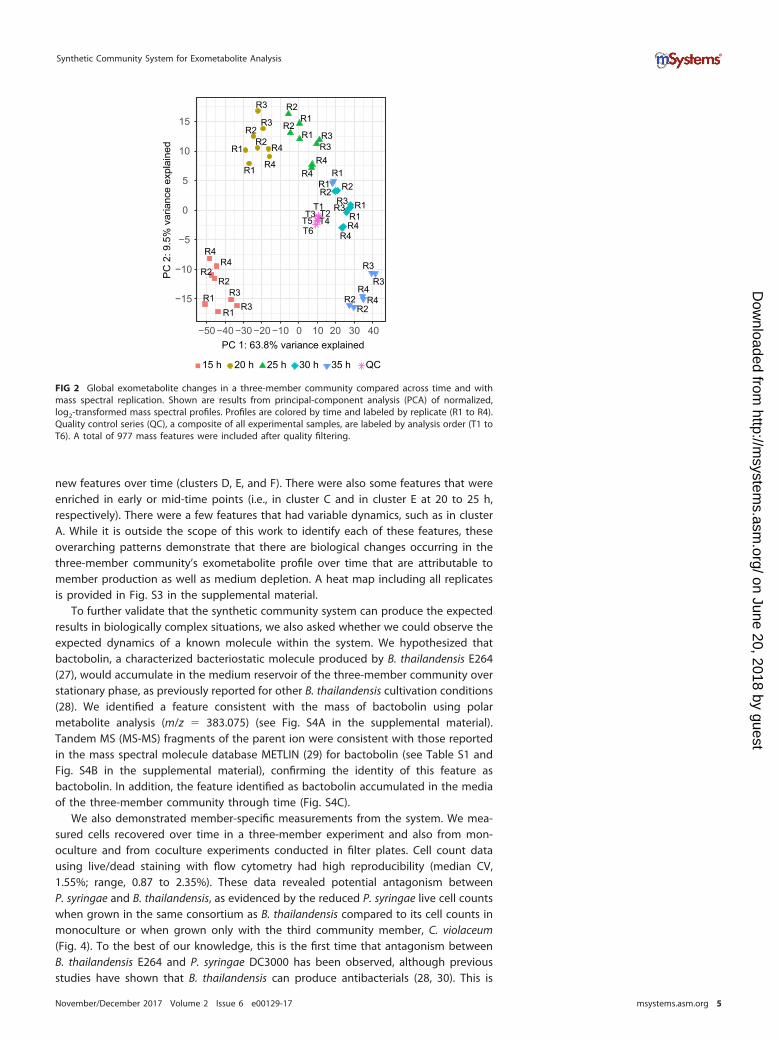
new features over time (clusters D, E, and F). There were also some features that wereenriched in early or mid-time points (i.e., in cluster C and in cluster E at 20 to 25 h,respectively). There were a few features that had variable dynamics, such as in clusterA. While it is outside the scope of this work to identify each of these features, theseoverarching patterns demonstrate that there are biological changes occurring in thethree-member community’s exometabolite profile over time that are attributable tomember production as well as medium depletion. A heat map including all replicatesis provided in Fig. S3 in the supplemental material.
To further validate that the synthetic community system can produce the expectedresults in biologically complex situations, we also asked whether we could observe theexpected dynamics of a known molecule within the system. We hypothesized thatbactobolin, a characterized bacteriostatic molecule produced by B. thailandensis E264(27), would accumulate in the medium reservoir of the three-member community overstationary phase, as previously reported for other B. thailandensis cultivation conditions(28). We identified a feature consistent with the mass of bactobolin using polarmetabolite analysis (m/z � 383.075) (see Fig. S4A in the supplemental material).Tandem MS (MS-MS) fragments of the parent ion were consistent with those reportedin the mass spectral molecule database METLIN (29) for bactobolin (see Table S1 andFig. S4B in the supplemental material), confirming the identity of this feature asbactobolin. In addition, the feature identified as bactobolin accumulated in the mediaof the three-member community through time (Fig. S4C).
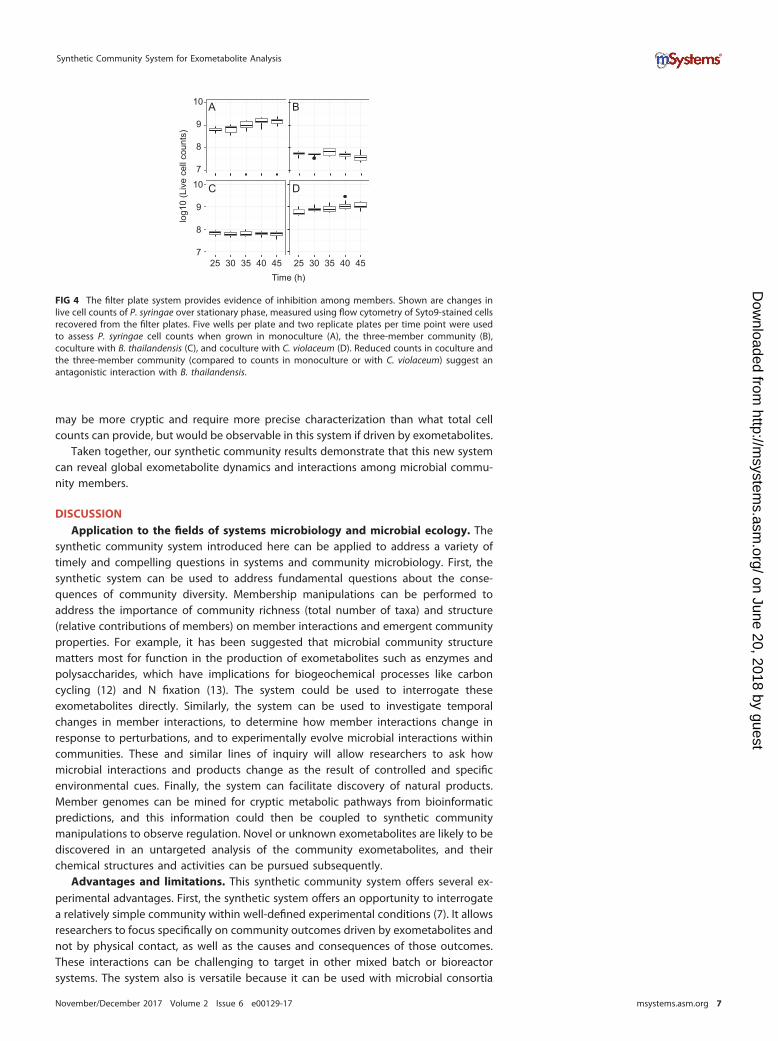
We also demonstrated member-specific measurements from the system. We mea-sured cells recovered over time in a three-member experiment and also from mon-oculture and from coculture experiments conducted in filter plates. Cell count datausing live/dead staining with flow cytometry had high reproducibility (median CV,1.55%; range, 0.87 to 2.35%). These data revealed potential antagonism betweenP. syringae and B. thailandensis, as evidenced by the reduced P. syringae live cell countswhen grown in the same consortium as B. thailandensis compared to its cell counts inmonoculture or when grown only with the third community member, C. violaceum(Fig. 4). To the best of our knowledge, this is the first time that antagonism betweenB. thailandensis E264 and P. syringae DC3000 has been observed, although previousstudies have shown that B. thailandensis can produce antibacterials (28, 30). This is
R1R1
R2R2
R3R3
R4R4
R1
R1
R2R2
R3
R3
R4
R4
R1
R1
R2
R2R3R3
R4R4
R1R1
R2R2R3
R3
R4R4
R1R1
R2R2
R3
R3
R4R4
T1T2T3T4T5
T6
−15
−10
−5
0
5
10
15
PC 1: 63.8% variance explained
PC
2: 9
.5%
var
ianc
e ex
plai
ned
−50 −40 −30 −20 −10 0 10 20 30 40
15 h 20 h 25 h 30 h 35 h QC
FIG 2 Global exometabolite changes in a three-member community compared across time and withmass spectral replication. Shown are results from principal-component analysis (PCA) of normalized,log2-transformed mass spectral profiles. Profiles are colored by time and labeled by replicate (R1 to R4).Quality control series (QC), a composite of all experimental samples, are labeled by analysis order (T1 toT6). A total of 977 mass features were included after quality filtering.
Synthetic Community System for Exometabolite Analysis
November/December 2017 Volume 2 Issue 6 e00129-17 msystems.asm.org 5
on June 20, 2018 by guesthttp://m
systems.asm
.org/D
ownloaded from

relevant because P. syringae spp. are common plant pathovars, and we suggestsubsequent work should explore this interaction with biocontrol applications in mind.
We observed consistent population sizes for each community member over station-ary phase (see Fig. S5 in the supplemental material), suggesting that, for this commu-nity, exometabolite interactions that occurred during stationary phase impacted func-tional output without impacting standing population sizes. Thus, outcomes of memberexometabolite interactions did not drastically alter population sizes in this consortium.In contrast, the expectation in ecological compensatory dynamics is that populationsizes of competitors are negatively correlated, such that an increase in the more fitpopulation corresponds with a decrease in the less fit population. The observation ofstatic population sizes in the synthetic system is important because it suggests that wecan identify signatures of microbial interactions that are not necessarily indicated bychanges in population size. Microbial interactions without obvious growth outcomes
15 20 25 30 35 QCTime (h)
Features
2 1 0 -1 -2
z-score
A
B
C
D
E
F
FIG 3 Exometabolites exhibit directional changes over stationary phase in a three-member syntheticmicrobial community. Shown is a heat map of 977 mass feature changes over time within a three-member community, where samples are columns and features are rows. Each sample is the average offour time point replicates, each started independently from new cultures. Euclidean distance wascalculated from Z-scored mass spectral profiles. Features with similar dynamics were clustered by Ward’smethod. Letter designations for clusters were added post hoc to aid in discussion. “QC” is quality controlseries, an even composite of all experimental samples that was run at regular intervals on the massspectrometer to assess instrument stability and feature consistency.
Chodkowski and Shade
November/December 2017 Volume 2 Issue 6 e00129-17 msystems.asm.org 6
on June 20, 2018 by guesthttp://m
systems.asm
.org/D
ownloaded from
may be more cryptic and require more precise characterization than what total cellcounts can provide, but would be observable in this system if driven by exometabolites.
Taken together, our synthetic community results demonstrate that this new systemcan reveal global exometabolite dynamics and interactions among microbial commu-nity members.
DISCUSSIONApplication to the fields of systems microbiology and microbial ecology. The
synthetic community system introduced here can be applied to address a variety oftimely and compelling questions in systems and community microbiology. First, thesynthetic system can be used to address fundamental questions about the conse-quences of community diversity. Membership manipulations can be performed toaddress the importance of community richness (total number of taxa) and structure(relative contributions of members) on member interactions and emergent communityproperties. For example, it has been suggested that microbial community structurematters most for function in the production of exometabolites such as enzymes andpolysaccharides, which have implications for biogeochemical processes like carboncycling (12) and N fixation (13). The system could be used to interrogate theseexometabolites directly. Similarly, the system can be used to investigate temporalchanges in member interactions, to determine how member interactions change inresponse to perturbations, and to experimentally evolve microbial interactions withincommunities. These and similar lines of inquiry will allow researchers to ask howmicrobial interactions and products change as the result of controlled and specificenvironmental cues. Finally, the system can facilitate discovery of natural products.Member genomes can be mined for cryptic metabolic pathways from bioinformaticpredictions, and this information could then be coupled to synthetic communitymanipulations to observe regulation. Novel or unknown exometabolites are likely to bediscovered in an untargeted analysis of the community exometabolites, and theirchemical structures and activities can be pursued subsequently.
Advantages and limitations. This synthetic community system offers several ex-perimental advantages. First, the synthetic system offers an opportunity to interrogatea relatively simple community within well-defined experimental conditions (7). It allowsresearchers to focus specifically on community outcomes driven by exometabolites andnot by physical contact, as well as the causes and consequences of those outcomes.These interactions can be challenging to target in other mixed batch or bioreactorsystems. The system also is versatile because it can be used with microbial consortia
7
8
9
10
25 30 35 40 45 25 30 35 40 45
log1
0 (L
ive
cell
coun
ts)
Time (h)
A B
C D
7
8
9
10
FIG 4 The filter plate system provides evidence of inhibition among members. Shown are changes inlive cell counts of P. syringae over stationary phase, measured using flow cytometry of Syto9-stained cellsrecovered from the filter plates. Five wells per plate and two replicate plates per time point were usedto assess P. syringae cell counts when grown in monoculture (A), the three-member community (B),coculture with B. thailandensis (C), and coculture with C. violaceum (D). Reduced counts in coculture andthe three-member community (compared to counts in monoculture or with C. violaceum) suggest anantagonistic interaction with B. thailandensis.
Synthetic Community System for Exometabolite Analysis
November/December 2017 Volume 2 Issue 6 e00129-17 msystems.asm.org 7
on June 20, 2018 by guesthttp://m
systems.asm
.org/D
ownloaded from
from any ecosystem and adjusted to simulate environmental conditions of interest. Thesystem also is scalable, not only for increasing the overall community diversity, but alsofor moving toward higher-throughput and high-content screens for molecules andcommunity outcomes of interest. Finally, the system is accessible. The filter plates areavailable to any lab, and manual manipulation of the system without specializedequipment is feasible. We suggest that the most limiting factor is access to massspectrometers and expertise in mass spectral analysis, which if not available locally isaccessible via research support facilities.
As is true for any laboratory-scale experimental system, this synthetic communitysystem also has several limitations. First, all possible types of microbial interactions arenot observable using this system. Some exceptions include interactions that are contactdependent or in which chemical exchanges and physical contact are not clearlydistinguishable or independent. The system instead allows for control of the influenceof physical spatial structure on microbial interactions, which has been shown to beimportant for stabilizing some communities, especially for highly structured environ-ments like biofilms or soil matrices (e.g., 17, 19, 31, 32). However, because members arespatially partitioned yet permitted to interact chemically, this system allows the re-searcher to control for spatial effects without a typical limitation of homogenouscoculture: overgrowth of one member that prevents long-term observations of com-munity interactions (17).
Not all relevant microbial exometabolites and community outcomes will be observ-able in this system. Specifically, exometabolites that have a rapid turnover or that areconcentration dependent in ranges outside the system’s physical constraints andimposed experimental conditions will be inaccessible (e.g., total medium volume orexperiment duration, respectively). The ability to observe a molecule and its communityoutcomes also depends on the sensitivity of the microbial sensing/signaling systemsinvolved, which will depend on the members’ capabilities. Also, this system may not beideal for situations in which the local accumulation of an exometabolite inhibits thereaction generating the exometabolite, but this will depend on the duration of theexperiment relative to the expected rate of exometabolite accumulation in the reser-voir. Finally, interactions that are reliant on volatiles that may off-gas during plateshaking will not be observable.
Only cultivable organisms can be applied easily to the system, and so if the mostfunctionally important or prevalent members of a community are yet uncultivable, theirinteractions will be difficult to observe with this system. However, cultivation methodsare improving, in part because cultivation conditions can be informed by metagenomeand (meta)transcriptome data (33), and there is evidence that growing microbialcommunity members in cohorts from the environment can improve isolate recovery(34). Thus, this synthetic community system could be used to provide insights into theprecise memberships and molecules required to bring new isolates into laboratoryculture.
A general limitation of any system used to observe exometabolites is that manymicrobial exometabolites are unknown and difficult to identify. We anticipate that thislimitation will be overcome as technology and infrastructure for exometabolite iden-tification advances. Analysis pipelines to integrate exometabolite data with othermicrobial omics approaches, such as transcripts and metabolic flux analysis, are also inactive development (35, 36). Therefore, the first experiments using the syntheticcommunity system will face necessary challenges in spearheading analysis and inte-gration approaches.
There are general criticisms offered for using model or laboratory-scale systems inmicrobial ecology, and a common concern is that any model cannot mimic naturalconditions and therefore is not biologically relevant. The synthetic community systemdescribed here is an artificial, simplified model. However, it is a model that offers manyadvantages specifically for understanding the chemical feedbacks on community ecol-ogy driven by microbial interactions, which is a key goal of synthetic microbial ecology(7). These interactions have the potential to occur in nature, especially when thoughtful
Chodkowski and Shade
November/December 2017 Volume 2 Issue 6 e00129-17 msystems.asm.org 8
on June 20, 2018 by guesthttp://m
systems.asm
.org/D
ownloaded from
experimental designs are employed to (i) include organisms that are naturally cooc-curring or have evidence of interactions and (ii) manipulate the pertinent primarydrivers of natural ecosystems. Furthermore, important advances in ecology and evolu-tion have been made using model systems (37–40). Microbial synthetic systems espe-cially have offered insights because of their malleable communities and molecular toolsfor understanding population dynamics (4, 41–43). Thus, researchers continue to usemodel systems because they can inform as to both biological potential and constraintsin nature. When complemented with careful studies in situ, the synthetic communitysystem described here can serve to discover and interrogate microbial interactions, thesignatures of which may otherwise be unobservable within the complexity of naturalsystems.
MATERIALS AND METHODSFilter plate preparation. To prepare and use the filter plates for experiments, all protocols were
performed using an aseptic technique in a biosafety level 2 cabinet. For the synthetic communityexperiments, we used sterile filter plates with 0.22-�m-pore polyvinylidene difluoride (PVDF) filterbottoms (Millipore MAGVS2210). These are also referred to as “Transwell plates” in the tissue cultureliterature. Prior to use, filter plates were washed three times with sterile water using a vacuum apparatus(NucleoVac 96 vacuum manifold; Clontech Laboratories). The filter of well H12 was removed with a sterilepipette tip and tweezer, and 31 ml of medium was added to the reservoir through well H12. Each wellwas then filled with 130 �l of culture or medium.
Validation of the synthetic community system by the quorum sensing experiment. We inves-tigated the ability of quorum sensing molecules produced by populations arrayed in some wells to besensed by nonproducing but receptive populations in other wells. Cv017 and Cv026 (Table 1) wereinoculated in half-concentration Trypticase soy broth (TSB50) from overnight growth on half-concentration Trypticase soy agar (TSA50) in 3 replicate plates and grown at 29°C for 10 h. Cv017 wasdiluted to an optical density at 600 nm (OD600) of 0.2, and Cv026 was diluted to an OD600 of 0.075.Dilutions were either inoculated into test tubes (monoculture control growth) or a filter plate containingTSB50. Wells from columns 1 to 4 were inoculated with 130 �l/well Cv017 culture, columns 5 to 8 wereinoculated with 130 �l/well fresh TSB50, and columns 9 to 12 were inoculated with 130 �l/well Cv026culture. Control cultures in test tubes were incubated at 29°C at 200 rpm (model 4353; Thermo Scientific).After 16 h, cultures were flash-frozen in liquid nitrogen and stored at �80°C. Filter plates were incubatedat 29°C with gentle shaking (0.32 relative centrifugal force [rcf]) for 26 h. After 26 h, 10 �l from 5 wellscontaining Cv026 and 10 �l from the shared medium reservoir were serially diluted (10�4) and plated onTSA50 for 24 h at 29°C. The remaining Cv026-innoculated wells were pooled, flash-frozen in liquidnitrogen, and stored at �80°C.
Genomic DNA (gDNA) was used as a positive control in RT-PCR experiments. An overnight culture ofCv017 was grown in TSB50 at 29°C. Genomic DNA was isolated using the EZNA bacterial DNA kit (OmegaBio-Tek, Norcross, GA). We extracted RNA from the Cv017-Cv026 filter plate coculture experiment andfrom both test tube controls. RNA was isolated using the EZNA bacterial RNA kit (Omega Bio-Tek)according to the manufacturer’s instructions and treated with RNase-free DNase (Qiagen). Purity of RNAwas analyzed on a NanoDrop spectrophotometer using a 260/280 absorbance ratio and quantified usingQubit 2.0 (Life Technologies, Inc.).
Primers for vioC and rpoB were designed with Primer3 v.0.4.0 (44) using C. violaceum referencesequences from NCBI’s GenBank (see Table S2 in the supplemental material). To confirm that theamplicon products were as expected, vioC and rpoB bands were excised from an agarose gel and purifiedusing the Wizard SV gel and PCR clean-up system (Promega). Sanger sequencing was performed on thepurified bands at the Michigan State Genomics Core using the forward and reverse primers from vioC_Cvand rpoB_Cv.
PCR was performed on extracted RNA to ensure proper DNase treatment using the vioC_Cv primers.Fifty nanograms of RNA from each sample was added to GoTaq Green 2� master mix (containing bufferand enzyme; Promega), 0.5 �M forward and reverse primers, and nuclease-free water in a total volumeof 25 �l/reaction. Thirty nanograms of Cv017 gDNA was used as a positive control and nuclease-freewater as a negative PCR control. PCR conditions were as follows: 95°C for 5 min, 95°C for 15 s, 56°C for15 s, and 72°C for 25 s, repeated 29 times from step 2, followed by 72°C for 10 min and hold at 7.4°C.Five microliters of each PCR product was run on 1% agarose gel containing 0.5� Tris-borate with EDTA(TBE) and ethidium bromide with a 100-bp DNA ladder (New England Biolabs). Electrophoresis was runfor 50 min at 100 V. Gels were visualized by UV illumination.
Reverse transcription (RT) was performed using a Thermo Fisher Scientific high-capacity cDNA RT kitfor both vioC and rpoB genes according to the manufacturer’s instructions. Each RT reaction mixturecontained ~1,500 ng template RNA, 0.625 �M reverse primer (Table S2), 4 mM deoxynucleosidetriphosphates (dNTPs), MultiScribe murine leukemia virus (MuLV) reverse transcriptase (50 U; AppliedBiosystems), 1� RT buffer, and nuclease-free water in a total volume of 20 �l/reaction. An RT negativecontrol was prepared for each primer using only nuclease-free water instead of template. The RTthermocycler conditions were as follows: 25°C for 10 min, 37°C for 2 h, and 85°C for 5 min, followed byhold at 4°C. cDNA was stored at �80°C.
Synthetic Community System for Exometabolite Analysis
November/December 2017 Volume 2 Issue 6 e00129-17 msystems.asm.org 9
on June 20, 2018 by guesthttp://m
systems.asm
.org/D
ownloaded from
Endpoint PCR was performed on cDNA after the reverse transcription reaction for both vioC and rpoBusing the Pfu Turbo DNA polymerase kit (Agilent Technologies). Each reaction mixture contained 1 �l ofRT product, 1� Pfu buffer, 0.2 mM dNTP, 1� Pfu DNA polymerase, 0.5 �M forward and reverse primers(Table S2), and nuclease-free water in a total volume of 25 �l/reaction. Thirty nanograms of Cv017 gDNAwas used as a positive control, while a nuclease-free water sample served as a negative PCR control. TheRT reaction without template DNA served as an additional negative control. PCR conditions for bothprimer sets were as follows: 95°C for 2 min, 95°C for 30 s, 56°C for 30 s, and 72°C for 45 s, repeated 29times from step 2, followed by 72°C for 10 min and hold at 4°C. Twenty-five microliters of each PCRproduct was mixed with 6� loading dye (New England Biolabs) and run on 1% agarose gel containing0.5� Tris-borate with EDTA (TBE) and ethidium bromide with a 100-bp DNA ladder (New EnglandBiolabs). Electrophoresis was run for 50 min at 100 V. Gels were visualized by UV illumination.
Three-member synthetic community experiments. (i) Experimental setup. Prior to initiating thesynthetic community experiments, we characterized member growth curves to determine their com-patibility in our experimental conditions. To perform the experiments, we diluted overnight cultures toconcentrations that would allow the members to achieve stationary phase within 1 to 2 h of one another.Freezer stocks of B. thailandensis, C. violaceum, and P. syringae (Table 1) were plated on TSA50 at 28°Cfor 36 h. Isolated colonies were inoculated in 5 ml of M9 – 0.2% glucose medium and grown overnightat 28°C with gentle shaking. Overnight cultures of each strain were diluted 1:20 in fresh M9-glucosemedium prior to inoculation in the filter plates (130 �l/well), and the medium reservoir was filled with31 ml M9-glucose. Filter plates were prepared as described above. For each plate, a custom R script(RandomArray.R [see the GitHub repository]) was used to randomize community member placement inthe wells so that each member occupied a total of 31 wells per plate. For each of four replicate timecourses (where each time course included five points assessed every 5 h over stationary phase), fivereplicate filter plates were prepared for destructive sampling. Filter plates were incubated at 28°C withgentle shaking (~0.32 rcf). The first plate was destructively sampled at 15 h, and each subsequent platewas destructively sampled every 5 h thereafter until 35 h. Spent medium (~31 ml) from the sharedreservoir was flash-frozen in liquid nitrogen and stored at �80 °C prior to metabolite extraction.
(ii) Flow cytometry. Prior to analysis, live/dead gates were established using overnight culturesgrown in in M9-glucose. Fifteen microliters of log-phase cells was placed in either 135 �l Tris-bufferedsaline (TBS; 20 mM Tris, 0.8% NaCl [pH 7.4]) (live) or 135 �l 70% isopropanol (dead) and incubated atroom temperature for 10 min. Live and dead cells were then diluted an additional 100-fold (1,000-foldtotal dilution) and stained with the Thermo Scientific LIVE/DEAD BacLight bacterial viability kit at finalconcentrations of 1.5 �M Syto9 (live stain) and 2.5 �M propidium iodide (dead stain). Two hundredmicroliters of stained cultures was transferred to a 96-well microtiter U-bottom microplate (ThermoScientific). Twenty microliters of sample was analyzed on a BD Accuri C6 flow cytometer (BD Biosciences)at a fluidics rate of 66 �l/min and a threshold of 500 on an FL2 gate. The instrument contained thefollowing optical filters: FL1-533, 30 nm; FL2-585, 40 nm; and FL3, 670-nm longpass. Data were analyzedusing BD Accuri C6 software version 1.0.264.21 (BD Biosciences). Live/dead gates are provided for eachmember (see Fig. S6 in the supplemental material). Reproducibility in cell counts was assessed using thecoefficient of variation (CV) in R.
After gates were established, we used live/dead staining of cells with flow cytometry to determinemember population size from cells collected at each time point. For each member, five replicate wellscontaining spent culture were prepared for flow cytometry analysis. From each well, 20 �l of culture wasplaced in 180 �l TSB. In plate arrangements where P. syringae was arrayed with B. thailandensis,P. syringae culture was diluted 70-fold in TBS. In plate arrangements where P. syringae was arrayed inmonoculture or in coculture with C. violaceum, P. syringae was diluted 900-fold in TBS. Diluted cultureswere stained and analyzed as described above. Flow cytometry analyses of both B. thailandensis andC. violaceum were prepared as described above, except that B. thailandensis was diluted 1,300-fold andC. violaceum was diluted 1,540-fold before staining.
(iii) Metabolite extraction and preparation. To prepare samples for nonpolar mass spectralanalysis, 5-ml aliquots of spent medium from each filter plate medium reservoir and four M9-glucosemedium controls were thawed on ice with 5 ml of 100% methanol. After thawing, solutions weretransferred to glass separatory funnels that were initially washed with Liquinox (Alconox, Inc., New York,NY), rinsed with water, dried, and then rinsed three times with acetone. Three separate 5-ml liquid-liquidextractions were performed on each sample using dichloromethane, and then the combined volume ofthe organic layers from each extraction (15 ml) was pooled into a 50-ml canonical tube. The organic layerwas dried under nitrogen (N2 evaporator system; Glas-Col). Samples were resuspended in 1.0 ml65%:35% (vol/vol) acetonitrile– 0.1% formic acid in water.
To prepare samples for polar mass spectral analysis, 2 ml of the aqueous layer from liquid-liquidextractions was evaporated using a Savant SVC 100H centrifugal evaporator. Dried samples wereresuspended in 150 �l of methanol, sonicated (Branson M1800) for 30 min, further resuspended with theaddition of 350 �l of acetonitrile, and centrifuged at 20,817 � g for 20 min, and the supernatant wasfiltered through a 0.22-�m-pore PVDF membrane.
(iv) Mass spectral analysis. Reverse-phase chromatography and mass detection of exometaboliteswere performed on a Waters Xevo G2-XS QTof UPLC–MS-MS instrument. For nonpolar UPLC analysis,10 �l was injected into a C18 column (BEH Shield; 2.1 by 100 mm, 1.7-�m particle size; Waters, Milford,MA) maintained at 35°C. Samples were eluted at a flow rate of 0.3 ml/min under the following gradientconditions: 99% A–1% B for 1 min, followed by 1% to 99% B in 10 min, then hold at 99% B for 3 minbefore returning to the initial condition for 1 min. Mobile phase A consisted of 0.1% formic acid in water(pH 2.7), and mobile phase B consisted of acetonitrile. MS conditions were set as follows: mass range
Chodkowski and Shade
November/December 2017 Volume 2 Issue 6 e00129-17 msystems.asm.org 10
on June 20, 2018 by guesthttp://m
systems.asm
.org/D
ownloaded from
acquisition, 50 to 2,000 m/z; ionization mode, electrospray ionization negative (ESI�) sensitivity mode;scan time, 0.5 s; collision energy, 6 eV; capillary voltage, 2.5 kV; sampling cone, 40 V; source temperature,100°C; desolvation temperature, 350°C; cone gas flow, 50 liters/h; desolvation gas flow, 550 liters/h;and low mass (LM) resolution, 4.7. For accurate mass acquisition, a lock mass of leucine enkephalin([M � H]� � 554.2615) was used. Twenty experimental samples (4 time series replicates and 5 timepoints/series) and 4 M9-glucose controls (1 for each time series) were analyzed twice as mass spectralreplicates. All samples, including solvent blanks, were analyzed in a random order. In addition, acomposite quality control (QC) sample was made by combining 50 �l from each experimental sample,including all biological replicates but excluding medium controls (45). A QC dilution series was preparedby diluting the QC sample 2-, 4-, and 8-fold. The QC sample was used to condition the column at thebeginning of the mass spectral analysis (45) and to assess instrument stability at six time points over thecourse of the mass spectral analysis (45). The QC dilutions were analyzed at the end of the mass spectralanalysis and were used to filter out noisy features as part of the data quality control prior to statisticalanalysis (46). Raw Waters MS data files were converted to netCDF file format using MassLynx DataBridgesoftware (Waters, Milford, MA).
Hydrophilic interaction liquid chromatography (HILIC) mass detection of exometabolites was per-formed on a Waters Xevo G2-XS quadrupole time of flight (QTOF) UPLC–MS-MS instrument. For polarUPLC analysis, 10 �l of each sample was injected into an HILIC column (Cortecs UPLC, 2.1 by 100 mm,1.7-�m particle size; Waters, Milford, MA) maintained at 35°C. Samples were eluted at a flow rate of0.3 ml/min under the following gradient conditions: 0% A–100% B for 1 min, 0% to 52.5% A in 13 min,hold at 52.5% A for 3 min before returning to the initial condition for 5 min. Mobile phase A consistedof 5 mM ammonium acetate in water (pH 3), and mobile phase B consisted of 95% acetonitrile–5% 5 mMammonium acetate in water (pH 3). MS conditions were set as follows: mass range acquisition, 50 to2,000 m/z; ionization mode, ESI� sensitivity mode; scan time, 0.1 s; collision energy, 6 eV; capillaryvoltage, 3.0 kV; sampling cone, 35 V; source temperature, 100°C; desolvation temperature, 350°C; conegas flow, 25 liters/h; desolvation gas flow, 600 liters/h; and LM resolution, 4.7. For accurate massacquisition, a lock mass of leucine enkephalin ([M � H]� � 556.2771) was used. Samples were analyzedin blocks of 4 time series replicates, starting with 35 h and decreasing sequentially to 15 h, followed by4 medium control samples. A solvent blank was run between each block. Given the expectation ofbactobolin accumulation through time (28), samples were analyzed in this order to ensure that there wasno sample carryover in each subsequent block analyzed. The sample taken at 35 h from replicate 4 waschosen for MS-MS analysis to confirm the identification of bactobolin. For MS-MS analysis, similar UPLCconditions and MS conditions were used with the following exceptions: MS set mass, 383.1; MS-MS rangeacquisition, 40 to 600 m/z; LM resolution, 17.0; and collision energy ramp, 20 to 80 eV.
(v) Peak selection, quality control, and global analysis of nonpolar mass spectral data. mzMatchversion 2.0-13 was used for metabolomics analysis (25). Fifty-seven mass spectral files were analyzed: 4time series replicates, 5 time points/series, 2 mass spectral replicates/time point, 4 negative controls with2 mass spectral replicates each, 6 QC samples, and 3 QC dilution series samples. First, XCMS version 1.48.0was used within mzMatch for peak selection and retention time correction (24). Then, peak grouping,peak filling, and peak filtering steps were performed in mzMatch. Filtering steps included noise filtering,medium control removal, removal of features below and above the elution gradient (�0.5 min and�18 min of retention), and QC dilution series assessment. Pearson’s correlation was used to assesscongruence across dilutions for each feature and to determine if the experimental series for an undilutedfeature was highly correlated with that of its 1:2, 1:4, and 1:8 dilutions (46). Features with a dilution seriesPearson’s r of �0.9 and/or P value of �0.05 had an irreproducible dilution trend and were removed (46).The resulting feature by sample matrix was converted from a .peakml file to a text file and was importedinto R. The coefficient of variation (CV) was calculated in R to assess reproducibility of QC samples.Duplicate retention times were removed, features with a positive Pearson correlation coefficient from theQC dilution series were removed, and features with the greatest average abundances in the QC sampleswere removed. The three QC dilution series samples and medium control samples were omitted from thestatistical analysis of differential patterns. Missing values were changed to half the minimum value, andlabels were added to comply with the MetaboAnalyst data format (47).
The feature table was uploaded into MetaboAnalyst 3.0 (47). Raw feature intensity values from thequality-filtered data set were normalized using probabilistic quotient normalization (48) and log2
transformed (49). The resulting mass feature table was used for statistical analysis and visualization. Weused principal-component analysis to explore global changes in metabolite profiles across samples(Fig. 2). We tested for significant differences among time points using permutational multivariate analysisof variance (PERMANOVA) (50), implemented with the Adonis function in the vegan package (51). We firstperformed a global test with Adonis to determine as if there are any differences among any time points.If the global test was significant, post hoc pairwise tests between all time points were performed todetermine which were different from each other (e.g., time 15 versus time 20). To correct for multiplecomparisons, we used a false-discovery rate (FDR) adjustment to the P values for post hoc tests, using thep.adjust script from the base package in R (52). We used a Procrustes superimposition analysis todetermine if replicate time series were coherent (26). This test was implemented with the PROTESTfunction in the vegan package (51). We used MetaboAnalyst to create a heat map to visualize featurechanges over time. For the heat map, time point replicates were standardized with Z scores, and thenfeatures were averaged within a time point. A full heat map with each replicate as a separate column isprovided in the supplemental material (Fig. S3).
(vi) Bactobolin identification from polar mass spectral data. For MS analysis targeting bactobolin,polar mass spectral data from the HILIC analysis were used. Targeted peaks were detected in MZmine
Synthetic Community System for Exometabolite Analysis
November/December 2017 Volume 2 Issue 6 e00129-17 msystems.asm.org 11
on June 20, 2018 by guesthttp://m
systems.asm
.org/D
ownloaded from
2.17 with the following parameters: intensity tolerance, 10%; noise level, 50; m/z tolerance, 30 ppm; andretention time tolerance, 0.4 min. After peak detection, peak extension was used with the followingparameters: m/z tolerance, 30 ppm; and minimum height, 50. Selected peaks were joined into one datafile using the join aligner function in MZmine, and peak areas were exported to a CSV file. The R packageggplot2 (53) was used to make a box plot tracking bactobolin accumulation through time.
For MS-MS analysis, the netCDF file was uploaded into MZmine to observe MS-MS fragments. Scannumber 2405 was chosen to produce the fragment list provided in Table S1 because this MS-MS scan hadthe least parts per million errors for all fragments. Extracted ion chromatographic traces of bactobolinfrom the MS and MS-MS data files were generated in XCMS.
Availability of data. Computing workflows (source code and input files) are available on GitHub(https://github.com/ShadeLab/PAPER_Chodkowski_mSystems_2017). Mass spectral data have been sub-mitted to MetaboLights (http://www.ebi.ac.uk/metabolights/MTBLS525).
SUPPLEMENTAL MATERIALSupplemental material for this article may be found at https://doi.org/10.1128/
mSystems.00129-17.FIG S1, PDF file, 0.4 MB.FIG S2, PDF file, 0.1 MB.FIG S3, PDF file, 0.4 MB.FIG S4, PDF file, 0.1 MB.FIG S5, PDF file, 0.1 MB.FIG S6, PDF file, 0.2 MB.TABLE S1, PDF file, 0.1 MB.TABLE S2, PDF file, 0.1 MB.
ACKNOWLEDGMENTSWe thank Sang-Hoon Lee, Keara L. Grady, and Siobhan A. Cusack for technical
assistance. This work was supported by the instrumentation at the Michigan StateUniversity Mass Spectrometry and Proteomics Core Facility and by the computationalresources at the Michigan State Institute for Cyber-Enabled Research. We thank theSheng Yang He lab for use of their flow cytometer and Daniel Jones for training on useof the mass spectrometers.
This work was supported by Michigan State University start-up funds to A.S.
REFERENCES1. Little AE, Robinson CJ, Peterson SB, Raffa KF, Handelsman J. 2008. Rules
of engagement: interspecies interactions that regulate microbial com-munities. Annu Rev Microbiol 62:375– 401. https://doi.org/10.1146/annurev.micro.030608.101423.
2. Damore JA, Gore J. 2012. Understanding microbial cooperation. J TheorBiol 299:31– 41. https://doi.org/10.1016/j.jtbi.2011.03.008.
3. Cornforth DM, Foster KR. 2013. Competition sensing: the social side ofbacterial stress responses. Nat Rev Microbiol 11:285–293. https://doi.org/10.1038/nrmicro2977.
4. De Roy K, Marzorati M, Van den Abbeele P, Van de Wiele T, Boon N. 2014.Synthetic microbial ecosystems: an exciting tool to understand andapply microbial communities. Environ Microbiol 16:1472–1481. https://doi.org/10.1111/1462-2920.12343.
5. Andrade-Domínguez A, Salazar E, Del Carmen Vargas-Lagunas M,Kolter R, Encarnación S. 2014. Eco-evolutionary feedbacks drive spe-cies interactions. ISME J 8:1041–1054. https://doi.org/10.1038/ismej.2013.208.
6. Watve MG, Tickoo R, Jog MM, Bhole BD. 2001. How many antibiotics areproduced by the genus Streptomyces? Arch Microbiol 176:386 –390.https://doi.org/10.1007/s002030100345.
7. Dolinšek J, Goldschmidt F, Johnson DR. 2016. Synthetic microbial ecol-ogy and the dynamic interplay between microbial genotypes. FEMSMicrobiol Rev 40:961–979. https://doi.org/10.1093/femsre/fuw024.
8. Yang YL, Xu Y, Straight P, Dorrestein PC. 2009. Translating metabolicexchange with imaging mass spectrometry. Nat Chem Biol 5:885– 887.https://doi.org/10.1038/nchembio.252.
9. Watrous JD, Dorrestein PC. 2011. Imaging mass spectrometry inmicrobiology. Nat Rev Microbiol 9:683– 694. https://doi.org/10.1038/nrmicro2634.
10. Liu WT, Yang YL, Xu Y, Lamsa A, Haste NM, Yang JY, Ng J, Gonzalez D,
Ellermeier CD, Straight PD, Pevzner PA, Pogliano J, Nizet V, Pogliano K,Dorrestein PC. 2010. Imaging mass spectrometry of intraspecies meta-bolic exchange revealed the cannibalistic factors of Bacillus subtilis. ProcNatl Acad Sci U S A 107:16286 –16290. https://doi.org/10.1073/pnas.1008368107.
11. Turnbaugh PJ, Gordon JI. 2008. An invitation to the marriage of metag-enomics and metabolomics. Cell 134:708 –713. https://doi.org/10.1016/j.cell.2008.08.025.
12. Schimel JP, Schaeffer SM. 2012. Microbial control over carbon cycling insoil. Front Microbiol 3:348. https://doi.org/10.3389/fmicb.2012.00348.
13. Norman JS, Friesen ML. 2017. Complex N acquisition by soil diazotrophs:how the ability to release exoenzymes affects N fixation by terrestrialfree-living diazotrophs. ISME J 11:315–326. https://doi.org/10.1038/ismej.2016.127.
14. Grosskopf T, Soyer OS. 2014. Synthetic microbial communities. Curr OpinMicrobiol 18:72–77. https://doi.org/10.1016/j.mib.2014.02.002.
15. Datta MS, Sliwerska E, Gore J, Polz MF, Cordero OX. 2016. Microbialinteractions lead to rapid micro-scale successions on model marineparticles. Nat Commun 7:11965. https://doi.org/10.1038/ncomms11965.
16. Lindemann SR, Mobberley JM, Cole JK, Markillie LM, Taylor RC, Huang E,Chrisler WB, Wiley HS, Lipton MS, Nelson WC, Fredrickson JK, Romine MF.2017. Predicting species-resolved macronutrient acquisition during suc-cession in a model phototrophic biofilm using an integrated ’omicsapproach. Front Microbiol 8:1–15. https://doi.org/10.3389/fmicb.2017.01020.
17. Kim HJ, Boedicker JQ, Choi JW, Ismagilov RF. 2008. Defined spatialstructure stabilizes a synthetic multispecies bacterial community. ProcNatl Acad Sci U S A 105:18188 –18193. https://doi.org/10.1073/pnas.0807935105.
18. Klitgord N, Segrè D. 2010. Environments that induce synthetic microbial
Chodkowski and Shade
November/December 2017 Volume 2 Issue 6 e00129-17 msystems.asm.org 12
on June 20, 2018 by guesthttp://m
systems.asm
.org/D
ownloaded from
ecosystems. PLoS Comput Biol 6:e1001002. https://doi.org/10.1371/journal.pcbi.1001002.
19. Harcombe WR, Riehl WJ, Dukovski I, Granger BR, Betts A, Lang AH,Bonilla G, Kar A, Leiby N, Mehta P, Marx CJ, Segrè D. 2014. Metabolicresource allocation in individual microbes determines ecosystem inter-actions and spatial dynamics. Cell Rep 7:1104 –1115. https://doi.org/10.1016/j.celrep.2014.03.070.
20. Shou W, Ram S, Vilar JM. 2007. Synthetic cooperation in engineeredyeast populations. Proc Natl Acad Sci U S A 104:1877–1882. https://doi.org/10.1073/pnas.0610575104.
21. Widder S, Allen RJ, Pfeiffer T, Curtis TP, Wiuf C, Sloan WT, Cordero OX,Brown SP, Momeni B, Shou W, Kettle H, Flint HJ, Haas AF, Laroche B, KreftJU, Rainey PB, Freilich S, Schuster S, Milferstedt K, van der Meer JR,Grosskopf T, Huisman J, Free A, Picioreanu C, Quince C, Klapper I,Labarthe S, Smets BF, Wang H, Isaac Newton Institute Fellows, Soyer OS.2016. Challenges in microbial ecology: building predictive understand-ing of community function and dynamics. ISME J 10:2557–2568. https://doi.org/10.1038/ismej.2016.45.
22. Lindemann SR, Bernstein HC, Song HS, Fredrickson JK, Fields MW, ShouW, Johnson DR, Beliaev AS. 2016. Engineering microbial consortia forcontrollable outputs. ISME J 10:2077–2084. https://doi.org/10.1038/ismej.2016.26.
23. McClean KH, Winson MK, Fish L, Taylor A, Chhabra SR, Camara M, DaykinM, Lamb JH, Swift S, Bycroft BW, Stewart GS, Williams P. 1997. Quorumsensing and Chromobacterium violaceum: exploitation of violacein pro-duction and inhibition for the detection of N-acylhomoserine lactones.Microbiology 143:3703–3711. https://doi.org/10.1099/00221287-143-12-3703.
24. Smith CA, Want EJ, O’Maille G, Abagyan R, Siuzdak G. 2006. XCMS:processing mass spectrometry data for metabolite profiling using non-linear peak alignment, matching, and identification. Anal Chem 78:779 –787. https://doi.org/10.1021/ac051437y.
25. Scheltema RA, Jankevics A, Jansen RC, Swertz MA, Breitling R. 2011.PeakML/mzMatch: a file format, Java library, R library, and tool-chain formass spectrometry data analysis. Anal Chem 83:2786 –2793. https://doi.org/10.1021/ac2000994.
26. Peres-Neto PR, Jackson DA. 2001. How well do multivariate data setsmatch? The advantages of a Procrustean superimposition approachover the Mantel test. Oecologia 129:169 –178. https://doi.org/10.1007/s004420100720.
27. Seyedsayamdost MR, Chandler JR, Blodgett JAV, Lima PS, Duerkop BA,Oinuma K-I, Greenberg EP, Clardy J. 2010. Quorum-sensing-regulatedbactobolin production by Burkholderia thailandensis E264. Org Lett12:716 –719. https://doi.org/10.1021/ol902751x.
28. Duerkop BA, Varga J, Chandler JR, Peterson SB, Herman JP, Churchill ME,Parsek MR, Nierman WC, Greenberg EP. 2009. Quorum-sensing control ofantibiotic synthesis in Burkholderia thailandensis. J Bacteriol 191:3909 –3918. https://doi.org/10.1128/JB.00200-09.
29. Smith CA, O’Maille G, Want EJ, Qin C, Trauger SA, Brandon TR, CustodioDE, Abagyan R, Siuzdak G. 2005. METLIN: a metabolite mass spectraldatabase. Ther Drug Monit 27:747–751. https://doi.org/10.1097/01.ftd.0000179845.53213.39.
30. Knappe TA, Linne U, Zirah S, Rebuffat S, Xie X, Marahiel MA. 2008. Isolationand structural characterization of capistruin, a lasso peptide predicted fromthe genome sequence of Burkholderia thailandensis E264. J Am Chem Soc130:11446–11454. https://doi.org/10.1021/ja802966g.
31. Nadell CD, Drescher K, Foster KR. 2016. Spatial structure, cooperationand competition in biofilms. Nat Rev Microbiol 14:589 – 600. https://doi.org/10.1038/nrmicro.2016.84.
32. Mitri S, Clarke E, Foster KR. 2016. Resource limitation drives spatialorganization in microbial groups. ISME J 10:1471–1482. https://doi.org/10.1038/ismej.2015.208.
33. Bomar L, Maltz M, Colston S, Graf J. 2011. Directed culturing of micro-organisms using metatranscriptomics. mBio 2:e00012-11. https://doi.org/10.1128/mBio.00012-11.
34. Nichols D, Cahoon N, Trakhtenberg EM, Pham L, Mehta A, Belanger A,Kanigan T, Lewis K, Epstein SS. 2010. Use of ichip for high-throughput insitu cultivation of “uncultivable” microbial species. Appl Environ Micro-biol 76:2445–2450. https://doi.org/10.1128/AEM.01754-09.
35. Maansson M, Vynne NG, Klitgaard A, Nybo JL, Melchiorsen J, Nguyen DD,Sanchez LM, Ziemert N, Dorrestein PC, Andersen MR, Gram L. 2016. Anintegrated metabolomic and genomic mining workflow to uncover thebiosynthetic potential of bacteria. mSystems 1:e00028-15. https://doi.org/10.1128/mSystems.00028-15.
36. Khandelwal RA, Olivier BG, Röling WFM, Teusink B, Bruggeman FJ. 2013.Community flux balance analysis for microbial consortia at balancedgrowth. PLoS One 8:e64567. https://doi.org/10.1371/journal.pone.0064567.
37. Buckling A, Kassen R, Bell G, Rainey PB. 2000. Disturbance and diversityin experimental microcosms. Nature 408:961–964. https://doi.org/10.1038/35050080.
38. Kassen R, Buckling A, Bell G, Rainey PB. 2000. Diversity peaks at inter-mediate productivity in a laboratory microcosm. Nature 406:508 –512.https://doi.org/10.1038/35020060.
39. Violle C, Pu Z, Jiang L. 2010. Experimental demonstration of the impor-tance of competition under disturbance. Proc Natl Acad Sci U S A107:12925–12929. https://doi.org/10.1073/pnas.1000699107.
40. Peay KG, Belisle M, Fukami T. 2012. Phylogenetic relatedness predictspriority effects in nectar yeast communities. Proc Biol Sci 279:749 –758.https://doi.org/10.1098/rspb.2011.1230.
41. Lenski RE, Rose MR, Simpson SC, Tadler SC. 1991. Long-term experimen-tal evolution in Escherichia coli. I. Adaptation and divergence during. AmNat 138:1315–1341.
42. Jessup CM, Forde SE, Bohannan BJM. 2005. Microbial experimentalsystems in ecology. Adv Ecol Res 37:273–307. https://doi.org/10.1016/S0065-2504(04)37009-1.
43. Jessup CM, Kassen R, Forde SE, Kerr B, Buckling A, Rainey PB, BohannanBJ. 2004. Big questions, small worlds: microbial model systems in ecol-ogy. Trends Ecol Evol 19:189 –197. https://doi.org/10.1016/j.tree.2004.01.008.
44. Untergasser A, Cutcutache I, Koressaar T, Ye J, Faircloth BC, Remm M,Rozen SG. 2012. Primer3—new capabilities and interfaces. Nucleic AcidsRes 40:e115. https://doi.org/10.1093/nar/gks596.
45. Want EJ, Wilson ID, Gika H, Theodoridis G, Plumb RS, Shockcor J, HolmesE, Nicholson JK. 2010. Global metabolic profiling procedures for urineusing UPLC-MS. Nat Protoc 5:1005–1018. https://doi.org/10.1038/nprot.2010.50.
46. Jankevics A, Merlo ME, de Vries M, Vonk RJ, Takano E, Breitling R. 2012.Separating the wheat from the chaff: a prioritisation pipeline for theanalysis of metabolomics datasets. Metabolomics 8:29 –36. https://doi.org/10.1007/s11306-011-0341-0.
47. Xia J, Sinelnikov IV, Han B, Wishart DS. 2015. MetaboAnalyst 3.0 —making metabolomics more meaningful. Nucleic Acids Res 43:W251–W257. https://doi.org/10.1093/nar/gkv380.
48. Dieterle F, Ross A, Schlotterbeck G, Senn H. 2006. Probabilistic quotientnormalization as robust method to account for dilution of complexbiological mixtures. Application in 1H NMR metabonomics. Anal Chem78:4281– 4290. https://doi.org/10.1021/ac051632c.
49. van den Berg RA, Hoefsloot HC, Westerhuis JA, Smilde AK, van der WerfMJ. 2006. Centering, scaling, and transformations: improving the bio-logical information content of metabolomics data. BMC Genomics 7:142.https://doi.org/10.1186/1471-2164-7-142.
50. Anderson MJ. 2001. A new method for non-parametric multivariateanalysis of variance. Aust Ecol 26:32– 46. https://doi.org/10.1046/j.1442-9993.2001.01070.x.
51. Oksanen J, Blanchet FG, Kindt R, Legendre P, Minchin PR, O’Hara RB,Simpson GL, Solymos P, Stevens MHH, Wagner H. 2013. Vegan: commu-nity ecology package. R package version 20-8:254. http://CRAN.Rproject.org/package�vegan.
52. Benjamini Y, Hochberg Y. 1995. Controlling the false discovery rate: apractical and powerful approach to multiple testing. J R Stat Soc B StatMethodol 57:289 –300.
53. Wickham H. 2009, ggplot2: elegant graphics for data analysis. Springer,New York, NY.
54. Gika HG, Macpherson E, Theodoridis GA, Wilson ID. 2008. Evaluation ofthe repeatability of ultra-performance liquid chromatography-TOF-MSfor global metabolic profiling of human urine samples. J Chromatogr BAnalyt Technol Biomed Life Sci 871:299 –305. https://doi.org/10.1016/j.jchromb.2008.05.048.
55. Wells JS, Trejo WH, Principe PA, Bush K, Georgopapadakou N, Bonner DP,Sykes RB. 1982. SQ 26,180, a novel monobactam. I. Taxonomy, fermen-tation and biological properties. J Antibiot 35:184 –188. https://doi.org/10.7164/antibiotics.35.184.
56. Chernin LS, Winson MK, Thompson JM, Haran S, Bycroft BW, Chet I,Williams P, Stewart GS. 1998. Chitinolytic activity in Chromobacteriumviolaceum: substrate analysis and regulation by quorum sensing. JBacteriol 180:4435– 4441.
57. Brett PJ, DeShazer D, Woods DE. 1998. Burkholderia thailandensis sp.
Synthetic Community System for Exometabolite Analysis
November/December 2017 Volume 2 Issue 6 e00129-17 msystems.asm.org 13
on June 20, 2018 by guesthttp://m
systems.asm
.org/D
ownloaded from
nov., a Burkholderia pseudomallei-like species. Int J Syst Bacteriol 48:317–320. https://doi.org/10.1099/00207713-48-1-317.
58. Buell CR, Joardar V, Lindeberg M, Selengut J, Paulsen IT, Gwinn ML,Dodson RJ, Deboy RT, Durkin AS, Kolonay JF, Madupu R, Daugherty S,Brinkac L, Beanan MJ, Haft DH, Nelson WC, Davidsen T, Zafar N, Zhou L,Liu J, Yuan Q, Khouri H, Fedorova N, Tran B, Russell D, Berry K, Utterback
T, Van Aken SE, Feldblyum TV, D’Ascenzo M, Deng WL, Ramos AR, AlfanoJR, Cartinhour S, Chatterjee AK, Delaney TP, Lazarowitz SG, Martin GB,Schneider DJ, Tang X, Bender CL, White O, Fraser CM, Collmer A. 2003.The complete genome sequence of the Arabidopsis and tomato patho-gen Pseudomonas syringae pv. tomato DC3000. Proc Natl Acad SciU S A 100:10181–10186. https://doi.org/10.1073/pnas.1731982100.
Chodkowski and Shade
November/December 2017 Volume 2 Issue 6 e00129-17 msystems.asm.org 14
on June 20, 2018 by guesthttp://m
systems.asm
.org/D
ownloaded from