A Survey of Vernal Pools and the Effects of Climate Change ...
26
A Survey of Vernal Pools and the Effects of Climate Change on Artificially Constructed Vernal Pool Replicates Ben Sasamoto University of Michigan Biological Station Rivers, Lakes, and Wetlands August 18 th , 2010 Dr. Amy Schrank Abstract Vernal pools are important temporary wetlands that support a wide variety of macroinvertebrates and provide safe breeding grounds for amphibians. These pools are precipitation-filled and thus, their hydrology is dependent on precipitation and evaporation; this makes them particularly sensitive to climate. We surveyed three relatively unstudied vernal pools in order to analyze their importance in maintaining high woodland biodiversity and lay baseline data to aid future research. We sampled the chemical and biotic features of the pools. In addition, we studied effects of climate change on vernal pools; this issue is of particular importance given the sensitivity of vernal pools to climate. In order to do this, climate change was simulated on a series of artificially created pools in a mesocosm experiment that assessed algae biomass. We found that climate change did not significantly affect algae biomass. In addition, we analyzed the validity of our mesocosm by comparing the nutrient levels and algae production in our artificial pools to the natural pools we surveyed. Phosphorous levels were found to be significantly higher in the artificial pools and algae biomass was found to be significantly different between the artificial and natural pools. However, the artificial system accurately replicated the biotic community of the natural pools. Our study revealed that algae is resilient and can withstand the predicted effects of climate change. This is of considerable importance to vernal pool communities. I grant the Regents of the University of Michigan the non-exclusive right to retain, reproduce, and distribute my paper, titled in electronic formats and at no cost throughout the world. The University of Michigan may make and keep more than one copy of the Paper for purposes of security, backup, preservation and access, and may migrate the Paper to any medium or format for the purpose of preservation and access in the future. Signed, 1
Transcript of A Survey of Vernal Pools and the Effects of Climate Change ...

A Survey of Vernal Pools and the Effects of Climate Change on Artificially Constructed Vernal Pool Replicates
Ben Sasamoto
University of Michigan Biological Station Rivers, Lakes, and Wetlands
August 18th, 2010 Dr. Amy Schrank
Abstract
Vernal pools are important temporary wetlands that support a wide variety of macroinvertebrates and provide safe breeding grounds for amphibians. These pools are precipitation-filled and thus, their hydrology is dependent on precipitation and evaporation; this makes them particularly sensitive to climate. We surveyed three relatively unstudied vernal pools in order to analyze their importance in maintaining high woodland biodiversity and lay baseline data to aid future research. We sampled the chemical and biotic features of the pools. In addition, we studied effects of climate change on vernal pools; this issue is of particular importance given the sensitivity of vernal pools to climate. In order to do this, climate change was simulated on a series of artificially created pools in a mesocosm experiment that assessed algae biomass. We found that climate change did not significantly affect algae biomass. In addition, we analyzed the validity of our mesocosm by comparing the nutrient levels and algae production in our artificial pools to the natural pools we surveyed. Phosphorous levels were found to be significantly higher in the artificial pools and algae biomass was found to be significantly different between the artificial and natural pools. However, the artificial system accurately replicated the biotic community of the natural pools. Our study revealed that algae is resilient and can withstand the predicted effects of climate change. This is of considerable importance to vernal pool communities.
I grant the Regents of the University of Michigan the non-exclusive right to retain, reproduce, and distribute my paper, titled in electronic formats and at no cost throughout the world. The University of Michigan may make and keep more than one copy of the Paper for purposes of security, backup, preservation and access, and may migrate the Paper to any medium or format for the purpose of preservation and access in the future. Signed,
1

Introduction
Vernal pools are important and unique depressional wetland habitats that are distributed
widely across the United States. Vernal pools are precipitation-filled and are defined by seasonal
periods of drying out; because of this, they are often referred to as ephemeral pools (EPA, 2001).
The hydrologic regime of these pools is governed by the balance between precipitation rates and
evaporation rates (Keeley, 1998). As a result, the amount of water found in a pool is heavily
dependent on weather and can fluctuate dramatically from year-to-year (Bauder, 2005). These
pools serve an important role in ecosystems and contribute significantly to biodiversity. Because
they are subject to seasonal drying, vernal pools cannot maintain permanent fish communities
(Brooks, 2009). This makes them ideal habitats for macroinvertebrates and important breeding
grounds for many amphibians, such as salamanders and frogs (Oscarson & Calhoun, 2007);
many of which are obligate vernal pool species. This is particularly significant given the global
decline in amphibian populations that has been widely observed (Blaustein & Wake, 1995). In
addition, vernal pools can support diverse and unique plant communities; for example, vernal
pools in California are home to several unique and endemic plant species (Collinge & Ray,
2009).
Because precipitation and evaporation are crucial to the hydrology of vernal pools, they are
extremely sensitive to climate (Pyke, 2005). Unfortunately, as the 21st century progresses global
climate patterns will be dramatically altered by climate change (IPCC, 2007). Given their
sensitivity to climate, vernal pools are likely to be an early victim to the effects of climate
change. In fact, because of this sensitivity, it has been proposed that they be used as indicator
systems for climate change (Graham, 1997). Current climate change models predict that
worldwide temperatures will rise considerably in the upcoming century, while precipitation
2
events will become more variable. This will undoubtedly affect regional evaporation and
precipitation rates and thus, alter the hydrological conditions of vernal pools. These climatic
alterations will likely result in more frequent and longer periods of drying out in vernal pools
(Brooks, 2009). It is evident that this will have a profound influence on the ecology of these
systems. Because of the important role these pools play in ecosystems worldwide, it is crucial to
understand how they will be impacted by climate change. Unfortunately, few studies have
directly assessed this (Brooks, 2009). Similarly, it is uncertain how the species that inhabit and
utilize vernal pools will be affected by the projected changes to their hydrology (Graham, 1997).
However, some studies predict that climate change will shorten the hydroperiod of vernal pools
and as a result increase the frequency of reproductive failures by amphibians (Brooks, 2004).
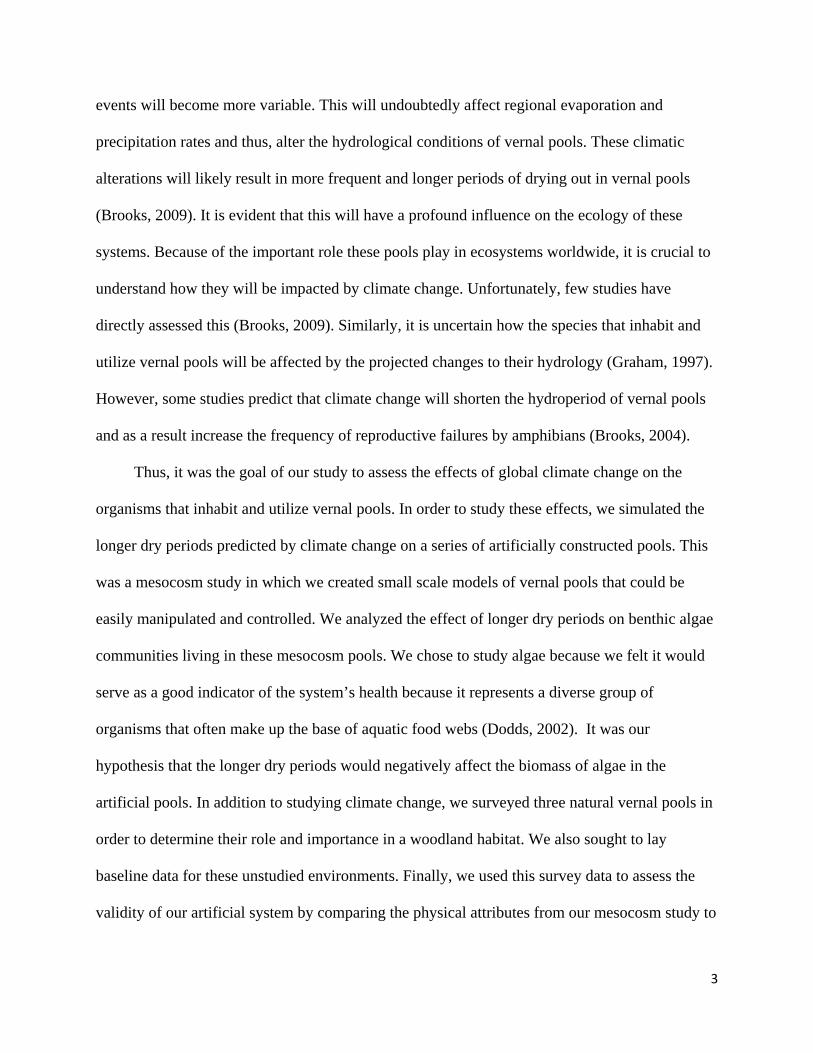
Thus, it was the goal of our study to assess the effects of global climate change on the
organisms that inhabit and utilize vernal pools. In order to study these effects, we simulated the
longer dry periods predicted by climate change on a series of artificially constructed pools. This
was a mesocosm study in which we created small scale models of vernal pools that could be
easily manipulated and controlled. We analyzed the effect of longer dry periods on benthic algae
communities living in these mesocosm pools. We chose to study algae because we felt it would
serve as a good indicator of the system’s health because it represents a diverse group of
organisms that often make up the base of aquatic food webs (Dodds, 2002). It was our
hypothesis that the longer dry periods would negatively affect the biomass of algae in the
artificial pools. In addition to studying climate change, we surveyed three natural vernal pools in
order to determine their role and importance in a woodland habitat. We also sought to lay
baseline data for these unstudied environments. Finally, we used this survey data to assess the
validity of our artificial system by comparing the physical attributes from our mesocosm study to
3

the characteristics of the natural vernal pools. This was done in order to determine if our artificial
pools were accurate representations of vernal pools and whether or not our results could be
extrapolated to natural pools. We conducted this part of our research as a case study of the value
of mesocosm experiments, which have been widely criticized for not reflecting reality and being
too simplistic (Schindler, 1998). We suggest that mesocosm studies are useful and can enhance
our understanding of the natural world.
Methods
1) Survey of Natural Pools
We began our study by taking the physical measurements of three natural vernal pools
located in a wooded area near grapevine point of the University of Michigan Biological Station
(UMBS) in Cheboygan County, Michigan, USA (Figure 1; Appendix). Using a tape measure, we
measured the maximum length and width of each pool. We then measured the maximum depth
of each pool using a meter stick; we measured from the surface of the water to the top of the leaf
litter deposited at the bottom of each pool in order to attain these values. In addition, we
calculated an average depth of the pools by taking ten depth measurements across the width of
each pool and averaging these values. Our second pool, “site 2”, was actually part of a large
complex of pools that had partially dried up. We decided to treat a smaller subsection of this
complex as an individual pool.
We collected one 125 mL sample of water from each natural pool and analyzed them for
total phosphorous (TP), phosphate (PO4), nitrate (NO3), ammonium (NH4), and total nitrogen
(TN) content. In addition, we collected 1 liter samples of water from each pool in order to
determine their alkalinity. We then measured the surface irradiance of each pool using a
photometer. These measurements were taken on a sunny day at 9:00AM, 1:00PM, and 4:30PM.
4

In order to measure each ephemeral pool’s pH, conductivity, and dissolved oxygen (DO) levels
we used a Fisher Scientific accument portable AP10 pH meter, a YSI Incorporated conductivity
meter, and a dissolved oxygen meter.
Finally, we examined the biota of each vernal pool. Using a dip net, we collected
macroinvertebrate samples from the pools. This was done quantitatively by dip netting the length
of one meter; this was done twice in each pool, once along the shallow edge and once at the
center, these samples were pooled together. We repeated this process twice. We surveyed each
pool for amphibians by turning over every significant log or piece of woody debris within 5
meters of the edge of each pool. Every amphibian spotted was identified and recorded. We also
caught several larval amphibians in our macroinvertebrates samples; these were recorded and
then released.
2) Simulating the Effects of Climate Change
In order to simulate the effects of climate change on vernal pools we conducted a
mesocosm experiment. Sixteen artificial vernal pools were created in a wooded area on UMBS
grounds. The sites of these artificial pools were located within close proximity of each other and
were chosen because they were already naturally depressed; however some of these depressions
had to be artificially deepened or widened. Impermeable tarps were placed in the natural
depressions to create the pools. These pools were then completely filled in with well water. The
sizes of the vernal pools were not uniform but each was approximately less than or equal to one
meter in length and width. The pools were all shallow (less than a half meter) and relatively
similar in depth. After the pools were created, they were seeded with leaf litter extracted from the
natural vernal pools we surveyed.
5

Two tiles were placed in all sixteen artificial pools for benthic algae to colonize. Using this
algae as an indicator of the productivity of the vernal pools, we studied the effect of the longer
periods of dryness predicted by climate change models on the artificial pools. To simulate the
dry periods vernal pools experience, all of our artificial pools were drained and completely dried
out on two occasions. However eight pools, chosen as our experimental group, were subject to a
longer period of dryness in accordance with climate change predictions. The experimental group
was twice left completely dry for periods of five days, while the control group was only
completely dry for one day periods. The pools were dried using a kayak pump. In order to make
sure leaf litter and organisms were not pumped out with the water, a fine meshed net was used to
filter the water. The water was pumped into a bucket and then dumped away from the site. This
“dry down” was conducted in stages, with half of the water being pumped in one day and the
remaining water being removed one to three days later. This staggering of dry down was meant
to simulate natural evaporation, which is a gradual process that does not occur in one instance.
In order to assess the biomass of the algae in our artificial pools, we measured the
chlorophyll-a content on our tiles on two occasions. The first tiles were removed after the first
“dry down” period, two weeks after they were placed, and the second tiles were removed after
the second “dry down” period, four weeks after they had been placed. There was a two week
period in between the first and second sampling. Once the tiles were removed, we scraped their
surfaces clean and then collected and concentrated the scraped material on filter paper, which
was analyzed in the UMBS chemistry lab for chlorophyll-a. The chlorophyll-a results of the
experimental pools were compared with the results from the control pools using a t-test. We used
an F-test to see if variances were significantly different and used this to choose the appropriate t-
test. The t-test helped determine if the longer dry periods had a significant effect on the biomass
6

of algae in the vernal pools. In addition, we placed one tile in each of our natural pools and
sampled them for chlorophyll-a two weeks after they were placed. We compared algal biomass
after two weeks of colonization in the natural pools with the control treatment artificial pools.
3) Testing the Accuracy of our Mesocosm Study
We took samples of water from the artificial vernal pools in order to assess nutrient levels
for PO4, NO3, NH4, and TP. We then took this nutrient data, along with our chlorophyll-a results
from the artificial pools, and compared them to data from the natural pools. In order to do this,
we took mean nutrient and chlorophyll-a values for the control artificial pools and compared
them to the mean nutrient and chlorophyll-a values of the natural pools. We used an F-test to see
if the variances were significantly different and then compared the differences in means using the
appropriate t-test. These data helped to assess the validity of our artificial system. This was done
to help determine if our simulated climate change results could be safely extrapolated to natural
habitats.
Results
1) Survey Results
Pool 1 was considerably larger than the other two pools and had the biggest width, length,
perimeter, and depth. Pools 2 and 3 were nearly the same size in terms of width, length, and
perimeter; however, pool 2 was much shallower than the other pools, which were relatively
similar in depth (Table 1).
Table 1 Max. Width (m)
Max. Length (m)
Perimeter (m)
Mean Depth (cm)
Max. Depth (m)
Pool 1 8.8 21.1 57.2 34.2 40.0
Pool 2 6.0 7.3 23.6 8.1 14.0
Pool 3 5.9 7.2 22.4 27.0 36.0Table 1: Pool 1 is the largest, Pool 2 & 3 are similar in size and pool 2 is the shallowest.
7

Conductivity ranged from 242.1 uS to 285.9 uS and was highest in pool 1. Pools 2 & 3
were relatively similar in terms of conductivity (Figure 2).
Our pH results show that all three pools were nearly neutral (Figure 3). Pool 3 had the
highest pH but all three pools were similar and only ranged from 6.85 (pool 1) to 7.84 (pool 3).
220
240
260
280
300
1 2 3
Cond
uctivity(uS)
Pool
Figure 2
Figure 2: Conductivity ranged from 242.1 uS to 285.9 uS with pool 1 having the highest value.
6.4
6.6
6.8
7
7.2
7.4
7.6
1 2 3
pH
Pool
Figure 3
Figure 3: pH was the highest in pool 3 and lowest in pool 1; however, all pools were nearly basic.
Unlike pH, our DO measurements were quite varied among the three pools. Pool 2’s
dissolved oxygen measurements were considerably lower than the other pools, with a
8

measurement of 0.8 mg/l. Pool 1 had a DO reading of 2.73 mg/l, while pool 3 had the highest
levels of oxygen at 4.03 mg/l (Figure 4).
00.51
1.52
2.53
3.54
4.5
1 2 3
Dissolved
Oxygen (m
g/l)
Pool
Figure 4
Figure 4: DO was quite varied among the pools; pool 3 had the highest reading at 4.03 mg/l, while pool 2 had the lowest at 0.8 mg/l.
Alkalinity was comparable across all pools, with only a 7 mg CaCO3/L difference
between the least and most alkaline pool (Table 2). Values ranged from 160.5 mg CaCO3/L
(pool 2) to 167.5 mg CaCO3/L (pool 3). Our nutrient sampling results showed that there was
some variability in nutrient content for our survey pools (Table 2). Phosphate was found in a
lower quantity in pool 1 than the rest of the pools, which had similar results. Total phosphorous,
however, was similar across all pools. All three pools demonstrated low levels of nitrate.
Ammonium was less prevalent in pool 2 than in pools 1 and 3, which had comparable amounts.
Total nitrogen levels were about twice as high in pool 3 compared to the other two pools, which
had fairly similar amounts. However, these values only ranged from 0.44 mg N/L in pool 2 to
1.176 mg N/L in pool 1. Benthic algae biomass was the lowest in pool 1 and the highest in pool
2, however the range was small (.017 - .05 ug Chl-a/L). Unfortunately, we did not attain a
9

benthic algae biomass for pool 3. To collect these samples we scraped our colonized tiles and
concentrated the scraped material on filter paper. However, the water we used to concentrate the
algae was taken from the pools themselves; this included phytoplankton in the sample. To
correct this mistake, we took a phytoplankton sample and used this value and the flawed benthic
algae sample to calculate a true sample of benthic algae biomass. For site 3, the phytoplankton
sample was much higher than our original benthic sample; as a result we were presented with a
negative biomass, we did not include this in our data.
Table 2 Benthic Algae
Site TP TN PO4‐P NO3‐N NH4‐N Alkalinity Biomass
ug P/L
mg N/L ug P/L ug N/L ug N/L
mg CaCO3/L ug Chl‐a/L
Pool 1 67.7 1.176 9.2 5.2 74.5 167.5 0.017
Pool 2 65.6 0.44 31.6 1.6 23 160.5 0.05 Pool 3 78.4 0.56 45.1 4.1 89 164.3 NA
Table 2: Nutrient and alkalinity results from our sampling the water chemistry of each pool showed variable levels.
Our photometer data shows that surface irradiance varied through the day at each pool,
with the most light reaching each pool in the late afternoon (Figure 5). At both pool 1 and pool 3
the amount light received increases throughout the day, with the lowest readings at 9:00AM and
the highest at 4:00PM. Pool 2, however, has a higher surface irradiance at 1:00PM than at
9:00AM. In general, pool 1 had the highest surface irradiance while pool 3 had the lowest.
0
100
200
300
400
500
600
1 2 3Surface Irradian
ce (u
mol)
Pool
Figure 59:00 AM
1:00 PM
5:00 PM
Average
10

Figure 5: The light received at each pool varied throughout the day; however, on average pool 1 received the most.
Chironomidae and Lymnadeidae were the most abundant macroinvertebrate families in
the three pools (Table 3; Figure 6). Sphaeriidae were found in relatively high abundance in pool
1 and pool 2, but they were surprisingly absent from pool 3. Other macroinvertebrates found in
more than one pool were Hydrophilidae (pools 1 & 2) and Limnephilidae (pools 2 & 3);
however, these invertebrates were present in relatively low quantities. Several amphibians were
also inadvertently captured in our macroinvertebrate sampling. Two tadpoles and two larval
salamanders were found in pool 1 and two tadpoles were found in pool 2; these amphibians were
released upon capture. Overall, pool 2’s CPUE was much higher than the other sites, which had
similar CPUEs (Figure 7).
Table 3
Pool 1 Avg. Abundance
Pool 1 Std. Dev.
Pool 2 Avg. Abundance
Pool 2 Std. Dev.
Pool 3 Avg. Abundance
Pool 3 Std. Dev.
Megaloptera ‐ Corydalidae 0.50 0.71 0.00 0.00 0.00 0.00Gastropoda ‐ Lymnadeidae 5.50 0.71 21.50 21.92 10.50 6.36Sphaeriidae 7.50 3.54 15.50 4.95 0.00 0.00Diptera ‐ Chironomidae 2.50 2.12 23.50 33.23 4.00 2.83Coleoptera ‐ hydrophilidae 1.00 1.41 1.00 1.41 0.00 0.00Adult Beetle 0.50 0.71 0.00 0.00 0.00 0.00Trichoptera ‐ Limnephilidae 0.00 0.00 0.50 0.71 0.50 0.71
Acari ‐ Hydrachnidia 0.00 0.00 0.00 0.00 0.50 0.71
Table 3: Our macroinvertebrate sampling showed high average abundances for gastropods and diptera among all pools; in pools 1 and 2 Sphaeriidae were also abundant.
11

0
2
4
6
8
10
12
14Figure 6
Site 1
Site 2
Site 3
Figure 6: The catch per unit effort for each macroinvertebrate sampled in all pools shows the high abundance of Lymnadeidae, Chironomidae, and Sphaeriidae (only in pools 1 and 2).
0
5
10
15
20
25
30
35
1 2 3
CPUE
Figure 7
Pool
Figure 7: The CPUE data reveals pool 2 to have the highest abundances of macroinvertebrates.
12
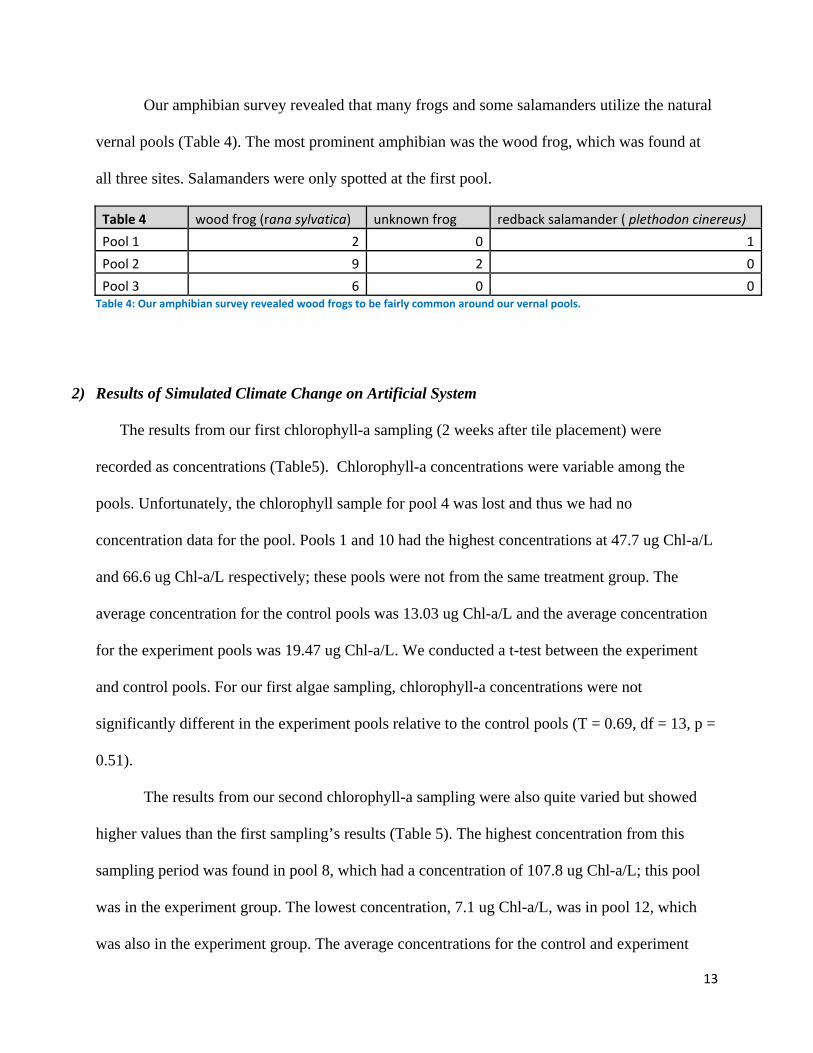
Our amphibian survey revealed that many frogs and some salamanders utilize the natural
vernal pools (Table 4). The most prominent amphibian was the wood frog, which was found at
all three sites. Salamanders were only spotted at the first pool.
Table 4 wood frog (rana sylvatica) unknown frog redback salamander ( plethodon cinereus)
Pool 1 2 0 1
Pool 2 9 2 0
Pool 3 6 0 0Table 4: Our amphibian survey revealed wood frogs to be fairly common around our vernal pools.
2) Results of Simulated Climate Change on Artificial System
The results from our first chlorophyll-a sampling (2 weeks after tile placement) were
recorded as concentrations (Table5). Chlorophyll-a concentrations were variable among the
pools. Unfortunately, the chlorophyll sample for pool 4 was lost and thus we had no
concentration data for the pool. Pools 1 and 10 had the highest concentrations at 47.7 ug Chl-a/L
and 66.6 ug Chl-a/L respectively; these pools were not from the same treatment group. The
average concentration for the control pools was 13.03 ug Chl-a/L and the average concentration
for the experiment pools was 19.47 ug Chl-a/L. We conducted a t-test between the experiment
and control pools. For our first algae sampling, chlorophyll-a concentrations were not
significantly different in the experiment pools relative to the control pools (T = 0.69, df = 13, p =
0.51).
The results from our second chlorophyll-a sampling were also quite varied but showed
higher values than the first sampling’s results (Table 5). The highest concentration from this
sampling period was found in pool 8, which had a concentration of 107.8 ug Chl-a/L; this pool
was in the experiment group. The lowest concentration, 7.1 ug Chl-a/L, was in pool 12, which
was also in the experiment group. The average concentrations for the control and experiment
13

pools were 29.58 ug Chl-a/L and 37.51 ug Chl-a/L respectively. Again we used a t-test to
analyze these results. For our second algae sampling, chlorophyll-a concentration was not
significantly different between the experiment and control pools (T = -0.51, df = 14, p = 0.62).
Table 5
Chl‐a Avg. #1 Chl‐a Avg. #2 Treatment group ug Chl‐a/L Std. Dev. ug Chl‐a/L
Std. Dev.
Control 13.03 15.10 29.58 26.89
Experiment 19.47 21.45 37.51 35.40Table 5: Chl‐a concentrations were quite variable among all pools and not significantly different between treatment groups.
3) Comparison of Natural Pools to Artificial Pools
We used chlorophyll-a and nutrients to assess the validity of our artificial system. In
doing so, we only used results from the control artificial pools, since the experimental pools had
undergone manipulation and were not meant to reflect current conditions.
The nutrient levels found in our artificial control pools were much higher than those
found in the natural pools (Table 6). There was also much variance between samples. We
analyzed this perceived difference using a t-test; an f-test was used to determine which t-test to
use.
Table 6 TP (Std. Dev.) PO4 (Std. Dev.) NO3 (Std. Dev.) NH4 (Std. Dev.)
Site ug P/L ug P/L ug N/L ug N/L Artificial Average 631.5 (379.45) 545.6 (373.42) 30.6 (32.50) 2342.0 (3253.43)
Natural Average 70.6 (6.86) 28.6 (18.13) 3.6 (1.84) 164.1 (34.69) Table 6: The mean nutrient values in the artificial pools versus the natural pools show a huge difference in nutrient content.
For total phosphorous, variances were significantly different (p < 0.001). TP was
significantly higher in the artificial pools relative to the natural pools (T = -3.51, df = 7, p =
0.009; Table 7)
14

Phosphate variances were also significantly different (p = 0.001). P04 was significantly
higher among the artificial pools relative to the natural pools (T = -3.096, df = 7, p = 0.017;
Table 7)
Nitrate also had variances that were significantly different (p = 0.002). However, NO3
values were not significantly different in the artificial pools in comparison to the natural pools (T
= -1.808, df = 7, p = 0.114; Table 7). This is likely the result of the extreme variation in nitrate
levels found among the artificial pools (Table 6).
Ammonium had variances that were significantly different (p < 0.001). Like NO3, NH4
was not significantly different in the artificial pools relative to the natural pools (T = -1.399, df =
7, p = 0.205; Table 7) Again, I believe this to be the result of extremely high variation among
samples (Table 6).
Table 7 Nutrient P‐value
Significantly Different?
TP 0.01 Yes PO4‐P 0.02 Yes NO3‐N 0.11 No NH4 0.20 No
Table 7: Summary of t‐test results
In the same way that we compared nutrients between the artificial control pools and
natural pools, we analyzed chlorophyll-a for benthic algae (Table 8). Both of these were samples
were taken after two weeks of colonization. Average biomass was higher in the natural pools
relative to the artificial pools; however, both means were relatively small. A t-test was used to
help determine if this apparent difference was significant. In order to perform this t-test, we
converted the algae concentrations from our control pools into ug Chl-a/cm2. Benthic algae
biomass, after two weeks of growth, was significantly higher in the natural pools relative to the
15

control artificial pools (T = 2.56, df = 7, p = 0.04). However, it should be noted that sample sizes
were quite small; this could have influenced the t-test.
Table 8
Natural Pools Artificial Control Pools
Chl‐a (ug/cm2) avg. Std. Dev. Chl‐a (ug/cm2) avg. Std. Dev.
0.04100 0.03394 0.01693 0.00869Table 8: Benthic algae biomass was higher in the natural pools than in the experimental pools.
Discussion
Our study had three major objectives: 1) to survey three natural vernal pools in order to
collect baseline data for future studies and assess their importance in woodland ecosystems, 2)
To study the predicted effects of climate change on algae biomass in vernal pools via a
mesocosm study involving artificially constructed pools, and 3) to analyze the validity of our
constructed vernal pools by comparing them to natural pools. Through our survey of the natural
vernal pools we were able to collect useful data and confirm the pivotal role vernal pools play as
a woodland habitat. Our mesocosm study on climate change revealed that algae biomass was not
significantly affected by longer dry down periods. Finally, our analysis of the validity of our
mesocosm pools revealed that nutrient levels and algae production were significantly different
between our constructed pools and natural pools.
1) Survey of Natural Pools
Our survey of three natural vernal pools was successful in that we were able to establish
baseline data for a relatively unstudied habitat near UMBS. Our physical survey of the pools
demonstrates the variation in size that exists among vernal pools. For example, pool 1 was much
larger than the other pools, while pool 2 was much shallower. The results from our chemical
16

sampling of the pools (conductivity, pH, alkalinity, and DO) reveal that they tend to have similar
chemical conditions as conductivity, pH, and alkalinity were relatively alike. Our pH and
conductivity measurements are similar to those found in vernal pools in Oklahoma (Boeckman &
Bidwell, 2007). Dissolved oxygen was quite different between pools; this suggests that some
variation can exist among the chemical conditions found in vernal pools. This range in DO is
consistent with findings in vernal pools in Mississippi (Bonner et al., 1997). In particular, pool 2
had low dissolved oxygen content. Based on our high CPUE of macroinvertebrates at this pool,
it seems this may be the result of respiration by a high numbers of organism (Dodds, 2002).
Nutrient content was also not the same in every pool with the exception of total phosphorous.
This solidifies the fact that vernal pools, even when in close proximity, can have very different
abiotic features. Given the temporary nature of these systems and the fact that they are relatively
small, it is likely that many of these abiotic features will change from year-to-year. It will be
interesting to see how they do and what effects these changes might have on the biotic make up
of the pool. Hopefully, this survey data will be of aid in studying these topics further.
Our biotic sampling of the vernal pools demonstrated the importance of these habitats.
The pools supported a macroinvertebrate community that prominently featured Chironomidae,
Lymnaeidae, and Sphaeriidae and included beetles and caddisflies. The discovery of
Chironomidae, beetles, and caddisflies is consistent with findings by Williams (1996), who noted
the common occurrence of these organisms in temporary pools. We also observed the exuvia of
many dragonflies (Odonata) around our pools. Dragonflies are also noted by Williams as a
species that often inhabits temporary pools. In addition, these findings confirm previous studies
that assert that vernal pools are an important macroinvertebrate habitat (Oscarson & Calhoun,
2007; Brooks, 2009).
17

Our results also confirmed the important status vernal pools play in regards to amphibian
populations. At each pool, we observed at least a few amphibians. The most prevalent amphibian
was the wood frog, whose presence in vernal pools has been noted elsewhere (EPA, 2001). This
is logical, as wood frogs breed in vernal pools (Homan, 2004). One redback salamander was also
sighted. In addition to the amphibians identified during our amphibian survey, two young
salamanders and four tadpoles were inadvertently captured in our macroinvertebrate sampling.
This further indicates the importance of these vernal pools as amphibian breeding grounds
(Brooks, 2009). Thus, our biotic sampling confirmed that vernal pools are important harbors of
biodiversity that support a varied macroinvertbrate community and offer safe breeding grounds
to amphibians.
2) Effects of Climate Change
The results from both of our algae samplings in our artificial pools indicate that the longer
dry down periods experienced by the experiment pools had no significant effect on algae
biomass. It appears that the five day dry periods were too short to significantly impact the algae
communities; they were too resilient. Thus the hypothesis that algae biomass would be
negatively influenced by longer dry periods was not supported by our study. This is in line with
findings from other studies which note the quick recovery time of algae after disturbances. For
example, benthic algae have been known to recover rapidly following disturbance by spates in
streams (Peterson et al., 1994). As a result of our study and the noted resilience of algae, we
believe that algal communities in vernal pools will be able to withstand more frequent periods of
dryness of considerable duration. However, even longer dry periods could significantly inhibit
the growth of algae; this remains understudied.
18
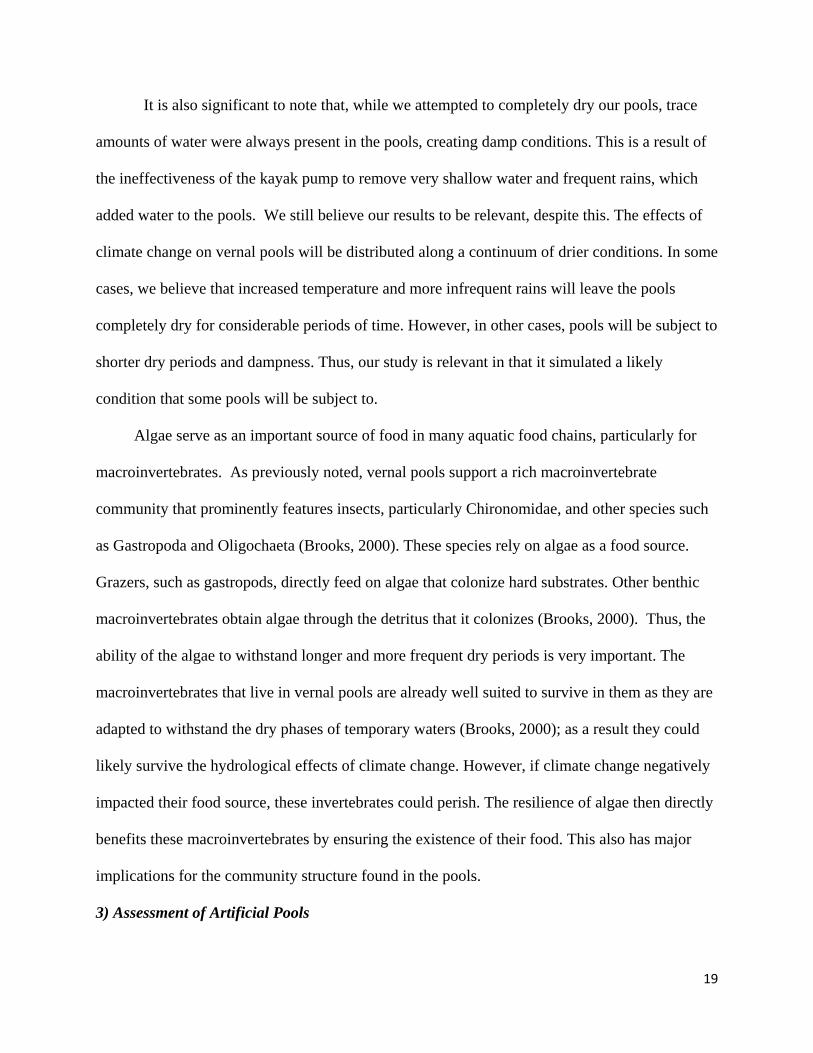
It is also significant to note that, while we attempted to completely dry our pools, trace
amounts of water were always present in the pools, creating damp conditions. This is a result of
the ineffectiveness of the kayak pump to remove very shallow water and frequent rains, which
added water to the pools. We still believe our results to be relevant, despite this. The effects of
climate change on vernal pools will be distributed along a continuum of drier conditions. In some
cases, we believe that increased temperature and more infrequent rains will leave the pools
completely dry for considerable periods of time. However, in other cases, pools will be subject to
shorter dry periods and dampness. Thus, our study is relevant in that it simulated a likely
condition that some pools will be subject to.
Algae serve as an important source of food in many aquatic food chains, particularly for
macroinvertebrates. As previously noted, vernal pools support a rich macroinvertebrate
community that prominently features insects, particularly Chironomidae, and other species such
as Gastropoda and Oligochaeta (Brooks, 2000). These species rely on algae as a food source.
Grazers, such as gastropods, directly feed on algae that colonize hard substrates. Other benthic
macroinvertebrates obtain algae through the detritus that it colonizes (Brooks, 2000). Thus, the
ability of the algae to withstand longer and more frequent dry periods is very important. The
macroinvertebrates that live in vernal pools are already well suited to survive in them as they are
adapted to withstand the dry phases of temporary waters (Brooks, 2000); as a result they could
likely survive the hydrological effects of climate change. However, if climate change negatively
impacted their food source, these invertebrates could perish. The resilience of algae then directly
benefits these macroinvertebrates by ensuring the existence of their food. This also has major
implications for the community structure found in the pools.
3) Assessment of Artificial Pools
19

The results from our nutrient t-tests between the constructed pools and the natural pools
indicate that the artificial pools do not reflect the real nutrient conditions of vernal pools.
Phosphorous (both TP and PO4) was shown to be significantly different. Nitrate and ammonium
levels also appear to be different in the natural pools relative to the artificial pools however, this
was not proven statistically. This is likely the result of the large variances between samples in
both the natural and artificial pools; it appears as if they are actually different (Table, 6). This
means that our artificial pools do not replicate natural nutrient conditions. This is obvious even
without the statistical comparison as the high level of nutrients found in our artificial system are
not consistent with other studies of natural vernal pools, which note nutrient levels that are much
lower (Keeley, 1998). However, among our mesocosm pools, nutrient levels were not
significantly different between the control and experimental pools (Sasamoto, 2010). Thus, while
increased nutrients may have altered biomass, it should not have impacted the resilience of the
algae as both treatment groups were exposed to the same conditions. This allows us to
extrapolate our climate change findings to natural pools, despite our failure to perfectly replicate
natural conditions.
Chlorophyll-a levels were also shown to be significantly different between our
constructed pools and the natural pools; algae biomass was greater in the natural pools. This is
counter-intuitive, given the high nutrient levels found in the artificial pools. Generally, algae
biomass is increased in the presence of nutrients. For example in lakes, it has been shown that
much of the variation found in periphyton biomass is explained by nutrient availability (Hansson,
1992). However, we speculate that the amount of light received by the natural pools could
explain their higher biomasses. The natural pools are located near the shore of Douglas Lake
where tree canopy cover is less dense relative to the site of the artificial pools; this increased
20

exposure to light might have increased algae growth. Light is prominent among the abiotic
factors that limit primary production (Hill et al., 1995); this may have occurred in our artificial
pools.
The significant differences in regards to nutrient levels and algae biomass between the
artificial pools and the natural pools indicate that our mesocosm study did not completely reflect
reality. In terms of other mesocosms, which are enclosed, outdoor experiments that are, in scale,
somewhere between laboratory experiments and large real-world studies (Odum, 1984), lack of
correspondence between artificial and natural systems is not uncommon. Many studies of similar
setup are often too simple or too short in duration to produce accurate results. In fact, they are
often criticized for creating inaccurate results or results that may lead to poor management
decisions (Schindler, 1998). However, these studies also provide a wealth of benefits to
ecologists. For example, they are easy to control, replicate, and repeat in ways that larger, whole
ecosystems studies can never be (Petersen & Englund, 2005). Thus, there is a large debate
among ecologists as to what value these experiments have.
We do not think our mesocosm study was a failure by any means, despite our inability to
replicate the chemical features of natural vernal pools. In fact, though we did not quantitatively
measure it, we believe we successfully replicated the biota found in vernal pools in our
mesocosm pools. For example, during the sampling of our artificial pools, we noted the presence
of several wood frogs. In addition, leaf litter in the artificial pools was reported to have been
colonized by Sphaeriidae in some cases and we also saw many Chironomidaes. Even if the
constructed pools are not chemically equivalent to the natural systems, they still support a similar
biotic community. Thus, while should hesitate to extrapolate our climate change findings to
natural pools because of the chemical differences, we believe that because the artificial pools had
21

been colonized by the appropriate species that they may replicate reality in other, unstudied,
ways. More research must be done in order to determine what other ways these constructed pools
are similar or different to natural vernal pools. Though our study was not able to replicate the
conditions found in vernal pools, other studies have been able to successfully replicate these
systems (Rogers, 1998). In addition, mesocosms in other experiments have also successfully
replicated natural conditions. For example, mesocosm stream channels have been shown to
resemble natural conditions in terms of macroinvertebrate populations (Harris et al., 2007). The
success of other mesocosm studies in producing natural conditions and our own biotic
observations lead us to believe that accurate vernal pools can be constructed. As a result of this,
we believe that mesocosm studies in general provide a good research opportunity and are of
great value to ecologists, however, they must carefully designed in order to be of use (Petersen &
Englund, 2005). Our mesocosm study confirms this conclusion by replicating the biotic
conditions of vernal pools; however, it also highlights the need for careful design and
construction, as it did not replicate chemical conditions found in nature.
Conclusion
In conclusion, our study has demonstrated the resilience of algae to the increased dry
down periods predicted by climate change. This resilience ensures that the base of vernal pool
food chains will remain intact under climate change conditions; this is extremely important to the
stability of the biotic communities found in these habitats. However, we must be cautious in
extrapolating these results to real world pools, as the water chemistry found in our constructed
pools was significantly different than those found in natural pools. However, we believe that
because these chemical factors were held constant between our artificial control pools and our
artificial experiment pools, we can extrapolate our finds pertaining to hydrological changes; thus,
22

with some confidence, we can say that algae can likely survive drier conditions. In addition to
studying the effects of climate change, we have confirmed the pivotal role vernal pools play in
woodland habitats through our survey of three natural pools. These pools maintain high levels of
macroinvertebrate diversity and provide breeding grounds to amphibians, such as the wood frog.
It is our hope that the survey data we have collected will be useful to future research on these
particular vernal pools. There is much room for future studies. We studied the effects of sudden
onset dry periods that could occur as a result of climate change. However, other conditions are
possible. In particular, it is predicted that climate change will shorten the length of inundation
annually in vernal pools; this would have significant impacts on amphibian populations and
would likely result in higher reproductive failure (Brooks, 2004). We feel that an effective way
to study vernal pools is through mesocosm experiments. Our own mesocosm experiment was
able to reflect some degree of reality; however, it also had many inaccuracies. We believe that
with careful design, our model can be improved upon and used in further vernal pool research.
23

Appendix:
24

Works Cited:
Bauder, E. 2005. The Effects of an Unpredictable Precipitation Regime on Vernal Pool Hydrology. Freshwater Biology 50: 2129-2135
Blaustein, A.R., and Wake, D.B. 1995. The puzzle of declining amphibian populations. Scientific American. 272:52-57
Boeckman, C., Bidwell, J. 2007. Spatial and Seasonal Variability in Water Quality Characteristics of an Ephemeral Wetland. Oklahoma Academy of Science.
Bonner, L., Diehl, W., Altig, R. 1997. Physical, Chemical, and Biological Dynamics of Five Temporary Dystrophic Forest Pools in Central Mississippi. Hydrobiologia 353: 77-89
Brooks, R. 2000. Annual and Seasonal Variation and the Effects of Hydroperiod on Benthic Macroinvertebrates of Seasonal Forest ("Vernal") Ponds in Central Massachusetts, USA. Wetlands 20: 707-715.
Brooks, R. 2004. Weather-Related Effects on Woodland Vernal Pool Hydrology and Hydroperiod. Wetlands 24: 104-114
Brooks, R. 2009. Potential Impacts of Global Climate Change on the Hydrology and Ecology of Ephemeral Freshwater Systems of the Forests of the Northeastern United States. Climactic Change 95: 469-483
Collinge, S. K., and Ray, C. 2009. Transient Patterns in the Assembly of Vernal Pool Plant Communities . Ecology, 3313 - 3323.
Graham, T., USGS. 1997. Climate Change and Ephemeral Pool Ecosystems: Potholes and Vernal Pools as Potential Indicator Systems. U.S. Geological Service.
< http://geochange.er.usgs.gov/sw/impacts/biology/vernal/>
Hansson, L.A. 1992. Factors Regulating Periphytic Algal Biomass. Limnology and Oceanography 37: 322-328
Harris, R., Armitage, P., Milner, A., Ledger, M. 2007. Replicability of Physicochemistry and Macroinvertebrate Assemblages in Stream Mesocosms: Implications for Experimental Research. Freshwater Biology 52: 2434-2443
Hill, W., Ryon, M., Schilling, E. 1995. Light Limitation in a Stream Ecosystem: Responses by Primary Producers and Consumers. Ecology 76:1297-1309.
Homan, R., Windmiller, B., and Reed, J. 2004. Critical Thresholds Associated with Habitat Loss for Two Vernal Pool-Breeding Amphibians Ecological Applications14: 1547-1553
IPCC, 2007: Summary for Policymakers. In: Climate Change 2007: The Physical Science Basis. Contribution of Working Group I to the Fourth Assessment Report of the Intergovernmental Panel on Climate Change [Solomon, S., D. Qin, M. Manning, Z.
25

26
Chen, M. Marquis, K.B. Averyt, M.Tignor and H.L. Miller (eds.)]. Cambridge University Press, Cambridge, United Kingdom and New York, NY, USA.
Keeley, J., and Zedler, P. 1998. Characterization and Global Distribution of Vernal Pools. Ecology, Conservation, and Management of Vernal Pool Ecosystems – Proceedings from a 1996 Conference. California Native Plant Society, Sacramento, CA.
Odum, E. 1984. The Mesocosm. BioScience 34: 558-562
Oscarson, D. B., & Calhoun, A. 2007. Developing Vernal Pool Conservation Plans at the Local Level Using Citizen-Scientists . Wetlands 27, 80-95.
Peterson, C., Weibel, A., Grimm, N., Fisher, S. 1994. Mechanisms of Benthic Algal Recovery Following Spates: Comparison of Simulated and Natural Events. Oecologia 98: 280-290.
Petersen, J., Englund, G. 2005. Dimensional Approaches to Designing Better Experimental Ecosystems: A Practitioners Guide with Examples. Oecologia 145: 216-224
Pyke, C. 2005. Assessing Climate Change Impacts on Vernal Pool Ecosystems and Endemic Branchiopods. Ecosystems 8: 95-105
Rogers, D. 1998. Aquatic Macroinvertebrate Occurrences and Population Trends in Constructed and Natural Vernal Pools in Folsom, California. Ecology, Conservation, and Management of Vernal Pool Ecosystems – Proceedings from a 1996 Conference. California Native Plant Society, Sacramento, CA.
Sasamoto, B. 2010. The Effects of Climate Change on Algae Communities in Vernal Pools.
Schindler, D. 1998. Replication versus Realism: The Need for Ecosystem-Scale Experiments. Ecosystems 1: 323-324
U.S. EPA, 2001. Midwestern Ephemeral Wetlands. U.S. Environmental Protection Agency, Washington DC. <http://www.epa.gov/R5water/ephemeralwetlands/pdf/wetlands_brochure.pdf>
Williams, D. 1996. Environmental Constraints in Temporary Fresh Waters and Their Consequences for the Insect Fauna. Journal of the North American Benthological Society 15: 634-650