A Survey of Utility Experience with Real Time Pricing · PDF fileA Survey of Utility...
127
LBNL-54238 A Survey of Utility Experience with Real Time Pricing Galen Barbose and Charles Goldman Lawrence Berkeley National Laboratory Bernie Neenan Neenan Associates Environmental Energy Technologies Division http://eetd.lbl.gov/ea/EMS/EMS_pubs.html December 2004 The work described in this study was coordinated by the Consortium for Electric Reliability and Technology Solutions (CERTS) and funded by the Assistant Secretary of Energy Efficiency and Renewable Energy, Office of Electric Transmission and Distribution (OETD) of the U.S. Department of Energy under Contract No. DE-AC03- 76SF00098 and the New York Independent System Operator (NYISO). The authors are solely responsible for any errors or omissions contained in this report. ERNEST ORLANDO LAWRENCE BERKELEY NATIONAL LABORATORY
Transcript of A Survey of Utility Experience with Real Time Pricing · PDF fileA Survey of Utility...

LBNL-54238
A Survey of Utility Experience with Real Time Pricing Galen Barbose and Charles Goldman Lawrence Berkeley National Laboratory Bernie Neenan Neenan Associates Environmental Energy Technologies Division http://eetd.lbl.gov/ea/EMS/EMS_pubs.html December 2004 The work described in this study was coordinated by the Consortium for Electric Reliability and Technology Solutions (CERTS) and funded by the Assistant Secretary of Energy Efficiency and Renewable Energy, Office of Electric Transmission and Distribution (OETD) of the U.S. Department of Energy under Contract No. DE-AC03-76SF00098 and the New York Independent System Operator (NYISO). The authors are solely responsible for any errors or omissions contained in this report.
ERNEST ORLANDO LAWRENCE BERKELEY NATIONAL LABORATORY

Disclaimer
This document was prepared as an account of work sponsored by the United States Government. While this document is believed to contain correct information, neither the United States Government nor any agency thereof, nor The Regents of the University of California, nor any of their employees, makes any warranty, express or implied, or assumes any legal responsibility for the accuracy, completeness, or usefulness of any information, apparatus, product, or process disclosed, or represents that its use would not infringe privately owned rights. Reference herein to any specific commercial product, process, or service by its trade name, trademark, manufacturer, or otherwise, does not necessarily constitute or imply its endorsement, recommendation, or favoring by the United States Government or any agency thereof, or The Regents of the University of California. The views and opinions of authors expressed herein do not necessarily state or reflect those of the United States Government or any agency thereof, or The Regents of the University of California. Ernest Orlando Lawrence Berkeley National Laboratory is an equal opportunity employer.

LBNL-54238
A Survey of Utility Experience with Real Time Pricing
Prepared for the Office of Electric Transmission and Distribution
Assistant Secretary for Energy Efficiency and Renewable Energy U.S. Department of Energy
Principal Authors
Galen Barbose and Charles Goldman Lawrence Berkeley National Laboratory
1 Cyclotron Road, MS90R4000 Berkeley, CA 94720-8136
Bernie Neenan
Neenan Associates
December 2004
The work described in this study was coordinated by the Consortium for Electric Reliability and Technology Solutions (CERTS) and funded by the Assistant Secretary of Energy Efficiency and Renewable Energy, Office of Electric Transmission and Distribution (OETD) of the U.S. Department of Energy under Contract No. DE-AC03-76SF00098 and the New York Independent System Operator (NYISO).

A Survey of Utility Experience with Real Time Pricing
ii
Acknowledgements
The work described in this study was coordinated by the Consortium for Electric Reliability and Technology Solutions (CERTS) and funded by the Assistant Secretary of Energy Efficiency and Renewable Energy, Office of Electric Transmission and Distribution (OETD), Transmission Reliability and Electric Markets Technical Assistance Programs of the U.S. Department of Energy under Contract No. DE-AC03-76SF00098 and the New York Independent System Operator (NYISO). The authors would like to thank Phil Overholt and Larry Mansueti (DOE) for supporting this project and Severin Borenstein (UC Berkeley and UC Energy Institute), Joe Eto (LBNL), Chris Holmes (TVA), Nicole Hopper (LBNL), Tom Taylor (Duke Power), and Henry Yoshimura (ISO-NE) for providing review comments on a draft of this report. We also thank the utility program managers who were willing to be interviewed and who provided valuable information on the RTP tariffs included in this study. The authors are solely responsible for any errors or omissions contained in this report.

A Survey of Utility Experience with Real Time Pricing
iii
Table of Contents Acknowledgements......................................................................................................................... ii Table of Contents........................................................................................................................... iii List of Figures, Tables, and Text Boxes ........................................................................................ vi Acronyms and Abbreviations ....................................................................................................... vii Executive Summary ...................................................................................................................ES-1
Background..........................................................................................................................ES-1 Project Overview .................................................................................................................ES-1 Key Findings........................................................................................................................ES-2 Implications for Policymakers .............................................................................................ES-8
1. Introduction................................................................................................................................1
1.1 Background .....................................................................................................................1 1.2 Report Overview .............................................................................................................3
2. Research Approach ....................................................................................................................4
2.1 Population and Sample....................................................................................................4 2.2 Research Questions and Methods....................................................................................4
3. Evolution of RTP Tariff Design ................................................................................................7 4. RTP Program History and Outlook..........................................................................................10
4.1. Timeline of Program Offerings .....................................................................................10 4.2. Utility Motivation and Goals.........................................................................................11 4.3. Program Status and Outlook..........................................................................................12
5. RTP Program Participation ......................................................................................................17
5.1 Summary .......................................................................................................................17 5.2 Factors That May Affect RTP Program Participation...................................................20
6. Price Response .........................................................................................................................25
6.1 Data Availability ...........................................................................................................25 6.2 Percent of Participants Providing Price Response ........................................................25 6.3 Price Threshold..............................................................................................................27 6.4 Maximum Combined Load Reduction ..........................................................................28
7. Discussion: Implication for Policymakers ...............................................................................31
7.1. Challenges for Implementing Voluntary RTP as a Tool for Demand Response ..........31 7.2. Recommendations for Improving the Design and Implementation of Voluntary RTP
Programs........................................................................................................................33 7.3. Aligning Policy Objectives and RTP Program Design .................................................34
References......................................................................................................................................36
A Survey of Utility Experience with Real Time Pricing
iv
Appendix A: RTP Experience Questionnaire ................................................................................40 Appendix B: RTP Tariff Design Features .....................................................................................43
B.1. Eligibility Requirements................................................................................................43 B.2. Enrollment Limits..........................................................................................................44 B.3. Tariff Pricing Structure .................................................................................................44 B.4. CBL Adjustments ..........................................................................................................47 B.5. Other Risk Management Options ..................................................................................48 B.6. Marginal Energy Cost Derivation .................................................................................49 B.7. Marginal Capacity and Outage Cost Adders .................................................................50 B.8. Interruptible Service Provisions ....................................................................................51 B.9. Minimum Contract Term...............................................................................................52
Appendix C: RTP Program Case Study Summaries......................................................................59
Alliant (Interstate Power & Light – Illinois and South Beloit Water, Gas & Electric) ...........59 Alliant (Interstate Power & Light – Iowa)...............................................................................60 Ameren (Central Illinois Light Co., Central Illinois Public Service, and Union Electric) ......61 American Electric Power (Public Service Company of Oklahoma)........................................62 Aquila.......................................................................................................................................63 British Columbia Hydro and Power Authority ........................................................................65 Cinergy.....................................................................................................................................67 Conectiv Power Delivery (Delmarva Power & Light) ............................................................68 Dominion (Dominion Virginia Power)....................................................................................69 Duke Power..............................................................................................................................71 Exelon (Commonwealth Edison).............................................................................................73 Exelon (Commonwealth Edison) and The Community Energy Cooperative..........................74 FirstEnergy (Jersey Central Power & Light) ...........................................................................76 FirstEnergy (Metropolitan Edison and Pennsylvania Electric) ...............................................77 FirstEnergy (Ohio Edison, Toledo Edison, Cleveland Electric Illum., and Penn Power) .......79 Florida Power & Light .............................................................................................................81 Kansas City Power & Light .....................................................................................................82 Long Island Power Authority...................................................................................................85 MidAmerican Energy...............................................................................................................86 Otter Tail Power Company ......................................................................................................87 Pacific Gas & Electric Company .............................................................................................88 Pennsylvania Power & Light ...................................................................................................89 Progress Energy (Carolina Power & Light).............................................................................91 Seattle City Light .....................................................................................................................92 South Carolina Electric and Gas ..............................................................................................93 Southern California Edison......................................................................................................94 Southern Company (Alabama Power) .....................................................................................96 Southern Company (Georgia Power).......................................................................................97 Southern Company (Gulf Power) ............................................................................................99 Tennessee Valley Authority...................................................................................................101 Wisconsin Electric .................................................................................................................103 Xcel Energy (Northern States Power Company) ...................................................................104

A Survey of Utility Experience with Real Time Pricing
v
Xcel Energy (Public Service Company of Colorado)............................................................107

A Survey of Utility Experience with Real Time Pricing
vi
List of Figures, Tables, and Text Boxes
Figure ES - 1. Aggregate non-coincident peak demand of RTP participants in 2003.............. ES-4 Figure ES - 2. Maximum percentage load reductions from RTP programs ............................. ES-7 Figure ES - 3. RTP program outlook ........................................................................................ ES-8 Figure 1. Number of utilities in each state offering a voluntary RTP tariff in 2003.................... 5 Figure 5. Timeline of RTP Tariff Design..................................................................................... 7 Figure 6. Start date of voluntary RTP tariffs offered in 2003 .................................................... 10 Figure 7. Primary utility motivations for offering RTP ............................................................. 12 Figure 8. RTP tariff outlook ....................................................................................................... 13 Figure 9. RTP enrollment in 2003.............................................................................................. 17 Figure 10. Aggregate non-coincident peak demand of RTP participants in 2003 ....................... 18 Figure 11. RTP participants’ aggregate non-coincident peak demand as a percentage of the
utilities’ system peak................................................................................................... 18 Figure 12. Change in enrollment in RTP tariffs from 2000-2003................................................ 19 Figure 13. Participation rates for tariffs with enrollment caps..................................................... 20 Figure 14. Market penetration rates for RTP tariffs without enrollment caps ............................. 21 Figure 15. Provision of technical assistance and access to hourly energy usage data ................. 22 Figure 16. Percentage of participants in each RTP tariff reported to be price responsive........... 26 Figure 17. Threshold for price response....................................................................................... 27 Figure 18. Maximum load reductions from RTP programs ......................................................... 28 Figure 19. Maximum percentage load reductions from RTP programs....................................... 29 Table 1. Summary of research questions and associated indicators .............................................. 5 Table 2. RTP programs included in this study............................................................................... 6 Table 3. Tariff history and outlook. ............................................................................................. 15 Table 4. RTP enrollment statistics for 2003 ................................................................................ 24 Table 5. RTP participant price response statistics ....................................................................... 30 Text Box 1. Customer benefits, risks, and costs of RTP participation ........................................... 2 Figure A - 1. RTP tariff eligibility requirements........................................................................ 43 Figure A - 2. One-part vs. multi-part tariffs ............................................................................... 45 Figure A - 3. The revenue-neutral, CBL-based RTP tariff structure.......................................... 46 Figure A - 4. Distribution of tariff pricing structures ................................................................. 47 Figure A - 5. Distribution of approaches to deriving marginal energy costs ............................. 50 Table A - 1. Summary of tariff design features......................................................................... 53

A Survey of Utility Experience with Real Time Pricing
vii
Acronyms and Abbreviations C&I commercial and industrial CBL customer baseline load DSM demand side management DR demand response FERC Federal Energy Regulatory Commission ISO independent system operator LOLP loss of load probability MOC marginal outage cost MW megawatts O&M operations and maintenance PSC public service commission RTO regional transmission organization RTP real time pricing T&D transmission and distribution VOLL value of lost load

A Survey of Utility Experience with Real Time Pricing
ES-1
Executive Summary Background Under real time pricing (RTP) tariffs, electricity consumers are charged prices that vary over short time intervals, typically hourly, and are quoted one day or less in advance to reflect contemporaneous marginal supply costs. RTP differs from conventional retail tariffs, which are based on prices that are fixed for months or years at a time to reflect average, embedded supply costs. In recent years, a resurgence of interest in RTP has occurred. Economists recognize that providing electricity consumers with price incentives to reduce their usage when wholesale prices rise would improve the performance of wholesale electricity markets in two important ways: mitigating suppliers’ ability to exercise market power and dampening price volatility. Policymakers engaged in electric utility resource planning have also recognized that, by reducing peak demand, RTP could play an important role in a portfolio of strategies for cost-effectively meeting utility load obligations.1 While other mechanisms can be used to induce price-responsive demand and/or reduce peak demand, many economists argue that RTP represents the most direct and efficient approach, and therefore it should be the primary focus of policymakers’ efforts to improve the performance of wholesale and retail electricity markets (Borenstein et al. 2002).2 While clearly appealing from a theoretical perspective, questions remain about the extent to which RTP can ultimately affect wholesale market performance and utility resource planning. First, assuming that RTP is offered on a voluntary basis, how many customers would choose to enroll in RTP, given the additional risks and transaction costs compared to traditional, fixed-price retail supply service? Second, even if a sizable number of customers did choose to enroll, to what extent, and how consistently, would a diverse population of participants respond to the prices they face? Some insight into these issues can be gleaned from experiences with several prominent RTP programs frequently featured in the literature. However, to understand the potential role of RTP in settings with substantially different types of customers and/or different market and regulatory conditions, policymakers require a wider base of experience. Project Overview While more than 70 utilities in the U.S. have offered voluntary RTP tariffs on either a pilot or permanent basis, most have operated in relative obscurity. To bring this broad base of 1 There is a third policy context in which interest in RTP has emerged, but which is less relevant to topics addressed in this report: in some states that have implemented retail choice, policymakers have designated RTP as the default, or provider of last resort, service for large customers that do not switch to a competitive supplier. In this context, RTP is often viewed primarily as a tool for supporting the development of a competitive retail market, with the belief that most customers will find RTP unacceptable and will seek out some form of hedged service from a competitive retail provider. 2 Other strategies include: critical peak pricing rates, which enable the utility to invoke high prices for a limited number of hours per year; traditional load management programs, such as interruptible service tariffs and direct load control; demand bidding programs, which allow customers to submit load reduction bids to their load serving entity or ISO; and capacity call-option programs, which provide customers with an up-front payment in exchange for agreeing to reduce demand, on a limited number of occasions, if called upon. In addition, energy efficiency and traditional time of use (TOU) rates can serve to reduce peak demand, although they do not create short-term price responsive demand.

A Survey of Utility Experience with Real Time Pricing
ES-2
experience to bear on policymakers’ current efforts to stimulate price responsive demand, we conducted a survey of 43 voluntary RTP tariffs offered in 2003. The survey involved telephone interviews with RTP program managers and other utility staff, as well as a review of regulatory documents, tariff sheets, program evaluations, and other publicly available sources. Based on this review of RTP program experience, we identify key trends related to: • utilities’ motivations for implementing RTP, • evolution of RTP tariff design, • program participation, • participant price response, and • program outlook. We draw from these findings to discuss implications for policymakers that are currently considering voluntary RTP as a strategy for developing price responsive demand. Key Findings Utilities’ Motivations for Implementing RTP Program managers characterized the motivations and goals underlying their utility’s decision to offer RTP. The most common response was that RTP was introduced primarily to build customer satisfaction and loyalty, by providing an opportunity for customers to realize bill savings. The second and third most common responses, respectively, were to reduce peak demand or encourage load shifting and to encourage load growth. The fourth most common response was to comply with a statutory or regulatory mandate. These motivations reflect the historical context within which RTP programs have been offered. The first wave of RTP programs, in the mid-1980s, were introduced as a novel strategy for meeting Demand Side Management (DSM) objectives and testing critical assumptions about customer acceptance and price response. Beginning in the early 1990s, a number of utilities, primarily in the Southeast and Midwest, introduced pilot and permanent RTP tariffs. During this period, electric utilities faced heightened competition for new and existing load (from other electric or gas utilities) and were increasingly concerned about uneconomic bypass from onsite generation. In addition, as movement towards retail market restructuring gained momentum, utilities became increasingly concerned about unregulated, retail suppliers luring away large customers with market-based rates. Thus, many utilities introduced RTP during this period to retain large customers by offering them “early access” to market prices and/or to encourage load growth by offering RTP tariffs that allowed customers to add new load without incurring additional demand charges. The proliferation of new RTP programs began to subside in the latter half of the 1990s, as utilities focused their attention more directly on restructuring-related issues. However, the past three to four years have seen a resurgence of interest in RTP, as policymakers and utilities have sought to address concerns about inadequate reliability, price volatility, and market power in wholesale electricity markets.

A Survey of Utility Experience with Real Time Pricing
ES-3
Evolution of RTP Tariff Design RTP tariffs have evolved over the past 20 years, in response to lessons learned from early efforts, preferences expressed by customers, and changing market and regulatory conditions. The first RTP programs, implemented in California in the mid-1980s, charged customers an hourly-varying price, quoted a day in advance, for all energy consumed. Thus, participants’ entire load was exposed to the volatility that characterized the RTP prices they faced. These tariffs were designed to be revenue neutral over average climatic conditions, for the class of customers deemed likely to participate. However, because such a large portion of the revenues generated from these tariffs was related to actual hourly supply and/or weather conditions, revenue recovery could not be guaranteed. Niagara Mohawk’s Hourly Integrated Pricing Pilot (HIPP), launched in 1988, introduced a new RTP tariff design: a two-part rate with a customer-specific access charge. A unique customer baseline load (CBL) profile, comprised of a kWh value for each hour of the year, was established for each participant from their historical interval billing data. The customer-specific access charge was calculated by applying the energy and billing demand rates from the customer’s otherwise applicable tariff to their CBL load profile. Deviations between the customer’s actual load and its CBL in each hour were settled at the prevailing real time price. Because only marginal changes in usage were subject to RTP prices, participants’ had less exposure to price volatility, and the utility had greater revenue stability, compared to earlier RTP tariff designs. The two-part, CBL-based tariff became the standard RTP tariff design during the early and mid-1990s, although some utilities introduced variations on particular program features. A number of utilities offered an option whereby the prices quoted a day-ahead were provisional and could be updated by the utility the next day, with one or two hour’s notice, if supply and/or outage costs changed dramatically. Program designers also began experimenting with different CBL provisions. For example, while the initial tariff designs fixed the customer’s CBL at the time of enrollment, several utilities later offered RTP tariffs that called for periodically adjusting participants’ CBL, as a way for the utility and the customer to share the risks and benefits associated with load growth. Finally, several utilities offered options that gave RTP participants the ability to customize their exposure to price volatility, for example, by temporarily raising or lowering their CBL, or by purchasing financial risk management products, such as price caps and contracts for differences. Voluntary RTP tariffs introduced since the late 1990s have largely diverged from the two-part, CBL-based design. Many of these tariffs are offered by utilities in states that have implemented retail choice and have unbundled retail electricity rates to separate commodity charges from T&D charges. The RTP tariffs introduced in these states have generally been based on a rate structure composed of hourly energy prices for the commodity component and unbundled T&D charges assessed on the customer’s billing demand and/or energy consumption. The departure from the CBL-based tariff structure reflects several factors. In markets open to retail competition, the utility can more easily achieve revenue stability by unbundling its T&D rate components and collecting these costs through an access charge, and pricing commodity electricity usage at prevailing market prices, thereby undercutting one of the primary motivations for the CBL-based design.

A Survey of Utility Experience with Real Time Pricing
ES-4
Program Participation We asked program managers to describe current and historical participation in their RTP program in terms of the number of participants and the amount of peak demand enrolled, and to describe the types of customers enrolled. We also asked them about factors that may have influenced participation rates, such as the types of marketing activities that have been conducted and whether customers were provided with technical assistance. Based on their responses, a number of key trends emerged: • Although several programs have achieved a significant level of participation, most have not.
In 2003, a total of 2,700 non-residential customers, representing more than 11,000 MW of peak demand, were enrolled in the RTP programs in this study. However, most of these participants are associated with a small number of programs. Only three programs had more than 100 non-residential participants or more than 500 MW enrolled, accounting for 80% of all load enrolled in RTP (see Figure ES - 1). One-third of the programs in our study had no participants in 2003. Another third had fewer than 25 participants, less than 50 MW, and less than 1% of the utility’s system load enrolled. Although many RTP programs imposed enrollment caps and/or restrictive eligibility requirements (e.g., minimum customer size), in most cases, neither factor appears to have directly limited participation.
02468
10121416
0 1-50 51-200 201-500 >500
Aggregate Peak Demand (MW)
Num
ber o
f Pro
gram
s n = 37
Figure ES - 1. Aggregate non-coincident peak demand of RTP participants in 2003
• Most RTP programs have not been broadly and pro-actively marketed. Forty percent (40%)
of the programs in our survey reportedly have not been pro-actively marketed. The other 60% have been marketed to some degree, but generally have been targeted to a relatively narrow group of eligible customers: typically the largest customers, particularly those with opportunities for load growth or relocation, relatively flat load profiles, on-site generation, and/or prior participation in interruptible service tariffs. While customers’ ability or willingness to respond to prices was often mentioned as one consideration, many customers were targeted solely on the basis of the bill savings they could accrue by purchasing some of their load at marginal-cost based prices rather than standard tariff rates.

A Survey of Utility Experience with Real Time Pricing
ES-5
• Most RTP programs provide limited assistance to help customers physically manage their
exposure to price volatility. Only one-third of the programs in our survey offer technical assistance to help customers identify strategies for price response. About 50% of the programs offered participants internet-based access to their hourly consumption data on a real-time or day-after basis, although in some cases, only for an additional fee.
• Participation in most RTP programs is dominated by large industrial customers, with modest
participation by large institutional customers. This trend, in part, reflects program eligibility restrictions: one-third of the programs in our survey are available only to customers with peak demand greater than 1 MW. It also reflects the program goals and associated marketing strategies employed by many utilities. Due to the size of their loads and their ability to expand and relocate, large industrial customers are typically the most applicable to load retention and load growth objectives. These customers are also most likely to have previously been served on interruptible service rates or to have on-site generation, and therefore they have often been perceived as the most capable of responding to RTP prices.
• Participation in most programs has declined in recent years. Between 2000 and 2003, half
of all programs in existence prior to 2000 lost 25% or more of their participants, while only two programs saw participation increase. Many program managers attributed this trend to an increase in price volatility or average RTP prices, in combination with the belief that many customers enrolled in RTP expecting to realize bill savings solely by purchasing load at marginal cost based prices, without responding to these prices on an hourly or daily basis. Increased price levels and volatility eroded those opportunities, resulting in program attrition.
Participant Price Response We asked program managers to describe the price response of participants in their program in terms of three metrics: (1) the percent of participants that appear to respond to RTP prices, (2) the minimum price at which participants begin to respond, and (3) the maximum load reduction generated by their portfolio of participants and the corresponding price. The key findings from their responses are as follows. • Quantitative information on participants’ price responsiveness is relatively sparse. Most
program managers indicated that RTP participants’ price response had not been formally evaluated, and therefore some or all of the information requested was currently unknown. They cited several factors in explaining this situation. First, because many programs were motivated primarily for purposes other than load management, utilities have had little incentive to devote resources to rigorously measuring and quantifying customers’ price response. Second, many programs have had too few participants, too short a duration, or not enough price volatility to support a formal analysis of participants’ price response. Finally, because most programs are not integrated into the utility’s system scheduling or planning operations (in part, a consequence of the small amount of load enrolled), detailed information about price response is not required for operational purposes.

A Survey of Utility Experience with Real Time Pricing
ES-6
• Although many customers on RTP are price responsive, a substantial fraction is not. Among programs with more than 10 participants, most program managers reported that between 20 and 60% of participants have exhibited some discernable response to hourly prices. To explain the fact that the remaining customers evidently do not respond to hourly prices at all, program managers cited their belief that many customers enrolled in RTP without any intention of monitoring or responding to prices on a day-to-day basis. Program managers also pointed to various operational and institutional factors that they believe makes price response difficult for many customers: a lack the flexibility in customers’ operations, a lack of technical expertise, employee turnover, and a general tendency for customers simply to forget about electricity prices if they remain low and stable for prolonged periods.
• Customers that respond to RTP prices generally employ relatively low-tech strategies or on-
site generation resources. Most program managers indicated that the participants in their program that have actively responded to prices are large industrial customers that reschedule discrete, electrically-intensive process loads (e.g., arc furnaces at steel mills), and customers that run on-site generation.
• Most program managers report that some RTP program participants respond to prices less
than $0.20/kWh. Two-thirds of the program managers that provided information on this metric indicated that at least some customers begin to respond at prices below $0.20/kWh. Often, these low-price responders are customers with on-site generation. About one-third of program managers reported that no participants appear to respond unless prices are at least $0.30 to $0.80/kWh.
• RTP programs reportedly achieved load reductions equal to 12-33% of participants’
aggregate peak demand, across a wide range of prices. Among eight programs with more than 20 participants, six have reportedly generated load reductions in the range of 12-22% of participants’ combined non-coincident peak demand, while the other two have generated load reductions of approximately 33% (see Figure ES - 2). These load reductions occurred across a wide range of hourly prices, from $0.12/kWh to $6.50/kWh, although higher prices did not necessarily correspond to higher percentage load reductions. In fact, the largest reported percentage load reduction (33%) for an RTP program occurred at a price of $0.30/kWh.
• Most RTP programs have generated modest load reductions, in terms of their absolute
magnitude. Of the ten programs for which an estimate of the maximum load reduction was provided, only two have generated load reductions greater than 100 MW, and only one has generated load reductions greater than approximately 1% of the utility’s system peak. For most programs, the modest load response directly reflects the small amount of load enrolled. However, some program managers also pointed to the fact that RTP prices have remained too low for participants to respond significantly, or suggested that few participants were price responsive.

A Survey of Utility Experience with Real Time Pricing
ES-7
0%
5%
10%
15%
20%
25%
30%
35%
$0.00 $1.00 $2.00 $3.00 $4.00 $5.00 $6.00 $7.00
Price ($/kWh)
Max
Loa
d R
educ
tion
as a
% o
f Pa
rtic
ipan
ts' N
on-C
oinc
iden
t Pea
k D
eman
d
Figure ES - 2. Maximum percentage load reductions from RTP programs3
Program Outlook About one-third of the utilities report a continuing and active commitment to voluntary RTP programs, in terms of further marketing or program development (see Figure ES - 3). This includes utilities with recently introduced programs that are still under development (15%), 1990s-era RTP programs that are continuing to be actively promoted (11%), and programs that will be phased out but replaced with a new voluntary RTP tariff (8%). However, most utilities are either continuing to offer voluntary RTP but without actively promoting it (38%), or are in the process of phasing it out (28%). Many of these programs have never been aggressively promoted, while others had a greater level of support in the past, but are now being mothballed or cancelled, due to a demonstrated lack of customer interest and/or changes associated with restructuring. For example, in some states that have implemented retail competition, utilities no longer see themselves (or regulators no longer see them) as having a role in offering “experimental” retail supply tariffs. In several other states that are currently in a transitional phase within their restructuring process, utilities are simply waiting to see how the regulatory environment and/or retail market develops before committing further resources to RTP program marketing or development.
3 Georgia Power’s two tariffs (RTP-DA and RTP-HA) are shown as separate data points in Figure ES - 2, since participants in the two programs faced different prices at the time that the maximum load reduction occurred.

A Survey of Utility Experience with Real Time Pricing
ES-8
Recently Introduced Program
15%
Maintain Program with Active Efforts
11%
Maintain Program, without Active
Efforts38%
Replace with New Voluntary RTP
Program8%
Phasing Out Voluntary RTP
28% n = 53
Figure ES - 3. RTP program outlook4
Implications for Policymakers A small number of programs have demonstrated that it is possible for voluntary RTP to attract a significant number of participants and generate a substantial level of price response. However, the fact that the vast majority of programs in our study have had a much more modest impact does suggest that policymakers must explicitly address a number of challenges if voluntary RTP is to have a meaningful impact on wholesale market operations and utility resource planning. • Sufficient resources must be devoted to developing and implementing a customer education
program. Experience to date suggests that customers are highly unlikely to gravitate in large numbers toward RTP on their own accord. To extend participation beyond a few large industrial customers, aggressive marketing and education campaigns must be undertaken to reach medium-sized customers and to successfully identify price responsive customers other than just those that have participated in interruptible rates or that have on-site generation. Customers must be made aware of the tariff and its terms, be able to make direct comparisons of their electricity bills under the otherwise applicable tariff and the RTP rate, and understand what opportunities they have to shift and curtail discretionary loads.
• Customers need help understanding and managing price risk. Modest participation rates and
high levels of customer attrition reinforce the notion that many customers have limited tolerance for price volatility in hourly spot electricity markets. Customers need technical assistance and training to help them understand market price formation and to identify physical and financial strategies for managing price risk. Financial incentives to accelerate adoption of technologies that simplify and/or automate price response may be warranted in some cases. If, in vertically-integrated markets, two-part, CBL-based RTP designs do not attract sufficient participation, utilities may need to offer companion financial risk
4 Some RTP programs are offered in multiple states, and the outlook of the program differs between states. To account for this fact, Figure ES - 3 was constructed by counting each RTP program once for each of the states in which it is offered. This is why the sample size is 53.

A Survey of Utility Experience with Real Time Pricing
ES-9
management products that mitigate risk without undermining customers’ incentive to respond to high prices.
RTP implementation should be coordinated with other demand side activities. Although energy efficiency programs and real time pricing serve a common purpose and share many overlapping technologies and customer education activities, utilities typically have not coordinated these two pursuits. Integrating many of the programmatic initiatives needed to build participation in RTP with traditional energy efficiency and DSM-related efforts (e.g., marketing, customer education, technical assistance, and technology rebate programs) could capitalize on the natural synergies between RTP and energy efficiency, yielding several specific benefits for utilities and consumers. Greater awareness and acceptance of RTP could be achieved among commercial and institutional customers, which have traditionally been the mainstays of energy efficiency programs but heretofore have not participated widely in RTP. Customers would be better positioned to evaluate investments in new end-use technologies (e.g., energy management and control systems and high efficiency air-conditioning) in light of the benefits they provide vis-à-vis participation in RTP. Transaction and administrative costs could also be minimized (e.g., related to marketing materials, site audits, and customer load analyses).
• RTP programs should include provision for a rigorous analysis of customer acceptance and
price response. Only about 20% of the 43 programs included in our survey have conducted any formal evaluation of participants’ price response, and even fewer have attempted to quantify the benefits to the utility and non-participants. Yet, many utilities and policymakers are reluctant to fully embrace RTP, partly because the nature and magnitude of the benefits are poorly understood. Some of the apprehension toward RTP could potentially be mitigated if a greater emphasis was placed on program evaluation, with the results made available to the broader policy community. Evaluation initiatives are also critical for identifying best-practice RTP program designs, thereby allowing RTP programs to become more standardized and widely marketed, similar to the process used in a number of states for energy efficiency programs.
• Utilities interests must be aligned with program goals. RTP is a complex and relatively
costly tariff to market and administer. Those utilities that have historically been the most successful at enrolling participants in RTP have had well aligned motivations; in particular, they saw RTP as a valuable tool for customer retention and load building. In states where policymakers are interested in promoting RTP for the purpose of developing price responsive demand, they may need to evaluate the extent to which utilities’ incentives and interests are aligned with this particular goal, and if necessary, establish an appropriate incentive mechanism, such as a regulatory directive or performance-based incentives.
• The costs and benefits of obtaining incremental amounts of price-responsive load from RTP
must be weighed against those of other types of demand response mechanisms. If the baseline level of interest in RTP is limited to a small number of large industrial customers, utilities may have to devote significant resources to entice a substantial number of additional customers to enroll. Policymakers should weigh the costs of these further inducements and the incremental benefits against those of implementing alternative price response

A Survey of Utility Experience with Real Time Pricing
ES-10
mechanisms. Given the diversity and heterogeneity of retail customers, a portfolio of RTP and other demand response programs, including some fast-response options and others that build long-run price response behaviors, may be more likely to achieve meaningful levels of price-responsive load than focusing exclusively on RTP.
• Policymakers must account for the potential environmental and market impacts of increased
use of distributed generation that may result from RTP. Experience with existing RTP programs suggests that customers with on-site generation have been among those most receptive to RTP and, in some cases, the most price-responsive. Depending on the emissions characteristics and location of on-site generators relative to bulk power generation, the health and environmental consequences of increased operation of onsite generators may be negative or positive. If customers on RTP rates choose, or are allowed to, increase operation of existing diesel-fired generators as part of their price response strategy, adverse environmental consequences are likely to result. At the same time, a proliferation of distributed generation located in transmission-constrained load centers may help to mitigate the exercise of market power, and therefore improve the efficiency of bulk power markets.
A Survey of Utility Experience with Real Time Pricing
1
1. Introduction 1.1 Background Under real time pricing (RTP) tariffs, retail electricity consumers are charged prices that vary over short time intervals (typically hourly) and are quoted one day or less in advance, to reflect contemporaneous marginal supply costs. These tariffs differ significantly from those typically used by electric utilities, which are based on prices that are fixed for months or years at a time to reflect average, embedded supply costs, with little or no differentiation with respect to the timing of consumption. Economists have long advocated for RTP on the basis of the gains in economic efficiency it could potentially engender, by more accurately signaling to consumers the time-varying costs of electricity consumption (Vickrey 1971, Schweppe et al. 1980). Recent interest among policymakers has largely been motivated by several, more specific, policy goals. In a number of states with retail choice, policymakers have designated RTP as the default service, or considered doing so, for large customers that do not switch to a competitive supplier. In this case, RTP is largely viewed as a tool for stimulating the development of competitive retail markets, with the belief that most customers will find RTP unacceptable and will seek out some form of hedged service from a competitive retail provider. Policymakers have also identified RTP as a potential strategy for developing demand response (DR). Economists and policy analysts engaged in efforts to improve the performance of competitive wholesale markets recognize that, by providing customers with an incentive to respond to high wholesale market prices, RTP could serve to mitigate market power, dampen wholesale price volatility, and bolster system reliability (Lafferty et al. 2001). Policymakers involved in utility resource planning have also identified RTP as a potential strategy to consider within a cost-effective portfolio of options for meeting utility load obligations. Policymakers seeking to develop DR face two fundamental policy choices. First, what type of mechanism(s) to use: RTP, emergency load reduction programs, demand bidding programs, traditional load management programs (interruptible tariffs and direct load control), or some other approach? Many argue that RTP represents the most direct and efficient DR mechanism, and therefore it should be the focus of policymakers’ efforts, at least for large customers (Borenstein et al. 2002). If RTP is to be used, state regulators then face a second choice: whether to make it voluntary or mandatory. In states without retail competition, regulators have implemented RTP only on a voluntary basis, and in some cases, customer groups have strongly opposed establishing RTP as a mandatory service.5 While clearly appealing from a theoretical perspective, questions remain about the extent to which RTP can ultimately affect wholesale market performance and utility resource planning. First, given the additional risks and costs that customers might bear on RTP (see Text Box 1), it is unclear how many customers would voluntarily enroll, and of those, what portion would return to a standard, fixed-rate service if prices became exceptionally volatile. Second, even if a sizable number of customers did choose to enroll, to what extent, and how consistently, would a diverse 5 Some consumer groups have argued that RTP creates unacceptable price risks for the customer, or that potential benefits are less than metering and other costs for small customers (Costello 2004).

A Survey of Utility Experience with Real Time Pricing
2
population of participants respond to the prices they face? With respect to the latter issue, some research has been conducted to examine the behavior of participants in several RTP programs, but it is uncertain how well these results would extrapolate to a broader customer base or to other utilities with substantially different types of customers and/or a different market and regulatory setting.6 The experiences of the approximately 70 utilities in the United States that have offered voluntary RTP programs over the past two decades represents an untapped source of information for insight into these issues. Yet, most of these programs have operated in relative obscurity, and few utilities have published program evaluations. Several RTP programs have been frequently featured in the literature on RTP, including those offered by Georgia Power, Duke Power, Central and Southwest Services, and Niagara Mohawk Power Company. Experiences with these tariffs provide many valuable lessons. However, to better understand the ultimate role that RTP could play in improving wholesale market operations and utility resource planning, policymakers require a broader base of experience.
Text Box 1. Customer benefits, risks, and costs of RTP participation
The primary benefit that customers can derive from participating in RTP is a reduction in their electricity costs. RTP participants can reduce their electricity costs by actively responding to prices, through some combination of: curtailing load during high-price periods, operating on-site generation during high-price periods, and shifting load from high-price to low-price periods. Depending on the details of the RTP tariff design, customers may also be able to generate bill savings simply by switching to RTP, without actively responding to prices. For example, some RTP tariffs allow customers to purchase a portion of their existing load or add new load at marginal cost based prices with no associated demand charge. Depending on how marginal costs compare to the utility’s average cost to serve a particular customer class, customers that switch to RTP may be able to make a smaller contribution to the utility’s embedded costs than if they were billed for the same electricity usage on their otherwise applicable tariff. RTP participants may also be able to reduce their electricity costs if the portion of their load subject to RTP prices is relatively flat compared to their class average load profile, thereby reducing the amount by which they “cross-subsidize” other customers in their class. The primary risk associated with participating in RTP is that hourly prices may spike at a time when the customer is consuming a disproportionate amount of power relative to other customer in its class, and the cost of either consuming or curtailing exceeds any savings accrued. With a mature market for financial risk management products, customers may be able to hedge much of this risk, although the cost of such products may offset a significant portion of savings from RTP. RTP participants can potentially incur three types of costs: equipment costs, short-term losses of amenity, and training and transaction costs. Additional equipment may be required for billing (e.g., interval metering and communications) or for responding to price signals (e.g., energy information systems, monitoring and controls devices, onsite generation). Losses of amenity may result from modifying equipment operation (e.g., reducing lighting or cooling levels). Transaction costs may be associated with a variety of activities, including monitoring electricity markets, responding to price signals, and purchasing risk management products.
6 Econometric studies of customers exposed to RTP have been conducted for programs offered by Niagara Mohawk Power Company (Herriges et al. 1993 and Goldman et al. 2004), Midlands Electricity in the U.K. (King and Shatrawka 1994, Patrick and Wolak 1997), Georgia Power (Braithwait and O’Sheasy 2000), Central and Southwest Services (Boisvert et al. 2004), and Duke Power (Schwarz et al. 2000). A summary of results from many of these studies is provided in Christensen Associates (2000).

A Survey of Utility Experience with Real Time Pricing
3
1.2 Report Overview To address this information gap, we reviewed the experiences of a large number of utilities that offered voluntary RTP programs in 2003. Based on this review, we identify key findings related to tariff design, utility motivation and goals, program outlook, customer participation, and price responsiveness. Drawing from these findings, we discuss implications for policymakers that are currently considering voluntary RTP as a strategy for developing demand response. The remainder of the study is organized as follows. • Section 2 identifies the population of voluntary RTP programs included in our survey and
describes the approach used to gather information on utilities’ experiences with these programs.
• Section 3 describes key tariff features and the evolution of RTP tariff design. • Section 4 discusses the history and outlook for RTP programs in this study, highlighting the
particular motivations and goals that have driven utilities’ interest in RTP. • Section 5 summarizes findings related to customer participation. • Section 6 summarizes findings related to the observed price response of customers enrolled
in voluntary RTP programs. • Section 7 offers guidance to policymakers that are considering voluntary RTP as a strategy
for fostering greater levels of demand response. • Appendix A includes the interview questionnaire. • Appendix B provides a detailed discussion of RTP tariff design features as well and
summarizes the design features of the RTP tariffs in this study. • Appendix C includes detailed case study summaries describing each utility’s experience
with voluntary RTP.

A Survey of Utility Experience with Real Time Pricing
4
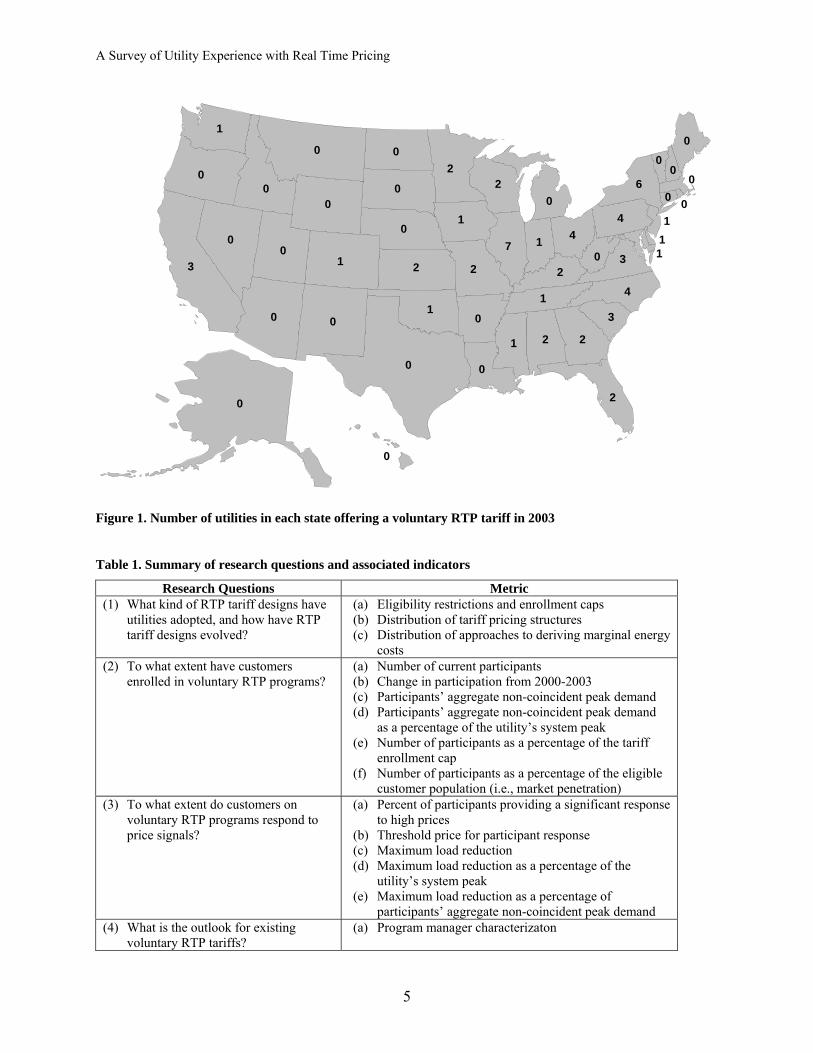
2. Research Approach 2.1 Population and Sample The target population for this study was the set of voluntary RTP programs offered by investor-owned and large publicly-owned utilities in 2003.7 We did not review the small number of RTP tariffs that have been designated as the default service in states with retail competition. Most of these have been introduced recently, and utilities have limited experience with the issues explored in this study.8 We identified the population of voluntary RTP tariffs offered in 2003 by reviewing utility tariffs on the Internet, and through referrals from industry experts. This process yielded a total of 49 utilities, across 27 states and the British Columbia offering voluntary RTP service in 2003 (see Figure 1). Our survey sample includes 48 of these utilities (see Table 2). Some of these utilities are subsidiaries of a common holding company and offer identical, or nearly identical, tariffs that are administered essentially as a single program. For the purpose of reporting summary statistics and characterizing utilities’ experiences, we grouped these tariffs together. We also aggregated those tariffs offered by individual utilities that have similar pricing structures but differ in other ways (e.g., eligibility limits, firm or non-firm service, advance notice of prices, etc.). Based on these aggregations, our sample frame is comprised of 43 distinct RTP programs. 2.2 Research Questions and Methods We obtained information on utilities’ experience with these programs by interviewing utility program managers and other relevant utility staff.9 Interviews were conducted using a survey instrument distributed to respondents in advance (included as Appendix A). Where available, we supplemented interview data with information from relevant regulatory filings, program evaluations, and secondary literature sources. The interviews and other data collection efforts were guided by a set of broad research questions and associated metrics, summarized in Table 1.
7 We excluded RTP programs that were cancelled prior to 2003. 8An exception is the RTP tariff offered by Niagara Mohawk as the default service, since 1998, for customers with peak demand greater than two MW [see Goldman et al (2004) for a comprehensive case study of customers on this tariff]. 9 For several programs, the interview subject was either a consultant to the utility, a third-party organization responsible for certain aspects of program implementation, or a staff member at the state public service commission. For one program, all information was obtained from publicly available information, and no interview was conducted.
A Survey of Utility Experience with Real Time Pricing
5
0
2 2
4
0
0
111
0
0
0
0
6
4
30
3
2
1
0 0
0
2
41
02
7
2
1
20
0
0
21
0
0
0
0
0
0
0
0
1
3
0
11
Figure 1. Number of utilities in each state offering a voluntary RTP tariff in 2003
Table 1. Summary of research questions and associated indicators
Research Questions Metric (1) What kind of RTP tariff designs have
utilities adopted, and how have RTP tariff designs evolved?
(a) Eligibility restrictions and enrollment caps (b) Distribution of tariff pricing structures (c) Distribution of approaches to deriving marginal energy
costs (2) To what extent have customers
enrolled in voluntary RTP programs? (a) Number of current participants (b) Change in participation from 2000-2003 (c) Participants’ aggregate non-coincident peak demand (d) Participants’ aggregate non-coincident peak demand
as a percentage of the utility’s system peak (e) Number of participants as a percentage of the tariff
enrollment cap (f) Number of participants as a percentage of the eligible
customer population (i.e., market penetration) (3) To what extent do customers on
voluntary RTP programs respond to price signals?
(a) Percent of participants providing a significant response to high prices
(b) Threshold price for participant response (c) Maximum load reduction (d) Maximum load reduction as a percentage of the
utility’s system peak (e) Maximum load reduction as a percentage of
participants’ aggregate non-coincident peak demand (4) What is the outlook for existing
voluntary RTP tariffs? (a) Program manager characterizaton

A Survey of Utility Experience with Real Time Pricing
6
Table 2. RTP programs included in this study
Company (Subsidiaries) Tariff Name State(s) Alliant (Interstate Power & Light – Illinois; South Beloit Water, Gas & Electric)
Real Time Pricing: Non-Residential Service IL
Alliant (Interstate Power & Light – Iowa) Day Ahead Hourly Time of Use Firm Service IA Ameren (Central Illinois Lighting Company) Rider G: Real Time Pricing IL Ameren (Central Illinois Public Service and Union Electric)
Rider RTP: Non-Residential Real Time Pricing IL
American Electric Power (Public Service Company of Oklahoma)
MarketChoice Real Time Pricing - Load Reduction
OK
Aquila (Aquila Networks - MPS, Aquila Networks - WPK)
Real-Time Pricing Program KS, MO
British Columbia Hydro and Power Authority Schedules 1288 & 1848: Real-Time Pricing Trans. Service BC Central Hudson Gas & Electric Hourly Pricing Provision NY Cinergy (Cincinnati Gas & Electric; PSI Energy; Union Light, Heat & Power)
Rate RTP: Real Time Pricing Program (PathWise) IN, KY, OH
Conectiv Power Delivery (Delmarva Power & Light)
Real Time Pricing - Firm Real Time Pricing - Interruptible
DE, MD, VA
Consolidated Edison Rider M: Voluntary Real-Time Pricing NY Dominion (Dominion Virginia Power) Schedule RTP (VA) and Rider RTP (NC) NC, VA Duke Power Hourly Pricing for Incremental Load NC, SC Exelon (Commonwealth Edison) Rate HEP: Hourly Energy Pricing IL Exelon (Commonwealth Edison) Rate RHEP: Residential Hourly Energy Pricing (Experimental) IL FirstEnergy (Jersey Central Power & Light) Service Class. GTX: Experimental Transmission Service NJ FirstEnergy (Metropolitan Edison, Pennelec) Rate RTP: Real Time Price Rate PA FirstEnergy (Ohio Edison, Toledo Edison, Cleveland Electric Illuminating, Penn Power)
Experimental Day Ahead Real Time Pricing Program
OH, PA
Florida Power & Light Real-Time Pricing FL Kansas City Power & Light Real-Time Pricing and Real-Time Pricing - Plus KS, MO Long Island Power Authority Voluntary Real-Time Pricing Pilot Service NY MidAmerican Energy Rider 17: Non-Residential Real Time Pricing IL New York State Electric & Gas Corporation Real Time Pricing Provision NY Orange & Rockland Utilities Rider M: Real-Time Pricing NY Otter Tail Power Company Real Time Pricing Rider (Experimental) Option 1
Real Time Pricing Rider (Experimental) Option 2 MN
Pacific Gas & Electric Schedule A-RTP CA Pennsylvania Power & Light Rate Schedule PR-1(R): Price Response Service – Firm
Rate Schedule PR-2(R): Price Response Service – Interruptible PA
Progress Energy (Carolina Power & Light) Experimental Real Time Pricing NC, SC Rochester Gas & Electric Real Time Pricing Option NY San Diego Gas & Electric Hourly Pricing Option CA Seattle City Light Variable Rate General Service WA South Carolina Electric & Gas Rate 27: Large Power Service Real Time Pricing SC Southern California Edison Schedule RTP-2 CA Southern Company (Alabama Power) Rate RTP: Real Time Pricing (Industrial Power)
Rate RTPD, Real Time Pricing - Day Ahead Rate RTPH, Real Time Pricing - Hour Ahead
AL
Southern Company (Georgia Power) Rate RTP-DA-2: Real Time Pricing – Day-Ahead (DA) Rate RTP-HA-2: Real Time Pricing – Hour-Ahead (HA)
GA
Southern Company (Gulf Power) Rate Schedule RTP, Limited Available Rate, Real Time Pricing FL Variable Price Interruptible Program Small Customer RTP Pilot
Tennessee Valley Authority
Two-part RTP
AL, GA, KY, NC, TN, VA
Wisconsin Energy Experimental Real Time Pricing WI Xcel Energy (Northern States Power) Experimental Real Time Pricing Service MN, WI Xcel Energy (Public Service Company of Colorado)
Real Time Pricing Service (Secondary, Primary, and Transmission)
CO

A Survey of Utility Experience with Real Time Pricing
7
3. Evolution of RTP Tariff Design RTP tariff designs have evolved over the past 20 years, as program designers have responded to lessons learned from early efforts, preferences expressed by customers, and changing market and regulatory landscapes. This section provides an overview of the evolution of RTP tariffs, with a focus on key design features (see Figure 2). Appendix B contains a more detailed discussion of individual tariff design features and a summary of the design of RTP tariffs included in this study.
Tariff Design Feature
Timeline
Rate Structure Bundled, RTP for all energy
Bundled, CBL-based design
Unbundled, RTP for all energy
Revenue Neutrality with Non-RTP Class Average Customer-Specific Class Average
(for commodity) CBL None Fixed Adjustable None
Advance Notice Day-Ahead Day-Ahead and Hour-Ahead Day-Ahead
Derivation of Marginal Cost
Synthetic, state driven
Marginal energy cost based on utility top of stack; Marginal outage cost based on LOLP and VOLL or peaker cost
ISO and published index prices
Eligibility Threshold Large and Medium C&I All C&I, Residential Pilots
Examples PG&E, SCE Niagara Mohawk Georgia Power, PSO SCE&G, Aquila IL and NY utilities
Figure 2. Timeline of RTP Tariff Design10
The initial application of RTP, launched in the mid-1980s, blended traditional rate design practices with marginal cost elements. In contrast to conventional demand and energy tariffs, these initial RTP tariffs charged customers a single, hourly-varying price, quoted a day in advance, for all energy consumed.11 As a result, customers were exposed to the volatility that characterized dynamic supply costs. These tariffs were designed to be revenue neutral for the class of customers deemed likely to participate, generally considered to be large industrial and commercial customers.12 However, unlike traditional rates that utilize fixed rate schedules and therefore realize revenue neutrality by design, RTP involves hourly prices that reflect current utility supply and/or weather conditions, so neither individual participant nor class-level revenue recovery was guaranteed.13
10 For the full spelling of acronyms used in the figure, refer to the list of acronyms and abbreviations in the front of the report. 11 RTP started as a general concept, charging customers usage rates that reflect the contemporaneous cost of supply (Vickrey 1971). However, turning that concept into a workable tariff was challenging, as it involved resolving technical and financial problems, and matching the price setting process with customers’ ability to react and respond. Thus, while the original concept envisioned customers receiving and responding to real-time price signals, a practical application required providing customers with greater notice of price changes. 12 For an RTP tariff to be revenue neutral for a particular customer class means that the utility’s revenues would be unaffected if a group of customers with an average load profile equal to the class average were to switch to RTP from their standard tariff. 13 As a consequence, there was a subscription bias. Customers with load shapes that differed substantially from the class average either had an incentive or deterrent to participate.
1985 1990 1995 2000

A Survey of Utility Experience with Real Time Pricing
8
The next phase in RTP tariff design was began with Niagara Mohawk’s Hourly Integrated Pricing Pilot (HIPP), which introduced several innovations in response to shortcomings of the earlier RTP designs. The first innovation was the concept of a two-part RTP rate design with a customer-specific fixed charge based on the customer’s historical consumption patterns. This type of two-part tariff defines a customer baseline load (CBL) profile for each participant, comprised of a kWh value for each hour of the year, typically derived from the customer’s historical interval usage data. The first part of the rate applies the energy and demand charges from the customer’s otherwise applicable tariff to their CBL hourly usage and billing demand, respectively. The second part settles load deviations from the CBL in each hour at the prevailing RTP price, so that load in excess of the CBL is charged at the RTP price, and load reductions below the CBL result in a bill credit at that price. This approach has the advantage of shielding the customer’s typical hourly usage from volatile prices. It also stabilizes the utility’s revenue by creating a customer-specific form of revenue neutrality: if the customer’s usage pattern is identical to its CBL, then its utility bill is the same as if it were taking service on the standard tariff. The other major innovation of the HIPP tariff design was the methodology used to derive hourly prices. HIPP prices were comprised of two distinct components, representing marginal energy and marginal capacity costs, both of which were set on a day-ahead basis to reflect projected system conditions. The marginal energy cost component was based on the projected cost of providing energy from the generating unit at the top of the stack, i.e., the unit that would serve load in excess of what was forecast for the hour. The marginal capacity component, defined as the marginal outage cost (MOC), was equal to the product of the change in the loss of load probability (LOLP) and the value of lost load (VOLL).14 The LOLP varied inversely with the level of operating reserve margins, and the VOLL was a fixed amount, typically about $2.00/kWh. Relatively low load and high capacity availability conditions, the norm for most hours of the year, yielded a negligible MOC and an hourly price approximately equal to the marginal energy cost. However, low operating reserves caused the LOLP component to rise, resulting in an increase in the hourly price above the marginal energy cost, by as much as the VOLL. During the early-to-mid-1990s, a number of other utilities adopted the CBL-based, two-part RTP design, several of which introduced an alternative RTP service option whereby customers agreed that the quoted day-ahead prices were provisional and could be updated with one or two hour’s notice if supply and/or outage costs changed. When unforeseen supply shortfalls resulted in sudden increases in the LOLP or expensive off-system purchases, the short-notice RTP price overcall could result in prices rising substantially (e.g., $0.50/kWh or higher). Hour-ahead RTP tariffs were typically offered to customers that were served under conventional interruptible tariffs. This service provided these customers with an alternative to interruptible rates, where instead of paying a large penalty for not complying with a curtailment order, they could buy-through the curtailment at the prevailing, updated RTP prices while retaining most of the discount embedded in interruptible rates.
14 The same approach was subsequently adopted by the British pool in setting system-wide prices

A Survey of Utility Experience with Real Time Pricing
9
The mid- and late-1990s were characterized by experiments with different ways of establishing and adjusting the CBL. Earlier RTP tariffs typically required the CBL to be fixed at the time of enrollment. However, customers’ circumstances change, as does the character of RTP prices. Program designers began tinkering with the CBL, initially focusing on making downward adjustments to the CBL for customers whose loads declined systematically. Subsequently, the notion of an adjustable CBL was introduced as a way for the utility and the customer to share the risks and benefits associated with load growth. During this period, several utilities also introduced a variety of risk management options for customers to hedge price volatility. Participants could buy additional CBL or sell some of their CBL back to the utility, based on projected RTP prices. Several utilities introduced other financial risk management products, such as price caps and contracts for differences, to confront the growing RTP price volatility. These hedging innovations were offered by only a small number of utilities, but were reportedly popular among their RTP customers. By the late 1990s, utilities in many states turned their attention toward restructuring-related issues, and interest in experimental tariff offerings, such as RTP, waned. A number of utilities did introduce new voluntary RTP tariffs, but they largely abandoned the CBL-based design. Most of the new RTP tariffs were introduced in states that had implemented retail competition, and were based on an unbundled rate design, with RTP commodity prices charged for all energy consumption and unbundled T&D rate components charged for delivery services. This trend potentially reflects a variety of factors related to industry restructuring. In states with retail choice, some policymakers may deem it inappropriate for utilities to offer hedged RTP service, on the basis that risk management products should be offered only by competitive retail entities. Utilities may also be less inclined to offer CBL-based RTP. In states where retail rates are unbundled and utilities have divested their generation assets, revenue stability is largely achieved through the unbundled T&D rate components, thus undercutting one of the primary drivers for the CBL-based design. CBL-based RTP tariffs are also often viewed as costly to administer, due to the time required to establish each customer’s CBL and the more complex billing requirements. Finally, CBL-based RTP tariffs may run into a variety of challenging ratemaking issues in states that have restructured, for example, how to appropriately price the fixed commodity charges on the CBL and how to coordinate CBL contract provisions with commodity procurement requirements and processes. In addition to the shift away from CBL-based tariff structures, the new generation of RTP tariffs also differed from their predecessors in terms of their approach to deriving marginal costs. With the advent of ISOs, utilities began to tie hourly RTP prices more directly to wholesale day-ahead and/or real-time energy markets, forsaking the top-of-stack, marginal outage cost methods that had been the underpinning of earlier RTP programs. In many cases, this change has been born of necessity, as utilities’ divested their generation assets and the top-of-stack approach was no longer applicable.

A Survey of Utility Experience with Real Time Pricing
10
4. RTP Program History and Outlook 4.1. Timeline of Program Offerings The RTP programs included in this study were introduced in three semi-distinct periods over the past two decades (see Table 3 and Figure 3). Several utilities introduced experimental RTP pilot programs in the mid-1980s, as a novel approach to meeting Demand Side Management (DSM) objectives.15 RTP gained wider acceptance beginning in the early 1990s, when a number of utilities, primarily in the Southeast and Midwest, introduced new RTP programs. During this period, electric utilities faced heightened competition for new and existing load (from other electric or gas utilities) and were increasingly concerned about uneconomic bypass from onsite generation. In addition, as movement towards retail market restructuring gained momentum during the mid-1990s, utilities became increasingly concerned about unregulated, retail suppliers luring away large customers with market-based rates. Many utilities introduced RTP during the early- and mid-1990s to retain large customers by offering them “early access” to market prices and the opportunity to add load at prices based on marginal, rather than embedded, costs. The proliferation of new RTP programs began to subside in the latter half of the 1990s, as utilities focused their attention more directly on restructuring-related issues.16 However, the past three to four years have seen a resurgence of interest in RTP, as policymakers and utilities have sought to address concerns about inadequate reliability, price volatility, and market power in wholesale electricity markets.17
0
1
2
3
4
5
6
7
8
1985
1986
1987
1988
1989
1990
1991
1992
1993
1994
1995
1996
1997
1998
1999
2000
2001
2002
2003
Program Start Date
# of
Pro
gram
s
Figure 3. Start date of voluntary RTP tariffs offered in 2003
15 Several programs in addition to those shown in Figure 3 were introduced during the first era of program offerings, but expired prior to 2003, and therefore were not included in this study. These include RTP tariffs offered by Connecticut Light & Power, Gulf States Utilities, Niagara Mohawk, and Savannah Electric & Power (Newcomb and Byrne 1995). 16 The apparent surge in new RTP program offerings in 1998 is primarily associated with the programs introduced in that year by electric utilities in Illinois, as required by the state’s restructuring law. 17 Most notably, the New York Public Service Commission ordered five of the state’s utilities to introduce RTP tariffs in 2001, due to concerns about inadequate generation supply. ComEd’s Rate RHEP and San Diego Gas & Electric’s Rate HPO were introduced for similar reasons in 2003.

A Survey of Utility Experience with Real Time Pricing
11
4.2. Utility Motivation and Goals RTP program managers characterized the motivations and goals underlying their utility’s decision to offer RTP. We grouped their responses into six categories (see Figure 4). • The most common response, given for more than half of the programs, was that RTP was
introduced primarily to build satisfaction and loyalty among large customers, by providing them with opportunities for bill savings. Interest in customer satisfaction was often closely linked to anticipation of retail competition and/or concerns about customers relocating to other service territories. During the early-to-mid 1990s, competition for new and existing load heightened among utilities. Concerns about uneconomic bypass by cogeneration and on-site generation were also increasingly raised. As the decade progressed, interest in opening up retail markets to non-utility suppliers rapidly emerged. Many utilities were concerned that potential competitors (initially, other utilities, and later, non-utility suppliers) might lure their large customers away with market-based rates, and some responded to this threat by developing RTP as a way of offering their large customers “early access” to market-based prices, thus heading off potential competitors.18 Several program managers reported that the initial impetus for developing RTP came directly from customers who had experience with RTP at facilities located in other service territories where RTP was already available.
• Approximately one-third of the program managers indicated that their RTP program was
introduced directly for the purpose of reducing peak demand or encouraging load shifting. Several of these were introduced explicitly as DSM programs. Several others were introduced as an alternative or potential replacement for interruptible rates. Of the program managers that mentioned peak demand reduction as an objective, almost all indicated that it was one of several important motivations.
• Twenty-five percent (25%) of the RTP programs were motivated by an interest in
encouraging load growth. Many utilities had excess generation capacity at the time that they first offered RTP, and they sought to increase their generation capacity utilization and reduce average system costs. RTP, particularly when implemented as a two-part, CBL-based tariff, was seen as a tool to achieve this goal, by providing low, marginal-cost based prices for incremental usage during off-peak periods.
• Another 25% of program managers reported that their utility was required to offer RTP,
either by legislative mandate or regulatory order. All of these utilities are located in Illinois or New York. In Illinois, the state’s restructuring legislation required that all electric utilities
18 A clear illustration of this is given in an EPRI publication describing the motivation of Public Service Company of Oklahoma: “In 1993, competition for load within the geographic region and competition against other states for industry compelled Public Service Company of Oklahoma (PSO) to reevaluate its rate structures. The utility wanted a more competitive pricing structure to give it ammunition to ward off unregulated ‘cowboy generators’ and ‘open-access mavericks’” (EPRI 1996). Another EPRI case study of Kansas City Power & Light’s RTP program explains: “KCPL is among the utilities striving to keep ahead in the market by capturing customers’ interest with alluring new service options before they receive appeals from competitors…KCPL wanted to adopt an RTP strategy that would take advantage of its low marginal cost energy and satisfy its large customers” (EPRI 1997).

A Survey of Utility Experience with Real Time Pricing
12
make RTP available to their non-residential retail customers by October 1998. In New York, the Public Service Commission issued an order in 2000 requiring that each of the state’s regulated electric utilities offer RTP, following the recommendations of a Commission-appointed Task Force directed to identify strategies for ensuring adequate supplies of electricity in the state.19
• Looming retail competition also meant that retail pricing would become increasingly market-
based. Approximately 15% of the RTP programs were seen as a way to build administrative experience with market-based retail pricing and to gain a better understanding of how customers would respond to dynamic, market-based prices. Several program managers further indicated that the utility wanted to provide customers with an opportunity to prepare for purchasing electricity in a restructured market.
0% 10% 20% 30% 40% 50% 60%
share price risk
gain experience with market based pricing
compliance with regulatory order
load growth
load shifting or peak load reduction
customer satistfaction and customer retention
Percentage of RTP Programs
n = 41
Figure 4. Primary utility motivations for offering RTP20
4.3. Program Status and Outlook We asked program managers to describe the status and outlook of their RTP program, in terms of their utility’s assessment of the program and future program development and marketing activities (see Table 3). Based on their responses, we classified the programs into five groups: (1) Programs introduced recently (i.e., since 2000) (2) 1990s-vintage programs that are continuing to be actively promoted (3) Programs that will continue to be offered but not actively promoted (4) Programs that are in the process of being replaced with a new voluntary RTP program (5) Programs that are in the process of being phased out, with no plans for replacement with
another voluntary RTP program
19 Niagara Mohawk Power Company already offered RTP as its default tariff for large customers, and was thus already in compliance. 20 Some respondents identified more than one primary factor, thus the sum of responses in each category total more than 41.

A Survey of Utility Experience with Real Time Pricing
13
Recently Introduced Program
15%
Maintain Program with Active Efforts
11%
Maintain Program, without Active
Efforts38%
Replace with New Voluntary RTP
Program8%
Phasing Out Voluntary RTP
28% n = 53
Figure 5. RTP program outlook21
The distribution of voluntary RTP programs among these groups indicates the general direction in which these programs are headed (see Figure 5). • Thirty-eight percent (38%) of the programs will continue to be offered, but not actively
promoted. Many of these programs are offered by utilities in states that are in a transitional period within their restructuring process. Some of these utilities are required to maintain their current RTP tariffs until the end of a rate freeze period. Others are waiting to see how the retail market develops and/or whether some form of RTP is designated as the default supply service before devoting further resources to their voluntary RTP program. Finally, a number of utilities in this group are statutorily required to offer RTP to non-residential customers, but indicate that they do not plan to pro-actively seek out participants for their RTP program.
• Twenty-eight percent (28%) of the programs are in the process of being phased out, with no
immediate plans for a new voluntary RTP tariff. Some are being phased out due to a demonstrated lack of customer interest and/or a judgment that the cost of the program exceeds its benefits. However, many programs are being phased out as a result of changes associated with restructuring. For example, some utilities that have divested their generation assets or become the default service provider no longer perceive a rationale for continuing to offer “experimental” retail supply services. In other cases, tariff provisions have become obsolete as a result of changes in the market or regulatory environment, and the utility has no stated interest in revising the tariff. Finally, several utilities have designated RTP as the default service for large customers, thereby obviating the need for any voluntary RTP program offered to the same customer class.
21 Some RTP programs are offered in multiple states, and the outlook of the program differs between states. To account for this fact, Figure 5 was constructed by counting each RTP program once for each of the states in which it is offered. This is why the sample size is 53.

A Survey of Utility Experience with Real Time Pricing
14
• Fifteen percent (15%) of the programs have been introduced recently (i.e., since 2000). For the immediate future, most will continue to be actively promoted. However, their ultimate outlook will depend on the success of continued program development and outreach and the results of future program evaluations.
• Eleven percent (11%) of the programs are 1990s-vintage programs of which the utility
maintains a generally positive view and which it plans to continue actively marketing. All of these programs are offered in states that have not restructured their retail electricity markets.
• Several utilities (8%) have identified problems with their RTP tariff and are planning to
substantially re-design it or replace it with a new voluntary RTP tariff. Two of these programs are being renovated specifically for the purpose of improving customer acceptance and participation. Two others are being cancelled because of changes in the regional electricity industry that made tariff provisions obsolete, but at the encouragement of state policymakers, the utilities may develop new voluntary RTP programs.

A Survey of Utility Experience with Real Time Pricing
15
Table 3. Tariff history and outlook. Company Start Date Tariff Status
(2003) Utility Attitude and Future Plans
Alliant (Illinois) 1998 Open The state's restructuring law requires that the utility continue to offer the tariff. However, it is not a subject of considerable attention. No plans are currently underway to make any tariff modifications.
Alliant (Iowa) 2003 Closed (provisionally)
Preliminary analysis indicated that the tariff may result in revenue erosion without any corresponding behavioral change or associated cost savings. In response, Alliant requested that the pilot be closed to new participants until an evaluation of the pilot is completed in 2004.
Ameren (Illinois) 1998 Open The state's restructuring law requires that the utility continue to offer the tariff. However, it is not a subject of considerable attention. No plans are currently underway to make any tariff modifications. When the restructuring transition period ends in 2007, the company may consider revising the tariff or offering new RTP-based rates.
American Electric Power (Oklahoma) 1994 Open The company is currently filing several minor tariff revisions. However, the tariff is otherwise "not on the radar." The PUC wants the tariff to continue as a way to provide customers with options.
Aquila (Missouri, Kansas) 1998 (MO) 1999 (KS)
Open Based on experience to date, the tariff does not appear to have generated sufficient benefits to justify the ongoing administrative expense, and Aquila is considering phasing the tariff out.
BC Hydro 1996 Open The program is not a subject of considerable attention. No plans are currently underway to make any tariff modifications. Central Hudson Gas & Electric 2001 Open The NY Public Service Commission has required that the utilities increase marketing and customer education for RTP, and may
consider tariff revisions as necessary to increase participation. Cinergy 1996 Open (OH);
Cancellation pending (IL, KY)
The Indiana and Kentucky tariffs expired at the end of 2003, and Cinergy has requested that they be cancelled. Within their Ohio service territory, Cinergy must continue to offer the RTP pilot through the transition period in the state's restructuring process, although they may later request that it be cancelled. Cinergy has proposed a set of new standard offer service options in Ohio, which include a one-part RTP tariff.
Conectiv Power Delivery (Delaware, Maryland, Virginia)
1997 Closed, Cancellation
Pending
The tariff was envisioned as a transitional design that would provide a bridge to full market pricing. The Delaware tariff has already been cancelled, and the tariffs in the other two states are currently closed to new participants and will be cancelled by the end of 2004. Customers that want access to market prices can now take service under the Market Priced Supply Services option of the standard offer service.
Consolidated Edison 2001 Open The NY Public Service Commission has required that the utilities increase marketing and customer education for RTP, and may consider tariff revisions as necessary to increase participation.
Dominion (Dominion Virginia Power) 1994 (VA) 1999 (NC)
Closed; Cancellation
pending
Due, in part, to diminished customer interest and higher marginal costs, Dominion no longer markets the tariffs. The Virginia tariff was closed to new customers in 2000 and will be cancelled in 2010, at the end of the rate cap period. The North Carolina tariff is set to expire in 2004, and is not expected to be renewed.
Duke Power 1993 Open Duke expects to continue offering the tariff, potentially with some modifications. Exelon (Commonwealth Edison – Rate HEP)
1998 Open No changes to Rate HEP are anticipated in the immediate future. However, in 2007, the only other service option available to customers with demand greater than 3 MW will expire. Rate HEP may then become the default/POLR tariff for this customer class, at which point ComEd would likely revise the tariff (e.g., to incorporate more transparent pricing).
Exelon (Commonwealth Edison – Rate RHEP)
2003 Open ComEd and the Community Energy Cooperative are interested in continuing the tariff after the pilot phase ends in 2005, provided that the results continue to be encouraging.
FirstEnergy (Jersey Central Power & Light)
1992 Closed New Jersey has adopted RTP as the default service for large customers, thus obviating the need for an experimental RTP tariff. The rate was closed to new customers in 1998, and the last remaining contract expired in 2004.
FirstEnergy (MetEd, Pennelec)
1997 Closed Due to evolution of the regional wholesale market structure since the time that the tariff was developed, many of its provisions are now obsolete. FirstEnergy is in the early stages of developing a new, voluntary, market-based rate that will more closely reflect the current regional market structure.
FirstEnergy (OhioEd, ToledoEd, CEl, Penn Power)
1996 (OhioEd) 1998 (ToledoEd)
1998 (CEI) 2003 (Penn Power)
Open (OH); Cancelled
(PA)
The tariffs at the Ohio utilities are scheduled to expire in 2005. Overall, the utility maintains a positive view of the tariff, but its future depends, in large part, on how retail competition develops in Ohio. If an active retail market does emerge, an experimental two-part rate would probably no longer be necessary, but it is conceivable that some form of RTP (most likely a one-part design) would be adopted as the basic POLR service. The tariff may be revised in the future so that hourly prices are based on MISO market prices.
Florida Power & Light 1995 Cancelled The tariff expired at the end of 2003, and will not be renewed. FP&L remains interested in demand response. Kansas City Power & Light 1995 Open Overall, the tariff has been judged to be a moderate success, and is expected to continue to be offered for the foreseeable future. No
tariff revisions are expected. Long Island Power Authority 1994 Open No plans are currently in place to modify the tariff in any way.

A Survey of Utility Experience with Real Time Pricing
16
Company Start Date Tariff Status (2003)
Utility Attitude and Future Plans
MidAmerican Energy 1998 Open The state's restructuring law requires that the utility continue to offer the tariff. However, it is not a subject of considerable attention, and no plans are currently underway to make any modifications.
New York State Electric & Gas Corporation
2001 Open The NY Public Service Commission has required that the utilities increase marketing and customer education for RTP, and may consider tariff revisions as necessary to increase participation.
Orange & Rockland Utilities 2001 Open The NY Public Service Commission has required that the utilities increase marketing and customer education for RTP, and may consider tariff revisions as necessary to increase participation.
Otter Tail Power Company 1996 Open No plans are currently in place to modify the tariff. Pacific Gas & Electric 1985 Cancelled Due to the substantial changes in the California electricity market, the pricing provisions became obsolete, and the tariff was cancelled
in 2003. Discussions are currently underway to develop a new generation of RTP tariffs in the state. Pennsylvania Power & Light 1995 Closed The tariff is set to expire in 2010, and there are currently no plans regarding whether to modify or extend the tariff at that point.
However, given the changes in the regional electricity market since the time that the tariff was developed (e.g., utility divestiture and retail competition), the original motivations for offering the tariff as a customer retention strategy are no longer applicable.
Progress Energy (North Carolina, South Carolina)
1997 Open Experience with the tariff thus far has apparently met the company’s expectations, and no plans are underway to modify the tariff in any substantive manner. The tariff was recently extended through 2009.
Rochester Gas & Electric 2001 Open The NY Public Service Commission has required that the utilities increase marketing and customer education for RTP, and may consider tariff revisions as necessary to increase participation.
San Diego Gas & Electric 2003 Open The tariff is under evaluation, and future revisions may be made pending the results of this evaluation. Seattle City Light 1996 Open Due to lack of customer interest, the utility is considering canceling the tariff. South Carolina Electric & Gas 1995 Open The tariff has not been a particular focal point for the company. For the time being, they are planning to maintain its status as a pilot,
since this allows the tariff to be cancelled without a formal rate case. They are looking into offering risk management products, in response to interest expressed by customers concerned about higher bills.
Southern California Edison 1987 Closed; Cancellation
pending
The tariff may be replaced with a new two-part RTP tariff, currently under discussion.
Southern Company (Alabama Power)
1993 Open The utility is enthusiastic about the tariff, and expects to continue offering it.
Southern Company (Georgia Power)
1992 (DA) 1993 (HA)
Open The utility is enthusiastic about the tariff, and expects to continue offering it.
Southern Company (Gulf Power)
1995 Open The tariff is not the subject of considerable attention, and no plans are currently underway to modify it.
Tennessee Valley Authority (VPI Program)
1986 Open TVA expects to continue offering VPI, but plans to evaluate the incremental benefit of additional participants and may decide to close the tariff to new customers.
Tennessee Valley Authority (Small Customer RTP Pilot)
1998 Open Because the pilot has not garnered much participation and is relatively complex to administer, TVA has recently been moving customers onto the standard interruptible tariff, and is considering closing the pilot.
Tennessee Valley Authority (2-Part RTP)
2000 Open No information available.
Wisconsin Energy 1996 Open The utility has a low opinion of the current tariff and it expects to replace it with a new, CBL-based design in 2004. Xcel Energy (Minnesota, Wisconsin) 1997 Closed (MN)
Open (WI) The Minnesota and Wisconsin tariffs expire at the end 2003 and 2004, respectively. Xcel has filed a proposal for a new RTP pilot in its Minnesota service territory. Overall, the utility is not particularly optimistic about RTP, due to doubts about the size of the market, and a perceived inability of the PUC to adequately address distributional impacts of the rate.
Xcel Energy (Colorado) 1997 Closed; Cancellation
pending
The pilot is currently set to expire at the end of 2004, and the company is not planning to renew the tariff

A Survey of Utility Experience with Real Time Pricing
17
5. RTP Program Participation A major focus of this study was to characterize and understand participation rates in voluntary RTP programs. We asked program managers to describe participation in terms of the number of customers and the amount of load enrolled in 2003, the market penetration, and enrollment trends (see Table 4). We also asked them to describe factors that may have affected participation, including marketing efforts and whether customers were offered technical assistance or access to hourly consumption data. 5.1 Summary RTP Program Participation in 2003 In 2003, approximately 2,700 non-residential customers were enrolled in the RTP programs in our sample.22 These customers comprise more than 11,000 MW of non-coincident peak demand, equivalent to approximately 1% of total installed generation capacity in the U.S.23 However, most RTP participants are associated with a small number of programs. Just three programs had more than 100 non-residential customers enrolled in 2003 (see Figure 6), accounting for 80% of all non-residential RTP participants. Georgia Power’s program, alone, accounts for 60% of all non-residential participants. In contrast, half of the programs in our survey had fewer than ten customers enrolled in 2003, and one-third had no participants.
0
2
4
6
8
10
12
14
16
0 1-10 11-25 26-50 51-100 >100
Number of Participants
Num
ber o
f Pro
gram
s n = 42
Figure 6. RTP program enrollment in 2003
Similarly, most of the load enrolled in RTP is associated with a small number of programs. Only three programs had more than 500 MW of combined, non-coincident peak demand enrolled,
22 One program, Exelon’s Rate RHEP, had 750 residential participants in 2003. All other programs had only non-residential participants. 23 Information on the amount load enrolled was not available for several programs with relatively large numbers of participants, thus 11,000 MW represents a conservative estimate of the total load served on RTP in 2003.

A Survey of Utility Experience with Real Time Pricing
18
accounting for more than 80% of all load on RTP (see Figure 7). In fact, two utilities (Georgia Power and TVA) account for 75% of the load on RTP. The vast majority of programs in our sample (31) had less than 200 MW enrolled, and 24 programs had less 50 MW enrolled.
02468
10121416
0 1-50 51-200 201-500 >500
Aggregate Peak Demand (MW)
Num
ber o
f Pro
gram
s n = 37
Figure 7. Aggregate non-coincident peak demand of RTP participants in 2003
Although the utilities in our survey span a wide range in terms of their total system peak demand (from 620 MW to 30,000 MW), the fraction of their load enrolled in RTP is generally quite small (see Figure 8). Only four RTP programs constitute more than 5% of their utilities’ total system load: Georgia Power (33%), TVA’s VPI program (11%), Public Service of Oklahoma (11%), and South Carolina Electric & Gas (9%). Nine programs have between 1% and 5% of their utilities’ system load enrolled, but most (24) have less than 1%.
0
2
4
6
8
10
12
14
16
no participants 0-1% 1-3% 3-5% >5%
Percent of Utility System Peak
Num
ber o
f Pro
gram
s n = 37
Figure 8. RTP participants’ aggregate non-coincident peak demand as a percentage of the utilities’ system peak

A Survey of Utility Experience with Real Time Pricing
19
Participation Trends: 2000-2003 Most RTP programs have witnessed a decline in enrollment since 2000 (see Figure 9). Approximately half of the programs lost 25% or more of their participants over this period, and five programs lost 100% of their participants. In most cases, the change in absolute number of customers was relatively small (e.g., less than 10 customers), although several tariffs have lost more than twenty customers. Only two programs have reportedly seen a net increase in participation since 2000.
-50
-40
-30
-20
-10
0
10
20
-100% -50% 0% 50% 100%
Change in Enrollment (Percentage of Customers)
Cha
nge
in E
nrol
lmen
t (N
umbe
r of C
usto
mer
s)
n = 30
9 data points at origin
Figure 9. Change in enrollment in RTP tariffs from 2000-200324
Most program managers attributed the customer attrition to a rise in marginal electricity prices and/or price volatility, and many suggested that the departing customers were disproportionately comprised of those that were not particularly price responsive. Many RTP programs were introduced when marginal energy prices were relatively low and stable, and program managers suggested that a large portion of participants apparently enrolled with the expectation that they would save on their electricity costs, not by monitoring and responding to prices on a daily basis, but by purchasing some portion of their load at prices based on marginal, rather than embedded costs. In fact, several program managers reported that their RTP programs were explicitly marketed on this premise. As marginal prices and/or volatility increased in recent years, many customers that did not respond to prices reportedly found that their monthly bills increased dramatically, and they subsequently dropped off RTP and returned to the utility’s standard, fixed-rate tariff.25 24 This figure does not include ten RTP programs that had no customers enrolled at any point during 2000-2003, nor does it include RTP programs that were introduced during this time span. 25 Without exception, all RTP programs in regulated markets allow participants to return to the standard tariff once their RTP contract obligation is completed.

A Survey of Utility Experience with Real Time Pricing
20
5.2 Factors That May Affect RTP Program Participation Enrollment Caps Over one-third of the tariffs imposed a cap on either the number of customers or the combined peak demand allowed to enroll. Three quarters of the tariffs with enrollment caps have current participation levels less than 50% of the size of the cap (see Figure 10). Only one program is currently fully subscribed, and three others were previously fully subscribed but have been closed to new participants and thus unable to enlist new participants to replace those that have departed. Thus, with the exception of several programs, enrollment caps to not appear to have directly restricted participation in RTP.
0
1
2
3
4
5
6
7
no participants 0-25% 25-50% 50-75% >75%
Percent of Enrollment Cap
Num
ber o
f Pro
gram
s n = 16
Figure 10. Participation rates for tariffs with enrollment caps
Eligibility Restrictions Almost all of the RTP programs limit eligibility to customers with a peak demand greater than a specified threshold. Of the 24 RTP tariffs without any enrollment cap, three-quarters currently have less than 10% of eligible customers enrolled, and only two have more than 25% enrolled (see Figure 11). Many of these tariffs have never attracted more than a handful of participants, if any, despite having an eligible base of hundreds or thousands of customers. In a few cases, the pool of potential participants is quite small; however, even these programs have a relatively low market penetration rate. Thus, based on the low market penetration rates, the eligibility restrictions do not appear to have directly limited participation levels.

A Survey of Utility Experience with Real Time Pricing
21
0123456789
10
no participants 0-10% 10-25% 25-50% >50%
Percent of Eligible Customers Enrolled
Num
ber o
f Pro
gram
s n = 24
Figure 11. Market penetration rates for RTP tariffs without enrollment caps
Program Marketing Efforts Program managers were asked to describe the types of marketing activities undertaken at their utility to promote participation in RTP and to characterize the types of customers targeted. Based on their responses, we categorized programs into those that were pro-actively marketed and those that were not, where “pro-active marketing” is defined to include activities such as holding workshops or meetings with customers to discuss the program, issuing program brochures or other informational material, and conducting analyses to identify customers likely to be amenable to RTP. Based on this categorization scheme, approximately 40% of the programs reportedly were not pro-actively marketed by the utility. In most cases, program managers indicated that information on RTP was provided to customers if they asked or at the discretion of their account representative. However, account representatives typically were not under any explicit guidance to elicit customer interest in RTP, and in some cases were reportedly not well-informed about the RTP tariff, themselves. Of the remaining 60% of RTP programs that were pro-actively marketed in some way, several were actively marketed only to a very narrow group of eligible customers, such as those that were expected to achieve at least some minimum level of passive bill savings (i.e., bill savings without modifying usage patterns) or that were planning to add some minimum amount of new load.26 Most other utilities focused their marketing on somewhat broader sub-sets of the eligible customer population, such as customers with plants running at less than full capacity or customers with on-site generation or that previous participated in interruptible service rates. Very few programs were marketed broadly across the base of eligible customers.
26 For example, Xcel-Minnesota marketed RTP only to customers that were expected, based on analyses of their load profiles, to save at least 2-3% without changing their usage in response to prices; Conectiv marketed their RTP program only to customers that were expected to add at least 1 MW of new load.

A Survey of Utility Experience with Real Time Pricing
22
Technical Assistance and Access to Hourly Data Program managers were asked whether the utility offered RTP participants any form of technical assistance to help them identify strategies for responding to prices, and whether RTP participants were provided access to their hourly energy usage data on a real-time or next-day basis. Two-thirds of the programs did not provide any form of technical assistance (see Figure 12). In some cases, program managers suggested that the types of customers targeted for RTP were expected to have sufficient technical expertise, themselves, and it was therefore unnecessary for the utility to offer assistance. Approximately half of the programs provided participants with internet-based access to hourly consumption data on either a day-after (most common) or near-real-time (less common) basis. In some of these cases, customers were charged an additional fee to access to their hourly data.
0
5
10
15
20
25
30
Technical assistance to identify strategies forprice response
Access to hourly energy usage data on a real-time or next-day basis
Num
ber o
f RTP
Pro
gram
s YesNo
n = 43
Figure 12. Provision of technical assistance and access to hourly energy usage data
Composition of Customer Base A number of program managers suggested that the modest participation rates in their RTP program were a result of the fact that their service territory had few customers suited to participation in RTP. In their mind, the vast majority of eligible customers view the risks of RTP as too great and/or the potential benefits as too small. Program managers consistently identified several specific types of customers that appear to be most amenable to RTP. Chief among these are customers with onsite generation, typically large institutional customers, such as universities and military bases, as well as industrial plants with cogeneration.27 The other group of likely RTP participants are large industrial customers, particularly those with electrically intensive batch processes that can accommodate rescheduling, 27 Several program managers reported that some customers with cogeneration use RTP as an alternative to a standby rate, and reduce the electricity output from their cogeneration units (i.e., switch to grid power) when RTP prices drop below the cost of self-generation.

A Survey of Utility Experience with Real Time Pricing
23
at least occasionally (e.g., steel mills, which operate arc furnaces). Program managers pointed to other attributes of large, industrial customers that contribute to their propensity for RTP participation, such as flat load profiles (which is beneficial in the case of tariffs designed around class-level revenue neutrality), high electricity expenditures, relatively high levels of sophistication and technical capability, and options for facility expansion. Program managers also frequently pointed to customers with onsite generation, often large institutional customers such as universities and military bases, as likely RTP participants, including large institutional customers, such as universities and military bases, as well as industrial plants with cogeneration.28
28 Several program managers reported that some customers with cogeneration use RTP as an alternative to a standby rate, and reduce the electricity output from their cogeneration units (i.e., switch to grid power) when RTP prices drop below the cost of self-generation.

A Survey of Utility Experience with Real Time Pricing
24
Table 4. RTP enrollment statistics for 2003 Company Number of
ParticipantsParticipants’ Peak Demand
(MW)
% of Utility Peak Demand
Enrolled
Market Penetration
Change in Enrollment Over
Past 3 Yrs. Alliant (Illinois) 0 0 0% 0%* 0 Alliant (Iowa) 21 79 3% 53%** 0 Ameren (CILCO) 0 0 0% 0%* 0 Ameren (CIPS, UE) 0 0 0% 0%* 0 American Electric Power (Pub. Service of Oklahoma) 41 400 11% 14%* -13 Aquila 15 15 1% 0%* 0 BC Hydro 0 0 0% 0%* 0 Central Hudson Gas & Electric 1 n/a 0% 0%* 0 Cinergy 140 n/a n/a n/a +10 Conectiv Power Delivery (Delmarva Power & Light) 0 0 0% 0%** -5 Consolidated Edison 0 0 0% 0%* 0 Dominion (Dominion Virginia) 4 31 0% 6%* -24 Duke Power 53 600 4% 35%** -47 Exelon (ComEd – Rate HEP) 9 12 0% 0%* 0 Exelon (ComEd – Rate RHEP) 750 1.5 0% 75%** 0 FirstEnergy (Jersey Central Power & Light) 1 75 1% 13%* -3 FirstEnergy (MetEd, Pennelec) 0 0 0% 0%** -2 FirstEnergy (OhioEd, ToledoEd, CEI, Penn Power) 45 100-200 1% 45%** 0 Florida Power & Light 20 11 0% 40%** -22 Kansas City Power & Light 10 11.5 0% 1%* -2 Long Island Power Authority 5 6 0% 83%** -1 MidAmerican Energy 0 0 0% 0%* -1 New York State Electric & Gas 32 n/a n/a n/a n/a Orange & Rockland Utilities 0 0 0% 0%* 0 Otter Tail Power Company (Option 1) 3 18.5 3% 15%** -2 Otter Tail Power Company (Option 2) 0 0 0% 0%** 0 Pacific Gas & Electric 0 0 0% 0%** -10 Pennsylvania Power & Light 12 75 1% 48%** -13 Progress Energy (Carolina Light & Power) 85 n/a n/a 100%** n/a Rochester Gas & Electric 0 0 0% 0%** 0 San Diego Gas & Electric 0 0 0% 0%* 0 Seattle City Light 0 0 0% 0%* 0 South Carolina Electric & Gas 21 347 9% 9%* -6 Southern California Edison 96 136 1% 2%* minimal Southern Company (Alabama Power) 30 500 4% 24%* -25 Southern Company (Georgia Power) 1600 5,000 33% 16%* minimal Southern Company (Gulf Power) 13 100-150 5% 33%* +6 Tennessee Valley Authority (VPI Program) 375-400 3,400 11% 69%* n/a Tennessee Valley Authority (Small Customer RTP Pilot) 7 10 0% 0%* -5 Tennessee Valley Authority (2-Part RTP) n/a n/a n/a n/a n/a Wisconsin Energy 0 0 0% 0%** -3 Xcel Energy (Northern States Power) 2 90 1% 30%** -3 Xcel Energy (Public Service of Colorado) 3 n/a n/a 0%* -7
Notes: n/a = data not available or deemed to be confidential. For tariffs with no enrollment cap (*), the market penetration values refer to the fraction of eligible customers enrolled. For tariffs with an enrollment cap (**), the market penetration values refer to the fraction of the cap enrolled.

A Survey of Utility Experience with Real Time Pricing
25
6. Price Response A major focus of this study was to characterize how customers have responded to RTP prices, over a broad range of RTP tariff structures and settings. We asked program managers to describe and explain the price response of RTP participants in terms of three metrics: (1) the percent of participants that appear to respond to RTP prices, (2) the minimum price at which some load response, across the portfolio of participants, is expected to occur, and (3) the maximum aggregate load reduction from RTP participants and the corresponding price. Key findings from their survey responses are discussed in this section and summarized in Table 5. 6.1 Data Availability Most program managers indicated that RTP participants’ price response had not been formally evaluated, and therefore some or all of the information requested was currently unknown. To explain why evaluations had not been conducted, program managers frequently cited one of several factors. First, many RTP programs were motivated primarily for purposes other than load management, for example, customer retention and load growth. Thus, evaluating the program’s success did not require that the utility devote resources to measuring and quantifying customers’ price response. Second, many programs have had too few participants, too short a duration, or not enough price volatility to support a rigorous assessment of price response. Finally, many programs are not integrated into the utility’s system scheduling or planning operations (in part, a consequence of the small amount of load enrolled), and thus detailed information about price response is not required for operational purposes. Nevertheless, a handful of utilities have analyzed RTP customers’ load response, using consumer demand modeling or other econometric techniques, and were able to provide quantitative responses to some or all of the survey questions on this topic.29 Other program managers provided quantitative estimates or qualitative assessments of customers’ price responsiveness, based on their familiarity with participants’ behavior, particularly when relatively few customers were enrolled. 6.2 Percent of Participants Providing Price Response We obtained quantitative estimates of the percent of participants providing price response for 20 of the 35 RTP tariffs that have had participants at one time (see Figure 13).30 Three program managers provided information on the percent of participants with a statistically significant price elasticity estimate, based on customer demand modeling. However, most program managers estimated the percent of customers that provided a “discernable” load response based on their personal judgment and familiarity with participants.
29 Formal evaluations or other econometric analyses of participants’ price response were conducted for RTP programs offered by American Electric Power (PSO), Duke Power, Exelon (ComEd-Rate RHEP), Florida Power & Light, Southern Company (Georgia Power), and Southern Company (Gulf Power). 30 For tariffs that formerly had participants, but currently have none, the percentage values refer to the percent of former participants that were price responsive. Otherwise, the value refers to the percent of current participants that are price responsive.

A Survey of Utility Experience with Real Time Pricing
26
The estimates for programs with fewer than ten customers span the widest range: 0 to 100% of participants in these programs are reportedly price responsive. The distribution among RTP programs with ten or more participants is somewhat narrower. Most program managers in this group reported that 20-60% of participants are price responsive, although several reported that a much smaller percentage appears to be price responsive.31 In addition to the quantitative estimates, several program managers of relatively large RTP programs suggested that few, if any, participants appear to respond to prices, although they did not provide numerical estimates.
0%
20%
40%
60%
80%
100%
1 10 100 1000 10000
Number of Customers Enrolled
Perc
ent P
rovi
ding
Pric
e R
espo
nse econometric analysis
program manager assessment
n = 20
Figure 13. Percentage of participants in each RTP tariff reported to be price responsive
To explain the fact that many customers apparently do not respond to hourly prices at all, program managers cited their belief that a large portion of RTP participants likely enrolled solely to purchase load at marginal cost-based prices and had no intent of monitoring or responding to prices on a daily or hourly basis. Program managers also pointed to various operational and institutional factors that they believe makes price response difficult for many customers: a lack the flexibility in customers’ operations, a lack of technical expertise, employee turnover, and a general tendency for customers simply to forget about electricity prices if they remain low and stable for prolonged periods. In many programs, price responsive participants reportedly consist primarily of customers with on-site generation and large industrial facilities with electrically-intensive loads that can be rescheduled with relative ease.32 31 In several programs, the percentage of participants that are price responsive has increased in recent years, as non-responsive customers have dropped out due to rising price volatility and/or average prices. For example, when Duke Power analyzed its RTP customers’ price elasticities through 1999, 23% of the 110 participants had elasticities statistically different from zero (Schwarz et al. 2002). The program has since lost half of its participants, following a period of exceptionally volatile prices in 1999 and 2000. When the price elasticities of the remaining customers were subsequently assessed, 50% were found to have statistically significant price elasticities (Taylor et al. 2004). 32 An analysis of Duke Power’s RTP tariff found that participants with either onsite generation or arc furnaces have price elasticities approximately ten times greater than those of other customers (Taylor et al., 2004).

A Survey of Utility Experience with Real Time Pricing
27
6.3 Price Threshold Fifteen program managers provided an estimate of the threshold price at which some RTP participants begin to respond (see Figure 14). 33 Among programs with more than 10 participants, price response typically begins to materialize at a threshold below $0.20/kWh, and the three largest programs reported that price response occurs at, or below, $0.10/kWh. Program managers frequently reported that much of the price response at these relatively low prices consists of customers operating onsite generation. For example, in Duke’s and Georgia Power’s tariffs, such customers are reported to begin responding when prices reach $0.07-$0.08/kWh, and in Dominion’s program, customers with diesel-fired backup generators were assumed to operate these units when prices reached $0.10/kWh. For a handful of programs, several of which have fewer than ten participants, customers apparently do not begin responding until prices reach $0.30 to $0.80/kWh. In most of these cases, participants’ response is reportedly limited to periods when marginal capacity/outage cost adders (or similar pricing components) are imposed. These adders often constitute the most significant source of price variability, and several programs provide explicit notification (e.g., phone calls or email alerts) when such adders are to be applied.
$0.00
$0.10
$0.20
$0.30
$0.40
$0.50
$0.60
$0.70
$0.80
$0.90
1 10 100 1000 10000
Number of Participants
Thre
shol
d Pr
ice
for R
espo
nse
($/k
Wh)
n = 15
Figure 14. Threshold for price response
33 For one-third of the programs, this question is not applicable, because the program had no customers or no price responsive customers. For another third of the programs, the information was unavailable.

A Survey of Utility Experience with Real Time Pricing
28
6.4 Maximum Combined Load Reduction Ten program managers provided information on the maximum load reduction generated by participants in their RTP program (see Figure 15).34 Seven of these estimates were derived from program evaluations or other econometric analyses of participants’ load data. The other estimates were based on less formal methods such as visual inspection of load profiles or utility program managers’ personal knowledge of participants’ behavior. Overall, these programs have achieved fairly modest amounts of load response. Only one out of these ten utilities (Georgia Power) reported that its RTP participants have generated a load reduction greater than approximately 1% of the utility’s system peak, and only two (Georgia Power and Duke) reported load reductions greater than 100 MW. The modest load reductions among the other programs reflect a variety of factors, most importantly, the small amount of load enrolled: all of the utilities included in Figure 15, other than Georgia Power and Duke Power, had no more than 60 MW enrolled in RTP. A number of program managers also indicated that RTP prices had remained relatively low or that most of the participants were not price responsive.
0%
1%
2%
3%
4%
5%
6%
0 100 200 300 400 500 600 700 800
Max. Load Reduction (MW)
Max
. Loa
d R
educ
tion
(% o
f Util
ity S
yste
m P
eak)
econometric analysis
program manager assessment
n = 10
Figure 15. Maximum load reductions from RTP programs
For the eight programs with more than 20 participants, we calculated the maximum load reduction reported for each program as a percentage of participants’ combined non-coincident peak demand, and plotted these values against the corresponding price at which the load reduction occurred (see Figure 16).35 Six of these eight programs have generated maximum load 34 Estimates were not provided for several tariffs with relatively large numbers of customers, including Cinergy (250 participants), FirstEnergy-Ohio (45 participants), Progress Energy (85 participants), Southern California Edison (96 participants), Southern Company-Alabama Power (50 participants), and TVA’s VPI program (375 participants). 35 “Combined non-coincident peak demand” refers to the sum of each individual participant’s non-coincident peak demand. This is not an ideal scaling factor for the maximum load reduction in each program, since participants’ load factor at the time of the maximum load reduction may differ substantially from one customer to another, and

A Survey of Utility Experience with Real Time Pricing
29
reductions in the range of 12-22% of participants’ non-coincident peak demand, and two programs report maximum load reductions equal to approximately 33% of participants’ aggregate non-coincident peak demand. The hourly prices corresponding to these maximum load reductions varied significantly across programs, from as low as $0.12/kWh for one program to $6.50/kWh for another. Higher prices did not necessarily correspond to higher percentage load reductions between programs. In fact, the largest percentage load reduction (33%) reported for an RTP program occurred at a price of just $0.30/kWh.
0%
5%
10%
15%
20%
25%
30%
35%
$0.00 $1.00 $2.00 $3.00 $4.00 $5.00 $6.00 $7.00
Price ($/kWh)
Max
Loa
d R
educ
tion
as a
% o
f Pa
rtic
ipan
ts' N
on-C
oinc
iden
t Pea
k D
eman
d
Figure 16. Maximum percentage load reductions from RTP programs36
from one program to another. A better approach would be to use an estimate of what the combined demand of RTP customers would have been at the time of the load reduction, if they were billed on standard tariff rates, rather than RTP. However, such estimates were not generally provided. 36 Figure 16 includes only those programs with more than 20 participants, since the data for programs with fewer participants may disproportionately reflect the price response of one or two large customers. Georgia Power’s two tariffs (RTP-DA and RTP-HA) are shown as separate data points in Figure 16, unlike previous figures, since participants in the two programs faced different prices at the time that the maximum load reduction in each occurred.

A Survey of Utility Experience with Real Time Pricing
30
Table 5. RTP participant price response statistics
Maximum Load Reduction Company Number of Participants
Percent Providing
Price Response
Threshold Price for Response ($/kWh)
MW Percent of Participants’
Peak
Percent of Utility’s Peak
Price at Max. Load
Reduction ($/kWh)
Alliant (Illinois) 0 n/a n/a n/a n/a n/a n/a Alliant (Iowa) 21 unknown unknown unknown unknown unknown unknown Ameren (CILCO) 0 n/a n/a n/a n/a n/a n/a Ameren (CIPS, UE) 0 n/a n/a n/a n/a n/a n/a American Electric Power (Pub. Service of Oklahoma)
44 50%* $0.08 40* 18% 1% $0.45
Aquila 15 unknown unknown unknown unknown unknown unknown BC Hydro 25 4% unknown unknown unknown unknown unknown Central Hudson Gas & Electric 1 unknown unknown unknown unknown unknown unknown Cinergy 250 unknown unknown unknown unknown unknown unknown Conectiv Power Delivery (Delmarva Power & Light)
5 unknown unknown unknown unknown unknown unknown
Consolidated Edison 0 n/a n/a n/a n/a n/a n/a Dominion (Dominion Virginia) 28 unknown $0.10 unknown unknown unknown unknown Duke Power 53 50%* $0.05-0.10 200* 33% 1% $0.30 Exelon (ComEd - Rate HEP) 9 unknown unknown unknown unknown unknown unknown Exelon (ComEd - Rate RHEP) 750 >50%* $0.10 0.3* 22% 0.002% $0.12 FirstEnergy (Jersey Central Power & Light) 4 25% ~$0.80 60 57% 1% unknown FirstEnergy (MetEd, Pennelec) 2 0% n/a n/a n/a n/a n/a FirstEnergy (OhioEd, ToledoEd, CEI, Penn Power)
45 unknown $0.50 unknown unknown unknown unknown
Florida Power & Light 20 25% unknown 5* 20% 0.1% $0.40 Kansas City Power & Light 14 90% $0.20 16.2 54% 0.4% $0.94 Long Island Power Authority 6 100% $0.80 confidential confidential confidential confidential MidAmerican Energy 1 0% n/a n/a n/a n/a n/a New York State Electric & Gas 32 unknown unknown unknown unknown unknown unknown Orange & Rockland Utilities 0 n/a n/a n/a n/a n/a n/a Otter Tail Power Company (Option 1) 3 33% unknown 5-6 ~30% 1% >$0.20 Otter Tail Power Company (Option 2) 0 n/a n/a n/a n/a n/a n/a Pacific Gas & Electric 45 50% $0.30 10-15* 10-15% 0.1% $1.00 Pennsylvania Power & Light 12 33% $0.10 confidential confidential confidential confidential Progress Energy (Carolina Light & Power)
85 confidential confidential confidential confidential confidential confidential
Rochester Gas & Electric 0 n/a n/a n/a n/a n/a n/a San Diego Gas & Electric 0 n/a n/a n/a n/a n/a n/a Seattle City Light 3 0% n/a n/a n/a n/a n/a South Carolina Electric & Gas 21 0% n/a n/a n/a n/a n/a Southern California Edison 96 unknown unknown unknown unknown unknown unknown Southern Company (Alabama Power) 50 60% $0.30 unknown unknown unknown unknown Southern Company (Georgia Power) 60 (HA)
1540 (DA) 10% $0.08 250 (HA)*
500 (DA)*30% (HA) 12% (DA)
5% $6.50 (HA) $1.50 (DA)
Southern Company (Gulf Power) 20 25% $0.15-0.20 23* 15% 1% $0.70 TVA (Small Customer Pilot) 7 0% n/a n/a n/a n/a n/a TVA (Two-part RTP) unknown unknown unknown unknown unknown unknown unknown TVA (VPI Program) 375-400 unknown $0.04 unknown unknown unknown unknown Wisconsin Energy 3 unknown unknown unknown unknown unknown unknown Xcel Energy (Northern States Power) 2 100% $0.10-0.15 unknown unknown unknown unknown Xcel Energy (Public Service of Colorado) 3 unknown unknown unknown unknown unknown unknown Notes: Entries marked “n/a” signify programs that have had no customers or no price responsive customers. Entries marked “unknown” refer to data that was not provided by the interview subject, although qualitative information on these items may be provided in the program summaries (see Appendix C). Values based econometric analysis are marketed with an asterisk (*). Numbers of Participants column contains data that represent enrollment at the time for which price response data is applicable, and may therefore differ from the data presented in Table 4, which represent enrollment in 2003.

A Survey of Utility Experience with Real Time Pricing
31
7. Discussion: Implication for Policymakers Economists and policymakers have proposed voluntary RTP programs as a strategy for developing price responsive demand and improving the performance of competitive wholesale electricity markets. While a theoretically appealing idea, it has been challenging for utilities to design and implement voluntary RTP programs that enroll and retain a significant number of customers. Moreover, with a few notable exceptions, quantitative information on RTP participant price responsiveness is relatively sparse. In this section, we discuss the implications of our findings for policymakers that are considering RTP as a tool for improving wholesale market performance or utility resource planning. 7.1. Challenges for Implementing Voluntary RTP as a Tool for Demand Response We currently have a limited ability to predict how much demand response could be achieved through wide-scale implementation of voluntary RTP.
Two prerequisites are required for voluntary RTP programs to generate meaningful levels of demand response. First, customers must enroll. Most existing voluntary RTP tariffs have had quite modest participation levels (see Section 5). Some program managers expressed a belief that most customers view the risks of RTP as too great and/or the potential benefits as too small. However, because these programs have generally been marketed to a narrow population of customers, or not marketed at all, customer acceptance of voluntary RTP tariffs has not yet been thoroughly tested. The second prerequisite is that customers that do enroll must shift or curtail sufficient amounts of load, in aggregate, to affect market prices and/or generation planning. The voluntary RTP programs described in this study provide some insight into the magnitude of price response that similar tariffs might elicit if implemented on a wider scale (see Section 6). However, the ability to extrapolate directly from these results is limited by several factors: (1) Participation in existing voluntary RTP programs has been dominated by large industrial
customers. If future RTP programs are marketed to a more diverse customer population, the aggregate price response will depend on the relative price responsiveness of other customer classes.
(2) Many program managers reported that a significant fraction of price responsive participants use on-site generators to respond to RTP prices. Environmental permitting and siting issues are likely to limit the use of on-site generation (particularly diesel-fired emergency generators) in some regions of the U.S., which may reduce the magnitude of potential price response.
(3) Many participants in existing RTP programs reportedly enrolled with the expectation that they would save on their electricity costs, not by responding to hourly prices, but by purchasing electricity at RTP prices that are lower, on average, than standard tariff rates. If future RTP programs are targeted more exclusively toward price responsive customers, greater levels of price responsiveness may be obtained.
(4) Participants in existing RTP programs generally rely upon relatively low-tech strategies for price response. To the extent that future RTP programs are able to encourage

A Survey of Utility Experience with Real Time Pricing
32
adoption of enabling technologies, greater levels of price responsiveness may be achieved.
Restructuring of retail markets may limit utilities’ ability and incentive to offer RTP tariffs that customers will find attractive.
The two-part, CBL-based RTP tariff design, which allows customers to hedge a portion of their load against volatile prices, rose to prominence in the vertically-integrated, monopoly franchise industry setting. However, as our review of RTP programs has found (see Sections 3 and B.3), utilities in states that are pursuing retail competition have largely abandoned this tariff design. This trend likely reflects a number of factors. In states where retail rates have been unbundled, utilities’ revenue recovery is largely achieved through the unbundled T&D related charges, thus undercutting one of the primary motivations for utilities to use the CBL-based tariff design. Regulators and other policymakers in states with retail choice may also view it as inappropriate for utilities to offer hedged RTP tariffs, on the grounds that risk management products are a service to be provided by competitive retail entities and that allowing regulated utilities to offer these products as part of default service would undermine the development of retail competition. Regulated utilities may also be disinclined to offer hedged RTP because of the associated risks, transaction costs (e.g., associated with establishing participant’s CBL), practical limitations (e.g., coordinating CBL provisions with procurement requirements), and/or simply a fundamental interest in moving out of retail services. The RTP tariff design typically adopted in restructured retail markets consists of hourly-varying commodity prices charged for all energy consumption, in combination with unbundled T&D rate components. None of the voluntary RTP programs in this study based on this tariff design have attracted more than a handful of participants. Some experience with this tariff design has also been gained in several states where utilities or regulators have established it as the default service for large customers. For example, in 1998, Niagara Mohawk Power Company (NMPC) implemented day-ahead hourly pricing indexed to the NYISO market as the default commodity service for its largest customers (≥ 2 MW peak demand). Similarly, utilities in New Jersey have implemented an RTP rate with hourly prices indexed to the PJM real-time market as the default supply tariff for large customers (≥ ~1.4 MW peak demand). In these market settings, key questions for policymakers interested in facilitating price-responsive load are: (1) how many customers will remain on the default supply service, given the high degree of exposure to volatile prices; and (2) among customers that switch to a competitive supplier, how many will take service on supply contracts that provide incentives for price response? A recent study estimated that about 65% of NMPC’s large customers were exposed to market price volatility, either through the default RTP tariff or indexed supply contracts. While some of these customers were found to be price responsive, many appear to not respond at all (Goldman et al. 2004). In New Jersey, after one year, 80% of the load switched off the RTP-based default service (NJ BPU 2004).
A Survey of Utility Experience with Real Time Pricing
33
7.2. Recommendations for Improving the Design and Implementation of Voluntary RTP Programs
Sufficient resources must be devoted to developing and implementing a customer education program.
Experience to date suggests that customers are highly unlikely to gravitate in large numbers toward voluntary RTP programs on their own accord. Modest enrollment in existing RTP programs, in part, reflects the limited marketing efforts undertaken by most utilities. If voluntary RTP programs are to penetrate beyond the largest industrial customers, aggressive marketing and education campaigns will likely be required. As part of these efforts, customers must be made aware of the RTP tariff and its terms, be able to make direct comparisons of their expected electricity bills under their standard tariff and the RTP rate, and understand the savings opportunities associated with shifting and curtailing load. Ongoing customer support may also be needed to provide periodic market updates and retraining to accommodate employee turnover at customer facilities.
Customers need help understanding and managing price risk.
Most voluntary RTP tariffs have witnessed significant customer attrition following periods of heightened price volatility or increases in average prices. This phenomenon reinforces the notion that many customers have limited tolerance for price risk, and unless they are fully prepared to respond, they will seek out ways to avoid it. To address this issue, some entity must provide customers with technical assistance and training to help them understand market price formation and identify physical and financial strategies for managing their exposure to price risk. In some cases, financial incentives to accelerate the adoption of technologies that facilitate price response may also be warranted. In states without retail competition, utilities should be encouraged to offer financial risk management products, with an appropriate risk premium, and to educate customers about these types of products.
Coordinate RTP implementation with other demand-side activities.
Although energy efficiency programs and real time pricing serve a common purpose and share many overlapping technologies and customer education activities, utilities typically have not coordinated these two pursuits. Integrating many of the programmatic initiatives needed to build participation in RTP with traditional energy efficiency and DSM-related efforts (e.g., marketing, customer education, technical assistance, and technology rebate programs) could capitalize on the natural synergies between RTP and energy efficiency, yielding several specific benefits for utilities and consumers. Greater awareness and acceptance of RTP could be achieved among commercial and institutional customers, which have traditionally been the mainstays of energy efficiency programs but heretofore have not participated widely in RTP. Customers would be better positioned to evaluate investments in new end-use technologies (e.g., energy management and control systems and high efficiency air-conditioning) in light of the benefits they provide vis-à-vis participation in RTP. Transaction and administrative costs could also be minimized (e.g., related to marketing materials, site audits, and customer load analyses).

A Survey of Utility Experience with Real Time Pricing
34
RTP programs should include provision for a rigorous analysis of customer acceptance and price response.
Only about 20% of the 43 programs included in our survey have conducted any formal evaluation of participants’ price response, and even fewer have attempted to quantify the benefits to the utility and non-participants. Yet, many utilities and policymakers are reluctant to fully embrace RTP, partly because the nature and magnitude of the benefits are poorly understood. Some of the apprehension toward RTP could potentially be mitigated if a greater emphasis was placed on program evaluation, with the results made available to the broader policy community. Evaluation initiatives are also critical for identifying best-practice RTP program designs, thereby allowing RTP programs to become more standardized and widely marketed, similar to the process used in a number of states for energy efficiency programs.
7.3. Aligning Policy Objectives and RTP Program Design Utilities’ interests must be aligned with program goals.
RTP is a complex and relatively costly tariff to market and administer. Those utilities that have historically been the most successful at enrolling participants in RTP have had well-aligned incentives; in particular, they saw RTP as a valuable tool for customer retention and load building. In states that have retained a traditional industry structure with vertically-integrated, monopoly franchise utilities, the business rationale underlying these objectives is likely to persist. However, the value of RTP as a tool to pursue load retention or load growth will depend on the relationship between RTP prices and other favorable tariff rates (e.g., special contracts and interruptible service rates), as well as the preferences of state regulators. In states where utilities have divested their generation as part of restructuring and are obligated to provide default service, the underlying incentives are likely to be quite different. In this environment, the utility may be supportive of establishing RTP as the default service tariff, because it transfers wholesale market price risk onto customers. In states where policymakers are interested in promoting RTP for the purpose of developing demand response, they may need to evaluate the extent to which the utility’s interests are aligned with this particular goal, and if necessary, establish an appropriate incentive mechanism to encourage the utility to maximize the level of price response generated by RTP. Approaches include regulatory directives and performance-based incentives. As an example of the former, the California Public Utility Commission (CPUC) has established policy preferences for demand response, along with energy efficiency and renewables, as the preferred approach for investor-owned utilities to meet resource needs as part of their portfolio management responsibilities. Specifically, the CPUC has established aggressive goals for investor-owned utilities and has directed them to achieve peak savings equivalent to 5% of the state’s projected peak demand in 2007, through demand response programs and dynamic pricing tariffs.37
37 The peak demand of the three investor-owned utilities in California is about 40,000 MW, so a 5% target corresponds to a 2,000 MW reduction in their peak demand, through price-responsive demand.

A Survey of Utility Experience with Real Time Pricing
35
The costs and benefits of obtaining incremental amounts of price-responsive load from RTP must be weighed against those of other types of demand response programs.
Our review of experience with voluntary RTP programs suggests that few customers can be expected to enroll in the absence of explicit efforts to build customer awareness and acceptance. Utilities may therefore need to devote significant additional resources in the form of marketing, technical assistance, customer education, and financial incentives, to entice a significant number of customers to enroll. Policymakers should weigh the costs of these further inducements and the incremental benefits against those of implementing alternative price response mechanisms. Given the diversity and heterogeneity of retail customers, a portfolio of RTP and other demand response programs, including some fast-response options and others that build long-run price response behaviors, may be more likely to achieve meaningful levels of price-responsive load than focusing exclusively on RTP.38
Policymakers need to account for the environmental and market impacts of the increased use of distributed generation
RTP program managers consistently indicated that customers with on-site generation were among those that have been most receptive to RTP and, in some cases, the most price-responsive. Policymakers should explicitly account for the fact that RTP tariffs may provide customers with an additional financial incentive to expand the use of existing, and install additional, on-site generation. Depending on the emissions characteristics and location of on-site generators relative to bulk power generation, the health and environmental consequences of increased operation of on-site generators may be negative or positive. If customers on RTP choose, or are allowed to, increase operation of existing diesel-fired generators as part of their price response strategy, adverse environmental consequences are likely to result.39 Conversely, a proliferation of distributed generation (located near load centers) is likely to mitigate the exercise of market power in transmission-constrained areas may improve the efficiency of bulk power markets. Because distributed generation options for customers are proliferating, state utility regulators should ensure that retail rate structures, such as RTP, are aligned with state environmental policies and regulations and should explicitly consider the impacts of RTP on the adoption and utilization of on-site generation equipment.
38 One option is to combine fixed rate tariffs offered by utilities or competitive suppliers with an “economic” demand response program operated by an ISO. NYISO and PJM are currently offering demand response programs that allow customers to submit load reduction bids into the day-ahead energy market, in competition with bids to supply energy. 39 As a practical matter, other elements of retail rates (e.g., demand charges, stand-by rates) may be just as influential as RTP, if not more so, to customer decision-making with respect to operation and/or installation of on-site generation.

A Survey of Utility Experience with Real Time Pricing
36
References BCUC (British Columbia Utilities Commission). 1999. Order No. G-41-99. April 16. Borenstein, S., M. Jaske, and A. Rosenfeld. 2002. “Dynamic Pricing, Advanced Metering and
Demand Response in Electricity Markets.” University of California Energy Institute. CSEM Working Paper CSEMWP-105, Berkeley CA. October.
Boisvert, R. and B. Neenan. 2003. “Social Welfare Implications of Demand Response
Programs in Competitive Electricity Markets.” Lawrence Berkeley National Laboratory. LBNL-52530, Berkeley CA. August.
Boisvert, N., P. Cappers, B. Neenan, and B. Scott. 2004. “Industrial and Commercial Customer
Response to Real Time Electricity Prices. A Study of Central and Southwest RTP Program.” (Forthcoming).
Braithwait, S.D. 2003. “Demand Response is Important - But Let’s Not Oversell (or Over-Price)
It.” Electricity Journal, June. Braithwait, S. and M. O’Sheasy. 2000. “Customer Response to Market Prices – How Much
Can You Expect When You Need it Most?” Proceedings of the EPRI International Energy Pricing Conference, Washington D.C. July.
Christensen Associates. 2000. “Electricity Customer Price Responsiveness – Literature Review
of Customer Demand Modeling and Price Elasticities.” Prepared for the California Energy Commission. September 29.
Cinergy. 2003. “Preparation for Summer 2003.” Presentation to the Indiana Utility Regulatory
Commission. May 2. Colorado PUC (Colorado Public Utilities Commission). 1996. Decision No. 96A-243E.
October 1. Costello, K. 2004. “An Observation on Real-Time Pricing: Why Practice Lags Theory.”
Electricity Journal, January/February. CPUC (California Public Utilities Commission). 2002. “Report of Working Group 2 on
Dynamic Tariff and Program Proposals.” Rulemaking R. 02-06-001, Sacramento CA. November 15.
Electric Power Research Institute (EPRI). 1996. “PSO Pioneers Successful New Approach to
Real-Time Pricing With Insight From C-Valu.” Innovators with EPRI Technology. IN-106083, Palo Alto CA. August.

A Survey of Utility Experience with Real Time Pricing
37
Electric Power Research Institute (EPRI). 1997. “C-VALU and Advanced EPRI Techniques Put ‘Real Time’ On KCPL's Side.” Innovators with EPRI Technology. IN-107711, Palo Alto CA. March.
Faruqui, A., J. Hughes, and M. Mauldin. 2001. “Real Time Pricing in California, R&D Issues
and Needs.” Prepared for the California Energy Commission. October 28. FPSC (Florida Public Service Commission). 2002. Order No. PSC-02-1634-TRF-EI. November
25. Goldman, C., N. Hopper, O. Sezgen, M. Moezzi, R. Bharvirkar, B. Neenan, R. Boisvert, P.
Cappers, and D. Pratt. 2004. “Customer Response to Day-ahead Wholesale Market Electricity Prices: Case Study of RTP Program Experience in New York.” Lawrence Berkeley National Laboratory. LBNL-54761, Berkeley CA. June.
Goldman, C., J. Eto, and G. Barbose. 2002. “California Customer Load Reductions during the
Electricity Crisis: Did They Help to Keep the Lights On?” Lawrence Berkeley National Laboratory. LBNL-49733, Berkeley CA. May.
Gulf Power Company. 1999. “Gulf Power Company Real Time Pricing Pilot.” Report to the
Florida Public Service Commission. April. Herriges, J., S. Baladi, D. Caves, and B. Neenan. 1993. “The Response of Industrial Customers
to Electricity Rates Based upon Dynamic Marginal Costs.” Review of Economics and Statistics, v75(3).
Huso, S. 2000. “Real Time Pricing – A Unified Rate Design Approach.” Pricing in Competitive
Electricity Markets, eds. A. Faruqui and K. Eakin. Boston MA: Kluwer Academic Publishers.
Jaske, M. R. and A. H. Rosenfeld. 2001. “Developing Demand Responsiveness in California’s
Energy Markets,” 76th Annual Western Economics Association Conference, July. King, K. and P. Shatrawka. 1994. “Customer Response to Real-Time Pricing in Great Britain.”
ACEEE 1994 Summer Study on Energy Efficiency in Buildings. Lafferty, R., D. Hunger, J. Ballard, G. Mahrenholz, D. Mead, and D. Bandera. 2001. “Demand
Responsiveness in Electricity Markets.” Federal Energy Regulatory Commission, Office of Markets, Tariffs, and Rates. January 15.
Long, J., B. Neenan, and B. Scott. 1999. “Advancing the Benefits of Competition to Today’s
Regulated Electricity Markets,” The Journal of Professional Pricing, v8(2), Summer. Mak, J. and B.R. Chapman. 1993. “A Survey of Current Real-time Pricing Programs.” The
Electricity Journal, v6(7), August/September.

A Survey of Utility Experience with Real Time Pricing
38
Malloy, K. 2004. “From Failure to Failure with Great Enthusiasm: A presentation on default policy.” Presentation to the Pennsylvania Public Utilities Commission. April 8.
MPUC (Minnesota Public Utilities Commission). 2001. Order Permitting Withdrawal of Tariff,
and Extending Current Real Time Pricing Program. November 8. Neenan, B., D. Pratt, P. Cappers, J. Doane, J. Anderson and R. Boisvert, C. Goldman, O. Sezgen,
G. Barbose and R. Bharvirkar, M. Kinter-Meyer, S. Shankle, and D. Bates. 2003. “How and Why Customers Respond to Electricity Prices: A Study of NYISO and NYSERDA 2002 PRL Program Performance.” Lawrence Berkeley National Laboratory. LBNL-52209, Berkeley CA. January.
New Jersey Board of Public Utilities (NJ BPU). 2004. New Jersey Electric Statistics. May 31.
http://www.bpu.state.nj.us/energy/elecSwitchData.shtml Newcomb, J. and W. Byrne. 1995. “Real-Time Pricing and Electric Utility Restructuring: Is the
Future Out of Control?” E Source Strategic Issues Paper, Boulder CO. April. O’Sheasy, M. 2002. “Is Real-Time Pricing a Panacea? If So, Why isn’t it More Widespread?”
The Electricity Journal, v15(10). December. Patrick, R. and F. Wolak. 1997. “Estimating the Customer-Level Demand for Electricity Under
Real-Time Market Prices.” Stanford University working paper, Palo Alto CA. Progress Energy. 2001. “SRS Installs Web-based Energy Management Systems for Marine
Corps Base Camp Lejeune.” Press release. July 30. Ruff, L. 2002. “Demand Response: Reality versus ‘Resource’,” The Electricity Journal,
v15(10). December. Schwarz, P., T. Taylor, M. Birmingham, and S. Darden. 2002. “Industrial Response to
Electricity Real-Time Prices: Short Run and Long Run,” Economic Inquiry, v40(4). Schweppe, F., M. Caramanis, R. Tabors, and R. Bohn. 1987. Spot pricing of electricity. Boston
MA: Kluwer Academic Publishers. Summit Blue Consulting. 2004. “Evaluation of the Energy-Smart Pricing Plan, Final Report.”
Prepared for the Community Energy Cooperative. February. Taylor, T., J. Cochell, and P. Schwarz. 2004. “24/7 Hourly Response to Electricity Real-Time
Pricing with up to Eight Summers of Experience.” Journal of Regulatory Economics, (forthcoming).
Vickrey, W. 1971. "Responsive Pricing of Public Utility Services," Bell Journal of Economics,
v2(1), Spring.

A Survey of Utility Experience with Real Time Pricing
39
Xcel Energy, MDC (Minnesota Department of Commerce), and MOAG-RUD (Minnesota Office of the Attorney General – Residential Utilities Division). 2001. “Xcel Energy’s Real-Time Pricing Program Compliance Report.” Docket No. E002/M-00-1513. February 28.

A Survey of Utility Experience with Real Time Pricing
40
Appendix A: RTP Experience Questionnaire RTP Tariff History (1) What was the program start date? (2) What was the initial impetus for the tariff?
a. Compliance with regulatory order b. Preparation for, or response to, retail competition c. Response to customer interest d. Replace conventional interruptible rates e. Other:
(3) What was the primary program goal?
a. To encourage peak demand reductions b. To encourage load growth c. To retain existing and/or attract new customers d. Whatever results from efficient pricing e. To measure customers’ price elasticity f. To gain experience with market-based pricing g. To recover revenue requirements more equitably h. Other:
(4) What is the utility management’s current attitude and level of enthusiasm for the program?
Any plans to modify the program? (5) When is the program set to expire? Will it be renewed? Marketing Strategy (6) Has the tariff been pro-actively marketed (for example, by identifying likely participants and
arranging meetings)? (7) To whom was the program marketed? What criteria are used to identify prospective
participants? (8) How were customers informed of the tariff offering?
a. Brochures b. Workshops c. Meetings with account representatives d. Meetings sponsored by utility and Public Service Commission or other entity
Participation (9) How many customers are currently enrolled, and what is their combined summer peak
demand?

A Survey of Utility Experience with Real Time Pricing
41
(10) Approximately how many customers are eligible for the tariff within your service territory
(based on minimum size restrictions, etc.)? What is their combined summer peak demand? (11) If eligible customers are able to take service from a competitive service provider, what
portion has chosen to do so? (12) What is the utility’s summer peak demand? (13) Over the past several years, are customers joining or leaving the program?
a. Number of participating customers that have dropped out b. Why have customers dropped out? c. Number of new enrollments
Performance (14) Are any published materials or regulatory proceedings available that report customer
performance? (15) How have marginal prices varied over the past several years (e.g., maximum price,
frequency of price spikes, etc.)? (16) What percent of enrolled customers appear to provide some discernable response (not
“noise”) to price movements? Do these participants possess any particular attributes? (17) Is there some threshold marginal price above which customers that actively participate in
the tariff begin to respond? (18) What is the maximum load reduction due to high prices that the program has induced? At
what marginal price did this occur? (19) What level of load reduction would likely occur at prices of:
a. 10 ¢ b. 20 ¢ c. 50 ¢
(20) Are customers provided with access (e.g., via the internet) to their hourly electricity
consumption? a. Real-time or near-real-time b. Day-after c. End of month
(21) Have customers been provided with technical assistance to help identify strategies for responding to prices?

A Survey of Utility Experience with Real Time Pricing
42
(22) Is price response from customers on the tariff incorporated into scheduling/dispatch, long-term planning (e.g., IRP), or other resource decisions?
Tariff Design (23) Is the tariff a one-part or two-part design? (24) If one-part, is it revenue neutral to a full customer class or only for the customers that
participate? (25) If one-part, how are embedded costs recovered? (26) If two-part, how is the CBL calculated? How often, and under what terms, is it updated? (27) What is the basis for the marginal energy charge?
a. A published index (which one?) b. An internal estimate of top-of-stack cost (how is it determined?) c. ISO market prices? d. Other (describe)
(28) Is there a marginal capacity charge? If so, what does it include (generation, transmission,
distribution), and how is it calculated? (29) Is there a transmission/distribution capacity component? If so, how is it calculated? (30) How far in advance are customers notified of hourly energy prices? (31) What, if any, risk management products are available to customers? (32) What portion of customers purchase risk management products? (33) Do you have any sense of what impact these hedges have had on customers’ price
responsiveness or participation

A Survey of Utility Experience with Real Time Pricing
43
Appendix B: RTP Tariff Design Features In this appendix, we identify and discuss key RTP tariff design features, describe the range of options associated with each feature, discuss some implications of alternative options, and summarize the features of the RTP tariffs included in this study (see Table A - 1). B.1. Eligibility Requirements RTP tariffs, like most utility rates, impose restrictions on which customers are eligible to enroll. Eligibility restrictions may reflect the specific goals of the tariff, such as encouraging load growth among large, high-load factor customers. They may also reflect cost-benefit related considerations, for example, the cost of additional interval metering or communication and billing systems. With few exceptions, the RTP programs included in this study are restricted to non-residential customers.40 Most programs further restrict enrollment to customers larger than a specified minimum size threshold, typically specified in terms of customers’ average or maximum billing demand.41 Half of the programs are restricted to customers with a billing demand greater than 500 kW, and one-third are available only to customers larger than 1 MW (see Figure A - 1). While one-third of the programs are technically open to non-residential customers with less than 200 kW peak demand, customers in this size range are effectively excluded from most of these programs due to the size of monthly program fees, which can be in excess of several hundred dollars per month, or charges for installing interval metering.42
0
2
4
6
8
10
anyresidential
anycustomer
any non-residential
30-199 200-499 500-999 1,000-4,999 5,000+
Min. Customer Peak Demand (kW)
Num
ber o
f RTP
Tar
iffs
n = 43
Figure A - 1. RTP tariff eligibility requirements
40 A notable exception is ConEd’s Rate RHEP, which was specifically designed for residential customers. 41 Of the tariffs that do not impose minimum size restrictions, most are offered by utilities in Illinois, who were required by the state’s restructuring law to make RTP available to all non-residential customers. 42 For example, consider a customer with an average load of 100 kW. A typical RTP program fee of $200/month would likely represent approximately 5% of their monthly bill on the standard tariff.
A Survey of Utility Experience with Real Time Pricing
44
B.2. Enrollment Limits Many RTP tariffs have enrollment limits, either in terms of the total number of customers or the aggregate demand. In some cases, enrollment limits are imposed, because the program is first offered on a “pilot” or “experimental” basis, often with the intention of removing the cap if the tariff is extended on a permanent basis. In other cases, enrollment caps reflect concerns about revenue erosion and/or administrative feasibility, and are not necessarily imposed as a temporary feature. Forty percent (40%) of the RTP tariffs included in this study impose an enrollment cap. Half of these are relatively high (i.e., greater than or equal to 300 MW or 50 customers), a few are quite low (i.e., less than 10 customers or 100 MW), and the remaining tariffs are somewhere in between, typically in the range of 20-25 customers. B.3. Tariff Pricing Structure In general, tariff pricing structures can be classified according to two basic distinctions, as either bundled or unbundled and as either one-part or multi-part. Bundled tariffs, which are the standard in states that have retained a traditional industry structure with vertically-integrated monopolies, do not have a one-to-one relationship between individual rate elements (i.e., demand, energy, and customer charges) and cost elements (i.e., generation, transmission, distribution). Unbundled tariffs, which better accommodate competition in the provision of the electricity commodity, align functional costs with distinct billing elements. For example, commodity costs might be collected through volumetric charges on energy usage, and separate volumetric and demand usage rates are constructed to recover T&D costs. The second distinction is between one-part and multi-part tariffs. A one-part tariff assesses only a volumetric charge (i.e., based on kWh consumption) to recover both fixed and variable costs. A multi-part tariff has two or more distinct rate components, one for collecting variable costs and one or more separate charges for collecting fixed costs. Figure A - 2 illustrates the difference between a one-part rate and a two-part rate. The X-axis represents energy usage and the Y-axis represents the total bill. The bill under a one-part rate is represented by a line that emanates from the origin, the slope of which is comprised of the energy rate plus another amount to collect fixed charges. A two-part rate collects fixed costs through some other mechanism, for example a demand charge, so the line that shows the relationship between the bill and energy usage emanates above the origin and has a lower slope, as that rate collects only the variable costs of supplying energy.

A Survey of Utility Experience with Real Time Pricing
45
Bill ($)
kWh
One-part rate
Two-part rate
Fixed charge
Figure A - 2. One-part vs. multi-part tariffs
RTP tariffs can, in principle, fall anywhere within this basic rubric of bundled vs. unbundled and one-part vs. multi-part tariff structures. One-part RTP tariffs recover fixed costs through adders or multipliers applied to hourly marginal costs, while multi-part RTP tariffs recover some portion of fixed costs through demand charges or customer-specific “access” charges. One particular type of multi-part RTP tariff is the two-part RTP tariff with a customer baseline load (CBL) charge. The CBL charge, an example of a customer-specific access charge, is determined for each customer by applying the standard, non-RTP tariff billing components to the customer’s historical hourly usage profile.43 Deviations between the customer’s actual usage and its CBL in each hour are settled at the prevailing marginal energy cost, so that if the customer’s actual load exceeds its CBL, it is charged for the difference at the real time price, but if it uses less than its CBL, it is credited for the difference. This can be portrayed by considering each hour’s price as a distinct rate that produces a specific relationship between kWh usage and the bill the participant pays (see Figure A - 3). In the figure, the line labeled Low RTP Price shows how the bill varies in the hour if the RTP price is low. Load above the CBL causes the bill to increase and reduced load lowers the bill at the same rate. However, the line as depicted has the property that the RTP price is lower than the average cost of the CBL, represented by the line Avg. RTP Price, which goes through the origin, so that even if load is reduced to zero, a positive access charge remains. At higher prices, the bill line rotates around the point of intersection labeled S, because it has higher slope, as illustrated by the line labeled High RTP Price in the figure. As a result, the bill rises faster for increased load and declines faster for load reductions. Moreover, as depicted, the RTP price is high enough that the 43 The CBL is typically constructed from one year or more of the customer’s historical interval data. Most CBL profiles consist of 8,760 separate load points, one for each hour of the year. However, several utilities have adopted simplified CBL structures that average hourly data over similar periods (e.g., every interval between 1:00 and 2:00 P.M. on a weekday in January) in order to smooth out idiosyncratic variations in the customer’s load and to simplify participation and administration.

A Survey of Utility Experience with Real Time Pricing
46
access charge can actually be negative. This illustrates one hour under RTP. A month’s bill would reflect the result of 720 such situations.44
Total Bill
kWh
positiveaccess charge
CBL
High RTP Price
negativeaccess charge
Low RTP PriceBillCBL
Point S
Avg. RTP Price
Figure A - 3. The revenue-neutral, CBL-based RTP tariff structure.
Some advocates of RTP see important advantages to the CBL-based design.45 First, this tariff design allows the customer to hedge its typical usage against the risk associated with volatile real time prices, whereas other tariff designs generally subject the customer to a high degree of risk, by exposing their entire load to uncertain prices. The CBL-based design also provides more certainty for the utility with respect to cost recovery, because fixed costs are largely recovered through the fixed CBL charges. It therefore protects the utility from windfall losses that result from selective participation by customers with an advantageous load profile. Other tariff designs are susceptible to revenue erosion resulting from subscription bias. Finally, this RTP design ensures that, at all times, the customer faces the marginal supply cost in making consumption decisions, the hallmark of an efficient market. Adders or multipliers incorporated into hourly energy prices (and, to a lesser extent, demand charges) distort the price signal, undermining potential efficiency gains, and can exacerbate revenue erosion resulting from load changes. Twenty tariffs included in this study are CBL-based designs (see Figure A - 4). Most are bundled tariffs, which is expected since they were implemented by vertically integrated utilities. However, several are unbundled or partially unbundled, in which case T&D related charges are
44 Because hourly RTP prices are high only a few hours in any month, and generally at or below the average tariff price the other hours, the monthly access charge is generally positive and participants’ bills are therefore positive. But, in situation like those of California in 2000, it is possible that a participant that reduced its load consistently and substantially would have a very small bill, or even a negative one, meaning that it would be paid rather than paying its supplier. Most RTP tariffs, however, preclude such a possibility by stipulating a minimum bill amount. 45 For example, see O’Sheasy (2002) and Huso (2000).

A Survey of Utility Experience with Real Time Pricing
47
assessed on customers’ actual usage, rather than on their CBL.46 A number of utilities have experimented with variations on the standard pricing structure of the CBL-based design. For example, BC Hydro and Conectiv have asymmetric pricing structures, whereby consumption above the CBL is charged at RTP prices but reductions below the CBL are credited back at the standard tariff rate; and Aquila and KCP&L have hourly prices that are calculated as weighted averages of hourly marginal costs and standard tariff rates. The other 23 tariffs included in this study have the common attribute that all of the customer’s energy consumption is charged at RTP prices. The majority of these (15) are multi-part tariffs with RTP for all energy plus demand charges. Half of these are unbundled tariffs, with RTP prices that replace the commodity charges from the customer’s standard tariff, and unbundled T&D charges that continue to apply. Two multi-part tariffs charge RTP prices for all energy, and recover remaining costs through a customer-specific fixed charge based on historical usage (similar to a CBL). Finally, six tariffs are bundled, one-part designs, which incorporate adders or multipliers into hourly prices, or are based on synthetic price schedules with implicit embedded cost elements.
0
5
10
15
20
CBL-based RTP for all energy plusdemand charge
RTP for all energy pluscust.-specific fixed charge
Multi-Part One-Part
Num
ber o
f RTP
Tar
iffs
UnbundledBundled
n = 43
Figure A - 4. Distribution of tariff pricing structures
B.4. CBL Adjustments Participants in CBL-based RTP programs are assigned a CBL upon enrollment. Yet, over time, equipment is installed or removed, business activity grows or recedes, and energy efficiency modifications are made. As a result, a customer’s CBL may cease to be representative of their “typical” hourly usage pattern. This may be advantageous or disadvantageous to customers, depending on their risk preferences, whether their load is growing or shrinking, and the level of prevailing RTP prices. For example, a customer whose load has dropped substantially since the
46 Unbundled CBL-based designs are often structured with T&D charges assessed first on the CBL and then on deviations from the CBL, the net effect of which is that unbundled T&D charges are assessed on actual usage.

A Survey of Utility Experience with Real Time Pricing
48
time that their CBL was established appears to be reducing load every hour. If RTP prices are below tariff rates, then the customer’s bill is reduced less than it would be under their standard tariff, and as a result it pays a premium for being on RTP. Conversely, if RTP prices are above tariff rates, then the customer receives a curtailment payment that makes RTP more attractive.47 Divergence between a customer’s typical usage pattern and their CBL can also have significance for the utility administering the RTP program, in terms of cost recovery and allocation, as each customer’s CBL largely defines its contribution to embedded costs. To address concerns such as these, many utilities have incorporated provisions into their RTP tariffs that allow for CBL adjustments during the term of a customer’s enrollment. Most of the CBL-based tariffs included in this study allow for adjustments to the CBL, at least under limited conditions. Roughly one-third allow the utility to make CBL adjustments at its discretion, typically on a case-by-case basis. Four tariffs include provisions for automatic adjustment if the customer’s actual usage deviates from their CBL by a specified percentage. Many programs also provide the customer with a right to request changes to their CBL, typically limited to situations where major equipment changes have been made at the their facility (e.g., energy efficiency upgrades or facility expansion/contraction). One tariff (Otter Tail’s RTP Option 1) allows participants to select an “Adjustment Factor” to automatically scale their CBL up or down each year to incorporate some fraction of the difference between their annual CBL usage and their actual usage in the prior year. B.5. Other Risk Management Options RTP tariffs without a CBL component expose customers to uncertain prices for their entire load, while those with a CBL expose customers to uncertain prices only for the difference between their actual load and their CBL, which, in some cases, may be large relative to the CBL. To provide customers with options for managing this exposure to price risk, a small number of utilities offer financial risk management contracts or special tariff features.48 Aquila, Alabama Power, and Georgia Power all offer a suite of supplemental risk management products, including price caps, price collars, and CfDs on blocks of power, and several other utilities reported that they are exploring the possibility of offering one or more of these types of products in the future.49 Georgia Power also offers customers the opportunity to purchase or sell adjustments to their CBL, based on the company’s projection of prices at the time of the transaction.
47 The latter situation calls to mind the agreements struck during the Northwest energy crisis of 2000, where large industrial customers were reportedly paid to close their plants. 48 The CBL of a two-part tariff effectively serves as a contract for differences (CfD) between the real time price and the regulated retail rate, on a quantity that varies from hour to hour. However, unlike a pure CfD financial contract, which is priced on the basis of the volatility in the underlying commodity and a competitive risk premium, the price paid for a CBL is based on the average cost of power assigned to a particular rate class. A CfD would also typically be sold for a single demand level over a block of continuous hours, rather than for a quantity that varies each hour of every day. 49 Aquila and Georgia Power’s tariffs are CBL-based designs, and their risk management products apply to load above the CBL. Alabama Power’s tariff, which is a one-part design, allows customers to purchase risk management products to cover up to 75% of their expected average billing capacity.

A Survey of Utility Experience with Real Time Pricing
49
Several additional utilities offer other types of risk management options. For example, BC Hydro offers its RTP customers the opportunity to purchase forward blocks of incremental usage above their CBL at negotiated, market-based prices.50 Customers participating in ComEd’s Rate RHEP are guaranteed a $0.50/kWh cap on real time prices as the result of a hedge purchased by the Community Energy Cooperative.51 B.6. Marginal Energy Cost Derivation The primary source of variability in RTP prices, under typical conditions (i.e., when the loss of load probability is low), is the marginal cost of energy production, which is comprised of fuel costs plus variable O&M. Consequently, the method used to derive these costs can have a significant influence on the overall character of RTP prices. Among the RTP programs reviewed in this study, five basic approaches to estimating marginal energy costs have been used.
(1) Synthetic: the utility specifies a functional relationship between the hourly price and a small number of independent variables, such as temperature, day of the week, and time of day. In some cases, a schedule of hourly prices is established in advance, and the utility selects prices from this schedule on a day-ahead basis. The synthetic approach is used most often with one-part, bundled tariffs, in which case the hourly prices incorporate embedded cost components, in addition to marginal energy costs.
(2) Utility system lambda: marginal energy costs are equal to the incremental operating cost
of the generation unit at the top of the utility’s resource stack, typically determined by the utility’s dispatch model. Bilateral spot market purchases can also be incorporated into the resource stack, although the opportunity cost of forgone wholesale transactions usually is not.
(3) Power pool prices: marginal energy costs are equal to the spot market clearing price in
the regional power pool (e.g., ISO/RTO-administered day-ahead and/or real-time energy markets).
(4) Index service prices: marginal energy costs are based on price indices published by
private firms that track bilateral spot market transactions. These indices are typically structured as single peak and off-peak prices for each day. Thus, the utility must shape the index prices if they want to provide distinct hourly RTP prices.
(5) Trading floor quotes or forecasts: marginal energy costs are based on quotes or forecasts
of day-ahead bilateral spot market prices from the utility’s trading desk. These alternative approaches have several significant differences. First, some yield more meaningful representations of the marginal cost of energy than others, and therefore differ in
50 Unused energy from these block purchases is credited back to the customer at 80%-95% of the prevailing RTP energy price, depending on the advance notice provided by the customer and the market conditions. Thus, this arrangement is similar to a CfD, but with an asymmetric payout. 51 The Cooperative saw this risk mitigation as a critical element in making the program attractive to residential customers.

A Survey of Utility Experience with Real Time Pricing
50
terms of their potential for producing efficiency gains. Second, some approaches are more transparent and verifiable (e.g., power pool prices) than others (e.g., utility system lambda or trading floor quotes), which can have implications for customer acceptance. Third, some approaches yield RTP prices that are more predictable – for example, an RTP tariff that uses a pre-established schedule of prices provides customers with more certainty about the maximum price they might face than a tariff with prices based on an ISO spot market. However, not all options are available for every utility. A utility must be located in a region with an ISO/RTO-administered market to use power pool prices for their RTP tariff, and they must not have divested their generation assets to be able to use the system lambda approach. The large majority of RTP tariffs included in this study (70%) use either power pool prices or the utility system lambda approach for deriving marginal energy costs (see Figure A - 5). The utilities that are not part of a regional power pool generally use the system lambda method, although some use index services (particularly those that have divested their generation), trading floor quotes, or a hybrid of these approaches. All of the utilities that are located in regions where ISO-administered spot markets have been established use power pool prices, typically from the day-ahead energy market (although one utility uses real-time market prices), as the source of the RTP prices. Finally, two utilities use a synthetic price schedule.
0
5
10
15
20
systemlambda
power pool index service trading floor hybrid synthetic
Num
ber o
f RTP
Tar
iffs
n = 43
Figure A - 5. Distribution of approaches to deriving marginal energy costs
B.7. Marginal Capacity and Outage Cost Adders Changes in electricity consumption, particularly during peak demand periods, affect the probability that involuntary curtailments might be required. This consumption has an associated marginal outage cost – i.e., the cost that the usage imposes as a result of the incremental increase in the risk of involuntary curtailments - in addition to incremental fuel and O&M costs. To provide an efficient price signal, many utilities therefore incorporate marginal outage costs into RTP prices, to achieve efficient rationing. The standard approach to deriving marginal outage costs is to define it as the product of the Change in the Loss of Load Probability (LOLP)

A Survey of Utility Experience with Real Time Pricing
51
associated with a change in consumption and the Value of Lost Load (VOLL). LOLP measures the change in the risk of an outage, while VOLL applies the social value to that risk. As an alternative, some utilities use a marginal capacity cost approach, in which case, the measure of value is based on the cost of new peaking generation capacity, rather than on the VOLL.52 This is equivalent to assuming that a peaker is always at the margin and that the marginal cost of a peaker exactly equates to the value of loss load. Both approaches, marginal outage cost and marginal capacity cost, add a significant source of volatility to RTP prices when reserves are short, often much greater than the volatility in marginal energy costs. More than half of the RTP tariffs included in this study incorporate marginal outage or capacity costs. Some tariffs have a single marginal outage/capacity cost adder that is dispatched when a threshold state condition is reached, usually defined in terms of system load or operating reserves. Among tariffs utilizing this approach, the adder is typically in the range of $0.25 - $1.00/kWh, when applied. Other tariffs have more complex pricing structures, with tiered adders or adders that vary continuously over a range of operating conditions. In most cases, utilities provide firm RTP price quotes a day in advance. However, because marginal outage costs may be difficult to predict even that far in advance, several tariffs allow the utility to update RTP prices, or just the marginal outage cost component, with shorter-term advance notice (e.g., one hour ahead). B.8. Interruptible Service Provisions Customers on traditional interruptible service tariffs typically receive a discount on demand charges in exchange for agreeing to reduce their load to a contracted firm load level when notified by the utility. During interruption periods, stiff penalties (often as high as $7-8/kWh) are assessed on energy consumed in excess of the customer’s contracted firm load level. Many utilities have incorporated interruptible service provisions into their RTP tariff (or allow customers to jointly participate in interruptible service and RTP), either to provide additional incentives for customers to reduce load during constrained system conditions or to offer a revenue neutral option for customers that would otherwise enroll in a traditional interruptible service tariff. Seventeen RTP tariffs included in this study incorporate interruptible service provisions. The most common example is CBL-based RTP tariffs that allow customers to purchase their CBL under the interruptible service tariff. The customer is thus able to receive some or all of the standard discount or credit associated with interruptible service. In exchange, the customer’s CBL is temporarily reduced to their firm load level during interruption periods, with all usage above their firm load charged at RTP prices. Most utilities that offer this option also assess standard non-compliance penalties on usage above the firm load level, although several utilities (AEP and Aquila) allow the customer to opt out of the penalty provision in exchange for a reduction in the interruptible service discount and/or shorter-term (e.g., one hour) advance notice of RTP prices. Several utilities with CBL-based RTP tariffs incorporate interruptible service provisions by designating all load above the CBL as interruptible, or offering this as an option, in which case the benefit to the customer is a reduced demand charge on incremental load. 52 As a variation on this approach, Ameren derives marginal capacity costs from actual market quotes for capacity resources (e.g., call options).

A Survey of Utility Experience with Real Time Pricing
52
A number of utilities with tariffs that charge all energy at RTP prices also incorporate interruptible service provisions. Some offer customers the option to designate a portion of their load as non-firm, in which case they receive a discount or credit on non-firm demand charges and are subject to non-compliance penalties during interruption periods. In the case of TVA’s VPI tariff, this is not an optional feature; all RTP load is non-firm and subject to an “excess takings” charge during interruption periods. B.9. Minimum Contract Term RTP tariffs typically require that customers commit to a minimum contract term. The duration of this term can have implications for customers’ willingness to enroll and the value of the RTP program to the utility. From the customer’s perspective, long contract terms increase the risks of participation. However, from the perspective of a utility seeking dependable peak demand reductions, short contract terms (less than several years) may limit the value of RTP for resource planning. With respect to the minimum contract term, the RTP programs included in this study fall into three groups. The vast majority (29) of programs require a minimum contract term of one year, although service often converts to a monthly term after the first year. Three programs (Georgia Power, Conectiv, and South Carolina Electric & Gas) require a contract term of five years, and one program (Alabama Power) requires a five-year contract term for new customers, but only a one-year term for existing customers. Finally, the remaining tariffs have no formally defined minimum contract term, in some cases because contract terms are negotiated on a case-by-case basis.

A Survey of Utility Experience with Real Time Pricing
53
Table A - 1. Summary of tariff design features Company Eligibility
Restrictions Enrollment
Caps Tariff
Structure Type
Tariff Structure Details CBL Adjustments Marginal Energy Cost Derivation
Marginal Outage/ Capacity Charges
Interruptible Service Provision
Price Notification
Minimum Contract
Term
Supplemental Risk Management Products
Alliant (Interstate Power & Light - Illinois; South Beloit Water, Gas & Electric)
Open to all non-residential customers
None Bundled, One-part
All energy subject to RTP price. Customer-specific multiplier (based on load factor) applied to marginal energy cost.
n/a Utility system lambda or highest day-ahead bilateral purchase price
None None 4 PM day-ahead
1 year None
Alliant (Interstate Power & Light - Iowa)
50 kW minimum billing demand and 20 MWh each month
150 MW Bundled, One-part
All energy subject to RTP price. n/a Hourly RTP prices selected from pre-established schedule of ten price levels and corresponding hours per year that each price is applied. Price schedule incorporates marginal operating cost and embedded cost elements.
None None 12 PM day-ahead
1 year None
Ameren (Central Illinois Lighting Company)
Open to all non-residential customers
None Unbundled, Multi-part
Fixed CBL charges, with deviations from CBL energy settled at the hourly RTP price. 10% profit adder applied to marginal energy cost if based on utility-owned generation. Unbundled T&D charges applied as demand charges/credits on deviations from CBL billing demand, and unbundled ancillary service charges applied as adder to marginal cost for incremental usage above CBL.
Automatically updated if actual annual usage differs by more than 20% from annual CBL usage
Utility system lambda, highest day-ahead bilateral purchase price, or lowest day-ahead sales price (depending on whether company is net seller or net buyer)
None None 3 PM day-ahead
1 year None
Ameren (Central Illinois Public Service and Union Electric)
Open to all non-residential customers
None Unbundled, Multi-part
Fixed CBL charges, with deviations from CBL energy settled at hourly RTP price. 10% adder applied to marginal energy cost, at utility discretion. Unbundled T&D charges applied as demand charges/credits on deviations from CBL billing demand.
None – CBL is fixed throughout the contract term
Based on the lower of utility system lambda or market price quotes from Ameren trading desk
The market cost of firm transmission capacity and/or call instruments are included when RTP prices are based on interchange quotes.
None 8 AM day-ahead
1 year None
American Electric Power (Public Service of Oklahoma)
1 MW (MarketChoice Program) or 500 kW (RTP-LR Program) average monthly peak demand
None Bundled, Multi-part
Fixed CBL charges, with deviations from CBL energy settled at hourly RTP price. Risk adder applied to marginal energy costs if less than standard tariff rate (equal to half the difference)
None (currently) - CBL is fixed throughout contract term
Utility system lambda Marginal transmission outage and marginal generation outage charges
Customers in RTP-LR receive a demand credit for load above their firm service level. During interruption events, their CBL is reduced to their firm service level, and they can "buy through" with no additional penalty. RTP prices can be updated up to one hour prior to interruption event.
2 PM day-ahead
1 year None
Aquila (Aquila Networks - MPS, Aquila Networks - WPK)
Open to all customers
None Bundled, Multi-part
Fixed CBL charges, with deviations from CBL energy settled at hourly RTP price. Marginal transmission charge of ~$0.03/kWh applied to incremental usage during summer peak periods.
None - CBL is fixed throughout contract term
Utility system lambda None Customers whose CBL is billed under the interruptible service tariff can opt to buy through interruption periods at RTP price in exchange for a reduction in their interruptible service discount, or retain the full discount with standard penalty provisions during interruption periods.
4 PM day ahead
1 year Custom products are available, including price caps and floors, collars, and contracts for differences. The duration of these contracts is limited to a period of time ranging from one week to six months.

A Survey of Utility Experience with Real Time Pricing
54
Company Eligibility Restrictions
Enrollment Caps
Tariff Structure
Type
Tariff Structure Details CBL Adjustments Marginal Energy Cost Derivation
Marginal Outage/ Capacity Charges
Interruptible Service Provision
Price Notification
Minimum Contract
Term
Supplemental Risk Management Products
British Columbia Hydro and Power Authority
Transmission service (>60 kV)
None Bundled, Multi-part
Fixed CBL charges, with incremental usage settled at RTP price. Reductions below the CBL of 25% or less are credited at standard tariff rate, with further reductions credited at RTP price. Demand charges based on actual demand (but not less than 75% of CBL billing demand).
May be reduced for load retention or economic development, or updated to reflect changes in production equipment or energy efficiency
RTP prices are based on the Dow Jones Mid-Columbia Index high load hours (HLH) and low load hours (LLH) prices. Customers can choose among the Firm, Non-Firm, and One-Day Pre-schedule Price Indices.
See Interruptible Service Provision
During interruption periods, incremental energy is charged at 125% of an updated RTP price, unless customer has arranged fro pre-authorized buy-through or alternative source of supply.
None (ex-post)
None Customers can buy fixed block of energy at forward price, and sell back any unused portion at a discounted price
Central Hudson Gas & Electric
Open to all non-residential customers
None Unbundled, Multi-part
All energy subject to RTP price. All non-commodity demand and volumetric charges from otherwise applicable tariff apply.
n/a NYISO day-ahead energy market LBMP
None None 5 AM day-ahead
None None
Cinergy (Cincinnati Gas & Electric; PSI Energy; Union Light, Heat & Power)
Open to all non-residential customers
None Unbundled, Multi-part
Fixed CBL charges, with deviations from CBL energy settled at hourly RTP price. Multipliers applied to marginal energy cost (110%-125% for incremental usage, 90% for decremental usage). Unbundled delivery and ancillary service charges are applied as adders to the marginal energy cost.
May be requested by customer
Utility system lambda Marginal outage cost calculated based on reserve margin
None 3 PM day-ahead
1 year None
Conectiv Power Delivery (Delmarva Power & Light)
1 MW minimum billing demand in any month
25 customers Bundled, Multi-part
Fixed CBL charges, with incremental usage charged at marginal energy cost and decremental usage credited at standard tariff rate. 7 mill adder applied to marginal energy cost. Incremental demand charges for T&D and generation capacity.
CBL reviewed by company periodically and revised as necessary to ensure sufficient revenue recovery
PJM real-time energy market LMP
None Customers on the interruptible option receive a demand credit for load in excess of firm service level. During interruption events, demand in excess of their firm service level is charged at twice the standard tariff demand rate.
None (ex-post)
5 years None
Consolidated Edison
100 kW minimum monthly demand
None Unbundled, Multi-part
All energy subject to RTP price. All non-commodity demand and volumetric charges from otherwise applicable tariff apply.
n/a NYISO day-ahead energy market LBMP
None None 4 PM day-ahead
1 year None
Dominion (Dominion Virginia)
5 MW minimum billing demand
None Bundled, Multi-part
Fixed CBL charges, with deviations from CBL energy settled at hourly RTP price. 6 mill profit margin adder applied to marginal energy cost.
May be requested by customer, subject to certain limitations
Utility system lambda Adders for marginal generation capacity ($0.25/kWh) and marginal transmission capacity ($0.20/kWh) applied when system load is projected to exceed 90% and 92%, respectively, of the forecast annual peak load.
All load in excess of Baseline kW level is interruptible and subject to a non-compliance penalty of six times the standard tariff demand charge during interruption events.
5 PM day-ahead
1 year None
Duke Power 1 MW minimum contract demand
150 customers Bundled, Multi-part
Fixed CBL charges, with deviations from CBL energy settled at hourly RTP price. 5 mill "incentive margin" adder applied to marginal energy cost. T&D demand charge for incremental demand.
Revised every four years Utility system lambda Adders applied for marginal generation capacity (when CT is expected to run) and T&D capacity (when > 90% of projected system peak). Total can reach ~$0.30/kWh.
Customers enrolled in the interruptible service rider receive a monthly credit based on the difference between their CBL and their Firm Contract Demand. During interruption periods, the rationing charge is excluded from credits on load reductions down to the Firm Contract Demand.
4 PM day-ahead
1 year None (currently)

A Survey of Utility Experience with Real Time Pricing
55
Company Eligibility Restrictions
Enrollment Caps
Tariff Structure
Type
Tariff Structure Details CBL Adjustments Marginal Energy Cost Derivation
Marginal Outage/ Capacity Charges
Interruptible Service Provision
Price Notification
Minimum Contract
Term
Supplemental Risk Management Products
Exelon (Commonwealth Edison)
Open to all non-residential customers
None Bundled, Multi-part
All energy subject to RTP price. 10% adder applied to marginal energy cost. All non-commodity charges from standard tariff apply.
n/a Published price index (Power Market Week's Daily Price Report) for day-ahead peak and off-peak transactions; converted to hourly prices by applying PJM West hourly price shapes
None None 7 PM day-ahead
1 year None
Exelon (Commonwealth Edison)
Residential 1,000 customers in
2003
Bundled, One-part
All energy subject to RTP price, $0.014/kWh participation credit, and volumetric "access charge" derived from class-average non-commodity costs. 10% adder included in hourly RTP price.
n/a Published price index (Power Market Week's Daily Price Report) for day-ahead peak and off-peak transactions; converted to hourly prices by applying PJM West hourly price shapes
None None 7 PM day-ahead
1 year Community Energy Cooperative provides rebate for any prices exceeding $0.50/kWh
FirstEnergy (Jersey Central Power & Light)
10 MW minimum transmission service
None Unbundled, Multi-part
All energy subject to RTP price and volumetric (peak and off-peak differentiated) fixed cost recovery adder. Demand charges plus volumetric adder apply during Critical Periods (see Marginal Outage/Capacity Charges)
n/a PJM real time energy market LMP (averaged daily for peak period; averaged monthly for off-peak period)
During designated "Critical Periods" (effectively interruption periods), a $0.34/kWh adder and a $3/kW demand charge are assessed. During "Super-Critical Periods", charges are doubled.
See Marginal Outage/Capacity Charges
None 1 year None
FirstEnergy (Metropolitan Edison, Pennelec)
400 kW minimum monthly billing demand
5% of company peak load (approx.
275 MW)
Bundled, Multi-part
Fixed CBL charges, with deviations from CBL energy settled at hourly RTP price. Transaction fee (profit adder) and delivery charge applied to incremental usage.
None - CBL is fixed throughout contract term
day-ahead market price, utility system lambda, or cost of bilateral spot market transactions
Adder applied to incremental load when temperature index is expected to exceed threshold value.
When billed under an interruptible service tariff, a customer's CBL is reduced to their firm service level during curtailment events, and standard non-compliance penalties are applicable.
4 PM day-ahead
None None
FirstEnergy (Ohio Edison, Toledo Edison, The Cleveland Electric Illuminating Company, Penn Power)
30 kW 100 customers and 1,000
MW
Bundled, Multi-part
Fixed CBL charges, with deviations from CBL energy settled at hourly RTP price. T&D adder applied to incremental usage only.
May be made by Company if the customer's actual usage falls below 50% of the CBL for three consecutive months, if onsite generation is installed, or if distribution facilities upgrades are required
Projected wholesale price for energy and capacity at the Cinergy Hub
None When billed under an interruptible service tariff, a customer's CBL is reduced during all hours of summer months to the midpoint between their firm service level and their normal CBL level. During curtailment events, their CBL is reduced to their firm service level, and standard non-compliance penalties apply to excess load. Curtailments below the firm service level receive additional Emergency RTP Credits.
1 PM day-ahead
None None
Florida Power & Light
500 kW minimum annual peak demand
50 customers Bundled, Multi-part
Fixed CBL charges, with deviations from CBL energy settled at hourly RTP price. Cost recovery adder included in hourly RTP price.
Annual adjustments automatically made when actual monthly usage or demand deviates by more than 10% from CBL.
Utility system lambda "Marginal reliability cost" adder ($0, $0.10, $0.30, or $0.90/kWh) dispatched based on system conditions
None 4 PM day-ahead
1 year None

A Survey of Utility Experience with Real Time Pricing
56
Company Eligibility Restrictions
Enrollment Caps
Tariff Structure
Type
Tariff Structure Details CBL Adjustments Marginal Energy Cost Derivation
Marginal Outage/ Capacity Charges
Interruptible Service Provision
Price Notification
Minimum Contract
Term
Supplemental Risk Management Products
Kansas City Power & Light
500 kW minimum annual peak demand
None Bundled, Multi-part
Fixed CBL charges, with deviations from CBL energy settled at a weighted average of the hourly marginal cost (energy plus outage costs) and the effective marginal cost of standard tariff. On Schedule RTP, hourly marginal cost and standard tariff are weighted 75% and 25%, respectively. On RTP-Plus, the weighting is 95%/5%, and the CBL is increased by 5%.
None - CBL is fixed throughout contract term
Utility system lambda Marginal outage costs calculated based on the projected reserve level; could reach ~$1.00/kWh.
Customers jointly participating in the Peak Load Curtailment Credit program receive one half of the standard credit. During curtailment periods, their CBL is reduced to their firm service level, and standard non-compliance penalties are assessed on excess load. Marginal outage costs may be updated up to one hour before a curtailment event.
4 PM day-ahead
None None
Long Island Power Authority
145 kW minimum billing demand in any summer month
6 customers Bundled, Multi-part
All energy subject to RTP price. Customer-specific fixed charge assessed, based on forecast of difference between customer bill under standard tariff and RTP charges. Cap on total bill equal to charges if actual usage billed under standard tariff.
n/a NYISO day-ahead energy market LBMP
Adder for marginal T&D and generation capacity ("Hourly Demand Rate") applied during a limited number of hours per year. Customers have several options related to the frequency, duration, and magnitude of the charge.
None 4 PM day-ahead
1 year None
MidAmerican Energy
Open to all non-residential customers
None Bundled, Multi-part
All energy subject to RTP price. Access charge and capacity charge also assessed on either billing demand or energy use, depending on customer rate class.
n/a Competitive bidding process, conducted daily, to supply RTP customers. If insufficient bids, RTP prices are based on lowest bilateral sales price.
None None 4 PM day-ahead
1 year None
New York State Electric & Gas Corporation
Open to all non-residential customers
25 MW Unbundled, Multi-part
All energy subject to RTP price. All non-commodity demand and volumetric charges from otherwise applicable tariff apply.
n/a NYISO day-ahead energy market LBMP
None None 5 AM day-ahead
None None
Orange & Rockland Utilities
Open to all non-residential customers
None Unbundled, Multi-part
All energy subject to RTP price. All non-commodity demand and volumetric charges from otherwise applicable tariff apply.
n/a NYISO day-ahead energy market LBMP
None None 5 AM day-ahead
1 year None
Otter Tail Power Company - RTP Option 1
200 kW minimum baseload demand
20 customers Bundled, Multi-part
Fixed CBL charges, with deviations from CBL energy settled at hourly RTP price. Profit margin included in RTP price.
Customer selects an annual Adjustment Factor to automatically adjust their CBL each year, between 0 (no change) and 1 (CBL=Actual Load).
Utility system lambda Marginal outage cost applied during conditions of congestion or stressed system reliability
None 4 PM day-ahead
1 year None
Otter Tail Power Company - RTP Option 2
200 kW minimum baseload demand
20 customers Bundled, Multi-part
All energy is subject to RTP price. Customer-specific fixed charge calculated by applying standard tariff to historical annual usage profile and subtracting contemporaneous variable costs applied to historical profile.
n/a Utility system lambda Marginal outage cost applied during conditions of congestion or stressed system reliability
None 4 PM day-ahead
1 year None
Pacific Gas & Electric
500 kW minimum billing demand
50 customers Bundled, Multi-part
All energy is subject to RTP price. Demand charge assessed on maximum demand.
n/a California Power Exchange (now-defunct)
Marginal T&D adder (~$0.25/kWh) applied during approximately one quarter of summer peak period hours; marginal generation capacity adder (~$1.00/kWh) applied up to ten days per year, when system reserves low
None Day-ahead (marginal
energy and T&D capacity
charges)
10 AM same-day (marginal
generation capacity charge)
1 year None

A Survey of Utility Experience with Real Time Pricing
57
Company Eligibility Restrictions
Enrollment Caps
Tariff Structure
Type
Tariff Structure Details CBL Adjustments Marginal Energy Cost Derivation
Marginal Outage/ Capacity Charges
Interruptible Service Provision
Price Notification
Minimum Contract
Term
Supplemental Risk Management Products
Pennsylvania Power & Light
2 MW minimum monthly maximum demand
25 customers Bundled, Multi-part
Fixed CBL charges, with deviations from CBL energy settled at hourly RTP price. Levelized marginal capacity cost (generation and T&D) and risk adjustment adder included in RTP price.
May be requested by customer
PJM day-ahead energy market LMP
None When billed under the interruptible service tariff, a customer's CBL is reduced to their firm service level during curtailment events, and standard non-compliance penalties are applicable.
5 PM day-ahead
1 year None
Progress Energy (Carolina Light & Power)
1 MW minimum contract demand
85 customers Bundled, Multi-part
Fixed CBL charges, with deviations from CBL energy settled at hourly RTP price. Profit adder assessed on incremental usage, equal to 20% of difference between average customer class rate and hourly marginal operating cost (but not less than zero).
May be requested by customer
Utility system lambda Capacity charge applied if system reserves fall below 15%; at its maximum, the charge reaches ~$0.40/kWh
None 4 PM day-ahead
None None
Rochester Gas & Electric
300 kW minimum monthly billing demand
5 customers Unbundled, Multi-part
All energy subject to RTP price. All non-commodity demand and volumetric charges from otherwise applicable tariff apply.
n/a NYISO day-ahead energy market LBMP
None None 5 AM day-ahead
1 year None
San Diego Gas & Electric
100 kW minimum annual peak demand
None Unbundled, Multi-part
All energy subject to RTP price, which incorporates a multiplier, based on class average load profile and revenue requirements, applied to marginal energy cost. All demand and volumetric charges from unbundled delivery service tariff continue to apply.
n/a Published price index (Powerex) for South Path 15 delivery
None None 5 PM day-ahead
1 year None
Seattle City Light 10 MW minimum billing demand during at least half of billing periods
None Bundled, One-part
All energy subject to RTP price plus retail service charge.
n/a Dow Jones-California Oregon Border or Dow Jones-Mid-Columbia Firm Price Index for peak and off-peak power.
None None None 1 year None
South Carolina Electric & Gas
1 MW minimum monthly maximum demand
None Bundled, Multi-part
Fixed CBL charges, with deviations from CBL energy settled at hourly RTP price. 5 mill risk adder included in RTP price. Transmission and ancillary service charges applied to incremental usage only.
Automatically updated if actual usage exceeds CBL by more than 20%
Utility system lambda Rationing Charge applied when regional generation capacity is low.
None 4 PM day-ahead
5 years None
Southern California Edison
500 kW minimum billing demand during at least 3 months
None Unbundled, Multi-part
All energy subject to RTP price plus volumetric delivery service charges. Unbundled T&D-related demand charges also assessed.
n/a Hourly RTP prices selected from pre-established price schedule that designates price in each hour based on maximum temperature in downtown L.A. of the day prior (as recorded by Nat. Weather Service). Price schedule incorporates marginal operating cost, marginal capacity cost, and embedded cost elements.
Implicit in hourly price schedule.
Customers on the interruptible RTP tariff are not assessed demand charges on the non-firm portion of their load. During interruption periods, a non-compliance penalty is assessed on energy in excess of their firm service level.
Day-ahead (participants
check temperature
index)
1 year None
Southern Company (Alabama Power)
3 MW minimum monthly billing capacity (effectively serves as a floor on customer size)
None Bundled, One-part
All energy subject to RTP prices, which includes an adder for fixed cost recovery. Minimum bill provision based on billing capacity.
n/a Utility system lambda Reliability adder ($0.15/kWh) applied if customers on interruptible tariffs are expected to be called for interruption.
None 4 PM day-ahead
(marginal operating charge)
30 minutes
ahead (reliability
adder)
1 year (existing
customers)
5 years (new
customers)
Price caps, collars, and CfDs can be purchased for 250 kW or more, but not more than 75% of capacity billed under RTP. The RTP Sentry option provides TOU pricing in July and August. Contracts are available for one year only.

A Survey of Utility Experience with Real Time Pricing
58
Company Eligibility Restrictions
Enrollment Caps
Tariff Structure
Type
Tariff Structure Details CBL Adjustments Marginal Energy Cost Derivation
Marginal Outage/ Capacity Charges
Interruptible Service Provision
Price Notification
Minimum Contract
Term
Supplemental Risk Management Products
Southern Company (Georgia Power)
250 kW (Day-Ahead Program) or 5 MW (Hour-Ahead Program) minimum monthly peak demand
None Bundled, Multi-part
Fixed CBL charges, with deviations from CBL energy settled at hourly RTP price. 2-3 mill risk recovery adder included in RTP price.
Customers can request permanent reductions in their CBL if load was removed that was part of their original CBL, or permanent increases in their CBL to reduce their risk exposure. Customers can also make temporary CBL adjustments by purchasing additional CBL or selling back some of their existing CBL, based on projected RTP prices.
Utility system lambda Marginal transmission and marginal capacity cost adders can be imposed
Customers may elect to be interruptible under one of the company’s interruptible service riders, with all applicable provisions, including non-compliance penalty.
4 PM day-ahead (RTP-2-
DA)
one hour ahead (RTP-2-
HA)
5 years Various risk protection products are available for incremental load (price caps, collars, CfDs, index swaps, and index caps). Minimum and maximum amount for each customer are determined annually.
Southern Company (Gulf Power)
2 MW minimum annual peak demand
None Bundled, One-part
All energy subject to RTP prices. Multiplier and adder applied to marginal energy cost.
n/a Utility system lambda None None 4 PM day-ahead
1 year None
Tennessee Valley Authority - VPI program
5 MW minimum, and specified SIC code
None Bundled, Multi-part
All energy subject to RTP prices. Profit adder applied to hourly energy cost. Demand charge assessed on monthly billing demand.
n/a Utility system lambda None All RTP load is interruptible and subject to an “excess takings charge” during interruption periods.
Day-ahead and hour-ahead
options
unknown None
Tennessee Valley Authority - small customer RTP pilot
non-residential customers with less than 5 MW billing demand
None Bundled, Multi-part
All energy subject to RTP prices. Profit adder applied to hourly energy cost. Demand charge assessed on monthly billing demand.
n/a Utility system lambda None All RTP load is interruptible and subject to an “excess takings charge” during interruption periods.
Day-ahead unknown None
Tennessee Valley Authority - 2-part RTP
20 MW minimum billing demand
None Bundled, Multi-part
Fixed CBL charges, with deviations from CBL energy settled at hourly RTP price.
None Utility system lambda None None Hour-ahead unknown None
Wisconsin Energy 500 kW minimum average monthly on-peak demand
300 MW Bundled, Multi-part
All energy subject to RTP prices. Demand charges assessed on max peak period demand during billing period and on max demand during previous year
n/a Utility system lambda Marginal generation capacity cost applied, based on LOLP.
Customers on the non-firm RTP tariff receive a credit against the demand charges for their non-firm load and, during interruption periods, are subject to a non-compliance penalty on demand in excess of their firm load level.
4 PM day-ahead
1 year None
Xcel Energy (Northern States Power)
1 MW minimum average monthly peak demand
300 MW Bundled, Multi-part
All energy subject to RTP prices. Demand charges assessed on max peak period demand during corresponding month of base year and on max demand during previous year
n/a Utility system lambda Marginal outage cost applied, based on system load level.
Customers on the non-firm RTP tariff receive a credit against the demand charges for their non-firm load and, during interruption periods, are subject to a non-compliance penalty on demand in excess of their firm load level.
4 PM day-ahead
1 year None
Xcel Energy (Public Service of Colorado)
500 kW billing demand in all months
None Bundled, Multi-part
Fixed CBL charges, with deviations from CBL energy settled at hourly RTP price. T&D demand charge assessed on actual peak demand, not CBL billing demand.
May be requested by the customer
Utility system lambda Marginal outage cost, based on an exponential function of percent reserves.
When billed under the interruptible service tariff, a customer's CBL is reduced to their firm service level during curtailment events, and standard non-compliance penalties are applicable.
4 PM day-ahead
1 year None
A Survey of Utility Experience with Real Time Pricing
59
Appendix C: RTP Program Case Study Summaries Alliant (Interstate Power & Light – Illinois and South Beloit Water, Gas & Electric) Real Time Pricing, Non-Residential Service Tariff Description This is a bundled, one-part RTP tariff, available to all non-residential customers in Alliant’s Illinois service territories (Interstate Power & Light and South Beloit Water, Gas & Electric). Other than the initial start up charge and the monthly customer service charge, all costs are recovered through hourly energy charges, which are equal to the product of the hourly energy price and a customer-specific multiplier factor. The hourly energy price reflects the Alliant’s day-ahead estimate of its marginal generation cost, as determined either by the company’s production cost model or, in the case that Alliant is a net buyer for that hour, the highest purchase price for interchange in the corresponding hour of the prior day. The value of the multiplier is determined based on the customer’s load factor, and is generally in the range of 2.0. Participants are notified of the hourly prices by 4 PM, the day prior. Tariff History: Utility Motivation and Goals The tariff was introduced in 1998, to comply with statutory requirements associated with Illinois’ restructuring legislation, mandating that each regulated electric utility in the state offer real-time pricing to nonresidential customers by October 1998. The tariff has not been the subject of considerable attention, and no plans are currently underway to make any modifications. Participation No customers have ever taken service under this tariff. This can be attributed to several factors. First and foremost, Alliant has relatively few large customers in its Illinois service territories that are likely to be able to manage their load in response to hourly prices. The base of potential participants is likely further diminished by certain features of the tariff, in particular, the multiplier component, which magnifies price volatility considerably. Finally, the tariff was offered solely to comply with statutory requirements, and no marketing efforts have been undertaken to inform customers of the tariff or solicit interest. Load Response With no participants, the tariff has not generated any price response.

A Survey of Utility Experience with Real Time Pricing
60
Alliant (Interstate Power & Light – Iowa) Day Ahead Hourly Time of Use Tariff Description This is a bundled, one-part RTP tariff, offered as a pilot in Alliant’s Iowa service territories (Interstate Power and Light). The tariff is available to customers with a demand of 50 kW or more in each month, with total participation currently limited to a combined peak coincident demand of 150 MW. Participants on the rate are charged for their energy consumption based on a set of hourly energy prices selected from a pre-established schedule of 10 different price levels. These prices, which range from a low of approximately $0.02/kWh to a high of $0.13/kWh, were designed by Alliant to recover embedded costs, based on customer class average load shapes, as well as marginal energy and marginal generation capacity costs. Each of the 10 prices is to be applied for a specified number of hours per year, but the choice of which price to invoke for each hour of a particular day is made on a day-ahead basis. Participants are notified of the price in each hour by 12 PM of the day prior. Tariff History: Utility Motivation and Goals The pilot was introduced in June 2003, as part of a general rate case. The primary objective of the tariff is to offer customers an opportunity to “get a feel for market prices,” in anticipation of the opening of the Midwest Independent System Operator’s (MISO) markets and the implementation of Standard Market Design (SMD). Alliant is also interested in encouraging peak demand reductions, and is hoping to learn more about customer price response. An evaluation of the pilot is planned for summer 2004, and the results of this evaluation will be used to inform any future decisions to propose tariff revisions and/or propose offering the tariff on a permanent basis. Enrollment has been closed to new customers until after completion of the evaluation study. Participation Alliant marketed the pilot by contacting targeted large industrial accounts to inform them of the tariff and elicit interest. Rate analyses were provided to those customers that already had interval metering (approximately a dozen accounts). In addition, account managers discussed the tariff with customers during more general meetings related to tariff options. Thus far, 21 customers have enrolled in the pilot, comprising an aggregate demand of 79 MW. A cross sectional group of industrial and commercial customers have opted for the rate including large manufacturers, large and medium size offices, and government buildings. Customers range in size from 18 MW down to 50 kW. Load Response Because the tariff was only recently introduced, there has not yet been sufficient opportunity to assess participants’ price response. Future evaluation efforts will address this question.

A Survey of Utility Experience with Real Time Pricing
61
Ameren (Central Illinois Light Co., Central Illinois Public Service, and Union Electric) Real Time Pricing Rider G (CILCO) and Rider RTP (CIPS and UE) Tariff Description Ameren offers RTP to all non-residential customers in its three Illinois service territories: Central Illinois Light Company (CILCO), Central Illinois Public Service (CIPS), and Union Electric (UE). The tariffs are CBL-based designs, where each customer’s CBL is developed from one year of historical hourly load data, and they are billed for their CBL usage and billing demand under their previous tariff. CILCO’s tariff has an automatic CBL adjustment provision, whereby a participant’s CBL is automatically updated if their actual usage consistently differs by more than 20% from their CBL usage, for six or more months. Usage above/below the CBL in each hour is charged/credited at the prevailing hourly price. The tariffs also have incremental T&D demand charges/credits assessed on the difference between the customer’s actual peak demand and their CBL billing demand. Hourly prices reflect the cost of company generation and the price of scheduled interchanges, although the specific method for deriving hourly prices differs somewhat between the CILCO tariff and the CIPS and UE tariffs. On the CILCO tariff, hourly prices are equal to the lower of the projected incremental cost of company-owned generation plus 10% and either the highest purchase price for scheduled interchange (if the company is expected to be a net buyer) or the lowest sale price (if the company is expected to be a net seller). The 10% adder is a profit margin on embedded generation costs. On the CIPS and UE tariffs, hourly prices are based on the lower of the market price for financially firm energy (quoted a day in advance, including the cost of any call instruments or capacity charges) and the utility’s actual incremental cost. A 10% adder is included in the hourly price, although the company may opt to exclude it if they anticipate more decremental than incremental usage. Tariff History: Utility Motivation and Goals The tariff riders were introduced in 1998 to comply with statutory requirements associated with Illinois’ restructuring legislation that required each regulated electric utility in the state to offer real-time pricing to nonresidential customers by October 1998. Since introduced, the RTP riders have not been a subject of particular attention, and no plans are currently in place to modify them in any way. When the restructuring transition period ends in 2007, the company may consider revising the tariff or offering new RTP-based rates. Participation No customers have ever enrolled on either RTP tariff, and little or no marketing efforts have been undertaken to inform customers of the tariff or solicit interest. Load Response With no customers participating, the tariffs have not generated any price response.

A Survey of Utility Experience with Real Time Pricing
62
American Electric Power (Public Service Company of Oklahoma) MarketChoice Program and Real Time Pricing Load Reduction (RTP-LR) Program Tariff Description American Electric Power (AEP) offers two RTP tariffs in its Public Service Company of Oklahoma (PSO) service territory. The first, MarketChoice, is a CBL-based tariff available to customers who establish a peak demand of at least 1 MW. The customer baseline load (CBL) profile is determined for each participant, based on one complete year of historical hourly energy consumption data. In each billing period, participants are charged for their CBL energy usage and billing demand at the rates of their otherwise applicable tariff. Energy consumption above/below the CBL in any hour is charged/credited at the prevailing hourly energy price for that hour. PSO typically does not require adjustments to the CBL if participants add new load. Hourly energy prices are composed of several elements, including projected marginal fuel and O&M costs, marginal transmission costs, and marginal outage costs, all adjusted for line losses. When the resulting price is less than the standard tariff rate, an additional risk adder is imposed, equal to one half of the difference between the standard tariff rate and the adjusted marginal costs. Participants are notified of the hourly energy prices for each day by 2 PM of the day prior. The Real Time Pricing Load Reduction (RTP-LR) tariff is structured similarly to the MarketChoice tariff. RTP-LR is available to customers who have signed an interruptible service contract and establish a peak demand of at least 500 kW. Participants in RTP-LR receive a monthly Load Reduction Credit based on the difference between their CBL billing demand and their contracted firm service level. During interruption periods, their CBL is temporarily reduced to their firm service level, for the purpose of calculating hourly energy charges during the interruption event. PSO provides notification of interruption events and prices by 2 PM, the day prior, but they may update prices up to one hour prior to the interruption event. Participants may buy through interruption periods at the prevailing hourly prices, without any penalty for exceeding their firm service level. Tariff History: Utility Motivation and Goals PSO launched MarketChoice as a pilot in 1994. The company was interested in offering real time pricing, in lieu of conventional interruptible rates, to encourage load reductions when system resources were short while also encouraging economic load growth. In part, the impetus came from existing interruptible service customers interested in buying-through interruption periods (Long et al. 1999). The pilot was intended to assess customer acceptance of RTP and determine the extent to which customers would respond to hourly prices. The tariff was made permanent in 1996, following a program evaluation. Currently, the tariff is expected to continue being offered, although it is not a major focus for the company, and no plans are underway to make major modifications.

A Survey of Utility Experience with Real Time Pricing
63
Participation Some moderate degree of marketing activity was conducted when the tariff was initially introduced, consisting primarily of periodic meetings between account representatives and large industrial customers. Over recent years, any explicit marketing for the tariff has been discontinued. Currently, 41 customers are enrolled in either the MarketChoice or the RTP-LR tariff, comprising approximately 400 MW of combined peak demand. Although price volatility has increased somewhat over the past several years, participants’ CBL has minimized much of their exposure and little change in enrollment has ensued. Load Response The pilot evaluation analyzed participants’ price response in 1998, at which point 44 customers were enrolled MarketChoice or RTP-LR, most of whom are still participating. Elasticities of substitution were calculated for each customer, and statistically significant estimates were derived for approximately half of the participants. Approximately one third of these elasticity estimates were of sizeable magnitude and statistically significant. The maximum load reduction observed was 40 MW, representing about 18% of participants’ peak demand, which occurred when prices reached $0.45/kWh. Aquila Basic RTP Service and Premium RTP Service Tariff Description Aquila offers two, similar RTP tariffs in its Kansas and Missouri service territories (Aquila Networks – WPK and Aquila Networks – MPS). Although the tariffs are technically available to all customers, the $200 monthly customer charge effectively excludes residential and small commercial customers. Both tariffs are variations on the standard CBL-based design, but they differ from one another in terms of the extent to which participants are exposed to hourly price volatility. The customer baseline load (CBL) profile is developed for each participant, based on historical hourly load data, and typically remains fixed throughout the duration of the customer’s RTP service agreement. In each billing period, a participant is charged for their CBL usage and billing demand, based on the rates of their previous tariff. Hourly energy usage above/below their CBL is then charged/credited based on a weighted average of the marginal costs for that hour and the “effective energy charge” of the customer’s standard tariff. The marginal costs are projected on a day-ahead basis, and include both marginal generation costs and a fixed marginal transmission adder applicable during summer peak periods. The effective energy charge incorporates both the energy charge of the standard tariff and any incremental demand charges that would have been incurred during a particular hour if the customer were taking service under the standard tariff. For Basic RTP Service, the hourly price is based on a weighted average between the total projected marginal costs and the effective energy charge of the standard tariff, where these terms are weighted by a factor of 80% and 20%, respectively. For the Premium RTP Service option,

A Survey of Utility Experience with Real Time Pricing
64
the weighting factors are 95% and 5%, and the customers’ CBL is increased by 5%. The net effect is that, depending on how the customer’s usage level compares to their CBL, and how marginal prices compare to the effective energy charge of the standard tariff, Premium RTP Service may expose the customer to more or less volatility in marginal prices. Interruptible service customers can retain their interruptible service contract and participate in RTP through one of two options. The customer can retain the full discount associated with the interruptible tariff, in which case their CBL is lowered to their firm load level during interruption events, and the standard penalty for exceeding their firm load level continues to apply. Alternatively, the customer may opt to “buy-through” interruption events at the hourly RTP price (rather than the standard interruptible penalty), in exchange for a reduction in their interruptible discount. A variety of risk management products are available for customers that are interested in hedging their incremental consumption above the CBL, including price caps, collars, and fixed prices (i.e., contracts for differences). Customers with multiple accounts can also aggregate across accounts for the purpose of determining hourly energy charges. Tariff History: Utility Motivation and Goals The RTP tariff was introduced in Missouri and Kansas in 1998 and 1999, respectively. The basic motivation was to provide customers with a tariff option that provided access to the electricity market. From the utility’s perspective, the primary goal was to gain experience with market-based pricing, in preparation for any move toward retail competition in their service territories. At the same time, since market prices were then below standard tariff rates, RTP provided customers with an incentive for load growth and encouraged customer retention. Based on experience to date, the tariff does not appear to have generated sufficient benefits to justify the ongoing administrative expense, and Aquila is considering phasing it out. The need to gain further experience with market-based pricing is unclear, given the subsiding interest in deregulation. In addition, since real time prices have been relatively flat, participants have had little incentive to shift load, and thus the tariff has not provided any significant cost savings for the utility. Participants have benefited by growing load at incremental costs below standard tariff rates. However, other tariff designs with less administrative complexity than RTP are available for pursuing economic development goals. Participation The tariff was initially marketed quite aggressively through workshops and meetings arranged with account representatives. The targeted accounts were those customers with the largest loads, and the greatest potential to grow or otherwise modify their loads. At the time, the company had an active marketing services group that was responsible for tariff marketing and for designing risk management products available to RTP customers. However, in the wake of financial turmoil resulting from the collapse of the merchant energy industry (in which Aquila had been heavily invested), the marketing services group has since been eliminated. As a result, marketing for the RTP tariff no longer occurs. For the past several years, participation has

A Survey of Utility Experience with Real Time Pricing
65
remained essentially constant, with 15 customers enrolled on the tariff, comprising an aggregate load of approximately 15 MW. Load Response While participants’ price response has not been formally evaluated, available evidence suggests that customers on the tariff have not engaged in any significant load shifting. In part, this is due to the fact that hourly prices in the region have remained relatively flat, and thus minimal opportunities for savings have been available. At the same time, customers enrolling on the tariff are generally assumed to have done so for the primary purpose of facilitating load growth, and thus it is likely that they would not have provided much response, even if prices had been somewhat more volatile. Based on experience with their curtailment program, Aquila expects that most customers are unlikely to respond significantly to prices below $1.00/kWh. British Columbia Hydro and Power Authority Real Time Pricing Transmission Service, Schedules 1288 and 1848 Tariff Description BC Hydro’s RTP tariff, a variation on the standard CBL-based design, is available to transmission service customers (>60 kV) only. Each participants’ CBL is developed from three years’ of historic hourly load data, and may be updated to reflect changes in production equipment or energy efficiency improvements. Customers may also negotiate with BC Hydro for other modifications to their CBL, including reductions in their CBL to facilitate customer retention and/or economic development. Like the standard CBL-based design, participants are charged for their CBL energy usage and billing demand, based on the standard transmission service rate schedule. However, BC Hydro’s RTP tariff differs from other two-part designs in several significant ways. First, rather than having energy prices that vary from hour to hour, there are only two price periods each day: high load hours (HLH, 6 AM – 10 PM) and low load hours (LLH). The price quotes are based on the Dow-Jones Mid-Columbia index prices for each day. Customers may elect to be charged based on either Firm prices, Non Firm prices, or the mid-point of the Non Firm One-Day Preschedule price range for HLH and LLH. Second, the exposure to RTP prices is asymmetric with respect to deviations from the customer baseline load (CBL). Incremental energy use is charged at the prevailing RTP price; however, decremental usage up to 25% of the CBL is credited at the otherwise applicable tariff (OAT) rate. Decremental usage above 25% of the CBL is credited at the prevailing RTP price. The impetus for this design was that customers expected that market prices would be considerably less than the OAT rates and wanted to be credited for decremental usage at the higher of the two, but charged for incremental usage at the lower of the two. Third, customers may purchase forward blocks of incremental energy usage, extending over periods of up to one year, at negotiated market-based prices. Any unused portion of block purchases is credited to the customer at 80%-95% of the prevailing RTP energy price, depending on the advance notice provided and market conditions. Finally, customers also receive demand charge credits when their maximum demand in a billing period is less than their CBL billing demand (up to a maximum credit of 25% of the CBL demand charge).

A Survey of Utility Experience with Real Time Pricing
66
Energy and demand in excess of the CBL is also subject to interruption due to generation shortages or transmission constraints. Within one hour of notification, the customer must reduce its load to their CBL energy usage. During interruption periods, incremental energy above the CBL is assessed a penalty, equal to 125% of an updated RTP price. Customers who fail to comply with curtailment requests may also be required to install and provide BC Hydro with control of load control relays. Tariff History: Utility Motivation and Goals The tariff was introduced in 1996, motivated primarily as a strategy for customer retention. At the time, BC Hydro had surplus power. Market prices were below the utility’s standard tariff rates, and large industrial customers wanted access to these prices. The RTP tariff essentially represented a compromise with respect to retail competition, where the utility’s largest customers could reap some of the benefits of competition, in the form of access to market prices for incremental load. Economic development was also a key motivation behind the tariff; this was the basis for including in the tariff the provision that allowed customers to reduce their CBL below their historical usage. Participation BC Hydro actively marketed the tariff to its larger and more flexible transmission service customers, through a variety of workshops and customer meetings. At its peak, about 25-30 accounts (out of a total of 100 eligible transmission service accounts) were enrolled in the tariff. However, during the latter half of 1998, virtually all participants dropped out, in response to higher-than-anticipated market prices (BCUC 1999). Some customers had previously negotiated reductions in their CBL in order to increase the amount of energy that could be purchased at market prices that were below the tariff rate; however, this strategy left them highly exposed when market prices dramatically rose. No customers are currently receiving RTP service. BC Hydro is in the process of creating a new default tariff rate for industrial customers, based on an inverted block structure, where rates will escalate with the amount of usage each billing period. Load Response No formal analyses have been conducted to characterize or quantify the price response of customers formerly taking service under the tariff. However, anecdotal evidence indicates that only one customer provided any significant response to prices. This general lack of price responsiveness can be attributed, in large part, to the structure of the tariff design. First, because a single peak price is in effect each day from 6 AM to 10 PM, any incentive for intra-day load shifting is greatly diminished. Second, because reductions in usage below the CBL are credited at the standard tariff rate rather than the RTP energy price, volatile market prices provide no particular incentive to reduce consumption below the CBL. These tariff design features reflect the more fundamental fact that the primary motive for the tariff was to provide customers access to lower prices (thereby facilitating load growth), not to encourage load reductions.

A Survey of Utility Experience with Real Time Pricing
67
Cinergy Rate RTP, Real Time Pricing Program (PathWiseTM) Tariff Description Cinergy offers an unbundled, CBL-based RTP tariff to all nonresidential customers in its three service territories: Cincinnati Gas and Electric (CG&E), PSI Energy (PSI), and Union Light, Heat, and Power (ULH&P). Each customer’s CBL is based on one representative year of hourly load data. Participants are charged for their CBL usage and billing demand based on the otherwise applicable tariff, and usage in each hour above/below the CBL is charged/credited at an hourly price equal to the sum of hourly commodity, delivery, and ancillary service charges. Hourly commodity charges are based on the lesser of Cinergy’s marginal operating plus marginal capacity costs or day-ahead wholesale market price quotes for firm power. Marginal capacity costs are based on the expected hourly reserve margin. Hourly commodity charges also incorporate an asymmetric multiplier factor, equal to 110%-125% for incremental usage and 90% for decremental usage. The delivery and ancillary service components to the hourly price are fixed, per kWh charges. Tariff History: Utility Motivation and Goals Cinergy introduced the tariff in 1996, in preparation for retail competition. In particular, the company wanted to offer customers additional choices that provided opportunities for energy cost savings. The expectation was that customers would be able to reduce their costs both by shifting load in response to high prices and by building incremental load at lower average prices. The PSI and ULH&P tariffs expired at the end of 2003, and Cinergy has requested that these tariffs be cancelled. Within the CG&E service territory, Cinergy is committed to continuing to offer the RTP pilot for the time being, although the company may later request that the RTP pilot be cancelled. Cinergy has proposed a set of new standard offer service options for the CG&E territory, which includes a one-part RTP tariff design, Rider SEP-HP. Participation When the tariff was first launched, an active sales campaign was initiated to inform customers of the offering. Utility marketing staff prepared brochures, and account representatives held meetings with target customers specifically for the purpose of discussing the RTP tariff. Customers were targeted on the basis of their potential ability to respond to prices as well as their load growth opportunities. A deliberate effort was made to approach customers from a variety of business types; however, most of the customers enrolling were large industrial customers. At one time, approximately 250 customers were participating in the RTP pilot, but a large number of CG&E customers left the tariff after the retail market opened in Ohio and they switched to a competitive provider. After the initial tariff roll-out, marketing for the tariff has been largely discontinued, thus relatively few new customers have been enrolled over the past several years. Currently, 140 customers across the three service territories are participating in the pilot.

A Survey of Utility Experience with Real Time Pricing
68
Load Response Informal analyses have shown that participants provide at least 40 MW of load reduction when prices exceed $0.20/kWh. For its PSI service territory, Cinergy attributes 12 MW of peak demand reduction to its RTP pilot, for the purpose of resource planning (Cinergy 2003). Conectiv Power Delivery (Delmarva Power & Light) Real Time Pricing – Firm Power and Real Time Pricing – Interruptible Power Tariff Description Conectiv offered firm and interruptible RTP tariffs to customers in its Delaware, Maryland, and Virginia service territories (formerly Delmarva Power & Light). The tariffs were available to customer with a peak demand of 1 MW and larger, and required a minimum contract term of five years. Total participation was capped at twenty-five customers (ten each in Maryland and Delaware and five in Virginia). The tariffs are a variation on the standard CBL-based design. Each participant is assigned a customer baseline load (CBL) profile, based on historical hourly usage data, and also agrees to a baseline contract demand level for each month, which may be independent from the CBL. Unlike the standard, CBL-based tariff, Conectiv’s RTP tariffs apply hourly prices only to incremental load, with reductions below the CBL credited back at the standard offer service rate. Hourly prices are equal to the PJM Real-Time Locational Marginal Price (LMP). Since these are true real time prices, participants do not receive any advance notice, although prices are provided within 30 minutes after the hour that they are in effect. Conectiv’s RTP tariffs have unbundled demand charges for generation and T&D. Delivery-related demand charges from the standard offer service tariff are assessed on each participant’s CBL billing demand, and demand above that level is assessed an incremental T&D demand charge. The supply-related demand charge of the standard offer service tariff is assessed on each participant’s monthly baseline contract demand. On the firm power tariff, all incremental demand above the baseline contract demand is assessed an Incremental Production Demand charge, equal to the PJM annual market-clearing price for capacity. On the interruptible power tariff, customers nominate a firm service level. No Incremental Production Demand charge is assessed if their firm service level is less than their baseline contract demand; otherwise, it is assessed on the difference between the two. If, during a curtailment event, a customer does not reduce their load to their firm service level or below, they are charged for the excess demand at double the demand rate of the standard, general service tariff. Tariff History: Utility Motivation and Goals The RTP tariff was introduced in 1997, in preparation for retail competition and in response to customer interest in gaining access to market prices, which, at the time, were considerably below retail rates. At least one large customer initially advocating for the tariff was facing closure if

A Survey of Utility Experience with Real Time Pricing
69
energy costs could not be reduced, which would have entailed the loss of a substantial number of jobs in the surrounding region. From the utility’s perspective, the experimental RTP tariff was seen largely as a way to retain existing large customers in the face of impending retail competition (hence the five-year contract term) and encourage economic load growth by allowing customers to build new load at market prices. The tariff was envisioned as a transitional design that would provide a bridge to full market pricing, and was not expected to continue once retail competition took hold. The Delaware tariff has already been cancelled, and the tariffs in the other two states are currently closed to new participants and will be cancelled by the end of 2004. Customers that want access to market prices for their full energy requirements can now take service under Conectiv’s Market Priced Supply Services option. Participation The tariff was targeted to a fairly narrow class of customers. When initially introduced, account representatives were informed of the new tariff offering, and an effort was made to identify and target large customers that were planning on adding at least 1 MW of new load. Customers that responded with interest were then provided with bill analyses to illustrate projected savings under the experimental tariff. In all, five (out of 100-200 eligible) customers have taken service under the tariff, comprising a combined peak demand of approximately 20 MW. These contracts have all since expired, and no customers are currently on the rate. Load Response No analyses have been conducted to characterize participants’ price response. However, available evidence indicates that, in general, participants have not actively responded to hourly prices. Although some consideration of customers’ price responsiveness was given when initially marketing the tariff, it is likely that the customers that enrolled were primarily interested in generating savings by adding new load at lower incremental prices. In at least one case, a participant evidently did not even monitor prices until receiving an exceptionally high bill following July 1999, when hourly market prices rose to unprecedented levels. The apparent lack of price responsiveness is consistent with the basic features of the tariff design. Because decremental usage below the CBL is effectively credited at the standard retail rate, rather than at the hourly RTP rate, customers have no incentive (beyond the standard tariff rate) to reduce usage below their CBL during periods of market price spikes. Dominion (Dominion Virginia Power) Schedule RTP - Real Time Pricing (VA), Rider RTP – Day Ahead Hourly Pricing (NC) Tariff Description Dominion offers RTP tariffs in its Virginia and North Carolina service territories (Dominion Virginia Power). Eligibility is restricted to customers with a maximum demand of at least 5 MW for the Virginia tariff, and an annual average demand of at least 5 MW for the North Carolina

A Survey of Utility Experience with Real Time Pricing
70
tariff. Dominion also offers RTP-based special contracts to a number of large customers, but these are not discussed in this summary. The Virginia tariff is a variation on a bundled, CBL-based design. Participants nominate a Baseline Percentage, equal to or greater than 80%, which is applied to their peak and off-peak billing demands in each month of a reference year in order to determine monthly peak and off-peak Baseline kW Levels. These values are translated into monthly peak and off-peak Baseline Energy Levels by applying monthly peak and off-peak load factors from the reference year. For each month, participants are billed for their peak and off-peak Baseline kW Levels and Baseline Energy Levels according to the standard tariff rates. All incremental energy usage above the Baseline Energy Level in each hour is charged at the hourly RTP Energy Charge. The hourly RTP Energy Charge is based on a day-ahead projection of the company’s system lambda, plus a $0.006/kWh margin. Adders for marginal generation capacity ($0.25/kWh) and marginal transmission capacity ($0.20/kWh) are also applied when the system load is projected to exceed a given threshold percentage of the forecast annual peak load (90% and 92%, respectively, for the generation and transmission charges). Customers are notified of the firm hourly prices by 5 PM, the day prior. The tariff also has an interruptible provision that requires customers to reduce their load to their Baseline kW Level during critical system conditions. A customer that does not fully comply with an interruption request is subject to non-compliance penalty equal to six times the on-peak demand charge of the standard tariff. The North Carolina tariff is also a variation on a bundled, CBL-based design. On this tariff, participants’ baseline is not a fixed quantity of energy and/or demand, but rather, it is defined in terms of a fixed percentage of their actual load. Participants nominate a Contract Percentage, up to 35%, which determines the portion of their hourly load that will be charged at the Hourly Energy Rate. Demand and energy charges under the standard tariff rates are reduced by the Contract Percentage. The Hourly Energy Rate is based on a day-ahead projection of the company’s system lambda, plus a $0.006/kWh margin. Hourly Energy Rates are available by to participants by 5 PM, the day prior. A Constraint Adder of $0.40/kWh can also be assessed on the Contract Percentage of actual load, up to 140 hours per year, during periods of low reserve margin, high loads, high costs, or a number of other circumstances. Advance notice of at least two hours is provided if the Constraint Adder will be applied. Tariff History: Utility Motivation and Goals The Virginia tariff was introduced in 1994, as a response to impending retail competition. In particular, Dominion was interested in retaining existing customers and building new load, which it hoped to do through offering a tariff that provided access to marginal cost based prices and no demand charge for incremental load, and that required a multi-year contract term (which was later eliminated). The North Carolina tariff was introduced later, in 1999, as an experimental rate intended to offer large, high load factor customers a potentially attractive tariff option. For both tariffs, the primary goal was to retain customers and foster load growth. Due, in part, to diminished customer interest and higher marginal costs, Dominion no longer markets the tariffs. The Virginia tariff has been closed to new customers since 2000, and will be cancelled in 2010, at the end of the rate cap period. The North Carolina tariff is set to expire in

A Survey of Utility Experience with Real Time Pricing
71
2004, and is not expected to be renewed. In both service territories, other tariffs are available that provide customers with much of the savings opportunity of RTP, but with less exposure to market price volatility and a simpler tariff design. Schedule 10, which is based on TOU day-types that are assigned on a day-ahead basis, has elicited substantial participation. Participation For the Virginia tariff, an initial marketing effort was conducted when the tariff was first introduced. Account representative identified eligible customers (about 60, in total), and sent them letters describing the tariff. Up until 2000/2001, the tariff had approximately 22 customers enrolled, comprising an aggregate peak demand of 513 MW. However, most of these customers left the tariff after market prices became increasingly volatile. Currently, only four customers remain on the tariff, with a total peak demand of 31 MW. Three of these customers have cogeneration, and use RTP as an economic alternative to a standby rate; that is, for these customers, RTP represents a cheaper alternative for purchasing power if the cogeneration unit fails than would a standby rate. The North Carolina tariff currently has no customers enrolled. Only six customers in the North Carolina service territory are eligible for the rate, and at one point, all of these customers were enrolled, with a combined peak demand of 94 MW. As with the Virginia tariff, participants have dropped out in recent years due to increased market price volatility. Load Response None of the customers currently enrolled on the Virginia tariff provide any discernable price response, although the steel mill customers on special RTP-based contracts do shift their production schedules around in response to prices. In the past, when larger numbers of customers were enrolled on the RTP tariffs, some portion customers evidently did respond to price movements. Some large industrial customers with the ability to reschedule operations would shift load, and customers with backup generation would run these units. As a rule of thumb, Dominion assumed customers with diesel backup generators would begin operating these units at a threshold price of $0.10/kWh. Customers with cogeneration would also respond to price movements by shutting down their generation units when prices dropped low enough. Duke Power Hourly Pricing for Incremental Load Tariff Description Duke Power’s RTP tariff is a bundled, CBL-based tariff available to customers with a contract demand of at least 1 MW. As with all two-part tariffs, a customer baseline load (CBL) profile, representing one year of hourly loads, is defined for each participant. In each billing period, the customer is charged for the energy usage and billing demand of their CBL at the rates of their otherwise applicable tariff. Energy consumption above/below the CBL in any hour is then charged/credited at the prevailing hourly price for that hour.

A Survey of Utility Experience with Real Time Pricing
72
Hourly prices are composed of several elements, including an energy charge and a rationing charge. Energy charges are calculated by Duke Power based on a day-ahead forecast of the utility’s marginal fuel and variable O&M for serving native load. Rationing charges are included to reflect reductions in system reliability during hours when capacity is tight. These charges are applied during hours when combustion turbines are expected to operate, signaling tight generation capacity, and also during hours when demand is expected to exceed 90% of forecast system peak, signaling tight capacity on the transmission and distribution systems. In total, hourly prices can reach more than $0.30/kWh. An additional Incentive Margin of 0.5 ¢/kWh, applied to the net increase in energy consumption above the CBL at the end of the billing month, provides a contribution to fixed costs. Participants are notified of the hourly prices for each day by 4 PM of the day prior. Tariff History: Utility Motivation and Goals The tariff was launched as a pilot in 1993, initially limited to 10 customers. It expanded rapidly, and the enrollment cap was raised to 150. The motivation for the tariff was twofold: to provide customers with a pricing option that gives them flexibility in controlling their energy costs, and to promote efficient utilization of Duke’s generation and transmission capacity by encouraging consumption during those hours when capacity is available, and providing the incentive to reduce consumption when capacity is tight. Participation In general, Duke has not undertaken any organized effort to enlist large numbers of customers onto hourly pricing. Decisions to approach customers about the rate are typically left to individual account managers, who provide information about alternate rate options on the basis of their knowledge of customer needs and characteristics. To the extent that Duke has engaged in active marketing efforts for the hourly pricing rate, two particular groups of customers have been targeted. There was a systematic effort to enroll large customers with self-generation, since these customers are well-suited to providing price response and since hourly pricing is likely to be considerably more economical for these customers than the standard TOU-based self-generation rate. The other target group has been customers with prospects for load growth, as incremental prices for new load (coupled with a baseline) allow Duke to make competitive offers to prospective customers. At its peak in 1999, about 100 customers were enrolled in the tariff, representing an aggregate peak demand of approximately 1,000 MW. In terms of industrial classification, almost half were in the textile industry, with strong representation also by the chemical and pipeline industries (Schwarz et al, 2002). Only three customers were non-industrial (two universities and one retail establishment). Following a period of exceptionally high prices in the summer of 2000, almost half of the participants dropped off the tariff. Most of these customers were relatively price inelastic and therefore incurred substantial increases in their monthly energy costs during this period. Participation has since stabilized and even increased a bit, despite the fact that industrial activity in the region has generally been declining. Currently, 53 customers are enrolled in the tariff, with an aggregate peak demand of approximately 600 MW.

A Survey of Utility Experience with Real Time Pricing
73
Load Response Duke Power’s hourly pricing tariff is one of relatively few for which detailed econometric analyses have been performed, and therefore a fair amount of information is known about how customers on the tariff respond to variations in price. 53 Analysis of price response during summer months indicates that the current set of participants reduce their load by 150 MW to 200 MW (or 25% – 33% of their peak demand) at prices of $0.25/kWh and higher. An examination of customers who remained on the rate after the hot summer of 2000 found that about half are price responsive. Among these customers, average elasticities for the hours of 2 PM through 10 PM in summer months range from –0.03 to –0.38 (Taylor et al., 2004). The greatest price response is exhibited by customers with large batch processes that can be rescheduled relatively easily (e.g., steel manufacturers with arc furnaces) and those with onsite generation. Both sets of customers appear to begin responding at some threshold price: about $0.13/kWh for customers with arc furnaces and about $0.07/kWh for customers with onsite generation (Schwarz et al., 2002). Exelon (Commonwealth Edison) Rate HEP, Hourly Energy Pricing Tariff Description Rate HEP is an unbundled, multi-part available to any nonresidential customer in ComEd’s service territory (except Independent Power Producers). Customers on the rate are subject to hourly energy prices and transmission and ancillary service charges for all of their usage, as well as the charges from ComEd’s unbundled delivery service tariff (which includes demand–based charges for large customers). Hourly prices are developed from published price indices of day-ahead transactions for peak and off-peak power in the region, plus a 10% adder for fixed cost recovery. ComEd converts the peak period market price for each day into hourly prices by applying historical PJM Western Hub hourly price shapes. Off-peak energy prices are developed from off-peak market transaction data from the prior month, and are fixed for each month, with a separate weekend off-peak price and weekday off-peak price. The 24 hourly prices for each day are posted on a website by 7 PM, the day prior. Tariff History: Utility Motivation and Goals The tariff was introduced in 1998, to comply with statutory requirements of Illinois’ restructuring legislation, which mandated that each regulated electric utility in the state offer real-time pricing to nonresidential customers. ComEd had previously offered an experimental RTP tariff, starting in 1996, which was available to customers larger than 10 MW. This tariff was later phased out, in order to eliminate redundancy with Rate HEP. For the immediate future, no changes to Rate HEP are anticipated. 53 Customer elasticity estimates and aggregate load reductions are estimated in Schwarz et al. (2002) and Taylor et al. (2004).

A Survey of Utility Experience with Real Time Pricing
74
In addition to Rate HEP, Rider MEP – Monthly Energy Pricing (Rider MEP) is the only other service available for customers with demands greater than 3 MW that can no longer take service under ComEd’s bundled service rate for large nonresidential customers (Rate 6L – Large General Service). However, Rider MEP will expire at the end of 2006. Rate HEP may then become the default tariff for this customer class, at which point ComEd would likely then revise the tariff (e.g., to incorporate more transparent pricing). Participation Once it became an Integrated Distribution Company (IDC) in 2002, ComEd discontinued its marketing activities. However, even prior to then, marketing for Rate HEP was not conducted, as the rate was offered simply to comply with legislative requirements, and the company had no particular enrollment goals. Nine customers are currently taking service under Rate HEP, comprising a combined maximum billing demand of 12 MW. Most of these are customers that have returned to ComEd from a competitive supplier and are not eligible for any other ComEd bundled service, having opted for a fixed multi-year Customer Transition Charge option. Load Response No detailed analyses have been conducted to characterize participants’ price response. The limited anecdotal evidence available suggests that some customers on Rate HEP do respond to prices. Further information is not known or publicly available. Exelon (Commonwealth Edison) and The Community Energy Cooperative Rate RHEP, Residential Hourly Energy Pricing/Energy-Smart Pricing PlanSM
Tariff Description Rate RHEP is a pilot program, based on one-part, bundled tariff design, offered to ComEd’s residential customers. Participants in the program are provided with a range of support services through the associated Energy-Smart Pricing PlanSM (ESPP), offered by the Community Energy Cooperative, a local non-profit organization that helps small energy consumers reduce their energy costs. To be eligible for the program, a residential customer must be a Cooperative member (requiring a $5 membership fee).54 Charges on participants’ energy use include three components: hourly energy prices, an access charge, and a participation incentive. Hourly energy prices are calculated from Platts’ day-ahead peak period (16-hour) market price into ComEd, which is converted into hourly prices using an algorithm based on the historical hourly PJM West Price shapes. The hourly energy prices are made available to participants by 7 PM, the day prior. The access charge is a volumetric charge 54 Also, some rates prohibit participation (such as all electric space heating and Nature First, the residential A/C DSM program) and some meter connections cannot accept the interval meter.

A Survey of Utility Experience with Real Time Pricing
75
assessed on participants’ total usage in each billing period. It is based on the difference between the revenues that would be generated through standard tariff charges and the projected revenues from hourly energy charges, as applied to the class average load profile. Finally, customers receive a participation credit of $0.014/kWh, which is applied to their total energy consumption in each billing period. Tariff History: Utility Motivation and Goals This tariff, launched as a pilot in 2003, is an evolution of ComEd’s previous pay-for-performance type demand response programs, and thus is very much motivated by an interest in load management and peak demand reduction. It is also viewed, by the Cooperative in particular, as a way to provide residential customers with opportunities to reduce their energy costs. As a pilot, the tariff is serving primarily as an experiment to investigate how residential customers will respond to hourly prices, in terms of both short-term price response and more persistent conservation or energy efficiency effects, and also to see what types of supporting services and tools are most valuable to residential customers receiving RTP service. Rate RHEP is scheduled to expire at the end of 2005, but ComEd and the Cooperative are both interested in continuing the program if the pilot results are encouraging. Participation Enrollment for the pilot was capped at 1,000 customers for 2003; this cap will be raised to 5,000 in 2004 and 10,000 in 2005. Marketing for the program was the responsibility of the Cooperative, who solicited participation through mailers, advertising, and community meetings. A group of 1,800 prospective participants returned interest forms during the first few months of the program’s availability. Of these, 750 eventually enrolled (the remaining portion of prospective participants either were not eligible or did not return enrollment agreements). Anecdotal evidence indicates that participating customers are pleased with the program and that participation will continue to grow throughout the subsequent phases of the pilot. As of November 2003, 100 new customers had been referred to the program for the 2004 enrollment period. Rate RHEP and the Cooperative’s ESPP were designed with the intent of providing residential customers with an acceptable combination of expected benefits, costs, and risks. Some amount of passive bill savings was deemed appropriate to reflect the transfer of price risk to the customer and the level of risk aversion characteristic of residential customers. Thus, the $0.014/kWh participation incentive was added to the tariff, providing an expected 10-12% passive bill savings. Interval meters are provided to the customers at no charge, and the costs are borne by the Cooperative. Participants are also provided with a range of support services through ESPP. The Cooperative provides general information to participants about energy prices and strategies they can employ to respond to prices. In addition, they issue price alerts, notifying customers whenever hourly energy prices for the following day will rise above $0.10/kWh. The Cooperative also purchased a price hedge on the participants’ behalf, to ensure that they are not exposed to prices exceeding $0.50/kWh.

A Survey of Utility Experience with Real Time Pricing
76
Load Response Summer 2003 was relatively mild, with ten days of price alerts (i.e., hourly energy prices exceeding $0.10/kWh) and a maximum hourly energy price of $0.12/kWh. An analysis of participants’ price response was conducted, which found that the maximum load reduction was approximately 330 kW (or 22% of the participants’ aggregate peak demand). Participants’ average price elasticity was measured to be -0.042, with a particularly strong response during price alert periods (Summit Blue Consulting 2004). Some evidence of customer fatigue was revealed, as participants’ response was found to taper off over the duration of high price periods and as the number of successive days of high prices increased. Out of the 750 customers participating during Summer 2003, 10% were consistently high responders, more than 50% responded significantly, and most of the remainder responded to some degree. Participants who live in multi-family dwellings and have central air conditioning exhibited the largest response to high hourly energy prices. Such participants reduced their electric use by almost 30% during periods when prices exceeded $0.10/kWh. Other groups of participants reduced their demand by 16-20% on average during these periods. FirstEnergy (Jersey Central Power & Light) Service Classification GTX, Experimental Transmission Service Tariff Description Jersey Central Power and Light (JCP&L), an operating company of FirstEnergy, offers a bundled, one-part RTP tariff to transmission service customers with loads greater than 10 MW. On-peak energy prices for each weekday (11 AM – 7 PM) are based on the daily average of projected PJM peak-period hourly market prices for the JCP&L zone. Off peak energy prices are based on the monthly average of projected off-peak market prices. Each bill includes an adjustment to compensate for any differences between actual and projected market prices. In addition, JCP&L can designate up to 208 hours per year as “Critical Periods”, with a minimum 30 minutes notice. During these periods, customers are assessed an additional $0.34/kWh as well as a demand charge based on their maximum 15-minute demand during any Critical Period of the billing month. JCP&L may specify two concurrent Critical Periods, referred to as a “Super Critical Period”, during which the normal Critical Period charges are doubled. Tariff History: Utility Motivation and Goals The tariff was introduced in 1992, in response to the conditions of a single large industrial customer that was looking to expand their operations, but was considering relocating if they could not receive pricing terms that better reflected their cost of service. The GTX rate was developed as a way of offering this customer favorable pricing, to retain their business. This customer also had the ability to shift load, and thus to provide potential reliability benefits to the utility, the Critical Period component was incorporated into the rate.

A Survey of Utility Experience with Real Time Pricing
77
New Jersey has since opened its retail electricity market to competitive suppliers, and the Board of Public Utilities (BPU) has adopted real time pricing as the default tariff for generation service for large customers, thus obviating the need any experimental RTP tariff, such as rate GTX. The rate was closed in 1998, and the last remaining contract expired in 2004. Participation Due to the limited number of customers eligible for the rate (only eight customers meet the minimum size threshold), no explicit marketing was conducted. Eligible customers were generally aware of the tariff through contact with their account representative, and if they wanted to take service under the tariff, they were required to receive individual approval from the BPU. Over the course of its history, four customers have taken service under the rate, comprising a combined demand of approximately 105 MW (out of 170 MW eligible). One customer is currently remaining on the rate, with a peak demand of 75 MW. Load Response Some price response among the portfolio of customers has been observed, generally limited to Critical Periods when the additional energy and demand charges are assessed. The maximum load reduction generated from the full portfolio of four customers previously on the tariff was 65 MW. However, almost all price response has been associated with a single large customer who has continued to take service under the tariff (the same customer for whom the tariff was created). The other three customers generally opted to “buy through” any Critical Periods. FirstEnergy (Metropolitan Edison and Pennsylvania Electric) Rate RTP, Real Time Price Rate Tariff Description FirstEnergy offered a CBL-based RTP tariff in its Metropolitan Edison (MetEd) and Pennsylvania Electric (Pennelec) service territories. The tariff was available to customers with a billing demand of at least 400 kW each month, up to a combined total of 5% of the company’s peak load. For each participant, a customer baseline load (CBL) profile was developed, based on one year of historical hourly load data. The CBL could have been defined at different levels of granularity: hourly values, seasonal values, or a single, flat value for the entire year. Once agreed upon, a participant’s CBL remained fixed throughout the length of their contract term (nominally five years). In each billing period, participants were charged for the energy and demand usage of their CBL, based on the rates of their otherwise applicable tariff. Incremental usage above the CBL in any hour was charged at the real time “asked” price, and decremental usage below the CBL was credited at the real time “bid” price. The “asked” price was composed of a transaction fee (profit adder), marginal operating cost, normal delivery cost, and when applicable, a marginal capacity cost. The “bid” price was composed of the marginal operating cost only. The marginal operating

A Survey of Utility Experience with Real Time Pricing
78
cost was the Company’s forecast of its hourly short-run costs based on the value of the Company’s generation, transactions with the PJM Interconnection and any two party transactions. The capacity adder, applied during periods when the temperature index is expected to exceed a threshold value, was intended to discourage consumption during PJM peaks when the company’s installed capacity requirements are established. Participants are notified of the hourly asked and bid prices by 4 PM, the day prior. Customers served under an interruptible tariff were permitted to simultaneously participate in the RTP tariff. During interruption periods, their CBL would be reduced to their firm load level, as established under their interruptible contract, and the standard penalty provisions would continue to apply if usage exceeded their firm load level. Tariff History: Utility Motivation and Goals The tariff was introduced in 1996, as a strategic response to impending retail competition in Pennsylvania. At the time, GPU (the parent company of MetEd and Pennelec, since acquired by FirstEnergy) expected to continue offering generation services, and the company wanted to provide its customers with early access to market prices, with the goal of retaining customers and encouraging load growth. Since that time, the Company chose to divest its generation assets, thus obviating the strategic objective of the RTP tariff. Moreover, the structure of the wholesale market has also evolved substantially, making obsolete many of the RTP tariff provisions, particularly those related to determination of marginal energy costs. As a result of these developments, the tariffs were closed to new customers in 1999, at the time of restructuring. The last of two customers previously taking service under the tariffs left in 2003. FirstEnergy is in the early stages of developing a new voluntary market-based (e.g., RTP) rate that will more closely reflect the current regional market structure. Participation When the tariff was first introduced, some effort was initially made within the company to roll the tariff out to its account representatives. However, no explicit marketing activities were undertaken to inform customers of the tariff or elicit interest. Many account representatives expressed discomfort with the complexity of the tariff, particularly with respect to the CBL provisions, and therefore were reluctant to discuss it with customers. No customers are currently enrolled on the tariff. At one point, two customers were on the rate, with an aggregate demand of approximately 60 MW, most of which was associated with one customer. The smaller customer was a start-up company primarily interested in gaining access to low prices for economic development. The limited participation is attributed, in part, to a general inability to shift load among customers in the utility’s service territory. In some cases, this is related to labor contract requirements that restrict industrial customers’ ability to shift production activities between work shifts. In addition, because the Company already had time-differentiated TOU rates to which customers had become accustomed, many existing customers saw little advantage to switching to the RTP tariff.

A Survey of Utility Experience with Real Time Pricing
79
Load Response Neither of the two customers previously on the rate provided any short-term price response, although the large customer did make permanent changes to its operation to shift certain processes to off-peak periods. FirstEnergy (Ohio Edison, Toledo Edison, Cleveland Electric Illum., and Penn Power) Experimental Day Ahead Real Time Pricing Program Tariff Description The three FirstEnergy operating companies in Ohio (Ohio Edison, Toledo Edison, and the Cleveland Electric Illuminating Company) each offer a similar experimental RTP tariff. Pennsylvania Power, another FirstEnergy company, previously offered a similar tariff. Toledo Edison (ToledoEd) and the Cleveland Electric Illuminating Company (CEI) each offer a single RTP tariff available to firm service and interruptible service customers larger than 30 kW. Total enrollment at each of these utilities is capped at 25 customers or 250 MW. Ohio Edison (OhioEd) offers three separate tariffs: a firm service tariff for customers larger than 100 kVA, an interruptible service tariff, and a secondary service tariff. Combined participation on the firm and interruptible service RTP tariffs is capped at 43 customers or a combined demand of 500 MW, and total participation on the secondary service tariff is capped at 10 customers or 20 MW. The tariffs are a bundled, CBL-based design. Each participant has a CBL that is developed from their historical hourly load data, and they are charged for their CBL usage and billing demand based on the rates of their otherwise applicable tariff. Energy usage above/below their CBL in each hour is charged/credited at the applicable hourly RTP price. Hourly RTP prices are based on the estimated wholesale cost of generation and capacity (at the Cinergy Hub), adjusted for losses, plus an adder to recover marginal T&D costs. The adder, which is only applied to incremental usage above the CBL, ranges from $0.005/kWh - $0.033/kWh, depending on the service voltage and the time of day. The total adder charges for each billing period must be greater than or equal to the Minimum Adder Charge, which is calculated based on the maximum hourly demand in the billing period. The total hourly RTP price is made available to customers, via the Internet, by 1 PM the day-ahead. Customers whose CBL is billed under an interruptible service tariff are subject to a number of additional provisions. On the standard interruptible tariff, customers can be called for interruption in response to either emergency or economic conditions, but interruptible RTP customers are not called for economic interruptions. In exchange, the CBL of interruptible RTP customers is adjusted during each hour of the summer months to the midpoint between their firm service level and their historical CBL. Thus, a larger portion of their summer usage is subject to hourly RTP prices. When called for an emergency interruption, the CBL of interruptible RTP customers is adjusted to the lesser of their firm load level or their current CBL. Failure to interrupt is subject to the same penalties as in their otherwise applicable tariff. Additional Emergency RTP Credits are given for reductions in usage below the adjusted CBL.
A Survey of Utility Experience with Real Time Pricing
80
Tariff History: Utility Motivation and Goals The experimental tariff was first introduced at OhioEd in 1996, and then at the other Ohio operating companies in 1998 and at Penn Power in 2001. The initial impetus for the tariff came from within the utility, which was interested in providing opportunities for bill savings to customers with load growth options and/or an ability to shift loads. It was also initially seen as a way to help customers prepare for retail competition and become acquainted with market-based pricing. The primary goals for the tariff were to encourage load growth and economic development, and also to generate customer satisfaction and positive public relations by providing customers with an opportunity to reduce their energy costs. The tariff was not seen as a vehicle for load management, in part because participants are able to terminate service under the tariff with minimal notice (currently three business days), and thus the utility does not view any potential price response as a reliable resource. The tariff has been modified and extended on several occasions, with the most recent revisions extending the Ohio tariffs through 2005. Future revisions will likely involve modifying the tariff so that hourly RTP prices are based on MISO market prices. Overall, the utility maintains a positive view of the tariff, but its future depends, in large part, on how retail competition develops in Ohio. If an active retail market does emerge, FirstEnergy may no longer find it necessary to offer this type of experimental option for customers. However, it is conceivable that in this situation, some form of RTP (most likely a one-part design) would be adopted as the basic default service. If, on the other hand, retail competition does not take off, the current experimental tariffs may be renewed on a longer-term basis. Participation The tariff was initially marketed quite aggressively when it was introduced at OhioEd, with commissions provided to sales representatives for enrolling customers onto the rate. However, once the retail market was opened to competition, marketing activities at the regulated utilities have generally ceased. Any information about the tariff that is provided to customers is done so primarily at their request. That being the case, efforts are continuing at the utility to improve training of customer representatives, so that they are more comfortable explaining the tariff to customers. Enrollment in the tariff currently stands at approximately 45 customers, representing an aggregate peak demand of 100-200 MW. Most of these customers are served by Ohio Edison, who had a longer period of time to market the tariff prior to retail competition. Participants range in size from medium (several hundred kW) to large (several MW). Enrollment has been increasing slowly over time, particularly as revisions have made the tariff accessible to a wider variety of customers. Previously, FirstEnergy For example, the recent tariff modification establishing a Minimum Adder Charge for recovery of embedded T&D was intended to improve revenue recovery from low load factor customers, and thus allow the company to more readily permit this type of customers to join the tariff.

A Survey of Utility Experience with Real Time Pricing
81
Load Response No analyses have been conducted to characterize participants’ price response, primarily because this has not been a major goal for the tariff. However, anecdotal evidence does suggest that many of the customers that enrolled on the tariff did so in order to pursue load growth, and have little ability and/or interest in monitoring and responding to prices. A relatively small percentage of customers are known to provide some price response, although for most of these, the threshold for any significant response is $0.50/kWh or more. Experience with the tariff has indicated that, more than corresponding to any particular business type, the customers that do provide price response are those that have individuals on staff who have taken a particular interest in the tariff and coordinate strategies for taking responsive action. Florida Power & Light Rate RTP-GX, Real Time Pricing Tariff Description Florida Power and Light (FP&L) offered a bundled, CBL-based RTP tariff to customers with a peak demand of at least 500 kW. Each participant has a CBL that is developed from one year of historical hourly load data, and they are charged for their CBL usage and billing demand based on the rates of their otherwise applicable tariff. Energy consumption above/below the CBL in each hour is charged/credited at the prevailing hourly energy price for that hour. A customer’s CBL is adjusted annually to scale the monthly energy consumption and billing demand to their actual usage in the year prior. These adjustments are triggered when the monthly energy consumption and billing demand deviates from the CBL by more than 10%. If this occurs, hourly loads and/or billing demands are scaled up/down by 50% of the relative change, with a limit of a 20% CBL decrease. Adjustments also can be made on an ongoing basis for energy efficiency measures or permanent removal of equipment. Hourly energy prices are composed of several elements, including a marginal operating cost and a marginal reliability cost. Marginal operating costs are based on a day-ahead forecast of incremental fuel and O&M costs, as determined by FP&L’s marginal production costing tariff. Marginal reliability costs represent the incremental reliability impact of an additional unit of demand. These costs can take on one of four pre-specified values (0, $0.10, $0.30, or $0.90/kWh), which FP&L can dispatch based on prevailing system conditions (e.g., load levels, expected interruptions, etc.). These hourly energy prices are communicated to participants by 4 PM, the day prior. Tariff History: Utility Motivation and Goals The tariff was introduced as a pilot in 1995, limited to 50 customers. The stated purpose of the pilot tariff was to examine customers’ price response. FP&L was hoping to demonstrate that sufficient load shifting would occur to qualify the tariff as a conservation program eligible for DSM cost recovery.

A Survey of Utility Experience with Real Time Pricing
82
The pilot was modified several times in order to obtain better information about customers’ price response. It was initially available only to customers with a monthly billing demand of more than 1,500 kW. However, only four customers originally enrolled, and so the eligibility limit was lowered to 1 MW, and later to 500 kW (FPSC, 2002). The expiration date of the pilot was also extended on several occasions, from 1998 to 2003. FP&L also modified how the marginal reliability cost component to the tariff is computed, in order to increase the variability of prices between peak and off-peak periods and thus encourage greater load shifting. As discussed below, the tariff has experienced significant attrition in recent years, and has failed to demonstrate any significant demand response. FP&L therefore decided to withdraw the tariff effective December 31, 2003. However, the company is still interested in demand response, and may investigate other options. Participation The tariff was actively marketed during its initial phases through targeted meetings with account representatives and other media. At its peak in 1998, the tariff had 42 participants. However, more than half of these customers have since left the tariff. Marginal prices have been increasing in recent years due to rising incremental fuel costs. With raising prices, many customers found it difficult to save money on the tariff absent significant load shifting on their part. This lead to customers migrating to other rate options. An analysis of bill savings for the remaining twenty customers showed that over a one-year period, only eight were able to achieve more than minimal savings relative to their otherwise applicable tariff. It should be noted that FPL’s particular customer mix is heavily weighted towards commercial versus industrial customers. Load Response FP&L analyzed each participant’s load response during a one week period in May 2002, when prices reached as high as $0.40/kWh. Of the 20 customers participating at the time, only five provided any discernable price response, with a total load reduction of less than 5 MW (or 20% of all participants’ aggregate peak demand). As mentioned above, there are relatively few large industrial customers in FP&L’s territory. Despite the fact that the tariff was motivated by an interest in price response, many of the customers may have enrolled in order to gain access to lower market prices in order to facilitate load growth. Kansas City Power & Light Schedule RTP and Schedule RTP-Plus Tariff Description Kansas City Power & Light’s (KCP&L) RTP tariffs are a bundled, CBL-based design, available to customers with a maximum annual demand of at least 500 kW. Each customer has a CBL that is developed from one year of hourly load data (and ordinarily is not changed during the term of the their enrollment), and they are charged for their CBL usage and billing demand, based on

A Survey of Utility Experience with Real Time Pricing
83
their otherwise applicable tariff. Usage above/below the CBL in each hour is charged/credited at the hourly energy price. This price is equal to a weighted average of the “effective energy charge” of the otherwise applicable tariff and the projected hourly marginal costs. The effective energy charge in a particular hour incorporates both the energy charge of the standard tariff and any incremental billing demand charge that would be accrued, if the customer were taking service under the standard tariff. Hourly marginal costs include marginal generation costs, based either on the company’s system lambda or on projected wholesale market costs, and marginal outage costs, which are calculated based on the projected reserve level. Customers are notified of hourly prices by 4 PM, the day prior. On the Real-Time Pricing tariff, the weighting factors for calculating hourly prices are 75% for the marginal cost component and 25% for the effective energy charge of the standard tariff. On Real-Time Pricing – Plus option, the weighting factors are 95% and 5%, and participants’ CBL is increased by 5%. The net effect is that, depending on the customer’s usage level relative to their CBL and on marginal prices relative to the effective energy charge of the standard tariff, Real Time Pricing – Plus option may expose the customer to more or less volatility in marginal prices. Customers enrolled in the RTP tariff may simultaneously participate in KCP&L’s Peak Load Curtailment Credit (PLCC) tariff. Similar to an interruptible tariff, the PLCC tariff provides customers with a guaranteed credit in exchange for agreeing to curtail their usage to a firm power level during a limited number of periods, upon notification by KCP&L. Customers participating in both PLCC and RTP receive a reduced PLCC credit, and penalty provisions continue to apply for exceeding their contracted firm load level during curtailment events. During PLCC curtailment periods, the participant’s CBL – for the purpose of their RTP bill calculation – is reduced to their PLCC firm power level. KCP&L can update the hourly outage cost component of the hourly RTP prices within one hour of a PLCC event. Tariff History: Utility Motivation and Goals KCP&L’s RTP tariff was launched on an experimental basis in 1995 and made permanent in 1996. The tariff was motivated by several factors. First, it was viewed as preparation for retail competition – both by enabling the company to gain administrative experience with market-based pricing and by offering large customers early access to market prices, thus strategically positioning the company prior to any opening of the retail market. The tariff offering was also prompted by customer interest in accessing lower prices to facilitate load growth. In some cases, these were customers with experience participating in RTP rates through facilities located in the service territory of other utilities with RTP tariffs. Initially, the tariff was available only to customers with maximum annual demand of at least 1 MW. The eligibility threshold was later lowered to 500 kW, in order to boost participation during a period when KCP&L was facing capacity constraints and sought to encourage load shifting and/or peak period curtailments. Overall, the tariff has been judged to be a moderate success, and is expected to continue to be offered for the foreseeable future. While there is no longer any concerted effort to enroll additional customers in the tariff or to revise its design, it continues to be seen as part of a

A Survey of Utility Experience with Real Time Pricing
84
continuum of tariff lines offering customers varying levels of tradeoff between risk and expected cost. Participation Marketing for the tariff was conducted through several channels, including brochures and workshops on the utility’s various tariff offerings. However, due to the relatively small number of customers initially eligible for the tariff (i.e., with peak demand of at least 1 MW), the marketing strategy primarily consisted of contacting customers individually to discuss the tariff. Customers were targeted on the basis of a number of considerations, including their ability to respond to prices, as indicated, for example, by the presence of onsite generation at the customer’s facility or by the customer’s participation in the PLCC tariff. Initially, the motivation for targeting price responsive customers was primarily to avoid dissatisfaction among non-responsive customers that might be unable to take remedial action should energy prices rise or become volatile. Later, when KCP&L was facing capacity constraints, an added motivation for targeting price responsive customers was to effect reductions in the system peak. In addition to targeting customers based on their price responsiveness, marketing efforts were also directed at customers with load growth opportunities, since marginal prices for usage above a customer’s CBL was anticipated to remain below standard tariff rates. Currently, ten customers are enrolled, comprising an aggregate peak demand of 11.2 MW. At one point, 14 customers were enrolled, but participation has declined slightly over the past several years, due to several participants’ difficulties in rescheduling production processes or operating onsite generation. While hourly prices have periodically reached levels of $0.80/kWh or more (with a high of $1.80/kWh), there is little indication that price volatility has been a significant factor in customers’ decisions to leave the tariff. Load Response Econometric analyses of customer price response have not been conducted. However, customers’ price responsiveness has been characterized by directly examining their load shapes (i.e., by comparing their demand during low-price and high-price periods of a particular day). Based on this approach, the maximum load reduction is estimated to have been 16.2 MW when the hourly price reached $0.94/kWh; this occurred when fourteen customers were on the tariff, with an aggregate peak demand of approximately 30 MW. More recently, a 3.5 MW load reduction was observed with the current base of participants, when prices reached $0.80/kWh. The load shape data suggests that all customers on the rate, except for one, respond to prices to some discernable extent; and it indicates that the threshold for price response, among the portfolio of participants, is approximately $0.20/kWh.

A Survey of Utility Experience with Real Time Pricing
85
Long Island Power Authority Voluntary Real-Time Pricing Pilot Service Tariff Description Long Island Power Authority’s (LIPA) RTP tariff is an experimental tariff available to a maximum of six customers with a billing demand of at least 145 kW in any summer month. The tariff has a bill guarantee provision that caps the customer’s bill at an amount equal to what it would be if they were taking service under the standard tariff for their customer class. The tariff is a bundled, multi-part design. Each participant is assessed a customer-specific fixed charge, and all energy consumption is charged at hourly energy prices. The fixed charge is computed annually for each customer, by subtracting the forecast marginal energy and capacity costs for that customer from the total charges that would be assessed if they were billed at the standard tariff rate. The hourly energy price is based on the locational-based market price in the New York Independent System Operator’s (NYISO) day-ahead market. An additional Hourly Demand Rate is added to the hourly price for a limited number of hours per year. Participants select from among four options for the number of days (either 6 or 15) and hours per day (either 3 or 8) during which the Hourly Demand Rate can be assessed, referred to as “high-load periods”. The magnitude of the Hourly Demand Rate depends on which of the options a participant selects, ranging from $0.81/kWh to $5.37/kWh for secondary voltage service customers. Participants are notified of the Hourly Energy Rates and whether the Hourly Demand Charge will be applied, by 4 PM the day prior. Tariff History: Utility Motivation and Goals The tariff was introduced by the Long Island Lighting Company (LILCO) in the mid-1990’s, in response to requests by the New York Public Service Commission (PSC) for utilities in the state to examine real time pricing as a potential load management strategy. LILCO was later acquired by LIPA, which has continued to offer the experimental tariff on an open-ended basis. No current plans are in place to expand the enrollment cap or otherwise modify the tariff. LIPA’s current efforts at fostering demand response are more actively focused on their Peak Load Reduction Program, which provides payments to customers for reducing demand during critical periods. LIPA has integrated the operation of this tariff into the NYISO’s Emergency Demand Reduction Program. In doing so, LIPA is able to receive payments for load reductions, which help to finance the customer incentives, and is able to participate in a broader statewide initiative. Participation When the tariff was initially introduced, LILCO targeted a small set of prospective participants to fill the limited enrollment slots. These customers were targeted on the basis of their ability to respond to prices, and also with the goal of getting a cross-section of different business types and sizes. Six customers were initially enrolled, but one has since shut down. The current five customers comprise an aggregate demand of 6 MW.

A Survey of Utility Experience with Real Time Pricing
86
Load Response Some efforts have been made to characterize participants’ price response, although specific results from these analyses are not publicly available. The analyses do indicate that all of the participants are able to provide a discernable price response during “high-load hours,” when hourly demand charges are levied. However, participants tend to exhibit little, if any, response to movements in the LBMP-based energy price when high load hour demand charges are not in effect. MidAmerican Energy Rider No. 17, Non-Residential Real Time Pricing Tariff Description MidAmerican’s RTP tariff is a bundled, multi-part design, available to non-residential customers in their Illinois service territory. The tariff is a rider that replaces the basic service, energy, and billing demand charges of a customer’s existing tariff. In lieu of these charges, the customer is assessed hourly energy prices on all usage, as well as access and capacity charges, which are either volumetric or demand-based, depending on the customer’s rate class. The hourly energy prices are determined through a competitive bidding process conducted each day. MidAmerican forecasts the load for its RTP customers on the following day, and solicits bids for non-firm wholesale energy to serve this load (including transmission and ancillary services). The lowest cost bid is selected for each day, and RTP participants are charged for their full hourly consumption based on the hourly energy prices of the selected bid. If the a sufficient number of bids are not submitted, hourly energy prices are based on MidAmerican’s lowest recorded sale prices for wholesale energy in each hour. Hourly energy prices are posted on the Internet by 4 PM of the day prior. Tariff History: Utility Motivation and Goals The tariff rider was introduced in 1998, to comply with statutory requirements associated with Illinois’ restructuring legislation, mandating that each regulated electric utility in the state offer real-time pricing to nonresidential customers by October 1998. Since being introduced, the tariff rider has not been a subject of particular attention, and no plans are currently in place to modify the tariff in any way. Participation Currently, no customers are participating in the tariff. At one point, a single customer did enroll, but left the rider at the end of the initial one-year contract term. The lack of participation could be attributed to a variety of factors. For many customers, the economics may not compare favorably to the standard tariff. Little or no marketing has been conducted for the rider, other than information that may have been provided during meetings with account representatives to discuss broader tariff options.

A Survey of Utility Experience with Real Time Pricing
87
Load Response With no customers participating, the rider has not generated any price response. Otter Tail Power Company Real Time Pricing Rider – Option 1 and Real Time Pricing Rider – Option 2 Tariff Description Otter Tail offers two RTP tariffs to customers who maintain a demand of at least 200 kW. Option 1 is a bundled, CBL-based design. Each customer’s CBL is developed from one year of historical load data. However, participants can choose to have their CBL automatically adjusted each year to within any fraction of the difference between their existing CBL and their actual usage in the previous year. In each billing period, the customer is charged for their CBL energy usage and billing demand at the rates of their previous tariff. Energy consumption above/below the CBL in each hour is charged/credited at the prevailing hourly energy price, which is based on a day-ahead projection of the company’s system lambda and communicated to each participant by 4 PM, the day prior. The Option 2 tariff is a bundled, multi-part tariff with hourly pricing for all energy and a customer-specific access charge. The access charge is calculated for each customer by taking the difference of standard tariff charges and hourly marginal costs, as applied to that customer’s historical usage profile. Hourly energy prices are derived in the same manner as Option 1. Tariff History: Utility Motivation and Goals The tariff was launched as a pilot in 1996, motivated primarily for the purpose of customer retention. Several large customers had expressed interest in RTP, and the tariff was viewed as an innovative rate option that gave customers greater control over their energy costs. Load management or peak demand reduction was not a primary goal. Participation According to the utility, RTP has not been aggressively marketed. Both tariffs have an enrollment cap of 20 customers. The maximum enrollment in Option 1 has been five customers; Option 2 has never had any participants. Over the past several years, two customers have left Option 1: one that went out of business, and another that opted to return to standard service, in response to a slight increase in price volatility. The three customers currently receiving service under the tariff have a combined peak demand of 18.5 MW. While small in absolute magnitude compared to other RTP tariffs, this does represent about 3% of OTPCO’s system peak load.

A Survey of Utility Experience with Real Time Pricing
88
Load Response Of the three customers currently on Option 1, only one exhibits any significant price response. This customer has 5-6 MW of onsite generation, which it turns on when hourly energy prices under the tariff exceed the economic cost of self-generation. Pacific Gas & Electric Company Schedule A-RTP: Experimental Real-Time Pricing Service Tariff Description Pacific Gas and Electric Company (PG&E) offered an experimental RTP tariff available to customers with a billing demand greater than 500 kW. The tariff was a bundled, multi-part design. Customers were charged hourly energy prices for all usage, as well as a demand charge assessed on their monthly peak demand. Hourly energy prices were based on a tiered series of price components. The first tier, applicable in all hours, was the marginal energy cost. Prior to restructuring in California, marginal energy costs were based on PG&E’s day-ahead forecast of their system lambda, adjusted for natural gas costs and multiplied by a revenue recovery factor. After restructuring, marginal energy costs were based on the day-ahead market clearing prices at the California Power Exchange. The second price component, the marginal T&D cost, was applied during approximately one quarter of summer peak period hours and added approximately $0.25/kWh to the hourly price. The final price component was the marginal generation capacity cost, referred to as the Load Management Price Signal (LMPS). The LMPS was applied up to ten days per year, when system reserves were low, and added up to $1.00/kWh to the hourly price. Participants were provided with the marginal energy and T&D capacity costs on a day-ahead basis; if the LMPS were to be applied during a particular day, notice would be given by 10 AM that day. Tariff History: Utility Motivation and Goals PG&E introduced the pilot tariff in 1985, under the title, the Demand Side Real-Time Pricing Project. It was the first RTP tariff to be offered by any utility in the U.S. and was intended to demonstrate what, at the time, was an experimental concept for tariff design. The pilot was prompted by a regulatory order from the California Public Utilities Commission (CPUC), which was interested in RTP as a strategy for encouraging peak load reductions and providing more efficient price signals to end users. PG&E had established itself at the forefront of DSM activity in the U.S., and the RTP concept was seen as an extension of these early efforts. The pilot was expanded on several occasions up through the early 1990’s, until the time that restructuring began to be pursued in the state. At this point, the tariff was closed to new participants, and efforts to expand the pilot ceased. Also, the original rate design (based on utility system lambda) was difficult to adapt to hourly prices produced by the state’s short-lived Power Exchange, and most participants elected to return to service under standard tariffs. The tariff remained in place until early 2003, although with only a very small number of participants, when it was finally cancelled. However, a new generation of RTP tariffs is currently under

A Survey of Utility Experience with Real Time Pricing
89
development in the state, prompted by the energy crisis of 2000/2001 and acknowledgement that dynamic pricing tariffs could potentially help mitigate future crises. Participation Early efforts to enroll customers in the pilot involved a variety of marketing activities. Key account executives were provided with training, and potential participants were identified based on factors such as their SIC code, load profile characteristics, and known ability to curtail load. The enrollment cap was raised on several occasions after enrollment targets were reached. At its peak, the pilot had approximately 45 customers enrolled, with a combined demand of approximately 100 MW (CPUC 2002). Once the tariff was closed, enrollment began to decline as existing customers found the tariff less attractive, dropped out, and could not be replaced with new participants. The last customer left the tariff in 2002. Load Response Evaluations of the pilot were conducted regularly up until the mid-1990’s. These studies found that participants did respond to prices, particularly during periods when the LMPS was in effect. One such study found that, across the 50 hours in 1990 when the LMPS was applied and prices averaged $0.39/kWh, participants reduced their load by approximately 10% on average (Mak and Chapman 1993). Analyses of the program during later periods suggest that load reductions of up to 15% occurred when on-peak prices reached three times their normal value (CPUC 2002). Pennsylvania Power & Light Rate Schedules PR-1(R) and PR-2(R), Price Response Service (Experimental) Firm Power and Interruptible Power Tariff Description Pennsylvania Power and Light’s (PP&L) RTP tariffs are CBL-based designs, available to customers who maintain a monthly maximum demand of at least 2 MW year round. Each customer’s CBL is developed from one year of historical load data, and they are charged for their CBL energy usage and billing demand under their otherwise applicable tariff. Energy consumption above/below the CBL in each hour is charged/credited at the prevailing hourly energy price. Hourly energy prices are composed of several elements: a marginal operating cost, a marginal capacity cost, a risk adjustment factor, and a loss adjustment factor. The marginal operating cost is based on PJM’s day-ahead Locational Marginal Price. The marginal capacity cost is a forecast of the levelized marginal cost of generation and transmission capacity associated with a change in load. The risk adjustment adder, not to exceed $0.01/kWh, provides compensation to PP&L for price risk associated with differences between day-ahead and real-time energy prices. Customers are notified of hourly energy prices by 5 PM of the day prior. Rate PR-2 is for customers whose CBL is billed under the company’s interruptible service tariff. On PR-2, a customer’s CBL is temporarily reduced, during interruption periods, to the firm

A Survey of Utility Experience with Real Time Pricing
90
power level of their interruptible service contract, and standard non-compliance penalties for load in excess of their firm service level continue to apply. Customers on rates PR-1 and PR-2 may also participate in PJM’s Load Response Programs. However, if they do so, then they must forego all credits under the RTP tariff for usage below their CBL. Tariff History: Utility Motivation and Goals The tariff was introduced as a pilot in 1995, limited to 25 customers. The primary motivation of the tariff offering was to be innovative. PP&L was aware of other companies offering similar tariffs and was interested in providing their customers with rate option that gave them control over their energy costs. Since introducing the RTP rate, Pennsylvania has deregulated its retail electricity market, and PP&L is now a distribution company. The tariff was closed to new participants in August 1998. The tariff is set to expire on January 1, 2010, and it is unclear what actions will be taken at that point regarding modifying or extending the tariff. Participation PP&L marketed the tariffs heavily when they were first introduced. Account representatives met with over 50 potential participants, presenting them with their load profiles and discussing features of the tariff. The pilot enrollment limit of 25 customers (for both tariffs, combined) was easily met. PP&L was interested in enrolling a cross-section of different customer types. However, with the exception of a university and several food processing plants, most of the participants were electric-intensive foundries. Since the tariff was introduced, approximately half of the participants have left the tariff, due to increased price volatility over the past several years. The tariff was closed to new participants in 1998, so no additional marketing has been conducted to subscribe any additional customers. Currently, about 12 customers are enrolled in the tariff, comprising about 75 MW of peak demand. Two of these are very large customers, with approximately 15 MW demand each, and the remaining participants are all in the 3-5 MW range. Load Response Limited analysis of participants’ price response has been conducted; however, the results are confidential. Available evidence indicates that about one third of participants provide some meaningful response to prices. However, since many of these customers are on the interruptible RTP option, and interruptions often coincide with high-price periods, it is difficult to distinguish the response associated with hourly prices. All of the price responsive customers are large industrial accounts that shift large process loads (particularly arc furnaces). In some cases, these customers shift loads to other facilities that are not receiving service under a real time pricing tariff.

A Survey of Utility Experience with Real Time Pricing
91
Progress Energy (Carolina Power & Light) Experimental - Real Time Pricing (Schedule LGS-RTP-5B in North Carolina, Schedule LGS-RTP-4 in South Carolina) Tariff Description Progress Energy offers a bundled, CBL-based RTP tariff to customers in its North and South Carolina service territories that have a contract demand of at least 1 MW. Enrollment is limited to 85 customers in North Carolina and 25 customers in South Carolina. Each customer’s CBL is developed from one complete year of hourly load data. For each calendar month, the historical load data are averaged in order to generate a baseline weekly profile for that customer. Once established, the CBL profiles are adjusted only at the customer’s request. In each billing period, the participant is charged for their usage and billing demand of their CBL at the rates of their otherwise applicable tariff, and hourly usage above/below the CBL is charged/credited at the prevailing hourly energy price. The hourly energy price is composed of three terms: the marginal energy cost, a marginal generation capacity charge, and a profit adder. The marginal energy cost is based on a day-ahead projection of the company’s system lambda, including any firm sales or purchases. The capacity charge is applied whenever system reserves fall below 15%, and is intended to recover the cost of additional combustion turbine capacity needed for meeting peak load growth. It is structured as a tiered charge that increases as the reserve margin drops; at its maximum, the capacity charge reaches approximately $0.40/kWh. Finally, the profit adder is calculated for each hour in terms of a fraction of the difference between the average customer class rate and the hourly marginal costs (energy plus capacity). In hours when marginal costs are above average rates, the profit adder is set to zero. Participants are notified of the hourly RTP prices for each day by 4 PM of the prior business day. In addition to the demand charge levied on the CBL billing demand, a facilities demand charge is also applied on the incremental demand above the CBL, in order to recover additional embedded costs associated with T&D assets. Tariff History: Utility Motivation and Goals The RTP rate was launched as an experimental tariff in 1997. The primary impetus was to prepare for retail competition. In particular, the company wanted to better understand customer preferences related to market-based pricing and their capability and willingness to respond to hourly prices. There was also an interest in providing customers with an opportunity to prepare for retail competition and gain experience with market pricing, as a well as offering them a tariff option that gave them an added degree of control over their energy costs. Experience with the tariff thus far has apparently met the company’s expectations, and no plans are underway to modify the tariff in any substantive manner. The tariff was initially scheduled to expire in 2000. Although movement toward retail competition in the Carolinas has stalled, Progress Energy has opted to extend the RTP pilot on two occasions, most recently in 2002, when the tariff was extended through 2009.

A Survey of Utility Experience with Real Time Pricing
92
Participation When it was first rolled out, the tariff was actively marketed. Account representatives were trained sufficiently to serve as a sales force for the tariff. Detailed letters describing the tariff were mailed out to every customer that met the 1 MW eligibility threshold. Other marketing materials, such as newsletters and case studies were also prepared and distributed to potential participants. Customers that indicated an interest in the tariff were met with by a team of representatives from the utility and provided with technical support and financial analysis. The tariff is currently fully subscribed, with 85 participants, as it has been for the past several years. The aggregate load of customers on the tariff is not publicly available. Load Response Evaluations of participants’ price responsiveness have been conducted, but specific results from these analyses are considered confidential. In general, these evaluations suggest that many customers don’t respond to price movements. The presumption is that many of these customers were interested in the rate strictly for the purpose of accessing market prices below standard tariff rates, to facilitate load growth. Of those customers that do appear to respond to price signals, those with self-generation reportedly demonstrate the most consistent response. For example, a military base (Camp Lejeune) has been featured for their integration of onsite generation into an energy management system that automatically dispatches the generator whenever hourly prices exceed a pre-specified threshold (Progress Energy 2001). Seattle City Light Variable Rate General Service Tariff Description Seattle City Light offers a bundled, one-part RTP tariff to customers with a billing demand greater than 10 MW during at least six months of the year. Customers on the tariff are charged for all of their energy consumption based on peak and off-peak prices that vary each day, plus a retail service charge of $0.015/kWh.55 Peak and off-peak energy prices are based on either the Dow Jones-California Oregon Border or the Dow Jones Mid-Columbia index prices each day. Tariff History: Utility Motivation and Goals The tariff was introduced in 1996. In part, it was offered in response to customer interest in gaining access to market prices, which, at the time, were below standard tariff rates. By making this tariff available, Seattle City Light was hoping to retain large high demand customers and potentially attract new customers to its service territory. At the same time, the utility was interested in sharing price risk with its customers and thereby guarding against potential price
55 The tariff also has a small demand charge for transformer-related costs, but this is ignored for the purpose of classifying this tariff as a one-part rate.

A Survey of Utility Experience with Real Time Pricing
93
volatility that might accompany the emerging competitive electricity market. The tariff was not intended to pursue any load management objectives. Participation There are relatively few customers that meet the minimum size requirements for the tariff: just eight customers, in all. When the tariff was first introduced, account representatives emailed or called each of these customers to discuss the rate. At one point, three of these customers were enrolled. However, all of these participants left the tariff by the end of 1998, due to unacceptable increases in energy prices. The utility is currently considering canceling the tariff. Load Response No analyses have been conducted to characterize the price response of customers previously participating on the rate. However, anecdotal evidence suggests that these customers were interested in the rate solely for the purpose of accessing lower prices, and were not intending to respond to daily price movements. It is therefore assumed that these customers did not respond significantly to variations in hourly prices. South Carolina Electric and Gas Rate 27, Large Power Service Real Time Pricing (Experimental) Tariff Description This is a bundled, CBL-based tariff available to customers with at least 1 MW monthly billing demand. Each customer’s CBL is based on one year of historical load data. In each billing period, they are charged for their CBL energy usage and billing demand at the rates of their otherwise applicable tariff, and energy consumption above/below the CBL in each hour is charged/credited at the prevailing hourly energy price. Hourly energy prices are based on the company’s day-ahead forecast of their system lambda, plus several adders, including a rationing charge applied when regional generation reserves are low, a small risk adder, and a small transmission charge applied only to incremental usage above the CBL. Hourly prices are communicated to customers by 4 PM of the previous day. Each year, the customer’s CBL is reviewed, and if more than 20% of their energy use or demand in the previous year was exposed to RTP prices, then the CBL is adjusted so that only 20% of energy use is exposed to real time pricing. Tariff History: Utility Motivation and Goals The tariff was introduced in 1995 in response to interest among customers who were aware of RTP tariffs offered by other utilities in the region and wanted access to market-based prices, in many cases to facilitate load growth. As such, load management or peak demand reduction were not explicit goals of the tariff.

A Survey of Utility Experience with Real Time Pricing
94
In general, the tariff has not been a particular focal point for the company, and little or no marketing of the tariff has been conducted. The tariff is currently designated as a pilot, although it has no enrollment cap. For the time being, SCE&G is planning to maintain its status as a pilot, since this allows the company to cancel the tariff without a formal rate case. In terms of possible future changes to the tariff, they are looking into offering risk management products, in response to interest expressed by customers concerned about higher bills. Participation Twenty-one customers are currently enrolled on the RTP tariff, comprising a combined peak demand of 347 MW. Over the last several years, six customers have left the tariff, possibly due to a moderate increase in hourly price volatility. Load Response While no analysis has been conducted to measure or characterize participants’ price response, it is generally assumed none of the customers on the tariff are particularly responsive to movements in hourly prices. The tariff was not intended to elicit price response, and customers enrolling on the tariff did so with the expectation that they would save on energy costs without having to modify their consumption patterns. Southern California Edison Schedule RTP-2 and Schedule RTP-2-I Tariff Description Southern California Edison (SCE) offers two similar unbundled, multi-part RTP tariffs to customers with a billing demand in excess of 500 kW in at least three months of the year. On both tariffs, customers are subject to hourly prices for all of their energy use, as well as a billing demand charge. Hourly prices are based pre-established schedules associated with nine different day-types. Each day-type is defined in terms of the maximum temperature of the prior day, the season (summer or winter), and the weekday type (weekday or weekend). Each day-type is associated with two sets of 24 hourly prices: one set for marginal energy and generation capacity costs and one for marginal distribution costs. On the hottest summer weekday afternoons, hourly prices reach as high as $2.75/kWh and $0.40/kWh, for the generation and distribution components, respectively. Schedule RTP-2-I has the same hourly price schedules as RTP-2, but includes an interruptible service provision. Customers on RTP-2-I nominate a firm service level, and demand charges for load above that amount are waived. During interruption periods, non-compliance penalties are assessed on load in excess of the customer’s firm service level.

A Survey of Utility Experience with Real Time Pricing
95
Tariff History: Utility Motivation and Goals The RTP tariff was initially launched as a pilot in 1987, in response to customer interest. SCE had excess capacity at the time and marginal costs were below standard tariff rates. Customers were interested in gaining access to these lower prices and in obtaining the added degree of flexibility that hourly pricing provided. In addition, some customers with high load factors were interested in the rate, because embedded costs were rolled into the hourly prices. For SCE, the tariff offered an opportunity to generate customer satisfaction and potentially encourage economic load growth. When the California Power Exchange (PX) opened in 1998, the administratively determined prices for RTP-2 and RTP-2-I became obsolete. The rates were then closed to new customers, and in their place, several new RTP tariffs were introduced with hourly RTP prices based on PX day-ahead market prices. These new tariffs were later suspended when the PX ceased operation in 2001, in the wake of the California energy crisis. More recently, efforts have been underway by all three of California’s investor-owned electric utilities to develop a new generation of dynamic pricing tariffs. One option under consideration is to introduce a new RTP tariff, based on a two-part tariff design. Participation Any marketing or customer outreach for RTP-2 or RTP-2-I was conducted informally through account representatives, which ceased once the tariffs were closed to new participants. Currently, 96 customers are enrolled in RTP-2, comprising an aggregate demand of 136 MW (CPUC, 2002).56 These participants span a wide range of industrial classifications, with the largest representation by customers in the industrial classifications of construction gravel and cement (18%), foundries (10%), and asphalt (9%). Load Response Tariff evaluations were conducted in the early 1990’s, which included some analysis of customer load response. Among the approximately 15 customers enrolled in 1988 and 1989, load reductions of up to 16% were observed when hourly prices reached $2.70/kWh (Mak and Chapman, 1993). Since these early tariff evaluations, no detailed analyses have been conducted to assess the price responsiveness of a more current participant group. Anecdotal evidence suggests that at least some customers do monitor daily temperatures in order to determine which price schedule will be in effect for a particular day, but there is no evidence to indicate the extent to which current customers on RTP-2 respond to variations in hourly prices. Customers on the successor RTP tariffs, which had hourly prices linked to the California PX market prices, were found to generally not respond to prices. When prices in the state rose and become increasingly volatile during the state’s electricity crisis, customers on these RTP rates were unable to modify their operations in response, and were allowed to transfer off of the rate.
56 CPUC, “Report of Working Group 2 on Dynamic Tariff and Program Proposals,” Rulemaking R. 02-06-001, November 15, 2002.

A Survey of Utility Experience with Real Time Pricing
96
Southern Company (Alabama Power) Rate RTP: Real Time Pricing (Industrial Power) Tariff Description Alabama Power offers an array of real time pricing tariffs. The most popular of these is Rate RTP, a bundled, one-part tariff available to industrial customers. The tariff does not have any explicit eligibility requirement for minimum customer size. However, it does include a minimum bill charge that is assessed on the greater of the actual maximum billing period demand, 90% of contract capacity, or 3 MW, which effectively serves to limit participation to customers with a monthly peak demand of close to 3 MW or above. Hourly energy prices are based on a day-ahead forecast of the Southern Company system lambda. If customers on interruptible tariffs are expected to be called for interruption, a $0.15/kWh reliability adder is applied to the hourly RTP energy price. These total hourly prices are communicated to participants by 4 PM, the day prior. Alabama Power also offers a number of financial risk management products (“price protection products”), including caps, collars, and contracts for differences, which can be purchased for the summer billing months (June through September). Tariff History: Utility Motivation and Goals The tariff was introduced in 1993, in response to customer interest in RTP and a corresponding desire by Alabama Power to provide customers with additional choices. Alabama Power added price protection products to its offering around 1995. The utility saw some participant erosion that followed a period of extreme prices but has more recently seen renewed acceptance for the RTP tariff after a few years of price stability. The utility continues to market the RTP tariff through annual meetings with potentially eligible customers. Customers are regularly surveyed about their knowledge of rate options in order to ensure that account reps are providing sufficient information about each applicable rate option, including RTP. Alabama Power account reps also maintain a close relationship with customers on the RTP tariff, meeting annually to review historical price trends, discuss risk management strategies, and receive feedback from customers. With regard to risk management preferences, a relatively small portion of the total load is hedged, no doubt due to the fact that prices have remained relatively low and stable in recent years. Among those customers that have purchased some price protection product, contracts for differences are the favored product. Participation At its peak, the tariff had about 50 customers enrolled, with a total peak demand of approximately 800 MW. Some participant erosion occurred after 1999, when prices reached $4.00/kWh, and many of the less responsive customers dropped off the tariff. Currently, about 30 customers are enrolled, representing a combined peak demand of approximately 500 MW.

A Survey of Utility Experience with Real Time Pricing
97
Load Response A study was conducted to examine participants’ load response during 1998-1999, when prices reached $3.50/kWh. At that time, a relatively large portion of customers, about 60%, seemed to provide some discernable price response. However, since that time, many customers have left the tariff, and it is unclear whether the study’s results apply to the current set of participants. Over the past several years, RTP prices have remained relatively low and stable, and thus there has been limited opportunity to evaluate their price responsiveness. The company assumes that participants will respond at prices above $0.30/kWh, but RTP prices have remained below this level. Some anecdotal evidence indicates that current customers are generally not price responsive – even among those that may have responded in the past. A hypothesis is that customers’ perceptions of what constitutes a “high price” has changed: after having previously endured prices in the range of $3.50/kWh, they are no longer alarmed by more typical summer peak prices, and are less inclined to respond. As with the RTP tariffs of other Southern Company utilities, customer price response is integrated into plant dispatch through a parallel price response model, run day-ahead on a Southern Company wide basis. Southern Company (Georgia Power) Schedule RTP-DA-2: Real Time Pricing – Day Ahead Schedule RTP-HA-2: Real Time Pricing – Hour Ahead Tariff Description Georgia Power offers two bundled, CBL-based RTP tariffs. The tariffs are similar in most respect, differing primarily in terms of the customer eligibility threshold and the advance notice of prices. RTP-DA-2 is available to customers with monthly peak demand of at least 250 kW, and participants receive notification of firm hourly prices by 4 PM, the day prior. RTP-HA-2 is limited to customers with a monthly peak demand of at least 5 MW, and participants on this rate receive a day ahead forecast of hourly prices, but these prices can be updated up to one hour before they are in effect. Both tariffs have a 5-year contract term. The process for establishing participants’ CBL differs depending on whether, at the time that the customer enrolls in RTP, they are an existing or a new load on Georgia Power’s system. If they are an existing load, their CBL is developed from their historical hourly load data. If they are a new load, their CBL is based on an estimated load profile. New commercial customers and new industrial customers receive, by default, a CBL equal to 100% and 60%, respectively, of their estimated load profile. New customers can receive a CBL below the default level if they are able to demonstrate an ability to reduce their load to the reduced level, or if they have similar facilities that have already demonstrated that ability. In each billing period, the customer is charged for their CBL energy usage and billing demand at their otherwise applicable tariff rates, and energy consumption above/below the CBL in each hour is charged/credited at the prevailing hourly energy price. Hourly energy prices are

A Survey of Utility Experience with Real Time Pricing
98
determined by Georgia Power based on projections of hourly generation operating costs, line losses, transmission costs, outage costs, and a risk recovery factor. Georgia Power offers RTP customers several types of options for customizing their exposure to price volatility. Customers can purchase additional CBL or sell back a portion of their existing CBL at a price based on the company’s forecast of hourly prices at the time of the transaction, thereby decreasing or increasing, respectively, their exposure to price risk. Customers can also purchase a variety of financial risk management products to reduce their risk exposure, including caps, collars, and contracts for differences. Tariff History: Utility Motivation and Goals The day-ahead tariff was first introduced as a pilot in 1992, and the hour-ahead tariff was started in 1993. Both tariffs were made permanent in 1994. The tariff offering was motivated party in response to a limited form of retail competition in the state. (The Georgia Territorial Act specifies that electricity consumers over 900 kW of connected load have a one-time choice of service providers). It was also motivated in response to customer requests to buy through curtailable energy periods if they were willing to pay the cost to Georgia Power. The tariff was targeted for large, load-growth customers, who would want access to lower average prices, and price responsive customers, who would be able to reduce their energy costs through load shifting. While not necessarily originally envisioned as a demand side management (DSM) strategy, per se, Georgia Power does currently incorporate price response from their RTP customers into their Integrated Resource Planning. Participation Georgia Power has, by far, the largest base of participants of any RTP tariff offered to large C&I customers. Currently, about 1,540 customers are enrolled in the day-ahead tariff, and 60 in the hour-ahead tariff, which comprise 3,250 MW and 1,750 MW peak demand, respectively. Participants in the hour-ahead tariff primarily consist of large industrial and manufacturing customers, although several military bases, university campuses, and large office buildings are also enrolled. The day-ahead tariff is composed more or less equally of commercial and industrial customers. Unlike most other RTP tariffs, very few customers have left Georgia Power’s tariff, even after periods of extreme price volatility. In part, this can be attributed to the variety of risk management products available to participants, who are kept informed of price trends through annual workshops held by Georgia Power. Load Response Due to its size and notoriety, Georgia Power’s RTP tariffs have received a relatively significant amount of analysis in order to characterize participants’ price response. The largest load reductions observed have been on the order of 800 MW, which occurred in 1999, when participants faced exceptionally high prices of $1.50/kWh and $6.50/kWh in the day-ahead and hour-ahead programs, respectively. Braithwait and O’Sheasy (2000) report that, over a period of high priced hours, participants in the hour-ahead tariff reduced their average demand by approximately 250 MW in aggregate, and those in the day-ahead tariff reduced their average ad

A Survey of Utility Experience with Real Time Pricing
99
by approximately 500 MW. In summer 2000, when prices were less extreme than in the previous year, the maximum load reduction was 482 MW. For the purposes of its IRP filing, Georgia Power attributes a total peak demand reduction of 300-350 MW to its RTP tariffs, which it judges to be a conservative estimate of the price response at summer peak prices of approximately $0.10/kWh. Despite the sizeable price response in the tariff, a relatively small percentage of customers on the RTP tariffs, approximately 10%, are deemed to be price responsive. Because the tariff is, in large part, targeted toward customers on the basis of their anticipated load growth, many of the participants have little interest or ability to respond to prices. Rather, price response is concentrated among a subset of customers, primarily those in the hour-ahead tariff, many of whom are large manufacturing facilities with production processes that can be quickly rescheduled, and those with onsite generation. Customers with onsite generation begin responding at relatively low prices, starting at a threshold of approximately $0.08/kWh. Southern Company (Gulf Power) Rate Schedule RTP Tariff Description Gulf Power offers a bundled, one-part tariff to customers with an annual peak load of at least 2 MW. Hourly energy prices are based on the day-ahead forecast of hourly system lambdas for the Southern Company System. Embedded generation and transmission costs are recovered through a multiplier (derived from the class average load profile) applied to the system lambda. Fuel costs and embedded distribution costs are recovered through a fixed adder. Hourly energy prices are communicated to customers by 4 PM for the next weekday, along with forecast hourly prices through the sixth day out. Tariff History: Utility Motivation and Goals The tariff was introduced as a pilot in 1995 and approved for permanent status in 1999. The pilot had five stated objectives: (1) gain information about customer response to hourly pricing, (2) achieve peak load reductions, (3) encourage economic efficiency, (4) provide value based pricing, and (5) provide customer satisfaction. Part of the impetus for offering the pilot was that several customers had expressed interest in real time pricing. In addition, since many of the customers targeted for the pilot had onsite generation and cogeneration, the tariff was also motivated by an interest in replacing a more complex tariff for stand-by and supplementary service. Currently, utility management has neither a particularly positive nor negative attitude toward the tariff, and no plans exist for eliminating the tariff or modifying it in any significant way. One unintended, but potentially important, factor that may impact the future of Gulf Power’s tariff is that management is increasingly looking at financial statistics over shorter-term periods (e.g., monthly compared to annually). Since these statistics tend to be particularly variable for RTP over short time periods, there is a concern that RTP may be looked upon unfavorably.

A Survey of Utility Experience with Real Time Pricing
100
Participation The pilot was initially limited to 12 customers. In this phase, Gulf targeted large industrial customers, particularly those with onsite generation or cogeneration, because they were considered to be the most capable to respond to day ahead hourly prices. After two years, the participation cap for the pilot was expanded to 24 customers in order to gain information about a more diverse array of customer segments. Many of these new participants were commercial and institutional customers without onsite generation capabilities. When the tariff was made permanent, the enrollment cap was removed. Throughout the course of the pilot period (1995-1999), 22 customers participated in the tariff. Thirteen were industrial customers, including six from the chemical sector, two from the forest products industry, and the remaining from an assortment of other industries. The other nine participants were primarily institutional customers, including four government agencies (e.g., military facilities), three health care facilities, and a university. The tariff achieved its maximum enrollment of 20 customers in summer 1998. The combined peak demand of these customers was approximately 160 MW, with industrial customers accounting for ~50 MW and government agencies accounting for 80-90 MW. To a significant extent, enrollment is limited by the makeup of Gulf Power’s customer base. Gulf’s service territory is dominated by residential and military customers, with relatively little heavy industry. Only about 40 accounts meet the 2 MW minimum size requirements of the tariff. The RTP tariff has been pro-actively marketed by account representatives to most of these customers through targeted meetings that provide customers with bill analyses to compare costs between RTP and their current tariff. The pilot tariff evaluation revealed that almost all participants received some bill savings, even those that were unable to respond to prices. The tariff experienced significant attrition following the summers of 1998 and 1999, when marginal costs rose dramatically, and hourly RTP prices reached as high as $2.00/kWh. In response, two-thirds of the customers left the tariff, many of which were relatively price-inelastic, such as military facilities and hospitals lacking onsite generation. Since then, some rebound in enrollment has occurred, bringing current participation up to thirteen customers with a combined peak demand of about 100-150 MW. Some of these are returning customers that had previously dropped off the tariff. Recent enrollment is attributed to both lower prices, due to milder weather and adequate capacity in the Southern Company system, and a shortened contract period for the tariff, decreasing some of the perceived risk of enrollment. Load Response An analysis of participants’ price response during summer 1998 was conducted as part of the pilot tariff evaluation (Gulf Power Company, 1999). This analysis revealed that the maximum load reduction achieved was 23 MW, when prices reached $0.70/kWh. This represents a reduction of about 15% relative to participants’ aggregate peak demand of 140-150 MW. At more moderate prices of $0.15-30/kWh, load reductions were in the range of 5-10 MW, or 3-4% of peak demand. Comparing the response of different customer segments, almost all of the price

A Survey of Utility Experience with Real Time Pricing
101
response came from either industrial customers (18 MW) and from a university that responded to price spikes by running several cogeneration units otherwise used only for instructional purposes (3 MW). Although the five government facilities comprised almost 90 MW of peak demand, the maximum load reduction was less than 3 MW, even when hourly prices reached $0.70/kWh. These findings comport well with customer survey results, which revealed that only 12% of participants indicated that they had any substantial ability to respond to prices, and only one quarter indicated that price signals had any considerable impact on their energy management. Many of the customers that were unable to respond to prices left the tariff after two consecutive summers with particularly high prices. No in-depth analysis has been conducted since then in order to gauge the price responsiveness of the remaining customers. However, of the thirteen customers currently receiving RTP service, four to five appear to provide some significant level of price response. These include several industrial customers with large batch processes and several customers with onsite generation. The remaining participants are split fairly evenly between those that provide moderate price response and those that provide essentially none. For the entire portfolio of customers, price response appears to begin materializing at a threshold of about $0.15-20/kWh. While an opportunity has yet to arise to observe the response of the current set of customers to very high prices, tariff managers assume that the response would be at least 15% of peak demand, since this was the level of response observed during the price spikes in the summers of 1998 and 1999, when a large number of additional non-responsive customers were on the rate. Tennessee Valley Authority Variable Pricing Interruptible Program, Small Customer RTP Pilot, and Two-Part RTP Tariff Description Tennessee Valley Authority (TVA) has three bundled, multi-part RTP tariffs. The Variable Pricing Interruptible (VPI) Program is available to customers from industrial, manufacturing, and university SIC classifications with a demand exceeding 5 MW. Customers on VPI nominate some portion of their load as firm, which they purchase under the standard, firm service tariff. The remaining portion of their load is interruptible and is charged at hourly prices developed from projections of the average cost of the top 1,000 MW of generation in that hour, plus a markup. VPI participants have several options related to advance notice of hourly prices (day-ahead or hour-ahead) and advance notice for interruption (5-minute or 60-minute). During interruption periods, an “excess takings charge” is assessed on usage above the firm load level. Participants in VPI are also subject to a monthly billing demand charge, assessed on their total load (firm plus interruptible). TVA offers a similar tariff, on a pilot basis, to customers with peak demand under 5 MW. Similar to VPI, participants in this pilot nominate a firm load level, which is priced at the standard, firm service rate, and the incremental usage above their firm load is interruptible and is charged at hourly prices. These hourly prices are made available for participants on a day-ahead basis. A demand charge is assessed, based on each participant’s historical billing demand, which provides participants with an opportunity to add new load without associated demand charges.

A Survey of Utility Experience with Real Time Pricing
102
The third tariff is a CBL-based tariff available only to customers larger than 20 MW. The tariff is treated as a financial overlay, where all the provisions of a customer’s existing contract mix continue to apply to their customer baseline load (e.g., firm load and interruptible load provisions). All hourly incremental/decremental usage relative to the CBL is then charged/credited at a price equal to TVA’s projected top-of-stack marginal generation cost plus/minus a risk recovery factor. Notification of hourly prices is provided on an hour-ahead basis. Tariff History: Utility Motivation and Goals VPI is an outgrowth of an earlier tariff, the Economy Surplus Power (ESP) program, which TVA has offered since 1986. The tariff was motivated essentially by an interest in promoting load growth. At the time, TVA had excess generation capacity, and many industries in the region also had slack in their production capacity. These customers were interested in gaining access to the low cost marginal supplies, and TVA was similarly interested in improving the capacity utilization of their generation fleet. ESP was renamed VPI in 1999, when several tariff modifications were made. Hourly prices under ESP were based on the actual (as opposed to the projected) cost of the top 100 MW in the generation stack for each hour. With VPI, price quotes (either hour-ahead or day-ahead) are firm, and, in order to reduce price volatility, the prices are based on the top 1,000 MW in the generation stack. Going forward, no major modifications to the tariff structure are planned, although TVA may consider closing the tariff to new load, due to the already sizeable participation level. The small customer pilot was introduced in 1998, in response to interest expressed by customers below the minimum size threshold for the ESP program. At the time, it was the only interruptible tariff available to customers of this size; but since then, a standard, flat price interruptible tariff has become available to customers in this size range. Because the RTP pilot has not garnered much participation, and is relatively complex to administer, TVA has recently been moving its RTP customers onto the standard interruptible tariff with fixed prices for all load, and is considering closing the pilot. The two-part RTP tariff is the newest of TVA’s RTP rates, introduced in 2000/2001. Unlike the other tariffs, which were principally driven by an interest in stimulating load growth (at least in their initial stages), the two-part RTP tariff was offered specifically for the purpose of reducing TVA’s exposure to price volatility. Participation Marketing for both VPI and the small customer pilot have been conducted in concert with TVA’s distributors, by sponsoring information sessions and distributing brochures. TVA has conducted some additional marketing directly with customers through regional trade associations for industrial and manufacturing customers. Interest in VPI has been quite significant, with 375-400 customers currently participating, comprising a total VPI contract demand of 3,400 MW. This amounts to between two-thirds and three-quarters of all qualifying customers. Most of the

A Survey of Utility Experience with Real Time Pricing
103
participating customers are served through one of TVA’s distributors, although the majority of the load is associated with customers directly served by TVA. In contrast, participation in the small customer pilot has been quite modest. Currently, 6-7 customers are on the tariff, with a combined demand of approximately 10 MW; and the maximum enrollment at any time has been 12 customers. The limited participation is, in part, attributable to the increase in price volatility that emerged soon after the tariff was introduced, which discouraged customers from joining the tariff, and led to the departure of a number of early enrollees. Many customers looking for discounted rates are likely to find that the standard, flat price interruptible tariff provides a similar discount, with less associated risk. The two-part RTP tariff is applicable to a much smaller base of customers (approximately 35 are eligible), and thus any information provided to customers occurs through individual meetings. Since first offered, approximately five customers have participated in the tariff. Load Response Participants in VPI provide a substantial level of price response, and TVA operators and planners incorporate this response into day ahead scheduling and long-term resource evaluations. Many of the customers in the tariff, particularly the large commodity producers, have three production shifts, and respond to high price periods by rescheduling certain production activities to another shift. Typically, the pattern of response can be characterized as a step function, with 200-300 MW of load shifting that occurs when average prices during a particular shift reach $0.04/kWh. The several customers in the two-part RTP tariff have also been found to shift loads in response to prices, although the magnitude of this response has not been quantitatively assessed. In contrast to the other two tariffs, participants on the small customer pilot have exhibited very little response to price movements. Customer interest in this tariff was driven chiefly by a desire to gain access to low, marginal-cost based energy prices; and the several customers who have enrolled in the tariff apparently did so without the intent to respond to hourly price variation. Due to their smaller size, many of these customers may not have the operational flexibility of some of their larger counterparts in VPI, and therefore may be limited in their ability to respond to prices. Wisconsin Electric Experimental Real Time Pricing Tariff Description Wisconsin Electric offers a bundled, multi-part tariff to customers with an average monthly billing demand of at least 500 kW. Customers on the tariff are charged for all of their usage at hourly energy prices, in addition to demand charges. Hourly energy prices include several components: a marginal energy cost based on a day-ahead forecast of internal operating costs, a marginal generation capacity cost based on loss of load probability, and several other factors. The hourly energy prices are communicated to participants by 4 PM, the day prior.

A Survey of Utility Experience with Real Time Pricing
104
Customers can opt for firm or non-firm service on the tariff. Customers that receive non-firm RTP service receive a demand credit on the difference between their contract demand and their firm power demand. During interruption periods, a non-compliance penalty is assessed on demand in excess of the firm power level. Tariff History: Utility Motivation and Goals The tariff was introduced as a pilot in 1996, targeted towards industrial and manufacturing customers. The motivation for the tariff was to provide opportunities to savings for customers that had the ability to monitor and respond to energy price signals. Thus, customer retention and load management were both objectives of the offering. Current enthusiasm for the tariff is low, largely due to perceived price risks to the customer outweighing the potential customer savings. The company is in the process of designing a new RTP tariff, based on a two-part design that may include price-risk management products (caps and collars). Participation The pilot participation is capped at a combined 300 MW of average monthly billing demand. The tariff has not been heavily marketed, and since being introduced in 1996, only three customers have signed up for the tariff. All three have dropped out of the tariff over the past several years. While hourly prices in the tariff have remained relatively flat (due to Wisconsin Electric’s resource mix), customers were reportedly unwilling to bare the additional risk or incur the additional costs associated with monitoring energy prices. Load Response No information is known about the price response of the three previous customers on the tariff. Xcel Energy (Northern States Power Company) Experimental Real Time Pricing Tariff Description Xcel Energy offers a bundled, multi-part RTP tariff in their Minnesota and Wisconsin service territories, available to customers with an average monthly on-peak demand of at least 1 MW. Customers on the tariff are charged for all of their usage at hourly energy prices, as well as several demand charges. Hourly energy prices are based on day-ahead forecasts of marginal energy costs, plus a proxy for marginal capacity costs derived from project system load levels. These hourly energy prices are communicated to participants by 4 PM, the day prior. The rate also includes an interruptible load option, which provides a demand charge discount to customers who agree to reduce their load, with one hours’ notice, to a pre-determined (i.e.,
A Survey of Utility Experience with Real Time Pricing
105
“firm”) power level at least 500 kW below their monthly access demand. During interruption events, a non-compliance penalty is assessed on demand in excess of the customer’s pre-determined power level. Tariff History: Utility Motivation and Goals The tariff was introduced as a pilot in 1997, with an enrollment cap of 300 MW total average on-peak demand. The tariff offering was a response to an order by the Minnesota Public Utilities Commission (PUC), requiring Xcel to phase out its experimental three part time-of-day rate and replace it with an RTP tariff. The objective of the pilot was to generate some level of experience and administrative infrastructure that could potentially inform and support a permanent RTP tariff at a later date. The motivation for experimenting with rate design, in general, was to provide more efficient and equitable price signals, which would also serve to encourage load management and reduce contributions to system peak loads. The RTP pilot was originally intended to last for two years, but was extended on several occasions in order to allow Xcel sufficient time to manage administrative issues and develop rate design improvements for a replacement tariff. The utility submitted a proposal for a new, two-part tariff in 2001, but they later withdrew the proposal, citing issues of “administrative complexity and controversy” (MPUC, 2001). In part, this controversy was associated with opposition by several large industrial customers to the Customer Baseline Load (CBL) feature inherent in two-part tariff designs. A single large industrial customer enrolled on the existing RTP pilot argued that their costs would rise substantially on the proposed two-part tariff. This customer was concerned that their lower-cost load characteristics, which are recognized by the one-part RTP tariff, would not be recognized when billed at the standard tariff rate as part of a CBL. Following withdrawal of the proposed tariff revision, the PUC extended the existing one-part pilot through 2003, and ordered Xcel to propose a new replacement RTP tariff. A new one-part RTP proposal is currently under review by the PUC. This proposal is limited to 150 MW total on-peak demand and differs from the original tariff in several ways intended to address limitations of the previous tariff. The most significant difference is the structure of the demand charge. On the new tariff, participants are able to select a contract demand level at or above their average demand during all peak period hours, upon which their demand charges are based. During high-cost peak periods, a targeted energy-based surcharge is assessed on all incremental energy consumption above their contract demand. This new method for assessing demand charges serves to eliminate the problematic reliance on customer load history, which can become increasingly unrepresentative over time, while at the same time allowing customers to increase their loads in response to low prices without a demand charge penalty. Another difference is that, rather than exposing customers to unmitigated price volatility, energy prices are based on a number of “day-types”, with pre-specified energy prices for each of six different time blocks. (The maximum price under this design is $0.28/kWh.) This approach introduces some of the stability of conventional TOU pricing while retaining the RTP feature of aligning pricing with different daily conditions. The motivations for this feature were to simplify participation and administration and to eliminate some of the risk exposure to customers, with the hope of improving customer acceptance and participation.

A Survey of Utility Experience with Real Time Pricing
106
Despite having proposed a new pilot design, Xcel remains somewhat skeptical about the feasibility of more widespread implementation of RTP. First, the potential market for customers willing to incur the additional risk and transaction costs associated with monitoring and responding to energy prices is deemed to be relatively small. And second, there has yet to emerge any adequate resolution to the set of distributional issues that arise when RTP provides passive bill savings to participants with lower-cost usage patterns. Customers not on the tariff object to this outcome, since their rates must rise to cover revenue requirements. But the customers receiving these passive savings argue that the outcome is necessary and fair, since more accurate pricing more closely reflects the actual costs of their consumption. So far, no clear solution to this conflict has emerged. Participation Under a one-part RTP tariff, a customer’s entire load is exposed to real time prices. Due to the risk to the customer entailed by such a design, Xcel focused their marketing on customers with high load factors who would be expected to achieve at least 2-3% passive bill savings (i.e., without undertaking any price response). This level of passive savings was deemed necessary compensation for the additional risk born by customers on the rate. Xcel identified approximately 50 customers (out of 350 eligible customers) who would achieve at least this level of passive bill savings. Account representatives met with these customers to discuss the rate and presented them with static bill comparisons to illustrate the expected savings. Since its inception, six customers have enrolled in the tariff (Xcel Energy et al, 2001). The peak enrollment at any one time was five customers, representing approximately 110 MW of combined peak demand. Three of these customers left the tariff after an unusually hot summer in 2001 when prices rose dramatically. The departing customers were reportedly not equipped to respond to prices, and thus their energy costs rose considerably during this period. The two customers currently receiving service under the RTP tariff represent a combined load of 90 MW, the majority of which is associated with a single, large customer. Xcel attributes the limited participation to a number of factors (Xcel Energy et al. 2001). Most fundamentally, participation was limited by the nature of the tariff design. Only customers with relatively high load factors for their class, or with very low cost options for shifting load, could expect to receive sufficient compensation for the additional risk associated with a one-part RTP tariff. Other customers would need to institute significant and ongoing changes just to break even. Xcel also cites the fact that the pilot tariff design was unfamiliar, even for customers familiar with RTP tariffs offered by other utilities. Both of these were factors behind Xcel’s 2001 proposal for a two-part rate, which it expected to have broader appeal, since it would expose customers to less risk and was a more familiar tariff design. Load Response Although the price response of RTP participants has not been formally analyzed, available information indicates that some customers provided little or no price response. The tariff was targeted to customers on the basis of their passive bill savings, without explicit consideration of

A Survey of Utility Experience with Real Time Pricing
107
their ability to respond to price signals. Thus, some customers are likely to have enrolled without the intention and/or the capability to provide price response. The two customers currently receiving RTP service do provide some discernable response to prices – which is, in part, why they remained on the tariff following the period of high prices in summer 2001. The larger of these two customers reduces their load by approximately 85% above a threshold price in the range of $0.10-0.15/kWh. This company has reportedly invested significant time and money into developing manufacturing strategies, training personnel, and setting up necessary energy monitoring and management systems to respond to prices. Xcel Energy (Public Service Company of Colorado) Real Time Pricing Service Tariff Description Xcel Energy offers a bundled, CBL-based RTP tariff to customers in its Colorado service territory with an annual peak demand of at least 500 kW. Each customer’s CBL is developed from historical hourly load data from the twelve months prior to service under the RTP tariff. In each billing period, a participant is charged for their CBL energy usage based on their otherwise applicable tariff. A demand charge, referred to as the Access Charge, is applied to the customer’s actual monthly peak demand to recover T&D costs, and a second demand charge, the Production Demand Charge, is applied to the their CBL billing demand to recover embedded generation costs. Energy consumption above/below the CBL in any hour is charged/credited at the prevailing hourly energy price. Hourly energy prices are based on a day ahead forecast of the marginal cost of energy to serve native load. During periods of low reserves-to-load ratio, a marginal capacity charge, based on an estimate of marginal outage cost, is added to the hourly price. Participants are notified of hourly energy prices by 4 PM of the day prior. If customers purchase their CBL under an interruptible service tariff, the CBL is temporarily reduced to zero during interruption periods, and all of the provisions of the interruptible service tariff apply, as though the customer were not participating in the RTP tariff. Tariff History: Utility Motivation and Goals The tariff was introduced as a pilot in 1997. The tariff was most directly motivated by interest from one large customer who was receiving RTP service in several other utility service territories. The Colorado Public Utilities Commission order approving the pilot indicates that the company was also interested in reducing peak demand, providing more efficient pricing, and gaining administrative experience with market-based pricing, in anticipation of a competitive retail market (Colorado PUC 1996). Participation was initially limited to customers larger than 1 MW, but the minimum size requirement was later decreased to 500 kW, in order to encourage greater participation levels. The pilot is currently set to expire at the end of 2004, and the utility is not expected to file for a tariff extension.

A Survey of Utility Experience with Real Time Pricing
108
Participation With the exception of brochures initially distributed to customers larger than 1 MW, marketing for the tariff has not been particularly active, and information about the tariff is provided to customers largely at the discretion of individual account representatives. Perhaps as a result, participation has been somewhat limited. Approximately nine to ten customers have taken service under RTP over the course of its existence (out of approximately 1,300 eligible), and the maximum enrollment at any time has been five customers. Currently, three customers are enrolled on the tariff. Xcel also has one large customer, a municipal water board, who is not enrolled on an RTP tariff, but who is receiving service under a special contract that incorporates RTP-based pricing features. This customer has a number of sites with generation and their special contract was devised largely as a replacement for an expiring power purchase agreement. Load Response An evaluation of the pilot was conducted and filed with the Colorado Public Utilities Commission in 2002. The evaluation examined participants’ load response on an average monthly basis. In general, minimal variation in prices occurred over the study period (2000-2002), and consequently the ability to assess price responsiveness was limited. Prices did rise during winter 2000/2001, reaching an average monthly price of $0.13/kWh in December 2000, but no discernable price response was observed.