A SURVEY OF THE IKA-SHIBI FISHERY · southwest fisheries center administrative report h-82-4c a...
14
SOUTHWEST FISHERIES CENTER ADMINISTRATIVE REPORT H-82-4C A SURVEY OF THE IKA-SHIBI FISHERY IN THE STATE OF HAWAII, 1980 WALTER N. IKEHARA CONSULTANT OCTOBER 1981 Final Contract Report to the National Marine Fisheries Service Southwest Fisheries Center, Honolulu Laboratory Contract Purchase Order- no- 80-JJA-00389
Transcript of A SURVEY OF THE IKA-SHIBI FISHERY · southwest fisheries center administrative report h-82-4c a...

SOUTHWEST FISHERIES CENTER ADMINISTRATIVE REPORT H-82-4C
A SURVEY OF THE IKA-SHIBI FISHERY
IN THE STATE OF HAWAII, 1980
WALTER N. IKEHARA
CONSULTANT
OCTOBER 1981
Final Contract Report to the National Marine Fisheries Service
Southwest Fisheries Center, Honolulu Laboratory
Contract Purchase Order- no- 80-JJA-00389

PREFACE
This report was prepared under contract (Purchase Order No. 80-
JJA-00389, dated 19 September 1980) by Walter N. Ikehara, graduate
student, University of Hawaii. The contract objective was to collect
data from the Hawaiian ika-shibi fishery. The resulting data tabula-
tions and summarizations, and descriptions of data collecting methodol-
ogy provide information on the status of the Hawaiian ika-shibi fishery
.through 1980 and are intended to aid future data collecting activities for this fishery. Since the report was prepared under contract, the
statement, findings, conclusions, and recommendations in it are those
of the contractor and do not necessarily reflect the view of the
National Marine Fisheries Service.
Howard 0. Yoshida Fishery Biologist
16 April 1982

INTRODUCTION
The ika-shibi, or night handline, fishery for tunas has
undergone rapid expansion in the last few years. This is due
mainly t o the high productivity of the method and its low
capital and operating costs. fllthouqb predominantly occurring
on the island of Hawaii, it has also become established on Kauai
and possibly Ether islands in the state of Hawaii. Since the
description of the fishery by Yuen (197911, based on 1973-1975
data, there have been no reports detailing the recent
development and progress of the fishery.
Since there is no separate category for ika-shibi in the
catch reports of the Division of Aquatic Resources, state of
Hawaii, ika-shibi catch data are usually reported in the
deep-sea handline category. Because the deep-sea handline
category may also include catch data from the day handline and
bottomfish handline fisheries, it is difficult to distinguish
the ika-shibi catch. It is also possible that some of the
ika-shibi catch may not be reported at all. The National Marine
Fisheries Service funded this contract for the purpose of
collecting descriptive data on the ika-shibi fishery in the
state of Hawaii in order to assess the size of the fishery, its
economic value, and its catch, for inclusion in fishery
management plans for tuna and billfish species.
1
The results of this survey will be useful in the
formulation of economic and development plans for the fishing
industry in the state and in the planning of further research on
the i ka-shi bi fishery.
METHODS
The data were collected in two ways from five principal
wholesalers on the island of Hawaii and one from the island of
Kauai: 1) The wholesalers who deal with ika-shibi fishermen
were approached and direct access was gained to their fish
records;. The data I collected from these records included the
date of catch, locality, and catch by species with individual
fish weights and prices. 2) In some cases, I could not collect
the data myself and so the data were extracted by the
wholesaler, and did not always include complete records of all
desired data. A s a result some of the data presented in the
tables represent mixtures of actual data and estimates based on
similar data from other wholesalers.
The value data were incomplete from two wholesalers so the
ex-vessel revenues were estimated by the following method. The
mean price per pound was calculated from data from other
wholesalers in the same area. The weight of each fish was
multiplied by the price per pound, then summed for the entire
month;. The month’s total value was divided by the total weight
of fish for the month yielding the monthly mean price per pound.
The total weight of fish for each month from the wholesaler with
2

missing value data was mu l t i p l i ed by the calculated mean p r i c e
per pound resu l t i ng i n the month's estimated ex-vessel revenue.
This was done f o r each month and each species f o r which the
wholesaler lacked value data. Note tha t the f i gu res c i t e d i n
Table 1 represent the ex-vessel value of the f i s h on ly and do
not include the value added by the wholesalers and r e t a i l e r s
deal ing w i th the marketing and processing of f i s h caught i n the
ika-sh ib i f ishery. Data were not co l lec ted from small
wholesalers deal ing wi th a few ika-sh ib i fishermen or from
fishermen who market t h e i r catch independently as they comprise
a small segment of the t o t a l ika-shibi f i she ry and i t was
d i f f i c u l t t o c o l l e c t these data.
The catch records were a r b i t r a r i l y selected, w i t h the
consul tat ion of wholesalers and fishermen, far i nc lus ion in t he
ika-shibi catch data, as notat ions were not made as t o the
method by which f i s h were caught, The records were selected
based on knowledge of the establ ished ika-shibi fishermen and
presence i n the catch of species usual ly caught by ika-shibi
fishermen, such as ye l l ow f in tuna, albacore, swordfish, and
bigeye tuna. I n Hi lo, on the is land of Hawaii, fishermen who
use the ika-sh ib i method do not usual ly f i s h any other way.
However, along the south and west coast o f Hawaii, fishermen may
u t i l i z e the ika-shibi, day tuna handline, t r o l l i n g , and
bottom-f i sh ing methods, depending on the season and the
pa r t i cu la r types of f i s h i n abundance. Along the southwest
coast, i t seems tha t most tuna fishermen use the ika-shibi
3

method only at times when large tuna are abundant in certain
areas. Some fishermen use the ika-shibi method consistently
during much of the year.
Since the wholesale records do not include data on fishing
effort, a stock assessment study was infeasible and there wa5 no
certainty as to which fishermen were full-time or part-time.
Full-time meant that the fisherman had no other full-time job,
while part-time meant that the fisherman may have another
full-time jab, or that le55 than one-half of his income came
from fishing. Some indication can be obtained by examining the
dates of reported catch (not presented here) assuming that
full-time fishermen are more likely to fish during the week than
are part-time fishermen. c ) large number of full-time fishermen
will confirm the validity of the ika-shibi fishery as an
industry.
RESULTS
The tables clearly show that the ika-shibi fishery is now
considerably larger than when described by Yuen (1979). The
total weight of tunas caught in 1980 was almost six times that
for 1975 (887,782 VI. 154,955 ki 1 ograms) . The ex-vessel
revenues for tunas in 1980 was about $2.8 million compared to
$327,500 for 1975, almost a ten-fold increase. Other species
added about 9110,000 to the total ex-vessel revenues for 1980.
The species caught are listed in order of weight (Table 1) and
show that yellowfin tuna is definitely the primary species
4
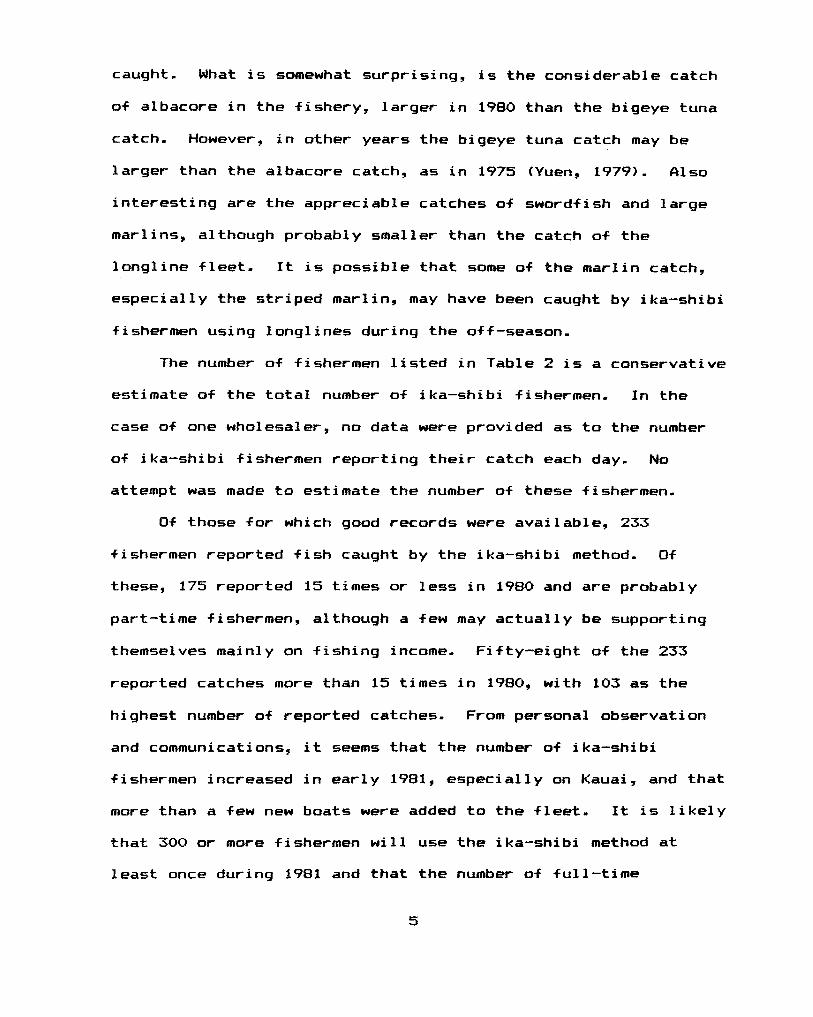
caught. What i s somewhat surprising, i s the considerable catch
of albacore i n the f ishery, larger i n 1980 than the bigeye tuna
catch. However, i n other years the bigeye tuna catch may be
la rger than the albacore catch, as i n 1975 (Yuen, 1979). Also
i n te res t i ng are the appreciable catches of swordfish and la rge
marlins, although probably smaller than the catch of the
long l ine f l ee t . I t i 5 possible t h a t some of the mar l in catch,
especia l ly the s t r i ped marlin, may have been caught by ika-shibi
f i s h e r m e n using longl ines during the off-season.
The number of fishermen l i s t e d i n Table 2 i s a conservative
estimate of the t o t a l number of ika-shibi fishermen. I n the
case of one wholesaler, no data were provided as t o the number
of ika-shibi fishermen repor t ing t h e i r catch each day. No
attempt was made t o estimate the number of these fishermen.
O f those f o r which good records were avai lable, 233
fishermen reported f i s h caught by the ika-shibi method. O f
these, 175 reported 15 times or l ess i n 1980 and are probably
part-t ime fishermen, although a few may ac tua l l y be supporting
themselves mainly on f i s h i n g income. F i f t y -e igh t o f the 233
reported catches more than 15 times i n 1980, w i t h 103 as the
highest number of reported catches. From personal observation
and communications, i t seems tha t the number of ika-shibi
fishermen increased i n ea r l y 1981, especia l ly on Kauai, and t h a t
m o r e than a few new boats were added t o the f l e e t . It i s l i k e l y
t h a t 300 or more fishermen w i l l u5e the ika-shibi method a t
leas t once during 1981 and tha t the number of f u l l - t ime
5

fishermen will increase by the end of the year.
The information in Table 3 shows the seasonality of various
species in the fishery. Although the figures can be misleading
because no effort data are available to compare with the catch
data, the monthly catch figures indicate the effects of seasonal
fishing effort and fish abundance on seasonality. The
seasonality of the fishery also depends on the location, being
slightly different for the east and west coasts of the islands.
The east coast of the island of Hawaii generally has a fishing
season lasting from May through October. The west coast seems
to have a summer/early fall season also, but there seems to be a
winter "run** of large tuna near the South Point area of Hawaii.
In general, summer and early fall is the period of peak
abundance of yellowfin tuna throughout the state. Yuen (1979)
provides more details for the fishing season in Hilo.
DISCUSSION
A s seen from the tables, the ika-shibi fishery has grown
about s i x times larger since 1975 (see Table 4) . This confirms
the suspected rapid growth of the fishery within recent years.
Although no data are available to confirm this, I don't think
that the fishery has reached it5 maximum size yet.
The total ex-vessel revenues of the fishermen exceeded $2.9
million in 1980. Industry sources have cited estimates as high
as %5 million as the total worth of the fishery. If the
revenues of the wholesalers and retailers marketing the
6

ika-shibi catch are added to the fishermen's revenues, it seems
that this estimate is accurate. This estimate will place the
ika-shibi fishery as one of the more important fisheries in the
state. Considering that individual fishermen have been
estimated by fishery sources to have a gross income as high as
$140,000 per year, with an estimated average gross income of
640,000 to $80,000 per year, it is not surprising that the
fishery is experiencing rapid growth.
The ika-shibi fishery, along with the albacore troll
fishery off the Northwestern Hawaiian Islands, is a very
promising newcomer to the small but locally important fishing
industry in the state of Hawaii. Since it is characteristically
productive and low-cost, it is an ideal +ishery development
project for other small Pacific Ocean island groups. It has
been found to be highly succesir;ful in the Philippines (Yuen,
1979). Attempts to introduce the ika-shibi method to other
areas have met with varying degrees of success (Strong, 1979).
If the ancillary fish-handling and transportation facilities are
available, then it is potentially a highly profitable industry.
RECOMMENDATIONS
While the ika-shibi fishery possesses high growth
potential, it is also hindered by certain problems. A condition
known as "burnt tuna" occurs in a significant proportion of the
ika-shibi catch. It appears a5 a pale, soft deterioration of
r a w tuna muscle which causes a sour, bitter taste and a
7

displeasing appearance to the raw tuna (Cramer, et. al., 1981).
The incidence of burnt tuna is a serious problem, primarily
because of the need for high quality in fresh tuna for the
export market. Since the local market is too small to absorb
the large quantities of fresh tuna caught during the peak
season, export markets are important to the further expansion of
the fishery (Hawaii Business, 1979). Burnt tuna occurs in tuna
caught by other fishing methods, such a5 trolling and purse
seining, but fish caught by these methods are not usually
exported from Hawaii . The first goal in improving the quality of fresh tuna
should be the development of a burnt tuna assay for use on whole
tuna. If the exporters can ensure that the tuna being exported
are of high quality by assaying for burnt tuna, then export
marketing losses will be eliminated. Secondly, the incidence of
burnt tuna should be reduced by improvements in fishing and
handling procedures so that a higher level of quality in fresh
tuna can be maintained. Such measures will benefit both the
local markets and the export markets;,
A s the ika-shibi fishery continues to grow, new fishing
areas should be explored and exploited as the traditional
fishing areas become more crowded. It is likely that not all
islands will have suitable ika-~ihibi fishing areas, but I do not
think that enough exploration has been done. Occasional
anecdotal reports of ika-shibi fishing have been reported +or
areas of the state where ika-shibi fishing is not regularly
8

taking place. A s a requisite for exploratory work, thorough
studies should be made of the existing ika-shibi fishing
grounds, such as food resources, oceanographic conditions, and
fish migratory patterns in the area.
I dl50 recommend that s o m e mechanism be set up to collect
data regularly f r o m the ika-shibi fishery so that a good
historical data base of the fishery can be established. Such a
data base would be valuable in stock assessment studies, fishery
management plans, research on topics such as burnt tuna, and in
economic studies. Although the Hawaii Division of Aquatic
Resources collects data on the deep-sea handline fishery, the
catch data does not segregate bottom-fishing and ika-shibi
catches. Furthermore, not all of the ika-shibi catch may be
reported in the deep-sea handline data because it may be
reported in other categories or not at all- The ika-shibi
fishery is unique and deserves its own category.
The opinions and recommendations expressed in this report
are my own and not of the National Marine Fisheries Service or
the Hawaiian fishing industry.
ACKNOWLEDGEMENTS
I would like to thank the ika-shibi wholesalers and
fishermen who very cooperatively furnished the data used in this
report. I would also like to thank R. A. Skillman, J. C.
Cooper, and H. S. H. Yuen for helpful criticism.
9

REFERENCES
Cramer, J. L., R. M. Nakamura, A. E. Dizon, and W. N. Ikehara
1981. Burnt tuna: Conditions leading to rapid
deterioration in the quality of fresh tuna. Mar. Fish.
Rev. 4 3 M : 12-16.
Hawai i Business
1979. Making it on the Big Island - Stan Shimizu: The ahi
king of Honaunau. Hawaii Business 25<5):43-44 Nov 1979
Strong, R. D.
1979. 1978-79 PTDF funded feasibility study to establish
an ika-shibi fishery on Guam - Final Report. Pacific
Tuna Development Foundation, Honolulu HI 96804, May 1979
Yuen, H. S. H.
1979. A night handline fishery for tunas in Hawaii.
Mar. Fish. Rev. 41 (8):7-14.
10

TABLE 1
Ye1 1 owf i n tuna
A1 bacore
Bigeye tuna
All tunas
Swordfish
Mahimahi
Marlin +
Striped marlin . Sai 1-f i sh
Shortbi 11 spearfish
Squid
814,871#
43,645
29,266
887,782
19, 720
6,658
6,229
2,570
111
30
2,437
21,110
1 , 837
819
23,756
269
672
54
73
9
1
-
2,618,945*
71 , 374$
108,611 * 2,798,930
58,507
33,348
7, 861
7,070
359
86
4,268
6
4
5
- 3
3
3
2
1
1
2
Weight to nearest kilogram, converted from pounds. # Of this total yellowfin tuna catch, 5,825 kg of unidentified
tuna were reported from Kauai. The remainder were reported from Hawaii.
8 In s o m e cases, a portion of the values are e6tirnated. + Species not identified in records, probably blue marlin. t Number of sources reporting catch.
TABLE 2
&-15 Times per year 51 9.8 2.6
>15 Times per year 58 40.2 24.0
Note: Data from 4 sources from the island of Hawaii. Mean number and standard deviation (SD) refer to the number of reports for each category at left.
11
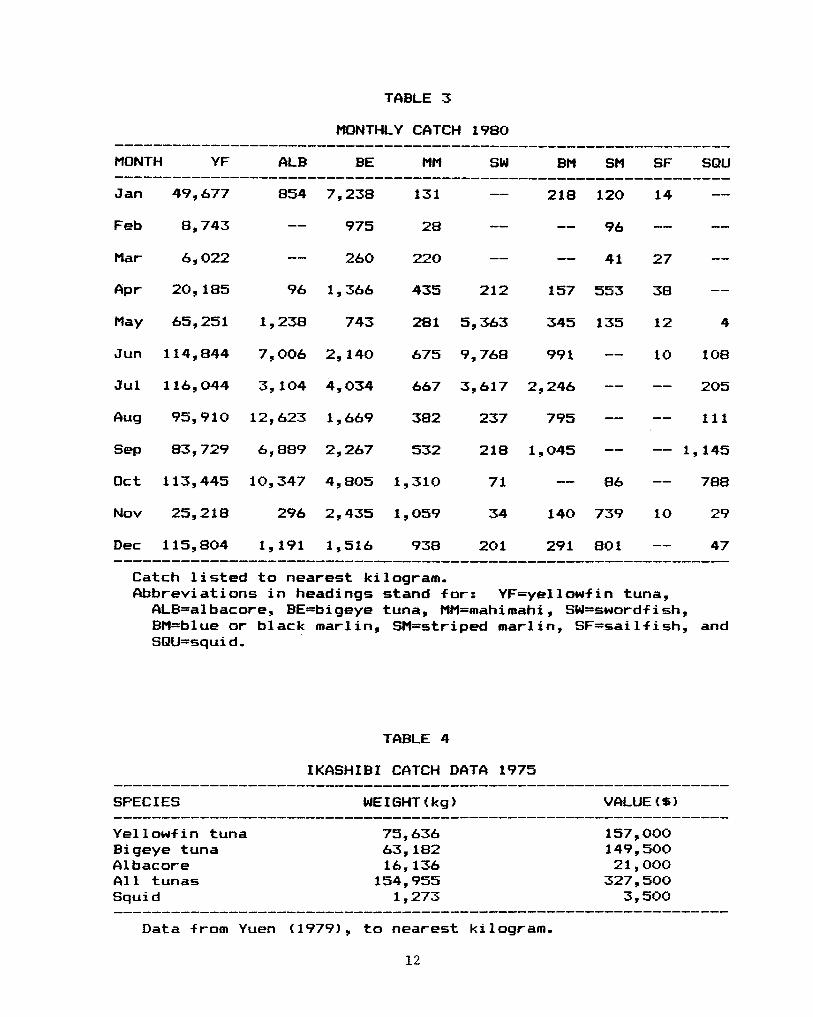
TABLE 3
Jan
Feb
Mar
APr
May
Jun
Jul
SeP
oc t
Nov
Dec
49,677 854
8,743 -- 6,022 --
20,185 96
65,251 1,238
114,844 7,006
116,044 3,104
95,910 12,623
83,729 6,889
113,445 10,347
25,218 296
115,804 1,191
7,238
975
260
1,366
743
2,140
4,034
1,669
2,267
4,805
2,435
1,516
-- 131
28
220
435 212
281 5,363
675 9,768
667 3,617
382 237
532 218
1,310 71
-- --
1,059 34
938 201
218 120
96
41
157 553
345 135
991 -- 2,24& -- 795 --
1,045 --
-- --
86
140 739
291 801
--
Catch listed to nearest kilogram. Abbreviations in headings stand for: YF=yellowfin tuna,
ALB=albacore, BE=bigeye tuna, MM=mahimahi, SW=swordfish, BM=blue or black marlin, SM=striped marlin, SF=sailfish, and SQU=squi d.
TABLE 4
IKASHIBI CATCH DATA 1975
Ye1 1 owf i n tuna 75,636 157,000 Bigeye tuna 63,182 149,500
A11 tunas 154,955 327,500 A1 bacore 16,136 21,000
Squid 1,273 3,500 __-------------------------------------------------------------- Data from Yuen (19791, to nearest kilogram.
12