A Survey of Staffing Levels of Medical Clinical Academics ... · A Survey of Staffing Levels of...
36
A Survey of Staffing Levels of Medical Clinical Academics in UK Medical Schools as at 31 July 2011 A report by the Medical Schools Council Siobhan Fitzpatrick October 2012
Transcript of A Survey of Staffing Levels of Medical Clinical Academics ... · A Survey of Staffing Levels of...
A Survey of Staffing Levels ofMedical Clinical Academics in UK Medical Schools as at 31 July 2011
A report by the Medical Schools Council
Siobhan FitzpatrickOctober 2012


A Survey of Staffing Levels of Medical Clinical Academics in UK Medical Schools as at 31 July 2011
A report by the Medical Schools Council
Siobhan FitzpatrickOctober 2012

2 Clinical Academic Staffing Levels in UK Medical Schools © Medical Schools Council 2012
Medical Schools Council
Chair Professor Tony Weetman MD DSc FRCP FMedSciDeputy Chair Professor Iain T Cameron MD FRCOG FRCP Edin
Medical Schools Council Secretariat
Executive Director Katie Petty-Saphon MBE MA PhDSenior Policy Officer Jocelyne Aldridge BSc MScExecutive Assistant Barbara AndersonSenior Project Officer Veronica Davids BScSenior Policy Officer Siobhan Fitzpatrick BA MAProject Support Officer Olga Sierocinska BA MAPolicy Officer Oliver Watson BA MSc
The Medical Schools Council Secretariat is based at:Woburn House20 Tavistock SquareLondon WC1H 9HD
Tel: +44 (0) 20 7419 5494Fax: +44 (0) 20 7380 1482Email: [email protected]
For more information about the work of Medical Schools Council please see www.medschools.ac.uk
Published by Medical Schools Council© 2012 Medical Schools Council London
All rights reserved. No part of this publication may be reproduced or transmitted in any form or by any means, electronic or mechanical, including photocopying, recording or any other information storage and retrieval system, without express prior permission from the publisher.

Clinical Academic Staffing Levels in UK Medical Schools © Medical Schools Council 2012 3
Contents
Figures 4
List of Acronyms 5
Preface 6
Introduction 7
Methodology 8
Medical Clinical Academic Staffing Levels in UK Medical Schools in 2011 9 1 OVERVIEW 9 2 ACADEMIC GRADE 10 3 FUNDING 11 4 REGION 12 5 SPECIALTY 13 6 VACANCIES 15 7 AGE 17 8 GENDER 18 9 ETHNICITY 2010 CLINICAL EXCELLENCE, MERIT AND DISTINCTION AWARDS 2011 CONCLUDING REMARKS 22
Appendices 24
Appendix 1: Profile by specialty and source of funding (FTE) 24
Appendix 2: Profile by region and source of funding (FTE) 25
Appendix 3: Profile by medical school and source of funding (FTE) 27
Appendix 4: Summary of changes (pre- and post- 2002 medical schools) (FTE) 30
Appendix 5: NHS and clinical academic consultants by specialty and UK medical student intake (FTE) 30
Appendix 6: Summary of change in clinical academic staffing level since 2000 (FTE) 30
Appendix 7: Clinical academic staffing levels by region since 2004 (FTE) 31
Appendix 8: Age profile of clinical academics since 2004 (headcount) 31
Appendix 9: Clinical academics by age, gender and academic grade (headcount) 31
Appendix 10: Clinical academics by age and ethnic origin (headcount) 31
Appendix 11: Clinical academics by academic grade and ethnic origin (headcount) 32
Appendix 12: Medicine specialty groups and sub-specialties 32

4 Clinical Academic Staffing Levels in UK Medical Schools © Medical Schools Council 2012
Figures
Figure 1: Timeline of clinical academic staffing levels by academic grade since 2000 (FTE) 9
Figure 2: Clinical academic staffing levels by academic grade since 2000 (FTE) 10
Figure 3: Clinical academic grade by source of funding (FTE) 11
Figure 4: Timeline of clinical academic staffing levels by source of funding (FTE) 11
Figure 5: Funding profile of clinical academic posts by medical school (FTE) 12
Figure 6: Clinical academic staffing levels by region since 2010 (FTE) 12
Figure 7: Clinical academic staffing levels by region and source of funding (FTE) 13
Figure 8: Clinical academic staffing levels by specialty since 2000 (FTE) 14
Figure 9: Clinical academic staffing levels by specialty since 2000 – Lecturers (FTE) 14
Figure 10: Vacant posts by specialty (FTE) 16
Figure 11: Vacant posts by academic grade (FTE) 16
Figure 12: Age profile of clinical academics since 2004 (headcount) 17
Figure 13: Age profile of clinical academic consultants and NHS consultants (headcount) 17
Figure 14: Clinical academic staffing levels by academic grade since 2004 – women (headcount) 18
Figure 15a: Clinical academic staffing level by age and academic grade – men (headcount) 19
Figure 15b: Clinical academic staffing level by age and academic grade – women (headcount) 19
Figure 16: Mean age of clinical academics by academic grade and gender (headcount) 19
Figure 17a: Ethnic origin of clinical academics (headcount) 20
Figure 17b: Ethnic origin of Professors (headcount) 20
Figure 17c: Ethnic origin of Readers/ Senior Lecturers (headcount) 20
Figure 17d: Ethnic origin of Lecturers (headcount) 20
Figure 18: Clinical academics with a Clinical Excellence Award (or equivalent) by gender (headcount) 21
Figure 19: Clinical academics with a Clinical Excellence Award (or equivalent) by gender and academic grade (headcount) 21
Figure 20: NHS and clinical academic consultants with a Clinical Excellence (or equivalent) award (headcount) 22
Figure 21: Timeline of numbers of NHS and clinical academic consultants since 2000 (FTE) 23

Clinical Academic Staffing Levels in UK Medical Schools © Medical Schools Council 2012 5
ACCEA Advisory Committee on Clinical Excellence Awards (England and Wales)
AGMETS Advisory Group on Medical Education, Training and Staffing
AHSC Academic Health Science Centre (England and Scotland)/ Collaboration (Wales)
AHSN Academic Health Science Networks
AoMRC Association of Medical Research Charities
BSMS Brighton and Sussex Medical School
CEA Clinical Excellence Award
CfWI Centre for Workforce Intelligence
CLAHRC Collaborations for Leadership in Applied Health Research and Care
DDRB Doctors and Dentists Remuneration Body
EWTD European Working Time Directive
FTE Full-Time Equivalent
GP General Practitioner
HEFCE Higher Education Funding Council for England
HEI Higher Education Institution
HESA Higher Education Statistics Agency
HIEC Health Innovation and Education Clusters (England)
IATP Integrated Academic Training Pathway (NIHR funded, England)
KCL King’s College London
LETB Local Education and Training Board
LSHTM London School of Hygiene and Tropical Medicine
MD Doctor of Medicine
MPET Multi Professional Education and Training levy
MRC Medical Research Council
NICEAC Northern Ireland Clinical Excellence Awards Committee
NIHR National Institute for Health Research
PhD Doctor of Philosophy
SACDA Scottish Advisory Committee on Distinction Awards
SCREDS Scottish Clinical Research Excellence Development Scheme
SHA Strategic Health Authority
STMTI Scottish Translational Medicine and Therapeutics Initiative
SWAN (Athena) Scientific Women’s Academic Network
UCAS Universities and Colleges Admissions Service
UCEA Universities and Colleges Employers Association
UCL University College London
UKCRC UK Clinical Research Collaboration
UKCMRI UK Centre for Medical and Research Innovation
WCAT Wales Clinical Academic Track
List of Acronyms

6 Clinical Academic Staffing Levels in UK Medical Schools © Medical Schools Council 2012
The Medical Schools Council represents the interests and ambitions of UK medical schools as they relate to the generation of national health, wealth and knowledge through biomedical research and the profession of medicine. As an organisation it occupies a unique position embracing medical undergraduate education, health related research, and critical interfaces with the health service and with postgraduate education and training. It aims to optimise locally, nationally and internationally the impact of the work undertaken in medical schools across the UK.
The Medical Schools Council is made up of the Head or Dean of each medical school on behalf of his/ her institution. Council meets four times each year, with an elected Executive Committee which meets six times each year. The three sub-committees of the Medical Schools Council undertake additional work in particular areas of interest – Clinical Staffing and Employment, Education, and Research. As the authoritative voice of all the medical schools within universities in the United Kingdom, the primary aims of the Medical Schools Council are:
1 To be the key reference point for Government, Higher Education generally and health related professional bodies, for informed opinion and advice on all matters relating to medical undergraduate education.
2 To respond proactively to the development and change that characterises the interface between higher education and the NHS.
3 To develop a close working relationship with NHS partner institutions and to facilitate the development of academic health science centres and networks.
4 To explore proactively the role of the doctor in the future and pursue educational solutions for workforce requirements involving doctors.
5 To work to improve and maintain quality in medical education and to facilitate the transition between undergraduate and postgraduate environments.
6 To promote clinical academic careers.7 To enhance clinical leadership and develop leaders
within medical schools.8 To promote the conduct of high quality, health related
research in all medical schools, recognising that the nature and scale of such research will differ between institutions.
9 To take due account of the views of the public on society’s needs of a doctor.
In the late 1990s, a series of reports highlighted the need for robust data on clinical academic staffing levels as a basis for partnership between the NHS and universities in tackling difficulties facing academic medicine1. In consultation with the Department of Health’s Advisory Group on Medical Education, Training and Staffing (AGMETS), and with the support of the Medical Research Council (MRC), the Association of Medical Research Charities (AoMRC) and the Wellcome Trust, the Medical Schools Council and the Dental Schools Council agreed jointly to undertake a comprehensive survey of clinical academic staff employed by UK universities in medical and dental schools.
Since 2000, the Medical Schools Council has undertaken a regular (annual since 2003) survey of clinical academic staffing levels in UK medical schools, available online at www.medschools.ac.uk. This is the tenth survey of clinical academic staffing levels, reflecting a decade of changes.
1 Including: Richards R (1997) Clinical Academic Careers – Report of an Independent Task Force Chaired by Sir Rex Richards. London: Committee of Vice Chancellors and Principals; Academy of Medical Sciences (2000) The Tenure Track Clinician-Scientist, a report of the Academy working group on academic careers.
Preface

Clinical Academic Staffing Levels in UK Medical Schools © Medical Schools Council 2012 7
Clinical academics make up around six per cent of the medical workforce. Most clinical academics are university employees but, in addition to academic activities, they have honorary contracts with the NHS and spend about half of their week as practising doctors involved in patient care. Clinical academics are responsible for the undergraduate curriculum, inspiring and educating the next generation, and they contribute substantially to postgraduate medical training. Importantly, clinical academics play a leading role in basic, translational and clinical research, bridging the divide between bench and bedside and providing a key interface with industry and policy-makers.
Clinical academia offers an exciting and varied medical career, with opportunities to work across teaching, research and clinical practice. Since the publication of the first survey of Medical Clinical Academic Staffing Levels in UK Medical Schools in 2001 (2000 census date), there have been significant changes in the world in which academic doctors work. Contract negotiations in 2003/04 ensured pay parity for university employed clinicians with their NHS counterparts; the introduction of national Clinical Excellence Awards in 2003 streamlined local employer based incentives for outstanding research and contributions to the NHS; the establishment of integrated clinical academic training pathways, for example those funded by NIHR and SCREDS has helped to ensure a pipeline into the clinical academic workforce. At the same time, evolving academic networks, particularly in England, are opening university medical schools to new collaborations with the NHS and industry and will also require them to work in new and innovative ways. Building on successes with Research Networks, Translational Research Partnerships, Academic Health Science Centres (AHSCs), Biomedical Research Centres and Units and Collaborations for Leadership in Applied Health Research and Care (CLAHRCs), it is hoped that the soon to be established Academic Health Science Networks (AHSNs) and Local Education and Training Boards (LETBs) will enable research diffusion and innovation in patient care, high quality education, and will play a critical role in promoting the UK as an opportunity for investment in health research.
The pace of change is unprecedented yet necessary. Concerns about the falling numbers of clinical academics are coupled with recent greater demands on medical schools from students paying higher tuition fees, downward pressures on the Multi Professional Education and Training (MPET) levy, and the constraints of the European Working Time Directive (EWTD). The population of the UK is ageing, there is rapid technological change, and public expectation around standards of service provision is rising. Revitalising academic medicine is essential to prepare for future healthcare demands and align priorities with global health needs.
The role of medical schools in educating undergraduate medical students is increasingly shared between the NHS and clinical academics, as medical education moves with patients to the community and primary care. Higher Education Institutions (HEIs) have different arrangements for the provision of teaching by NHS employed staff – the valuable contribution of whom may be recognised by honorary academic titles – and the provision of clinical care by university employed staff.
This report is an update of data reported in previous years, detailing staffing levels of clinical academic doctors in UK medical schools by specialty, region, school, age, gender and ethnicity as at the end of the academic year – 31 July 2011.
Introduction

8 Clinical Academic Staffing Levels in UK Medical Schools © Medical Schools Council 2012
Methodology
The data reported in the annual Survey of Staffing Levels of Medical Clinical Academics in UK Medical Schools are collected via an electronic survey with accompanying guidance notes and definitions. All UK medical schools return anonymised data on clinical academic grade, specialty, percentage full-time, source of funding, Clinical Excellence Award (or equivalent), and age, gender and ethnicity for each individual in post and for each vacant clinical academic post on the census date of 31 July 2011, the end of the academic year.
The methodology for the first survey of clinical academic staffing levels in 2000 was designed in consultation with the Advisory Group on Medical Education, Training and Staffing (AGMETS), the Medical Research Council, the Wellcome Trust, the Medical Schools Council and the Dental Schools Council, with a pilot survey undertaken at three medical schools. Subsequent revisions to the scope of data collection and to the accompanying guidance have been undertaken in consultation with members of Council and with the individuals who complete the data return on behalf of their institution.
All data on clinical academic numbers are presented as full-time equivalent (FTE) unless stated otherwise. Individuals working less than 0.1 FTE – including those on secondment who are recorded by the reporting institution as a 0 FTE – are excluded from analysis (in 2011 this was a total of 11 individuals, equivalent to 0.7 FTE). All data analyses and figures refer to the total staffing levels of Clinical Professors, Clinical Readers/ Clinical Senior Lecturers and Clinical Lecturers, referred to hereafter as Professors, Readers/ Senior Lecturers and Lecturers.
For the purpose of the Medical Schools Council survey, a clinical academic is defined as someone who:
1 has full registration with the General Medical Council; 2 holds a substantive contract of employment with the
university;3 holds an honorary or formal A+B clinical contract with
the NHS.
It is recognised that other clinicians within the academic team make a significant contribution to academic medicine (including Academic Clinical Fellows, Research Training Fellows, and NHS staff, some of whom hold honorary university contracts), however the same level of detail about these staff does not exist.
The contents of this report provide more detail on clinical academic staff than is currently provided by universities to the staff record of the Higher Education Statistics Agency (HESA); however plans are in place to align the data methodologies over the next one-two years.
Please note that in 2008, LSHTM resubmitted their data for all years 2000–2006, owing to a previous misclassification of the number of clinical academics with a substantive university contract. However, it has since been realised that the data for 2000 were indeed accurate, and that only data from 2003–2006 needed to be resubmitted. This report includes the originally submitted total clinical academic staff for 2000 as the baseline, as published prior to 2008.
Full data are available in the Appendices. Further detail is available on request from the Medical Schools Council.
Clinical Academic Staffing Levels in UK Medical Schools © Medical Schools Council 2012 9
1 OVERVIEW
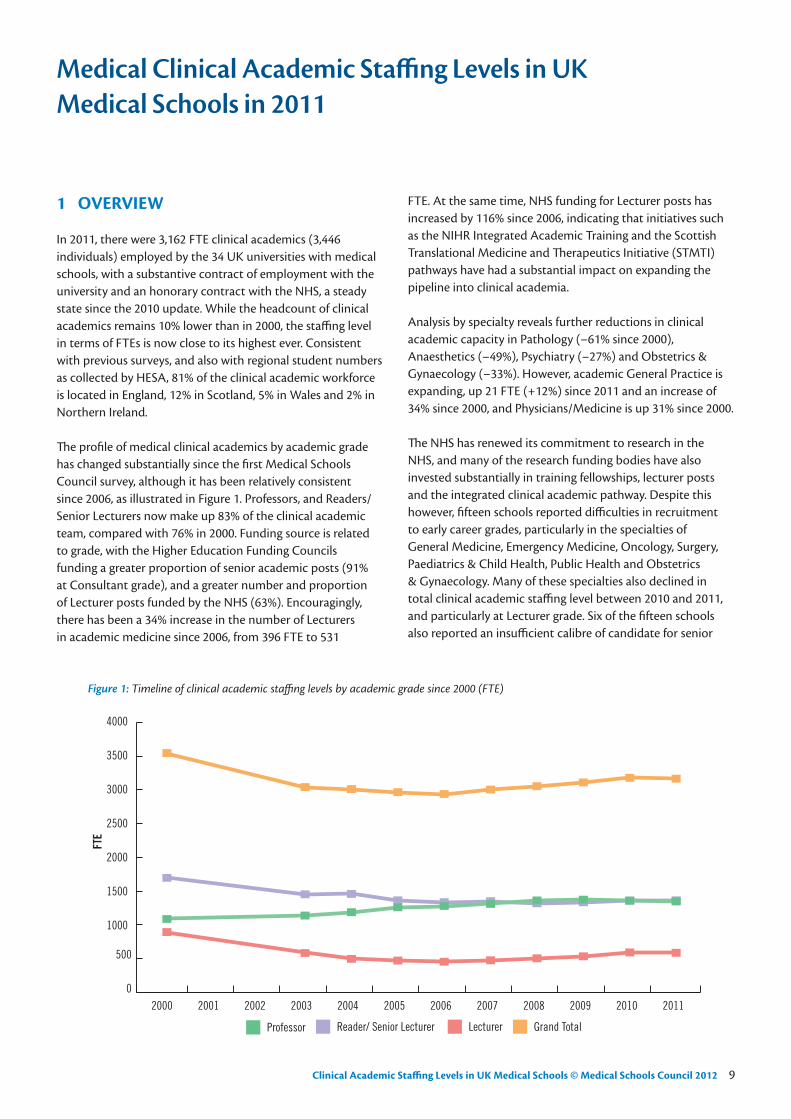
In 2011, there were 3,162 FTE clinical academics (3,446 individuals) employed by the 34 UK universities with medical schools, with a substantive contract of employment with the university and an honorary contract with the NHS, a steady state since the 2010 update. While the headcount of clinical academics remains 10% lower than in 2000, the staffing level in terms of FTEs is now close to its highest ever. Consistent with previous surveys, and also with regional student numbers as collected by HESA, 81% of the clinical academic workforce is located in England, 12% in Scotland, 5% in Wales and 2% in Northern Ireland.
The profile of medical clinical academics by academic grade has changed substantially since the first Medical Schools Council survey, although it has been relatively consistent since 2006, as illustrated in Figure 1. Professors, and Readers/ Senior Lecturers now make up 83% of the clinical academic team, compared with 76% in 2000. Funding source is related to grade, with the Higher Education Funding Councils funding a greater proportion of senior academic posts (91% at Consultant grade), and a greater number and proportion of Lecturer posts funded by the NHS (63%). Encouragingly, there has been a 34% increase in the number of Lecturers in academic medicine since 2006, from 396 FTE to 531
FTE. At the same time, NHS funding for Lecturer posts has increased by 116% since 2006, indicating that initiatives such as the NIHR Integrated Academic Training and the Scottish Translational Medicine and Therapeutics Initiative (STMTI) pathways have had a substantial impact on expanding the pipeline into clinical academia.
Analysis by specialty reveals further reductions in clinical academic capacity in Pathology (–61% since 2000), Anaesthetics (–49%), Psychiatry (–27%) and Obstetrics & Gynaecology (–33%). However, academic General Practice is expanding, up 21 FTE (+12%) since 2011 and an increase of 34% since 2000, and Physicians/Medicine is up 31% since 2000.
The NHS has renewed its commitment to research in the NHS, and many of the research funding bodies have also invested substantially in training fellowships, lecturer posts and the integrated clinical academic pathway. Despite this however, fifteen schools reported difficulties in recruitment to early career grades, particularly in the specialties of General Medicine, Emergency Medicine, Oncology, Surgery, Paediatrics & Child Health, Public Health and Obstetrics & Gynaecology. Many of these specialties also declined in total clinical academic staffing level between 2010 and 2011, and particularly at Lecturer grade. Six of the fifteen schools also reported an insufficient calibre of candidate for senior
Medical Clinical Academic Staffing Levels in UK Medical Schools in 2011
Figure 1: Timeline of clinical academic staffing levels by academic grade since 2000 (FTE)
0
500
1000
1500
2000
2500
3000
3500
4000
FTE
Grand TotalLecturerReader/ Senior LecturerProfessor
2000 20032001 2002 2004 2005 2006 2007 201120102008 2009

10 Clinical Academic Staffing Levels in UK Medical Schools © Medical Schools Council 2012
academic posts, with Chairs in some specialties – notably Neurosurgery and Oncology – remaining open for two years or more. Overall, there were 168 FTE vacancies in 2011, the smallest number on record.
The age profile of clinical academics has been relatively stable over the past two–three years, providing yet further evidence of the positive effect of the investment into early career clinical academics. It will take time to reverse the ageing profile of previous years, but this recent change is encouraging, particularly when from 2004–2009 the proportion of clinical academics aged 45 and over increased by 9%. Women continue to be under-represented at each academic grade, but the rate of increase in the number of women in post is very significant (+43% at Lecturer grade since 2004), demonstrating the progress that schools are making through initiatives such as mentoring, return to work grants and peer support groups. The NIHR announcement linking funding with the achievement of Silver Athena SWAN status is a welcome catalyst for yet further change, and will enable recognition of the work already in place in many schools. The data analysis also indicates a cohort effect, with a more ethnically and gender diverse workforce in younger age groups and at Lecturer grade.
Comparison with ACCEA data reveals that more clinical academics (40%) than their NHS counterparts (14%) hold a national Clinical Excellence Award (CEA) in recognition of exceptional contributions to the NHS. For both NHS consultants and clinical academics, fewer women than men hold a CEA (or equivalent), although this is partly confounded by age and academic grade.
Since 2000, there has been a substantial increase in the number of NHS consultants (from 28,300 FTE to 44,000 FTE). This has not been replicated in academic medicine, with numbers remaining steady at around 3000 FTE.
2 ACADEMIC GRADE
There were 3162 FTE clinical academics, equivalent to 3446 individuals, employed by the 34 medical schools as at 31 July 2011. There have been small changes in staffing level at each grade of Professor, Senior Lecturer and Lecturer (+/– 1%), with
the overall effect of a flatline in staffing numbers between 2010 and 2011; a decline of 0.4% FTE since 2010, but an increase of 0.9% in terms of headcount. Between 2000 and 2003, the clinical academic population declined from 3518 FTE to 3035 FTE, followed by four years of continued but more gradual decline to 2930 FTE in 2006. While the 2011 staffing level is 10% lower than in 2000, the total clinical academic staffing level in UK medical schools is around 8% higher than its low of 2930 FTE in 2006.
Figures 1 and 2 illustrate that the profile of the clinical academic team has changed substantially since the first Medical Schools Council survey in 2000. Between 2010 and 2011, as in 2009–10, there was a small but gradual decline in the number of Professors in post from a peak of 1333 FTE in 2009, in the context of a consistent 55–60 FTE vacancies (refer to Figure 1). The number of Senior Lecturers continued to increase for the third consecutive year, up from 1279 FTE (+4%) in 2008. Between 2006 and 2010 there was a substantial and encouraging 36% increase in the number of Lecturers, from 396 FTE to 537 FTE. Although the number is stable, rather than increasing, between 2010 and 2011, this provides evidence that sustained investment into early career grades is enabling more academics to enter the clinical academic pathway. It is as yet unclear whether the number of individuals currently in Lecturer and research fellowship posts is sufficient to replace the leadership and research expertise being lost through retirement.
The nine medical schools opened since 2001/022 employ just 7% of the clinical academic staffing population across the UK. As the newer schools develop specialist and teaching staff capacity, and establish their research portfolios, expansions are anticipated, and are indeed evident, with a year on year increase even when other schools are reporting decreases in number.
Full data on the profile of clinical academic staffing levels by academic grade are available as Appendices 1, 2, 3 and 4.
2 Brighton and Sussex, Durham, Hull York, Keele, Lancaster, Peninsula, Swansea, University of East Anglia and Warwick.
Figure 2: Clinical academic staffing levels by academic grade since 2000 (FTE)
2000 2010 2011 Change since 2000 Change since 2010
Professor 1035.88 29.4% 1318.27 41.5% 1306.54 41.3% 270.66 26.1% –11.73 –0.9%
Reader/ Senior Lecturer
1652.97 47.0% 1320.38 41.6% 1324.74 41.9% –328.23 –19.9% 4.36 0.3%
Lecturer 829.24 23.6% 536.84 16.9% 530.93 16.8% –298.31 –36.0% –5.91 –1.1%
Grand Total 3518.09 3175.48 3162.21 –355.88 –10.1% –13.27 –0.4%

Clinical Academic Staffing Levels in UK Medical Schools © Medical Schools Council 2012 11
3 FUNDING
Medical clinical academic posts in England, Northern Ireland, Scotland and Wales are funded in combination by the Higher Education Funding Councils (44%) and the NHS (43%), with a smaller but significant proportion of posts funded by other sources including research councils, charities and endowments (12%). The proportion of funding from other sources is fairly consistent across the academic grades, however a greater proportion of Professorial posts is funded by the Funding Councils (57%), and a greater proportion of Lecturer posts funded by the NHS (63%), as illustrated in Figure 3.
In 2005, the Department of Health in England created integrated clinical academic training pathways funded through the NIHR, and equivalent schemes were established in Scotland through SCREDS and in Northern Ireland through NIMDTA, as well as the Wales Clinical Academic Track (WCAT), Scottish Translational Medicine and Therapeutics Initiative (STMTI) and the Northern Ireland Academic Career Fellowships. The fifth round of NIHR fixed-term Academic Clinical Fellowships, Academic Clinical Lectureships and Senior Academic Clinical Lectureships has recently completed, and it is extremely clear to see the impressive impact that this investment has had in ensuring a pipeline of clinical academics
in medicine. NHS funding for Clinical Lecturer posts has increased by 116% since 2006, from 154 FTE to 333 FTE in 2011.
Again, by comparing funding source over time by academic grade as in Figure 4, it is apparent that the primary and increasing source of funding for Professorial posts has been the Higher Education Funding Councils, with an increase of 135 FTE (+ 22%) since 2000. In the last four years the number of Senior Lecturer and Lecturer posts funded by other sources – including health charities, research councils and university endowments – has declined by 23%, from 327 FTE in 2008 to 253 FTE in 2011. In most years however, the funding contribution by other sources for Professorial posts has been stable and close to 135 FTE. Since 2000, there has been a reduction of 40% of FTE posts funded by other sources, across all three academic grades, with much of the reduction initially between 2000 and 2003, and latterly between 2010 and 2011 at Lecturer grade.
A number of funders, including the NHS Education Scotland, the Department of Health through NIHR, the MRC and the Wellcome Trust, have invested substantially in schemes to build academic capacity at early career grades, as in the early stages of the integrated clinical academic pathway. Although
Figure 3: Clinical academic grade by source of funding (FTE)
Figure 4: Timeline of clinical academic staffing levels by source of funding (FTE)
0
20%
40%
60%
80%
100%
Funding CouncilNHS
LecturerReader/ Senior LecturerProfessor
Other
0
400
200
600
800
1000
1200
1400
1600
1800
2000 20032001 2002 2004 2005 2006 2007 201120102008 2009
Funding CouncilNHSOther

12 Clinical Academic Staffing Levels in UK Medical Schools © Medical Schools Council 2012
the numbers of researchers are not monitored through the MSC staff survey, the effect of the cohort of clinicians progressing from fellowships to Lecturer and Senior Lecturer posts is evident in the MSC survey.
On average, clinical academics spend half of their time on clinical duties. In return NHS staff provide a substantial contribution to medical undergraduate and postgraduate teaching. In most parts of the country, these arrangements require the combined efforts of the medical school, local trusts (acute and community-based), and the SHA to be successful. The arrangements are complicated by the variation in the numbers of staff funded by the local NHS and employed by the university. Individual institutional arrangements explain in part the differing levels of NHS support received for clinical academic posts, as well as research focus and the range of undergraduate and postgraduate taught and research programmes delivered.
Figure 5 illustrates the diversity of funding profiles of medical clinical academic posts in UK medical schools. In some institutions, for example in the Universities of East Anglia (88%) and St Andrews (85%), posts employed by the university are funded in majority by the Funding Councils, whereas in other institutions, funding from other sources provides for a greater proportion of posts, for example at Barts, QMUL (22%) and LSHTM (28%). Overall, the NHS funds an average of 44% of clinical academic posts. In six schools, the clinical academic team is funded by more than 60% by the NHS – Cambridge, Hull York Medical School, Leicester, KCL, Keele, Warwick – and 100% of posts at Swansea. The
funding contribution of the NHS towards staffing at LSHTM is especially low at 5%, with Oxford at 22%.
Full data on clinical academic staffing levels by source of funding are available as Appendices 1, 2, 3 and 5.
4 REGION
Twenty three of the UK’s 34 medical schools are located in England, and five of these are in London. It is to be expected that the clinical academic workforce is regionally clustered, with the numbers broadly consistent with HESA student number surveys. Consistent with previous surveys, the 2011 data highlight that 81% of the clinical academic workforce is located in England, 12% in Scotland, 5% in Wales and 2% in Northern Ireland.
Between 2010 and 2011, the staffing level in most regions remained relatively stable, with the exceptions of South Central (–15%) and the North West (–11%). However arrangements at individual schools can distort the overall picture, sometimes with only one or two schools in each region. The University of Manchester (Faculty of Medical and Human Sciences), in the North West SHA, had a combination of planned leavers and natural turnover in recent years in the lead up to a major strategic recruitment initiative which began late 2011. Many of its 17 vacancies were in the process of appointment on the census date. Please note that the University of Oxford (Medical Science Division) has moved to a new source of data, which has created an effect of seemingly
Figure 5: Funding profile of clinical academic posts by medical school (FTE)
Figure 6: Clinical academic staffing levels by region since 2010 (FTE)
East MidsEast of
EngLondon
North East
North West
South Central
South East
South West
West Mids
Yorks & Humber N Ireland Scotland Wales
Grand Total
2010 217.05 153.70 1017.24 116.08 284.31 224.70 32.50 113.95 192.15 218.06 64.00 382.05 159.70 3175.48
2011 217.18 158.70 1059.90 113.47 252.18 190.19 32.40 114.22 200.35 212.91 59.60 386.90 164.20 3163.21
Change since 2010
0.1% 3.3% 4.2% –2.2% –11.3% –15.4% –0.3% 0.2% 4.3% –2.4% –6.9% 1.3% 2.8% –0.4%
Aber
deen
Barts
, QM
UL
Birm
ingh
am
Bris
tol
BSM
S
Cam
brid
ge
Card
iff
Dund
ee
Durh
am
Edin
burg
h
Glas
gow
Hull
York
Impe
rial
Keel
e
KCL
Lanc
aste
r
Leed
s
Leic
este
r
Live
rpoo
l
LSHT
M
Man
ches
ter
Newc
astle
Norw
ich,
UEA
Notti
ngha
m
Oxfo
rd
Peni
nsul
a
Quee
n's,
Bel
fast
Shef
field
Sout
ham
pton
StAn
drew
s
StGe
orge
's
Swan
sea
UCL
War
wick
Funding CouncilNHSOther
0
20%
40%
60%
80%
100%
Clinical Academic Staffing Levels in UK Medical Schools © Medical Schools Council 2012 13
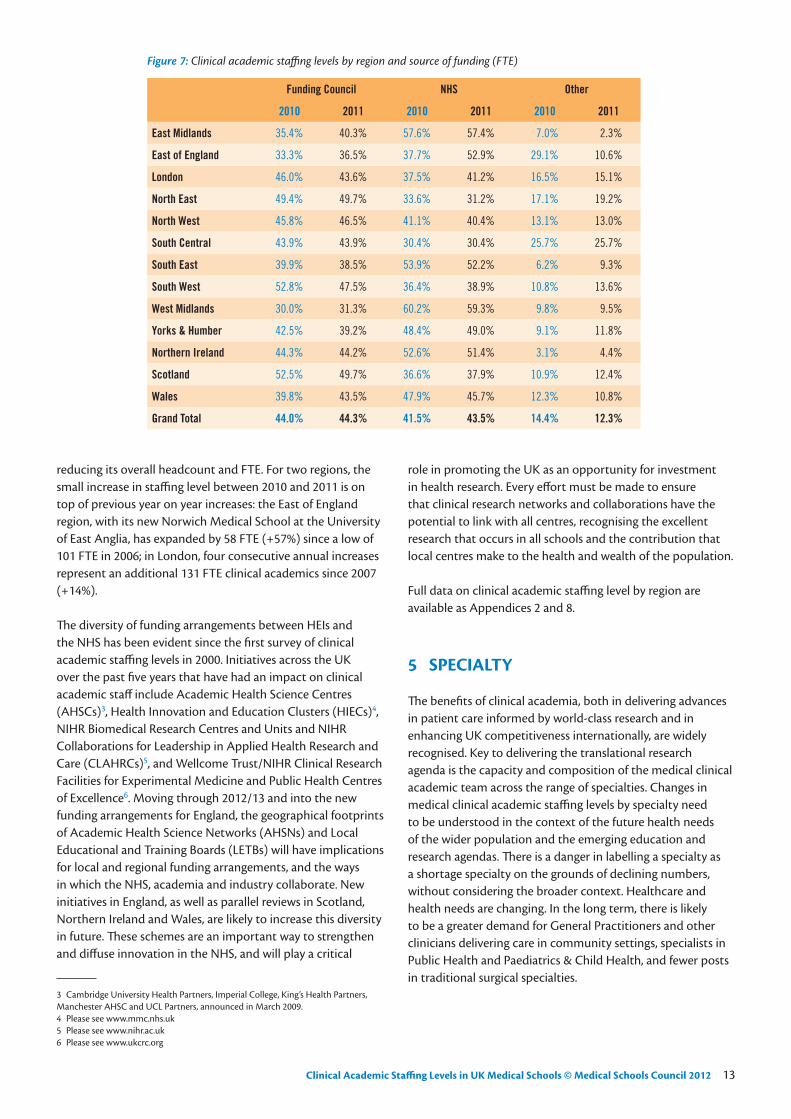
reducing its overall headcount and FTE. For two regions, the small increase in staffing level between 2010 and 2011 is on top of previous year on year increases: the East of England region, with its new Norwich Medical School at the University of East Anglia, has expanded by 58 FTE (+57%) since a low of 101 FTE in 2006; in London, four consecutive annual increases represent an additional 131 FTE clinical academics since 2007 (+14%).
The diversity of funding arrangements between HEIs and the NHS has been evident since the first survey of clinical academic staffing levels in 2000. Initiatives across the UK over the past five years that have had an impact on clinical academic staff include Academic Health Science Centres (AHSCs)3, Health Innovation and Education Clusters (HIECs)4, NIHR Biomedical Research Centres and Units and NIHR Collaborations for Leadership in Applied Health Research and Care (CLAHRCs)5, and Wellcome Trust/NIHR Clinical Research Facilities for Experimental Medicine and Public Health Centres of Excellence6. Moving through 2012/13 and into the new funding arrangements for England, the geographical footprints of Academic Health Science Networks (AHSNs) and Local Educational and Training Boards (LETBs) will have implications for local and regional funding arrangements, and the ways in which the NHS, academia and industry collaborate. New initiatives in England, as well as parallel reviews in Scotland, Northern Ireland and Wales, are likely to increase this diversity in future. These schemes are an important way to strengthen and diffuse innovation in the NHS, and will play a critical
3 Cambridge University Health Partners, Imperial College, King’s Health Partners, Manchester AHSC and UCL Partners, announced in March 2009.4 Please see www.mmc.nhs.uk5 Please see www.nihr.ac.uk6 Please see www.ukcrc.org
role in promoting the UK as an opportunity for investment in health research. Every effort must be made to ensure that clinical research networks and collaborations have the potential to link with all centres, recognising the excellent research that occurs in all schools and the contribution that local centres make to the health and wealth of the population.
Full data on clinical academic staffing level by region are available as Appendices 2 and 8.
5 SPECIALTY
The benefits of clinical academia, both in delivering advances in patient care informed by world-class research and in enhancing UK competitiveness internationally, are widely recognised. Key to delivering the translational research agenda is the capacity and composition of the medical clinical academic team across the range of specialties. Changes in medical clinical academic staffing levels by specialty need to be understood in the context of the future health needs of the wider population and the emerging education and research agendas. There is a danger in labelling a specialty as a shortage specialty on the grounds of declining numbers, without considering the broader context. Healthcare and health needs are changing. In the long term, there is likely to be a greater demand for General Practitioners and other clinicians delivering care in community settings, specialists in Public Health and Paediatrics & Child Health, and fewer posts in traditional surgical specialties.
Figure 7: Clinical academic staffing levels by region and source of funding (FTE)
Funding Council NHS Other
2010 2011 2010 2011 2010 2011
East Midlands 35.4% 40.3% 57.6% 57.4% 7.0% 2.3%
East of England 33.3% 36.5% 37.7% 52.9% 29.1% 10.6%
London 46.0% 43.6% 37.5% 41.2% 16.5% 15.1%
North East 49.4% 49.7% 33.6% 31.2% 17.1% 19.2%
North West 45.8% 46.5% 41.1% 40.4% 13.1% 13.0%
South Central 43.9% 43.9% 30.4% 30.4% 25.7% 25.7%
South East 39.9% 38.5% 53.9% 52.2% 6.2% 9.3%
South West 52.8% 47.5% 36.4% 38.9% 10.8% 13.6%
West Midlands 30.0% 31.3% 60.2% 59.3% 9.8% 9.5%
Yorks & Humber 42.5% 39.2% 48.4% 49.0% 9.1% 11.8%
Northern Ireland 44.3% 44.2% 52.6% 51.4% 3.1% 4.4%
Scotland 52.5% 49.7% 36.6% 37.9% 10.9% 12.4%
Wales 39.8% 43.5% 47.9% 45.7% 12.3% 10.8%
Grand Total 44.0% 44.3% 41.5% 43.5% 14.4% 12.3%

14 Clinical Academic Staffing Levels in UK Medical Schools © Medical Schools Council 2012
Figure 8: Clinical academic staffing levels by specialty since 2000 (FTE)
2000 2010 2011Change
since 2000Change
since 2010
Anaesthetics 100.31 56.42 51.16 –49.0% –9.3%
Emergency Medicine * 9.50 9.00 * –5.3%
General Practice 152.85 183.52 204.94 34.1% 11.7%
Infection/ Microbiology * 83.30 94.82 * 13.8%
Medical Education * 16.75 23.56 * 40.7%
Obstetrics & Gynaecology 176.34 133.05 118.85 –32.6% –10.7%
Occupational Medicine 14.74 11.40 8.60 –41.7% –24.6%
Oncology * 143.10 150.00 * 4.8%
Ophthalmology 40.19 38.20 43.20 7.5% 13.1%
Paediatrics & Child Health 246.14 221.07 201.81 –18.0% –8.7%
Pathology 371.53 150.18 143.26 –61.4% –4.6%
Physicians/ Medicine 972.56 1281.87 1271.72 30.8% –0.8%
Psychiatry 392.85 287.50 287.64 –26.8% 0.1%
Public Health 214.80 162.75 172.56 –19.7% 6.0%
Radiology 60.15 47.48 50.60 –15.9% 6.6%
Surgery 331.89 279.47 275.41 –17.0% –1.5%
Other 474.74 69.92 56.06 –88.2% –19.8%
Grand Total 3549.09 3175.48 3162.21 –10.9% –0.4%
Figure 9: Clinical academic staffing levels by specialty since 2000 – Lecturers (FTE)
2000 2010 2011
2011 as a % of total
staffing level
Change since 2000
Change since 2010
Anaesthetics 23.00 7.00 8.00 15.6% –65.2% 14.3%
Emergency Medicine * 2.00 1.00 11.1% * –50.0%
General Practice 40.15 31.73 35.94 17.5% –10.5% 13.3%
Infection/ Microbiology * 16.52 16.27 17.2% * –1.5%
Medical Education * 2.30 5.60 23.8% * 143.5%
Obstetrics & Gynaecology 38.60 32.17 33.30 28.0% –13.7% 3.5%
Occupational Medicine 3.20 0.00 0.40 4.7% –87.5% *
Oncology * 16.60 19.60 13.1% * 18.1%
Ophthalmology 15.00 9.00 8.00 18.5% –46.7% –11.1%
Paediatrics & Child Health 65.60 31.76 28.05 13.9% –57.2% –11.7%
Pathology 64.00 12.00 8.00 5.6% –87.5% –33.3%
Physicians/ Medicine 187.95 225.53 219.95 17.3% 17.0% –2.5%
Psychiatry 114.10 41.60 54.16 18.8% –52.5% 30.2%
Public Health 62.22 13.20 15.80 9.2% –74.6% 19.7%
Radiology 7.50 7.40 8.00 15.8% 6.7% 8.1%
Surgery 97.63 62.91 56.91 20.7% –41.7% –9.5%
Other 125.29 25.12 12.96 23.1% –89.7% –48.4%
Grand Total 844.24 536.84 530.93 16.8% –37.1% –1.1%

Clinical Academic Staffing Levels in UK Medical Schools © Medical Schools Council 2012 15
The comparison of staffing level by specialty between 2010 and 2011 in Figure 8 reveals that total FTE numbers increased in eight of the fifteen specialties, with notable decreases in Obstetrics & Gynaecology (–14 FTE, –11%), Occupational Health (–3 FTE, –25%) and Paediatrics & Child Health (–19 FTE, –9%). However while vacancies in Obstetrics & Gynaecology and Paediatrics & Child Health account for some of the change in these specialties, there are no reported vacancies in Occupational Health (refer to Figure 10). At the same time, the number of academic General Practitioners has increased substantially, up 21 FTE (12%) since 2011, and similarly in Infection/Microbiology (+12 FTE, +14%).
Between 2000 and 2003, there was a loss of 14% FTE clinical academics, affecting staffing levels across the range of specialties. Reductions in numbers between 2010 and 2011 compound the already significant loss of academic specialists since 2000 in Pathology (–61%), Anaesthetics (–49%), Psychiatry (–27%) and Obstetrics & Gynaecology (–33%). Only two specialties have increased in academic capacity since 2000 – General Practice (153 to 205, +34%) and Physicians/Medicine (973 to 1282, +32%). Expansion of the number of histopathology training schools in the UK and additional funding and support from the Pathological Society made a significant contribution to increasing the number of clinical academics in post, peaking at 192 FTE in 2005. These staffing levels have not been maintained, with a further decline between 2010 and 2011 to the current level of 143 FTE.
Figure 9 illustrates the profile of the number of Lecturers by specialty, with a total of 17% of the clinical academic workforce returned at Lecturer grade, compared with 24% in 2000. Over the past 12 months, expansions in the number of Lecturers in General Practice (3 FTE, +13%), Medical Education (3 FTE, +143%), Oncology (3 FTE, +18%), Psychiatry (12 FTE, +30%) and Public Health (2.5 FTE, +20%) are notable and encouraging. This contrasts with the continued reduction in the number of Lecturers in Paediatrics & Child Health (–3FTE, –11%), Pathology (–4 FTE, –33%) and Surgery (–6 FTE, –10%). The data indicate six specialties with fewer than 10 FTE Clinical Lecturers, making these disciplines particularly vulnerable to change.
Full data on clinical academic staffing levels by specialty are available as Appendices 1 and 6.
6 VACANCIES
This survey reports the number of vacant clinical academic posts that universities were intending to retain on 31 July 2011, even if not actively recruiting to the post. There are different institutional policies about the recording of established posts and vacancies. Some schools do not hold vacancy data at all. In some institutions a post is not considered vacant until it is advertised; in others, vacancies are considered against funding and strategic objectives at institutional level. Decisions relating to recruitment and staff turnover affect not just the critical mass within the medical school, but also that of its associated NHS Trust(s). The principles of the Follett Review7 are that job reviews and appraisals are conducted jointly by the NHS and the university, and there are examples where the decision is taken to convert an NHS consultant post to an academic post, or vice versa, to deliver the required balance of academic and clinical duties.
Vacancies were reported by 25 of 34 medical schools, and of these, 21 medical schools reported 194 FTE vacancies at Professor, Senior Lecturer and Lecturer grade, 2 FTE fewer than in 2010. The number of vacant posts comprises 6% of the total available posts, although this is likely to be an underestimate due to different policies around recording vacancies. Analysis in this section is based on these 194 FTE vacancies although it should be noted that, as in previous years, there were also 42 FTE researcher vacancies and 8 FTE ungraded academic vacancies.
168 FTE vacancies were reported by medical schools established before 2002 (5% of total established clinical academic posts), and 25 FTE from newer medical schools (10% of total established clinical academic posts).
When considering the rate of vacancies, shown in Figure 10, it is evident that the number of vacancies in Anaesthetics (9%), Emergency Medicine (18%), Medical Education (9%), Oncology (9%), Radiology (11%) and Surgery (9%) is above average, with no vacancies reported in Occupational Medicine. Taken in the context of the number in post (Figures 8 and 9), for some specialties this could reflect turnover (eg Anaesthetics and Emergency Medicine) and for other specialties where the number is already higher, this could be indicative of expansions in the specialty (eg Oncology, Radiology). Around 4% of clinical academic posts are vacant at Consultant grade (Professor or Reader/Senior Lecturer) and 13% at Lecturer grade, broadly consistent with proportions in previous years e.g. in 2008, 6% vacancies at Consultant grade and 16% at Lecturer grade) (see Figure 11).
7 Follett, B (2001) A report to the Secretary of State for Education and Skills, by Professor Sir Brian Follett and Michael Paulson-Ellis

16 Clinical Academic Staffing Levels in UK Medical Schools © Medical Schools Council 2012
In responding to the MSC survey, 15 schools also commented on particular challenges in individual specialties, and challenges that they were facing locally. Six of the responding 15 schools reported difficulties in appointing to senior academic posts in Surgery, particularly Neurosurgery, and four schools reported difficulties in Oncology. Coupled with this, some 22 sub-specialties were reported with difficulties in recruitment at early career grades with a lack of academic trainees coming through in General Medicine, Emergency Medicine, Oncology, Surgery, Paediatrics & Child Health,
Public Health and Obstetrics & Gynaecology. Many of these challenges were also highlighted in the 2010 and 2009 data returns, and some schools reported that vacancies have been open for more than two years. Some schools report a lack of suitable candidates with an academic track record (x5), a withdrawal of NHS funding (x5), greater scrutiny of clinical activity (to the detriment of academic work) (x2), a reluctance to take time out of programme to do a PhD or MD when following run-through clinical training, and geography.
Figure 10: Vacant posts by specialty (FTE)
Total staffing level Vacant posts
Total available posts
Vacant posts as % of total
available posts
Anaesthetics 51.16 5.00 56.16 8.9%
Emergency Medicine 9.00 2.00 11.00 18.2%
General Practice 204.94 8.30 213.24 3.9%
Infection/ Microbiology 94.82 3.00 97.82 3.1%
Medical Education 23.56 2.40 25.96 9.2%
Obstetrics & Gynaecology 118.85 7.00 125.85 5.6%
Occupational Medicine 8.60 0.00 8.60 0.0%
Oncology 150.00 14.00 164.00 8.5%
Ophthalmology 43.20 2.00 45.20 4.4%
Paediatrics & Child Health 201.81 7.00 208.81 3.4%
Pathology 143.26 9.00 208.91 4.3%
Physicians/ Medicine 1271.72 65.65 1280.72 5.1%
Psychiatry 287.64 8.20 295.84 2.8%
Public Health 172.56 10.50 183.06 5.7%
Radiology 50.60 6.00 56.60 10.6%
Surgery 275.41 27.00 302.41 8.9%
Other 56.06 16.50 72.56 22.7%
Grand Total 3163.21 193.55 3356.76 5.8%
Figure 11: Vacant posts by academic grade (FTE)
Total staffing level Vacant posts
Total available posts
Vacant posts as % of total
available posts
Professor 1306.54 54.55 1361.09 4.0%
Reader/ Senior Lecturer 1327.24 59.60 1386.84 4.3%
Lecturer 529.43 79.40 608.83 13.0%
Grand Total 3163.21 193.55 3356.76 5.8%

Clinical Academic Staffing Levels in UK Medical Schools © Medical Schools Council 2012 17
7 AGE
Figure 12 illustrates the age profile of clinical academics in UK medical schools and the trends since 2004. When looking more closely at numbers in 2009, 2010 and 2011 – by which time the increase in the number of Lecturers reported in Figure 1 appears to have made its impact – the number and proportion of clinical academics in each age group appears to be more stable, with a relative flatline in terms of the number aged 26–35, 36–45, and 46–55, but with a 70 FTE (+9%) increase in those aged over 56. It will take time to reverse the trends of previous years, but this is extremely encouraging when considered in the context of the change since 2004, since which time the number of clinical academics aged under 35 declined by 5%, the number aged 36–45 declined by 9%, while those aged 46–55 increased 26% and the number aged 56–65 increased by 48%.
Becoming a clinical academic doctor takes longer than straight run-through clinical training, as, in addition to completing a medical degree (typically five years) and postgraduate
specialty training (four–six years), the majority of university appointments, at Lecturer and above, additionally require a doctorate and an established research track record. Managing the dual workload of specialty training while establishing a research track record can be exceptionally challenging, and limited postdoctoral experience can prevent individuals from developing sufficient expertise to be competitive for prestigious externally funded Intermediate Fellowships/Clinician Scientist Fellowships. This in turn reduces the potential pool of candidates for senior clinical academic posts. It is essential that sufficient numbers of graduates pursue a career in clinical academic medicine, and that supportive structures are in place to enable a healthy pool of researchers and clinical teachers to progress. Figure 13 illustrates that the age profile of clinical academics at Consultant level (Senior Lecturer and Professor) is slightly older than the wider NHS consultant population (Figure 13).
Full data on the age profile of clinical academic staffing levels are available as Appendices 9, 10 and 11.
Figure 12: Age profile of clinical academics since 2004 (headcount)
Figure 13: Age profile of clinical academic consultants and NHS consultants (headcount)
Source: Hospital and Community Health Services (HCHS): Medical and dental staff census from the Health and social care information centre (HSCIC); Medical Schools Council.
0
20%
40%
60%
80%
100%
66+56-6546-5536-4525-35
200466+ 12 19 19 24 25 42 56 5256-65 512 573 578 617 640 709 727 77046-55 1065 1208 1236 1258 1265 1341 1351 133736-45 1130 1147 1072 1028 1066 1017 1019 102825-35 275 288 267 291 282 268 261 259
2005 2006 2007 201120102008 2009
0
10%
20%
30%
40%
50%
NHS ConsultantsClinical Academic Consultants25-35 36-45 46-55 56-65 66+

18 Clinical Academic Staffing Levels in UK Medical Schools © Medical Schools Council 2012
8 GENDER
The gender balance in academic medicine reflects trends across the higher education sector. In UK universities, 44% of academics are women,8 with proportionately fewer women at senior academic grades: 48% of Lecturers, 39% of Senior Lecturers and 19% of Professors.9 In medicine, 42% of Lecturers are women, 30% of Senior Lecturers and 15% of Professors. Timeline analysis since 2004, when gender data were first recorded, shows a year on year increase in the number and proportion of female clinical academics in UK medical schools, demonstrating the progress that medical schools have already made to develop and support a more diverse staff profile.
Figure 14 illustrates a 33% increase in the number of female clinical academics since 2004 (226 individuals), up 57 (headcount) and 7% since 2010. In seven years since 2004, there has been a 43% increase in the number of female Lecturers (from 175 to 251). This is coupled with a 19% increase at Senior Lecturer grade (73 individuals), and a 60% increase at Professorial grade (75 individuals). It is important that both men and women continue to be attracted into careers in clinical academic medicine, and it is clear that the historical gender disparity is being redressed.
The number of women entering medical school in 2011 was around 55% of the 8,000 new intake to medical degree programmes. Over the last ten years, there have been slightly more women than men admitted into the first year of the medical degree programme, peaking at 61% in 2003, and consistent at 55% for the last three years. In 1980/110,
8 Higher Education Statistics Agency (2011) Press Release 1569 Higher Education Statistics Agency (2009) Press Release 13110 The mean year of birth of clinical academics in UK medical schools as at 31 July 2011 is 1962; 1980/1 intake is therefore taken as indicative of the year of entry to medical school.
just 1,620 women (40% of total intake) were admitted into medicine, and the gender profile of clinical academics is inevitably a time delay and effect of the student profile.
The profile of clinical academics by age broadly relates to academic grade, consistent with patterns of promotion and retirement. However, Figures 15a and 15b illustrate differences between the profiles of men and women by age and clinical academic grade, with men appearing to be more likely to achieve promotion to senior academic positions at an earlier age. In part, this may be a reflection of time away from full-time work, emphasising the importance of various current new initiatives run by medical schools, including mentoring, peer networking groups, and grants to support staff returning to work after career breaks. The NIHR announcement linking funding with the achievement of Silver Athena SWAN status is a welcome catalyst for yet further change, and will enable recognition of the work already in place in many schools.
Figure 16 indicates the average age of clinicians holding appointments at each academic grade. At Professorial grade, the average age has increased by 3.1 years since 2004, an increase of 1.9 years for Readers/ Senior Lecturers, and an increase of 1.5 years for Lecturers. For both men and women, the average age at each grade has increased since 2004; however, when taken in the context of expanding numbers at senior academic grades (illustrated in Figures 1 and 2), this can be taken to indicate the progress of a cohort achieving promotion through the academic grades.
Full data on the gender profile of clinical academic staffing levels are available as Appendix 9.
Figure 14: Clinical academic staffing levels by academic grade since 2004 – women (headcount)
0
100
200
300
400
500
600
800
900
700
1000
Grand TotalLecturerReader/ Senior LecturerProfessor
2004 2005 2006 2007 201120102008 2009

Clinical Academic Staffing Levels in UK Medical Schools © Medical Schools Council 2012 19
Figure 15a: Clinical academic staffing level by age and academic grade – men (headcount)
0
20%
40%
60%
80%
100%
36-45 46-55 56-65 66+26-35LecturerReader/ Senior LecturerProfessor
Figure 15b: Clinical academic staffing level by age and academic grade – women (headcount)
0
20%
40%
60%
80%
100%
36-45 46-55 56-65 66+26-35
LecturerReader/ Senior LecturerProfessor
Figure 16: Mean age of clinical academics by academic grade and gender (headcount)
Men Women Total
2004 2011 2004 2011 2004 2011
Professor 51.6 54.7 49.9 53.4 51.4 54.5
Reader/ Senior Lecturer 46.0 47.9 44.7 46.7 45.7 47.6
Lecturer 36.0 37.2 36.0 37.8 36.0 37.5

20 Clinical Academic Staffing Levels in UK Medical Schools © Medical Schools Council 2012
9 ETHNICITY
The 2011 data update indicates that 79% of clinical academics in UK medical schools are of white ethnic origin, 10% are of Asian/British Asian origin, and 11% from other ethnic origins. However, the data indicate a cohort effect with a greater ethnic mix amongst clinical academics at Lecturer grade (64% white, 37% non white), compared with consultant grade clinical academics (82% white, 18% non-white).
Full data on clinical academic staffing levels by ethnicity are available as Appendices 11 and 12.
10 CLINICAL EXCELLENCE, MERIT AND DISTINCTION AWARDS11
Clinical Excellence Awards (England and Wales; Northern Ireland)12, Merit Awards (England and Wales, old system)13 and Distinction Awards (Scotland)14 are financial awards made to recognise and reward exceptional and sustained contributions to the values and goals of the NHS by consultants (substantive and honorary contract holders) and academic General Practitioners, as measured against stringent criteria. Local awards are assessed by the employing Trust. National awards are overseen by a national panel, and all awards are funded at levels recommended by the Doctors and Dentists Remuneration Body (DDRB). CEAs (and equivalent awards) recognise and reward exceptional research and contributions to patient care above and beyond contractual expectations. Currently, national awards are subject to satisfactory review every five years.
Overall 39% of male and 18% of female clinical academics hold a national CEA, Distinction or Merit Award, but the gender balance is more equal for local awards (23% and 19%). The gender gap is illustrated in Figure 18, however, it is important to control for the age and gender profile of the clinical academic population. Figure 19 compares the number and proportion of those in receipt of a local or national award by gender and by grade, and shows, for example that 75% of women compared with 83% of men at Professor grade hold an award. The ACCEA annual report of the 2011 awards round15 revealed that while a lower proportion of women applied for a national award, success rates for women and men were similar.
11 And equivalent Award by the Devolved Administrations12 Levels 1–9 are awarded locally; Levels 9 (Bronze); 10 (Silver); 11 (Gold) and 12 (Platinum) are awarded nationally by ACCEA.Discretionary points 1–8 and B, A, A+ Clinical Excellence Awards are awarded by the NICEAC.13 B, A and A+ Merit Awards are made nationally. New awards are not made but existing awards can be re-awarded by ACCEA.14 Discretionary Points and B, A and A+ Distinction Awards are made by SACDA, but new awards are currently on hold.15 ACCEA (2012) Annual Report (covering 2011 awards round), published January 2012
Figure 17a: Ethnic origin of clinical academics (headcount)
Figure 17b: Ethnic origin of Professors (headcount)
Figure 17c: Ethnic origin of Readers/ Senior Lecturers (headcount)
Figure 17d: Ethnic origin of Lecturers (headcount)
Ethnicity TotalAsian/ British Asian 331Black/ Black British 27Chinese 63Mixed 51White 2726Other 60Unknown 188Grand Total 3447
Ethnicity TotalAsian/ British Asian 87Black/ Black British 3Chinese 18Mixed 20White 1169Other 20Unknown 52Grand Total 1369
Ethnicity TotalAsian/ British Asian 141Black/ Black British 13Chinese 25Mixed 21White 1175Other 29Unknown 79Grand Total 1483
Ethnicity TotalAsian/ British Asian 103Black/ Black British 11Chinese 20Mixed 10White 382Other 11Unknown 57Grand Total 594

Clinical Academic Staffing Levels in UK Medical Schools © Medical Schools Council 2012 21
The comparison with 2010 indicates that although the proportion of men and women in 2011 with an award is marginally higher, the number of all clinical academics in receipt of either a local or national award is lower. The number of new national awards made by ACCEA was reduced to around 300 in 2010, around half of the previous levels, and new awards have been frozen in Scotland and Northern Ireland since 2010 and 2011 respectively. The DDRB was asked to review CEAs in England and Wales in 2011, and the outcome is pending.
Figure 20 compares the number of clinical academics with the consultant workforce in receipt of a Clinical Excellence Award (England and Wales)161718, indicating that although the numbers holding a local awards are broadly consistent, significantly more clinical academics are in receipt of a national award (40%) than their NHS counterparts (14%).
16 Comparative data for Northern Ireland and Scotland were not available17 ACCEA Annual Report (including 2011 awards round), published January 2012. Table 19: Number and Percentage of Consultants with Clinical Excellence Awards18 The total consultant population in England is 37,752. Taken from the NHS Information Centre Annual Workforce Census, Medical and Dental Staff 2010, Detailed Results Tables, March 25 2011
Figure 18: Clinical academics with a Clinical Excellence Award (or equivalent) by gender (headcount)
Level 9(local & Bronze)
Local award (Levels/ DPs 1-8)
Level 10(Silver)
Level 11(Gold)
Level 12(Platinum)
B A A+
Men Women
0
5%
10%
15%
20%
25%
Figure 19: Clinical academics with a Clinical Excellence Award (or equivalent) by gender and academic grade (headcount)
Professor Reader/ Senior Lecturer Lecturer
Men Women Men Women Men Women
No Award 195 16.8% 51 24.6% 453 43.6% 271 60.4% 330 96.8% 244 97.6%
Local award (Levels/ DPs 1–8)
163 14.0% 39 18.8% 414 39.9% 133 29.6% 8 2.3% 4 1.6%
Level 9 (Local & Bronze) 208 17.9% 37 17.9% 92 8.9% 28 6.2% 1 0.3% 2 0.8%
Level 10 (Silver) 161 13.9% 30 14.5% 34 3.3% 8 1.8%
Level 11 (Gold) 88 7.6% 13 6.3% 6 0.6% 1 0.2%
Level 12 (Platinum) 105 9.0% 7 3.4% 3 0.3% 2 0.4%
B 79 6.8% 14 6.8% 27 2.6% 6 1.3%
A 96 8.3% 10 4.8% 5 0.5%
A+ 67 5.8% 6 2.9% 4 0.4% 2 0.6%
Total (national) 804 69.2% 117 56.5% 171 16.5% 45 10.0% 3 0.9% 2 0.8%
Total (all levels) 967 83.2% 156 75.4% 585 56.4% 178 39.6% 11 3.2% 6 2.4%
Grand Total 1162 207 1038 449 341 250

22 Clinical Academic Staffing Levels in UK Medical Schools © Medical Schools Council 2012
Figure 20: NHS and clinical academic consultants with a Clinical Excellence (or equivalent) award (headcount)
NHS consultants (England)
Clinical academic consultants (England
and Wales)
Clinical academic consultants (Scotland and
Northern Ireland)
No Award 14738 39.0% 772 33.2% 198 37.5%
Local award (Levels/ DPs 1–8) 17624 46.7% 636 27.3% 113 21.4%
Level 9 (Local & Bronze) 3352 8.9% 333 14.3% 32 6.1%
Level 10 (Silver) 815 2.2% 215 9.2% 18 3.4%
Level 11 (Gold) 281 0.7% 103 4.4% 5 0.9%
Level 12 (Platinum) 177 0.5% 108 4.6% 9 1.7%
B 459 1.2% 56 2.4% 70 13.3%
A 222 0.6% 58 2.5% 53 10.0%
A+ 84 0.2% 47 2.0% 30 5.7%
Total with a national award 5390 14.3% 920 39.5% 217 41.1%
Total with a local or national award 23014 61.0% 1556 66.8% 330 62.5%
Grand Total 37752 2328 528
11 CONCLUDING REMARKS
The 2011 data update of Medical Clinical Academic Staffing Levels in UK Medical Schools is encouraging, with increases in staffing level at every academic grade and especially among Lecturers. Whilst the total clinical academic staffing level remains 10% lower than in 2000, the current level of 3,162 FTE reflects an increase of 8% since 2006, with a notable 34% increase in the number of Lecturers in post to a total of 531 FTE. It is expected that many Academic Clinical Fellows and other individuals in intermediary positions, who are not recorded by this survey, will later achieve career progression into substantive university posts. It is too early to see the full impact of investments in structured academic trainee pathways, including those funded by NIHR, SCREDS and WCAT, on the staffing level of clinical academics in medical schools, but initial indications – evidenced by the evolving age profile, and substantiated additional NHS funding into Lecturer grade posts – are extremely positive.
The health of the UK population depends upon the contribution of clinical academics to teaching, research, innovation and clinical practice, and it is vital that students are attracted into academic careers across the range of specialties. Clinical academics are at the forefront of medical discoveries, and play an important role in informing national and international medical and healthcare policy. Despite wide recognition of the importance of clinical academic medicine, there are still concerns about research capacity in some specialties. Figure 21 illustrates that clinical academic staff numbers (at aroung 3000) have failed to keep pace with the substantial increase in the number of NHS consultants, that has risen from 28,300 FTE to 44,000 FTE since 2000.
Medical schools need to be resilient in the face of challenging financial times whilst achieving excellence in teaching, research and clinical service, but some schools have reported difficulties with recruitment owing to the inability to secure NHS funding. Perhaps more concerning are reports of challenges in appointing to the structured Integrated Academic Training Pathways, despite extensive investment from the NHS and research funders to protect structured training fellowships. Medical schools themselves play a key role in embedding research principles into the undergraduate curriculum from the outset, and exposing students to leading clinical academics. But, for example, recent changes in the higher education sector and the pressures of higher student fees risk jeopardising the pipeline of students who choose to undertake an intercalated degree. The Medical Schools Council is committed to enhancing its provision of careers advice to current and prospective students, and is developing public resources to be made available via its website, www.medschools.ac.uk.
Academic medicine requires a structured and adequately supported clinical environment and well trained clinicians. Clearly defined structures and processes are needed to enable trainees to integrate postdoctoral academic training with clinical training. Managing the dual workload of specialty training whilst establishing a research track record can be challenging. Obtaining and maintaining postdoctoral research experience should not act as a deterrent to those keen to pursue an academic career, and clinical training programmes need to be flexible to accommodate such academic development. Limited postdoctoral experience can prevent individuals from gaining the necessary expertise to be competitive for prestigious externally funded Intermediate Fellowships/Clinician Scientist Fellowships. Such Fellowships

Clinical Academic Staffing Levels in UK Medical Schools © Medical Schools Council 2012 23
Figure 21: Timeline of numbers of NHS and clinical academic consultants since 2000 (FTE)19,20,21
19 NHS consultant data for England, Scotland and Wales refer to September 2011; data for Northern Ireland refer to December 2011.20 Clinical academic consultants are Professorial and Senior Lecturer grades21 Sources: Medical Schools Council; HEFCE; UCAS; Department of Health, England; Information Services Division, NHS National Services Scotland; Department of Health, Social Services and Public Security, Northern Ireland; Health and Social Care Department, Wales.
enable the transition from postdoctoral to independent researcher, and, in turn, ensure a pool of talented candidates for more senior clinical academic posts.
As recommended by the 2008 Inquiry into Modernising Medical Careers22, flexible work patterns also need to be developed to enable individuals to move between an academic and a clinical career – and to challenge the academic-clinical binary divide. The review of the Shape of Medical Training23, due to report in autumn 2013, offers an opportunity to consider how best to provide all trainees with a more firmly comprehensive scientific grounding in medical practice and flexibility in training and career development.
Major achievements of the four Higher Education Funding Councils, NIHR, STMTI, WCAT and the main research charities
22 Tooke J (2008) Final Report of the Independent Inquiry into Modernising Medical Careers: Aspiring to Excellence23 http://www.shapeoftraining.co.uk/
include funding support for structured academic training pathways, the promotion of innovative partnerships between the NHS and HEIs, the affirmation of academic endeavour as a vital role for all clinicians and clinical trainees, and improving understanding of the contributions clinical academics make to the NHS. In the context of future funding pressures both in higher education and in the health sector, it is vital that these ambitions continue to be realised and recognised. With a joint and concerted effort across the funding councils, the NHS, academic institutions and third sector funders, the pipeline of the medical clinical academic workforce can be protected for the benefit of patient care through innovative discoveries in health and healthcare, and the education and leadership of future generations of doctors.
0
5000
10000
15000
20000
25000
30000
35000
50000
45000
40000
FTE
2000 20032001 2002 2004 2005 2006 2007 201120102008 2009
Clinical Academic ConsultantsNHS Consultants

24 Clinical Academic Staffing Levels in UK Medical Schools © Medical Schools Council 2012
Appendices
Appendix 1: Profile by specialty and source of funding (FTE) (cont)
Funding Council NHS Other Total 2011 Total 2010% Change since 2010
AnaestheticsProfessor 6.27 35.6% 10.83 61.5% 0.50 2.8% 17.60 18.00 –2.2%Reader/ Senior Lecturer 5.45 21.3% 19.11 74.8% 1.00 3.9% 25.56 31.42 –18.7%Lecturer 2.50 31.3% 4.50 56.3% 1.00 12.5% 8.00 7.00 14.3%Total 14.22 27.8% 34.44 67.3% 2.50 4.9% 51.16 56.42 –9.3%
Emergency MedicineProfessor 1.00 33.3% 2.00 66.7% 0.00 0.0% 3.00 5.00 –40.0%Reader/ Senior Lecturer 1.00 20.0% 4.00 80.0% 0.00 0.0% 5.00 2.50 100.0%Lecturer 0.00 0.0% 1.00 100.0% 0.00 0.0% 1.00 2.00 –50.0%Total 2.00 22.2% 7.00 77.8% 0.00 0.0% 9.00 9.50 –5.3%
General PracticeProfessor 52.05 66.0% 19.48 24.7% 7.37 9.3% 78.90 71.56 10.3%Reader/ Senior Lecturer 49.12 54.5% 28.10 31.2% 12.89 14.3% 90.11 80.22 12.3%Lecturer 13.89 38.7% 17.84 49.7% 4.20 11.7% 35.94 31.73 13.3%Total 115.06 56.1% 65.42 31.9% 24.46 11.9% 204.94 183.52 11.7%
Infection/ MicrobiologyProfessor 22.55 51.2% 13.65 31.0% 7.80 17.7% 44.00 35.20 25.0%Reader/ Senior Lecturer 11.04 32.0% 15.16 43.9% 8.35 24.2% 34.55 30.58 13.0%Lecturer 3.74 23.0% 11.53 70.9% 1.00 6.1% 16.27 16.52 –1.5%Total 37.33 39.4% 40.34 42.5% 17.15 18.1% 94.82 82.30 15.2%
Medical EducationProfessor 5.78 77.1% 1.62 21.6% 0.10 1.3% 7.50 6.50 15.4%Reader/ Senior Lecturer 6.61 63.1% 2.47 23.6% 1.38 13.2% 10.46 7.95 31.6%Lecturer 3.41 60.9% 2.19 39.1% 0.00 0.0% 5.60 2.30 143.5%Total 15.80 67.0% 6.28 26.7% 1.48 6.3% 23.56 16.75 40.7%
Obstetrics & GynaecologyProfessor 26.43 66.7% 9.81 24.8% 3.37 8.5% 39.60 50.80 –22.0%Reader/ Senior Lecturer 22.33 48.6% 20.07 43.7% 3.55 7.7% 45.95 50.08 –8.2%Lecturer 6.30 18.9% 25.10 75.4% 1.90 5.7% 33.30 32.17 3.5%Total 55.06 46.3% 54.97 46.3% 8.82 7.4% 118.85 133.05 –10.7%
Occupational MedicineProfessor 2.60 72.2% 1.00 27.8% 0.00 0.0% 3.60 4.20 –14.3%Reader/ Senior Lecturer 2.44 53.1% 0.60 13.0% 1.56 33.9% 4.60 7.20 –36.1%Lecturer 0.40 100.0% 0.00 0.0% 0.00 0.0% 0.40 0.00 100.0%Total 5.44 63.3% 1.60 18.6% 1.56 18.1% 8.60 11.40 –24.6%
OncologyProfessor 20.07 35.2% 27.12 47.5% 9.91 17.4% 57.10 56.30 1.4%Reader/ Senior Lecturer 20.42 27.9% 39.03 53.2% 13.85 18.9% 73.30 70.20 4.4%Lecturer 2.00 10.2% 16.10 82.1% 1.50 7.7% 19.60 16.60 18.1%Total 42.49 28.3% 82.24 54.8% 25.26 16.8% 150.00 143.10 4.8%
OphthalmologyProfessor 7.50 39.5% 8.60 45.3% 2.90 15.3% 19.00 16.00 18.8%Reader/ Senior Lecturer 6.50 40.1% 6.70 41.4% 3.00 18.5% 16.20 13.20 22.7%Lecturer 0.83 10.4% 6.67 83.3% 0.50 6.3% 8.00 9.00 –11.1%Total 14.83 34.3% 21.97 50.8% 6.40 14.8% 43.20 38.20 13.1%
Paediatrics & Child HealthProfessor 41.23 57.9% 24.31 34.2% 5.61 7.9% 71.15 79.61 –10.6%Reader/ Senior Lecturer 42.18 41.1% 44.44 43.3% 15.99 15.6% 102.61 109.71 –6.5%Lecturer 9.20 32.8% 16.85 60.1% 2.00 7.1% 28.05 31.76 –11.7%Total 92.61 45.9% 85.60 42.4% 23.60 11.7% 201.81 221.07 –8.7%
Appendix 1: Profile by specialty and source of funding (FTE)

Clinical Academic Staffing Levels in UK Medical Schools © Medical Schools Council 2012 25
Appendix 1: Profile by specialty and source of funding (FTE) (cont)
Funding Council NHS Other Total 2011 Total 2010% Change since 2010
PathologyProfessor 39.00 58.7% 24.85 37.4% 2.62 3.9% 66.46 69.55 –4.4%Reader/ Senior Lecturer 26.95 39.2% 29.82 43.3% 12.03 17.5% 68.80 68.63 0.2%Lecturer 1.00 12.5% 5.00 62.5% 2.00 25.0% 8.00 12.00 –33.3%Total 66.95 46.7% 59.67 41.6% 16.65 11.6% 143.26 150.18 –4.6%
Physicians/ MedicineProfessor 313.54 58.2% 160.21 29.7% 64.91 12.1% 538.66 557.14 –3.3%Reader/ Senior Lecturer 211.41 41.2% 237.77 46.3% 63.94 12.5% 513.11 499.20 2.8%Lecturer 41.45 18.9% 141.29 64.5% 36.21 16.5% 218.95 225.53 –2.9%Total 566.40 44.6% 539.26 42.4% 165.06 13.0% 1270.72 1281.87 –0.9%
PsychiatryProfessor 68.37 56.6% 45.31 37.5% 7.13 5.9% 120.80 128.70 –6.1%Reader/ Senior Lecturer 35.99 31.9% 62.66 55.6% 14.04 12.5% 112.68 117.19 –3.8%Lecturer 13.10 24.2% 22.36 41.3% 18.70 34.5% 54.16 41.60 30.2%Total 117.46 40.8% 130.32 45.3% 39.86 13.9% 287.64 287.50 0.1%
Public Health MedicineProfessor 67.81 73.8% 15.47 16.8% 8.64 9.4% 91.91 82.45 11.5%Reader/ Senior Lecturer 33.91 52.3% 19.09 29.4% 11.85 18.3% 64.85 67.10 –3.4%Lecturer 2.12 13.4% 11.03 69.8% 2.65 16.8% 15.80 13.20 19.7%Total 103.83 60.2% 45.59 26.4% 23.14 13.4% 172.56 162.75 6.0%
RadiologyProfessor 5.48 27.4% 9.65 48.3% 4.87 24.4% 20.00 19.60 2.0%Reader/ Senior Lecturer 8.19 36.2% 12.71 56.2% 1.70 7.5% 22.60 20.48 10.4%Lecturer 0.00 0.0% 8.00 100.0% 0.00 0.0% 8.00 7.40 8.1%Total 13.67 27.0% 30.36 60.0% 6.57 13.0% 50.60 47.48 6.6%
SurgeryProfessor 56.27 52.5% 45.36 42.3% 5.52 5.2% 107.15 95.25 12.5%Reader/ Senior Lecturer 38.88 34.9% 66.19 59.4% 6.28 5.6% 111.35 121.31 –8.2%Lecturer 14.38 25.3% 39.41 69.2% 3.13 5.5% 56.91 62.91 –9.5%Total 109.53 39.8% 150.96 54.8% 14.93 5.4% 275.41 279.47 –1.5%
OtherProfessor 10.58 52.6% 5.22 26.0% 4.30 21.4% 20.10 21.40 –6.1%Reader/ Senior Lecturer 11.40 49.5% 6.40 27.8% 5.20 22.6% 23.00 23.40 –1.7%Lecturer 5.20 40.1% 6.05 46.7% 1.71 13.2% 12.96 25.12 –48.4%Total 27.18 48.5% 17.67 31.5% 11.21 20.0% 56.06 69.92 –19.8%
Grand TotalProfessor 746.53 57.1% 424.47 32.5% 135.54 10.4% 1306.54 1318.27 –0.9%Reader/ Senior Lecturer 533.80 40.3% 614.32 46.4% 176.61 13.3% 1324.74 1320.38 0.3%Lecturer 119.53 22.5% 334.91 63.1% 76.50 14.4% 530.93 536.84 –1.1%Total 1399.86 44.3% 1373.70 43.4% 388.65 12.3% 3162.21 3175.48 –0.4%
Appendix 2: Profile by region and source of funding (FTE) (cont)
Funding Council NHS Other Total 2011 Total 2010% Change since 2010
East MidlandsProfessor 39.49 45.2% 43.91 50.2% 4.00 4.6% 87.40 86.00 1.6%Reader/ Senior Lecturer 32.46 36.6% 56.32 63.4% 0.00 0.0% 88.78 93.60 –5.1%Lecturer 15.48 37.8% 24.52 59.8% 1.00 2.4% 41.00 37.45 9.5%Total 87.43 40.3% 124.75 57.4% 5.00 2.3% 217.18 217.05 0.1%
East of EnglandProfessor 32.25 52.8% 18.35 30.0% 10.50 17.2% 61.10 61.00 0.2%Reader/ Senior Lecturer 21.70 35.1% 36.90 59.6% 3.30 5.3% 61.90 63.70 –2.8%Lecturer 4.00 11.2% 28.70 80.4% 3.00 8.4% 35.70 29.00 23.1%Total 57.95 36.5% 83.95 52.9% 16.80 10.6% 158.70 153.70 3.3%
LondonProfessor 258.83 57.7% 134.84 30.1% 54.99 12.3% 448.66 448.32 0.1%Reader/ Senior Lecturer 179.53 39.2% 207.68 45.3% 70.79 15.5% 458.01 439.32 4.3%Lecturer 24.21 15.8% 94.43 61.6% 34.59 22.6% 153.22 129.59 18.2%Total 462.57 43.6% 436.96 41.2% 160.37 15.1% 1059.90 1017.24 4.2%
Appendix 2: Profile by region and source of funding (FTE)

26 Clinical Academic Staffing Levels in UK Medical Schools © Medical Schools Council 2012
Appendix 2: Profile by region and source of funding (FTE) (cont)
Funding Council NHS Other Total 2011 Total 2010% Change since 2010
North EastProfessor 36.78 57.4% 15.98 24.9% 11.34 17.7% 64.09 66.23 –3.2%Reader/ Senior Lecturer 18.77 40.9% 18.40 40.1% 8.71 19.0% 45.88 45.65 0.5%Lecturer 0.80 22.9% 1.00 28.6% 1.70 48.6% 3.50 4.20 –16.7%Total 56.35 49.7% 35.38 31.2% 21.74 19.2% 113.47 116.08 –2.2%
North WestProfessor 61.76 54.9% 37.87 33.7% 12.85 11.4% 112.48 120.73 –6.8%Reader/ Senior Lecturer 45.27 46.9% 36.33 37.7% 14.86 15.4% 96.45 106.95 –9.8%Lecturer 10.30 23.8% 27.80 64.3% 5.15 11.9% 43.25 56.63 –23.6%Total 117.33 46.5% 101.99 40.4% 32.86 13.0% 252.18 284.31 –11.3%
South CentralProfessor 45.95 66.8% 12.65 18.4% 10.20 14.8% 68.80 69.70 –1.3%Reader/ Senior Lecturer 52.33 65.3% 16.86 21.1% 10.90 13.6% 80.09 86.40 –100.0%Lecturer 16.90 40.9% 24.40 59.1% 0.00 0.0% 41.30 68.60 –100.0%Total 115.18 60.6% 53.91 28.3% 21.10 11.1% 190.19 224.70 –100.0%
South EastProfessor 5.75 49.6% 5.85 50.4% 0.00 0.0% 11.60 10.00 16.0%Reader/ Senior Lecturer 5.34 31.8% 9.46 56.3% 2.00 11.9% 16.80 18.50 –9.2%Lecturer 1.40 35.0% 1.60 40.0% 1.00 25.0% 4.00 4.00 0.0%Total 12.49 38.5% 16.91 52.2% 3.00 9.3% 32.40 32.50 –0.3%
South WestProfessor 35.14 63.4% 16.71 30.1% 3.60 6.5% 55.45 53.80 3.1%Reader/ Senior Lecturer 17.43 34.4% 23.69 46.8% 9.51 18.8% 50.62 48.45 4.5%Lecturer 1.67 20.5% 4.03 49.4% 2.45 30.1% 8.15 11.70 –30.3%Total 54.24 47.5% 44.43 38.9% 15.56 13.6% 114.22 113.95 0.2%
West MidlandsProfessor 31.34 43.4% 34.71 48.1% 6.10 8.5% 72.15 68.85 4.8%Reader/ Senior Lecturer 24.21 27.5% 53.65 60.9% 10.24 11.6% 88.10 80.20 9.9%Lecturer 7.10 17.7% 30.40 75.8% 2.60 6.5% 40.10 43.10 –7.0%Total 62.65 31.3% 118.76 59.3% 18.94 9.5% 200.35 192.15 4.3%
Yorkshire and The HumberProfessor 36.60 45.5% 36.41 45.2% 7.50 9.3% 80.51 83.81 –3.9%Reader/ Senior Lecturer 38.59 40.0% 43.78 45.4% 14.14 14.6% 96.50 94.65 2.0%Lecturer 8.30 23.1% 24.20 67.4% 3.40 9.5% 35.90 39.60 –9.3%Total 83.49 39.2% 104.39 49.0% 25.04 11.8% 212.91 218.06 –2.4%
Northern IrelandProfessor 8.85 53.3% 7.15 43.1% 0.60 3.6% 16.60 18.00 –7.8%Reader/ Senior Lecturer 15.00 41.7% 19.00 52.8% 2.00 5.6% 36.00 40.00 –10.0%Lecturer 2.50 35.7% 4.50 64.3% 0.00 0.0% 7.00 6.00 16.7%Total 26.35 44.2% 30.65 51.4% 2.60 4.4% 59.60 64.00 –6.9%
ScotlandProfessor 121.28 71.8% 35.05 20.7% 12.67 7.5% 169.00 174.10 –2.9%Reader/ Senior Lecturer 58.09 43.6% 48.65 36.5% 26.56 19.9% 133.30 131.35 1.5%Lecturer 13.00 15.4% 62.93 74.4% 8.67 10.2% 84.60 76.60 10.4%Total 192.37 49.7% 146.63 37.9% 47.90 12.4% 386.90 382.05 1.3%
WalesProfessor 32.51 55.4% 24.99 42.6% 1.20 2.0% 58.70 57.73 1.7%Reader/ Senior Lecturer 25.10 34.7% 43.61 60.3% 3.60 5.0% 72.30 71.60 1.0%Lecturer 13.87 41.8% 6.40 19.3% 12.94 39.0% 33.20 30.37 9.3%Total 71.47 43.5% 75.00 45.7% 17.74 10.8% 164.20 159.70 2.8%
Grand TotalProfessor 746.53 57.1% 424.47 32.5% 135.54 10.4% 1306.54 1318.27 –0.9%Reader/ Senior Lecturer 533.80 40.3% 614.32 46.4% 176.61 13.3% 1324.74 1320.38 0.3%Lecturer 119.53 22.5% 334.91 63.1% 76.50 14.4% 530.93 536.84 –1.1%Total 1399.86 44.3% 1373.70 43.4% 388.65 12.3% 3162.21 3175.48 –0.4%

Clinical Academic Staffing Levels in UK Medical Schools © Medical Schools Council 2012 27
Appendix 3: Profile by medical school and source of funding (FTE) (cont)
Funding Council NHS Other sources Total 2011 Total 2010% Change since 2010
AberdeenProfessor 21.66 61.0% 9.00 25.4% 4.84 13.6% 35.50 36.20 –1.9%Reader/ Senior Lecturer 15.33 52.4% 6.52 22.3% 7.40 25.3% 29.25 24.75 18.2%Lecturer 4.50 32.1% 7.50 53.6% 2.00 14.3% 14.00 13.00 7.7%Total 41.49 52.7% 23.02 29.2% 14.24 18.1% 78.75 73.95 6.5%
Barts and The London, QMULProfessor 37.39 66.7% 14.40 25.7% 4.25 7.6% 56.04 60.48 –7.3%Reader/ Senior Lecturer 23.46 37.3% 23.81 37.8% 15.68 24.9% 62.94 59.23 6.3%Lecturer 3.35 18.1% 4.75 25.7% 10.40 56.2% 18.50 15.80 17.1%Total 64.20 46.7% 42.96 31.2% 30.33 22.1% 137.49 135.52 1.5%
BirminghamProfessor 21.98 51.6% 15.98 37.5% 4.64 10.9% 42.60 40.20 6.0%Reader/ Senior Lecturer 16.90 33.3% 26.26 51.7% 7.64 15.0% 50.80 42.70 19.0%Lecturer 1.70 6.6% 22.60 87.6% 1.50 5.8% 25.80 30.40 –15.1%Total 40.58 34.0% 64.84 54.4% 13.78 11.6% 119.20 113.30 5.2%
Brighton and SussexProfessor 5.75 49.6% 5.85 50.4% 0.00 0.0% 11.60 10.00 16.0%Reader/ Senior Lecturer 5.34 31.8% 9.46 56.3% 2.00 11.9% 16.80 18.50 –9.2%Lecturer 1.40 35.0% 1.60 40.0% 1.00 25.0% 4.00 4.00 0.0%Total 12.49 38.5% 16.91 52.2% 3.00 9.3% 32.40 32.50 –0.3%
BristolProfessor 25.69 67.6% 11.31 29.8% 1.00 2.6% 38.00 39.20 –3.1%Reader/ Senior Lecturer 13.93 32.8% 19.09 44.9% 9.51 22.4% 42.52 43.25 –1.7%Lecturer 0.67 9.4% 4.03 56.3% 2.45 34.3% 7.15 10.70 –33.2%Total 40.29 46.0% 34.43 39.3% 12.96 14.8% 87.67 93.15 –5.9%
CambridgeProfessor 21.25 42.4% 18.35 36.6% 10.50 21.0% 50.10 51.00 –1.8%Reader/ Senior Lecturer 11.20 22.7% 34.90 70.6% 3.30 6.7% 49.40 53.20 –7.1%Lecturer 3.00 8.9% 27.70 82.2% 3.00 8.9% 33.70 26.40 27.7%Total 35.45 26.6% 80.95 60.8% 16.80 12.6% 133.20 130.60 2.0%
CardiffProfessor 32.51 71.6% 11.69 25.7% 1.20 2.6% 45.40 45.33 0.2%Reader/ Senior Lecturer 25.10 42.7% 30.11 51.2% 3.60 6.1% 58.80 58.60 0.3%Lecturer 13.87 47.5% 2.40 8.2% 12.94 44.3% 29.20 25.37 15.1%Total 71.47 53.6% 44.20 33.1% 17.74 13.3% 133.40 129.30 3.2%
DundeeProfessor 21.59 74.2% 7.51 25.8% 0.00 0.0% 29.10 27.10 7.4%Reader/ Senior Lecturer 8.92 31.3% 15.78 55.4% 3.80 13.3% 28.50 26.30 8.4%Lecturer 4.50 32.6% 7.80 56.5% 1.50 10.9% 13.80 12.00 15.0%Total 35.01 49.0% 31.09 43.5% 5.30 7.4% 71.40 65.40 9.2%
DurhamProfessor 1.71 59.0% 1.00 34.5% 0.19 6.5% 2.90 2.90 0.0%Reader/ Senior Lecturer 0.50 41.7% 0.00 0.0% 0.70 58.3% 1.20 1.90 –36.8%Lecturer 0.00 0.0% 0.00 0.0% 0.00 0.0% 0.00 0.20 –100.0%Total 2.21 53.9% 1.00 24.4% 0.89 21.7% 4.10 5.00 –18.0%
EdinburghProfessor 40.00 69.7% 11.57 20.2% 5.83 10.2% 57.40 59.00 –2.7%Reader/ Senior Lecturer 15.15 42.5% 15.82 44.4% 4.69 13.2% 35.65 37.95 –6.1%Lecturer 0.00 0.0% 26.40 93.0% 2.00 7.0% 28.40 29.20 –2.7%Total 55.15 45.4% 53.79 44.3% 12.52 10.3% 121.45 126.15 –3.7%
GlasgowProfessor 34.63 80.5% 6.37 14.8% 2.00 4.7% 43.00 47.80 –10.0%Reader/ Senior Lecturer 18.70 46.9% 10.53 26.4% 10.68 26.8% 39.90 42.35 –5.8%Lecturer 4.00 14.1% 21.23 74.8% 3.17 11.2% 28.40 22.40 26.8%Total 57.33 51.5% 38.13 34.3% 15.85 14.2% 111.30 112.55 –1.1%
Hull YorkProfessor 5.61 38.7% 8.38 57.8% 0.52 3.6% 14.51 12.11 19.8%Reader/ Senior Lecturer 6.70 34.4% 12.80 65.6% 0.00 0.0% 19.50 17.90 8.9%Lecturer 0.05 2.5% 1.95 97.5% 0.00 0.0% 2.00 1.00 100.0%Total 12.36 34.3% 23.13 64.2% 0.52 1.4% 36.01 31.01 16.1%
Appendix 3: Profile by medical school and source of funding (FTE)

28 Clinical Academic Staffing Levels in UK Medical Schools © Medical Schools Council 2012
Appendix 3: Profile by medical school and source of funding (FTE) (cont)
Funding Council NHS Other sources Total 2011 Total 2010% Change since 2010
ImperialProfessor 60.81 58.1% 31.89 30.5% 11.90 11.4% 104.60 107.00 –2.2%Reader/ Senior Lecturer 33.14 29.7% 63.15 56.7% 15.14 13.6% 111.43 108.16 3.0%Lecturer 2.00 8.3% 20.00 83.3% 2.00 8.3% 24.00 21.00 14.3%Total 95.95 40.0% 115.04 47.9% 29.05 12.1% 240.03 236.16 1.6%
KeeleProfessor 2.60 25.0% 7.80 75.0% 0.00 0.0% 10.40 10.40 0.0%Reader/ Senior Lecturer 1.96 25.4% 4.74 61.6% 1.00 13.0% 7.70 7.70 0.0%Lecturer 2.40 45.4% 1.80 33.9% 1.10 20.8% 5.30 5.30 0.0%Total 6.96 29.7% 14.34 61.3% 2.10 9.0% 23.40 23.40 0.0%
King’s College LondonProfessor 58.42 61.2% 32.29 33.8% 4.80 5.0% 95.50 90.47 5.6%Reader/ Senior Lecturer 41.66 54.1% 28.29 36.7% 7.12 9.2% 77.07 72.38 6.5%Lecturer 13.28 22.5% 29.62 50.1% 16.20 27.4% 59.10 37.70 56.8%Total 113.35 48.9% 90.19 38.9% 28.12 12.1% 231.67 200.55 15.5%
LancasterProfessor 1.20 60.0% 0.80 40.0% 0.00 0.0% 2.00 3.00 –33.3%Reader/ Senior Lecturer 0.00 0.0% 0.00 0.0% 0.00 0.0% 0.00 0.00 0.0%Lecturer 0.40 40.0% 0.60 60.0% 0.00 0.0% 1.00 0.00 100.0%Total 1.60 53.3% 1.40 46.7% 0.00 0.0% 3.00 3.00 0.0%
LeedsProfessor 15.24 42.3% 16.28 45.2% 4.48 12.4% 36.00 37.70 –4.5%Reader/ Senior Lecturer 14.78 34.7% 15.39 36.1% 12.44 29.2% 42.60 41.35 3.0%Lecturer 3.75 28.2% 8.15 61.3% 1.40 10.5% 13.30 20.20 –34.2%Total 33.76 36.7% 39.82 43.3% 18.32 19.9% 91.90 99.25 –7.4%
LeicesterProfessor 14.68 38.6% 19.32 50.8% 4.00 10.5% 38.00 37.00 2.7%Reader/ Senior Lecturer 8.80 36.5% 15.30 63.5% 0.00 0.0% 24.10 30.10 –19.9%Lecturer 0.00 0.0% 11.00 100.0% 0.00 0.0% 11.00 13.00 –15.4%Total 23.48 32.1% 45.62 62.4% 4.00 5.5% 73.10 80.10 –8.7%
LiverpoolProfessor 25.90 56.9% 14.10 31.0% 5.50 12.1% 45.50 48.80 –6.8%Reader/ Senior Lecturer 21.75 49.3% 16.30 36.9% 6.10 13.8% 44.15 45.55 –3.1%Lecturer 3.30 21.7% 11.90 78.3% 0.00 0.0% 15.20 18.60 –18.3%Total 50.95 48.6% 42.30 40.3% 11.60 11.1% 104.85 112.95 –7.2%
London School of Hygene & Tropical Medicine
Professor 16.30 81.7% 0.00 0.0% 3.65 18.3% 19.95 18.46 8.1%Reader/ Senior Lecturer 5.81 45.5% 1.70 13.3% 5.25 41.1% 12.76 12.21 4.5%Lecturer 0.32 0.0% 0.00 0.0% 0.48 0.0% 0.80 0.60 33.3%Total 22.44 66.9% 1.70 5.1% 9.38 28.0% 33.52 31.27 7.2%
ManchesterProfessor 34.66 53.3% 22.97 35.3% 7.35 11.3% 64.98 68.93 –5.7%Reader/ Senior Lecturer 23.52 45.0% 20.03 38.3% 8.76 16.7% 52.30 61.40 –14.8%Lecturer 6.60 24.4% 15.30 56.6% 5.15 19.0% 27.05 38.03 –28.9%Total 64.78 44.9% 58.29 40.4% 21.25 14.7% 144.33 168.36 –14.3%
NewcastleProfessor 35.07 57.3% 14.98 24.5% 11.15 18.2% 61.19 63.33 –3.4%Reader/ Senior Lecturer 18.27 40.9% 18.40 41.2% 8.01 17.9% 44.68 43.75 2.1%Lecturer 0.80 22.9% 1.00 28.6% 1.70 48.6% 3.50 4.00 –12.5%Total 54.14 49.5% 34.38 31.4% 20.86 19.1% 109.37 111.08 –1.5%
Norwich (UEA)Professor 11.00 100.0% 0.00 0.0% 0.00 0.0% 11.00 10.00 10.0%Reader/ Senior Lecturer 10.50 84.0% 2.00 16.0% 0.00 0.0% 12.50 10.50 19.0%Lecturer 1.00 0.0% 1.00 0.0% 0.00 0.0% 2.00 2.60 –23.1%Total 22.50 88.2% 3.00 11.8% 0.00 0.0% 25.50 23.10 10.4%
NottinghamProfessor 24.81 50.2% 24.59 49.8% 0.00 0.0% 49.40 49.00 0.8%Reader/ Senior Lecturer 23.66 36.6% 41.02 63.4% 0.00 0.0% 64.68 63.50 1.9%Lecturer 15.48 51.6% 13.52 45.1% 1.00 3.3% 30.00 24.45 22.7%Total 63.95 44.4% 79.13 54.9% 1.00 0.7% 144.08 136.95 5.2%

Clinical Academic Staffing Levels in UK Medical Schools © Medical Schools Council 2012 29
Appendix 3: Profile by medical school and source of funding (FTE) (cont)
Funding Council NHS Other sources Total 2011 Total 2010% Change since 2010
OxfordProfessor 26.95 90.0% 0.00 0.0% 3.00 10.0% 29.95 30.00 –0.2%Reader/ Senior Lecturer 33.55 90.8% 0.90 2.4% 2.50 6.8% 36.95 44.56 –17.1%Lecturer 13.50 38.7% 21.40 61.3% 0.00 0.0% 34.90 62.20 –43.9%Total 74.00 72.7% 22.30 21.9% 5.50 5.4% 101.80 136.76 –25.6%
PeninsulaProfessor 9.45 54.2% 5.40 30.9% 2.60 14.9% 17.45 14.60 19.5%Reader/ Senior Lecturer 3.50 43.2% 4.60 56.8% 0.00 0.0% 8.10 5.20 55.8%Lecturer 1.00 100.0% 0.00 0.0% 0.00 0.0% 1.00 1.00 0.0%Total 13.95 52.5% 10.00 37.7% 2.60 9.8% 26.55 20.80 27.6%
Queen’s University BelfastProfessor 8.85 53.3% 7.15 43.1% 0.60 3.6% 16.60 18.00 –7.8%Reader/ Senior Lecturer 15.00 41.7% 19.00 52.8% 2.00 5.6% 36.00 40.00 –10.0%Lecturer 2.50 35.7% 4.50 64.3% 0.00 0.0% 7.00 6.00 16.7%Total 26.35 44.2% 30.65 51.4% 2.60 4.4% 59.60 64.00 –6.9%
SheffieldProfessor 15.75 52.5% 11.75 39.2% 2.50 8.3% 30.00 34.00 –11.8%Reader/ Senior Lecturer 17.11 49.8% 15.59 45.3% 1.70 4.9% 34.40 35.40 –2.8%Lecturer 4.50 21.8% 14.10 68.4% 2.00 9.7% 20.60 18.40 12.0%Total 37.36 44.0% 41.44 48.7% 6.20 7.3% 85.00 87.80 –3.2%
SouthamptonProfessor 19.00 48.9% 12.65 32.6% 7.20 18.5% 38.85 39.70 –2.1%Reader/ Senior Lecturer 18.78 43.5% 15.96 37.0% 8.40 19.5% 43.14 41.84 3.1%Lecturer 3.40 53.1% 3.00 46.9% 0.00 0.0% 6.40 6.40 0.0%Total 41.18 46.6% 31.61 35.8% 15.60 17.6% 88.39 87.94 0.5%
St AndrewsProfessor 3.40 85.0% 0.60 15.0% 0.00 0.0% 4.00 4.00 0.0%Reader/ Senior Lecturer 0.00 0.0% 0.00 0.0% 0.00 0.0% 0.00 0.00 0.0%Lecturer 0.00 0.0% 0.00 0.0% 0.00 0.0% 0.00 0.00 0.0%Total 3.40 85.0% 0.60 15.0% 0.00 0.0% 4.00 4.00 0.0%
St George’sProfessor 14.77 52.7% 10.47 37.3% 2.80 10.0% 28.04 32.65 –14.1%Reader/ Senior Lecturer 13.21 34.5% 21.93 57.3% 3.10 8.1% 38.24 40.86 –6.4%Lecturer 1.90 20.7% 7.30 79.3% 0.00 0.0% 9.20 12.50 –26.4%Total 29.88 39.6% 39.70 52.6% 5.90 7.8% 75.48 86.02 –12.3%
SwanseaProfessor 0.00 0.0% 13.30 100.0% 0.00 0.0% 13.30 12.40 7.3%Reader/ Senior Lecturer 0.00 0.0% 13.50 100.0% 0.00 0.0% 13.50 13.00 3.8%Lecturer 0.00 0.0% 4.00 100.0% 0.00 0.0% 4.00 5.00 –20.0%Total 0.00 0.0% 30.80 100.0% 0.00 0.0% 30.80 30.40 1.3%
UCLProfessor 71.14 49.2% 45.80 31.7% 27.58 19.1% 144.52 139.26 3.8%Reader/ Senior Lecturer 62.25 40.0% 68.82 44.2% 24.50 15.8% 155.57 146.47 6.2%Lecturer 3.36 8.1% 32.76 78.7% 5.51 13.2% 41.62 41.99 –0.9%Total 136.75 40.0% 147.37 43.1% 57.60 16.9% 341.71 327.72 4.3%
WarwickProfessor 6.76 35.3% 10.93 57.1% 1.46 7.6% 19.15 18.25 4.9%Reader/ Senior Lecturer 5.35 18.1% 22.65 76.5% 1.60 5.4% 29.60 29.80 –0.7%Lecturer 3.00 33.3% 6.00 66.7% 0.00 0.0% 9.00 7.40 21.6%Total 15.11 26.2% 39.58 68.5% 3.06 5.3% 57.75 55.45 4.1%
Grand TotalProfessor 746.53 57.1% 424.47 32.5% 135.54 10.4% 1306.54 1318.27 –0.9%Reader/ Senior Lecturer 533.80 40.3% 614.32 46.4% 176.61 13.3% 1324.74 1320.38 0.3%Lecturer 119.53 22.5% 334.91 63.1% 76.50 14.4% 530.93 536.84 –1.1%Total 1399.86 44.3% 1373.70 43.4% 388.65 12.3% 3162.21 3175.48 –0.4%

30 Clinical Academic Staffing Levels in UK Medical Schools © Medical Schools Council 2012
Appendix 4: Summary of changes (pre- and post- 2002 medical schools) (FTE)
Funding Council NHS Other Total 2011 Total 2010% Change since 2010
All SchoolsProfessor 746.53 57.1% 424.47 32.5% 135.54 10.4% 1306.54 1318.27 –0.9%Reader/ Senior Lecturer 533.80 40.2% 614.32 46.5% 176.61 13.3% 1324.74 1320.38 0.5%Lecturer 119.53 22.6% 334.91 63.0% 76.50 14.4% 530.93 536.84 –1.4%Total 1399.86 44.3% 1373.70 43.5% 388.65 12.3% 3162.21 3175.48 –0.4%
Post–2002 Medical SchoolsProfessor 44.08 43.1% 53.46 52.3% 4.77 5.1% 102.31 93.66 9.2%Reader/ Senior Lecturer 33.85 31.1% 69.75 64.1% 5.30 5.1% 108.90 104.50 4.2%Lecturer 9.25 32.7% 16.95 59.9% 2.10 7.9% 28.30 26.50 6.8%Total 87.18 36.4% 140.16 58.5% 12.17 5.4% 239.51 224.66 6.6%
Pre–2002 Medical SchoolsProfessor 702.45 58.3% 371.01 30.8% 130.77 10.7% 1204.23 1224.61 –1.7%Reader/ Senior Lecturer 499.96 41.1% 544.57 44.8% 171.31 14.1% 1215.84 1215.88 –0.0%Lecturer 110.28 21.9% 317.96 63.3% 74.40 14.6% 502.63 510.34 –1.5%Total 1312.68 44.9% 1233.54 42.2% 376.48 12.8% 2922.70 2950.82 –1.0%
Note: Medical Schools established post 2001/02 are: Brighton and Sussex, Durham, Hull York, Keele, Lancaster, Norwich at University of East Anglia, Peninsula, Swansea and Warwick
Appendix 5: NHS and clinical academic consultants by specialty and UK medical student intake (FTE)
UK NHS Consultants % Change since 2000
UK Clinical Academic Consultants
% Change since 20002000 2011 2000 2011
Anaesthetics 4143.0 7049.8 70.2% 77.31 43.2 –44.2%Obstetrics & Gynaecology 1309.4 2172.6 65.9% 137.74 85.6 –37.9%Paediatrics & Child Health 1605.0 2923.6 82.2% 180.54 173.8 –3.8%Pathology 2286.4 3012.4 31.8% 308.53 135.3 –56.2%Physicians/ Medicine 6783.7 10530.4 55.2% 821.34 1051.8 28.1%Psychiatry 3649.1 4908.7 34.5% 278.75 233.5 –16.2%Public Health 864.4 894.1 3.4% 152.58 156.8 2.7%Radiology 1871.7 2938.7 57.0% 52.65 42.6 –19.1%Surgery 5763.0 9674.9 67.9% 234.26 226.5 –3.3%Grand Total 28275.70 44105.1 56.0% 2243.70 2148.9 –4.2%
Medical Student Intake (headcount) 5610 8022 43.0%
Notes1. Consultants in the following specialties: Anaesthetics, Obstetrics & Gynaecology, Paediatrics & Child Health, Pathology, Physicians/ Medicine (Infection/Microbiology, Oncology, Ophthalmology and Occupational Medicine), Psychiatry, Public Health, Radiology and Surgery (including Emergency Medicine). These data exclude General Practice, Medical Education and other specialties.2. NHS consultant data for England, Scotland and Wales refer to September 2011; data for Northern Ireland refer to December 2011.3. Clinical academic consultants are Professorial and Senior Lecturer grades4. Sources: Medical Schools Council; HEFCE; UCAS; Department of Health, England; Information Services Division, NHS National Services Scotland; Department of Health, Social Services and Public Security, Northern Ireland; Health and Social Care Department, Wales.
Appendix 6: Summary of change in clinical academic staffing level since 2000 (FTE)
2000 2003 2004 2005 2006 2007 2008 2009 2010 2011Professor 1041.88 1093.22 1145.25 1218.22 1237.99 1269.00 1321.86 1333.09 1318.27 1306.54Reader/ Senior
Lecturer1662.97 1414.00 1420.14 1324.79 1296.25 1310.63 1278.52 1294.46 1320.38 1324.74
Lecturer 844.24 528.00 439.32 414.34 395.95 417.61 447.23 477.95 536.84 530.93Grand Total 3549.09 3035.22 3004.72 2957.35 2930.19 2997.23 3047.62 3105.50 3175.48 3162.21

Clinical Academic Staffing Levels in UK Medical Schools © Medical Schools Council 2012 31
Appendix 7: Clinical academic staffing levels by region since 2004 (FTE)
East Midlands
East of England London
North East
North West
South Central
South East
South West
West Midlands
Yorkshire and The Humber
Northern Ireland Scotland Wales
Grand Total
2004 210.19 123.31 1009.48 114.81 252.53 172.36 6.00 142.20 161.30 226.94 56.20 404.46 124.93 3004.722005 201.66 116.32 967.09 117.76 240.38 172.77 15.00 131.71 166.30 230.06 60.80 384.38 153.13 2957.352006 204.61 100.91 948.56 113.78 249.49 171.28 15.00 120.80 163.58 222.00 63.30 400.59 156.30 2930.192007 221.04 115.00 929.00 118.82 279.55 181.09 19.00 110.60 188.60 223.78 59.60 395.45 155.70 2997.232008 223.95 125.80 941.78 111.21 283.65 191.40 25.60 110.56 193.05 224.37 62.80 397.05 156.40 3047.622009 224.61 136.80 970.01 114.27 281.72 211.65 27.60 114.45 186.50 224.16 61.80 400.43 151.50 3105.502010 217.05 153.70 1017.24 116.08 284.31 224.70 32.50 113.95 192.15 218.06 64.00 382.05 159.70 3175.482011 217.18 158.70 1059.90 113.47 252.18 190.19 32.40 114.22 200.35 212.91 59.60 386.90 164.20 3162.21
Appendix 8: Age profile of clinical academics since 2004 (headcount)
2004 2005 2006 2007 2008 2009 2010 201126–35 275 9.2% 288 8.9% 267 8.4% 291 9.0% 282 8.6% 268 7.9% 261 7.6% 259 7.5%36–45 1130 37.7% 1147 35.5% 1072 33.8% 1028 31.9% 1066 32.5% 1017 30.1% 1019 29.8% 1028 29.8%46–55 1065 35.6% 1208 37.3% 1236 39.0% 1258 39.1% 1265 38.6% 1341 39.7% 1351 39.5% 1337 38.8%56–65 512 17.1% 573 17.7% 578 18.2% 617 19.2% 642 19.6% 709 21.0% 729 21.3% 770 22.3%66 and over 12 0.4% 19 0.6% 19 0.6% 24 0.7% 25 0.8% 42 1.2% 56 1.6% 52 1.5%Unknown 283 5 12Grand Total 3277 3240 3184 3218 3280 3377 3416 3446
Note: 2004, 2005 and 2006 is calculated as a percentage of all known age data
Appendix 9: Clinical academics by age, gender and academic grade (headcount)
Men Professor Reader/ Senior Lecturer Lecturer Grand Total26–35 6 0.6% 145 42.3% 15136–45 71 6.1% 446 43.1% 174 50.7% 69146–55 575 49.5% 415 40.1% 16 4.7% 100656–65 480 41.3% 161 15.5% 8 2.3% 64966 and over 36 3.1% 8 0.8% 44Grand Total 1162 1036 343 2541
Women Professor Reader/ Senior Lecturer Lecturer Grand Total26–35 9 2.0% 99 39.4% 10836–45 11 5.3% 198 44.3% 128 51.0% 33746–55 122 58.9% 192 43.0% 17 6.8% 33156–65 69 33.3% 45 10.1% 7 2.8% 12166 and over 5 2.4% 3 0.7% 8Grand Total 207 447 251 905
Appendix 10: Clinical academics by age and ethnic origin (headcount)
26–35 36–45 46–55 56–65 66 and overGrand Total
Asian/ British Asian 45 17.4% 144 14.0% 111 8.3% 29 3.8% 2 3.8% 331Black/ Black British 3 1.2% 15 1.5% 7 0.5% 2 0.3% 27Chinese 8 3.1% 26 2.5% 22 1.6% 7 0.9% 63Mixed 6 2.3% 17 1.7% 17 1.3% 10 1.3% 1 1.9% 51White 171 66.0% 720 70.0% 1097 82.0% 689 89.5% 49 94.2% 2726Other 5 1.9% 24 2.3% 24 1.8% 7 0.9% 60Unknown 21 8.1% 82 8.0% 59 4.4% 26 3.4% 188Grand Total 259 1028 1337 770 52 3446

32 Clinical Academic Staffing Levels in UK Medical Schools © Medical Schools Council 2012
Anaesthetics
AnaestheticsIntensive Care Medicine
Emergency Medicine
Accident & Emergency Medicine
General Practice
General Practice
Infection/ Microbiology
Infectious Diseases (formerly known as Communicable Diseases)
Medical Microbiology and Virology
Medical Education
Medical Education
Obstetrics and Gynaecology
Obstetrics and Gynaecology
Occupational Medicine
Occupational Medicine
Oncology
Clinical OncologyMedical Oncology
Ophthalmology
OphthalmologyMedical Ophthalmology
Paediatrics and Child Health
Paediatrics
Pathology
Chemical Pathology (also known as Clinical Biochemistry)
Clinical Cytogenetics and Molecular Genetics
Histopathology (Morbid Anatomy)Neuropathology
Physicians/ Medicine
AllergyAudiological medicineCardiology (formerly known as Cardio
Vascular Disease)Clinical GeneticsClinical NeurophysiologyClinical Pharmacology and
TherapeuticsDermatologyEndocrinology and Diabetes MellitusGastroenterologyGeneral Internal Medicine (formerly
known as General Medicine) Genito-Urinary Medicine (formerly known as Veneriology)
Geriatric Medicine (formerly known as Geriatrics)
HaematologyImmunology (also known as
Immunopathology)NeurologyNuclear MedicinePaediatric CardiologyPalliative MedicineRehabilitation MedicineRenal Medicine (formerly known as
Renal Disease, and as Nephrology)Respiratory Medicine (also known as
Thoracic Medicine)RheumatologyTropical Medicine
Psychiatry
Child and Adolescent PsychiatryForensic PsychiatryGeneral Adult Psychiatry (formerly
known as Psychiatry and as Mental Illness)
Old Age PsychiatryPsychiatry of Learning DisabilityPsychotherapy
Public Health Medicine
Public Health Medicine (formally known as Community Medicine)
Radiology
Clinical Radiology (formerly known as Diagnostic Radiology and as Radiology)
Surgery
Cardiothoracic Surgery (formerly known as Thoracic Surgery)
General SurgeryNeurosurgery (formally known as
Neurological Surgery)Otolaryngology (also known as ENT
Surgery)Paediatric SurgeryPlastic SurgeryTrauma and Orthopaedic SurgeryUrology
Other
Any medical specialty not included in the above list.
Appendix 12: Medicine specialty groups and sub-specialties
Appendix 11: Clinical academics by academic grade and ethnic origin (headcount)
Professor Reader/ Senior Lecturer Lecturer Grand TotalAsian/ British Asian 87 6.4% 141 9.5% 103 17.3% 331Black/ Black British 3 0.2% 13 0.9% 11 1.9% 27Chinese 18 1.3% 25 1.7% 20 3.4% 63Mixed 20 1.5% 21 1.4% 10 1.7% 51White 1169 85.4% 1175 79.2% 382 64.3% 2726Other 20 1.5% 29 2.0% 11 1.9% 60Unknown 52 3.8% 79 5.3% 57 9.6% 188Grand Total 1369 1483 594 3446