
A SUPERCRITICAL FLUID EXTRACTION PROCESS TO OBTAIN...
89
UNIVERSITÀ DEGLI STUDI DI PADOVA DIPARTIMENTO DI INGEGNERIA INDUSTRIALE CORSO DI LAUREA MAGISTRALE IN INGEGNERIA CHIMICA E DEI PROCESSI INDUSTRIALI Tesi di Laurea Magistrale in Ingegneria Chimica e dei Processi Industriali A SUPERCRITICAL FLUID EXTRACTION PROCESS TO OBTAIN VALUABLE COMPOUNDS FROM ERUCA SATIVA LEAVES Relatore: Prof. Alberto Bertucco Correlatore: Ing. Miriam Solana Ciprés Laureando: SHEFQET MIROFCI ANNO ACCADEMICO: 2013-2014
Transcript of A SUPERCRITICAL FLUID EXTRACTION PROCESS TO OBTAIN...
UNIVERSITÀ DEGLI STUDI DI PADOVA
DIPARTIMENTO DI INGEGNERIA INDUSTRIALE
CORSO DI LAUREA MAGISTRALE IN INGEGNERIA CHIMICA E DEI
PROCESSI INDUSTRIALI
Tesi di Laurea Magistrale in
Ingegneria Chimica e dei Processi Industriali
A SUPERCRITICAL FLUID EXTRACTION PROCESS
TO OBTAIN VALUABLE COMPOUNDS
FROM ERUCA SATIVA LEAVES
Relatore: Prof. Alberto Bertucco
Correlatore: Ing. Miriam Solana Ciprés
Laureando: SHEFQET MIROFCI
ANNO ACCADEMICO: 2013-2014


Abstract
Supercritical carbon dioxide extraction of glucosinolates, flavonoids and lipids from leaves of
rocket salad (Eruca sativa) is presented in this work. SC-CO2 extraction has been compared
with Soxhlet extraction method. In the case of SC-CO2 method, extractions with pure CO2
and co-solvents have been carried out. Three different co-solvents have been compared:
water, ethanol and methanol. First, SC-CO2 extraction has been performed using ethanol as
co-solvent. The effect of the different variables that affect the process has been studied,
obtaining the best results at 300 bar, 65°C, CO2 flow rate of 0.3 kg/h and ethanol dosage of
0.5 mL/min. The effect of a mechanical pre-treatment on the yield of the extraction has also
been reported. Then, SC-CO2 extraction has been performed using water as co-solvent. The
optimum values of the water dosage and of the extraction temperature have been obtained at
0.4 mL/min and 65°C, while pressure does not affect significantly the extraction yield. When
ethanol, methanol and water as co-solvents at the same extraction conditions have been
compared, the highest yield has been obtained with water. The extracts have been analyzed
and the results show that flavonoids and glucosinolates have been mainly extracted using
water as co-solvent, while lipids have been extracted using pure SC-CO2. A conceptual design
of an industrial scale application of the process has been proposed, using the software Aspen
Plus 7.3 for the simulation. The lowest production cost was found at extraction conditions of
250 bar and 65°C and separation pressure of 72 bar. An analysis of the profitability of the
process has also been performed.


Riassunto
L’estrazione è stata per trent’anni il maggior impiego dei fluidi supercritici. Una sostanza
pura è considerata nello stato supercritico se la sua temperatura e la sua pressione sono
superiori a quelle critiche. In queste condizioni le proprietà fisiche della sostanza assumono
caratteristiche uniche, ibride tra quelle in fase gas e quelle in fase vapore. In particolare i
valori di alta diffusività, bassa tensione superficiale e bassa viscosità li accumunano ai gas,
mentre i valori della densità li accomunano ai liquidi. A temperature costante, cambiando la
pressione si cambia la densità, che a sua volta porta al cambiamento di proprietà come la
capacità del solvente, la viscosità e la diffusività, e la costante dielettrica. Queste
caratteristiche permettono ai fluidi supercritici di essere utilizzati come solventi
nell’estrazione di sostanze da prodotti naturali: essi possono penetrare la sostanza biologica ed
offrono un potere solvente che può essere aggiustato in modo da solubilizzare ed estrarre il
componente chimico di interesse. Il fluido supercritico più usato è l’anidride carbonica.
Questa unisce ai già citati vantaggi dei fluidi supercritici, il fatto di presentare condizioni
critiche facilmente raggiungibili e di essere non infiammabile, non tossica, economica. Inoltre
l’anidride carbonica può essere completamente recuperata dopo l’estrazione per semplice
depressurizzazione, non lasciando alcuna traccia nell’estratto. Queste caratteristiche la
rendono ideale come solvente da usare nel industria alimentare.
In questo lavoro si utilizzato anidride carbonica supercritica per estrarre componenti chimici
ad alto valore aggiunto da foglie di rucola (Eruca sativa). Fonti di letteratura mostrano che le
foglie di rucola contengono glucosinolati e flavonoidi, mentre i semi sono ricchi di acidi
grassi. I glucosinolati sono metaboliti secondari che si trovano all’interno dei vacuoli, tipici
delle piante della famiglia delle (Brassicaceae). È confermato che un assunzione regolare di
questi composti è in grado limitare la probabilità di insorgere di malattie cardiovascolari, in
particolare la glucorafanina è noto per essere la sostanza che più di ogni altra stimola il fegato
a produrre disintossicanti che impediscono l’insorgere di cancro al petto e al colon. Pure i
flavonoidi (composti polifenolici) sono metaboliti secondari presenti nei tessuti delle foglie
noti per avere proprietà antiossidanti e anticancerogene.
In questo lavoro si estraggono glucosinolati, flavonoidi e acidi grassi da foglie di rucola
usando la tecnica dell’estrazione con CO2 supercritica. In letteratura ci sono articoli di
estrazione supercritica di glucosinolati dalla pianta di colza e di flavonoidi da foglie di
Gingko utilizzando l’etanolo come co-solvente. Acidi grassi sono invece stati estratti in
letteratura da foglie di broccoli (appartenenti alla stessa famiglia della rucola, Brassicaceae),
utilizzando l’anidride carbonica pura o addizionata con metanolo per estrarre gli acidi grassi
più polari.
L’estrazione è stata effettuata usando un impianto di estrazione supercritica da laboratorio.
Le foglie di rucola prima dell’estrazione hanno subito un pre-trattamento di disidratazione
(liofilizzazione) per eliminare l’acqua che potrebbe interferire con l’estrazione. Si sono
sostenute diverse condizioni di temperatura (da 45 a 75 °C) e pressione (da 150 a 300 bar) di
estrazione al fine di individuare i valori ottimali. Gli estratti ottenuti sono stati poi analizzati
per investigare l’influenza delle condizioni di estrazione sulla composizione dell’estratto.
HPLC e NMR sono state le due tecniche utilizzate per le analisi della composizione.
La resa dell’estrazione supercritica è stata paragonata con quella ottenuta con l’estrazione
Soxhlet, mostrando che la prima oltre a richiedere tempo e temperature inferiori può avere
anche rese simili.
Le condizioni dell’estrazione sono state ottimizzate utilizzando l’etanolo come co-solvente. Si
è visto che un aumento della portata di CO2 porta ad una diminuzione della resa, 0.3 kg/h si è
scelto come portata ottimale. Un trattamento meccanico per ridurre le dimensioni delle
particelle è stato effettuato ottenendo chiari miglioramenti nella resa, dovuti all’aumento
dell’area interfacciale, alla rottura meccanica delle pareti cellulari e alla diminuzione del
diametro delle particelle solide che favorisce la diffusione. Si è osservato che la portata di
etanolo ha un valore ottimale (0,5 mL/min) al di sopra del quale un aumento della
concentrazione di etanolo non porta ad un aumento della resa. Un aumento della pressione
comporta invece un aumento della resa (miglior risultato a 300 bar). Analogamente, a
temperature elevate si sono osservate rese elevate. Accanto all’etanolo anche l’acqua è stata
utilizzata come co-solvente, e si è trovato che la portata ottimale di acqua è di 0.4 mL/min. Si
è osservato che la temperatura è la variabile che maggiormente influenza la resa
dell’estrazione, riscontrando notevoli incrementi nei valori della resa quando si passa da 45
°C a 65 °C. Al contrario della temperatura si è visto che l’influenza della pressione, pur
portando ad aumenti del valore della resa all’ aumentare della pressione, risulta meno marcata
e non ben distinguibile. Nelle stesse condizioni di estrazione (300 bar, 45°C, 7% di co-
solvente) tre diversi co-solventi sono stati impiegati: etanolo, metanolo e acqua. Le rese
ottenute con etanolo e metanolo sono simili (5,54 e 5,56 %), mentre quella con l’acqua risulta
essere di molto superiore (21 %).
Le analisi degli estratti hanno mostrato l’influenza delle condizioni di estrazione sulla
composizione dell’estratto. I glucosinolati sono stati estratti utilizzando l’acqua come co-
solvente mentre non si sono riscontrati negli estratti ottenuti con con l’etanolo o il metanolo.
La quantità maggiore di glucosinolati è stata ottenuta a 300 bar e con 0,4 mL/min di acqua.
Curiosamente la quantità di glucosinolati ottenuti con la rucola non filtrata risulta maggiore di
quella ottenuta con quella filtrata. I componenti principali sono stati glucorafanina e DMB-
glucosinolato. Anche i flavonoidi sono stati estratti utilizzando l’acqua come co-solvente. La
concentrazione maggiore di flavonoidi è stata ottenuta 0,4 mL/min di acqua, in particolare
risulta essere influenzata dalla temperatura presentando la massima quantità alla massima

temperatura utilizzata (75 °C). Principalmente i flavonoidi estratti sono stati Quercetina e suoi
derivati. Flavonoidi e glucosinolati sono stati estratti utilizzando la CO2 supercritica
(addizionata da acqua come co-solvente) mentre sono presenti solo in tracce negli estratti
ottenuti con l’estrazione Soxhlet. Negli estratti ottenuti utilizzando l’acqua come co-solvente
non vi erano tracce di acidi grassi, che invece sono stati estratti utilizzando solamente
l’anidride carbonica supercritica pura. Gli estratti ottenuti erano ricchi in acidi grassi insaturi.
In questo lavoro si è voluto proporre una progettazione concettuale di uno scale up industriale
dell’impianto di estrazione supercritica di laboratorio. Il software Aspen Plus V7.3 è stato
utilizzato per tale scopo. Il processo produce estratto di rucola a partire da rucola, acqua e
anidride carbonica, ed è principalmente costituito da un sistema di estrazione e uno di
separazione. Il sistema di estrazione è costituito da due estrattori in serie che permettono di
operare l’estrazione supercritica in modo semi-continuo, quello di separazione è costituito da
un’unità per la separazione e il recupero dell’anidride carbonica, e da un’unità di
essiccamento dell’estratto per eliminare e recuperare l’acqua utilizzata come co-solvente.
Una unità di calcolo è stata implementata per calcolare il costo di produzione per ottenere una
portata di prodotto di 30 kg/h. L’influenza della temperatura di estrazione e della pressione di
estrazione sul costo di produzione è stata analizzata. I valori operativi ottimali per l’estrazione
si sono trovati essere 300 bar, e 65°C. Si è inoltre osservato che il costo di produzione tende a
diminuire all’aumentare della pressione di separazione, fino al valore limite costituito dalla
pressione critica. Un valore ottimale si è trovato per la portata di ricircolo di anidride
carbonica di circa 30000 kg/h. Per le condizioni ottimali si sono poi calcolati i costi fissi
dell’impianto. Si è osservato che i costi fissi annualizzati contribuiscono solo per il 10% al
costo totale del prodotto. Il costo delle materie prime risulta essere quello che maggiormente
influisce sul costo totale del prodotto (50%).
Infine è stata effetuata un’analisi sulla redditività del processo. Come base di calcolo si è
considerato una vita utile dell’impianto di 10 anni con un ammortamento dei costi di impianto
di 7 anni. Si è osservato che con un tasso di interesse pari al 10 % per avere un valore attuale
netto positivo, il prezzo di vendita dell’estratto deve essere superiore a 29.8 $/kg.


Table of contents
CHAPTER 1 ............................................................................................................................... 3
1.1 Supercritical fluids and their solvent power ......................................................................... 3
1.1.1 Supercritical carbon dioxide .......................................................................................... 6
1.2 Literature review on Eruca sativa composition .................................................................... 8
1.2.1 Glucosinolates ............................................................................................................... 9
1.2.2 Polyphenols ................................................................................................................. 12
1.2.3 Fatty Acids .................................................................................................................. 14
1.3 Literature review on supercritical CO2 extraction of glucosinolates, flavonoids and fatty
acids from rocket salad ............................................................................................................. 16
1.3.1 Supercritical CO2 extraction of glucosinolates............................................................ 16
1.3.2 Supercritical CO2 extraction of phenolic compounds (flavonoids) ............................. 17
1.3.3 Supercritical CO2 extraction of lipids.......................................................................... 17
CHAPTER 2 ............................................................................................................................. 19
2.1 Pre-treatment: Lyophilization of the leaves ....................................................................... 19
2.2 Supercritical CO2 extraction process .................................................................................. 22
2.3 Soxhlet extraction ............................................................................................................... 27
2.4 Analysis of the extract ........................................................................................................ 28
2.4.1 HPLC – MS ................................................................................................................. 28
2.4.2 NMR ............................................................................................................................ 30
CHAPTER 3 ............................................................................................................................. 33
3.1 Comparison of SCF extraction with Soxhlet extraction ..................................................... 33
3.2 Optimization of the extraction parameters using ethanol as co-solvent ............................. 34
3.2.1 Effect of CO2 flow rate on the yield of the extraction ................................................ 34
3.2.2 Optimization of the ethanol dosage ............................................................................. 36
3.2.3 Effect of the pre-treatment on the yield of the extraction ........................................... 38
3.2.4 Optimization of the temperature on the extraction process ......................................... 39
3.2.5 Optimization of the pressure on the extraction process .............................................. 40
3.3 Optimization of the extraction parameters using water as co-solvent ............................... 41
3.3.1 Optimization of the water dosage ................................................................................ 42
3.3.2 Optimization of the temperature on the extraction process ......................................... 42
3.3.3 Optimization of the pressure on the extraction process .............................................. 43

3.4 Comparison between three different co-solvents ............................................................... 44
3.5 Effect of the extraction conditions on the Eruca sativa extract composition .................... 46
3.5.1 Glucosinolates ............................................................................................................. 46
3.5.2 Phenols ........................................................................................................................ 49
3.5.3 Lipids ........................................................................................................................... 53
CHAPTER 4 ............................................................................................................................. 55
4.1 Simulation model ............................................................................................................... 55
4.1.1 Aspen Plus ................................................................................................................... 57
4.2 Economical analysis of the process .................................................................................... 62
References ............................................................................................................................. 75


Preface
Rocket salad (Eruca sativa) is a vegetable herb highly consumed in Italy as a salad ingredient.
Literature overview reveals that it contains valuable health-promoting compounds.
Glucosinolates and flavonoids are present in the leaves while seeds are rich in fatty acids. All
these compounds have gained importance in recent years because of their healthy properties.
Glucosinolates are associated with lower risk of the presence of cancer and cardiovascular
disease while flavonoids are powerful antioxidants.
The aim of this thesis is to extract these compounds by supercritical fluid technology. Usually
they are extracted with solvent extraction, methanol and ethanol being the most commonly
used solvents. However they require high temperatures that can lead to the degradation of
plant tissues losing these valuable compounds. Moreover, solvent extraction requires long
residence time. In addition there are lots of legal restrictions in using these two solvents for
food applications.
Supercritical fluid extraction seems to be appropriate for this extraction as it is fast and mostly
operated at low temperatures. Moreover the solvent can be easily be separated from the
extract by simple depressurization.
In this work carbon dioxide is used as supercritical solvent and its solubility power is
modified by adding a suitable co-solvent to extract glucosinolates, flavonoids and fatty acids.
A series of experiments have been carried out in order to find also the optimum extraction
parameters including pressure, temperature, co-solvent concentration and carbon dioxide flow
rate.
In Chapter 1 an overview on the supercritical fluid extraction and a literature review on the
most valuable compounds of rocket salad and their extraction, is reported. In Chapter 2 the
materials and the methods used during the experiments are reported. In Chapter 3 are shown
the results of the experimental part and a discussion on the results are shown. In Chapter 4 a
conceptual design of a possible industrial scale application is shown. Aspen plus software has
been used for this purpose. Furthermore an economic feasibility analysis for this process is
reported.
Finally, a conclusion part with the final results is reported.


CHAPTER 1
Introduction
Supercritical fluids are substances at pressures and temperatures above their critical values.
For more than thirty years extraction using supercritical carbon dioxide has been the most
widespread application of supercritical fluids. For various reasons, such as the solubility of
the substances and the low effort required to separate the solvent after the extraction,
supercritical fluids had their first application in the food industry. In this work supercritical
carbon dioxide was used to extract valuable chemical compounds such as glucosinolates,
polyphenols and fatty acids from leaves of rocket salad (Eruca sativa).
1.1 Supercritical fluids and their solvent power
A pure component is considered to be at the supercritical state when its temperature and its
pressure are higher than the critical values. The standard phase diagram is shown in Figure
1.1, it represents the regions of temperature and pressure where the substance is present as
solid, as liquid and as gas.
These phases are separated by equilibrium phase transition lines. The three phase boundaries
meet at the triple point, where the three phases coexist. The diagram shows that the
supercritical fluid region is apart from the three standard aggregate states.
Following the gas–liquid coexistence curve, both temperature and pressure increase. The
liquid becomes less dense because of thermal expansion, and the gas becomes denser as
pressure rises.
Figure 1.1 Generalized qualitative P-T phase diagram
At critical conditions of pressure and temperature, Pc and Tc respectively, the densities of the
two phases becomes identical and there is no practically distinction between the gas and the
liquid.

4 Chapter 1
Above these conditions the substance can only be described as a supercritical fluid (Figure
1.2).
Figure 1.2 Supercritical Fluid
This transition can be better represented within the P-V diagram (Figure 1.3) (1). In the P-T
diagram heating up a saturated substance means moving up the boiling line, while in the P-V
diagram it describes the isotherms rising and increasing the pressure on both the saturated
liquid and the saturated vapor line.
Figure 1.3 Qualitative P-V diagram.
For elevated conditions, the differences in density between the two lines decline and finally
disappear approaching the critical conditions. It means that the intermolecular forces become
equal and the thermal energy becomes equal.
The isotherm of the critical temperature touches the dew point line and the bubble point line
at the critical point, exhibiting a saddle and a turning point. The critical point is also defined
by the disappearance of the heat of vaporization.
Within the supercritical region there is no phase boundary between the gas and the liquid
phases, meaning that there is a continuity in physical properties of the fluid between the gas
and the liquid states.
The most important consequence is that supercritical fluids have properties which are a
curious hybrid of those associated with liquids and gases. The viscosities and diffusivities are
similar to those of the gases, while the density is closer to that of a liquid. A unique feature of
supercritical fluids is their pressure-dependent density. If temperature is constant, density can
Introduction 5
be adjusted by pressure from that of a vapor to that of a liquid with no discontinuity.
Changing in density leads to simultaneous change of several other properties such as
viscosity, solvent power, diffusivity and dielectric constant. Similar effects to that of the
supercritical state can in some cases be achieved at near critical temperatures in the liquid
state of a substance for P> Pc and T<Tc. In this region, important changes and related
properties such as solubility are observed with small changes in pressure. These
characteristics make supercritical fluids very attractive as tunable process solvents. The
combination of high solubility and low surface tension and low viscosity is especially
attractive to extraction from solid raw materials where the target substances are deep inside
pores.
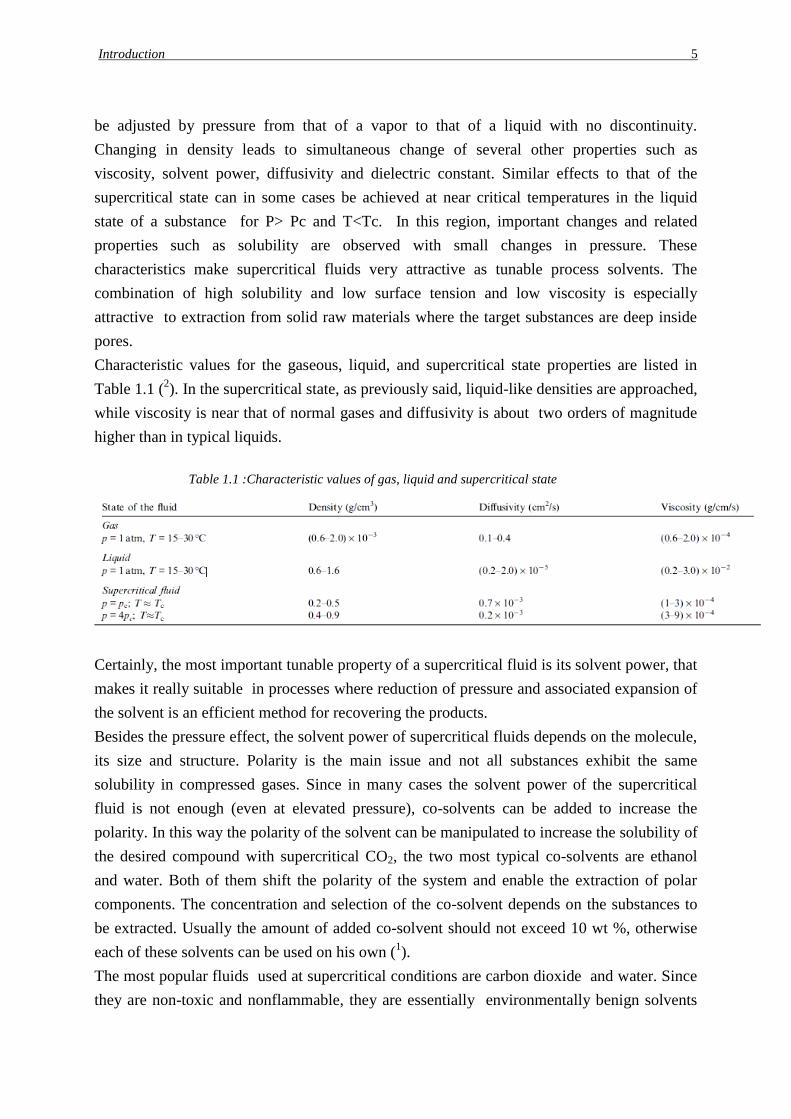
Characteristic values for the gaseous, liquid, and supercritical state properties are listed in
Table 1.1 (2). In the supercritical state, as previously said, liquid-like densities are approached,
while viscosity is near that of normal gases and diffusivity is about two orders of magnitude
higher than in typical liquids.
Table 1.1 :Characteristic values of gas, liquid and supercritical state
Certainly, the most important tunable property of a supercritical fluid is its solvent power, that
makes it really suitable in processes where reduction of pressure and associated expansion of
the solvent is an efficient method for recovering the products.
Besides the pressure effect, the solvent power of supercritical fluids depends on the molecule,
its size and structure. Polarity is the main issue and not all substances exhibit the same
solubility in compressed gases. Since in many cases the solvent power of the supercritical
fluid is not enough (even at elevated pressure), co-solvents can be added to increase the
polarity. In this way the polarity of the solvent can be manipulated to increase the solubility of
the desired compound with supercritical CO2, the two most typical co-solvents are ethanol
and water. Both of them shift the polarity of the system and enable the extraction of polar
components. The concentration and selection of the co-solvent depends on the substances to
be extracted. Usually the amount of added co-solvent should not exceed 10 wt %, otherwise
each of these solvents can be used on his own (1).
The most popular fluids used at supercritical conditions are carbon dioxide and water. Since
they are non-toxic and nonflammable, they are essentially environmentally benign solvents

6 Chapter 1
that can be used, even for food processing, without significant regulation. In addition, they are
two of the most inexpensive solvents available commercially (1).
1.1.1 Supercritical carbon dioxide
While supercritical fluids in general exhibit interesting physical properties, there is a specific
interest upon carbon dioxide due to its “easily” accessible supercritical state and its “green”
properties.
In Figure 1.4 the critical points of some fluids are represented, which have already been
utilized in technical plants using supercritical fluids (H2O, CO2, C2H4). Also chemically
similar fluids are compared, for example by their bonding (C2H2, C2H4, C2H6), or by their
molecular weights (C2H6, C3H8, C4H10, C5H12).
Figure 1.4: Critical points of some fluids
The critical point of carbon dioxide is at 7.38 MPa at 31.1 °C (3), so that means the
supercritical regime is readily accessible compare to water. Its critical point is higher than
analogous alkane. Carbon dioxide’s higher critical pressure is one result of the effect that its
strong quadrupole moment exerts on its physical properties. Carbon dioxide is non-
flammable, a significant safety advantage in using it as a solvent. The TLV (threshold limit
value for airborne concentration at 25 °C to which it is believed that nearly all workers may
be repeatedly exposed day after day without adverse effects) is 5000 ppm (4), rendering it less
toxic than other organic solvents (acetone has a TLV of 750 ppm, chloroform is 10 ppm,
pentane is 600 ppm (5)). Carbon dioxide is a greenhouse gas, but it is also a naturally
abundant material that can be theoretically extracted from the atmosphere. However, most of
carbon dioxide employed in processes is collected as a by-product of other processes as that
of ammonia production or collected from natural sources. Carbon dioxide presents also safety
disadvantages. Using it in a process certainly requires high pressure equipment, due to its high

Introduction 7
vapour pressure at room temperature. This can be a potential safety hazard relative to the
same process operating at atmospheric pressure.
Carbon dioxide can solubilise apolar components. Substances which have low molecule
weight, such as alcohols, ketones, aldehydes and esters, are the basis for flavours and are well
soluble in supercritical CO2. Less soluble substances with higher molecular weight, are amino
acids, proteins and carbohydrates (which are related to functionality). The solubility in
supercritical CO2 can be manipulated adding polar co-solvents such as ethanol, methanol or
water.
Increasing attention to environmentally friendly production, and constantly increasing
demands on product quality have forced the World Health Organization and the European
Union to publish guidelines for solvents in food production (1). Carbon dioxide is harmless
solvent, which represents an advantage compared to traditional solvent extraction.
One further advantage of using supercritical carbon dioxide is the low process temperature,
about 40 °C, at which extraction can be performed. This is specifically appropriate for food
applications where increasing temperature can damage the thermo-sensible substances.
Up to the end of 2004 approximately 90 production plants have been installed, which use
supercritical carbon dioxide.
Table 1.2 shows the distribution of industrial scale plants using supercritical fluids in the
world.
Table 1.2 : Distribution of industrial scale SFE plants
Region
Number of installed SFE
plants
Europe 45
Americas 5
Japan 17
China 9
Korea 3
India 3
Australia, New
Zeland 3
Africa 1
Extraction with SC-CO2 has been established for different applications, depending on their
target. Two are the main targets. The first one is extraction to remove a substance to refine a
raffinate, which is far larger in volume. This is the case of decaffeination of tea and coffee or
the defatting of cacao.
The second one is extraction to obtain the extract as desired product. This is the case of the
extraction of spices or fruit flavors or the extraction of milk products or fish oil components.

8 Chapter 1
1.2 Literature review on Eruca sativa composition
Eruca sativa ( in English “rocket salad”, in Italian “rucola”) is a vegetable herb of the family
of Brassicaceae. It is native to the Mediterranean region and it is really popular among
Middle Eastern and Europeans populations for its particular taste and flavour. The main
species of rucola known and cultivated are Eruca and Diplotaxis. The latter is generally
characterised by a more pungent taste. Italy is an important producer and especially the region
of Veneto in the north-east.
In the Mediterranean area rocket salad has been consumed as salad since Roman times
because of its nutritional property and especially because of its traditional benign effect on
human health. In Southern Europe and in the Middle East rocket leaves have been used as
digestion-aid, against eye infection and as deodorant and for cosmetic uses also as aphrodisiac
(6). In the Middle East also rocket salad seeds have also been used to produce an appreciated
nutritional oil.
Figure 1.5: Leaf of Rucola
This ancient knowledge has been confirmed in recent years. Plants belonging to Brassicaceae
family has gained greater importance because they possess diversified medicinal and
therapeutic properties. Various authors have studied the health promoting effects of the
chemical compounds of the members of Brassicaceae and especially that of rocket salad. In
literature the gastric anti-ulceric activity of the rocket salad is reported (7). Moreover, a
mechanism how isothiocyanates protects the organism against colon-rectal cancer (8) and the
hepatoprotective activity of members of Brassicaceae have been studied (9).
Generally, we can say that members of this family of vegetables are important for their
content of generalist (vitamin C, carotenes and phenolic) specific (glucosinolates) health
promoting compounds. (10
)
Focusing on the Eruca sativa leaves, there are many articles in the literature that report the
most valuable compounds of rocket salad. The main categories are glucosinolates and
flavonoids, which are described below.

Introduction 9
1.2.1 Glucosinolates
Glucosinolates are nitrogen- and sulfur- containing secondary metabolites that are limited to
species of the order of Capparales, which includes broccoli, rape and salad such as Eruca
sativa. Glucosinolates are also known as (z)-N-hydroximiniosulfate esters. They consist of a
common glycone group and a variable aglycone side chain R derived from amino acids (
usually methionine, phenylalanine,tyrosine and tryoptophan (Figure1.6)).
Figure 1.6 :General structure of glucosinolates
Extensive glucosinolates side chain modification and amino acid elongation are together
responsible for the chemical diversity of more than 120 reported glucosinolate structures,
which are classified as aliphatic, aromatic, w-methylthioalkyl and heterocyclic according to
the type of side chain. These hydrophilic, stable compounds are normally situated in vacuoles
of plant tissues. A damage to the tissue causing loss of cellular integrity initiates glucosinolate
breakdown by hydrolysis of the glucosidic bond catalyzed by myrosinase. Myrosinases are
specific β-thioglucosidases localized in idioblasts (myrosin cells). Thus, plant injury activates
the glucosinolate-myrosinase system, leading to the rapid generation of unstable
thiohydroximate-O sulfate intermediates. The conseguent spontaneous rearrangement yields a
variety of bioactive products which include isothiocyanates, thiocyanates, nitriles,
oxazolidine-2, thiones or epithioalkanes. The final composition depends on chemical
conditions such as pH, available ferrous ions and presence of protein interacting with
mirosinase. Figure 1.7 refers not to rocket salad but to Arabidopsis thaliana, another plant of
the same family that presents the glucosinolate – mirosinase system better explains this
sequence. (11
)

10 Chapter 1
Figure 1.7:Glucosinolate-myrosinase system. Upon plant injury, glucosinolate released
from vacuoles are hydrolyzed and the aglucone intermediate rearrange to form
(1)Isothiocynates at pH5-8;(2) nitriles and elementar sulfur if guided by ethiospecific
protein or at pH2-5 in presence of Fe ions; (3) thiocyanates at pH >8; (4) oxazolidine-2-
thiones if a hydroxyl function is present on carbon 3 of the glucosinolate; (5)epithionitriles
if a terminal double bond captures elemental sulfur released during nitriles formation.
These degradation products of glucosinolates have an important role in plant defense against
herbivores and pathogens because of their biocidal activities. For these reasons glucosinolates
are not uniformly distributed on the leaf, but are concentrated on the mid vein (12
).
Humans frequent consumption of high glucosinolate content vegetables is associated with a
lowered risk of cancer and cardiovascular disease. Interestingly, one of the most concentrated
glucosinolate present in leaves of Eruca Sativa is glucoraphanin which is generated after
hydrolysis sulphoraphane. This is recognized as the most effective compound which promotes
the liver to produce enzymes that detoxify cancer–causing chemicals, especially those
connected to chemically induced breast cancer and colon cancer (13
). Anti-carcinogenic
properties of glucosinolates and their associated hydrolytic products, isothiocyanates, have
been shown in literature (14,15,16
).
It has been shown that the major glucosinolate present in rocket leaves is 4-
mercaptobutylglucosinolate (glucosativin), probably derived from S-demethyalkylation of 4-
methylthiobutylglucosinolate (glucoerucin). This glucosinolate is associated to the
characteristic pungent taste and flavor of this herb, that is different from other Brassicaceae
(17
). Other main glucosinolates have been identified in rocket plant, including 4-(β-D-
glucopyranosyldisulfanyl) butyl glucosinolate (18
), 4-methylthiobutyl glucosinolate
(glucoerucin) mainly in seeds and roots (19
), and 4-methylsulfinylbutyl gucosinolate
(glucoraphanin) mainly in flowers (20
).
A complete report of the glucosinolates identified in rocket leaves ( both species Eruca stiva
and Diplotaxis ) in literature and compared to the previous authors is shown in Table 1.3 (9).

Introduction 11
The extraction has been done using methanol, and the identification of glucosinolates has
been done by HPLC-DAD-ESI-MS. Eight desulfoglucosinolates has been identified from
their protonated molecular ions [M+H]+ and two main product ions, corresponding to the
adducts [M+Na]+ and [M+K]
+ compared to literature information.
Table 1.3 :Identification of desulphoglucosinolates of Eruca and Diplotaxis
The 8 glucosinolates identified can be classified as four aliphatic-derived (glucoraphanin,
glucoalysiin, glucoerucin and progitrin/epiprogoitrin), one aromatic (glucosinalbin), two
indole-derived compounds (4-OH-glucobrassicin and glucobrassicin) and two structurally
related compounds containing one intermolecular disulfide linkage (4-
[βglucopyranosyldisulfanuy] butyl glucosinolate and dimeric 4-mercaptobutylglucosinolate.
The quantitative analysis results of glucosinolate content referred to the previous table is
shown in the following Table 1.4 (9).

12 Chapter 1
Table 1.4 :Total glucosinolate content of individuals compoundin in Eruca (SR) and Diplotaxis
(WR)
The total average glucosinolate content is 1642.2 mg/kg D.W., and ranged from 756.0 to
2459.0 mg/kg D.W. and from 1164.2 to 3031.1 mg/kg D.W. for Eruca and Diplotaxis
respectively. DMB-GLS is taken in consideration for the total and relative GLS
quantification. The aliphatic glucosinolates are predominant representing over 60% of total
glucosinolates. The main components are glucoarephanin, DMB-GLS and glucoerucin.
Glucoaraphanin (A) ranged from 17.6% to 63 %, has the highest relative percentage. DMB-
GLS (M) together with (4GDB-GLS) ranged from relative percentage12% to 49.5 %.
Glucoerucin (H) relative content ranged from 7.7 % to 28.1 %. Indole (4-OH-glucobrassicin,
F, and glucobrassicin, L) and aromatic (glucosinalbin, D) represent a lower part of total
glucosinolate composition.
1.2.2 Polyphenols
Tissues of rocket salad contain significant concentrations of flavonoids. Flavonoids are a class
of plant secondary metabolites, that are mostly distributed in fruits, vegetables and the leaves

Introduction 13
of herbal plants. Moreover, they are the most important plant pigments for flower coloration
(their name derives from the Latin word “flavus” meaning yellow, their colour in nature).
Flavonoids are polyphenolic compounds that are often added to medicines as antioxidants.
They can significantly reduce damage associated with conditions such as cancer and
cardiovascular disease (21
). For example, flavonoids are poorly absorbed in the proximal
gastrointestinal tract and are therefore likely to reach the colon in substantial quantities,
protecting the colonic epithelium from free radical attack (22
). They nuclear structure
comprise two benzene rings connected by a pyrene ring containing oxygen. Usually, they are
classified into sub groups including flavonols, flavones, flavanols, flavanones, and
isoflavones based on the additional presence of a C2-C3 double bond, hydroxyl, methoxy
groups, glycoside, and different positions of molecules. A classification is shown in Table 1.5
(23
).
Table1.5 : Classification of flavonoids from plants according to their skeletal
foumula.
The identification of the polyphenolic compounds in the rocket salad was found in literature
(9). It was based on chromatographic behavior, mass spectra obtained under electon spry
ionization (ESI) conditions and comparison with literature. The results are shown in table 1.6
for both the species of rocket salad, Eruca and Diplotaxis.
14 Chapter 1
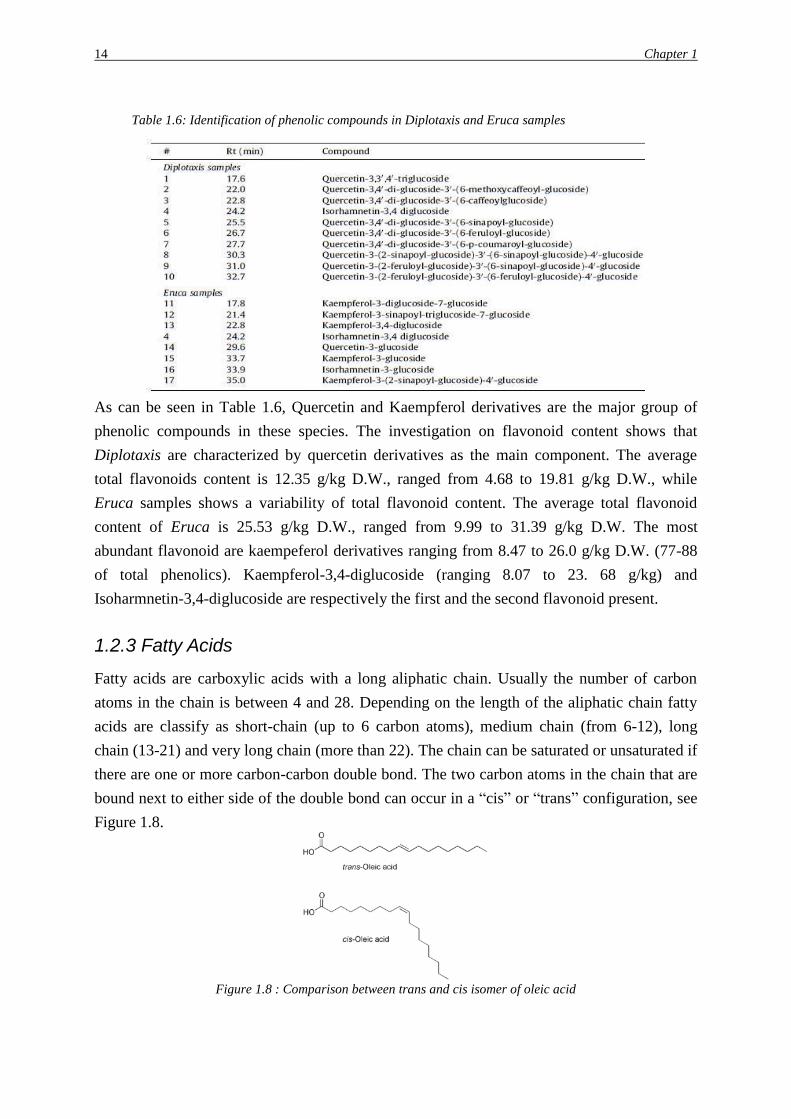
Table 1.6: Identification of phenolic compounds in Diplotaxis and Eruca samples
As can be seen in Table 1.6, Quercetin and Kaempferol derivatives are the major group of
phenolic compounds in these species. The investigation on flavonoid content shows that
Diplotaxis are characterized by quercetin derivatives as the main component. The average
total flavonoids content is 12.35 g/kg D.W., ranged from 4.68 to 19.81 g/kg D.W., while
Eruca samples shows a variability of total flavonoid content. The average total flavonoid
content of Eruca is 25.53 g/kg D.W., ranged from 9.99 to 31.39 g/kg D.W. The most
abundant flavonoid are kaempeferol derivatives ranging from 8.47 to 26.0 g/kg D.W. (77-88
of total phenolics). Kaempferol-3,4-diglucoside (ranging 8.07 to 23. 68 g/kg) and
Isoharmnetin-3,4-diglucoside are respectively the first and the second flavonoid present.
1.2.3 Fatty Acids
Fatty acids are carboxylic acids with a long aliphatic chain. Usually the number of carbon
atoms in the chain is between 4 and 28. Depending on the length of the aliphatic chain fatty
acids are classify as short-chain (up to 6 carbon atoms), medium chain (from 6-12), long
chain (13-21) and very long chain (more than 22). The chain can be saturated or unsaturated if
there are one or more carbon-carbon double bond. The two carbon atoms in the chain that are
bound next to either side of the double bond can occur in a “cis” or “trans” configuration, see
Figure 1.8.
Figure 1.8 : Comparison between trans and cis isomer of oleic acid

Introduction 15
A “cis” configuration means that the hydrogen atoms are on the same side of the double bond,
while a trans configuration means that the next hydrogen atoms are on the opposite sides of
the double bond. Naturally sources of fatty acids are rich in “cis” isomer.
The differences in geometry between the various types of unsaturated fatty acids, as well as
between saturated and unsaturated fatty acids, play an important role in biological processes.
A fatty acid chain is monounsaturated if it contains one double bond, and polyunsaturated if it
contains more than one double bond. There are called essential fatty acids, since human must
ingest because the body is not able to synthesize them (only two acids are essentials alfa-
linoleic acid and linoleic acid). In cellular metabolism, unsaturated fatty acids contain less
energy than the correspondent saturated acid (which has already the maximum of hydrogen
atoms bond). The greater the degree of unsaturation in a fatty acid (number of double bonds),
the less energy is required for its degradation.
The study of importance on unsaturated fatty acids for human health has gained more and
more importance in recent years. Unsaturated fats helps to lower levels of total cholesterol
and LDL (low density lipoprotein) in the blood, and are known to prevent cardiovascular
disease. Examples of unsaturated fats are palmitoleic acid, oleic acid, myristoleic acid,
linoleic acid, and arachidonic acid. Foods containing unsaturated fats include avocado, nuts,
and vegetable oils such as canola and olive oils.
In literature, the identification of fatty acids in rocket leaves has not been reported. However,
the composition of the seed-oils of rocket is available. The oil content and the fatty acids
composition of the Eruca sativa seeds is shown in Table 1.7 (6).
Table 1.7 : Fatty acids content and composition of Eruca Sativa lines
Oil content varies from 24.5 to 29.2 %, depending on the origin of the herb. Eruca sativa as a
member of Brassicaceae contains erucic acid (C22:1), a fatty acid unique to seed oils which
varies from 33 to 47 %. For Italian origin rocket salad, its concentration is average 43 %.

16 Chapter 1
Linolenic (C18:3) and oleic (C18:1) are also present with an average content of 15.9 and
15.1%. Eicosenic stearic and palmitic are present in lower quantity.
The ratio of mono-unsaturad fatty acids (oleic, C18:1; eicosenoic C20:1 and erucic, C22:1) to
polyunsaturated fatty acids (linoleic, C18:2; and linolenic, C18:3) is shown in Table 1.8 .
Table 1.8 : Ratio of monounsaturated/polyunsaturated fatty acids in Eruca
sativa lines
1.3 Literature review on supercritical CO2 extraction of
glucosinolates, flavonoids and fatty acids from rocket salad
Since literature is not particularly furnished with works on the supercritical CO2 extraction of
the compounds from rocket salad, a review on the supercritical extraction of the same
compounds from other vegetables is reported. Methods and results of these works are briefly
shown below.
1.3.1 Supercritical CO2 extraction of glucosinolates
Glucosinolates have been extracted with supercritical CO2 from canola meal (24
). Canola is
the major oilseed crop grown in Canada. It belongs to the same family of rocket salad
(Brassicaceae). Canola is mainly utilized because of its oil, the residual meal is a valuable
source of protein and it is used as animal feed (24
). Since glucosinolates are toxic for
herbivores they have to be removed from the meal.
The supercritical CO2 extraction has been performed at 70°C and 40 MPa for 6 hours. The
extraction cell has been loaded with 10 g of meal. The flow rate of CO2 have been maintained
at 1 L/min and added continuously with ethanol (20 % w/w). The glucosinolate contents of
the canola meals extracted with SCCO2 was 5.6-6.8 µmol/g, while glucosinolates available
was 6.9-7.96 µmol/g.
Introduction 17
1.3.2 Supercritical CO2 extraction of phenolic compounds (flavonoids)
Since flavonoids are widely distributed in fruits, vegetables and plants, and being their
healthy properties well known, their extraction with supercritical CO2 has been performed by
several authors at various experimental conditions.
For example, supercritical CO2 extraction of flavonoids has been performed on leaves of
Strobilanthes crispus (25
). This is a vegetable herb commonly consumed in a form of herbal
tea, proven to possess antioxidant activity and anticancer properties (26,27
), for whom was
identified the optimum processing variables for the supercritical CO2 extraction. The optimum
values of pressure, temperature and extraction time were respectively 200 bar, 50°C, and 60
min. The initial plant material was 30 grams and the flow rate of CO2 and co-solvent
(ethanol) were maintained at 10 and 1 g/min, respectively. The optimum yield (mass of
extract / mass of feed) was 5.17 % with a flavonoids content of 3.98 % (mg of flavonoids /
mg of extract). Supercritical CO2 extraction of flavonoids has also been performed on leaves
of Ginkgo biloba. In literature (28
) 90 grams of dry Gingko powder were extracted at 60°C and
31.2 MPa. The solvent was a mixture of SC-CO2 and ethanol (10 mol %). The final yield was
8 % (mass of extract / mass of feed) with a flavonoids content of 183 µg / g.
1.3.3 Supercritical CO2 extraction of lipids
In literature supercritical fluid extraction of lipids from leaves of rocket salad is not reported.
However, supercritical fluid extraction has been performed to extract lipids from leaves of
broccoli (Brassica oleracea L. var. Italica). This is a vegetable that belongs to the family of
Brassicaceae, that includes also rocket salad. Supercritical fluid extraction of lipids from
broccoli leaves has been performed in literature (29
). Lipids were extracted using pure CO2
obtaining the best results at 60° C, 300 bar, 3mL/ min and an extraction time of 90 min. Since
at these conditions the more polar fraction of lipids remain in the residual material, another
extraction has been performed employing a co-solvent. Methanol was used as co-solvent
obtaining the maximum of yield with 15 % methanol. Twenty-three fatty acids were identified
in the extracts. Among them, α-linoleic, linoleic and palmitic acids were the most abundant
(29
).


CHAPTER 2
MATERIALS AND METHODS
Raw material samples have been freeze-dried before extraction tests, to reduce the water
content. Supercritical carbon dioxide extraction has been done using a supercritical extraction
laboratory plant. An extraction with a Soxhlet apparatus has been performed too. The extracts
have been analysed using HPLC-MS and NMR.
2.1 Pre-treatment: Lyophilization of the leaves
Leaves of rocket salad have been bought in a local market. Water content in the raw leaves
has been reported to be around 91 wt. % (30
). Water can interfere with extraction, hence a pre-
treatment is required to dry the leaves. Usually drying methods use high temperatures that can
damage the internal structure of biological compounds. In order to keep the internal structure
of the leaves intact, lyophilization seems to be the most appropriate technique.
This process, also known as freeze-drying is a dehydration method that works by freezing the
material and then reducing the pressure to allow to the frozen water in the material
to sublimate directly from the solid phase to the gas phase. Freeze-drying does not usually
cause shrinkage or toughening of the material being dried. In addition, flavours, smells and
nutritional content generally remain unchanged, making the process popular for preserving
food. However, water is not the only chemical capable of sublimation, and can be losses of
other volatile compounds such as acetic acid and alcohols can occur.
Freeze-drying is mostly used in pharmaceutical and food industry to increase the shelf life of
the products. Preservation is possible because the greatly reduced water content inhibits the
action of microorganisms and enzymes that would normally spoil or degrade the substance.
Moreover, foods which are lyophilized can usually be stored without refrigeration, which
results in a significant reduction of storage and transportation costs. Another advantage of
using this technique of dehydration is that freeze-dried products can be rehydrated much more
quickly and easily because the process leaves microscopic pores. The pores are created by the
ice crystals that sublimate, leaving gaps or pores in their place. Lyophilisation does not
significantly reduce volume, therefore water quickly regains its place in the molecular
structure of the food or product.

20 Chapter 2
The stages of dry freezing are shown in the diagram of state reported in Figure 2.1 (31
).
Figure 2.1: Water P-T phase diagram
Generally, the first stage is a pre-treatment of the product before freezing. This may include
concentrating the product, formulation revision (i.e., addition of components to increase
stability and/or improve processing), decreasing a high vapour pressure solvent or increasing
the surface area. In our case, the raw leaves of rocket salad were milled to increase the surface
area.
The second stage is freezing. The sample was placed in a freeze-drying flask and rotated in a
bath, called shell freezer, cooled by liquid nitrogen. To allow the sublimation to occur rather
than melting, in this step is important to go below the triple point. This stage is the most
critical of the freeze-drying process. The freezing temperature is about −50 °C .
The third stage is primary drying. During this step the pressure is lowered to a few millibar
and enough heat to allow water to sublime is supplied to the sample. The heat is brought by
conduction or radiation. About 95% of the water is sublimated. This step is very slow and
can require several days. Increasing the heat supplied to lower the time could lead to the
degradation of the biological material. In this stage pressure is controlled through the
application of partial vacuum. Moreover, a cold condenser chamber and condenser plates
provide a surface for the water vapour to solidify on. Condenser temperatures are below -
50°C.
The secondary drying is usually added as a further stage. In this step the unfrozen water
molecules are removed, the temperature is raised higher than in the primary drying phase, and
can even be above 0 °C, to break any physico-chemical interactions that have formed between
the water molecules and the frozen material. Usually the pressure is also lowered in this stage
to encourage desorption (typically in the range of microbars, or fractions of a pascal).
An image of an apparatus for dry-freezing process is shown in Figure 2.2.

Materials and methods 21
Figure 2.2: Freeze-drying equipment
Two components are common to all types of freeze-dryers: a vacuum pump to reduce the
ambient gas pressure in a vessel, containing the substance to be dried, and a condenser to
remove the moisture by condensation on a surface cooled until −40 to −80 °C.
After the dry-freezing process is completed the water content in our samples of rocket salad
was about 4%, as was measured by gravimetric analysis.
A mechanical pre-treatment was also done. Dried leaves were grinded using a ceramic pestle
to reduce their particles dimension (Figure 2.3).
Figure 2.3:Pestle
After that, particles were filtered with a metallic sieve characterized by dimension of pores of
0.5 mm.
22 Chapter 2
2.2 Supercritical CO2 extraction process
The experimental extraction work has been carried in the High-Pressure Laboratory of
Industrial Engineering Department. The materials that have been used include:
Leaves of rocket salad after pre-treatments (lyophilisation and mechanical milling)
Carbon dioxide (99.998 %, gas cylinder of 50 L and 40 kg of carbon dioxide, Rivoira)
Ethanol (99.5 %, Sigma Aldrich)
Methanol (99.8 % Sigma Aldrich)
Ultrapure water ( Milli-Q, filtered by a 0.22 µm membrane )
The process is operated in a batch mode. The extraction cell is charged with the solid sample
to be extracted. Then supercritical fluid added with co-solvent flows through the fixed bed
and extracts the soluble molecules. The extract is then separated from the supercritical solvent
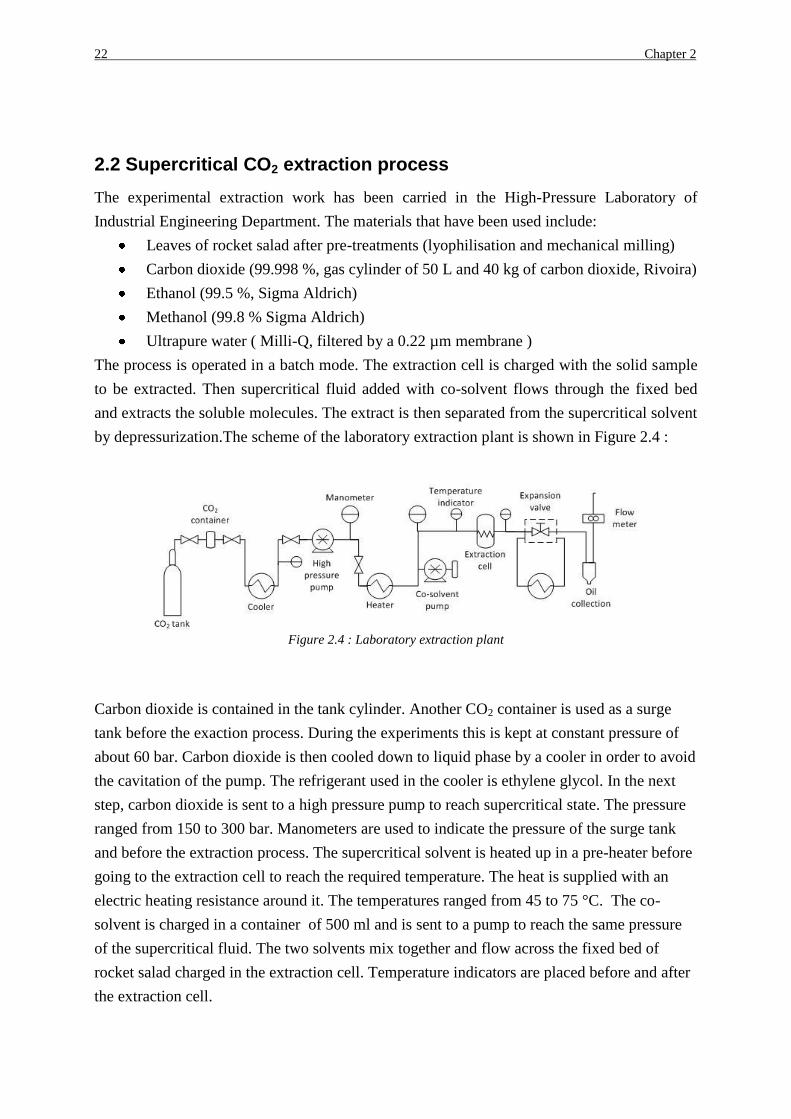
by depressurization.The scheme of the laboratory extraction plant is shown in Figure 2.4 :
Figure 2.4 : Laboratory extraction plant
Carbon dioxide is contained in the tank cylinder. Another CO2 container is used as a surge
tank before the exaction process. During the experiments this is kept at constant pressure of
about 60 bar. Carbon dioxide is then cooled down to liquid phase by a cooler in order to avoid
the cavitation of the pump. The refrigerant used in the cooler is ethylene glycol. In the next
step, carbon dioxide is sent to a high pressure pump to reach supercritical state. The pressure
ranged from 150 to 300 bar. Manometers are used to indicate the pressure of the surge tank
and before the extraction process. The supercritical solvent is heated up in a pre-heater before
going to the extraction cell to reach the required temperature. The heat is supplied with an
electric heating resistance around it. The temperatures ranged from 45 to 75 °C. The co-
solvent is charged in a container of 500 ml and is sent to a pump to reach the same pressure
of the supercritical fluid. The two solvents mix together and flow across the fixed bed of
rocket salad charged in the extraction cell. Temperature indicators are placed before and after
the extraction cell.

Materials and methods 23
The extraction cell is a carbon steel cylinder made up of two screwed parts (Figure 2.5). The
cylinder has a diameter of 5 cm and is long 11.5 cm. The thickness of the walls is 1 cm.
Figure 2.5: Extraction Cell
The right side of the Figure 2.5 shows the upper part with the inlet, while the left part shows
the lower part with the outlet. The part on the right side is screwed with the left part leaving
the emptiness of the solid chamber. The solvent flows through the hollow tube of small
diameter (0.5 cm) from the upper part to the lower part.
The solid chamber is made up of the not threaded part, which includes the inner cylinder of
1.5 cm of diameter and the bigger cylinder of 3 cm of diameter. The solid is charged in the
inner cylinder which is 1.5 cm long with a diameter of 1.5 cm, while the other cylinder is
filled with a Teflon ring. A rubber o-ring gasket is wrapped around the tip of the upper part to
avoid pressure losses.
The mass of solid charged in our tests was 0.49±0.05 g. In order to avoid particle losses
during the extraction a filter is put before the outlet. The filter is made up of two layers: an
acetate membrane with pores of 0.22 µm to avoid losing particles and a metal mesh of
diameter of 0.5 mm as support of the membrane at high pressures. The filled and assembled
extraction cell is easily secured in the plant with two bolts and nuts (nominal hole diameter D
of 9/16). The extraction cell is also insulated with a layer of fiberglass collected by an
aluminum sheet to avoid thermal losses.
The temperature of the extraction cell is controlled by an electric resistance wrapped around
the cell and connected to a temperature controller. Another temperature indicator is placed
downstream of the extraction cell.
After the extraction cell, the loaded supercritical solvent added with co-solvent passes through
the expansion valve. Hence the pressure is reduced to 1 atmosphere. Since the fluid is below
the inversion temperature of carbon dioxide, the Joule-Thomson coefficient is positive, that
means that the gas cools down when expands. The valve can be frozen, hence a heater is

24 Materials and methods
required. For this purpose, the valve was immersed in a bath with recirculating warm water at
about 45 °C.
The separation process takes place after the throttling valve, where carbon dioxide passes to
gas phase and it is completely removed from the extract. The extract with the co-solvent is
recovered and collected in a plastic flask. A small amount of solvent was placed in the plastic
flask to recover the extract. Carbon dioxide goes to a volumetric flow rate meter and then to a
displacement volumetric meter. Carbon dioxide flow rate is controlled with the opening
degree of the valve. In the following Figure 2.6 a view of the plant is shown.
Figure 2.6 :View of the laboratory extraction plant
In the experimental tests the yield of the extraction was calculated as:
(2.1)
Tests have been carried out at different experimental conditions in order to find out the
highest yield of the extraction.
The extraction experimental procedure is:
1. 0.5 g of solid sample are weighted.
2. The filter is put in the extraction cell.
3. The extraction cell is charged with the solid and the Teflon ring and then assembled.
4. The cooler is switched on.
5. The thermostatic bath of the valve is turned on.
6. The extraction cell is secured in the plant with two bolts and nuts.
Materials and methods 25
7. After the cooler temperature is enough to liquefy the CO2 (5 °C), the valve of the CO2
cylinder can be opened and CO2 can flow to the pump.
8. A mixture of soap and water is sprinkled on the extraction cell for the leak test.
9. The valve upstream the extraction cell is opened and CO2 is allow to flow in the
extraction cell.
10. The set point of the CO2 pump is fixed and the pump is switched on.
11. If leakages are present the mixture of soap and water will swell an bubbles will be
seen. Then the pump have to be switched off, the valve upstream the extraction cell has
to be closed, while the valve downstream the extraction cell has to be opened to
depressurize the cell. The extraction cell has to be better secured to the plant (a layer of
Teflon wrapped on the bolts and nuts can be a good solution). The procedure has to be
repeated from number 7.
12. If there are not leakages the extraction cell can be pressurized until the desired
pressure. Supercritical carbon dioxide permeates the solid in the cell and solubilize the
low weight apolar components. The pump is then switched off, the valve upstream is
closed and the valve downstream is opened to allow the depressurization of the
extraction cell. The solubilized components are recovered in the separator. This is also
a pre-treatment for the following extraction, hence supercritical CO2 is permeated in
the solid after depressurization and subsequently expansion the cells are broken and the
following solvent can more easily access and solubilize the desired components.
13. The valve downstream the extraction cell is closed and that upstream is opened.
14. Temperature controllers are turned on.
15. The pump is turned on.
16. The extraction cell is pressurized so the downstream valve can be opened.
17. When the desired conditions of pressure and temperature are reached the co-solvent
pump is turned on the same pressure of the supercritical CO2: hence the two solvents
can mix and flow to the extraction cell.
18. The chronometer is started : Beginning of the experimental test.
19. Each 10 minutes the collected extract is recovered in a test tube, and the carbon
dioxide consumed is registered as reported in the displacement volumetric meter.
20. After 1 hour of extraction, 6 test tubes are collected.
21. The chronometer is stopped : End of the experiment test.
22. Both the pumps are switched off and the valve upstream the extraction cell is closed.
23. Temperature controllers are switched off.
24. The cooler is switched off and the valve of the cylinder tank is closed.
25. The valve downstream the extraction cell is fully opened to allow a complete
depressurization.

26 Materials and methods
26. After being cooled at environmental conditions, the extraction cell can be removed
from the plant, cleaned , and ready for a new extraction.
After the extraction has been performed, there are 6 test tubes containing the oil extracted plus
the co-solvent added. Figure 2.7 shows the samples collected during an experiment carried
out in our laboratory.
Figure 2.7: Extracted samples
Then a separation process is required. To achieve this target, a rotary evaporator is used
(Figure 2.8)
Figure 2.8 : Rotary evaporator
This device is mainly made up of a heating bath and a condenser. The extract added with the
solvent to be separate is put in a flask. This is immersed in a heating bath that has to heat up
enough to allow the solvent in the sample to evaporate. The sample is rotated by a drive unit
in order to allow a uniform distribution of the heat in the sample. A vacuum pump is
connected to allow evaporation at lower temperatures. After being evaporated, the solvent
flows in the condenser, where cold water flows continuously. The vapor is then condensed

Materials and methods 27
and completely recovered in the collection flask. Therefore only the extract remains in the
evaporation flask, attached to the walls of the flask.
The temperatures set in the heating bath depend on the boiling temperature of the solvent to
be separate and also on the temperature tolerated by the substance extracted before its
degradation. Usually, to separate ethanol and methanol 48 °C has been set. To separate water,
a temperature of 70 °C has been used.
To calculate the amount of extract this procedure is followed :
1. The empty flask (or matrass) is weighted.
2. The first sample is poured in the empty flask.
3. The flask is put in the rotary evaporator until the solvent is completely evaporated and
the extract is precipitated.
4. The flask is weighted. The amount of the extract is calculated as the difference
between this weight and the previous one.
5. The second sample is poured in the same flask.
6. The flask is put in the rotary evaporator until the solvent is completely evaporated and
the extract is precipitated.
7. The flask is weighted.
8. The same steps from 5 to 7 are repeated until the last sample is done.
The difference between the final weight and the empty flask represents the total amount of oil
extracted.
The experimental values of the yield vs mass of cumulated CO2 are plotted. An empirical
model is used to fit the data. The equation of the model is :
(2.2)
Where Y = mass of oil extracted / mass of initial solid, X = mass of CO2 / mass of initial solid
and K1, K2 re adjustable parameters.
The cumulated mass of CO2 used during the experiment is calculated multiplying the
volumetric value from the displacement volumetric meter per the density of carbon dioxide
(1.98 kg/m3) at each experimental step and make the cumulative.
2.3 Soxhlet extraction
To compare the results obtained with the supercritical fluid extraction with a classical solvent
extraction, a Soxhlet extraction has also been performed.
A typical apparatus is shown in the following Figure 2.10.

28 Materials and methods
Figure 2.10 : Soxhlet extraction apparatus.
The apparatus is made up of three parts: a round bottom flask, the “soxhlet” extractor, and a
condenser. The solvent is placed in the round bottom flask and is heated to allow its complete
evaporation. A mixture of methanol and water 70:30 v/v has been used as solvent, heated at
100°C. The vaporized solvent flows to the condenser (the yellow path in figure 2.10), where
coolant water flows continuously. The solvent condenses and falls to the “soxhlet” extractor.
Here the solid to extract is placed in a paper thimble. The solvent is extracted from the solid
and passes through the thimble wall (the green path in Figure 2.10). The extract is finally
collected in the round bottom flask. The Soxhelt extraction was carried out for 20 hours.
2.4 Analysis of the extract
The extracted samples were analyzed in a laboratory of the Department of Pharmaceutical and
Pharmacological Science. The identification and the content of glucosinolates, flavonoids and
fatty acids were measured employing two techniques: HPLC-MS and NMR.
2.4.1 HPLC – MS
Liquid chromatography–mass spectrometry (LC-MS, or high performances liquid
chromatography HPLC-MS, is an analytical chemistry technique that combines the physical
separation abilities of liquid chromatography with the mass analysis capabilities of mass
spectrometry (MS). It is generally used to separate, generally detect or to identify chemicals

Materials and methods 29
of particular masses in presence of other chemicals. Principally, it is used to identify a natural
product from a natural product extract or a pure substance from a mixture of other
intermediates.
HPLC is a liquid chromatography separation technique that operates at relatively high
pressures. As in liquid chromatography there is a mobile phase and a stationary phase. The
sample is forced by a liquid at high pressures (mobile phase) through a column that is packed
with a stationary phase composed by irregularly or spherically shaped particles depending on
the separation target to achieve. Depending on the stationary phase and on the polarity of the
mobile phase two methods of HPLC can be used. For reversed phase liquid chromatography
(RP-LC) octadecylsyl (C18) is used as stationary phase with organic-water mixture as mobile
phase (water-acetonitrile and water-methanol). For normal phase liquid chromatography
(NP-LC) silica gel is used as stationary phase with organic mixtures. Usually, the former is
used as the means to introduce samples into the mass spectrometry. The flow used in the
standard column (4.6 mm bore diameter) has to be split before sent to the column (10:1). The
mass spectrometry will give improved sensitivity at flow rates of 200 μL/min or less.
Mass spectrometry is an analytical technique that measures the mass to charge ratio of
charged particles. MS works by ionizing chemical compounds to generate charged molecules
or molecule fragments and measuring their mass-to-charge ratios. It is used for determining
masses of particles for elucidating the composition of a sample or the structure of a molecule .
A typical HPLC-MS coupling is shown in Figure 2.11.
Figure 2.11 Example of HPLC-MS coupling
The component of the sample separated in the HPLC is vaporized and then ionized by
inductive coupled plasma (ICP) or other techniques, to produce ions. The ions are separated
according to their mass-to-charge ratio in an analyzer by electromagnetic fields. The ions are

30 Materials and methods
detected by a quantitative method (e.g quadrupole) and the signal is processed into mass
spectra.
In this work, HPLC–MS measurements were obtained on a Varian 212 series chromatograph
equipped with Prostar 430 autosampler and MS-500 Ion Trap as detector. MS spectra were
recorded in positive and in negative ion mode (50–2000 Da). The APCI ion source was used
for lipid analysis while the ESI was used for phenolic and glucosinolates. Fragmentation of
the main ionic species were obtained during the HPLC run by the turbo data depending
scanning (tdds) function, yielding in fragmentation pattern of eluted compounds. As
stationary phase Agilent Zorbax C-18 (2.1 × 150 mm) 3.5 μm was used. As mobile phases
solvent A (water 0.1% formic acid) and solvent B (methanol) were utilized. The solvent
gradient started at 80% A then decreased to 0% A over 30 min.
2.4.2 NMR
Nuclear magnetic resonance is a research technique that exploits magnetic properties of some
atomic nuclei to determine physical and chemical properties of molecules in which they are
contained. NMR make use of the phenomenon of nuclear magnetic resonance, the
intramolecular magnetic field around an atom in a molecule changes the resonance frequency,
revealing the electronic structure of a molecule. In H-NMR when a magnetic field is placed,
1H (hydrogen1isotope) nuclei absorb electromagnetic radiation at a frequency characteristic
of the isotope. The resonant frequency , energy of absorption , and the intensity of the signal
are proportional to the strength of the magnetic field. NMR spectra are unique and clearly
determined. Different functional groups evidently distinguishable , furthermore identical
functional groups with different neighbors substituents still give distinct signals.
The indicators used to assign a molecule are chemical shifts and spin-spin couplings. The
variations of nuclear magnetic resonance frequencies of the same kind of nucleus (1H), due to
variations in the electron distribution, is called the chemical shift. In a magnetic field nuclei
that possess a magnetic moment (nuclear spin) give rise to different levels of energy an
resonance frequencies. The electron distribution of the same type of nucleus (1H) depends on
the local geometry (neighbors, bond length , angle between bonds…) and on the local
magnetic field of each nucleus. This is exhibited in the variance of level of energy and the
variance of resonance frequencies. Chemical shifts values are expressed in ppm.
Chemical shift is not the only indicator. Nuclei themselves possess a small magnetic field:
they influence each other changing the energy and the resonance frequency. This is known as
spin-spin coupling. The coupling constant is independent of magnetic field strength because it
is caused by the magnetic field of another nucleus. Therefore it is quoted in hertz (frequency)
and not ppm (chemical shift).
Materials and methods 31
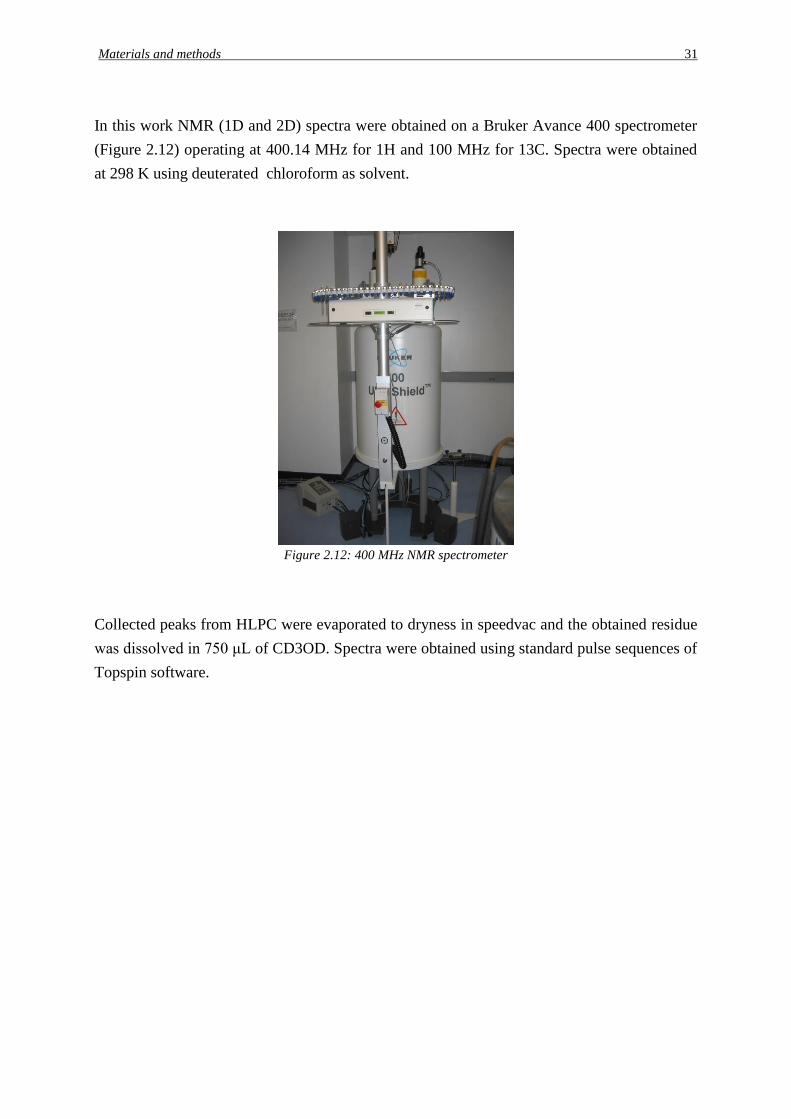
In this work NMR (1D and 2D) spectra were obtained on a Bruker Avance 400 spectrometer
(Figure 2.12) operating at 400.14 MHz for 1H and 100 MHz for 13C. Spectra were obtained
at 298 K using deuterated chloroform as solvent.
Figure 2.12: 400 MHz NMR spectrometer
Collected peaks from HLPC were evaporated to dryness in speedvac and the obtained residue
was dissolved in 750 μL of CD3OD. Spectra were obtained using standard pulse sequences of
Topspin software.


CHAPTER 3
Results and discussion
The optimum values of the extraction parameters of the extraction have been investigated,
and different co-solvents have been used for enhancing supercritical CO2 extraction. The
yields obtained have been compared to the solvent extraction technique. The extract have
been analyzed to identify the desired compounds and their content.
3.1 Comparison of SCF extraction with Soxhlet extraction
Solvent extraction using Soxhlet apparatus has been performed in order to compare the results
obtained with supercritical fluid extraction. SC-CO2 extraction has been performed with the
constant values of temperature, pressure, carbon dioxide flow rate using three different co-
solvents : ethanol, methanol, water. Table 3.1. shows the conditions at which the prelimiray
tests have been performed.
Table 3.1 : SC-CO2 parameters for comparison of different methods.
Pressure (bar) 300
Temperature (°C) 45
CO2 flow rate (kg/h) 0.3
Co-solvent conc. (wt %) 7
Soxhlet extraction has been carried out at 100 °C, using a mixture of methanol and water
(70:30 v,v). The different yields obtained using both Soxhlet and SC-CO2 extraction are
compared in Figure 3.1. As can be seen, the extraction yield using an organic solvent in the
Soxhlet apparatus is higher than that of the supercritical fluid extraction.
Supercritical carbon dioxide used without a co-solvent yields only 1.5%. Adding co-solvents
leads to enhancement the extraction yield. In this study polar co-solvents were added since
some of the components of interest are polar.
The results obtained with ethanol and methanol are similar 5.54% and 5.56%, respectively.

34 Chapter 3
Higher amount of extract are obtained using water as co-solvent with respect to ethanol and
methanol yields. This will be better explained in the following sections. At 45°C and 300 bar
the yield obtained by supercritical fluid extraction using water as co-solvent is 21.71%.
Figure 3.1: Comparison of the yields (% )obtained by SC-CO2 with different co-solvents
and by Soxhlet.
The enhancement of the amount of extract obtained with Soxhlet is probably related to the
higher extraction temperature. The higher the temperature, the more cell walls are broken
down, allowing the solvent to access to the compounds, solubilize them and extract them
more easily.
3.2 Optimization of the extraction parameters using ethanol as co-
solvent
In literature, ethanol is certainly the most often used co-solvent employed to increase the
polarity of supercritical carbon dioxide. Since it is slightly polar, it can enhance the solvent
power of the supercritical fluid allowing the extraction of polar compounds. Our first aim was
to extract glucosinolates, which are polar compounds; for this reason ethanol was chosen as
the co-solvent to be used in the first experimental test. The effect of the extraction parameters
on the yield of the extraction was investigated. First, the influence of the CO2 flow rate on the
yield of the extraction was examined. Moreover, an optimum value of the ethanol dosage was
found. Beside these, the influence of the pre-treatment on the yield of the extraction was
confirmed. Finally, optimum values of the extraction temperature and pressure were achieved.
3.2.1 Effect of CO2 flow rate on the yield of the extraction
In order to find the optimum value of the CO2 flow rate, various experiments at different CO2
flow rates were performed.
21,71
5,54 5,56
1,50
25,08

Results and discussion 35
The other parameters were kept at constant values shown in the Table 3.2.
Table 3.2: Extraction parameters values
Pressure (bar) 300
Temperature (°C) 45
Co-solvent dosage (mL/min) 0.5
These values are considered as a reference from previous extraction experiments. Typical
results are shown in Figure 3.2. There is an enhancement of the extraction yield while
decreasing the flow rate of the SCCO2 from 0.5 kg/h to 0.3 kg/h. Higher velocity leads to
lower time contact of solvent with the particles and hence to lower yield.
Figure 3.2: Effect of CO2 flow rate on the extraction yield
According to literature (32
) the final yield can be estimated from the following correlation
(3.1):
Y = ks * as * Vt * Δcm (3.1)
Where ks is the mass transfer coefficient (m/s); as the specific interfacial area (m2/m3); Vt the
bed volume (m3); and Δcm the mean concentration gradient. The mass transfer coefficient, ks
can be calculated by a correlation with the Sherwood number (3.2)
Sh = ks * d/D12 = 2 + 1.1 *Sc1/3
*Re0.6
for 3 < Re < 3000
(3.2)
Since an increasing of the flow rates leads to an increasing of the Reynolds number defined
as (3.3)
Re = (v * d) / υ (3.3)
0
1
2
3
4
5
6
7
0 200 400 600 800 1000 1200
Yie
ld (
wt
%, d
ry b
asis
)
CO2/rucola mass ratio
0,3
0,5

36 Chapter 3
This should lead to an enhancement of the yield, because at the same extractor diameter, d,
the velocity is increasing. However more CO2 would be needed to extract the same quantity.
3.2.2 Optimization of the ethanol dosage
Since pure SCCO2 has low solvent power for the substances, we want to extract a small
amount of co-solvent was added. Ethanol was chosen, as it is a polar liquid and it is the most
employed co-solvent in literature. The effect of the dosage of ethanol on the extraction yield
was investigated. The values of the other extraction parameters were kept constant (Table
3.3):
Table 3.3: Extraction parameters values for the optimization of the ethanol
dosage
Pressure (bar) 300
Temperature (°C) 45
CO2 flow rate (kg/h) 0.3
Extraction experiments were carried out with different values of ethanol dosage, varying
dosage between 0.3 and 0.7 mL/min, with steps of 0.1 mL/min. Since the addition of co-
solvent affects the solubility of the substances in the solvent, an increasing amount of ethanol
should lead to increasing solubility, and increasing final yields.
The extraction curves obtained are shown in Figure 3.3. As can be seen, increasing the dosage
of ethanol leads to increase of the slope of the linear part of the curve, that means higher
solubility.
Passing from 0.3 to 0.4 mL/min clearly to increases the solubility and the yield. This trend is
true also at 0.5 mL/min. However further increasing of the ethanol concentration does not
lead to further advantages. The final yield seems to reach a maximum with 0.5 mL/min.
Higher values of co-solvent amounts do not improve the yield.

Results and discussion 37
Figure 3.3: Effect of the ethanol dosage on the extraction yield
A comparison of the values of the final yields is shown in Figure 3.4
Figure 3.4: Comparison of the final yields
The optimum value of the ethanol dosage is furthermore confirmed if we compare the
solubility data shown in Figure 3.5
0
1
2
3
4
5
6
7
0 100 200 300 400 500 600 700
Yiel
d (
wt.
%, d
ry b
asis
)
CO2/rucola mass ratio
0,3
0,4
0,5
0,6
0,7
2
3
4
5
6
7
8
9
10
0,3 0,4 0,5 0,6 0,7
Yiel
d (
%)
Co-solvent dosage (mL/min)

38 Chapter 3
Figure 3.5: Solubility at different ethanol dosage
To sum up, the optimum value of the co-solvent dosage seems to be 0.5 mL/min (7 wt %),
this may be due to that this amount of ethanol is solubilized in the SCCO2 and brought inside
the cell to the available soluble compounds. A larger amount of ethanol is not fully
solubilized in SCCO2 and therefore it is not able to access to the available substances inside
the cells.
3.2.3 Effect of the pre-treatment on the yield of the extraction
The mechanism of transport in the solid phase proceeds in the following parallel and
consecutive steps:
The solvent is absorbed in the plant, swelling the cell structure and dissolving the
soluble compounds
The dissolved substances are transported to the outer surface by diffusion
The dissolved substances are transported from the surface layer to the solvent
Particle size distribution and the initial location of the desired compounds in the solid matrix
play important roles on the hydrodynamic of the solvent and the diffusion. For this reason a
mechanical pre-treatment was performed to the dried leaves before the extraction
experiments.
After being freeze-dried, the leaves were grinded with a laboratory pestle. The powder
obtained was then filtered with a metallic sieve of 0.5 mm. It has been reported that the size
of the particles should be in a range between 0.4 and 0.8 mm. Smaller particle sizes can cause
channeling.(33
)
The main effect of this process is to increase as ,the specific interfacial area (m2/m3). This
leads directly to an enhancement of the yield as reported from the correlation (3.1). Moreover,
the mechanical pre-treatment breaks the cell walls, this helps the diffusion process. In this
0,00
0,01
0,02
0,03
0,04
0,3 0,4 0,5 0,6 0,7
Solu
bili
ty (
g/kg
)
Co-solvent dosage (mL/min)

Results and discussion 39
way the soluble compounds are directly available for the solvent that can easily dissolve and
extract them.
The influence of the mechanical pre-treatment is shown in the following Figure 3.6.
Figure 3.6: Influence of the pre-treatment on the extraction yield
As can be seen in Figure 3.6 a higher yield is reached in the pre-treated sample since the first
part of the extraction curve (solubility limited), with a lower amount of solvent. The main
effect is noticed in the following part of the extraction curve. Diffusion is related to the size of
particles, the lower the size particle the faster the diffusion. The mechanism of transport in the
solid phase shown previously is accelerated by regular particle size distribution, and
especially the increasing of the interfacial area as. The “fresh” solvent can more easily access
to the solid phase and being absorbed. Moreover diffusion from the inner to the outer surface
is faster and the dissolved substance can more easily being transported from the surface layer
into the solvent.
The result is that in a mechanical pre-treated sample the final yield is higher and the amount
of solvent consumed is smaller than that of the sample without pre-treatment.
3.2.4 Optimization of the temperature on the extraction process
In order to find the optimum value of the extraction temperature, various experiments have
been carried out at different temperatures. The other extraction parameters, kept constant, are
shown in Table 3.4.
0
1
2
3
4
5
6
7
0 200 400 600 800 1000
Yie
ld (
%w
t., d
ry b
asi
s)
CO2/rucola mass ratio
d>0,5 mm
d<0,5 mm
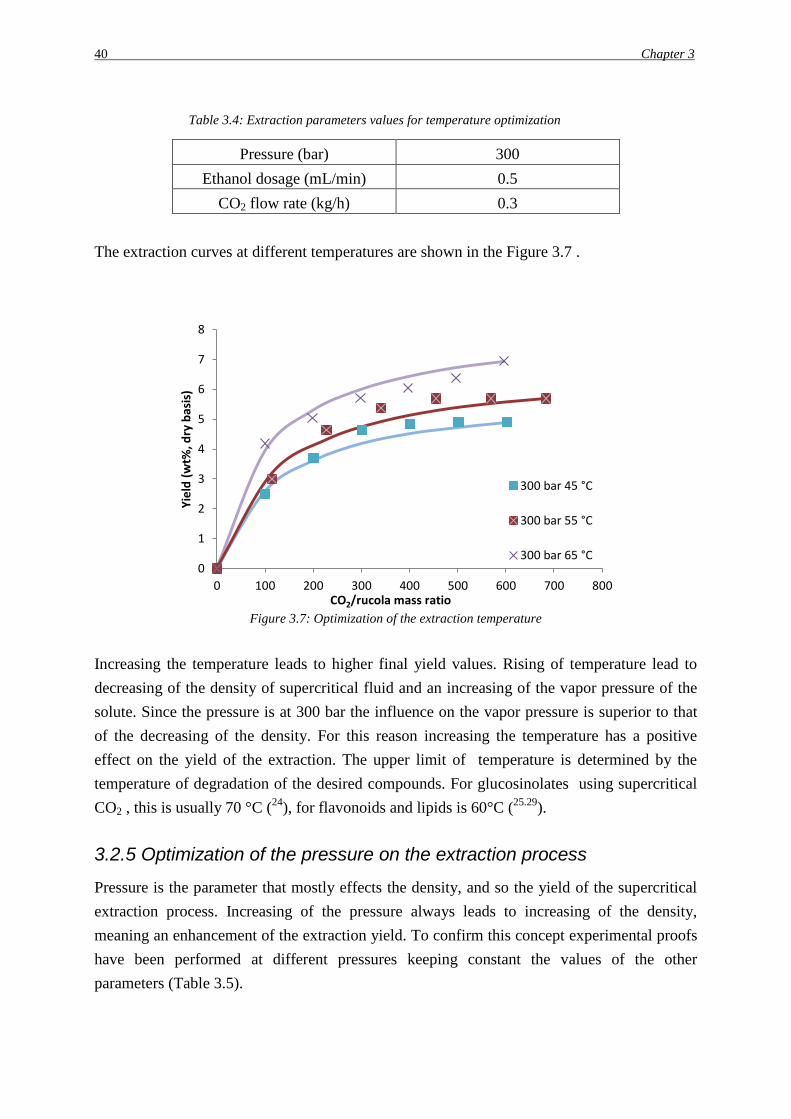
40 Chapter 3
Table 3.4: Extraction parameters values for temperature optimization
Pressure (bar) 300
Ethanol dosage (mL/min) 0.5
CO2 flow rate (kg/h) 0.3
The extraction curves at different temperatures are shown in the Figure 3.7 .
Figure 3.7: Optimization of the extraction temperature
Increasing the temperature leads to higher final yield values. Rising of temperature lead to
decreasing of the density of supercritical fluid and an increasing of the vapor pressure of the
solute. Since the pressure is at 300 bar the influence on the vapor pressure is superior to that
of the decreasing of the density. For this reason increasing the temperature has a positive
effect on the yield of the extraction. The upper limit of temperature is determined by the
temperature of degradation of the desired compounds. For glucosinolates using supercritical
CO2 , this is usually 70 °C (24
), for flavonoids and lipids is 60°C (25.29
).
3.2.5 Optimization of the pressure on the extraction process
Pressure is the parameter that mostly effects the density, and so the yield of the supercritical
extraction process. Increasing of the pressure always leads to increasing of the density,
meaning an enhancement of the extraction yield. To confirm this concept experimental proofs
have been performed at different pressures keeping constant the values of the other
parameters (Table 3.5).
0
1
2
3
4
5
6
7
8
0 100 200 300 400 500 600 700 800
Yie
ld (
wt%
, dry
bas
is)
CO2/rucola mass ratio
300 bar 45 °C
300 bar 55 °C
300 bar 65 °C

Results and discussion 41
Table 3.5: Extraction parameters values for the optimization of extraction
pressure
Temperature (°C) 45
CO2 flow rate (kg/h) 0.3
Ethanol dosage (mL/min) 0.5
The results obtained at different pressures are shown in Figure 3.8
Figure 3.8: Optimization of the extraction pressure
Our results confirm that increasing the extraction pressure always leads to larger final yields.
There is a slight enhancement of the yield from increasing the pressure form 150 bar to 200
bar. This improvement becomes more evident raising the pressure to 250 and 300 bar.
3.3 Optimization of the extraction parameters using water as co-
solvent
Beside ethanol, water can be employed as co-solvent in supercritical CO2 extraction (1).
Water and ethanol are physically similar and there are both used as co-solvent to allow to the
supercritical CO2 to solubilize also polar components. Experiments have been carried out in
order to find an optimum value of the water dosage, extraction pressure and extraction
temperature.
0
1
2
3
4
5
6
0 200 400 600 800
Yie
ld (
wt
% d
ry b
asis
)
CO2 / rucola mass ratio
300
250
200
150

42 Chapter 3
3.3.1 Optimization of the water dosage
The optimum dosage of water has been investigated. Experiments have been performed
varying its value and keeping the other parameters at the constant values shown in Table 3.6
Table 3.6: Extraction parameters values for the optimization of the water
dosage
Pressure (bar) 300
Temperature (°C) 65
CO2 flow rate (kg/h) 0.3
The water dosage was varied among 0.3 mL/min, 0.4 mL/min, 0.5 mL/min corresponding to
respectively 6 wt %, 7 wt % and 10 wt% . The extraction curves are shown below (Figure
3.9).
Figure 3.9: Optimization of the water dosage
The results shows clearly that increasing of water dosage leads to better yields.
Particularly, the result obtained with 0.5 mL/min of water was very high. However for the
following experiments 0.4 mL/min was chosen as optimum value, since with a larger flow
rates of water the system was blocked. This could be due to that the increase of co-solvent
percentage may induce to the saturation of CO2 with water, with consequent formation of two
phases for the specific conditions of the system (34
).
3.3.2 Optimization of the temperature on the extraction process
The effect of the temperature on the extraction yield has been investigated. Temperature was
varied among 45°C, 55°C, 65°C and 75°C. The other extraction parameters were kept at the
constant values shown in Table 3.7.
0
10
20
30
40
50
60
0 200 400 600 800
Yie
ld (
wt%
, dry
bas
is)
CO2/rucola mass ratio
0.5
0.3
0.4

Results and discussion 43
Table 3.7: Extraction parameters values for the optimization of temperature
Pressure (bar) 300
Water dosage (mL/min) 0.4
CO2 flow rate (kg/h) 0.3
Extraction curves at different temperatures are shown in Figure 3.10.
Figure 3.10: Optimization of the temperature
Temperature has an evident effect on the yield. Increasing of temperature leads to
enhancement of both solubility and diffusivity, resulting in a higher final yield.
Since supercritical fluid extraction of the valuable compounds that we want extract are
usually performed at 70 °C (glucosinolates), (24
), or 60 °C (flavonoids and lipids), (25
) and
(29
) 65°C was chosen as an optimum value for the experiments, to avoid the degradation of
the compounds.
3.3.3 Optimization of the pressure on the extraction process
In order to investigate the optimum value of the extraction pressure, supercritical CO2
extraction has been performed at four different pressures ranged from 150 bar to 300 bar. The
values of the other extraction parameters are shown in Table 3.8.
Table 3.8: Extraction parameters values for the optimization of pressure
Temperature (°C) 65
CO2 flow rate (kg/h) 0.3
Water dosage (mL/min) 0.4
0
5
10
15
20
25
30
35
40
45
50
0 100 200 300 400 500 600 700
Yie
ld (
wt%
, dry
bas
is)
CO2/rucola mass ratio
75
65
55
45

44 Chapter 3
The extraction curves are shown in Figure 3.11 .
Figure 3.11: Optimization of the extraction pressure
The effect of increasing pressure on the extraction yield is not as evident as that of
temperature. Increasing pressure leads to higher the density of the supercritical fluid, which
that should always lead to an enhancement of the yield of the extraction. This enhancement is
clearly shown if we compare the yield at 150 bar with that of 300 bar. However, the
experimental values at 200 bar are not far from those of 150 bar, moreover the final value is
even smaller. The same behavior is represented from the curve at 250 bar with that of 300 bar,
and again the final value of 250 bar is higher than that of 300. What we can conclude
concerning these experiments, is that increasing of pressure does not influence primarily the
yield of the extraction. Similar data have been found in literature when water was used as co-
solvent (34
).
3.4 Comparison between three different co-solvents
Three different co-solvents have been employed in the supercritical fluid extraction: ethanol,
methanol and water. These are physically similar as they are polar protic solvents (35
). They
are compared in Table 3.9.
0
5
10
15
20
25
30
35
40
45
0 100 200 300 400 500 600 700
Yie
ld (
wt
%, d
ry b
asis
)
CO2/rucola mass ratio
300
250
200
150

Results and discussion 45
Table 3.9: Comparison of the physical properties of the solvents
Solvent
Chemical
Formula
Boiling
point
Dielectric
constant Density
Dipole
moment (D)
Ethanol (EtOH)
CH3-CH2-
OH 79 °C 30
0.789
g/ml 1.69 D
Methanol (MeOH) CH3-OH 65 °C 33
0.791
g/ml 1.70 D
Water H-O-H 100 °C 80
1.000
g/ml 1.85 D
Ethanol and methanol are very similar in terms of dielectric constant, density and dipole
moment. Water has a superior value of density, dipole moment and especially of dielectric
constant.
Supercritical CO2 has been performed using these chemicals as co-solvents at the same
conditions, shown in Table 3.10.
Table 3.10: Extraction parameters values for the co-solvents comparison
Pressure (bar) 300
Temperature (°C) 45
CO2 flow rate (kg/h) 0.3
Co-solvent dosage (wt %) 0.7
The comparison of the different yields is shown in the Figure 3.12.
Figure 3.12: Extraction yield with different co-solvent
The results show that the extraction yield obtained with ethanol and methanol are similar,
5.54±0.245 % and 5.6±0.06, respectively. The most evident data is the high yield achieved
with water (21.71±0.61 %) in comparison with ethanol and methanol.
0
5
10
15
20
25
Water Ethanol Methanol
Yie
ld (
wt%
)
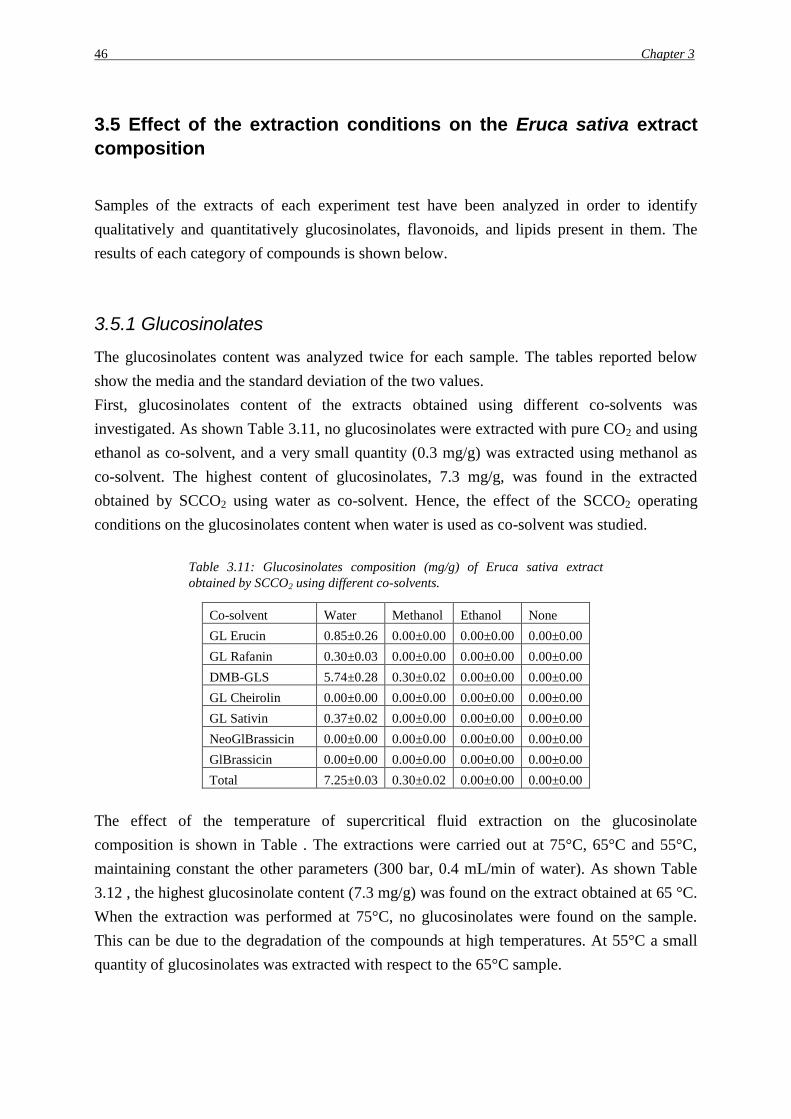
46 Chapter 3
3.5 Effect of the extraction conditions on the Eruca sativa extract
composition
Samples of the extracts of each experiment test have been analyzed in order to identify
qualitatively and quantitatively glucosinolates, flavonoids, and lipids present in them. The
results of each category of compounds is shown below.
3.5.1 Glucosinolates
The glucosinolates content was analyzed twice for each sample. The tables reported below
show the media and the standard deviation of the two values.
First, glucosinolates content of the extracts obtained using different co-solvents was
investigated. As shown Table 3.11, no glucosinolates were extracted with pure CO2 and using
ethanol as co-solvent, and a very small quantity (0.3 mg/g) was extracted using methanol as
co-solvent. The highest content of glucosinolates, 7.3 mg/g, was found in the extracted
obtained by SCCO2 using water as co-solvent. Hence, the effect of the SCCO2 operating
conditions on the glucosinolates content when water is used as co-solvent was studied.
Table 3.11: Glucosinolates composition (mg/g) of Eruca sativa extract
obtained by SCCO2 using different co-solvents.
Co-solvent Water Methanol Ethanol None
GL Erucin 0.85±0.26 0.00±0.00 0.00±0.00 0.00±0.00
GL Rafanin 0.30±0.03 0.00±0.00 0.00±0.00 0.00±0.00
DMB-GLS 5.74±0.28 0.30±0.02 0.00±0.00 0.00±0.00
GL Cheirolin 0.00±0.00 0.00±0.00 0.00±0.00 0.00±0.00
GL Sativin 0.37±0.02 0.00±0.00 0.00±0.00 0.00±0.00
NeoGlBrassicin 0.00±0.00 0.00±0.00 0.00±0.00 0.00±0.00
GlBrassicin 0.00±0.00 0.00±0.00 0.00±0.00 0.00±0.00
Total 7.25±0.03 0.30±0.02 0.00±0.00 0.00±0.00
The effect of the temperature of supercritical fluid extraction on the glucosinolate
composition is shown in Table . The extractions were carried out at 75°C, 65°C and 55°C,
maintaining constant the other parameters (300 bar, 0.4 mL/min of water). As shown Table
3.12 , the highest glucosinolate content (7.3 mg/g) was found on the extract obtained at 65 °C.
When the extraction was performed at 75°C, no glucosinolates were found on the sample.
This can be due to the degradation of the compounds at high temperatures. At 55°C a small
quantity of glucosinolates was extracted with respect to the 65°C sample.

Results and discussion 47
Table 3.12 : Glucosinolates composition (mg/g) of Eruca sativa extract
obtained by SCCO2 at different temperatures.
Temperature (°C) 75°C 65°C 55°C
GL Erucin 0.00±0.00 0.85±0.26 0.32±0.09
GL Rafanin 0.00±0.00 0.30±0.03 0.18±0.03
DMB-GLS 0.00±0.00 5.74±0.28 0.61±0.23
GL Cheirolin 0.00±0.00 0.00±0.00 0.08±0.00
GL Sativin 0.00±0.00 0.37±0.02 0.00±0.00
NeoGlBrassicin 0.00±0.00 0.00±0.00 0.00±0.00
GlBrassicin 0.00±0.00 0.00±0.00 0.00±0.00
Total 0.00±0.00 7.25±0.03 1.19±0.30
Different tests were carried out at different pressures maintaining constant the other
parameters (65°C, 0.4 mL/min of water) with the aim of studying the effect of the pressure on
the glucosinolates composition of the extract. As shown in Table 3.13 , the higher the
pressure, the higher the glucosinolates content on the extract. Probably, at 300 bar, the
enzyme myrosinase is deactivated, whereas lower pressures are not high enough to deactivate
it.
Table 3.13: Glucosinolates composition (mg/g) of Eruca sativa extract
obtained by SCCO2 at different pressures.
Pressure (bar) 300 250 200 150
GL Erucin 0.85±0.26 0.24±0.03 0.22±0.01 0.26±0.03
GL Rafanin 0.30±0.03 0.00±0.00 0.00±0.00 0.20±0.01
DMB-GLS 5.74±0.28 1.59±0.91 0.54±0.36 0.00±0.00
GL Cheirolin 0.00±0.00 0.00±0.00 0.00±0.00 0.00±0.00
GL Sativin 0.37±0.02 0.00±0.00 0.00±0.00 0.00±0.00
NeoGlBrassicin 0.00±0.00 0.00±0.00 0.00±0.00 0.00±0.00
GlBrassicin 0.00±0.00 0.00±0.00 0.00±0.00 0.00±0.00
Total 7.25±0.03 1.83±0.94 0.76±0.35 0.45±0.02
The effect of the co-solvent dosage on the glucosinolates composition is shown in Table 3.14.
The highest value, 7.3 mg/g, was obtained using 0.4 mL/min. As explained in the previous
sections, with 0.5 mL/min, the saturation of CO2 with water with consequently formation of
two phases for the specific conditions of the system could have been taken place. It is also
noted that 0.3 mL/min of water is not enough to extract the glucosinolates from Eruca sativa
leaves.
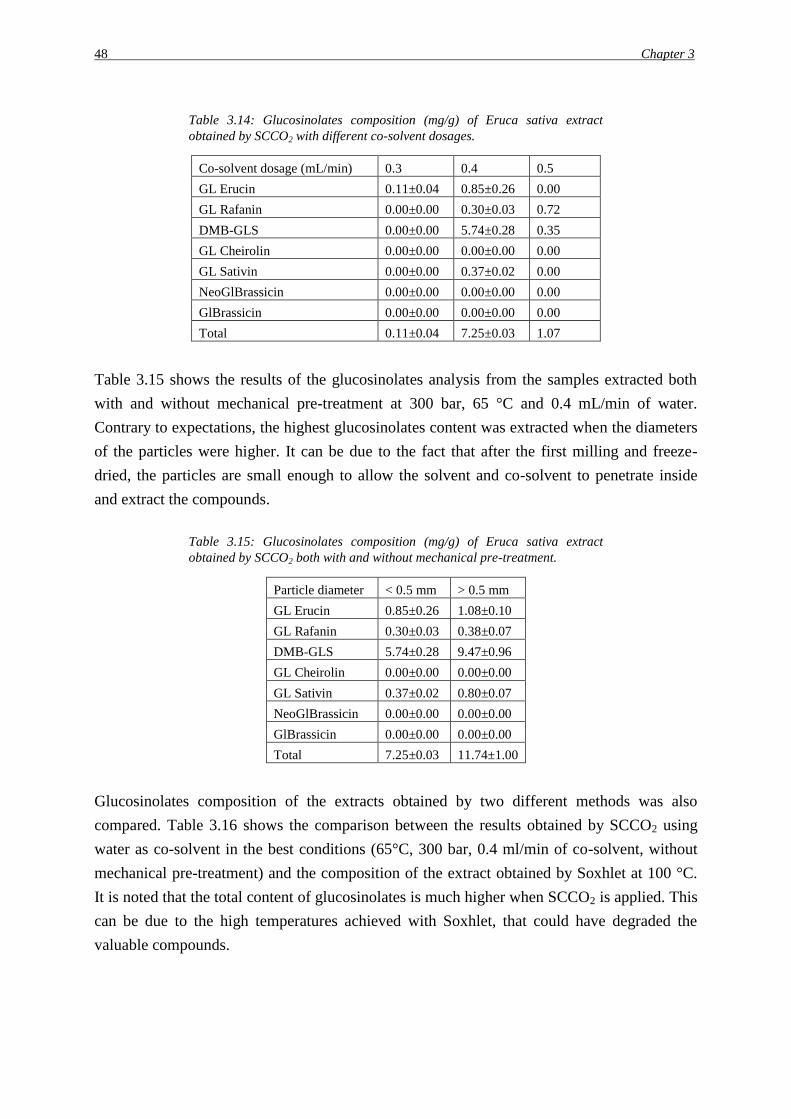
48 Chapter 3
Table 3.14: Glucosinolates composition (mg/g) of Eruca sativa extract
obtained by SCCO2 with different co-solvent dosages.
Co-solvent dosage (mL/min) 0.3 0.4 0.5
GL Erucin 0.11±0.04 0.85±0.26 0.00
GL Rafanin 0.00±0.00 0.30±0.03 0.72
DMB-GLS 0.00±0.00 5.74±0.28 0.35
GL Cheirolin 0.00±0.00 0.00±0.00 0.00
GL Sativin 0.00±0.00 0.37±0.02 0.00
NeoGlBrassicin 0.00±0.00 0.00±0.00 0.00
GlBrassicin 0.00±0.00 0.00±0.00 0.00
Total 0.11±0.04 7.25±0.03 1.07
Table 3.15 shows the results of the glucosinolates analysis from the samples extracted both
with and without mechanical pre-treatment at 300 bar, 65 °C and 0.4 mL/min of water.
Contrary to expectations, the highest glucosinolates content was extracted when the diameters
of the particles were higher. It can be due to the fact that after the first milling and freeze-
dried, the particles are small enough to allow the solvent and co-solvent to penetrate inside
and extract the compounds.
Table 3.15: Glucosinolates composition (mg/g) of Eruca sativa extract
obtained by SCCO2 both with and without mechanical pre-treatment.
Particle diameter < 0.5 mm > 0.5 mm
GL Erucin 0.85±0.26 1.08±0.10
GL Rafanin 0.30±0.03 0.38±0.07
DMB-GLS 5.74±0.28 9.47±0.96
GL Cheirolin 0.00±0.00 0.00±0.00
GL Sativin 0.37±0.02 0.80±0.07
NeoGlBrassicin 0.00±0.00 0.00±0.00
GlBrassicin 0.00±0.00 0.00±0.00
Total 7.25±0.03 11.74±1.00
Glucosinolates composition of the extracts obtained by two different methods was also
compared. Table 3.16 shows the comparison between the results obtained by SCCO2 using
water as co-solvent in the best conditions (65°C, 300 bar, 0.4 ml/min of co-solvent, without
mechanical pre-treatment) and the composition of the extract obtained by Soxhlet at 100 °C.
It is noted that the total content of glucosinolates is much higher when SCCO2 is applied. This
can be due to the high temperatures achieved with Soxhlet, that could have degraded the
valuable compounds.

Results and discussion 49
Table 3.16 : Glucosinolates composition (mg/g) of Eruca sativa extract
obtained by SCCO2 and Soxhlet extraction method.
3.5.2 Phenols
The phenols content was analyzed four times for each sample. The tables reported below
show the media and the standard deviation of the four values.
First, phenols content of the samples extracted using different co-solvents was analyzed. As
shown Table 3.17, no phenolic compounds were extracted with pure CO2, and very small
traces were extracted using ethanol and methanol as co-solvents. The highest content of
glucosinolates, 1.42 mg/g, was found in the extracted obtained by SCCO2 using water as co-
solvent. Therefore, the effect of the SCCO2 operating conditions on the phenols content when
water is used as co-solvent was investigated.
Table 3.17: Phenols composition (mg/g) of Eruca sativa extract obtained by
SCCO2 using different co-solvents
Co-solvent Water Methanol Ethanol None
Quinic acid 0.07±0.01 0.00±0.00 0.00±0.00 0.00±0.00
Quercetin-3-(2-feruloyl-glucoside)-3'-(6-feruloylglucoside)-
4'glucoside 0.00±0.00 0.00±0.00 0.00±0.00 0.00±0.00
Quercetin-3,4'-diglucoside-3'(6-sinapoyl-glucoside) 0.16±0.01 0.06±0.00 0.00±0.00 0.00±0.00
Rutin 0.04±0.00 0.00±0.00 0.00±0.00 0.00±0.00
Leucodelphynidin 0.46±0.01 0.09±0.00 0.13±0.01 0.00±0.00
Q-acetil-sinapoil-diglucoside 0.07±0.00 0.03±0.03 0.00±0.00 0.00±0.00
Quercetin(Sinapoyl-glucoside)(sinapoyl-glucoside)-glucoside 0.22±0.01 0.06±0.00 0.07±0.00 0.00±0.00
Quercetin(Sinapoyl-glucoside) 0.04±0.00 0.00±0.00 0.00±0.00 0.00±0.00
Quercetin 0.05±0.00 0.00±0.00 0.00±0.00 0.00±0.00
Kaempferol 0.04±0.00 0.00±0.00 0.00±0.00 0.00±0.00
Isoramnetin 0.04±0.00 0.00±0.00 0.00±0.00 0.00±0.00
Procatequic acid glucoside 0.05±0.00 0.00±0.00 0.00±0.00 0.00±0.00
Quercitin diglucoside 0.16±0.15 0.03±0.03 0.00±0.00 0.00±0.00
Total 1.42±0.18 0.28±0.01 0.19±0.01 0.00±0.00
Method SCCO2 Soxhlet
GL Erucin 1.08±0.10 0.00±0.00
GL Rafanin 0.38±0.07 0.09±0.05
DMB-GLS 9.47±0.96 3.13±0.25
GL Cheirolin 0.00±0.00 0.04±0.00
GL Sativin 0.80±0.07 0.31±0.08
NeoGlBrassicin 0.00±0.00 0.00±0.00
GlBrassicin 0.00±0.00 0.00±0.00
Total 11.74±1.00 3.57±0.28

50 Chapter 3
The effect of the temperature of supercritical fluid extraction on the phenols composition is
shown in Table 3.18. The compositions of the extract at 75°C, 65°C, 55°C and 45°C,
maintaining constant the other parameters (300 bar, 0.4 mL/min of water) are reported. As
shown Table 3.18, the higher the temperature, the higher the phenolic content. A total phenols
content of 1.48 mg/g was found on the extract obtained at 75 °C. Hence, at 75°C no
degradation of the phenolic compounds occur.
Table 3.18: Phenols composition (mg/g) of Eruca sativa extract obtained by
SCCO2 at different temperatures.
Temperature (°C) 75 65 55 45
Quinic acid 0.00±0.00 0.07±0.01 0.08±0.02 0.07±0.05
Quercetin-3-(2-feruloyl-glucoside)-3'-(6-feruloylglucoside)-
4'glucoside 0.07±0.00 0.00±0.00 0.02±0.03 0.00±0.00
Quercetin-3,4'-diglucoside-3'(6-sinapoyl-glucoside) 0.11±0.02 0.16±0.01 0.14±0.03 0.08±0.02
Rutin 0.03±0.04 0.04±0.00 0.02±0.03 0.00±0.00
Leucodelphynidin 0.40±0.03 0.46±0.01 0.29±0.03 0.12±0.09
Q-acetil-sinapoil-diglucoside 0.12±0.01 0.07±0.00 0.07±0.05 0.06±0.01
Quercetin(Sinapoyl-glucoside)(sinapoyl-glucoside)-glucoside 0.10±0.01 0.22±0.01 0.09±0.04 0.06±0.01
Quercetin(Sinapoyl-glucoside) 0.21±0.02 0.04±0.00 0.06±0.01 0.09±0.02
Quercetin 0.26±0.04 0.05±0.00 0.10±0.02 0.07±0.05
Kaempferol 0.08±0.01 0.04±0.00 0.04±0.03 0.04±0.00
Isoramnetin 0.09±0.00 0.04±0.00 0.06±0.00 0.05±0.00
Procatequic acid glucoside 0.00±0.00 0.05±0.00 0.02±0.03 0.00±0.00
Quercitin diglucoside 0.00±0.00 0.16±0.15 0.07±0.01 0.00±0.00
Total 1.48±0.13 1.42±0.18 1.07±0.08 0.64±0.18
Different experiments were carried out at different pressures maintaining the other parameters
constant (65°C, 0.4 mL/min of water) with the aim of studying the effect of the pressure on
the phenols composition of the extract. As shown in Table 3.19, the higher the pressure, the
higher the glucosinolates content on the extract, except in the case of extraction at 150 bar.
Nevertheless, the sample with the highest phenolic content, 1.42 mg/g, was extracted at the
highest pressure, 300 bar.

Results and discussion 51
Table 3.19: Phenols composition (mg/g) of Eruca sativa extract obtained by
SCCO2 at different pressures.
Pressure (bar) 300 250 200 150
Quinic acid 0.07±0.01 0.17±0.04 0.11±0.04 0.19±0.04
Quercetin-3-(2-feruloyl-glucoside)-3'-(6-feruloylglucoside)-
4'glucoside 0.00±0.00 0.00±0.00 0.00±0.00 0.00±0.00
Quercetin-3,4'-diglucoside-3'(6-sinapoyl-glucoside) 0.16±0.01 0.14±0.02 0.13±0.03 0.16±0.03
Rutin 0.04±0.00 0.00±0.00 0.00±0.00 0.00±0.00
Leucodelphynidin 0.46±0.01 0.31±0.03 0.28±0.03 0.28±0.04
Q-acetil-sinapoil-diglucoside 0.07±0.00 0.09±0.02 0.09±0.01 0.10±0.01
Quercetin(Sinapoyl-glucoside)(sinapoyl-glucoside)-
glucoside 0.22±0.01 0.08±0.01 0.08±0.01 0.12±0.02
Quercetin(Sinapoyl-glucoside) 0.04±0.00 0.11±0.01 0.08±0.01 0.11±0.01
Quercetin 0.05±0.00 0.16±0.02 0.14±0.02 0.14±0.02
Kaempferol 0.04±0.00 0.07±0.00 0.06±0.00 0.08±0.00
Isoramnetin 0.04±0.00 0.08±0.00 0.07±0.01 0.08±0.00
Procatequic acid glucoside 0.05±0.00 0.00±0.00 0.00±0.00 0.00±0.00
Quercitin diglucoside 0.16±0.15 0.00±0.00 0.00±0.00 0.00±0.00
Total 1.42±0.18 1.23±0.13 1.04±0.11 1.26±0.14
The effect of the co-solvent dosage on the phenols composition is shown in Table 3.20. The
highest value, 1.42 mg/g, was obtained using 0.4 mL/min, as in the case of glucosinolates.
Table 3.20 : Phenols composition (mg/g) of Eruca sativa extract obtained by
SCCO2 with different co-solvent dosages.
Co-solvent dosage (mL/min) 0.5 0.4 0.3
Quinic acid 0.00±0.00 0.07±0.01 0.10±0.03
Quercetin-3-(2-feruloyl-glucoside)-3'-(6-feruloylglucoside)-4'glucoside 0.00±0.00 0.00±0.00 0.00±0.00
Quercetin-3,4'-diglucoside-3'(6-sinapoyl-glucoside) 0.07±0.01 0.16±0.01 0.14±0.02
Rutin 0.01±0.02 0.04±0.00 0.00±0.00
Leucodelphynidin 0.48±0.06 0.46±0.01 0.29±0.04
Q-acetil-sinapoil-diglucoside 0.07±0.01 0.07±0.00 0.08±0.01
Quercetin(Sinapoyl-glucoside)(sinapoyl-glucoside)-glucoside 0.08±0.02 0.22±0.01 0.08±0.02
Quercetin(Sinapoyl-glucoside) 0.13±0.02 0.04±0.00 0.14±0.02
Quercetin 0.25±0.10 0.05±0.00 0.16±0.02
Kaempferol 0.07±0.02 0.04±0.00 0.04±0.03
Isoramnetin 0.08±0.02 0.04±0.00 0.07±0.00
Procatequic acid glucoside 0.00±0.00 0.05±0.00 0.00±0.00
Quercitin diglucoside 0.08±0.02 0.16±0.15 0.00±0.00
Total 1.31±0.16 1.42±0.18 1.11±0.13

52 Chapter 3
Table 3.21 shows the results of the phenols analysis from the samples extracted both with and
without mechanical pre-treatment at 300 bar, 65 °C and 0.4 mL/min of water. In this case, the
highest phenols content was extracted when the diameters of the particles were smaller, as
expected.
Table 3.21 : Phenols composition (mg/g) of Eruca sativa extract obtained by
SCCO2 both with and without mechanical pre-treatment.
Particle diameter < 0.5 mm > 0.5 mm
Quinic acid 0.07±0.01 0.13±0.08
Quercetin-3-(2-feruloyl-glucoside)-3'-(6-feruloylglucoside)-4'glucoside 0.00±0.00 0.00±0.00
Quercetin-3,4'-diglucoside-3'(6-sinapoyl-glucoside) 0.16±0.01 0.09±0.03
Rutin 0.04±0.00 0.05±0.01
Leucodelphynidin 0.46±0.01 0.30±0.04
Q-acetil-sinapoil-diglucoside 0.07±0.00 0.06±0.01
Quercetin(Sinapoyl-glucoside)(sinapoyl-glucoside)-glucoside 0.22±0.01 0.08±0.03
Quercetin(Sinapoyl-glucoside) 0.04±0.00 0.01±0.02
Quercetin 0.05±0.00 0.02±0.05
Kaempferol 0.04±0.00 0.01±0.02
Isoramnetin 0.04±0.00 0.01±0.02
Procatequic acid glucoside 0.05±0.00 0.05±0.05
Quercitin diglucoside 0.16±0.15 0.07±0.02
Total 1.42±0.18 0.89±0.13
Phenols composition of the extracts obtained by two different methods was compared. Table
3.22 shows the comparison between the results obtained by SCCO2 using water as co-solvent
at 65°C, 300 bar, 0.4 ml/min of co-solvent without mechanical pre-treatment, and the
composition of the extract obtained by Soxhlet at 100 °C. As in the content of glucosinolates,
the phenols content is much higher when SCCO2 is applied. Once again, this can be due to the
high temperatures achieved with Soxhlet, that could have degraded the valuable compounds.

Results and discussion 53
Table 3.22 : Phenols composition (mg/g) of Eruca sativa extract obtained by
SCCO2 and Soxhlet extraction methods.
Method SCCO2 Soxhlet
Quinic acid 0.07±0.01 0.00±0.00
Quercetin-3-(2-feruloyl-glucoside)-3'-(6-feruloylglucoside)-4'glucoside 0.00±0.00 0.00±0.00
Quercetin-3,4'-diglucoside-3'(6-sinapoyl-glucoside) 0.16±0.01 0.00±0.00
Rutin 0.04±0.00 0.00±0.00
Leucodelphynidin 0.46±0.01 0.11±0.03
Q-acetil-sinapoil-diglucoside 0.07±0.00 0.00±0.00
Quercetin(Sinapoyl-glucoside)(sinapoyl-glucoside)-glucoside 0.22±0.01 0.02±0.00
Quercetin(Sinapoyl-glucoside) 0.04±0.00 0.00±0.00
Quercetin 0.05±0.00 0.00±0.00
Kaempferol 0.04±0.00 0.00±0.00
Isoramnetin 0.04±0.00 0.00±0.00
Procatequic acid glucoside 0.05±0.00 0.03±0.00
Quercitin diglucoside 0.16±0.15 0.00±0.00
Total 1.42±0.18 0.16±0.04
3.5.3 Lipids
The lipids content was analyzed twice for each sample. Table 3.23 shows the media and the
standard deviation of the two values. The samples were obtained by pure SCCO2 and by
SCCO2 using water as-solvent at 300 bar and 45 °C. As expected, the sample extracted by
pure SCCO2 has a high content of lipids (338.0 mg/g), very rich in unsaturated fatty acids.
However, the sample extracted using water as co-solvent has only very small traces of lipids.

54 Chapter 3
Table 3.23: Lipids composition (mg/g) of Eruca sativa extract obtained by
pure SCCO2 and by SCCO2 using water as-solvent.
Co-solvent None Water
MAG(Ln) 4.36±0.38 0.00
TG(LnLnSt) 183.8±12.10 0.00
TG(LnLnLn) 102.42±8.15 0.00
TG(LLnLn) 1.09±0.01 0.04
TG(linolenico) 9.56±0.04 0.02
TG(PLn) 0.57±0.04 0.00
TG(linolenic) 6.38±0.19 0.00
TG(LnLL) 0.94±0.01 0.00
TG(arachidic ac) 6.84±8.33 0.00
DG_PP 0.60±0.08 0.00
DG_(linolenic) 2.76±0.59 0.00
DG_CaCa 1.45±0.06 0.00
Not identified lipid 8.20±0.30 0.00
Not identified lipid 8.38±0.89 0.00
Not identified lipid 0.64±0.00 0.00
Total 338.01±12.65 0.06

CHAPTER 4
Economical evaluation of an industrial
scale application
A conceptual design of an industrial scale application of the of the supercritical CO2
extraction process has been proposed. Aspen plus software has been used for the design. An
economical evaluation of the process has been performed in order to verify the economic
feasibility of the scale up of this process.
4.1 Simulation model
Starting from the laboratory supercritical extraction plant, a conceptual design of an industrial
scale application has been proposed. The hierarchical approach of Douglas (36
) has been
followed for the design. The block diagram of the process is shown in Figure 4.1.
Figure 4.1: Block Flow Diagram of the process
In the laboratory plant the extraction is operated in batch mode, since there is only one
extractor. However, adding another extractor in parallel allows operating in a semi-continuous

56 Chapter 4
mode. For this hypothesis of conceptual design, the process is supposed to be operated in a
continuous mode.
Process inlets are the solid material to be extracted (Solid IN), the fresh carbon dioxide (CO2
IN) and the co-solvent to be added (Water). The outlets are the stream of the extract (Extract),
the solid raffinate (Solid Out), and the loss of carbon dioxide remained after the extraction
and inevitably lost during opening and refilling the extractor vessel. Two are the main blocks
of the process: the extraction system and the carbon dioxide separator. The extraction system
is supposed to include three supercritical extractors operating in parallel. The carbon dioxide
separator assumed as a flash unit, which allows to separate carbon dioxide by
depressurization. Another separation step has to be included in the system, since the water
used as co-solvent has to be separated to recover the extract. This separation step is supposed
to be a drying unit, and water is assumed to be completely recycled.
As basis for the calculations the amount of solid feed is set to 100 kg/h. The extraction curve
obtained at 250 bar and 65 °C was chosen as reference.
(4.1)
Where Y= flow rate of the extract/flow rate of solid *100, X= mass of carbon dioxide/mass of
solid.
X was fixed at 300 so that the flow rate of the extract should be 31.03 kg/h and the solid out is
68.97 kg/h. According to the experimental results the initial amount of water inlet is 7 wt %
of that of carbon dioxide.
The loss of carbon dioxide has been evaluated from the porosity of the solid bed in the
laboratory extractor. The volume of the lab extractor is Vr= 2.6 *10-6
m3; the mass of solid put
in is ms= 0.5*10-3
kg, so that the apparent density of the solid is ρa = 190 kg/m3. The real
density of the solid has been calculated experimentally from a volumetric measure, finding ρs
= 1554 kg /m3, meaning that the real volume occupied by the solid is Vs= 3.2*10
-7 m
3. The
rest of the volume of the extractor Vr-Vs = 2.28*10-6
m3 is occupied by supercritical CO2. The
density of carbon dioxide at 250 bar 809 kg/m3, that leads to 1.8*10
-3 kg of carbon dioxide
which are in the reactor and are lost when it is opened. The ratio mass of carbon dioxide/
mass of solid in the laboratory extractor is 3.6. Hence, the loss of carbon dioxide in the
process with a feed of 100 kg/h is CO2 OUT= 360 kg/h.
To extract 100 kg/h with a residence time of 1 h, the total required volume is 530 L.
Extraction is assumed to be carried out in three extractors in parallel of 360 L. A ratio of
length/diameter = 4 has been considered (33
), obtaining, diameter = 0.48 m and length = 2 m.

Economical evaluation of an industrial scale application 57
4.1.1 Aspen Plus
The software used for the design was Aspen Plus V 7.3. The components chosen were all
conventional components, shown in Table 4.1.
Table 4.1: Components considered in the process
CO2 Conventional Carbon dioxide
H2O Conventional Water
OIL Conventional Linoleic acid
NOEXT Conventional Cellulose
The extract is approximated with the conventional component oil, and the part that cannot be
extracted is approximated with cellulose.
SRK was chosen as property calculation method. The thermodynamic consistence of the
chosen method has been evaluated by comparing data obtained from SRK with experimental
data. For instance, the density of carbon dioxide has been calculated at different pressures and
temperatures with the Equation of Bender (37
) and SRK. The results are compared in Figure
4.2-4.5.
Figure 4.2: Carbon dioxide density at 32°C
0
50
100
150
200
250
0 20 40 60 80
de
nsi
ty (
kg/m
3 )
P(bar)
SRK
Bender

58 Chapter 4
Figure 4.3:Carbon dioxide density at 34°C
Figure 4.4: Carbon dioxide density at 40°C
0
50
100
150
200
250
300
0 20 40 60 80
de
nsi
ty (
kg/m
3 )
P (bar)
SRK
Bender
0
50
100
150
200
250
0 20 40 60 80
de
nsi
ty (
kg/m
3 )
P(bar)
SRK
Bender

Economical evaluation of an industrial scale application 59
Figure 4.5: Carbon dioxide density at 50°C
Clearly, SRK seems to be reliable for the calculation of the carbon dioxide density, as shown
in Figures 4.2, 4.3, 4.4 and 4.5.
Data of water solubility on CO2 obtained with SRK in Aspen Plus have been compared to
experimental data from literature (38
). The results are shown in Figure 4.6.
Figure 4.6: Water solubility in CO2
Since even for water solubility experimental data and data calculated with SRK are similar,
SRK is considered to be a reliable property method for our operating conditions.
0
20
40
60
80
100
120
140
160
180
200
0 20 40 60 80
de
nsi
ty (
kg/m
3 )
P(bar)
SRK
Bender
0
0,001
0,002
0,003
0,004
0,005
0,006
0,007
0,008
0,009
0 20 40 60 80 100 120
Mas
s fr
ac
P bar
50
75
50 Exp
75 Exp

60 Chapter 4
The final flow sheet is reported in figure 4.7
Figure 4.7: Aspen Plus flow sheet of the process
As shown in Figure 4.7, the carbon dioxide at atmospheric conditions is compressed at 60 bar
(B1) and then cooled down to 5 °C (B5) to liquefy. Liquid carbon dioxide is pumped at the
desired extraction pressure (B3) and heated up to the desired extraction temperature (B6) and
goes to the extractor. Since there is not a “Supercritical Extractor block” available in Aspen
Plus 7.3, a Sep block (B2) has been used. The supercritical solvent, added with the co-solvent
and loaded with the extract is separated from the part that has not been extracted. An external
calculator block (called “EXTRACTO”) has been used to calculate the split fraction of the oil
component, according to the experimental curves (“k1” and “k2” parameter of the Fortran
block). In the block B4, the carbon dioxide lost at the end of the extraction during the
opening an refilling steps (while another extractor is operating in parallel) is separated. A
calculator block (called “CO2 OUT”) calculates the flow of carbon dioxide lost. A valve (B7)
is used for reducing the pressure at the desired separation pressure and a heat exchanger (B22)
is used to reach the desired separation temperature. To simulate the separation unit, a Sep
block (B8) is used. A calculator block (called “SEPARATO”) is used to calculate the split
faction of water and oil. In this block the solubility of oil calculated using the Chrastil
equation, whose parameters have been calculated from the experimental data (4.2).
(4.2)

Economical evaluation of an industrial scale application 61
Where S is the solubility (g/kg) of oil in CO2, ρ is the density (g/L), and T is the temperature
of the block (K). For the calculation of density, the separation block B10 is used to separate
CO2 since the software can calculate the density of a stream, not of a component.
For the solubility of water a curve that interpolates experimental literature data (38
) is been
used (4.3)
(4.3)
Where Sw is solubility of the water in CO2 (kg/kg), P is the pressure (bar) of the block B7, T is
the temperature (°C) of the block B22. At optimal conditions 72 bar and 34 °C, in the CO2
recycling stream water is 0.297 wt % and oil in practice absent.
Carbon dioxide passes to gas phase after depressurization and is completely recovered, it is
sent to the compressor (B9), that raises the pressure to 75 bar. At this pressure the temperature
is decreased to 5°C and allow the carbon dioxide to liquefy. Carbon dioxide is then sent to the
pump (B3) to reach the extraction pressure.
After being separated from the CO2 in the block B8, the extract has to be separated from
water. The stream EXT is depressurized at atmospheric pressure by the valve B18 and sent to
the water separator. To reproduce the laboratory conditions (rotavapor), this separation should
be done by a crystallizer. A separation block (B16) is used to separate entirely water from the
extract. To evaluate the duty that should be supplied to evaporate water and the duty to take
out to condense water and recycle it, two heat exchangers have been used. Water is
theoretically completely recycled, however for problem of convergence, a purge of 1%
hasbeen put in the split block B15. The water recycled is sent to the pump (B14) to reach the
desired extraction pressure.
Three designed specifications have been set. The production was fixed at 30 kg/h of oil
extract with the design specification called “PRODUCT”: the flow rate of solid in was varied
in order to keep this production constant. The inlet of carbon dioxide to extraction was fixed
with the design specification “CO2REC”, where the flow rate of carbon dioxide of stream 5
was fixed at 30000 kg/h varying the flow rate of fresh carbon dioxide of the stream “CO2IN”.
A similar design specification was fixed for water: the flow rate of water that enters to the
extractor was fixed at the 7 % of that of carbon dioxide varying the flow rate of fresh water in
“WATERIN”. Another design specification (HEX2) was imposed to assign the temperature
of the carbon dioxide separation block (B8). The temperature of the heat exchanger B22 was
varied in order to keep the vapor fraction of the stream “CO2REC” at 1.

62 Chapter 4
4.2 Economical analysis of the process
A calculator block (called “PRODCOST”) has been implemented to calculate the
manufacturing cost. An operation time of 8760 h/year has been considered. The cost of hot
utilities, cold utilities, electricity and raw materials have been calculated.
Prices of the utilities, that were took from Turton at al. 2009 (39
), are summarized in Table 4.2
Table 4.2: Utilities
Cost ($/GJ) BLOCK
Common Utilities
Electricity (110V - 440V) 16.8 B1,B3,B9,B14
Cooling Water (30°C to 45°C) 0.354 B18
Steam
Low Pressure (5 barg, 160°C) 6.08 B6,B22,B17
Refrigeration
Moderately Low (5°C) 4.43 B5, B11
The price of the raw materials considered are shown in Table 4.3
Table 4.3: Price of raw materials: rucola (40
), CO2 and water(41
).
Price $/kg
Rucola 0.75
CO2 0.279
Water 0.0014
In order to optimize the production cost, the effect of the separation pressure at different
extraction pressures was analysed. The production cost has been calculated at the production
of 30 kg/h. The results are shown in Figure 4.8.

Economical evaluation of an industrial scale application 63
Figure 4.8: Production cost at different separation pressures at different extraction
pressures
As can been seen, there is not a minimum value of the production cost. Increasing the
separation pressure there is anyway a decreasing of the production cost, common to all the
extraction pressures. So, the critical CO2 pressure was set as maximum of this process.
Accordingly, 72 bar was kept as the optimum separation pressure.
The effect of the extraction conditions on the production cost has been investigated. The
production cos has been calculated at different extraction pressures. The results are shown in
Figure 4.9.
Figure 4.9:Production cost at different extraction pressures at 65°C
0
1
2
3
4
5
6
7
8
9
0 20 40 60 80
Pro
d c
ost
(M
$/y
ear
)
P sep (bar)
Prod cost 150
Prod cost 200
Prod cost 250
Prod cost 300
6,15
3,96
2,82 2,97
0
1
2
3
4
5
6
7
100 150 200 250 300 350
M$
/ye
ar
P extraction (bar)

64 Chapter 4
According to the Figure 4.9 there is an optimum value of the extraction pressure at 250 bar.
The percentage distribution of the production cost at different extraction pressures is shown in
Figure 4.10.
Figure 4.10: Production cost distribution at different extraction pressures
As can be seen raw materials effects more the cost in all cases. The pumping cost (ELECT) is
lower at low extraction pressures and higher at 300 bar. The influence of the cost of utilities is
higher at high extraction pressures.
The effect of the extraction temperature on the production cost has been investigated. The
production cost has been calculated at different extraction temperatures at 300 bar, according
to the experimental extraction curves. The results are shown in Figure 4.11
Figure 4.11: Production cost at different extraction temperatures at 300 bar.
Increasing of the extraction temperature has an effective impact in reducing the production
cost passing from 45°C to 55°C. The production cost is lower at 65°C and lowest at 75 °C.
The distribution of the production cost at different temperatures is shown in Figure 4.12.
0%
10%
20%
30%
40%
50%
60%
70%
80%
90%
100%
150 200 250 300
UTHOT
UTCOLD
ELECT
RAW M
17,13
3,52 2,97
2,34
0
2
4
6
8
10
12
14
16
18
35 40 45 50 55 60 65 70 75 80
M$
/ye
ar
P extraction (bar)

Economical evaluation of an industrial scale application 65
Figure 4.12: Distribution of the production cost at different extraction temperatures.
As can be clearly seen, what effects more the cost are raw materials in all cases. Since the
yield of extraction at lower temperature is lower, consumption of raw materials increases
leading to an enhancement of the total production cost.
The influence of the flow rate of recycle of carbon dioxide on the production cost has also
been calculated. The production cost has been calculated at 300 bar and 65 °C of extraction at
different carbon dioxide recycle flow rates. The results are shown in Figure 4.13.
Figure 4.13: Production cost at different CO2 flow rates
Figure 4.13 shows that an optimum value is around 30000 kg/h.
The equipment costs have been calculated for the flow sheet at optimum conditions
(extraction at 250 bar and 65 °C , separation at 72 bar, flow rate of carbon dioxide 30000
0%
10%
20%
30%
40%
50%
60%
70%
80%
90%
100%
45 55 65 75
UTHOT
UTCOLD
ELECT
RAW M
3.08 2.82
3.00
3.43
3.77
0
0,5
1
1,5
2
2,5
3
3,5
4
10 20 30 40 50 60 70
cost
(M
$/y
ear
)
CO2 (103 kg/h)

66 Chapter 4
kg/h) using formulas suggested by Douglas (36). Aspen plus evaluation option was used for
sizing of the equipment (except for the extractors).For heat exchangers, the equation 4.3 has
been applied.
(4.3)
Where M&S is the Marshall &S wift index considered 1469.6 (0.2% year from 1457.4 of
2010), A is the exchange area (ft2) and Fc is a corrective value.
For the each vessel, the equation 4.4 has been used.
(4.4)
Where DR is the diameter (ft) and LR is the length of the vessel. For the compressors, the
equation 4.5 has been applied.
(4.5)
Where bhp is the brake power (hp). Fc is 1.55 for the extractor vessels and 1.52 fot the rest of
the equipment.
The results obtained after calculating the equipment costs are shown in Table 4.4.
Table 4.4: Total equipment cost
Equipment $
Heat exchangers 336064
Vessels (3 extractors + 1 flash vessel) 66408
Compressors 426893
Total equipment cost 829366
The distribution of the equipment cost is shown in Figure 4.14.

Economical evaluation of an industrial scale application 67
Figure 4.14: Equipment cost distribution
The total production cost distribution is shown in Figure 4.15. The equipment cost are
annualized according to Douglas (36
), using a capital charge factor (CCF) equal to 1/3. The
figure shows that the fixed capital (FCI) is really small compared to the production cost. Raw
materials are the most expensive production cost (50% ). Hot utilities (UTHOT) effects more
the production cost than cold utilities (UTCOLD), while the influence of pumping is lower
(ELECT).
Figure 4.15: Total manufacturing cost distribution.
Finally, an analysis of the profitability of the process has been made. The total capital
investement (TCI) and the total production cost (TPC) have been estimated using the formula
of Douglas (36
), shown in equations 4.6 and 4.7.
(4.6)
H EX 41%
Vessels 8%
Compressor 51%
RAW MATERIALS
50%
ELECT 7%
UTCOLD 8%
UTHOT 26%
FCI 9%

68 Chapter 4
(4.7)
The total capital investment and the total production cost are shown in Table 4.5
Table 4.5: Estimate of TCI and TPC
$ / year
TCI 1957304
TPC 6079304
For the evaluation of the profitability the following hypothesis has been considered :
Life of the plant =10 years
Period of start up = 2 years
Depreciation = (DDB method)7 years
Taxation = 40 %
Interest = 10%
Fixed capital land = 1000000 $
Residual value = 150000$
The market price of the extract varies from 10 to 80 $/kg (42
). With the hypothesis considered
the process will have a net present value positive at the end of life if the price of the extract is
higher than 29.8 $/kg. The flow cash diagram is shown in Figure 4.16.
Figure 4.16: Cash Flow diagram
-9
-8
-7
-6
-5
-4
-3
-2
-1
0
-1 0 1 2 3 4 5 6 7 8 9 10 11 12 13
M$
years

Economical evaluation of an industrial scale application 69
Since the process is profitable if the selling price of the extract is higher than 29.8$/kg and
since the market price can be much bigger (80$/kg), this process can be interesting for future
developments.


Conclusion
Different experimental tests have been carried out in order to extract glucosinolates,
flavonoids and fatty acids from leaves of rocket salad (Eruca sativa) using supercritical
carbon dioxide extraction. SC-CO2 extractions using pure CO2 and three co-solvents (water,
ethanol and methanol) have been carried out. Results show that SC-CO2 extraction is faster
and available at lower temperatures compared to the Soxhlet. When ethanol was employed as
co-solvent, the best yield (5.54 %) was obtained at 300 bar, 65 °C, 0.5 mL/min of ethanol and
0.3 kg/h of carbon dioxide. Applying a mechanical pre-treatment was observed to increase the
yield. Then, SC-CO2 was performed using water as co-solvent and the influence of the
extraction variables was investigated. The optimum values of water dosage and temperature
were 0.4 mL/min and 65°C, respectively. Increasing of temperature was observed to have a
direct effect on the enhancement of the extraction yield, while increasing of pressure did not
effect significantly the extraction yield. Comparing ethanol, methanol and water at the same
extraction conditions (300 bar, 45°C and 7 wt % co-solvent), the yield obtained with ethanol
and methanol were similar (5.54 and 5.56 %, respectively) while the yield obtained with
water was much higher (21.71 %). The analysis of the extract shows that glucosinolates and
flavonoids were mainly extracted using water as co-solvent. The highest amount of
glucosinolates was obtained with 0.4 mL/min of water at 300 bar, glucoraphanin and DMB-
GLS were the main compounds. The highest amount of flavonoids was obtained with 0.4
mL/min of water at 300 bar at the highest temperature (75 °C), Quercetin derivatives were the
main compounds. Glucosinolates and flavonoids were extracted using SC-CO2 while only
traces of them have been found in the Soxhelt extracts. Lipids were extracted using pure SC-
CO2, being the extract very rich in unsaturated fatty acids.
A conceptual design of an industrial process that produces an extract rich in glucosinolates
and flavonoids starting from freeze-dried rocket salad, water and carbon dioxide has been
proposed. The basic idea was a scale-up of the laboratory plant to a size able to treat 100 kg/h
of rocket salad. The software Aspen Plus has been employed for the simulation. The influence
of the extraction pressure and the extraction temperature has been investigated, obtaining the
lowest production cost at 250 bar and 65 °C. The effect of the separation pressure on the
production cost has also been studied, obtaining an optimum value at 72 bar. Finally, an
analysis of the profitability of the process was made showing that with an interest of 10% the
net present value of the process would be positive if the selling price of the extract was higher
than 29.8 $/kg.


1. Eggers R , Pilz S (2011), High Pressure Processing, Industrial Scale Natural Products
Extraction, Wiley-VCH Verlag GmbH & Co. KGaA.
2. Brunner G (2004), Supercritical fluids: technology and application to food processing.
Journal of Food Engineering, 67, 21-33.
3. "Phase change data for Carbon dioxide". National Institute of Standards and
Technology. Retrieved 2008-01-21.
4. Beckman EJ (2003), Supercritical and near-critical CO2 in chemical synthesis and
processing, Journal of Supercritical Fluids, 28, 121-191.
5. Praxair Material Data safety sheet, P-4574-H, May, 1999.
6. Yaniv Z (1997), Traditions, uses and research on rocket in Israel, Rocket, a
Mediterranean crop for the world, International Plant Genetic Institute, Rome, 76-80.
7. Alqasoumi S, Al-Sohaibani M, Al-Howiriny T, Al-Yahya M, Rafatullah S.(2009),
Rocket "Eruca sativa ": A salad herb with potential gastric anti-ulcer activity. World J
Gastroenterol ; 15(16): 1958-1965 .
8. Lynn A, Collins A, Fuller Z, Hillman K, Ratcliffe B (2006). Cruciferous
vegetables and colo-rectal cancer. Proc. Nutr. Soc., 65: 135-144.
9. Rafatullah S, AlSheikh A, Alqasoumi S, Al-Yahya M, El-Tahir K, Galal A
(2008). Protective effect of fresh radish juice (Raphanus sativus L.) against carbon
tetrachloride induced hepatotoxicity. Int. J. Pharmacol., 4: 1-5.
10. Pasini F Verardo, Caboni V MF, D’Antuono LF (2012), Determination of
glucosinolates and phenolic compounds in rocket salad by HPLC-DAD–MS:
Evaluation of Eruca sativa Mill. and Diplotaxis tenuifolia L. genetic resources. Food
Chem. 133, 1025–1033.
11. Douglas C, Abbel S (2006), Glucosinolate metabolism and its control, Plant Science,
Vol.11 No.2.
12. Shroff R, Vergara F, Muck A, Savatos A, Gershenzon J (2008), Nonuniform
distribution of glucosinolates in Arabidopsis thaliana leaves has important
consequences for plant defense, PNAS, Vol.105 No.16.
13. Das S, Tyagi A K, Kaur H (2000). Cancer modulation by glucosinolates: a review.
Current Science, 79(12), 1665–1671.
14. Keum YS, Jeong WS, Kong ANT(2004), Chemoprevention by isothiocyanates and
their underlying molecular signalling mechanisms,Mutation Research, 555, 191–202.
15. Smith TJ (2001), Mechanisms of carcinogenesis inhibition by isothiocyanates, Expert
Opinion on Investigational Drugs, 10, 2167–2174.

16. Zhang Y (2004), Cancer-preventive isothiocyanates: Measurement of humanexposure
and mechanism of action, Mutation Research, 555, 173–190.
17. Bennett RN, Mellon FA, Botting NP, Eagles J, Rosa EAS, Williamson G (2002).
Identification of the major glucosinolate (4-mercaptobutylglucosinolate) in leaves of
Eruca sativa L., Phytochemistry, 61, 25–30.
18. Kim SJ, Jin S, Ishii G. (2004), Isolation and structural elucidation of 4-(b-
Dglucopyranosyldisulfanyl) butyl glucosinolate from leaves of rocket salad (Eruca
sativa L.) and its antioxidative activity, Bioscience Biotechnology Biochemistry,
68,2444–2450.
19. Daxenbichler ME, Spencer GF, Carlson DG, Rose GB, Brinker AM, Powell RG
(1991), Glucosinolate composition of seeds from 297 species of wild plants,
Phytochemistry, 30, 2623–2638.
20. Cataldi TR, Rubino A, Lelario F, Bufo SA (2007), Naturally occurring glucosinolates
in plant extracts of rocket salad (Eruca sativa L.) identified by liquid chromatography
coupled with negative ion electrospray ionization and quadrupole ion-trap mass
spectrometry, Rapid Communication in Mass Spectrometry, 21, 2374–2388.
21. Erlund I (2004), Review of the flavonoids quercetin, hesperetin, and naringenin.
Dietary sources, bioactivities, bioavailability, and epidemiology. NutritionResearch,
24, 851–874.
22. Halliwell B, Zhao K, Whiteman M (2000). The gastrointestinal tract: A majorsite of
antioxidant action, Free Radical Research, 33, 819–830.
23. Ko MJ, Cheigh CI, Cho SW, Chung MS (2014). Relationship analysis between
flavonoids structure and subcritical water extraction (SWE), Food Chemistry, 143,
147–155.
24. Sun M, Xu L, Saldana MDA, Temelli F (2008), Comparison of canola meals obtained
with conventional methods and supercritical CO2 with and without ethanol, Journal
am oil chemistry Soc,85, 667-675.
25. Liza MS, Abdul Rahman R, Mandana B, Jinap S, Rahmat A, Zaidul ISM, Hamid A
(2010), Supercritical carbon dioxide extraction of bioactive flavonoid from
Strobilanthes crispus (Pecah Kaca), Food and Bioproducts Processing, 88, 319-326.
26. Gamache PH, McCabe D, Parvez H, Parvez S and Acworth IN, 1997. Progress in
HPLC-HPCE, vol. 6, VS Press, TheNetherlands, 99–126.
27. Abu BMF, Teh AH, Rahmat A , Osman F( 2006), Effects of Strobilanthes crispus tea
aqueous extracts on glucose and lipidprofile in normal and streptozotocin-induced
hyperglycemi rat. Plant Foods Hum Nutr, 61(1), 7–12.
28. Chiu KL, Cheng YC, Chen JH, Chang CJ, Yang PW (2002), Supercritical fluids
extraction of Ginkgo ginkgolides andflavonoids, Journal of Supercritical Fluids, 24,
77-87.

29. Arnaiz E, Bernal J, Martin MT, Garcia-Viguera C, Bernal JL, Toriblo L (2011),
Journal of Lipid Science Technology,113, 479-486.
30. http://www.inran.it/646/tabelle_di_composizione_degli_alimenti.html?idalimento=00
5460&quant=100.
31. http://www.ellab.com/applications/medical/pharma/lyophilization.aspx.
32. Bertucco A, Vetter G (2001), Supercritical fluid extraction and fractionation from
solid materials, High pressure process technology: Fundamentals and applications,
Elsevier, 378-379.
33. Bertucco A, Vetter G (2001), Supercritical fluid extraction and fractionation from
solid materials, High pressure process technology: Fundamentals and applications,
Elsevier, 387-388.
34. Da Porto C, Natolino A, Decorti D (2014), Extraction of proanthocyanidins from
grape marc by supercritical fluid extraction using CO2 as solvent and ethanol-water
mixture as co-solvent, Journal of supercritical fluids, 16, 1-8.
35. http://goldbook.iupac.org/D01751.html
36. Douglas JM (1988), Conceptual design of Chemical Processes, McGraw-Hill, New
York (USA).
37. Bender E, Equations of state exactly representing the phase behavior of pure
substances, in: Proceedings of the Fifth Symposium on Thermophys. Prop., ASME,
New York, 1970.
38. Coan RC, King AD (1971), Solubility of Water in Compressed Carbon Dioxide,
Nitrous Oxide, and Ethane. Evidence for Hydration of Carbon Dioxide and Nitrous
Oxide in the Gas Phase, Journal of the American Chemical Society, 93,1857.
39. Turton R (2009), Analysis, synthesis, and design of chemical processes, 3rd
ed,Upper
Saddle River, N.J. : Prentice Hall.
40. http://www.an.camcom.gov.it/sites/default/files/Listino%20febbraio%202012.pdf
41. http://www.icis.com/
42. http://www.alibaba.com/


![Review Analytical-scale supercritical fluid extraction: a ...quimica.udea.edu.co/~carlopez/cromatogc/sfe polluntants... · Analytical-scale supercritical fluid extraction ... [lo],](https://static.fdocuments.in/doc/165x107/5ab139fa7f8b9a6b468c4025/review-analytical-scale-supercritical-fluid-extraction-a-carlopezcromatogcsfe.jpg)
