A Summary of the Results of the 2016 Billion-Ton Report ...
46
1 | Bioenergy Technologies Office eere.energy.gov A Summary of the Results of the 2016 Billion-Ton Report: Advancing Domestic Resources for a Thriving Bioeconomy, Vol. 1 July 21, 2016 Dr. Mark Elless U.S. Department of Energy Dr. Matthew Langholtz Mr. Laurence Eaton Mr. Aaron Myers Oak Ridge National Laboratory Dr. Bryce Stokes Allegheny Science and Technology – Contractor to the U.S. Department of Energy
Transcript of A Summary of the Results of the 2016 Billion-Ton Report ...

1 | Bioenergy Technologies Office eere.energy.gov
A Summary of the Results of the 2016 Billion-Ton Report: Advancing Domestic Resources for a Thriving Bioeconomy, Vol. 1
July 21, 2016
Dr. Mark EllessU.S. Department of Energy
Dr. Matthew LangholtzMr. Laurence Eaton Mr. Aaron MyersOak Ridge National Laboratory
Dr. Bryce StokesAllegheny Science and Technology –Contractor to the U.S. Department of Energy
2 | Bioenergy Technologies Office
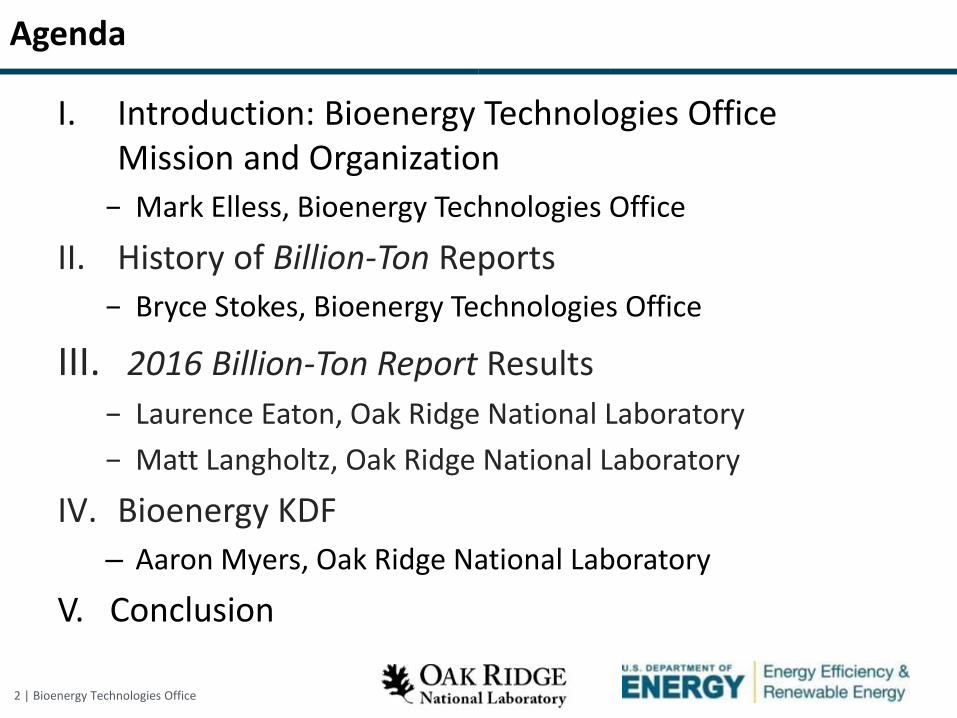
Agenda
I. Introduction: Bioenergy Technologies Office Mission and Organization
− Mark Elless, Bioenergy Technologies Office
II. History of Billion-Ton Reports
− Bryce Stokes, Bioenergy Technologies Office
III. 2016 Billion-Ton Report Results
− Laurence Eaton, Oak Ridge National Laboratory
− Matt Langholtz, Oak Ridge National Laboratory
IV. Bioenergy KDF
– Aaron Myers, Oak Ridge National Laboratory
V. Conclusion

3 | Bioenergy Technologies Office
Please record any questions and comments you may have during the webinar and send them in using the webinar chat function, or to [email protected]
As a follow-up to the webinar, the presenter(s) will provide responses to selected questions.
Slides from this presentation will be posted online: http://www.energy.gov/eere/bioenergy/webinars
For general questions regarding the Bioenergy Technologies Office, please email [email protected]
Questions and Comments

4 | Bioenergy Technologies Office
Started in May 2010 to highlight “hot topics” in biomass and bioenergy industry.
Bioenergy Technologies Office Webinar Series
Find past webinars and today’s slides on the Office’s website: http://www.energy.gov/eere/bioenergy/webinars
5 | Bioenergy Technologies Office
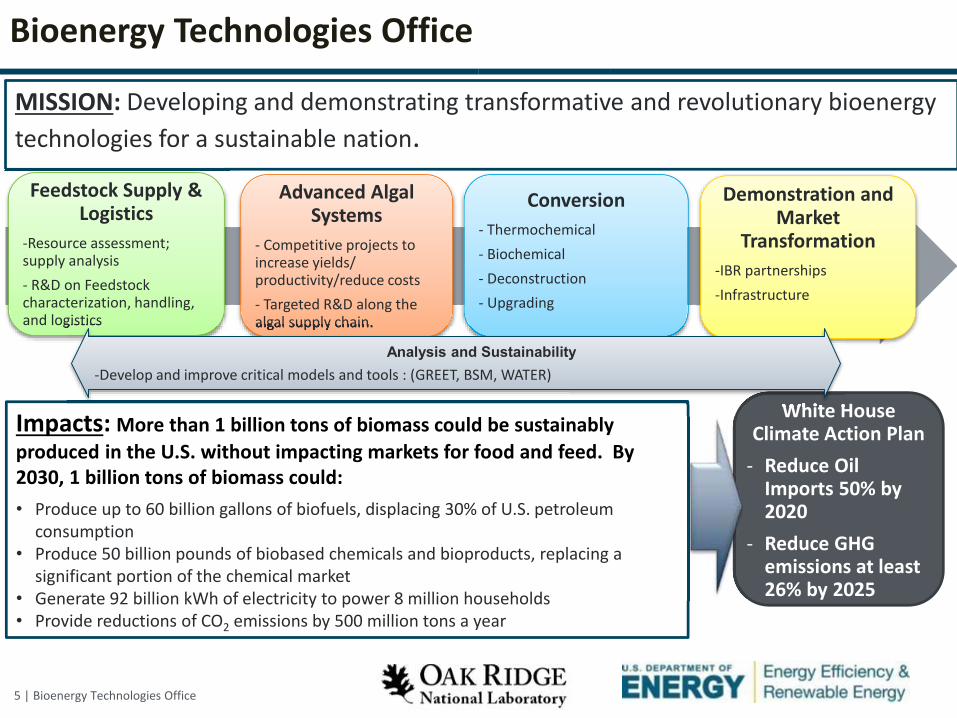
Bioenergy Technologies Office
• Bullet pointsMISSION: Developing and demonstrating transformative and revolutionary bioenergy
technologies for a sustainable nation.
Impacts: More than 1 billion tons of biomass could be sustainably
produced in the U.S. without impacting markets for food and feed. By 2030, 1 billion tons of biomass could:
• Produce up to 60 billion gallons of biofuels, displacing 30% of U.S. petroleum consumption
• Produce 50 billion pounds of biobased chemicals and bioproducts, replacing a significant portion of the chemical market
• Generate 92 billion kWh of electricity to power 8 million households• Provide reductions of CO2 emissions by 500 million tons a year
White House Climate Action Plan
- Reduce Oil Imports 50% by 2020
- Reduce GHG emissions at least 26% by 2025
Feedstock Supply & Logistics
-Resource assessment; supply analysis
- R&D on Feedstock characterization, handling, and logistics
Conversion
- Thermochemical
- Biochemical
- Deconstruction
- Upgrading
Demonstration and Market
Transformation
-IBR partnerships
-Infrastructure
Advanced Algal Systems
- Competitive projects to increase yields/ productivity/reduce costs
- Targeted R&D along the algal supply chain.
White House
and logistics algal supply chain.
-Develop and improve critical models and tools : (GREET, BSM, WATER)
Analysis and Sustainability

6 | Bioenergy Technologies Office
Feedstock Supply and Logistics
Focus• Fully integrate feedstocks into supply chain
(multiple interfaces).
• Reform raw biomass into high-quality feedstocks.
• Use innovative technologies to ensure sustainable supply and reduce costs.
• Reduce risks to enable industry expansion.
Approaches• Use basic and applied science to
understand, model, and manage.
• Provide nationally, but solve locally.
• Meet environmental performance targets and goals while assuring sustainability.
• Work with stakeholders and partners.
Biomass Supply
Cost
QuantityQuality

7 | Bioenergy Technologies Office
Billion-Ton History
Resource assessment + Economic Analysis
• Timeline to 2030• County-level biomass
feedstock availability estimates
• Broad energy crop definitions and estimates
• Harvesting biomass only (not delivering biomass)
Resource assessment + Economic Analysis
• Extended timeline• Updated agricultural
projections• Detailed cost analysis • Algae and energy crops• Regional analysis • Environmental sustainability
analyses
Resource assessment
• How much biomass is available in the U.S.?
• Can we produce a sustainable supply of biomass that can displace 30% of the country’s current petroleum consumption?

8 | Bioenergy Technologies Office
Webinar Agenda
I. Currently Used Biomass
II. Volume 1 Overview
A. Motivation
B. Introduction
C. Contributors
D. Outline
III. Resource AssessmentI. Forestry (roadside)
II. Agricultural Resources (farmgate)
III. Wastes (roadside)
IV. Algae
IV. Delivered Costs
V. Quick Update: Volume 2

9 | Bioenergy Technologies Office
Biomass is Largest Source of Domestic Renewable Energy
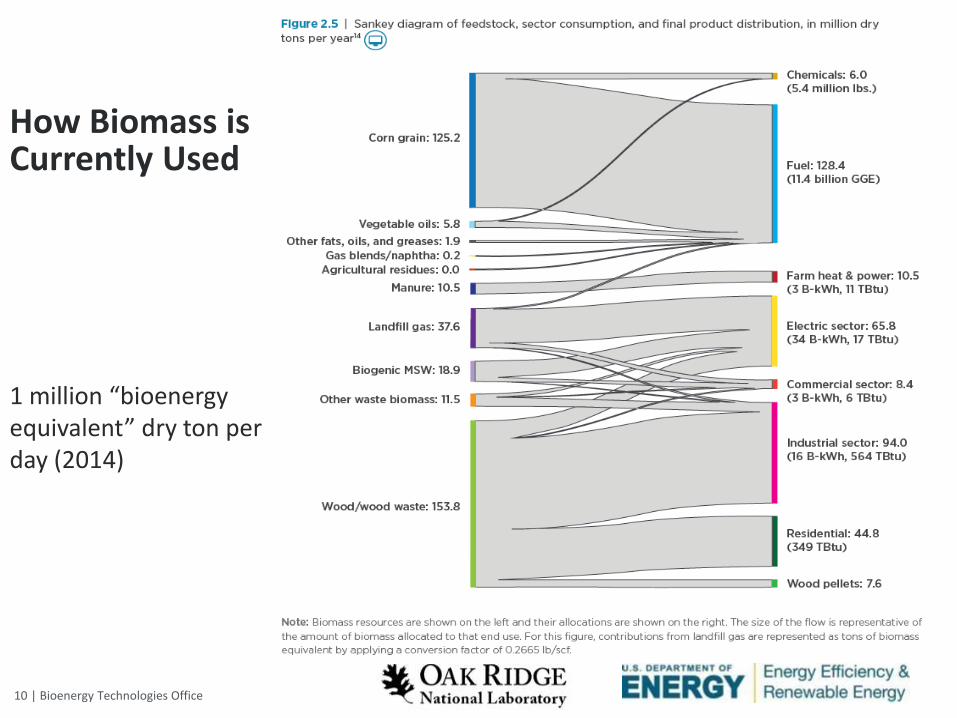
10 | Bioenergy Technologies Office
How Biomass is Currently Used
1 million “bioenergy equivalent” dry ton per day (2014)

11 | Bioenergy Technologies Office
Motivation
• Enormous U.S. domestic biomass potential – 2005 and 2011 reports identified > 1 billion ton annual
supply
• Understanding and quantifying biomass supply fosters commercialization to increase – Energy security,
– Energy independence, and
– Environmental stewardship
• Sustainable production is critical to long-term viability of technology for clean energy

12 | Bioenergy Technologies Office
Trials with Received Data (as of February 9, 2012)
RegionsNorth Central
Northeast
South Central
Southeast
Western
FeedstockCRP
Cereal Stover
Corn Stover
Energycane
MXG
Poplar
Sorghum
Switchgrass
Willow
Contributors

13 | Bioenergy Technologies Office
Schematic of Biomass Supply Chain

14 | Bioenergy Technologies Office
Major Biomass Sources, 2040
Base case scenario, 2040, $60 per dry ton or less

15 | Bioenergy Technologies Office
Example Visualization

16 | Bioenergy Technologies Office
Interactive Resources
http://bioenergykdf.net/billionton
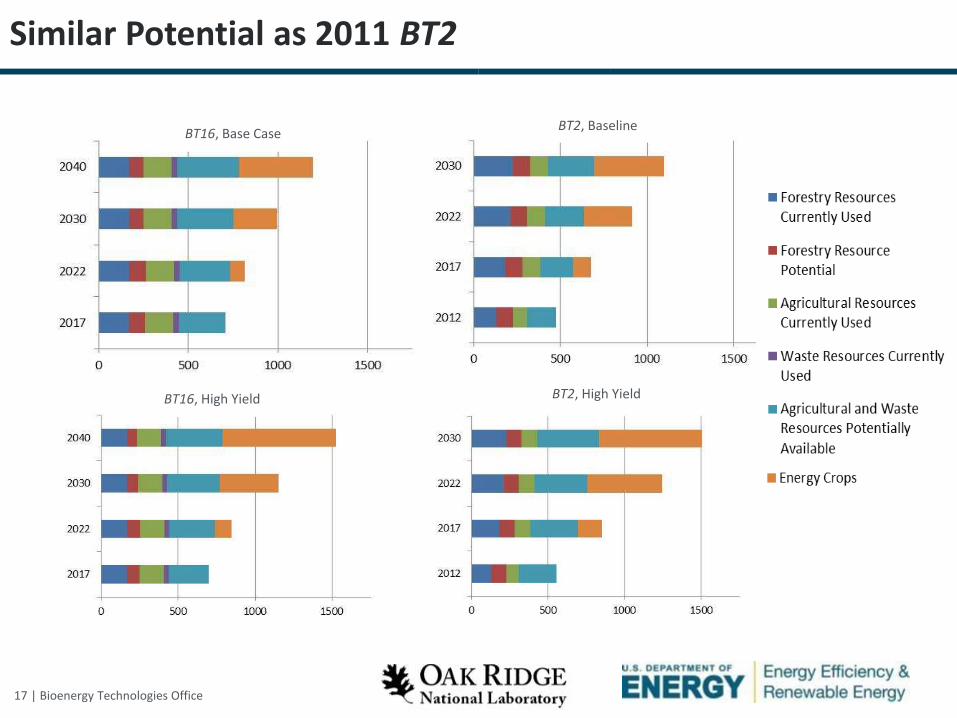
17 | Bioenergy Technologies Office
Similar Potential as 2011 BT2
BT16, Base CaseBT2, Baseline
BT2, High YieldBT16, High Yield

18 | Bioenergy Technologies Office
Sustainability Criteria—Forestry
Sustainability Assumption or Constraint Sustainability Category Implementation
Only includes timberlands, removal of fragile, reserved, protected, and environmentally sensitive forestland from database
Soil quality, water quality Excluded land area
Only stands with ½ mile of road was harvested – no road building
Excluded land area and
management assumption
Use of production and harvest systems specified for particular species, timber size, and land condition
Management assumptions
Management of residue removal levels to protect soil and water, and ensure long-term productivity
Land characteristic
assumption
Leaving at least 30% of logging residues onsite to protect soil, provide habitat, and maintain soil carbon
Management assumption
Inclusion of funding for use of best management practices (BMPs) in cost estimates
Management assumption
Management of harvest levels to ensure growth always exceeds harvest at the state level
Spatially explicit management
assumptions
No removal of timber or biomass on slopes greater than 40%, except in Pacific Northwest
Excluded land area

19 | Bioenergy Technologies Office
Base-case scenario, $60 roadside, forestry resources, year 2040

20 | Bioenergy Technologies Office
Sustainability Criteria—Agriculture
Sustainability Assumption or Constraint Sustainability Category Implementation
Trend toward reduced till and no till for corn, wheat Soil quality, water quality Management assumptions
High fraction of crop acres no-till Management assumptions
Residue removal prohibited on conventionally tilled acres Management assumptions
Crop residue removal based on wind and water erosion
estimates and soil carbon loss
Residue removal tool used to
estimate retention coefficients
No residue removal for soy Management assumption
Acceptable residue removal different for reduced and no till Residue removal tool to
estimate retention coefficients
Multi-county NRCS crop management zones (e.g., tillage
assumptions)
Spatially explicit rotation and
management assumptions
Annual energy crops on land with low erosion potential and
assumed part of multicrop rotation
Excluded land area
Irrigated cropland or pasture excluded Water quantity Excluded land area
No supplemental irrigation of energy crops Management assumptions
No use of pastureland in counties west of 100th meridian Excluded land area
No transition of non-agricultural lands to energy crops Greenhouse gas emissions Excluded land area
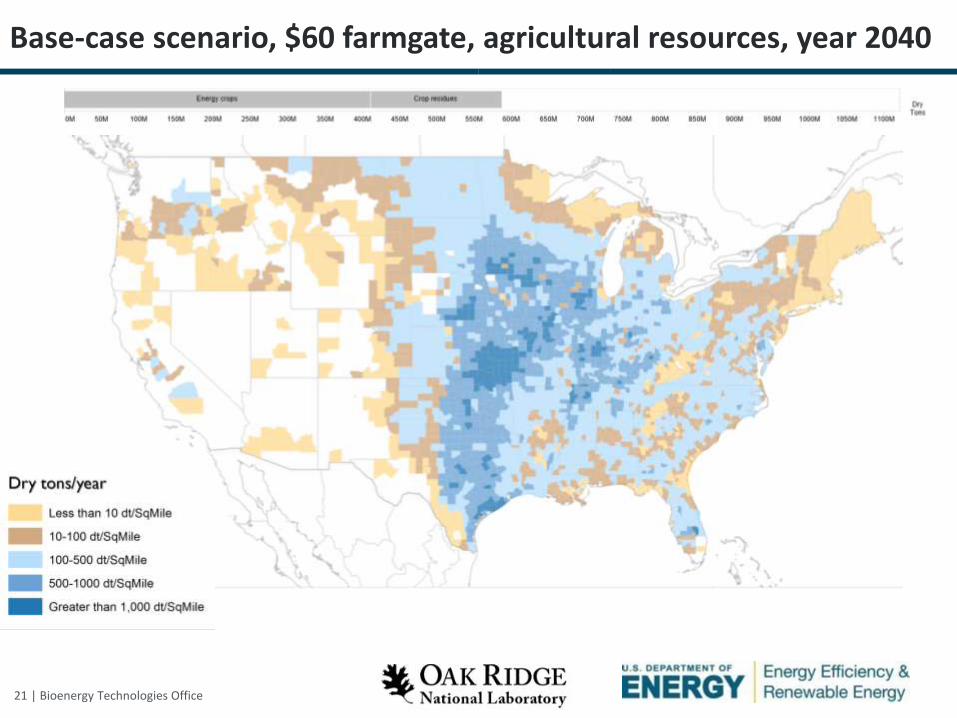
21 | Bioenergy Technologies Office
Base-case scenario, $60 farmgate, agricultural resources, year 2040

22 | Bioenergy Technologies Office
Base-case scenario, $60 offered price, waste resources, year 2040

23 | Bioenergy Technologies Office
Microalgae Resources Analysis
• Co-location near CO2 facilities
• Freshwater and saline culture
• Open ponds/raceways
• Lined and unlined ponds
• Present and future productivities
Scenario Ethanol
plant
Coal
EGU
Natural
gas EGU
Million
tons
Prices per
dry ton
Present productivities,
freshwater
12 19 15 <46 $719–$2,030
Present productivities,
saline
10 54 21 <86 $755–$2,889
Future productivities,
freshwater
13 10 0 <23 $490–$1,327
Future productivities,
saline
11 12 0 <24 $540–$2,074

24 | Bioenergy Technologies Office
0.365 0.365 0.365 0.365 0.365 0.365 0.365
0.0
0.2
0.4
0.6
0.8
1.0
1.2
1.4
1.6
2017 2020 2022 2025 2030 2035 2040
Bill
ion
Dry
To
ns
pe
r Ye
ar
Currently used
Current and Potential, Base Case
Currently used
0.0
0.2
Currently used at market prices, potential supplies up to $60/dt (2014$)

25 | Bioenergy Technologies Office
0.365 0.365 0.365 0.365 0.365 0.365 0.365
0.138 0.139 0.140 0.140 0.141 0.141 0.142
0.0
0.2
0.4
0.6
0.8
1.0
1.2
1.4
1.6
2017 2020 2022 2025 2030 2035 2040
Bill
ion
Dry
To
ns
pe
r Ye
ar
Wastes
Currently used
Currently used
0.0
0.2
Currently used at market prices, potential supplies up to $60/dt (2014$)
Current and Potential, Base Case at $60/dt

26 | Bioenergy Technologies Office
0.365 0.365 0.365 0.365 0.365 0.365 0.365
0.138 0.139 0.140 0.140 0.141 0.141 0.142
0.103 0.109 0.109 0.101 0.097 0.101 0.097
0.0
0.2
0.4
0.6
0.8
1.0
1.2
1.4
1.6
2017 2020 2022 2025 2030 2035 2040
Bill
ion
Dry
To
ns
pe
r Ye
ar
Forestland Resources
Wastes
Currently used
Currently used
0.0
0.2
Currently used at market prices, potential supplies up to $60/dt (2014$)
Current and Potential, Base Case at $60/dt

27 | Bioenergy Technologies Office
0.365 0.365 0.365 0.365 0.365 0.365 0.365
0.138 0.139 0.140 0.140 0.141 0.141 0.142
0.103 0.109 0.109 0.101 0.097 0.101 0.097
0.104 0.116 0.123 0.135 0.149 0.163 0.176
0.0
0.2
0.4
0.6
0.8
1.0
1.2
1.4
1.6
2017 2020 2022 2025 2030 2035 2040
Bill
ion
Dry
To
ns
pe
r Ye
arAgricultural residues
Forestland Resources
Wastes
Currently used
Currently used
0.0
0.2
0.4
0.6
Bill
ion
Dry
To
ns
pe
r Ye
ar
Near-term potential
Currently used at market prices, potential supplies up to $60/dt (2014$)
Current and Potential, Base Case at $60/dt
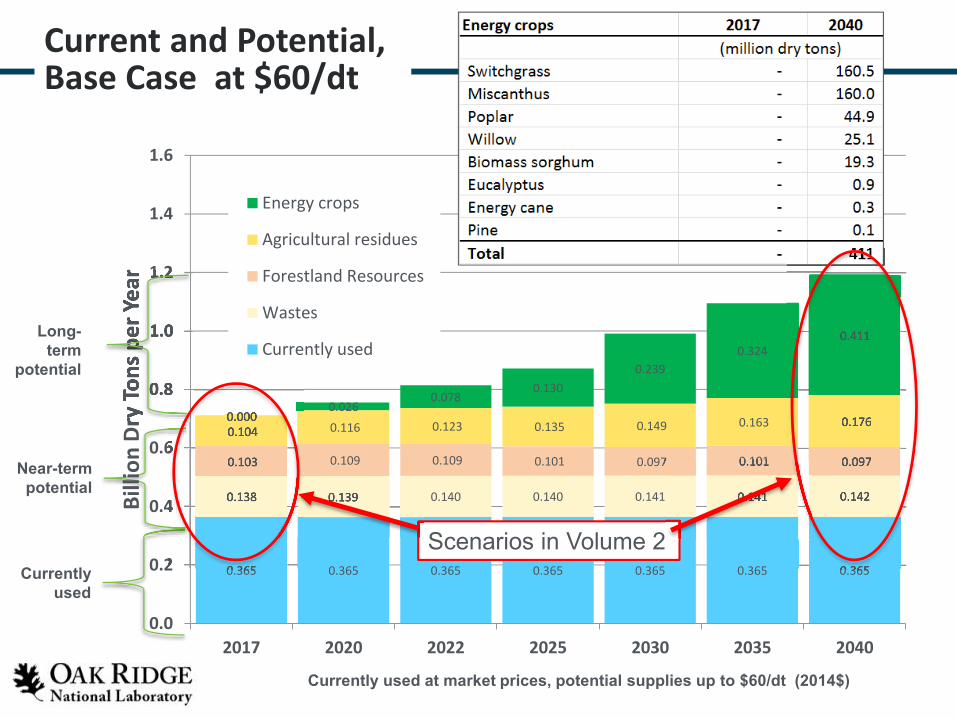
28 | Bioenergy Technologies OfficeCurrently used at market prices, potential supplies up to $60/dt (2014$)
Currently used
Near-term potential
0.365 0.365 0.365 0.365 0.365 0.365 0.365
0.138 0.139 0.140 0.140 0.141 0.141 0.142
0.103 0.109 0.109 0.101 0.097 0.101 0.097
0.104 0.116 0.123 0.135 0.149 0.163 0.176 0.0000.026
0.0780.130
0.239
0.3240.411
0.0
0.2
0.4
0.6
0.8
1.0
1.2
1.4
1.6
2017 2020 2022 2025 2030 2035 2040
Bill
ion
Dry
To
ns
pe
r Ye
ar
Energy crops
Agricultural residues
Forestland Resources
Wastes
Currently used
0.8
1.0
1.2
Bill
ion
Dry
To
ns
pe
r Ye
ar
Long-term
potential0.8
0.3650.2
0.4
0.6
0.138
0.103
0.104 0.0000.000
0.365
0.142
0.097
0.176
0.411
Scenarios in Volume 2
0.141
0.097 0.101
0.139
Current and Potential, Base Case at $60/dt

29 | Bioenergy Technologies Office
Currently used at market prices, potential supplies up to $60/dt (2014$)
Currently used
Near-term potential
Long-term
potential
0.365 0.365 0.365 0.365 0.365 0.365 0.365
0.138 0.139 0.140 0.140 0.141 0.141 0.142
0.103 0.109 0.109 0.101 0.097 0.101 0.097
0.105 0.123 0.135 0.152 0.174 0.189 0.200 0.0000.035
0.1100.192
0.380
0.559
0.736
0.0
0.2
0.4
0.6
0.8
1.0
1.2
1.4
1.6
2017 2020 2022 2025 2030 2035 2040
Bill
ion
Dry
To
ns
per
Yea
r
Energy crops
Agricultural residues
Forestland Resources
Wastes
Currently used
0.142
0.097
0.200
0.736
Scenario in Volume 2
0.141
0.101
Current and Potential, High Yield Ag. at $60/dt

30 | Bioenergy Technologies Office
Supplies Vary with Price and Time
https://bioenergykdf.net/billionton2016/1/9/tableau
BT16 Fig. ES.6

31 | Bioenergy Technologies Office
Supplies Vary Spatially and Temporally
https://bioenergykdf.net/billionton2016/1/2/tableau
Near-term potential (2017):
Long-term potential (2040, base case):

32 | Bioenergy Technologies Office
- 100,000,000 200,000,000 300,000,000 400,000,000
Oats straw
Barley straw
Primary mill residue
Sugarcane trash
Sorghum stubble
Rice hulls
Citrus residues
Tree nut residues
Cotton gin trash
Other forest thinnings
Other
Noncitrus residues
Sugarcane bagasse
Secondary mill residue
Rubber and leather
Cotton residue
Energy cane
Rice straw
Milk cow manure, 500+ head
Textiles
Hogs manure, 1000+ head
Other forest residue
Paper and paperboard
Plastics
Wheat straw
Pine
Eucalyptus
Yard trimmings
MSW wood
Forest residues
CD waste
Biomass sorghum
Whole trees
Willow
Poplar
Corn stover
Switchgrass
Miscanthus
Dry tons per year
2022, base case
2040, base case
2040, high yield
Other forest thinnings
Secondary mill residue
Milk cow manure, 500+ head
Hogs manure, 1000+ head
Paper and paperboard
0 100,000,000 200,000,000 300,000,000 400,000,000
Eucalyptus
Yard trimmings
MSW wood
Forest residues
CD waste
Biomass sorghum
Whole trees
Willow
Poplar
Corn stover
Switchgrass
Miscanthus
Dry tons per year
Feedstocks in Delivered Scenario Analysis
2022, base case
2040, base case
2040, high yield
Miscanthus
Feedstocks in Delivered Scenario Analysis
Wheat straw
Pine
Eucalyptus
Yard trimmings
MSW wood
Forest residues
CD waste
Biomass sorghum
Whole trees
Willow
Poplar
Corn stover
Switchgrass
Miscanthus
*Potentially available at up to $60/dry ton
All
Pot
entia
l Fee
dsto
cks*
Feedstocks to the Delivered Analysis

33 | Bioenergy Technologies Office
Delivered Scenario Analysis

34 | Bioenergy Technologies Office
Delivered Scenario Analysis

35 | Bioenergy Technologies Office
Delivered Scenario Analysis

36 | Bioenergy Technologies Office
Delivered Scenario Analysis

37 | Bioenergy Technologies Office
Delivered Scenario Analysis

38 | Bioenergy Technologies Office
Delivered Scenario Analysis

39 | Bioenergy Technologies Office
Delivered Scenario Analysis

40 | Bioenergy Technologies Office
Delivered Cost by County, Base Case, 2040
https://bioenergykdf.net/billionton2016/6/2/tableau
Long-term roadside (2040, base case):
Long-term delivered costs (2040, base case):

41 | Bioenergy Technologies Office
Advancing Resources
Adapted from DOE-EERE (2006) and NREL (2011). See also Batidzirai, Smeets, and Faaij (2012)

42 | Bioenergy Technologies Office
Supply push
Mar
ket
pu
llM
arke
t p
ull
Advancing Resources
• Conversion• Bioproducts• International markets
• Crop improvement• Advanced logistics• Precision agriculture

44 | Bioenergy Technologies Office
BT16 Volume 2Indicator
Soil quality 1. Total organic carbon (TOC)
2. Total nitrogen (N)
3. Extractable phosphorus (P)
4. Bulk density
Water quality and quantity
5. Nitrate concentration in streams (and export)
6. Total phosphorus (P) concentration in streams (and export)
7. Suspended sediment concentration in streams (and export)
8. Herbicide concentration in streams (and export)
9. Storm flow
10. Minimum base flow
11. Consumptive water use
Additional: Water yield
IndicatorGreenhouse gases 12. CO2 equivalent emissions
(CO2 and N2O)
Biodiversity 13. Presence of taxa of special concern
14. Habitat area of taxa of special concern
Air quality 15. Tropospheric ozone
16. Carbon monoxide17. Total particulate matter less than 2.5μm diameter (PM2.5)
18. Total particulate matter less than 10μm diameter (PM10)Additional: VOCs, SOx, NOx
Productivity 19. Aboveground net primary productivity or Yield
McBride et al. (2011) Ecological
Indicators 11:1277-1289Addressed in BT16 volume 2

45 | Bioenergy Technologies Office
Summary
• Resource assessments indicate vast national sustainable potential, over 1 billion tons/yr.
• Future biomass utilization is a function of supply and demand interactions.
• Resource assessments can help evaluate impacts of supply push and market pull and inform strategies to increase biomass utilization.
• Future research should advance from “how much is there” to “how can it happen”.

46 | Bioenergy Technologies Office
Thank you!
Laurence Eaton
Matt Langholtz
Questions?
http://bioenergykdf.net/billionton

47 | Bioenergy Technologies Office
Conclusions
Questions?
Email [email protected]
Please include “Billion-Ton Report Webinar” in the Subject Line
Thank you!