A subsidiary of San Miguel Corporationsanmiguelbrewery.com.ph/pdf/SMB Materials for Investors'...
29
August 10, 2016 PHILIPPINE DEALING & EXCHANGE CORP. 37/F, Tower I, The Enterprise Center 6766 Ayala Ave., cor. Paseo de Roxas Makati City Attention: MS. VINA VANESSA S. SALONGA Head, Issuer Compliance and Disclosure Department Gentlemen: Attached are the materials for the combined Investors’ Briefing on the 2016 First Semester Results of San Miguel Brewery Inc., San Miguel Corporation, Ginebra San Miguel Inc., San Miguel Pure Foods Company, Inc., and Petron Corporation. Very truly yours, ROSABEL T. BALAN Vice President and General Counsel SAN MIGUEL BREWERY INC. A subsidiary of San Miguel Corporation
Transcript of A subsidiary of San Miguel Corporationsanmiguelbrewery.com.ph/pdf/SMB Materials for Investors'...
August 10, 2016 PHILIPPINE DEALING & EXCHANGE CORP. 37/F, Tower I, The Enterprise Center 6766 Ayala Ave., cor. Paseo de Roxas Makati City Attention: MS. VINA VANESSA S. SALONGA Head, Issuer Compliance and Disclosure Department Gentlemen: Attached are the materials for the combined Investors’ Briefing on the 2016 First Semester Results of San Miguel Brewery Inc., San Miguel Corporation, Ginebra San Miguel Inc., San Miguel Pure Foods Company, Inc., and Petron Corporation. Very truly yours,
ROSABEL T. BALAN Vice President and General Counsel
SAN MIGUEL BREWERY INC. A subsidiary of San Miguel Corporation

i n v e s t o r s ’ b r i e f i n g 2 0 1 6 f i r s t s e m e s t e r r e s u l t s
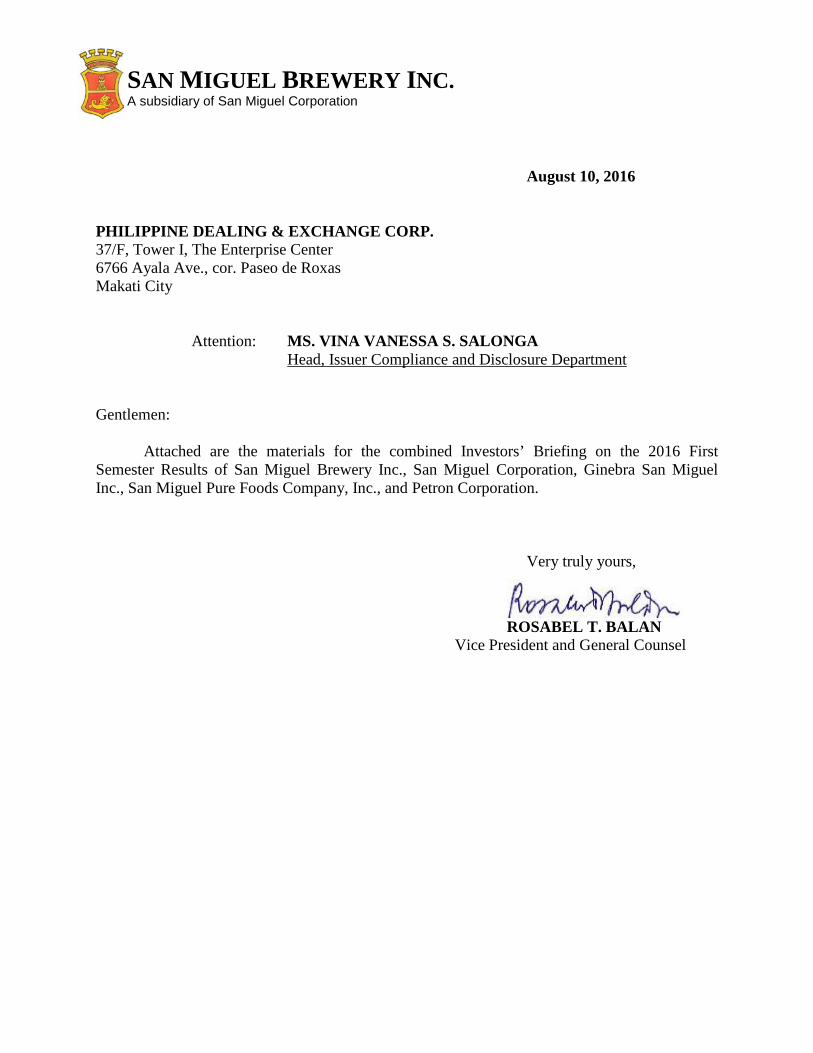
Recent Events
2
Sale of Telco business: - Enterprise Value: P69.1 billion
- P52.08 billion represents share value and advances
Acquisition /full control in MRT7 Project: - Total consideration: $100 million
- Acquisition of 49% equity interest in Universal LRT Corporation
SMC Global Power issuance of retail bond: - Total amount: P15.0 billion
- Tenor: 5, 7 and 10 years
- Dividend rate: 4.3458%, 4.7575% and 5.1792%
1
2
3
i n v e s t o r s ’ b r i e f i n g 2 0 1 6 f i r s t s e m e s t e r r e s u l t s
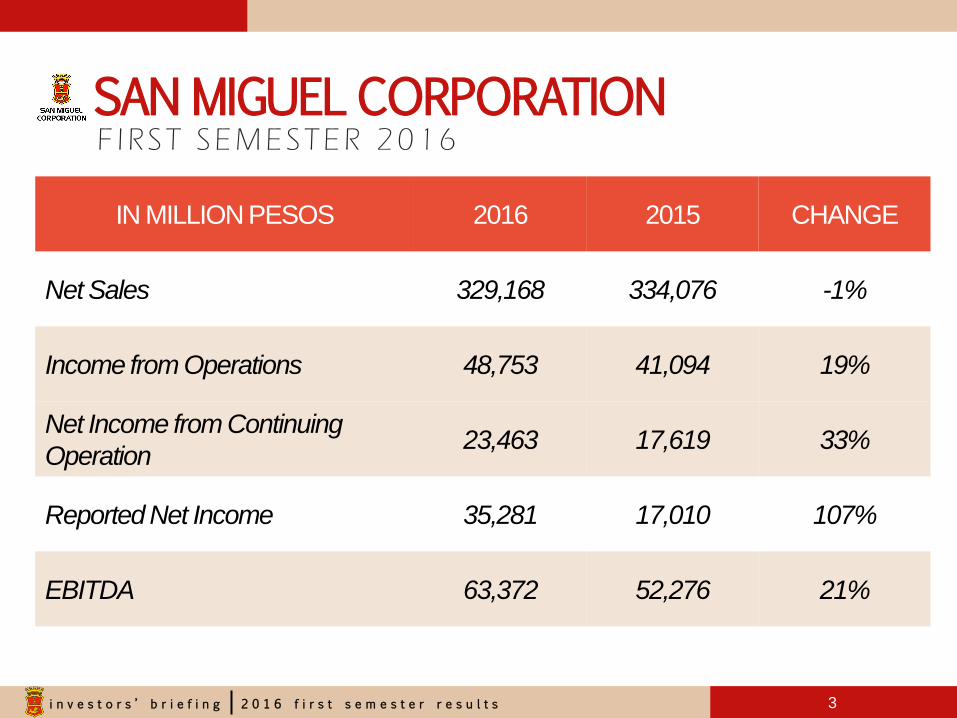
IN MILLION PESOS 2016 2015 CHANGE
Net Sales 329,168 334,076 -1%
Income from Operations 48,753 41,094 19%
Net Income from Continuing
Operation 23,463 17,619 33%
Reported Net Income 35,281 17,010 107%
EBITDA 63,372 52,276 21%
SAN MIGUEL CORPORATION
3
F I RST SEMESTER 2016
i n v e s t o r s ’ b r i e f i n g 2 0 1 6 f i r s t s e m e s t e r r e s u l t s
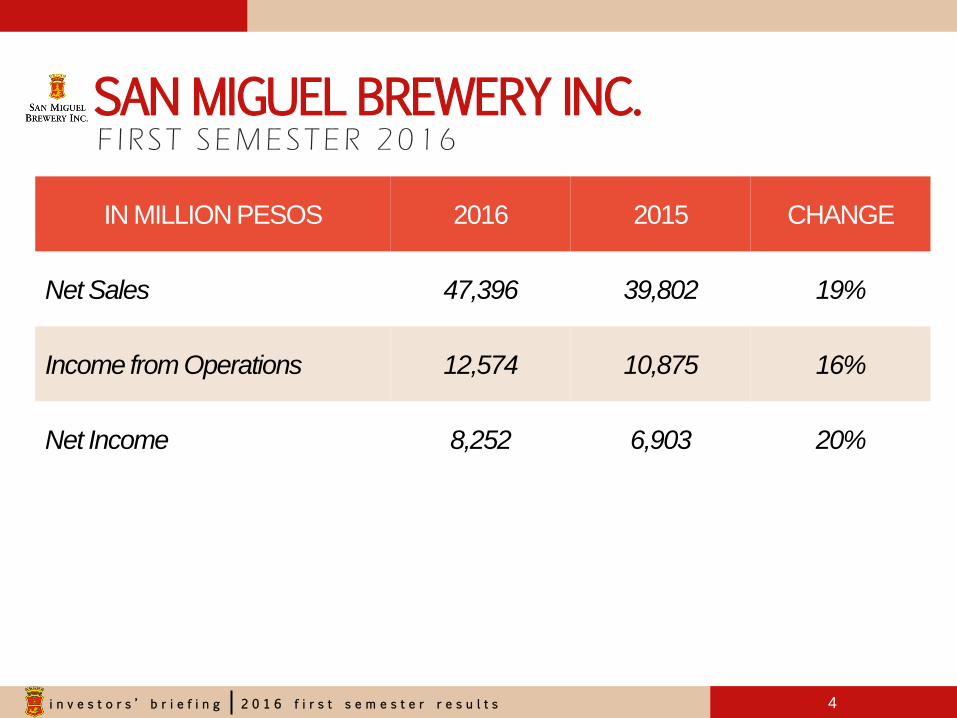
SAN MIGUEL BREWERY INC.
IN MILLION PESOS 2016 2015 CHANGE
Net Sales 47,396 39,802 19%
Income from Operations 12,574 10,875 16%
Net Income 8,252 6,903 20%
4
F I RST SEMESTER 2016

i n v e s t o r s ’ b r i e f i n g 2 0 1 6 f i r s t s e m e s t e r r e s u l t s
GINEBRA SAN MIGUEL INC.
IN MILLION PESOS 2016 2015 CHANGE
Net Sales 8,414 7,453 13%
Income from Operations 414 246 68%
Net Income 138 5 *
5
F I RST SEMESTER 2016
i n v e s t o r s ’ b r i e f i n g 2 0 1 6 f i r s t s e m e s t e r r e s u l t s
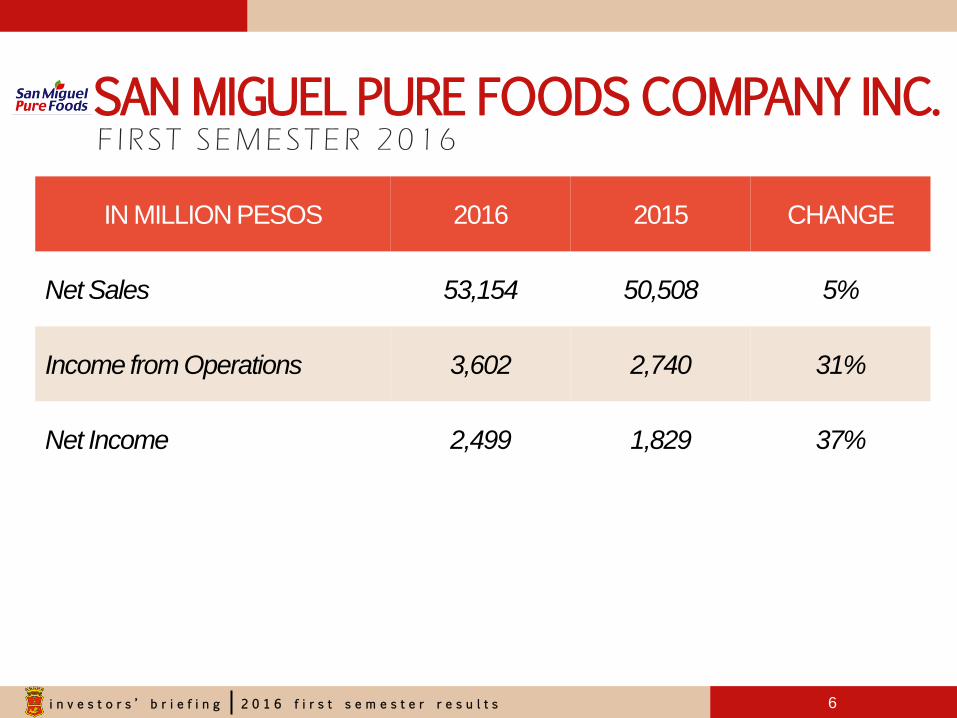
SAN MIGUEL PURE FOODS COMPANY INC.
IN MILLION PESOS 2016 2015 CHANGE
Net Sales 53,154 50,508 5%
Income from Operations 3,602 2,740 31%
Net Income 2,499 1,829 37%
6
F I RST SEMESTER 2016
i n v e s t o r s ’ b r i e f i n g 2 0 1 6 f i r s t s e m e s t e r r e s u l t s
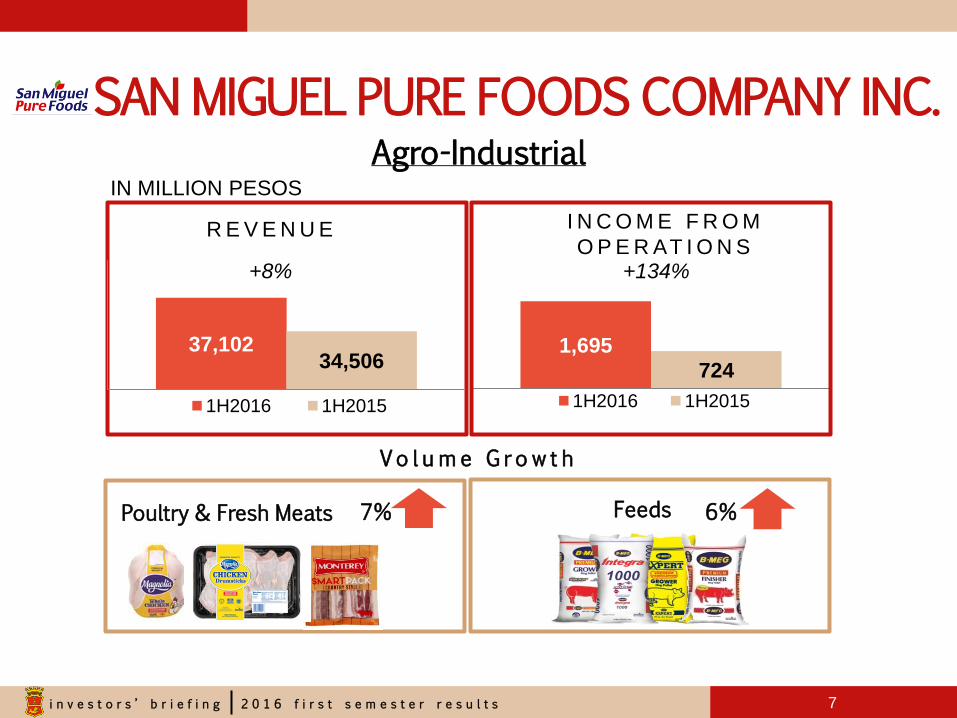
I N C O M E F R O M
O P E R AT I O N S
37,102 34,506
1H2016 1H2015
+8%
R E V E N U E
Agro-Industrial
+134%
1,695
724
1H2016 1H2015
SAN MIGUEL PURE FOODS COMPANY INC.
7
Feeds 6% Poultry & Fresh Meats 7%
Vo l um e G ro w t h
IN MILLION PESOS
i n v e s t o r s ’ b r i e f i n g 2 0 1 6 f i r s t s e m e s t e r r e s u l t s
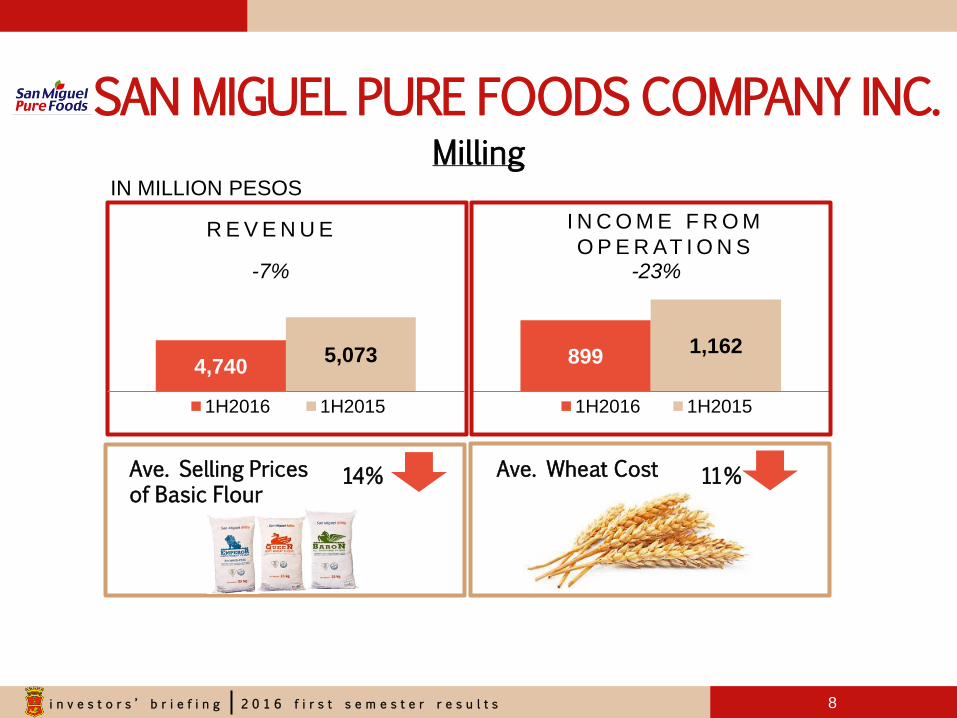
SAN MIGUEL PURE FOODS COMPANY INC.
8
Milling
I N C O M E F R O M
O P E R AT I O N S
4,740 5,073
1H2016 1H2015
-7%
R E V E N U E
-23%
899 1,162
1H2016 1H2015
Ave. Wheat Cost 11% Ave. Selling Prices of Basic Flour
14%
IN MILLION PESOS

i n v e s t o r s ’ b r i e f i n g 2 0 1 6 f i r s t s e m e s t e r r e s u l t s
SAN MIGUEL PURE FOODS COMPANY INC.
9
Branded Value - Added
I N C O M E F R O M
O P E R AT I O N S
12,147 11,285
1H2016 1H2015
+8%
R E V E N U E
+25%
856 684
1H2016 1H2015
B r a n d B u i l d i n g
IN MILLION PESOS
i n v e s t o r s ’ b r i e f i n g 2 0 1 6 f i r s t s e m e s t e r r e s u l t s
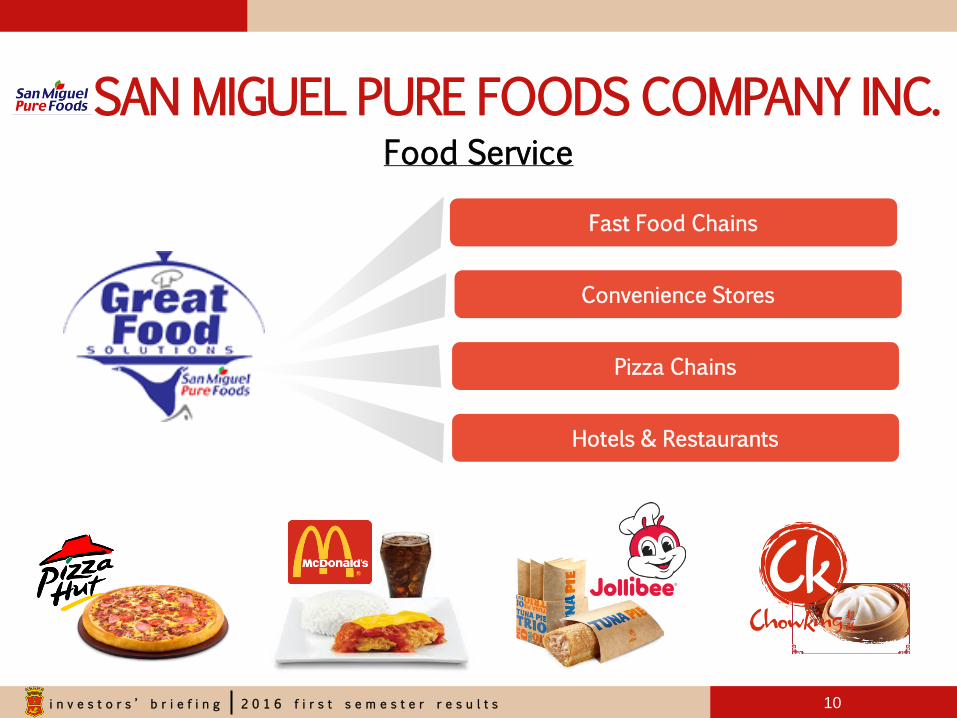
SAN MIGUEL PURE FOODS COMPANY INC.
10
Food Service
Convenience Stores
Pizza Chains
Fast Food Chains
Hotels & Restaurants
i n v e s t o r s ’ b r i e f i n g 2 0 1 6 f i r s t s e m e s t e r r e s u l t s
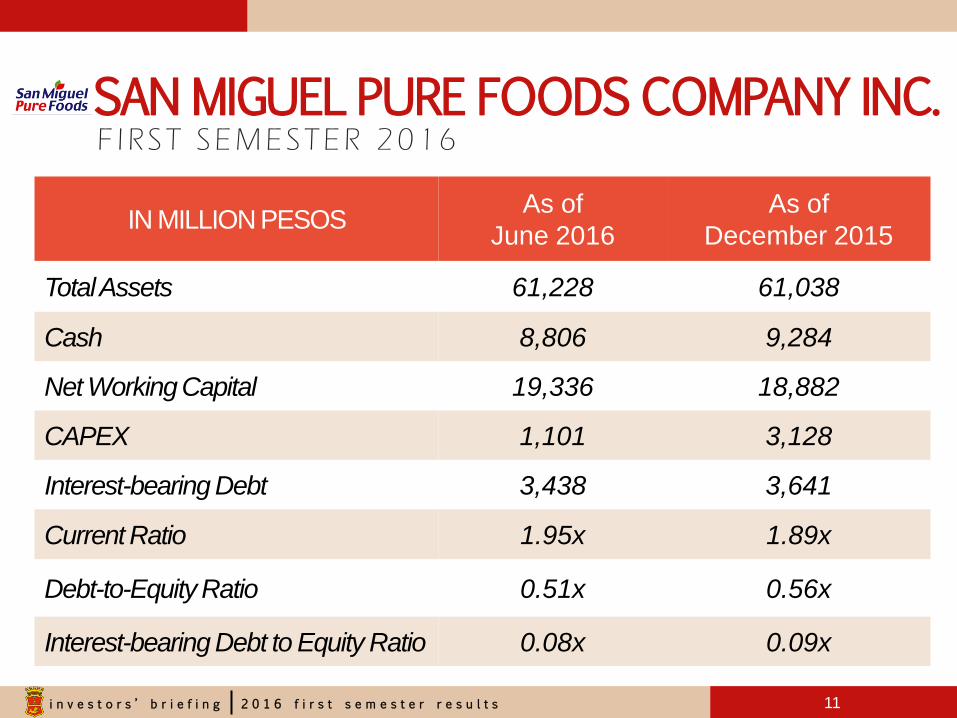
IN MILLION PESOS As of
June 2016
As of
December 2015
Total Assets 61,228 61,038
Cash 8,806 9,284
Net Working Capital 19,336 18,882
CAPEX 1,101 3,128
Interest-bearing Debt 3,438 3,641
Current Ratio 1.95x 1.89x
Debt-to-Equity Ratio 0.51x 0.56x
Interest-bearing Debt to Equity Ratio 0.08x 0.09x
SAN MIGUEL PURE FOODS COMPANY INC.
11
F I RST SEMESTER 2016
i n v e s t o r s ’ b r i e f i n g 2 0 1 6 f i r s t s e m e s t e r r e s u l t s
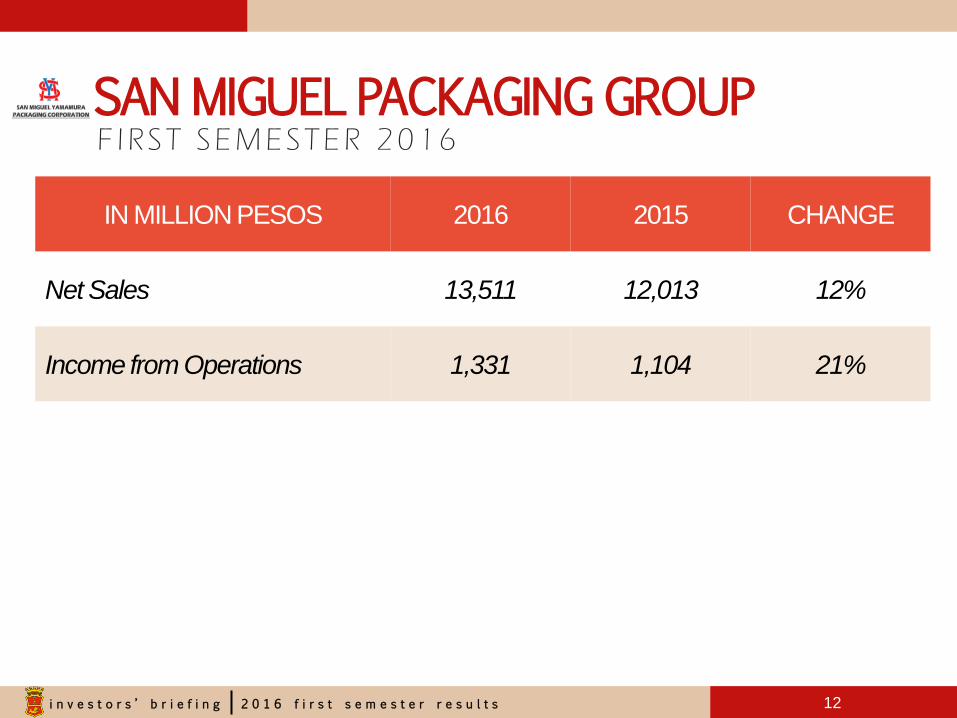
SAN MIGUEL PACKAGING GROUP
IN MILLION PESOS 2016 2015 CHANGE
Net Sales 13,511 12,013 12%
Income from Operations 1,331 1,104 21%
12
F I RST SEMESTER 2016
i n v e s t o r s ’ b r i e f i n g 2 0 1 6 f i r s t s e m e s t e r r e s u l t s
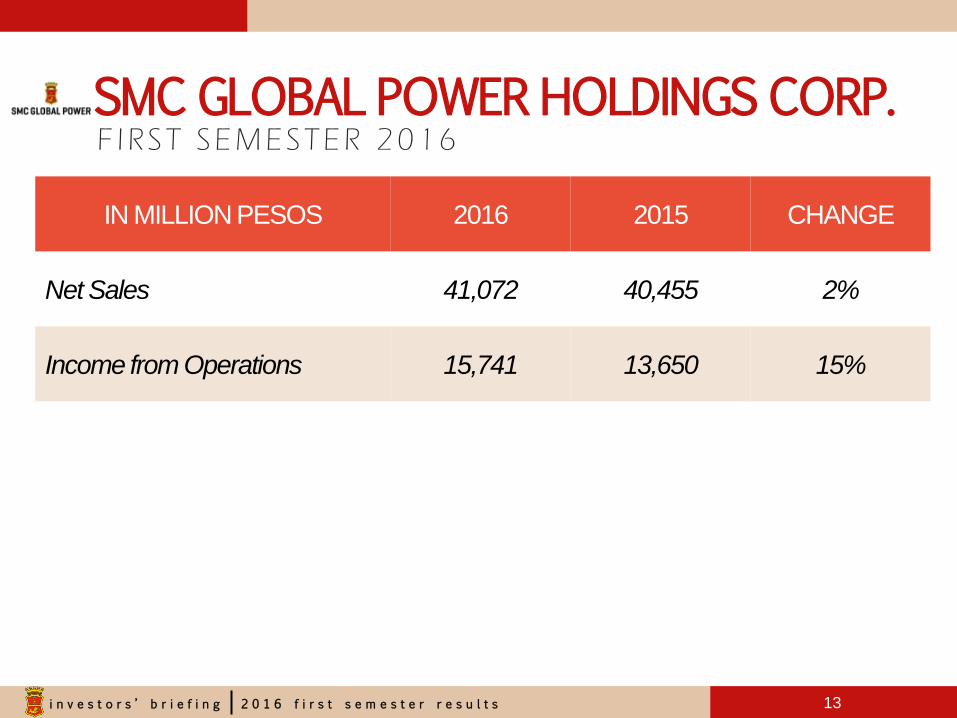
SMC GLOBAL POWER HOLDINGS CORP.
IN MILLION PESOS 2016 2015 CHANGE
Net Sales 41,072 40,455 2%
Income from Operations 15,741 13,650 15%
13
F I RST SEMESTER 2016

i n v e s t o r s ’ b r i e f i n g 2 0 1 6 f i r s t s e m e s t e r r e s u l t s
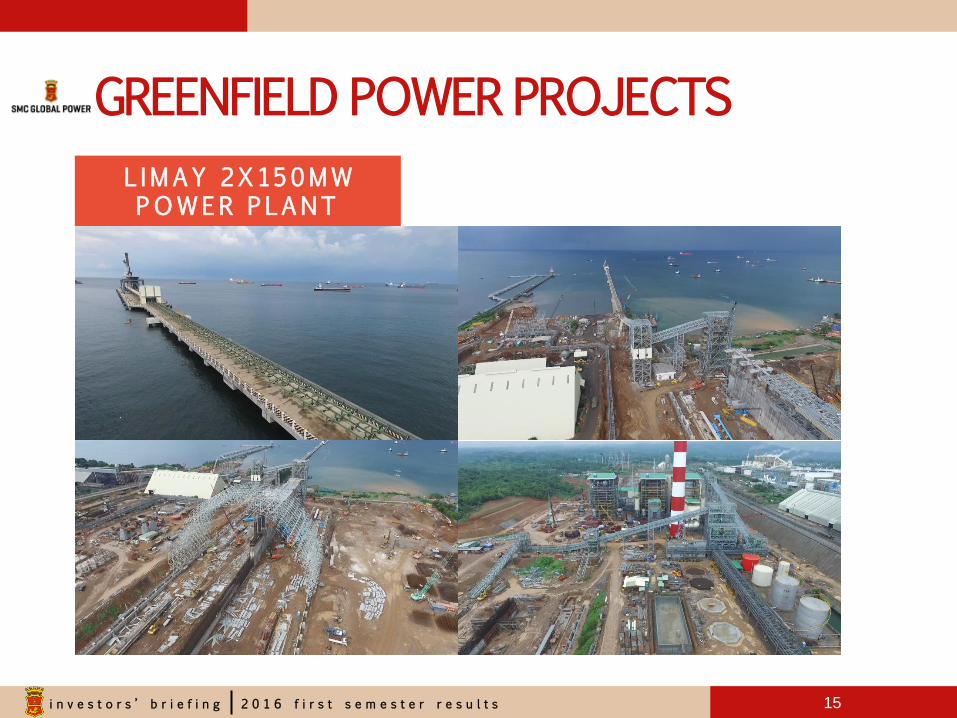
GREENFIELD POWER PROJECTS
MAL I TA 2X150MW POWER P LANT
14
i n v e s t o r s ’ b r i e f i n g 2 0 1 6 f i r s t s e m e s t e r r e s u l t s
L IMAY 2X150MW POWER P LANT
GREENFIELD POWER PROJECTS
15
i n v e s t o r s ’ b r i e f i n g 2 0 1 6 f i r s t s e m e s t e r r e s u l t s
0
5
10
15
3Q15 4Q15 1Q16 2Q16
(20)
(15)
(10)
(5)
0
5
10
3Q15 4Q15 1Q16 2Q16
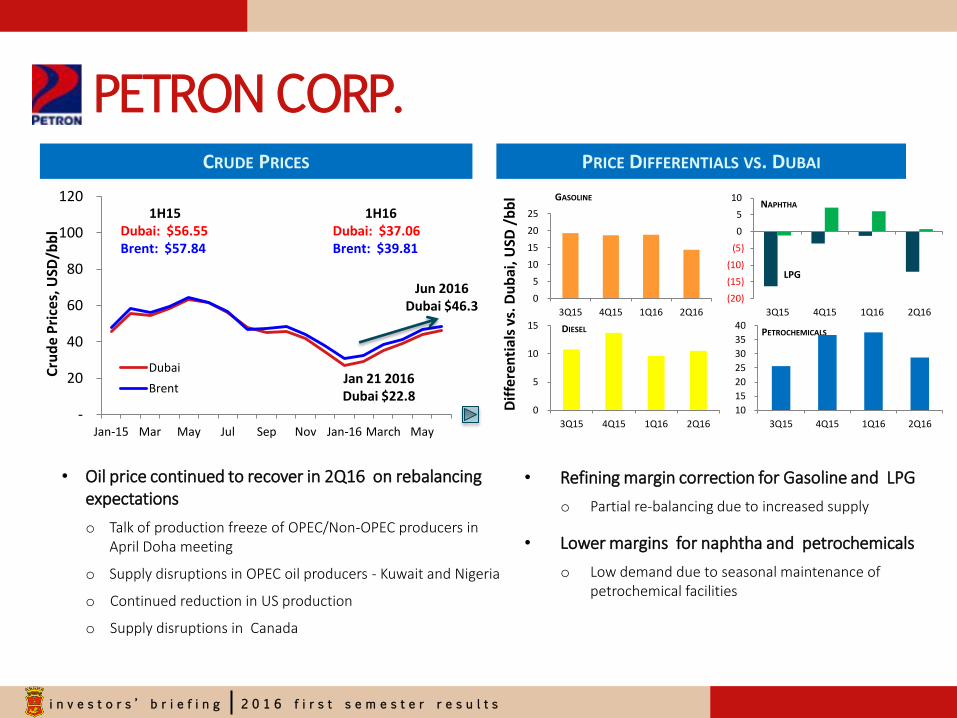
PETRON CORP.
16
-
20
40
60
80
100
120
Jan-15 Mar May Jul Sep Nov Jan-16 March May
Cru
de
Pri
ces,
USD
/bb
l
Dubai
Brent
1H15 Dubai: $56.55 Brent: $57.84
Jan 21 2016 Dubai $22.8
1H16 Dubai: $37.06 Brent: $39.81
CRUDE PRICES PRICE DIFFERENTIALS VS. DUBAI
Dif
fere
nti
als
vs. D
ub
ai, U
SD /
bb
l
PETROCHEMICALS
DIESEL
GASOLINE
LPG
• Oil price continued to recover in 2Q16 on rebalancing expectations
o Talk of production freeze of OPEC/Non-OPEC producers in April Doha meeting
o Supply disruptions in OPEC oil producers - Kuwait and Nigeria
o Continued reduction in US production
o Supply disruptions in Canada
• Refining margin correction for Gasoline and LPG
o Partial re-balancing due to increased supply
• Lower margins for naphtha and petrochemicals
o Low demand due to seasonal maintenance of petrochemical facilities
0
5
10
15
20
25
3Q15 4Q15 1Q16 2Q16
NAPHTHA
10
15
20
25
30
35
40
3Q15 4Q15 1Q16 2Q16
Jun 2016 Dubai $46.3

i n v e s t o r s ’ b r i e f i n g 2 0 1 6 f i r s t s e m e s t e r r e s u l t s
140
150
160
170
180
190
1H15 FY15 1H16
17
164.2 179.8
97.6 104.5
- 25 50 75
100 125 150 175 200 225 250
1H15 1H16 1H15 1H16
PH MY
Operating Performance
BATAAN REFINERY UTILIZATION
SALES VOLUME PERFORMANCE (‘000 BARRELS/DAY)
• Strong sales volumes growth in all major segments
- PH driven by strong growth in industrial, LPG and lubricants. Diesel as main product driver.
- MY driven by high industrial and retail growth with gasoline and diesel as main product drivers.
• Improvements in Refinery utilization and RMP-2 production
• Continued reduction in debt levels
Gro
ss D
ebt
In B
illio
ns,
PH
P
C
rud
e R
un
in ,
in M
BD
PETRON CORP.
~60%
~75% ~80%
0
30
60
90
120
150
180
FY14 1H15 1H16

i n v e s t o r s ’ b r i e f i n g 2 0 1 6 f i r s t s e m e s t e r r e s u l t s
PETRON CORP.
18
F I RST SEMESTER 2016
IN MILLION PESOS 1H 2016 1H2015 CHANGE
Net Sales 161,863 186,051 -13%
Gross Margins 17,754 14,918 19%
Rate 11% 8%
Income From Operations 11,479 8,876 29%
Net Income 5,279 3,408 55%
Volume (in million barrels) 51.8 47.4 9%
i n v e s t o r s ’ b r i e f i n g 2 0 1 6 f i r s t s e m e s t e r r e s u l t s
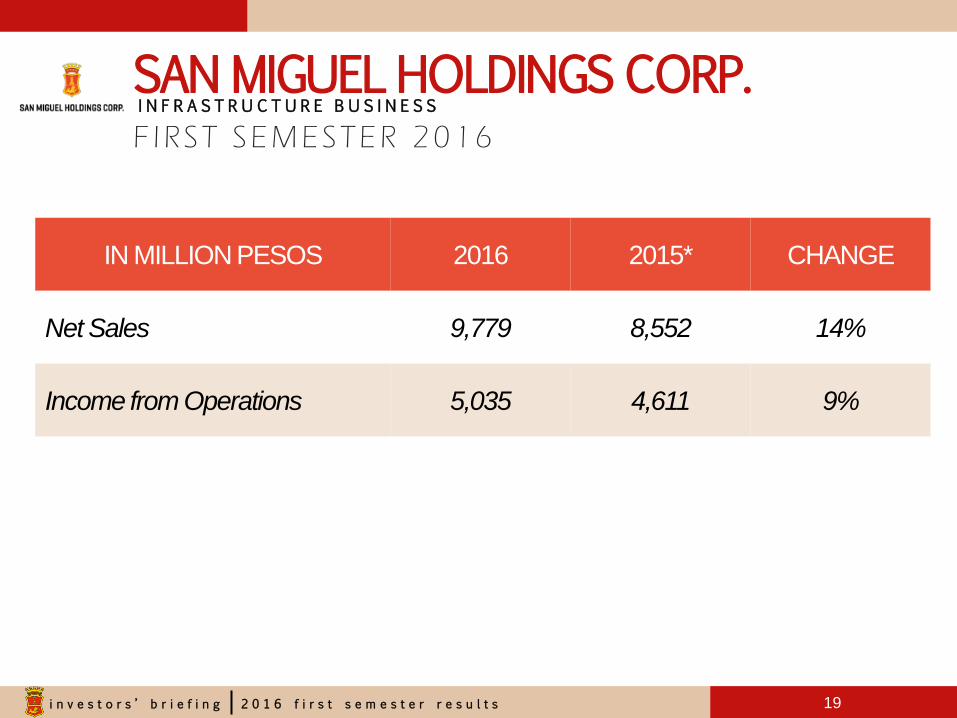
SAN MIGUEL HOLDINGS CORP. I N F R A S T R U C T U R E B U S I N E S S
IN MILLION PESOS 2016 2015* CHANGE
Net Sales 9,779 8,552 14%
Income from Operations 5,035 4,611 9%
19
F I RST SEMESTER 2016

i n v e s t o r s ’ b r i e f i n g 2 0 1 6 f i r s t s e m e s t e r r e s u l t s 20
SAN MIGUEL HOLDINGS CORP. I N F R A S T R U C T U R E B U S I N E S S
NAIA EXPRESSWAY
Macapagal Blvd. (Ramps 15-16) Toll Plaza (Ramp 9)

i n v e s t o r s ’ b r i e f i n g 2 0 1 6 f i r s t s e m e s t e r r e s u l t s 21
SAN MIGUEL HOLDINGS CORP. I N F R A S T R U C T U R E B U S I N E S S
BORACAY AIRPORT
Ongoing works on Osmeña Highway
Ongoing rehabilitation of old routes
i n v e s t o r s ’ b r i e f i n g 2 0 1 6 f i r s t s e m e s t e r r e s u l t s 22
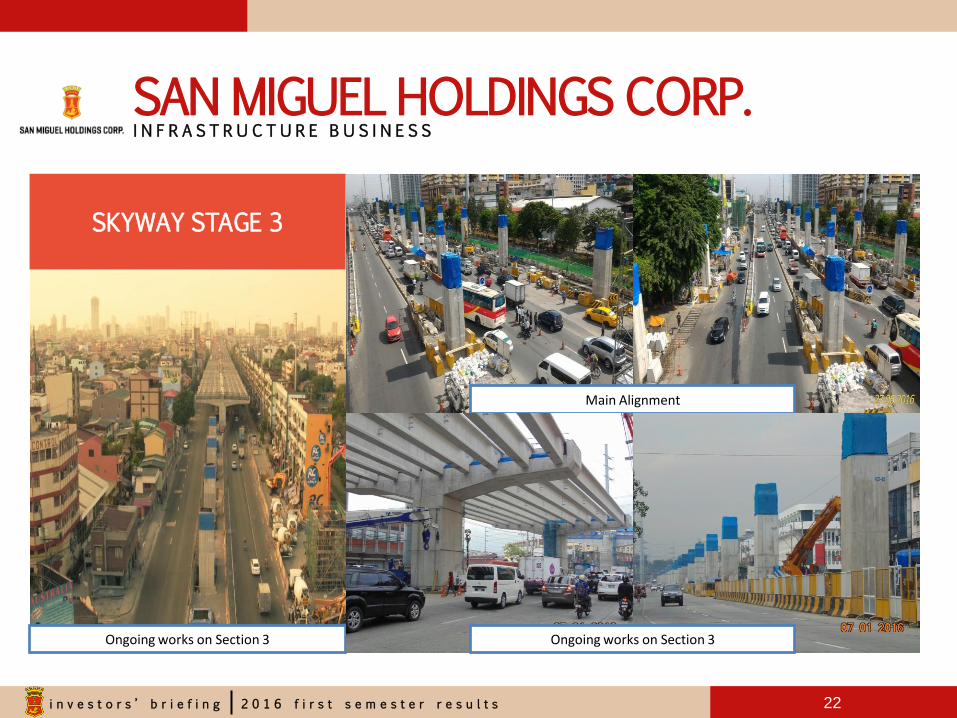
SAN MIGUEL HOLDINGS CORP. I N F R A S T R U C T U R E B U S I N E S S
SKYWAY STAGE 3
Ongoing works on Section 3
Main Alignment
Ongoing works on Section 3
i n v e s t o r s ’ b r i e f i n g 2 0 1 6 f i r s t s e m e s t e r r e s u l t s
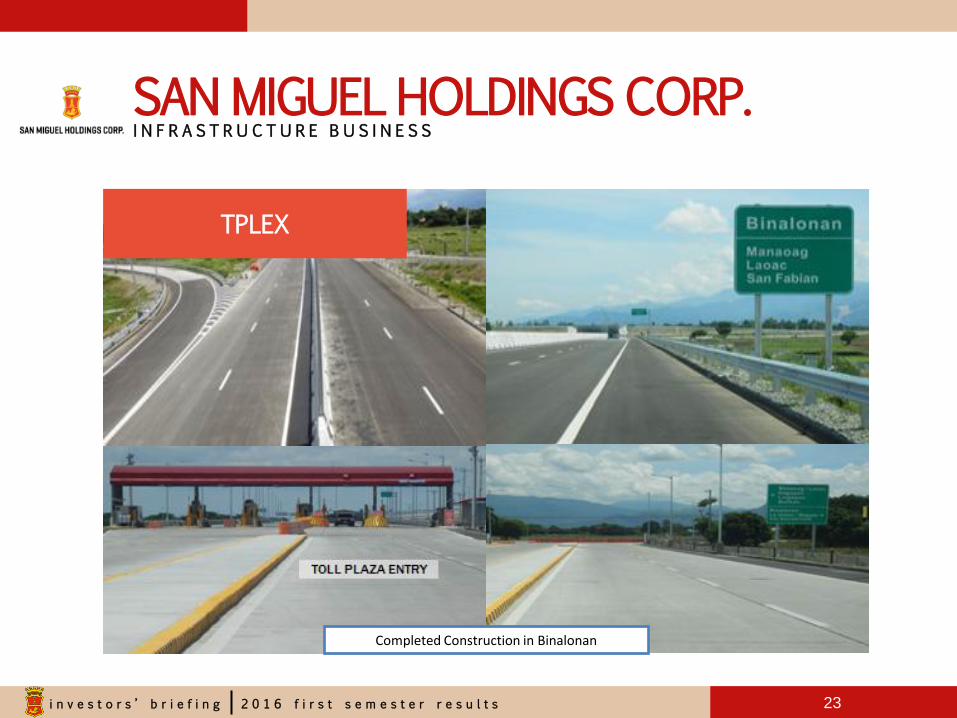
SAN MIGUEL HOLDINGS CORP. I N F R A S T R U C T U R E B U S I N E S S
23
Completed Construction in Binalonan
TPLEX
i n v e s t o r s ’ b r i e f i n g 2 0 1 6 f i r s t s e m e s t e r r e s u l t s
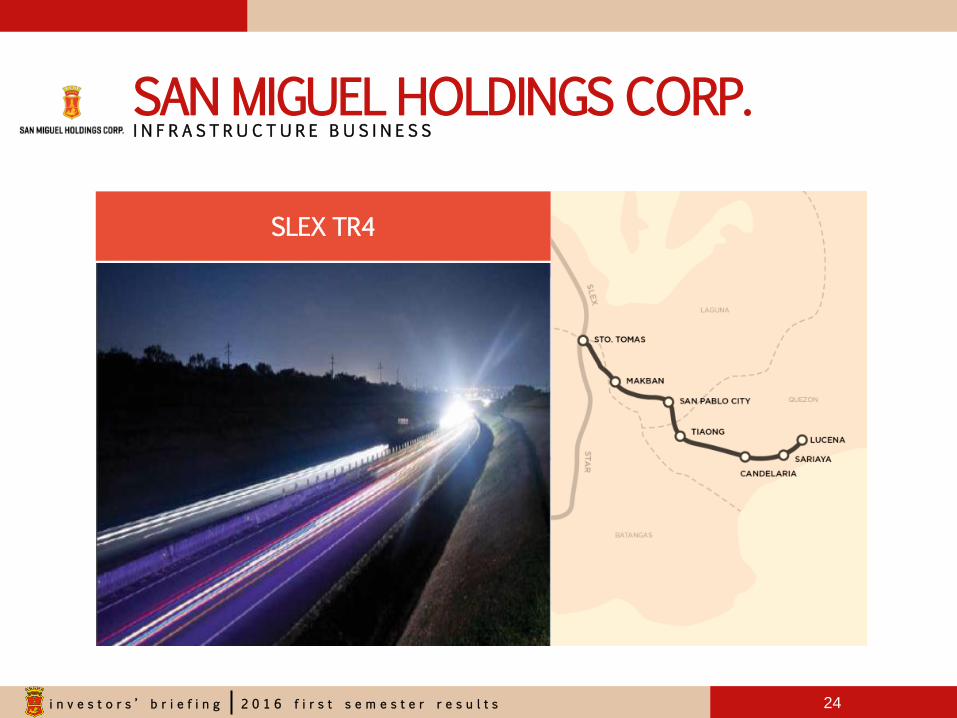
SAN MIGUEL HOLDINGS CORP. I N F R A S T R U C T U R E B U S I N E S S
24
SLEX TR4
i n v e s t o r s ’ b r i e f i n g 2 0 1 6 f i r s t s e m e s t e r r e s u l t s
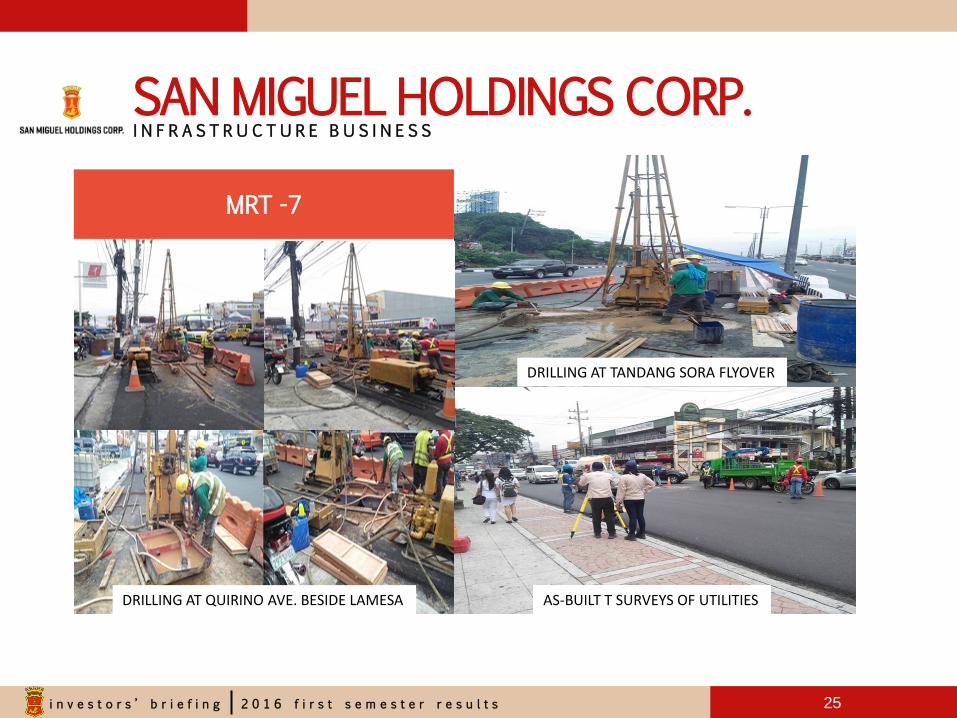
SAN MIGUEL HOLDINGS CORP. I N F R A S T R U C T U R E B U S I N E S S
MRT -7
25
DRILLING AT TANDANG SORA FLYOVER
AS-BUILT T SURVEYS OF UTILITIES DRILLING AT QUIRINO AVE. BESIDE LAMESA

i n v e s t o r s ’ b r i e f i n g 2 0 1 6 f i r s t s e m e s t e r r e s u l t s
SAN MIGUEL HOLDINGS CORP. I N F R A S T R U C T U R E B U S I N E S S
BULACAN BULK WATER
26
i n v e s t o r s ’ b r i e f i n g 2 0 1 6 f i r s t s e m e s t e r r e s u l t s
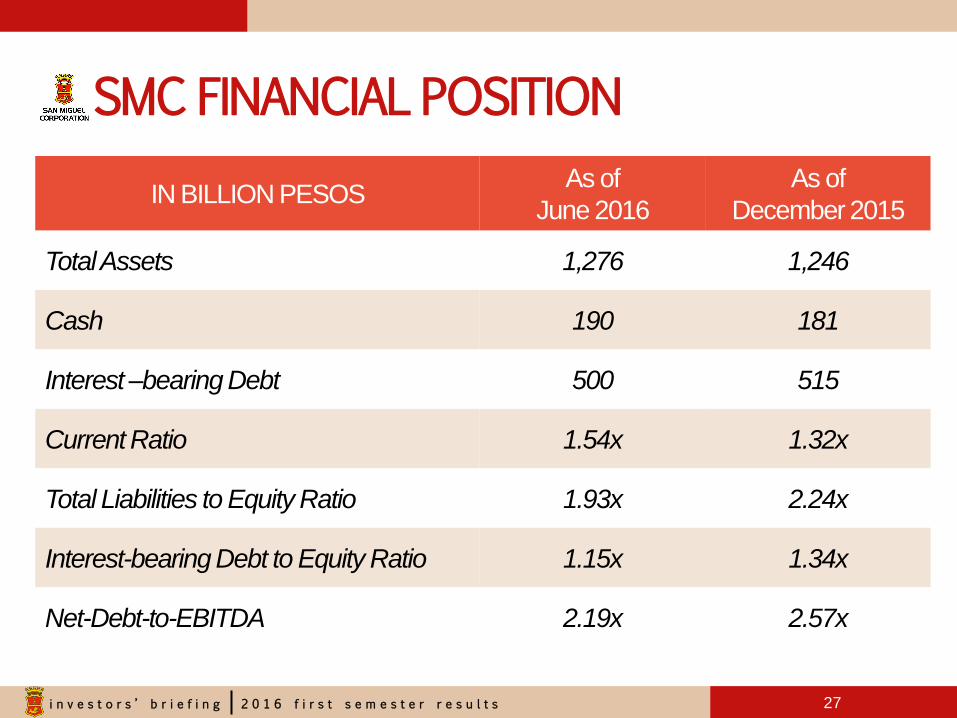
SMC FINANCIAL POSITION
IN BILLION PESOS As of
June 2016
As of
December 2015
Total Assets 1,276 1,246
Cash 190 181
Interest –bearing Debt 500 515
Current Ratio 1.54x 1.32x
Total Liabilities to Equity Ratio 1.93x 2.24x
Interest-bearing Debt to Equity Ratio 1.15x 1.34x
Net-Debt-to-EBITDA 2.19x 2.57x
27
VISIT OUR WEBSITES
San Miguel Corporation - www.sanmiguel.com.ph
San Miguel Brewery Inc. - www.sanmiguelbrewery.com.ph
Ginebra San Miguel Inc. - www.ginebrasanmiguel.com
San Miguel Pure Foods Co. Inc. - www.sanmiguelpurefoods.com
Petron Corporation - www.petron.com
CONTACT US
SMC Investor Relations +632 632 3752 +632 632 3422