Submillimeter Array Observations of Molecular Outflows in Massive

Journal of Physics Conference Series
OPEN ACCESS
A submillimeter VLBI arrayTo cite this article Jonathan Weintroub 2008 J Phys Conf Ser 131 012047
View the article online for updates and enhancements
You may also likeInterferometric Phase Correction Using183 GHzGHz Water Vapor MonitorsMartina C Wiedner Richard E Hills JohnE Carlstrom et al
-
A Decade of SCUBA-2 A ComprehensiveGuide to Calibrating 450 m and 850 mContinuum Data at the JCMTSteve Mairs Jessica T Dempsey GrahamS Bell et al
-
H-ATLASGAMA magnification biastomography Astrophysical constraintsabove 1 arcminJ Gonzaacutelez-Nuevo A Lapi L Bonaveraet al
-
This content was downloaded from IP address 601089205 on 12022022 at 2124
A Submillimeter VLBI Array
Jonathan WeintroubHarvard-Smithsonian Center for Astrophysics 60 Garden Street Cambridge MA USA
E-mail jweintroubcfaharvardedu
Abstract A VLBI array operating at λ 13 mm and 08 mm is being designed using existingsubmillimeter telescopes as ad-hoc stations Initial three station λ = 13 mm observationsof SgrA and other AGN have produced remarkable results which are reported by Doelemanelsewhere in this proceedings Future observations are planned with an enhanced array which haslonger baselines more stations and greater sensitivity At λ = 08 mm and on the long baselinesthe array will have about a 20 microas angular resolution which equals the diameter of the eventhorizon of the massive black hole in SgrA Candidate single dish facilities include the ArizonaRadio Observatory Submillimeter Telescope (SMT) in Arizona the Caltech SubmillimeterObservatory (CSO) and the James Clerk Maxwell telescope (JCMT) in Hawaii the LargeMillimeter Telescope (LMT) in Mexico ASTE and APEX in Chile and the IRAM 30 m inSpain interferometers include the Submillimeter Array (SMA) in Hawaii the Combined Arrayfor Research in Millimeter-wave Astronomy (CARMA) in California IRAM PdB Interferometerin France and the Atacama Large Millimeter Array (ALMA) in Chile I will discuss thetechniques we have developed for phasing interferometric arrays to act as single VLBI stationA strategy for detection of short (10s) time-scale source variability using VLBI closure phasewill be described
1 IntroductionIt is widely accepted that most galaxies harbor supermassive black holes (SMBH) at theircenters The closest SMBH candidate is SgrA at the center of our Galaxymdashsince it has thelargest angular size scale of any SMBH it is a compelling example for observation Infraredobservations made with adaptive optics on the VLT and the Keck 10 m telescope have been usedto measure the orbits of a number of stars bound to Sgr A with periods as short as 15 years([1][2][3]) From these orbits the central mass has been determined to be about 39times 106MFurther the mass density must be greater than 1022 Mpcminus3 because lack of proper motion ofSgr A implies that gt 10 of the mass must be tied to Sgr A which has a size lt 1 AU [11]Barring a few really exotic explanations this mass is most likely in the form of a black hole [12]The Schwarzschild radius (Rsch) for this black hole is about 12times1012 cm or 10 microas The closestapproach among the stellar orbits now measured is about 45 AU (560timesRsch)
The relativistic gas in the accreting envelope of Sgr A is the probable origin of the emission atsubmillimeter wavelengths Theoretical calculations ([4][5][6]) show that the general relativisticray paths are highly curved and lead to a severely distorted image with a central shadow Thesize of the expected image is about 50 microas and the symmetry of the image is sensitive to theviewing angle of the accretion disk and the spin of the black hole
The spectral energy distribution of SgrA peaks in the submillimeter wavelength part ofthe spectrum Submillimeter Array (SMA) results [13] show that the peak is near 08 mm
The Universe under the Microscope ndash Astrophysics at High Angular Resolution IOP PublishingJournal of Physics Conference Series 131 (2008) 012047 doi1010881742-65961311012047
ccopy 2008 IOP Publishing Ltd 1
Figure 1 The observed angular sizeof Sgr A vs wavelength (source iselliptical two solid lines indicate themajor and minor axes with a λ squareddependence characteristic of plasmascattering) At wavelengths longer thanseveral millimeters the apparent angularsize is dominated by the image blurringinduced by interstellar scattering in theionized plasma in the inner galaxy Thedata points at 14 mm and 35 mmsuggest that the true source size may bein the range of 50-100 microas (see [7] [8][9]) Figure from [15] Reference [10]has an updated form of this figure whichintegrates the results from the 13 mmVLBI observation of April 2007
Observations made at or shorter than this wavelength offer the possibility of observing emissionoriginating close to the event horizon because theoretical models predict the emission to behighest there and the plasma to be optically thin At radio wavelengths the image of Sgr A isblurred by the turbulence of the ionized gas in the inner galaxy The fluctuations in the indexof refraction due to this turbulence broadens the image to about 10 times(λ1mm)2 microas as shownby the interferometric data in figure 1
Hence λ sim 1 mm is ideal for VLBI on the Galactic center because the flux density is highthe emission is relatively unaffected by scattering in the intervening medium and the opacityis small enough to observe close to the event horizon Sgr A is obscured by dust in theoptical region In the near infrared interferometric baselines of 10 km would be required TheGRAVITY instrument using adaptive optics on the VLTI will be capable of astrometry with10 microas accuracy thereby tracing motions in the Galactic Center to a few Rsch [16] In the X-Rayregion a space interferometer MAXIM is being considered [17]
2 Extending VLBI to the submillimeterBy extending Very Long Baseline Interferometry to submillimeter wavelengths it is possibleto obtain sufficient resolution to directly probe the emission from the SMBH in the GalacticCenter on event-horizon scales and also higher mass SMBHs in nearby galaxies such as M87The resolution of an interferometric array is 07λD where D is the longest baseline lengthHence for λ = 08 mm and D = 5000 km the resolution is about 20 microas
The shortest wavelength at which the VLBA can be used is 3 mm because of the surfaceaccuracy limitation of its antennas At shorter wavelengths telescopes must be combined on anad hoc basis to make VLBI images Candidate single dish facilities include the SMTO (HHT)in Arizona the CSO and JCMT in Hawaii LMT in Mexico ASTE and APEX in Chile andthe IRAM 30 m in Spain interferometers include the Submillimeter Array (SMA) in HawaiiCARMA in California IRAM PdB Interferometer in France and ALMA in Chile A morecomprehensive list of candidate submillimeter VLBI stations and their salient characteristicsis shown in table 1 VLBI is progressively more difficult at shorter wavelengths because thecoherence time shortens due to the effects of the atmosphere and atomic frequency standardsthat control the signal recording at the remote independent stations Also at wavelength shorter
The Universe under the Microscope ndash Astrophysics at High Angular Resolution IOP PublishingJournal of Physics Conference Series 131 (2008) 012047 doi1010881742-65961311012047
2
than about 08 mm atmospheric transparency is a severe problem due to water vapor and thelikelihood of sufficiently good weather at multiple sites is small
A preliminary successful observation has been carried out at 14 mm wavelength using theIRAM PdBI and 30 m antennas to form a single 1200 km baseline [7] In 2007 this result wassubstantially extended with a 3-station experiment with λ = 13 mm and including stationson Mauna Kea (JCMT) California (one CARMA dish) and Arizona (SMT) [10] The longestbaseline in this experiment was 4500 km corresponding to a fringe spacing of 60 microas
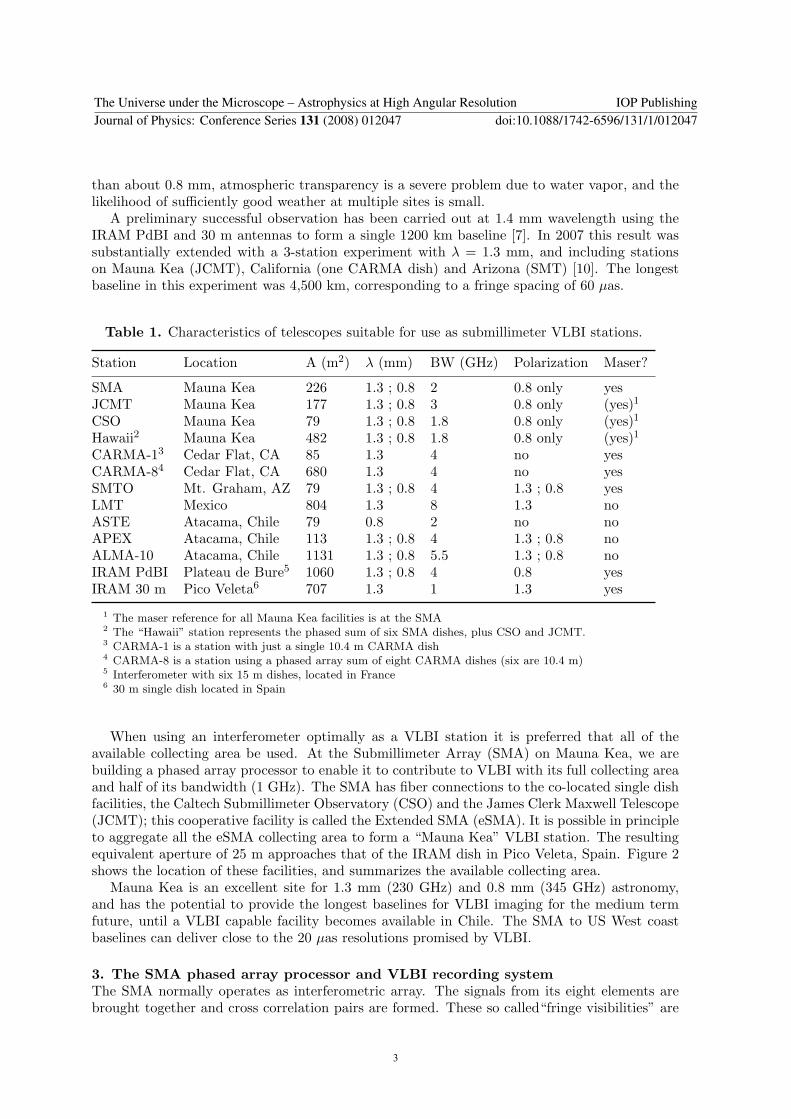
Table 1 Characteristics of telescopes suitable for use as submillimeter VLBI stations
Station Location A (m2) λ (mm) BW (GHz) Polarization Maser
SMA Mauna Kea 226 13 08 2 08 only yesJCMT Mauna Kea 177 13 08 3 08 only (yes)1CSO Mauna Kea 79 13 08 18 08 only (yes)1Hawaii2 Mauna Kea 482 13 08 18 08 only (yes)1CARMA-13 Cedar Flat CA 85 13 4 no yesCARMA-84 Cedar Flat CA 680 13 4 no yesSMTO Mt Graham AZ 79 13 08 4 13 08 yesLMT Mexico 804 13 8 13 noASTE Atacama Chile 79 08 2 no noAPEX Atacama Chile 113 13 08 4 13 08 noALMA-10 Atacama Chile 1131 13 08 55 13 08 noIRAM PdBI Plateau de Bure5 1060 13 08 4 08 yesIRAM 30 m Pico Veleta6 707 13 1 13 yes
1 The maser reference for all Mauna Kea facilities is at the SMA2 The ldquoHawaiirdquo station represents the phased sum of six SMA dishes plus CSO and JCMT3 CARMA-1 is a station with just a single 104 m CARMA dish4 CARMA-8 is a station using a phased array sum of eight CARMA dishes (six are 104 m)5 Interferometer with six 15 m dishes located in France6 30 m single dish located in Spain
When using an interferometer optimally as a VLBI station it is preferred that all of theavailable collecting area be used At the Submillimeter Array (SMA) on Mauna Kea we arebuilding a phased array processor to enable it to contribute to VLBI with its full collecting areaand half of its bandwidth (1 GHz) The SMA has fiber connections to the co-located single dishfacilities the Caltech Submillimeter Observatory (CSO) and the James Clerk Maxwell Telescope(JCMT) this cooperative facility is called the Extended SMA (eSMA) It is possible in principleto aggregate all the eSMA collecting area to form a ldquoMauna Keardquo VLBI station The resultingequivalent aperture of 25 m approaches that of the IRAM dish in Pico Veleta Spain Figure 2shows the location of these facilities and summarizes the available collecting area
Mauna Kea is an excellent site for 13 mm (230 GHz) and 08 mm (345 GHz) astronomyand has the potential to provide the longest baselines for VLBI imaging for the medium termfuture until a VLBI capable facility becomes available in Chile The SMA to US West coastbaselines can deliver close to the 20 microas resolutions promised by VLBI
3 The SMA phased array processor and VLBI recording systemThe SMA normally operates as interferometric array The signals from its eight elements arebrought together and cross correlation pairs are formed These so calledldquofringe visibilitiesrdquo are
The Universe under the Microscope ndash Astrophysics at High Angular Resolution IOP PublishingJournal of Physics Conference Series 131 (2008) 012047 doi1010881742-65961311012047
3
Figure 2 Mauna Kearsquos Submillimeter Valley showing the CSO JCMT and SMA and showingthe available collecting area from each observatory and in total
Fourier transformed to form an image To be able to use all of the SMA elements together asa single element in a VLBI array the signals from the SMA elements must be appropriatelydelayed and phase shifted before being coherently combined The combined signal is equivalentto that from a single telescope having the full area of the array The digital electronics necessaryto carry out this signal combination is called a phased array processor
The design [20] uses fast processing and sampling hardware which has been developed atUC Berkeley The Berkeley hardware consists of iADC boards based on Atmel Corporationanalog to digital converters for sampling and processing boards based on Xilinx Virtex II ProField Programmable Gate Arrays (FPGA) for data processing (ldquoiBOBrdquo boards) BerkeleyrsquosCenter for Astronomy Signal Processing and Electronics Research (CASPER) group [18] hasapplied the BWRC hardware specifically to reducing the design cycle time of radio astronomyinstrumentation They have developed a library of radioastronomy-specific functions that areavailable for quick application to particular instrumentation needs [19] The Berkeley hardwareand libraries are also used by MIT-Haystack Observatory to develop the new Digital Back End(DBE) for the Mark5b+ VLBI data storage terminal
Figure 3 shows a schematic of the eight-antenna SMA VLBI phased array processor Thisinitial system is limited to eight antennas because doing so made for an elegant design in thecontext of the natural multiples of ADC channels in the CASPER hardware So when either theCSO or JCMT are included in the eight antenna sum a single SMA antenna will be droppedfor each Analog IF signals with 1 GHz bandwidth are tapped from the SMA IF electronicsand are processed by an analog pre-processor which amplifies to the correct power level Thepreprocessor also includes custom anti-alias filters Two contiguous 512 MHz Nyquist sub-bandswith center frequencies of 768 MHz and 1280 MHz respectively are derived for each antennaA programmable analog eight-channel phase shifter implemented with broadband quadraturehybrids (Werlatone Corp) and four-quadrant vector multipliers (Analog Devices) modulatesboth the required phase correction and the the secondary phase rotation required for dopplercorrection onto these sub-bands before they are sampled at a rate of 1 GSample sminus1 to eight-bitprecision
The Universe under the Microscope ndash Astrophysics at High Angular Resolution IOP PublishingJournal of Physics Conference Series 131 (2008) 012047 doi1010881742-65961311012047
4
Figure 3 Block diagram of the VLBI phased array processor system implemented withBerkeleyrsquos CASPER FPGA hardware
The delay correction and four-channel sum is implemented using the CASPER iBOB FPGAhardware Each iBOB board can accept four 500 MHz analog inputs so two are needed to sampleeight channels The coherent sum of each set of four antennas is communicated via 10 Gbit sminus1
serial links to a downstream iBOB processor board where the two groups are summed coherentlyto form the eight-antenna signal needed for VLBI This board also houses a customized versionof the Mark5b DBE design and the data are routed directly to the Mark5b+ data storageterminal The entire arrangement is replicated for the second 500 MHz IF block to to meet theneeds of 1 GHz bandwidth VLBI
Real time calibration of the programmed phase and delay in the presence of perturbationsdue to atmospheric effects represents a significant challenge Since the SMArsquos geometry iswell known some of this information can be directly communicated to the VLBI processorSystematic delays though are different for the SMA correlator than for the VLBI system andbecause the SMA works on 82 MHz bandwidth chunks the delay and phase corrections are notcomputed in the SMA system to adequate precision to correct a 500 MHz bandwidth block
Thus the VLBI processor will be equipped with a dedicated real-time XF correlatorimplemented in another of the CASPER FPGA processing engines the BEE2 The antennadata in the phased array processor is communicated using the 10 Gbit sminus1 serial data links tothe correlator The correlator computes the complex cross-power visibility spectrum for eachof seven antennas with respect to that antenna which forms the phase reference A straightline fit to the phase part of the visibility spectrum determines the slope and the offset whichrespectively represent the delay and phase corrections required to align that antennarsquos signalwith the reference The delay and phase corrections are fed back in real to the phased arraysummer allowing for adaptive self-calibration of the phased array processor while the array is
The Universe under the Microscope ndash Astrophysics at High Angular Resolution IOP PublishingJournal of Physics Conference Series 131 (2008) 012047 doi1010881742-65961311012047
5
pointed at the target sourceThe phased array processor being developed for the SMA includes technology which we expect
to be useful at other interferometers such as CARMA and the Plateau de Bure Interferometer(PdBI) We are in contact with staff at both facilities for technical interchange The phasingof the ALMA array will require a different technological approach because the digitization ofsignals in the antennas means that analog IF tap points are not available at a central locationImplementation of an ALMA phased array and VLBI processor is an important longer termgoal of our efforts
4 Detecting flaring and time-variable structuresNon-imaging algorithms have been developed to detect time variable structures in SgrA Themethods described briefly here are discussed in detail in reference [21] There are a numberof reasons for an alternative to the imaging approach For example Earth rotation aperturesynthesis assumes a static source structure while models of SgrA suggest substantial timevariability may be present on short time- and small angular scales In any case the sparseUV coverage typical in a submillimeter VLBI observation is not well suited to inversion intothe image plane The technique uses interferometric closure quantities as robust observables(ie they are insensitive to atmospheric and instrumental gain variations) and is motivated bymodels in which an orbiting hot spot is embedded in an accretion disk ([5] [6]) Simulationsusing these rotating hot spot models and based on arrays with stations selected from thosesuggested in section 2 show that the signature of periodicity can be detected using currentlyavailable λ = 13 mm 4 Gbit sminus1 VLBI technology to a 10 s time resolution The potential fordetecting these signatures will be substantially improved when 16 Gbit sminus1 VLBI bandwidthsand large collecting areas from telescopes such as ALMA become available in a few years Theclosure signature is shown to be sensitive to the black hole spin A few representative resultsusing closure phase taken from reference [21] are presented here
In the figures in this section the solid red line shows the predicted closure phase in theabsence of noise while the dots model an actual noisy observation with each point representing10 s of coherently integrated data Plots are presented for a variety of station locations and inthe case of interferometers collecting areas at a given station The collecting area in the caseof arrays models whether or not interferometers at those locations are phased Bandwidth inVLBI is measured in terms of the data storage rate in Gbit sminus1 the simulations illustrate theexpected improvement in SNR at higher data rates
Figure 4 Closure phase for JCMT-SMTO-CARMA1 triangle with 4 Gbsbandwidth
Figure 5 Closure phase for JCMT-SMTO-CARMA1 triangle with 16 Gbsbandwidth
The first four figures model arrays of North American telescopes only and are thus considered
The Universe under the Microscope ndash Astrophysics at High Angular Resolution IOP PublishingJournal of Physics Conference Series 131 (2008) 012047 doi1010881742-65961311012047
6
to be ldquosmall trianglesrdquo Figure 4 is a simulation for a triangle with stations consisting of theJCMT on Mauna Kea the SMT on Mt Graham in Arizona and a single CARMA dish in CedarFlat CA The VLBI array operated with a data rate of 4 Gbit sminus1 which is equivalent to anobservation with a sky bandwidth of 1 GHz and 2-bit VLBI data samples Both the data rateand the stations correspond closely to the experiment which was run in April 2007 [10] Figure5 considers the same stations as figure 4 however the data rate is 16 Gbit sminus1 correspondingto a 2 GHz IF bandwidth as well as dual polarization and 2-bit sampling
Figure 6 Closure phase for Hawaii-SMTO-CARMA8 triangle with 4 Gbsbandwidth
Figure 7 Closure phase for Hawaii-SMTO-CARMA8 triangle with 16 Gbsbandwidth
In figures 6 and 7 the Hawaii and the California stations now include the collecting area madepossible by a phased array instrument retrofit In the case of Mauna Kea an effective 23 maperture results from the phased sum of six SMA dishes plus the JCMT and the CSO In thecase of California eight CARMA dishes are phased up to produce an effective 27 m apertureAgain two cases are presented 4 Gbit sminus1 and 16 Gbit sminus1 The periodicity evident in thered line is measurable with 10 s integrations perhaps marginally so in figure 4 but improvingsignificantly with increases in collecting area and bandwidth Reference [21] discusses the use ofautocorrelation functions which are applied to the closure phase measurements and have thepotential to improve the detectability of the periodicity
Figure 8 Phase closure for Hawaii-CARMA8-ALMA10 triangle with 16Gbs bandwidth
Figure 9 Phase closure for Hawaii-CARMA8-ALMA10 triangle with 16Gbs bandwidth and a=09
Figures 8 and 9 both demonstrate the effect of including a Chilean station in this case a
The Universe under the Microscope ndash Astrophysics at High Angular Resolution IOP PublishingJournal of Physics Conference Series 131 (2008) 012047 doi1010881742-65961311012047
7
10-element phased array of ALMA dishes The large North-South extent produce a greateramplitude in the closure phase periodic signature Apparent asymmetry in the source results ina net offset in the closure phase signature The asymmetrical structure in the source is due tolensing and opacity effects In figure 8 the drift in closure phase offset due to projection effectsover the course of an observation is clearly shown Figure 8 models the case of a non-rotatingblack hole figure 9 shows the case of a strongly rotating black hole Models of SgrA suggestthat a spinning black hole is generally associated with a more spatially compact source and thisresults in lower amplitude closure phase fluctuations and greater SNR on longer baselines Thusthe closure-phase technique has the potential to probe the fundamental parameters of the blackhole such as its spin
5 ConclusionsObservations of SgrA made in April 2007 have shown the potential of λ = 13 mm VLBI toprobe the Galactic Center on event-horizon scales This work demonstrates both the feasibilityof the technique and illustrates the benefits available through improving the sensitivity of theVLBI array In the coming years we plan to improve sensitivity in three ways First by increasingthe bandwidth at each station second by having a greater number of stations and thirdby aggregating the collecting area at stations which operate normally as local interferometersthrough the use of phased arrays With improved sensitivity and detections on at least threebaselines techniques using closure quantities have the potential to detect short time scalevariability in the source with 10 s resolution Our team aims to observe SgrA again in thefirst half of 2009 with an improved VLBI array
AcknowledgmentsThe Submillimeter Array is a joint project between the Smithsonian Astrophysical Observatoryand the Academia Sinica Institute of Astronomy and Astrophysics and is funded by theSmithsonian Institution and the Academia Sinica Vincent Fish supplied the graphics presentedin section 4 and helped collate the data for table 1 Sheperd Doeleman supplied the graphic infigure 1
References[1] Schodel R et al 2002 Nature 419 694[2] Ghenzel R et al 2003 Nature 425 934[3] Ghez A M et al 2005 ApJ 620 744[4] Falcke H Melia F amp Algol E 2000 ApJ 528 L13[5] Broderick A E amp Loeb A 2006a ApJ 636 L109[6] Broderick A E amp Loeb A 2006b MNRAS 367 905[7] Krichbaum T P et al 1998 A amp A 335 L106[8] Bower G C Falcke H Herrnstein R M Zhao J H Goss W M amp Backer D C 2004 Science 304 704[9] Shen Z Q Lo K Y Liang M -C Ho P T P amp Zhao J-H 2005 Nature 438 62[10] Doeleman S S et al 2008 Nature 455 78[11] Reid M J amp Brunthaler A 2004 ApJ 616 872[12] Maoz E 1998 ApJ 494 L181[13] Marrone D 2006 Submillimeter Properties of Sagittarius A PhD Thesis Harvard University[14] Marrone D Moran J M Zhao J-H and Rao R 2007 ApJ 654 L57[15] Doeleman S S et al 2001 AJ 121 2610[16] httpwwwmpempgdeirgravityindexphplang=en[17] Cash W 2005 Advances in Space Research 35 122[18] httpcasperberkeleyedu[19] Parsons A et al 2005 URSI General Assembly New Dehli India[20] Nagpal V 2006 An FPGA Based Phased Array Processor for the Submillimeter Array Masterrsquos Thesis
Chalmers University of Technology[21] Doeleman S S Fish V L Broderick A E Loeb A amp Rogers A E E ApJ submitted
The Universe under the Microscope ndash Astrophysics at High Angular Resolution IOP PublishingJournal of Physics Conference Series 131 (2008) 012047 doi1010881742-65961311012047
8

A Submillimeter VLBI Array
Jonathan WeintroubHarvard-Smithsonian Center for Astrophysics 60 Garden Street Cambridge MA USA
E-mail jweintroubcfaharvardedu
Abstract A VLBI array operating at λ 13 mm and 08 mm is being designed using existingsubmillimeter telescopes as ad-hoc stations Initial three station λ = 13 mm observationsof SgrA and other AGN have produced remarkable results which are reported by Doelemanelsewhere in this proceedings Future observations are planned with an enhanced array which haslonger baselines more stations and greater sensitivity At λ = 08 mm and on the long baselinesthe array will have about a 20 microas angular resolution which equals the diameter of the eventhorizon of the massive black hole in SgrA Candidate single dish facilities include the ArizonaRadio Observatory Submillimeter Telescope (SMT) in Arizona the Caltech SubmillimeterObservatory (CSO) and the James Clerk Maxwell telescope (JCMT) in Hawaii the LargeMillimeter Telescope (LMT) in Mexico ASTE and APEX in Chile and the IRAM 30 m inSpain interferometers include the Submillimeter Array (SMA) in Hawaii the Combined Arrayfor Research in Millimeter-wave Astronomy (CARMA) in California IRAM PdB Interferometerin France and the Atacama Large Millimeter Array (ALMA) in Chile I will discuss thetechniques we have developed for phasing interferometric arrays to act as single VLBI stationA strategy for detection of short (10s) time-scale source variability using VLBI closure phasewill be described
1 IntroductionIt is widely accepted that most galaxies harbor supermassive black holes (SMBH) at theircenters The closest SMBH candidate is SgrA at the center of our Galaxymdashsince it has thelargest angular size scale of any SMBH it is a compelling example for observation Infraredobservations made with adaptive optics on the VLT and the Keck 10 m telescope have been usedto measure the orbits of a number of stars bound to Sgr A with periods as short as 15 years([1][2][3]) From these orbits the central mass has been determined to be about 39times 106MFurther the mass density must be greater than 1022 Mpcminus3 because lack of proper motion ofSgr A implies that gt 10 of the mass must be tied to Sgr A which has a size lt 1 AU [11]Barring a few really exotic explanations this mass is most likely in the form of a black hole [12]The Schwarzschild radius (Rsch) for this black hole is about 12times1012 cm or 10 microas The closestapproach among the stellar orbits now measured is about 45 AU (560timesRsch)
The relativistic gas in the accreting envelope of Sgr A is the probable origin of the emission atsubmillimeter wavelengths Theoretical calculations ([4][5][6]) show that the general relativisticray paths are highly curved and lead to a severely distorted image with a central shadow Thesize of the expected image is about 50 microas and the symmetry of the image is sensitive to theviewing angle of the accretion disk and the spin of the black hole
The spectral energy distribution of SgrA peaks in the submillimeter wavelength part ofthe spectrum Submillimeter Array (SMA) results [13] show that the peak is near 08 mm
The Universe under the Microscope ndash Astrophysics at High Angular Resolution IOP PublishingJournal of Physics Conference Series 131 (2008) 012047 doi1010881742-65961311012047
ccopy 2008 IOP Publishing Ltd 1
Figure 1 The observed angular sizeof Sgr A vs wavelength (source iselliptical two solid lines indicate themajor and minor axes with a λ squareddependence characteristic of plasmascattering) At wavelengths longer thanseveral millimeters the apparent angularsize is dominated by the image blurringinduced by interstellar scattering in theionized plasma in the inner galaxy Thedata points at 14 mm and 35 mmsuggest that the true source size may bein the range of 50-100 microas (see [7] [8][9]) Figure from [15] Reference [10]has an updated form of this figure whichintegrates the results from the 13 mmVLBI observation of April 2007
Observations made at or shorter than this wavelength offer the possibility of observing emissionoriginating close to the event horizon because theoretical models predict the emission to behighest there and the plasma to be optically thin At radio wavelengths the image of Sgr A isblurred by the turbulence of the ionized gas in the inner galaxy The fluctuations in the indexof refraction due to this turbulence broadens the image to about 10 times(λ1mm)2 microas as shownby the interferometric data in figure 1
Hence λ sim 1 mm is ideal for VLBI on the Galactic center because the flux density is highthe emission is relatively unaffected by scattering in the intervening medium and the opacityis small enough to observe close to the event horizon Sgr A is obscured by dust in theoptical region In the near infrared interferometric baselines of 10 km would be required TheGRAVITY instrument using adaptive optics on the VLTI will be capable of astrometry with10 microas accuracy thereby tracing motions in the Galactic Center to a few Rsch [16] In the X-Rayregion a space interferometer MAXIM is being considered [17]
2 Extending VLBI to the submillimeterBy extending Very Long Baseline Interferometry to submillimeter wavelengths it is possibleto obtain sufficient resolution to directly probe the emission from the SMBH in the GalacticCenter on event-horizon scales and also higher mass SMBHs in nearby galaxies such as M87The resolution of an interferometric array is 07λD where D is the longest baseline lengthHence for λ = 08 mm and D = 5000 km the resolution is about 20 microas
The shortest wavelength at which the VLBA can be used is 3 mm because of the surfaceaccuracy limitation of its antennas At shorter wavelengths telescopes must be combined on anad hoc basis to make VLBI images Candidate single dish facilities include the SMTO (HHT)in Arizona the CSO and JCMT in Hawaii LMT in Mexico ASTE and APEX in Chile andthe IRAM 30 m in Spain interferometers include the Submillimeter Array (SMA) in HawaiiCARMA in California IRAM PdB Interferometer in France and ALMA in Chile A morecomprehensive list of candidate submillimeter VLBI stations and their salient characteristicsis shown in table 1 VLBI is progressively more difficult at shorter wavelengths because thecoherence time shortens due to the effects of the atmosphere and atomic frequency standardsthat control the signal recording at the remote independent stations Also at wavelength shorter
The Universe under the Microscope ndash Astrophysics at High Angular Resolution IOP PublishingJournal of Physics Conference Series 131 (2008) 012047 doi1010881742-65961311012047
2
than about 08 mm atmospheric transparency is a severe problem due to water vapor and thelikelihood of sufficiently good weather at multiple sites is small
A preliminary successful observation has been carried out at 14 mm wavelength using theIRAM PdBI and 30 m antennas to form a single 1200 km baseline [7] In 2007 this result wassubstantially extended with a 3-station experiment with λ = 13 mm and including stationson Mauna Kea (JCMT) California (one CARMA dish) and Arizona (SMT) [10] The longestbaseline in this experiment was 4500 km corresponding to a fringe spacing of 60 microas
Table 1 Characteristics of telescopes suitable for use as submillimeter VLBI stations
Station Location A (m2) λ (mm) BW (GHz) Polarization Maser
SMA Mauna Kea 226 13 08 2 08 only yesJCMT Mauna Kea 177 13 08 3 08 only (yes)1CSO Mauna Kea 79 13 08 18 08 only (yes)1Hawaii2 Mauna Kea 482 13 08 18 08 only (yes)1CARMA-13 Cedar Flat CA 85 13 4 no yesCARMA-84 Cedar Flat CA 680 13 4 no yesSMTO Mt Graham AZ 79 13 08 4 13 08 yesLMT Mexico 804 13 8 13 noASTE Atacama Chile 79 08 2 no noAPEX Atacama Chile 113 13 08 4 13 08 noALMA-10 Atacama Chile 1131 13 08 55 13 08 noIRAM PdBI Plateau de Bure5 1060 13 08 4 08 yesIRAM 30 m Pico Veleta6 707 13 1 13 yes
1 The maser reference for all Mauna Kea facilities is at the SMA2 The ldquoHawaiirdquo station represents the phased sum of six SMA dishes plus CSO and JCMT3 CARMA-1 is a station with just a single 104 m CARMA dish4 CARMA-8 is a station using a phased array sum of eight CARMA dishes (six are 104 m)5 Interferometer with six 15 m dishes located in France6 30 m single dish located in Spain
When using an interferometer optimally as a VLBI station it is preferred that all of theavailable collecting area be used At the Submillimeter Array (SMA) on Mauna Kea we arebuilding a phased array processor to enable it to contribute to VLBI with its full collecting areaand half of its bandwidth (1 GHz) The SMA has fiber connections to the co-located single dishfacilities the Caltech Submillimeter Observatory (CSO) and the James Clerk Maxwell Telescope(JCMT) this cooperative facility is called the Extended SMA (eSMA) It is possible in principleto aggregate all the eSMA collecting area to form a ldquoMauna Keardquo VLBI station The resultingequivalent aperture of 25 m approaches that of the IRAM dish in Pico Veleta Spain Figure 2shows the location of these facilities and summarizes the available collecting area
Mauna Kea is an excellent site for 13 mm (230 GHz) and 08 mm (345 GHz) astronomyand has the potential to provide the longest baselines for VLBI imaging for the medium termfuture until a VLBI capable facility becomes available in Chile The SMA to US West coastbaselines can deliver close to the 20 microas resolutions promised by VLBI
3 The SMA phased array processor and VLBI recording systemThe SMA normally operates as interferometric array The signals from its eight elements arebrought together and cross correlation pairs are formed These so calledldquofringe visibilitiesrdquo are
The Universe under the Microscope ndash Astrophysics at High Angular Resolution IOP PublishingJournal of Physics Conference Series 131 (2008) 012047 doi1010881742-65961311012047
3
Figure 2 Mauna Kearsquos Submillimeter Valley showing the CSO JCMT and SMA and showingthe available collecting area from each observatory and in total
Fourier transformed to form an image To be able to use all of the SMA elements together asa single element in a VLBI array the signals from the SMA elements must be appropriatelydelayed and phase shifted before being coherently combined The combined signal is equivalentto that from a single telescope having the full area of the array The digital electronics necessaryto carry out this signal combination is called a phased array processor
The design [20] uses fast processing and sampling hardware which has been developed atUC Berkeley The Berkeley hardware consists of iADC boards based on Atmel Corporationanalog to digital converters for sampling and processing boards based on Xilinx Virtex II ProField Programmable Gate Arrays (FPGA) for data processing (ldquoiBOBrdquo boards) BerkeleyrsquosCenter for Astronomy Signal Processing and Electronics Research (CASPER) group [18] hasapplied the BWRC hardware specifically to reducing the design cycle time of radio astronomyinstrumentation They have developed a library of radioastronomy-specific functions that areavailable for quick application to particular instrumentation needs [19] The Berkeley hardwareand libraries are also used by MIT-Haystack Observatory to develop the new Digital Back End(DBE) for the Mark5b+ VLBI data storage terminal
Figure 3 shows a schematic of the eight-antenna SMA VLBI phased array processor Thisinitial system is limited to eight antennas because doing so made for an elegant design in thecontext of the natural multiples of ADC channels in the CASPER hardware So when either theCSO or JCMT are included in the eight antenna sum a single SMA antenna will be droppedfor each Analog IF signals with 1 GHz bandwidth are tapped from the SMA IF electronicsand are processed by an analog pre-processor which amplifies to the correct power level Thepreprocessor also includes custom anti-alias filters Two contiguous 512 MHz Nyquist sub-bandswith center frequencies of 768 MHz and 1280 MHz respectively are derived for each antennaA programmable analog eight-channel phase shifter implemented with broadband quadraturehybrids (Werlatone Corp) and four-quadrant vector multipliers (Analog Devices) modulatesboth the required phase correction and the the secondary phase rotation required for dopplercorrection onto these sub-bands before they are sampled at a rate of 1 GSample sminus1 to eight-bitprecision
The Universe under the Microscope ndash Astrophysics at High Angular Resolution IOP PublishingJournal of Physics Conference Series 131 (2008) 012047 doi1010881742-65961311012047
4
Figure 3 Block diagram of the VLBI phased array processor system implemented withBerkeleyrsquos CASPER FPGA hardware
The delay correction and four-channel sum is implemented using the CASPER iBOB FPGAhardware Each iBOB board can accept four 500 MHz analog inputs so two are needed to sampleeight channels The coherent sum of each set of four antennas is communicated via 10 Gbit sminus1
serial links to a downstream iBOB processor board where the two groups are summed coherentlyto form the eight-antenna signal needed for VLBI This board also houses a customized versionof the Mark5b DBE design and the data are routed directly to the Mark5b+ data storageterminal The entire arrangement is replicated for the second 500 MHz IF block to to meet theneeds of 1 GHz bandwidth VLBI
Real time calibration of the programmed phase and delay in the presence of perturbationsdue to atmospheric effects represents a significant challenge Since the SMArsquos geometry iswell known some of this information can be directly communicated to the VLBI processorSystematic delays though are different for the SMA correlator than for the VLBI system andbecause the SMA works on 82 MHz bandwidth chunks the delay and phase corrections are notcomputed in the SMA system to adequate precision to correct a 500 MHz bandwidth block
Thus the VLBI processor will be equipped with a dedicated real-time XF correlatorimplemented in another of the CASPER FPGA processing engines the BEE2 The antennadata in the phased array processor is communicated using the 10 Gbit sminus1 serial data links tothe correlator The correlator computes the complex cross-power visibility spectrum for eachof seven antennas with respect to that antenna which forms the phase reference A straightline fit to the phase part of the visibility spectrum determines the slope and the offset whichrespectively represent the delay and phase corrections required to align that antennarsquos signalwith the reference The delay and phase corrections are fed back in real to the phased arraysummer allowing for adaptive self-calibration of the phased array processor while the array is
The Universe under the Microscope ndash Astrophysics at High Angular Resolution IOP PublishingJournal of Physics Conference Series 131 (2008) 012047 doi1010881742-65961311012047
5
pointed at the target sourceThe phased array processor being developed for the SMA includes technology which we expect
to be useful at other interferometers such as CARMA and the Plateau de Bure Interferometer(PdBI) We are in contact with staff at both facilities for technical interchange The phasingof the ALMA array will require a different technological approach because the digitization ofsignals in the antennas means that analog IF tap points are not available at a central locationImplementation of an ALMA phased array and VLBI processor is an important longer termgoal of our efforts
4 Detecting flaring and time-variable structuresNon-imaging algorithms have been developed to detect time variable structures in SgrA Themethods described briefly here are discussed in detail in reference [21] There are a numberof reasons for an alternative to the imaging approach For example Earth rotation aperturesynthesis assumes a static source structure while models of SgrA suggest substantial timevariability may be present on short time- and small angular scales In any case the sparseUV coverage typical in a submillimeter VLBI observation is not well suited to inversion intothe image plane The technique uses interferometric closure quantities as robust observables(ie they are insensitive to atmospheric and instrumental gain variations) and is motivated bymodels in which an orbiting hot spot is embedded in an accretion disk ([5] [6]) Simulationsusing these rotating hot spot models and based on arrays with stations selected from thosesuggested in section 2 show that the signature of periodicity can be detected using currentlyavailable λ = 13 mm 4 Gbit sminus1 VLBI technology to a 10 s time resolution The potential fordetecting these signatures will be substantially improved when 16 Gbit sminus1 VLBI bandwidthsand large collecting areas from telescopes such as ALMA become available in a few years Theclosure signature is shown to be sensitive to the black hole spin A few representative resultsusing closure phase taken from reference [21] are presented here
In the figures in this section the solid red line shows the predicted closure phase in theabsence of noise while the dots model an actual noisy observation with each point representing10 s of coherently integrated data Plots are presented for a variety of station locations and inthe case of interferometers collecting areas at a given station The collecting area in the caseof arrays models whether or not interferometers at those locations are phased Bandwidth inVLBI is measured in terms of the data storage rate in Gbit sminus1 the simulations illustrate theexpected improvement in SNR at higher data rates
Figure 4 Closure phase for JCMT-SMTO-CARMA1 triangle with 4 Gbsbandwidth
Figure 5 Closure phase for JCMT-SMTO-CARMA1 triangle with 16 Gbsbandwidth
The first four figures model arrays of North American telescopes only and are thus considered
The Universe under the Microscope ndash Astrophysics at High Angular Resolution IOP PublishingJournal of Physics Conference Series 131 (2008) 012047 doi1010881742-65961311012047
6
to be ldquosmall trianglesrdquo Figure 4 is a simulation for a triangle with stations consisting of theJCMT on Mauna Kea the SMT on Mt Graham in Arizona and a single CARMA dish in CedarFlat CA The VLBI array operated with a data rate of 4 Gbit sminus1 which is equivalent to anobservation with a sky bandwidth of 1 GHz and 2-bit VLBI data samples Both the data rateand the stations correspond closely to the experiment which was run in April 2007 [10] Figure5 considers the same stations as figure 4 however the data rate is 16 Gbit sminus1 correspondingto a 2 GHz IF bandwidth as well as dual polarization and 2-bit sampling
Figure 6 Closure phase for Hawaii-SMTO-CARMA8 triangle with 4 Gbsbandwidth
Figure 7 Closure phase for Hawaii-SMTO-CARMA8 triangle with 16 Gbsbandwidth
In figures 6 and 7 the Hawaii and the California stations now include the collecting area madepossible by a phased array instrument retrofit In the case of Mauna Kea an effective 23 maperture results from the phased sum of six SMA dishes plus the JCMT and the CSO In thecase of California eight CARMA dishes are phased up to produce an effective 27 m apertureAgain two cases are presented 4 Gbit sminus1 and 16 Gbit sminus1 The periodicity evident in thered line is measurable with 10 s integrations perhaps marginally so in figure 4 but improvingsignificantly with increases in collecting area and bandwidth Reference [21] discusses the use ofautocorrelation functions which are applied to the closure phase measurements and have thepotential to improve the detectability of the periodicity
Figure 8 Phase closure for Hawaii-CARMA8-ALMA10 triangle with 16Gbs bandwidth
Figure 9 Phase closure for Hawaii-CARMA8-ALMA10 triangle with 16Gbs bandwidth and a=09
Figures 8 and 9 both demonstrate the effect of including a Chilean station in this case a
The Universe under the Microscope ndash Astrophysics at High Angular Resolution IOP PublishingJournal of Physics Conference Series 131 (2008) 012047 doi1010881742-65961311012047
7
10-element phased array of ALMA dishes The large North-South extent produce a greateramplitude in the closure phase periodic signature Apparent asymmetry in the source results ina net offset in the closure phase signature The asymmetrical structure in the source is due tolensing and opacity effects In figure 8 the drift in closure phase offset due to projection effectsover the course of an observation is clearly shown Figure 8 models the case of a non-rotatingblack hole figure 9 shows the case of a strongly rotating black hole Models of SgrA suggestthat a spinning black hole is generally associated with a more spatially compact source and thisresults in lower amplitude closure phase fluctuations and greater SNR on longer baselines Thusthe closure-phase technique has the potential to probe the fundamental parameters of the blackhole such as its spin
5 ConclusionsObservations of SgrA made in April 2007 have shown the potential of λ = 13 mm VLBI toprobe the Galactic Center on event-horizon scales This work demonstrates both the feasibilityof the technique and illustrates the benefits available through improving the sensitivity of theVLBI array In the coming years we plan to improve sensitivity in three ways First by increasingthe bandwidth at each station second by having a greater number of stations and thirdby aggregating the collecting area at stations which operate normally as local interferometersthrough the use of phased arrays With improved sensitivity and detections on at least threebaselines techniques using closure quantities have the potential to detect short time scalevariability in the source with 10 s resolution Our team aims to observe SgrA again in thefirst half of 2009 with an improved VLBI array
AcknowledgmentsThe Submillimeter Array is a joint project between the Smithsonian Astrophysical Observatoryand the Academia Sinica Institute of Astronomy and Astrophysics and is funded by theSmithsonian Institution and the Academia Sinica Vincent Fish supplied the graphics presentedin section 4 and helped collate the data for table 1 Sheperd Doeleman supplied the graphic infigure 1
References[1] Schodel R et al 2002 Nature 419 694[2] Ghenzel R et al 2003 Nature 425 934[3] Ghez A M et al 2005 ApJ 620 744[4] Falcke H Melia F amp Algol E 2000 ApJ 528 L13[5] Broderick A E amp Loeb A 2006a ApJ 636 L109[6] Broderick A E amp Loeb A 2006b MNRAS 367 905[7] Krichbaum T P et al 1998 A amp A 335 L106[8] Bower G C Falcke H Herrnstein R M Zhao J H Goss W M amp Backer D C 2004 Science 304 704[9] Shen Z Q Lo K Y Liang M -C Ho P T P amp Zhao J-H 2005 Nature 438 62[10] Doeleman S S et al 2008 Nature 455 78[11] Reid M J amp Brunthaler A 2004 ApJ 616 872[12] Maoz E 1998 ApJ 494 L181[13] Marrone D 2006 Submillimeter Properties of Sagittarius A PhD Thesis Harvard University[14] Marrone D Moran J M Zhao J-H and Rao R 2007 ApJ 654 L57[15] Doeleman S S et al 2001 AJ 121 2610[16] httpwwwmpempgdeirgravityindexphplang=en[17] Cash W 2005 Advances in Space Research 35 122[18] httpcasperberkeleyedu[19] Parsons A et al 2005 URSI General Assembly New Dehli India[20] Nagpal V 2006 An FPGA Based Phased Array Processor for the Submillimeter Array Masterrsquos Thesis
Chalmers University of Technology[21] Doeleman S S Fish V L Broderick A E Loeb A amp Rogers A E E ApJ submitted
The Universe under the Microscope ndash Astrophysics at High Angular Resolution IOP PublishingJournal of Physics Conference Series 131 (2008) 012047 doi1010881742-65961311012047
8
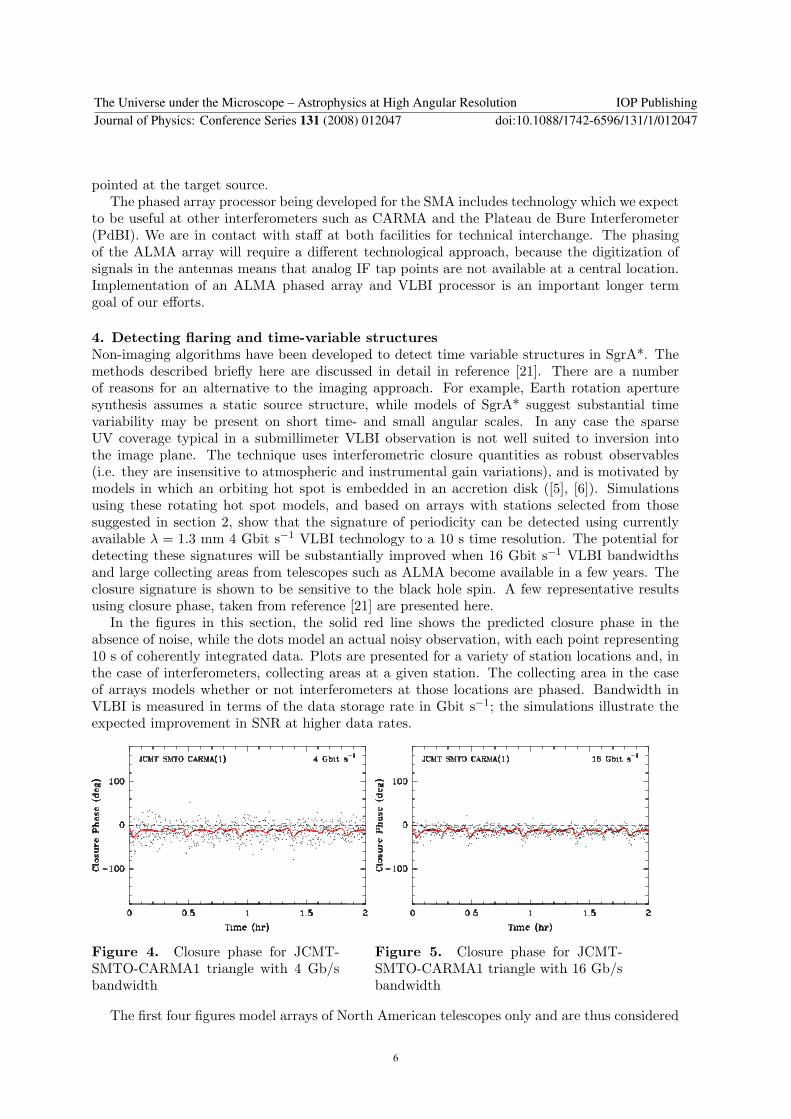