A STUDY ON THE EFFECTIVE TRAFFIC MANAGEMENT OF … · International Journal of Enterprise...
19
International Journal of Enterprise Innovation Management Studies(IJEIMS) Vol2. No2. July-Dec 2011 ISSN: 0976-2698 Pp: 172-190 www.ijcns.com 172 A STUDY ON THE EFFECTIVE TRAFFIC MANAGEMENT OF ROADS TO REDUCE ROAD ACCIDENTS IN TAMILNADU P.S.Bhargavi Asst Professor Department of Management Studies SaraswathiVelu College of Engineering Solinghar, Tamil Nadu [email protected] N. Kannaiya Raja Asst Professor SaraswathiVelu College of Engineering Solinghar, Tamil Nadu [email protected] -------------------------------------------------------------------------------------------------------------------------------------------------------- Abstract --------------------------------------------------------------------------------------------------------------------------------------------------------- The main purpose of this study is to identify and analyze the reasons for road traffic accidents in Tamilnadu. Also this study investigates the different causes of accidents occurred in past years in Tamilnadu. Tamilnadu was reported in one of the accident prone zone in India with having highest rate of road accidents. This study investigates why Tamilnadu reported in top number of accidents. What are the reasons for occurring accidents and how con resistance the accidents. --------------------------------------------------------------------------------------------------------------------------------------------------------- Keyword: Accident, Pedestrian, RTI- road traffic injuries, Highway. --------------------------------------------------------------------------------------------------------------------------------------------------------- 1. INTRODUCTION Road traffic accident is serious global problem. Each year over 1 million people are killed and 50 million injured on roads around the world. Without new and effective action, deaths in low to middle-income countries are forecast to rise steeply. At the same time, progress has slowed in recent years in the better performing countries where investment in preventing and reducing serious health loss from road traffic injury is not commensurate with its high socio- economic cost. The ESCAP secretariat estimates 700,000 people were killed and between 20-30 million in road accidents in ESCAP region in 2007. As highlighted in the World Report on Road Traffic Injury Prevention, fatal and long term crash injury is largely predictable, largely avoidable and a problem amenable to rational analysis and remedy. Research and experience in North America, Australia and Europe has shown that very substantial reductions in road deaths and serious injuries have been achieved through the application of evidence-based measures against the background of increased motorization.
-
Upload
vuongtuong -
Category
Documents
-
view
217 -
download
0
Transcript of A STUDY ON THE EFFECTIVE TRAFFIC MANAGEMENT OF … · International Journal of Enterprise...

International Journal of Enterprise Innovation Management Studies(IJEIMS) Vol2. No2. July-Dec 2011 ISSN: 0976-2698
Pp: 172-190 www.ijcns.com
172
A STUDY ON THE EFFECTIVE TRAFFIC MANAGEMENT OF ROADS TO REDUCE ROAD
ACCIDENTS IN TAMILNADU P.S.Bhargavi
Asst Professor Department of Management Studies
SaraswathiVelu College of Engineering Solinghar, Tamil Nadu
N. Kannaiya Raja Asst Professor
SaraswathiVelu College of Engineering Solinghar, Tamil Nadu
--------------------------------------------------------------------------------------------------------------------------------------------------------Abstract
--------------------------------------------------------------------------------------------------------------------------------------------------------- The main purpose of this study is to identify and analyze the reasons for road traffic accidents in Tamilnadu. Also this study investigates the different causes of accidents occurred in past years in Tamilnadu. Tamilnadu was reported in one of the accident prone zone in India with having highest rate of road accidents. This study investigates why Tamilnadu reported in top number of accidents. What are the reasons for occurring accidents and how con resistance the accidents.
--------------------------------------------------------------------------------------------------------------------------------------------------------- Keyword: Accident, Pedestrian, RTI- road traffic injuries, Highway.
---------------------------------------------------------------------------------------------------------------------------------------------------------
1. INTRODUCTION
Road traffic accident is serious global problem. Each year over 1 million people are killed and 50 million injured on roads around the world. Without new and effective action, deaths in low to middle-income countries are forecast to rise steeply. At the same time, progress has slowed in recent years in the better performing countries where investment in preventing and reducing serious health loss from road traffic injury is not commensurate with its high socio-economic cost. The ESCAP secretariat estimates 700,000 people were killed and between 20-30 million in road accidents in ESCAP region in 2007.
As highlighted in the World Report on Road Traffic Injury Prevention, fatal and long term crash injury is largely predictable, largely avoidable and a problem amenable to rational analysis and remedy. Research and experience in North America, Australia and Europe has shown that very substantial reductions in road deaths and serious injuries have been achieved through the application of evidence-based measures against the background of increased motorization.

International Journal of Enterprise Innovation Management Studies(IJEIMS) Vol2. No2. July-Dec 2011 ISSN: 0976-2698
Pp: 172-190 www.ijcns.com
173
This paper tries to present the experiences in developing policies and implementing the road safety management in Tamilnadu state of India and recommends for road safety management in National Highway segments in Tamilnadu Therefore, Roads are the principal transport mode in Tamilnadu, and this position is unlikely to change in the foreseeable future.
1.1 NATIONAL STATISTICAL TRENDS IN ROAD ACCIDENT
It is difficult to be accurate about the number of road accident as many accidents, including ones where people are injured, are not reported to the Police. Generally, only those accidents with high injury or property damage or with disputes are reported and recorded in the police station.
Road accidents are increasing in Tamilnadu due to increased vehicle fleet and speed. This
has become a serious problem which killed more than 1734 people’s life and injury of more than 11000 people in year 2009/10. The estimated annual national loss from road accidents is more than £ 9 million2. Considering the heavy loss of lives and wealth in road accidents the concerned road and traffic management agencies have started to incorporate road safety issues in their program but it seems inadequate as the losses of life and property from road accidents is increasing. Trend of road accidents and losses of life and property is increasing in recent year.
However, the figures do not give the full accident picture. Experience shows that a fairly large number of accidents are never reported to the police, mainly because the involved parties want to settle the matter between them. This under-representation is assumed to be less pronounced for severe accidents. 1.2. INDIAN SCENERIO OF ROAD ACCIDENT
Road accidents statistics of India is given in Table-1 in

International Journal of Enterprise Innovation Management Studies(IJEIMS) Vol2. No2. July-Dec 2011 ISSN: 0976-2698
Pp: 172-190 www.ijcns.com
174
Figure.1 Road Accident statistics in India.
The spectacular growth in the Road Transportation Sector in India has been a key
element in the economic development. In the country, more than 70,000 people die and nearly 4 lakhs persons are injured in about 3 lakhs and more road accidents every year. The trend in road accidents and number of vehicles registered during the period from 1970 – 1995 are shown in Figure 1. India’s motor vehicle population is just 1% of the world’s, but her share of world road traffic accidents is 6%. Even though it can be observed from Figure 2 that the accident rate has been steadily decreasing over the past 25 years, the accident rate is still very high compared to the developed nations.
The Compound annual growth rate (CAGR) in number of accidents, injuries, fatalities
and motor vehicles (registered) have moderated during 1990s (1990-2000) after a spurt during the 1980s (1980 to 1990) (Table 1). Moderation in the growth of accidents, fatalities and injuries during 1990s has taken place in the backdrop of lower growth in the number of registered vehicles and step up in the growth of road network. However, post-2000 (up to 2009) growth rate of fatalities has accelerated vis-à-vis the preceding decade (1990-2000).

International Journal of Enterprise Innovation Management Studies(IJEIMS) Vol2. No2. July-Dec 2011 ISSN: 0976-2698
Pp: 172-190 www.ijcns.com
175
Between 1970 and 2009 the number of accidents increased by 4.3 times with more than 7 fold increase in injuries and about 8.7 times increase in fatalities in the backdrop of about 64 fold increase in the number registered motor vehicles and three fold increase in road network. 1.2.1 Recent Trends in Number of Accidents, Injuries and Fatalities
• During the calendar year 2009, number of accidents reported at 4,86,384 was higher by 0.35 per cent compared with 4,84,704 accidents reported in the year 2008. • In comparison, the number of persons killed as a result of road accidents at 1,25,660 was higher by 4.8% in 2009 compared with the preceding year. However, the number of persons injured declined to 5,15,458 (a fall of 1.5%). • The total number of road accidents, injuries and deaths increased at CAGR of 2.4%, 2.9% and 5.3 % respectively between the years 2000 and 2009. 1.2.2 Profile of road accidents The total number of road accidents reported by all the States/ Union territories (UTs) in the year 2009 were 4,86,384 of which 1,10,993 were fatal i.e. 22.8% of the road accidents were fatal. The number of persons killed in the accidents were 1,25,660 (i.e. an average of one fatality per 4.4 accidents). Table 2 indicates that the proportion of fatal accidents in total road accidents has consistently increased since 2001 from 17.6% to 22.8% in 2009. The severity of road accidents, measured in terms of persons killed per 100 accidents, had also increased from 19.9 in 2001 to 25.8 in 2009.

International Journal of Enterprise Innovation Management Studies(IJEIMS) Vol2. No2. July-Dec 2011 ISSN: 0976-2698
Pp: 172-190 www.ijcns.com
176
The magnitude of road accidents and fatalities in India is alarming. This is evident from the fact that every hour there are about 56 accidents (about one accident every minute). Similarly, every hour more than 14 deaths occur due to road accidents i.e. one death in every 4 minutes. 1.2.3 Impact of Economic Growth on Urban Traffic
As incomes rise, car loans proliferate and the auto industry churns out low-cost cars to
nudge them off their motorcycles, Indians are rushing headlong to get behind the wheel. Indians bought 1.5 million cars in 2007, more than double of that in 2003. The cumulative growth of the Passenger Vehicles segment during April 2007 – March 2008 was 12.17 percent. In 2007-08 alone, 9.6 million motorized vehicles were sold in India.13 By some estimates, India is expected to soar past China this year as the fastest growing car market.
India's population and its traffic are concentrated within its cities. The contrast between
urban and rural India is far more pronounced than in most Western nations. The migration of rural population to urban areas in search of better job prospects has made cities densely populated. About 27 per cent the population live in urban areas. There are 4,000 cities and towns in India. About 400 cities have population over 1,00,000. Eight cities have population more than 3 million.14 1.2.4 Other reasons of Traffic Congestion in Indian Cities
India has more truly congested cities than any other nation, which is not surprising, since it is also the world's second-most populous country, after China. Vehicles in India are distributed

International Journal of Enterprise Innovation Management Studies(IJEIMS) Vol2. No2. July-Dec 2011 ISSN: 0976-2698
Pp: 172-190 www.ijcns.com
177
somewhat unevenly. Delhi, Mumbai, Kolkata and Bangalore have 5% of India's population, but 14% of its registered vehicles. Traffic is growing four times faster than the population in six cities: Mumbai, Delhi, Ahmedabad, Bangalore, Chennai and Hyderabad. Indeed, Delhi is now said to have as many cars as Mumbai, Kolkata and Chennai combined. Traffic is well known for moving at the pace of its slowest component. Most countries have automobiles, buses, trucks, trains, motorcycles, motor scooters and bicycles. But in India, in addition to this routine urban transportation, and contributing substantially to the congestion, are networks of auto-rickshaws and two-wheelers, as well as bullock carts and hand-pulled rickshaws (disappearing from some urban areas).
There has been a staggering 100 fold increase in the population of motorized vehicles,
however, the expansion in the road network has not been commensurate with this increase. While the motor vehicle population has grown from 0.3 million in 1951 to over 30 million in 2004, the road network has expanded from 0.4 million km to 3.32 million km, only a 8 fold increase in terms of length during the same period.16 However, upgrading of roads by way of widening of carriage- ways, improved surface quality, strengthening/ reconstruction of old/ weak bridges and culverts, etc. has been carried out. 1.2.5 Strategies to Mitigate Congestion
Traffic congestion is a serious problem in most Indian metros. The scorching pace of economic growth and the growing incomes of India’s burgeoning middle class are only likely to make the situation worse. Public transport systems are overloaded, and there is a limit on how much additional infrastructure such as roads and rail lines a city can add.
Of course, city planners are doing the best they can to cope with the increasing stress on the transportation infrastructure. For instance, in Mumbai, tens of flyovers have been – and continue to be – constructed, and existing roads are being widened.
But creating more infrastructure is not a solution by itself. The improvements in infrastructure will always lag behind the increase in traffic. Its benefits are only short-term; what’s needed is a more imaginative, holistic and integrated approach to the problem. A piece of statistic from the Mumbai Traffic Police web site illustrates the magnitude of the problem: While length of roads in Mumbai increased two times between 1951 and 2007, the population increased 5.4 times and the number of vehicles a whopping 43 times.
International Journal of Enterprise Innovation Management Studies(IJEIMS) Vol2. No2. July-Dec 2011 ISSN: 0976-2698
Pp: 172-190 www.ijcns.com
178
The improving-infrastructure approach seeks to accommodate the future. What is also needed is a preventive approach to actually reduce the traffic on the roads. This can be achieved in two ways.
1.2.6 Build better public transport systems
Transport experts at the second Urban Age conference on mega cities in Sao Paulo, Brazil - a city with 18 million people and 9 million cars - were unanimous in pointing out that throughout the world, whether in industrial or developing countries, public transport had to be promoted at the expense of private, motorized transport which, in effect, implies traffic restraint, among a slew of other measures. The demand so often raised by car owners for more roadways, by way of highways, fly overs and the like. India which is the second largest producer of buses, accounting for 16 percent of world's total bus production has a bus penetration ratio anywhere between 0.4 to six buses per 1000 people17. An efficient public transport system can effectively reduce the traffic on city roads.
There’s considerable evidence to suggest vehicle owners will use a mass transit system, if
a good one is available. In fact, because of traffic snarls and the problem of finding parking space, many commuters in cities like New York and London choose to travel by the metro rail network. Many cities in India are already taking steps in this direction. City authorities are also exploring providing public transport on sea routes that connect important hubs of Mumbai. But building such alternative transportation systems requires huge investments. That is where we come to the second approach.
1.2.7 Normalized Indicators of Road Accidents, Injuries & Fatalities: All India Averages Table 3 provides a share of top five States in India in total number of road accidents, persons killed in road accidents, persons injured in road accidents in the backdrop of their share in India’s motor vehicle population. Among the States, Tamilnadu and Gujarat stand out in contrast as regards accidents. Tamilnadu offers an interesting case as it accounts for a share about 4.2 % in total registered vehicles in 2009 compared to its much higher share in total road accidents (7.3% in 2009) [Annex-I A] and persons injured in road accidents (8% in 2009). However, Tamilnadu accounts for a lower share of 3% in the total road accident related deaths during 2009. Factors, which may contribute to high rate of accidents, are population density, road density and composition of vehicle population. On the other hand, Gujarat accounts for a share of 9.6% in the number of registered vehicles in 2009 but lower shares of 6.4%, 6.4% and 5.6% in total road accidents, persons injured and persons killed respectively in road accidents in 2009.

International Journal of Enterprise Innovation Management Studies(IJEIMS) Vol2. No2. July-Dec 2011 ISSN: 0976-2698
Pp: 172-190 www.ijcns.com
179
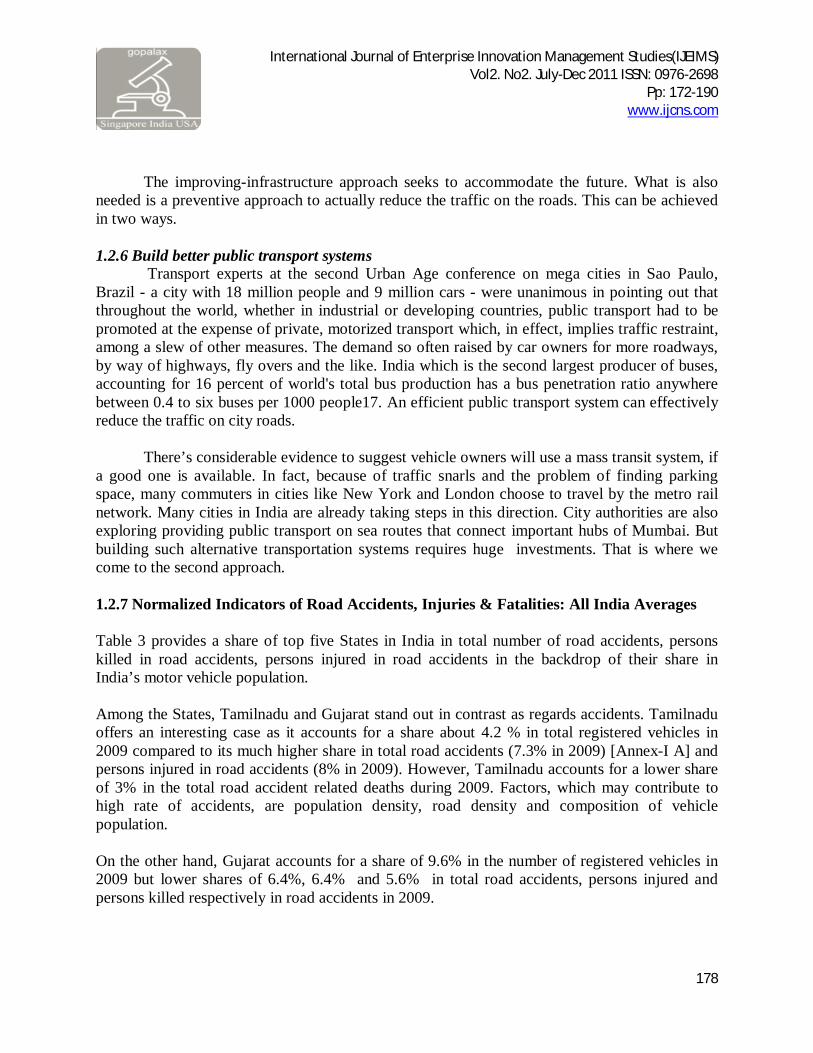
1.2.8 Incidence of Road Accidents, Injuries and Deaths: States & UTs. Inter State /UT comparisons of accident related data need to be viewed keeping in view the differences in road network, state of roads, size of human and vehicular population, levels of urbanization and accident reporting systems. These parameters have implications for accident rates across the States. Incidence of accident normalized in terms of road length, human population or vehicle population provides comparable accident data across States and UTs.
International Journal of Enterprise Innovation Management Studies(IJEIMS) Vol2. No2. July-Dec 2011 ISSN: 0976-2698
Pp: 172-190 www.ijcns.com
180
International Journal of Enterprise Innovation Management Studies(IJEIMS) Vol2. No2. July-Dec 2011 ISSN: 0976-2698
Pp: 172-190 www.ijcns.com
181

International Journal of Enterprise Innovation Management Studies(IJEIMS) Vol2. No2. July-Dec 2011 ISSN: 0976-2698
Pp: 172-190 www.ijcns.com
182
2. TAMILNADU SCENARIO Tamil Nadu is the southernmost state of India. It is the 11th largest state with an area of 1,30,058 Sq.km out of country's total area of 3166416 Sq.km and the third most urbanized State next to Maharashtra and Gujarat. Road network of the state influences considerably the economic development, population distribution, size of cities and towns, environmental quality, energy consumption, access to social infrastructure and above all the quality of life. The language spoken here is Tamil and most people in the urban areas would be able to understand English. The capital of Tamil Nadu is Chennai (formerly known as Madras). Tamil Nadu is divided into 32 districts. Tamil Nadu has Pondicherry, Tamilnadu, Karnataka and Andhra Pradesh as it neighbors. It also has one of the longest coastal lines in India and is very closely situated to Sri Lanka. It is seventh most populous state in India with a population of 72,138,958 (5.96% of India's population;census 2011). It is the seventh most densely populated state in India with a population density of 555 persons per squarekilometer as of 2011, having increased from 429 in 1991, significantly higher than the Indian average of 382 persons per square kilometer. 44% of the state's population lives in urban areas. The major administrative units of the state constitutes 39 LokSabha constituencies, 234 Assembly constituencies, 32 districts, 10 city corporations, 152 municipalities, 611 town panchayats and 12,618 village panchayats. Chennai (formerly known as Madras) is the state capital. It is the fourth largest city in India and is also one of the five A1 Metropolitan cities of India. The total length of road in Tamil Nadu is 1, 88,700 Km, of which 61446 Km length of roads are maintained by Highways Department. Tamil Nadu is in the forefront in developing road infrastructure. The density of road network in Tamil Nadu is 286 Km per lakh of population which is higher than the all India average of 258.20 Km and 137 Km per 100 Sq.Km area as against the all India average of 74.90 Km. Roads in Tamilnadu are broadly grouped under two categories viz. (a) Government Roads and (b) Village roads and others. Realizing the importance of developing and maintaining a good network of roads, for the first time in India, a separate department for Highways was formed at the State level, as early as in April 1946 and the Department has completed platinum jubilee year. Vehicular position in Tamilnadu as on 01-07-2012, it was 15819985 registered vehicles in that, 1023851 vehicles were transport vehicles and 14796134 were nontransport vehicles (13038498 two wheelers).
International Journal of Enterprise Innovation Management Studies(IJEIMS) Vol2. No2. July-Dec 2011 ISSN: 0976-2698
Pp: 172-190 www.ijcns.com
183
3. REVIEW OF LITERATURE Selzer (1968) showed that alcohol was a major problem in single vehicle fatal Accidents. In 72 fatal accidents which claimed 87 lives, he showed that half of drivers had serious drinking problems of chronic nature. A WHO advisory group in 1956 has defined accident as” an unpremeditated event resulting in recognizable damage” According to another definition, an accident is that “Occurrence in sequence of events which usually produces unintended injury death or property damage” Mortality from RTAs accounts for 10% of all deaths.in the 5-44 year age group (Jacobs and Sayer 1983). Road traffic accidents (RTAs) are the leading cause of deaths in adolescents and young adults globally (Mohan and Romer 1991). Peden et al. (2001: 12) argues that 'the same road space gets used by modern cars and buses, along with locally developed vehicles for public transport (three-wheeled scooter taxis), scooters and motorcycles, tricycle rickshaws, animal and human drawn carts'. He adds that infrastructure which is designed on the basis of homogeneous traffic models has failed to fulfill the mobility and safety needs of this traffic'(Ibid). Claret et al. 2002:394; Jelalian et al. 2000: 84-93; Oginni 2008: 226). Most authors attribute most accidents to driver dependent factors, which are thought to account for 60% to 90% of all traffic accidents (Ibid). 'The growth in numbers of motor vehicles is a major contributing factor in the rising toll of fatalities and injuries from road traffic crashes in poor countries' (Hague 1999: 212; McGrowder, 2008: 185; Nantulya 2002: 1139). Nantulya added that another explanation for the high burden of RTAs is “Poor enforcement of traffic safety regulations in low income countries due to inadequate resources, administrative problems and corruption. Corruption is a huge problem in some countries, often creating a circle of blame the police, blame drivers and the public, the public blames drivers and the police, and drivers blame the police. Corruption also extends to vehicle and driver licensing agencies”. (Ibid)The existing literature in developing countries does not provide clear evidence on whether vulnerable groups of people are mostly affected by RTAs although it suggests that there is a relationship (Nantulia and Reich, 2003; Laflamme and Didderichsen 2000). This might have been hindered by the incompleteness of data on TRAs both in developed and developing countries. 'A study in Bangalore, India seems to provide some evidence for such a negative gradient in income' (Jacobs et al. 2004: 24). As noted by (Peden and Sminkey 2004:67) 'economic costs are just the tip of the iceberg. For everyone killed, injured, or disabled by a road traffic crash there are countless others deeply affected'. Many families are driven deeper into poverty by the expenses of prolonged medical care, loss of a family breadwinner, or the added burden of caring for the disabled (Ibid). Oginni (2008: 226) further identified the specific risk factors such as 'uneducated and unlicensed drivers and riders, reckless driving, carelessness, drunkenness, lack of knowledge on road safety rules, driver's age, fatigue, unimplemented government policies, failure in law enforcement and

International Journal of Enterprise Innovation Management Studies(IJEIMS) Vol2. No2. July-Dec 2011 ISSN: 0976-2698
Pp: 172-190 www.ijcns.com
184
corruption'. Furthermore the literature on RTAs has noted that poor vehicle conditions, poor road infrastructure and poor traffic management are some risk factors contributing to RTAs. Road Traffic Injuries are modulated by human behavioural and environmental factors. Many studies (Bener et al., 2008a; Bener, Lajunen, Ozkan & Haigney, 2006; Bener, Ozkan & Lajunen, 2008b; Bener & Crundall, 2008c; Bener et al., 2007) have shown that human behavioural factors collectively represent the main cause of road traffic crashes and their remedial measures can go a long way to help prevent RTIs. Road traffic injuries are the leading cause of death globally among 15-19 year-olds, while for those in the 10-14 years and 20-24 years age brackets they are the second leading cause of death (WHO, 2007a). The projected 40% increase in global deaths resulting from injury between 2002 and 2030 is predominantly due to the increasing number of deaths from road traffic accidents (WHO, 2007b) India already accounts for about 9.5% of the total 1.2 million fatal accidents in the world (Mondal et al., 2011b). In 2007, 1.14 lakh people in India lost their lives in road mishaps — that's significantly higher than the 2006 road death figures in China, 89,455 (Mondal et al., 2011a). One person dies at every 4.61 minutes in India for road crashes. Road deaths in India registered a sharp 6.1% rise between 2006 and 2007. 4. OBJECTIVES To find out the major causes of accidents To analyze the severity rate of accidents To analyze the type of vehicle mostly involved in accidents 5. RESEARCH METHODOLOGY Data collection is based on secondary data. Data were available in detailed accidents in tamilnadu and Chennai from 1993-2013. And also make evaluation of causes of accidents with 2012. Data collections are done with the help of tamilnadu government website and DGP Chennai and daily newspapers of tamilnadu.
CHARTS AND DATA INTERPRETATIONS:
Table 6: Accident Details In Tamil Nadu For The Year From 1993 To 2012 ACCIDENT DETAILS IN TAMIL NADU FOR CERTAIN YEARS
State : TAMIL NADU
YEAR
Fatal
Grievous Injury
Minor injury
Non- injury
Total
Accidents
TOTAL NO.OF
PERSONS INVOLVED
N.A N.P.K N.A N.P.I N.A N.P.I N.A
1993 6528 7349 3562 5100 17957 27226 6878 34925 39675
1994 7027 7798 4199 6091 18950 28789 6861 37037 42678

International Journal of Enterprise Innovation Management Studies(IJEIMS) Vol2. No2. July-Dec 2011 ISSN: 0976-2698
Pp: 172-190 www.ijcns.com
185
1995 7974 8773 4440 6380 21661 31922 7610 41685 47075
1996 8079 9028 4474 7383 22151 31198 7493 42197 47609
1997 7947 8755 4542 6567 23362 34010 8352 44203 49332
1998 8510 9801 6562 8525 23862 33970 7789 46723 52296
1999 8734 9653 5276 7287 27231 34157 6845 48086 51097
2000 8269 9300 5278 8496 29137 44910 6239 48923 62706
2001 8579 9571 5442 8354 30963 45928 6994 51978 63853
2002 9012 9939 5830 8697 32183 46433 6478 53503 65069
2003 8393 9275 5163 8557 31600 46685 5869 51025 64517
2004 8733 9507 4875 7642 33222 49641 5678 52508 66790
2005 8844 9760 5214 7815 34669 54152 5151 53878 71727
2006 10055 11009 4630 6833 36262 57508 4198 55145 75350
2007 11034 12036 4498 6873 39494 64226 4114 59140 83135
2008 11813 12784 4426 6696 39193 63555 4977 60409 83035
2009 12727 13746 4448 6721 39676 63783 3943 60794 84250
2010 14241 15409 4613 6844 42320 68601 3822 64996 90854
2011 14359 15422 4619 6573 42766 67672 4129 65873 89667
2012 15072 16175 4851 6972 44604 71376 3230 67757 94523
20
13 (up to Ap
4893
5234
1564
2075
15068
24081
1033
22558
31390
N A : No of Accidents
N P K : No of persons killed
N P I : No of persons Injured

International Journal of Enterprise Innovation Management Studies(IJEIMS) Vol2. No2. July-Dec 2011 ISSN: 0976-2698
Pp: 172-190 www.ijcns.com
186
Figure 4: Total number of persons involved from 1998 To 2013(upto April)
Table 7. Road accident data from 1998 to 2013 (up to april 2013)
ROAD ACCIDENT DATA FROM 1998 TO 2013 (Up to April 2013)
CHENNAI CITY
YEAR
Fatal Grievous
Injury
Minor injury Non-
injury
Total
Accidents
Total No. of persons involved
N.A N.P.K N.A N.P.I N.A N.P.I N.A
1998
561
724
1832
1844
1928
3041
882
5203
5609
1999
575
681
87
87
3558
4269
424
4644
5037
2000
574
590
58
61
3956
4768
578
5166
5419
2001
611
638
125
147
3822
4640
684
5242
5425
2002
461
474
212
234
2792
3376
170
3635
4084
2003
509
529
217
238
3274
4069
202
4202
4836
2004
560
575
246
279
3750
4549
317
4873
5403
2005
550
561
435
532
3712
4526
199
4896
5619
2006
1082
1106
112
128
4336
5208
287
5817
6442
2007
1110
1146
1564
1907
4367
5331
529
7570
8384
2008
859
888
66
72
4296
5060
1602
6823
6020
2009
582
598
121
139
3504
4123
853
5060
4860
0
20000
40000
60000
80000
100000
YEA
R
1993
1994
1995
1996
1997
1998
1999
2000
2001
2002
2003
2004
2005
2006
2007
2008
2009
2010
2011
2012
TOTAL NO.OF PERSONS INVOLVEDTOTAL NO.OF PERSONS INVOLVED
International Journal of Enterprise Innovation Management Studies(IJEIMS) Vol2. No2. July-Dec 2011 ISSN: 0976-2698
Pp: 172-190 www.ijcns.com
187
2010
604
621
1470
1749
2227
2664
832
5133
5034
2011
906
929
271
320
4513
5343
876
6566
6592
2012
1367
1401
611
712
6581
7916
1104
9663
10029
2013
(up to April
504
517
262
310
3102
3685
453
4321
4512
N A : No of Accidents
N P K : No of persons killed
N P I : No of persons Injured
Source: DGP, Chennai
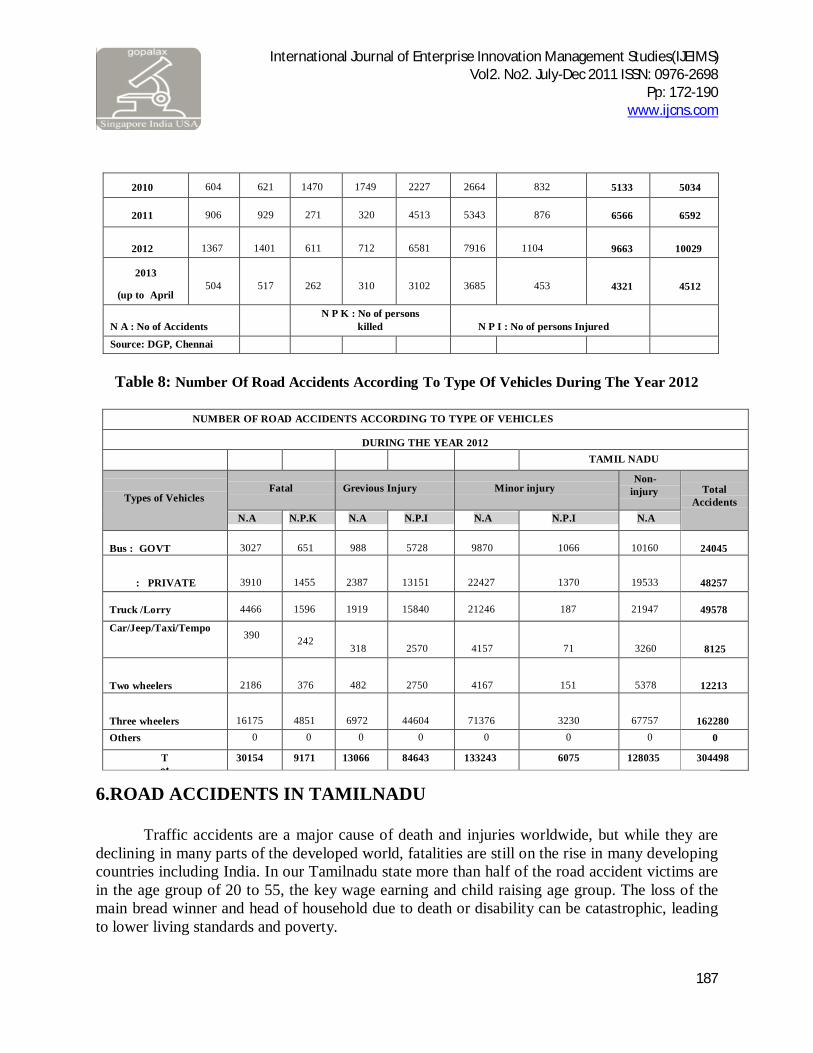
Table 8: Number Of Road Accidents According To Type Of Vehicles During The Year 2012
NUMBER OF ROAD ACCIDENTS ACCORDING TO TYPE OF VEHICLES
DURING THE YEAR 2012 TAMIL NADU
Types of Vehicles
Fatal
Grevious Injury
Minor injury
Non- injury
Total
Accidents N.A N.P.K N.A N.P.I N.A N.P.I N.A
Bus : GOVT
3027
651
988
5728
9870
1066
10160
24045
: PRIVATE
3910
1455
2387
13151
22427
1370
19533
48257
Truck /Lorry
4466
1596
1919
15840
21246
187
21947
49578
Car/Jeep/Taxi/Tempo 390
242
318
2570
4157
71
3260
8125
Two wheelers
2186
376
482
2750
4167
151
5378
12213
Three wheelers
16175
4851
6972
44604
71376
3230
67757
162280 Others 0 0 0 0 0 0 0 0
Tot
30154 9171 13066 84643 133243 6075 128035 304498
6.ROAD ACCIDENTS IN TAMILNADU
Traffic accidents are a major cause of death and injuries worldwide, but while they are declining in many parts of the developed world, fatalities are still on the rise in many developing countries including India. In our Tamilnadu state more than half of the road accident victims are in the age group of 20 to 55, the key wage earning and child raising age group. The loss of the main bread winner and head of household due to death or disability can be catastrophic, leading to lower living standards and poverty.

International Journal of Enterprise Innovation Management Studies(IJEIMS) Vol2. No2. July-Dec 2011 ISSN: 0976-2698
Pp: 172-190 www.ijcns.com
188
The main causes of the increasing death rates in the Road Accidents are: Not knowing or not adopting correct driving habits. Increasing number of New generation vehicles especially Two wheelers. Aggressive driving behavior of Heavy vehicle drivers especially Private Buses & Tipper
Lorries. Drivers sleeping while driving especially of Heavy vehicles & light motor vehicles after
midnight due to fatigue and other reasons. Over speeding. Bad condition of Roads and absence of different lanes. Driver /Rider's ignorance of Road conditions, Road signs and the Environmental factors. Driver /Rider's ignorance or violation of Traffic Rules. Drunken Driving/Driving without seat belt. Driving without Helmet.
All road users should remember that road is to be shared amongst all. Requirements of different road users may differ according to circumstances and observance of traffic rules and consideration for the fellow users can reduce congestions, traffic jams and accidents. All road users must ensure that they
Obey traffic rules at all times Obey all traffic signals and road sings Give preference to emergency vehicles and other fast moving vehicles wherever conditions
allow. Mandatory use signals who turning, stopping, over taking slowing down and parking Park only in designated areas. Give due consideration to pedestrians at all times Keep within permitted speed limits at all times.
7. PLAN TO STOP KILLING ON OUR ROADS
If we are determined, we can stop killing on the roads. We all play a role whether it is government, Private sector, industry; Media press TV, citizens, parents, teachers, and every one. We all can do it by:
Making people, our children staff and contractors aware of rules. Reminding them too often about dangers of the road
Learning defensive driving techniques By Encouragement and appreciation to good drivers By strict enforcement of traffic rules Sound design and maintenance of vehicles and roads Evaluation/adjustment to road conditions

International Journal of Enterprise Innovation Management Studies(IJEIMS) Vol2. No2. July-Dec 2011 ISSN: 0976-2698
Pp: 172-190 www.ijcns.com
189
8. SUGGESTIONS Fault of drivers only reported for high rate of accidents, government shall make more enforcement work on drivers. Two wheelers is the mostly expected vehicle for accident Drunken driving, over speeding, over loading, poor maintenance of vehicles and usage of mobile phones while driving are the major reasons for accidents. Sudden crossing by the pedestrian/ animal is also caused accidents. Not wearing seat belt and helmet is increases the severity of accidents. Making a proper road safety programs is the best method to reduce accidents; creating awareness among people about accidents and reasons for accidents. Developing emergency medical services through a 24*7 call centre with a dedicated common telephone number backed by ambulances. Make sure compulsory training program for before issuance of driving license. Developing highway patrol in national and state highways to find out the mistakes of drivers and making effective punishments. Make proper signals, way boards, and route maps in roads. 9. CONCLUSION Humans are unanimated, accidents are not made it happens unexpectedly. Creates severity not only financial level also in human lives. Drivers are plays vital role, they have to improve themselves and obey traffic rules. There is clearly a need for road safety education and it should be directed towards road users, who are frequently involved and injured in RTIs (e.g. students). An integrated programme of road safety education is suggested. State shall make proper rules and regulations and changes in traffic rules. And create good road conditions to avoid road accidents.
BIBLIOGRAPHY [1]Odelowo E. O. factors affecting Mobidity and mortality from road traffic – accidents; a Nigeria periurban study. Afri J med Sci 1993; 22: 69 – 74. [2]Archanu Kual, Sinhas us et al. Fatal road traffic accidents study of distribution, nature and type of injury. JIAFM, 2005: 27(2), 97w1 – 973. [3]Claret, P.L., A. B. Cavanillas, J. J. Jiménez Moleón, J. D. Luna del Castillo, M G. Martín and R. G. Vargas (eds) (2002) 'Influence of driver nationality on the risk of causing vehicle collisions in Spain'. Epidemiol Community Health 2002; 56:394–398 [4]Haque, M.S. (1999) 'The fate of sustainable development under neo-liberal regimes in developing countries'. International Political Science Review, Vol. 20, no.2. Sage publications. [5]Jacobs G. D; A. Aeron-Thomas, G. Gururaj, F .Rahman and B. Sexton (eds) (2004) 'The involvement and impact of road crashes on the poor: Bangladesh and India case studies'. Global Road Safety Partnership.

International Journal of Enterprise Innovation Management Studies(IJEIMS) Vol2. No2. July-Dec 2011 ISSN: 0976-2698
Pp: 172-190 www.ijcns.com
190
[6]Mohan, D., M. Khayesi, F.M. Nafukho and G. Tiwari (eds) (2006) 'Road Traffic Injury Prevention-Training Manual' WHO and Indian Institute of Technology Delhi [7]Mohan D, Road traffic deaths and injuries in India, Time for action. Nat. Medis India 2004, 17: 63 – 66. [8]Mohan D.Social cost of Road traffic crashes in India.www.cbme.iitd.in,2003. [9]Mondal, P., Dalela, S., Balasubramanian, N., Sharma, G.K., Singh, R. (2008). Critical Analysis of Road Crashes and a Case Study of Wet Road Condition and Road Crashes in an Indian Metropolitan City. SAE paper no. 2008-28-0078. [10]Mondal, P., Sharma, N., Kumar, A., Bhangale, U.D., Tyagi,D., Singh, R. (2011a). Effect of rainfall and wet road condition on road crashes: A critical analysis. SAE paper number 2011-26-0104. [11]Mondal, P., Kumar, A., Bhangale, U.D., Tyagi, D. (2011b). A Silent Tsunami on Indian Road: A Comprehensive Analysis of Epidemiological Aspects of Road Traffic Accidents.British Journal of Medicine & Medical Research, 1(1), 14-23. [12]Nantulya, V.M (2002) 'Equity Dimensions of Road Traffic Injuries in low and middle-income countries'. Havard Centre for Population and Development Studies, Cambridge. USA. Available at: http://www.bmj.com/content/324/7346/1139.full.pdf+html [Accessed on 25/6/2010]. [13]Oginni, F.O. (2008) 'Causes and outcomes of road traffic accidents in developing countries' in Bartley, G. P (ed) (2008) 'Traffic accidents: Causes and outcomes'. NOVA Science Publishers. [14]Peden, M.M., C. Dora, A. Hyder, E. Krug, M. MacKay, D. Mohan and R. Norton (eds) (2001) 'A five year WHO strategy for road traffic injury prevention'. World Health Organization, Geneva. [15]Peden, M., L. Sminkey (eds) (2004) 'World Health Organization dedicates World Health Day to road safety'. Injury Prevention 10, 67 Tamilnadu governmental website: www.tn.gov.in/sta/stat4.html [16]WHO (2001) 'International classification of functioning, disability and health, Geneva. WHO (2004) 'World report on road traffic injury prevention' WHO, Geneva. WHO (2006) 'Road traffic injury prevention training manual' WHO (2009) 'Global Status Report on Road Safety, time for action', WHO, Geneva.