A study on the Demand side of Accountability in the Urban ...
254
Analysis of the Demand side of Accountability in the Urban Sector A Study of Chennai City Thesis submitted for the Degree of Doctor of Philosophy in Economics By R.S.Murali Doctoral Guide Dr.S.Padmavathy Bharathidasan University Thiruchirapalli November 2009
Transcript of A study on the Demand side of Accountability in the Urban ...

Analysis of the Demand side of Accountability in the Urban Sector
A Study of Chennai City
Thesis submitted for the Degree of Doctor of Philosophy in
Economics
By
R.S.Murali
Doctoral Guide
Dr.S.Padmavathy
Bharathidasan University
Thiruchirapalli
November 2009

DEDICATION
This Thesis is dedicated to
Late Shri.R.S.Mani, my father, who taught me that hard work and tenacity are the two eyes to look into the future
and
Mrs.Y.G.Parthasarathy, (Dean & Director – PSBB Schools, Chennai), my teacher, who inspired me into learning
i

Thirukkural1
நாெடா ம் நாடி ைறெசய்யா மன்னவன்
நாெடா ம் நா ெக ம்
The country of the king who does not daily examine into and punish (crimes), will daily fall into ruin. Thirukkural – 553
Arthashastra2 They should carry out the works according to orders, without concerting together or quarrelling amongst themselves. Concerting together, they might swallow up (the fruits of) the undertakings, quarrelling, they might ruin (them). And they must not commence any work without informing the king, excepting measures against calamities.
And in cases of remissness on their part, he should fix a fine double the daily wages and (other) expenses. And he who, amongst them, carries out the work as ordered or better, should receive a (high) position and honour.
Arthashastra - 2.9.5 to 2.9.9
1 Thirukkural, written by the great Tamil sage/poet Thiruvalluvar (circa 30 BC), is a work on conduct and statesmanship. The translation of Thirukkural quoted in this study is based on the publication by the Thirupannathaazh Kasi Math, 1960. 2 Arthashastra (circa 350 BC) is a work on ‘governance and administration of a state’ by Chanakya or Kautilya. The quotes from Arthashastra in this study have been sourced from “The Kautilya Arthashastra” (Part II – An English Translation with critical and explanatory notes) by R.P.Kangle (1972, reprint 1988), published by Motilal Banarasidass Publishers Private Limited. The quotes are from Book 2 Chapter 9 – Inspection of (the work of) Officers, and they describe the accountability of various officials.
ii

CONTENTS DEDICATION........................................................................................................................... i
CONTENTS............................................................................................................................ iii
CERTIFICATE ....................................................................................................................... iv
DECLARATION...................................................................................................................... v
ACKNOWLEDGEMENT ...................................................................................................... vi
Table of Tables ....................................................................................................................... vii
Table of Figures........................................................................................................................ x
Table of Annexes ...................................................................................................................... x
ABBREVIATIONS ................................................................................................................. xi
Chapter – 1: Introduction ....................................................................................................... 1
Chapter – 2: Understanding the Urban Sector ................................................................... 25
Chapter – 3: Review of Literature and Theoretical Analysis ........................................... 45
Chapter – 4: Methodology, Survey, Validity, Reliability .................................................. 93
Chapter – 5: Analysis of Survey Findings ......................................................................... 116
Chapter – 6: Hypothesis & Testing .................................................................................... 163
Chapter - 7: Summary, Findings & Conclusions ............................................................. 199
Bibliography ......................................................................................................................... 236
Web-based References ......................................................................................................... 240
iii

Mrs. Dr. S. Padmavathy, M.A, M.Phil, M.B.A, B.Ed., Ph.D., P.G.D.E, P.G.D.I.M
Reader & Research Advisor,
Principal & Director, P.G.P College of Arts and Science,
Namakkal.
CERTIFICATE
Certified that this thesis “Analysis of Demand side of Accountability in the
Urban Sector – A Case of Chennai City” is a research work done by Mr.
R.S.Murali, at Bharathidasan University, Tiruchirappalli and submitted for the
award of Doctor of Philosophy in Economics. This thesis has not previously
formed the basis for the award to the candidate of any degree, diploma,
associateship, fellowship or any other similar title and it represents entirely an
independent work of the candidate under my guidance.
Place: Thanjavur
Date: S.Padmavathy
iv

R.S.Murali BSc(ApSc), MSc(Psy), FCA, AICWA, Lic.ICSI, DCM (ICA), CMC®
Managing Director, NCR Consultants Limited
Chennai.
DECLARATION
I hereby affirm that the research for this thesis titled “Analysis of Demand side
of Accountability in the Urban Sector – A Case of Chennai City” being
submitted to Bharathidasan University, Tiruchirappalli for the award of Doctor
of Philosophy in Economics, was carried out entirely by me, and that this work,
or any part thereof, has not been submitted elsewhere for any other degree,
diploma, associateship, fellowship or any other similar title.
Place: Chennai
Date: R.S.Murali
v

ACKNOWLEDGEMENT
I feel greatly indebted to the Bharathidasan University, Tiruchirappalli for
initiating me on this venture.
It is Dr. S. Padmavathy, Reader and Research Advisor - my guide, who
encouraged me to get in to this project saying that it is very topical and
essential. She has been a real source of encouragement and inspiration. It is
because of her availability and inputs that I have able to complete this work.
My heartfelt thanks are due to her.
My thanks are due to the Principal, Kunthavai Naachiyar Government Arts
College (W) Thanjavur for giving me permission to pursue my research
through the college.
I specially thank my Doctoral committee Members, Dr. J.A.Arul
Chellakumar, and Dr.G.Gnanasekaran, for all the help support provided from
the time of registration to the time of submission of my thesis.
This thesis would not have been possible but for the continuous support and
encouragement I have received from and the brain-storming I had with my
wife Nithya.
R.S.Murali
vi

Table of Tables Table 2-1: Number and Population (in Million) of Urban Agglomerations (UAs) and Towns
(1901-2001) in India ................................................................................................................ 28
Table 2-2: Share of Urban Areas in National Income ............................................................. 28
Table 2-3: Contribution of Urban Areas to National Income .................................................. 29
Table 2-4: Revenue Significance of the Municipal Sector ...................................................... 30
Table 2-5: Expenditure Significance of the Municipal Sector ................................................. 31
Table 2-6: Eleventh 5 year plan estimates for Urban Sector ................................................... 33
Table 2-7: ULB distribution in States of India (2004) ............................................................. 37
Table 2-8: Status of Implementation of CAA – Key Reforms ................................................ 38
Table 3-1: Key Words in the definition of Accountability and Transparency ........................ 58
Table 3-2: Types of Accountability ......................................................................................... 64
Table 3-3: Accountability Relationships ................................................................................. 66
Table 3-4: Analysis of the Accountability Models .................................................................. 78
Table 3-5: Basis for the proposed A-T-A Model ..................................................................... 80
Table 4-1: Ward/Zone Wise Sample ........................................................................................ 95
Table 4-2: Survey Plan and Actual – Statistical Analysis ..................................................... 100
Table 4-3: Gender Profile of Surveyed Population................................................................ 104
Table 4-4: Gender Profile of Respondents ............................................................................. 105
Table 4-5 : Age Profile of Respondents ................................................................................. 105
Table 4-6: Income Profile of Respondents ............................................................................ 106
Table 4-7: Occupation profile of Respondents ...................................................................... 107
Table 4-8 : Education profile of Respondents ....................................................................... 107
Table: 4-9: Summary of validity and Reliability Tests .......................................................... 110
Table 4-10: Summary of Demographic Variables (Count) .................................................... 113
Table 4-11: Summary of Demographic Variables (Percent) ................................................ 114
Table: 4-12: Validity – Content Validity – Feedback of Experts ......................................... 115
Table 5-1: Working of the Corporation ................................................................................. 120
Table 5-2: Reasons for Corporation: Not working fine and Working fine ............................ 121
Table 5-3: Service Delivery by the Corporation .................................................................... 122
Table 5-4: Citizen’s evaluation of the services delivered by the Corporation ....................... 123
Table 5-5: Reasons for lack of proper Service Delivery? ..................................................... 124
Table 5-6: How Accountable is Chennai Corporation ........................................................... 125
vii
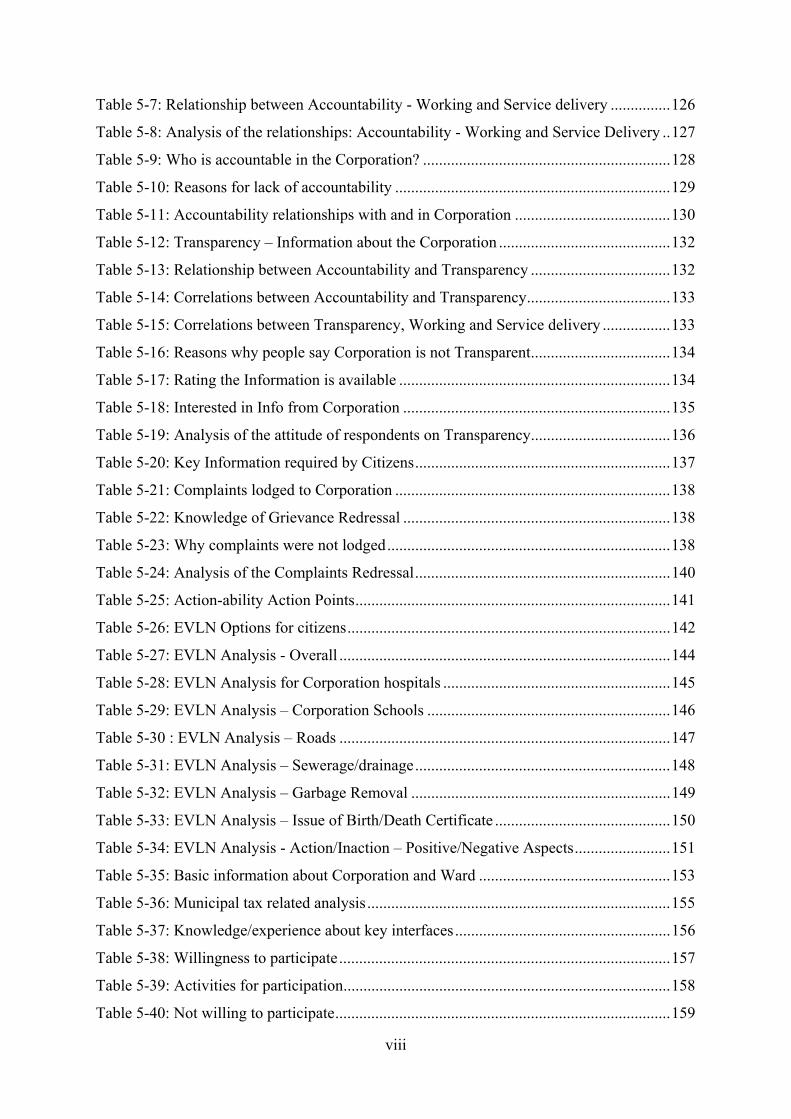
Table 5-7: Relationship between Accountability - Working and Service delivery ............... 126
Table 5-8: Analysis of the relationships: Accountability - Working and Service Delivery .. 127
Table 5-9: Who is accountable in the Corporation? .............................................................. 128
Table 5-10: Reasons for lack of accountability ..................................................................... 129
Table 5-11: Accountability relationships with and in Corporation ....................................... 130
Table 5-12: Transparency – Information about the Corporation ........................................... 132
Table 5-13: Relationship between Accountability and Transparency ................................... 132
Table 5-14: Correlations between Accountability and Transparency .................................... 133
Table 5-15: Correlations between Transparency, Working and Service delivery ................. 133
Table 5-16: Reasons why people say Corporation is not Transparent ................................... 134
Table 5-17: Rating the Information is available .................................................................... 134
Table 5-18: Interested in Info from Corporation ................................................................... 135
Table 5-19: Analysis of the attitude of respondents on Transparency ................................... 136
Table 5-20: Key Information required by Citizens ................................................................ 137
Table 5-21: Complaints lodged to Corporation ..................................................................... 138
Table 5-22: Knowledge of Grievance Redressal ................................................................... 138
Table 5-23: Why complaints were not lodged ....................................................................... 138
Table 5-24: Analysis of the Complaints Redressal ................................................................ 140
Table 5-25: Action-ability Action Points ............................................................................... 141
Table 5-26: EVLN Options for citizens ................................................................................. 142
Table 5-27: EVLN Analysis - Overall ................................................................................... 144
Table 5-28: EVLN Analysis for Corporation hospitals ......................................................... 145
Table 5-29: EVLN Analysis – Corporation Schools ............................................................. 146
Table 5-30 : EVLN Analysis – Roads ................................................................................... 147
Table 5-31: EVLN Analysis – Sewerage/drainage ................................................................ 148
Table 5-32: EVLN Analysis – Garbage Removal ................................................................. 149
Table 5-33: EVLN Analysis – Issue of Birth/Death Certificate ............................................ 150
Table 5-34: EVLN Analysis - Action/Inaction – Positive/Negative Aspects ........................ 151
Table 5-35: Basic information about Corporation and Ward ................................................ 153
Table 5-36: Municipal tax related analysis ............................................................................ 155
Table 5-37: Knowledge/experience about key interfaces ...................................................... 156
Table 5-38: Willingness to participate ................................................................................... 157
Table 5-39: Activities for participation .................................................................................. 158
Table 5-40: Not willing to participate .................................................................................... 159
viii

Table 5-41: Opinion on PPP .................................................................................................. 159
Table 5-42: PPPs: Areas for participation ............................................................................. 160
Table 6-1: Basis for the hypotheses proposed ....................................................................... 165
Table 6-2: Threshold levels for Hypotheses Testing ............................................................. 166
Table 6-3: Test Summary for Proportions for Hypotheses H0 1a to H0 1c .......................... 168
Table 6-4: Testing of A T A – Correlation Hypothesis ......................................................... 169
Table 6-5: Test Summary for Proportions for Hypotheses H0 3 ........................................... 171
Table 6-6: Test Summary for Proportions for Hypotheses H0 4 a ........................................ 173
Table 6-7: Test Summary for proportions for Hypothesis 4b ................................................ 174
Table 6-8: Demography based analysis of ATA Statements – Hypotheses 1a to 1c ............. 176
Table 6-9: Demography based analysis of ATA Correlations – Hypothesis 2 ...................... 178
Table 6-10: Demography based analysis of Action or Tolerance orientation – Hypothesis 3
................................................................................................................................................ 181
Table 6-11: Demography based analysis of Preparedness for Accountability – Basic
Knowledge - Hypothesis 4 (part a – basic knowledge) ......................................................... 187
Table 6-12: Demography based analysis of Preparedness for Accountability – Participation -
Hypothesis 4 (part b – participation) ..................................................................................... 192
Table 7-1: Mapping of Research Findings and Respondent Suggestions .............................. 211
ix
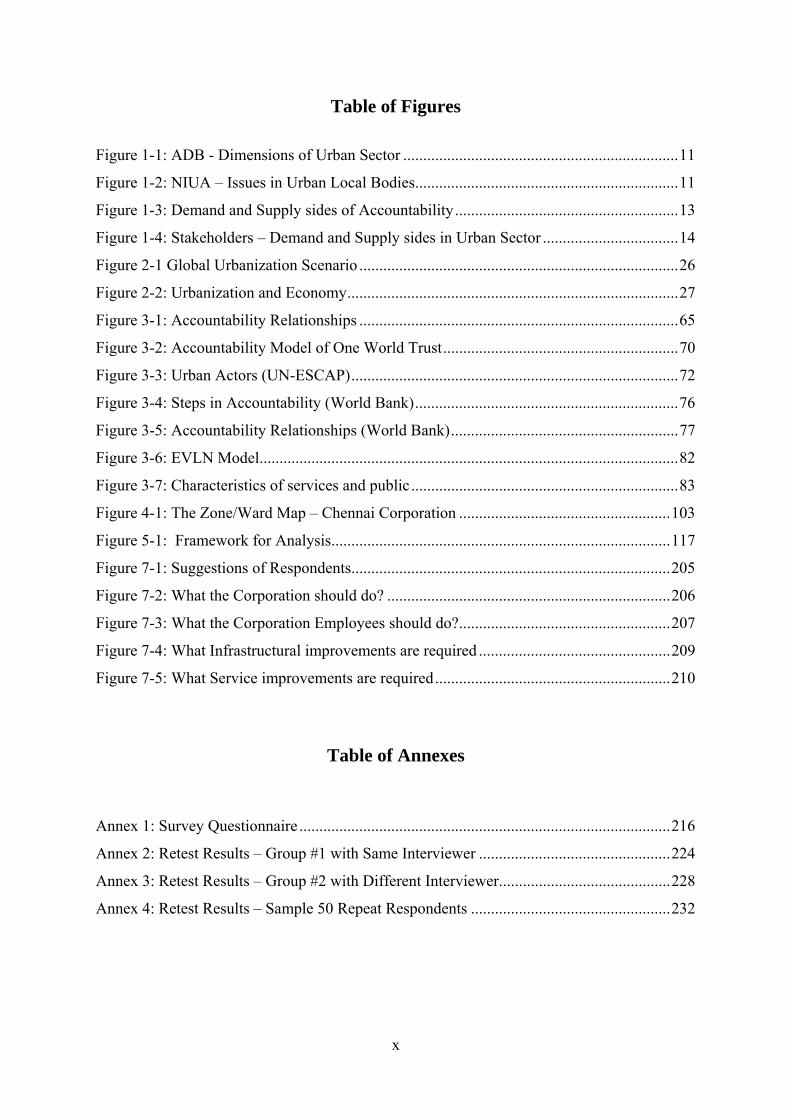
Table of Figures Figure 1-1: ADB - Dimensions of Urban Sector ..................................................................... 11
Figure 1-2: NIUA – Issues in Urban Local Bodies .................................................................. 11
Figure 1-3: Demand and Supply sides of Accountability ........................................................ 13
Figure 1-4: Stakeholders – Demand and Supply sides in Urban Sector .................................. 14
Figure 2-1 Global Urbanization Scenario ................................................................................ 26
Figure 2-2: Urbanization and Economy ................................................................................... 27
Figure 3-1: Accountability Relationships ................................................................................ 65
Figure 3-2: Accountability Model of One World Trust ........................................................... 70
Figure 3-3: Urban Actors (UN-ESCAP) .................................................................................. 72
Figure 3-4: Steps in Accountability (World Bank) .................................................................. 76
Figure 3-5: Accountability Relationships (World Bank) ......................................................... 77
Figure 3-6: EVLN Model ......................................................................................................... 82
Figure 3-7: Characteristics of services and public ................................................................... 83
Figure 4-1: The Zone/Ward Map – Chennai Corporation ..................................................... 103
Figure 5-1: Framework for Analysis ..................................................................................... 117
Figure 7-1: Suggestions of Respondents ................................................................................ 205
Figure 7-2: What the Corporation should do? ....................................................................... 206
Figure 7-3: What the Corporation Employees should do? ..................................................... 207
Figure 7-4: What Infrastructural improvements are required ................................................ 209
Figure 7-5: What Service improvements are required ........................................................... 210
Table of Annexes
Annex 1: Survey Questionnaire ............................................................................................. 216
Annex 2: Retest Results – Group #1 with Same Interviewer ................................................ 224
Annex 3: Retest Results – Group #2 with Different Interviewer ........................................... 228
Annex 4: Retest Results – Sample 50 Repeat Respondents .................................................. 232
x

ABBREVIATIONS
A&T Accountability and Transparency
ADB Asian Development Bank
ARC Administrative Reforms Commission (GoI)
ATA or A-T-A Accountability – Transparency- Account-ability
CAA Constitutional Amendment Act
CAGR Compounded Average Growth Rate
CFC Central Finance Commission
CLEAR Can-Like-Enabled-Asked-Responded
Crore Ten Million
DPC District Planning Committee
EVLN Exit-Voice- Loyalty-Neglect
FBAS Fund Based Accounting Systems
FI Female-Illiterate
FL Female-Literate
GDP Gross Domestic Product
GDRC Global Development Research Centre
GoI Government of India
GoTN Government of Tamil Nadu
IFAC International Federation of Accountants
IPSAS International Public Sector Accounting Standards
IT Information Technology
JNNURM Jawaharlal National Urban Renewal Mission
MI Male-Illiterate
ML Male-Literate
MPC Metropolitan Planning Committee
NCRCL NCR Consultants Limited
NDP Net Domestic Product
NGO Non Governmental Organization
NIUA National Institute of Urban Affairs
OECD Organization for Economic Cooperation and Development
PAC Public Accounts Committee
xi

xii
PG Post Graduation
PPP Public Private Partnership
PROOF Public Record of Operations and Finance
PWD Public Works Department
RBI Reserve Bank of India
RTI Right to Information Act, 2005
SFC State Finance Commission
TN Tamil Nadu
ULB Urban Local Bodies
UNCHS United Nations Centre for Human Settlements
UNDP United Nations Development Project
UN-ESCAP United Nations Economic and Social Commission for Asia and the
Pacific
UT Union Territory
WB World Bank
WC Ward Committee

Chapter - 1
ெபா ள்க வி காலம் விைனயிடெனா ைடந் ம்
இ ள்தீர எண்ணிச் ெசயல்
Five things should be carefully considered in the doing of all action, namely, the resources in hand, the instrument, the proper time, the nature of the action and the proper place for its execution.
Thirukkural - 675
If he causes loss through ignorance and other causes, he should make him pay that, suitably multiplied.
Arthashastra 2.9.14
1

Chapter – 1: Introduction
This Chapter is presented in four sections. Section-I deals with the importance of
accountability and transparency. While Section-II issues in urban governance, Section-III
deals with the demand and supply sides of accountability and transparency. Section-IV
deals with key aspects of this study like the objectives, and limitations of the study; and
provides the basis for chapterisation of the study.
Section-I: The Importance of Accountability and Transparency
A country performs as well as it is governed. Governance relates to decisions that
define expectations, grant power, or verify performance. It consists either of a separate
process or of a specific part of management or leadership processes. Sometimes people set
up a government to administer these processes and systems.
In terms of distinguishing the term governance from government (both of them nouns) -
"governance" is what a "government" does. It might be a geo-political government (nation-
state), a corporate government (business entity), a socio-political government (tribe,
family, etc.), or any number of different kinds of government. But governance is the
kinetic exercise of management power and policy, while government is the instrument
(usually, collective) that does it. The term government is also used more abstractly as a
synonym for governance, as in the Canadian motto, "Peace, Order and Good
Government"3.
The happiness of citizens depends on the governance of the place they live in. The essence
of successful governance is Accountability. Without accountability the objectives of
governance cannot be achieved. The persons, who are acting in a fiduciary position, as
agents of the citizens and stakeholders in the economy, need to act in complete trust. The
government can be thought of as a “trust” created by the authors (citizens) who have given
3 http://en.wikipedia.org/wiki/Governance
2
the responsibility of governance to the trustees (those responsible for governance and
handling the public money). This trusteeship in a democracy like India is held by the
politician-administrator combine.
“Transparency and accountability are critical for the efficient functioning of a modern
economy and for fostering social well-being. In most societies, many powers are delegated
to public authorities. Some assurance must then be provided to the delegators—that is,
society at large—that this transfer of power is not only effective, but also not abused.
Transparency ensures that information is available that can be used to measure the
authorities' performance and to guard against any possible misuse of powers. In that sense,
transparency serves to achieve accountability, which means that authorities can be held
responsible for their actions. Without transparency and accountability, trust will be lacking
between a government and those whom it governs. The result would be social instability
and an environment that is less than conducive to economic growth”.4
And today, thanks to the 73rd and 74th Constitutional Amendments Acts (CAA) 1992, the
third tier of governance has been etched. This decentralization of governance has moved
the seat of decision making and power nearer to the citizen. This decentralized power to
the most important stakeholder called citizen has been enabled by making the local
“bodies” (urban5 and rural) become local “governments”. Such a massive and powerful
4 Carstens, Agustin (2005), (Deputy Managing Director of the International Monetary Fund), The Role of Transparency and Accountability for Economic Development in Resource-rich Countries at the Regional Workshop on Transparency and Accountability in Resource Management in CEMAC Countries, Malabo, Equatorial Guinea, January 27, 2005. 5 Urban means "related to cities." (Wikipedia)
3

decentralization that is underway is a major milestone in the economic and political history
of India.
While it may be stated that it is already about two decades since these amendments to the
Indian constitution have taken place and not much has been done, in reality, a lot of
initiatives have been taken. It will not be fair on the part of the citizens to say that such
initiatives have not been taken; however, there is definitely a lot of things that need to be
done and also done properly, in order to achieve the desired results. Considering a country
with the size and complexities like India, and also with a chequered history of invasions,
these major initiatives are likely to take a long time to be really grounded, as such changes
are organic in nature.
“Accountability and transparency are the foundations of good governance. Local and
national leaders need to be transparent and accountable for their actions if they are to
successfully promote participatory governance….These, combined with weak legislatures,
weak accountability frameworks and weak judiciaries are the main contributing factors to
regional governance issues. Elected representatives, public officials, government
departments, public enterprises, quasi-government bodies and private sector institutions
must be held accountable for their actions and be fully transparent in their decision-
making, performance and use of public funds. All citizens must be accorded full access to
information and justice that is prompt and affordable. Lack of accountability and
transparency and increasing corruption have a strong negative impact on economic and
social growth.”. 6
6 UNDP, Governance for Livelihoods and Development in the Pacific (GOLD) Programme, UNDP website.
4

With the third tier of local governance getting nearer the stakeholders, particularly the
citizens, the management of public finance also gets nearer to him. Bogged down with
centuries of centralized systems, particularly due to the British rule, the migration to self-
governance requires consistent and intelligent efforts on the part of not only the policy
makers but various other stakeholders as well.
The two eyes of good governance are accountability and transparency. While
accountability deals with the extent of answerability of the public executives, transparency
deals with the extent of information shared by these public executives with the
stakeholders. These ingredients contribute for the success of any organization and their
level (how much accountable and how transparent) indicates the extent of the maturity of
the system. This is more so in the field of public delivery systems as the stakeholders are
innumerable. Also considering the current divide between the stakeholders and the trustees
(who are also stakeholders!), the system of accountability and transparency would
ultimately decide the quality of governance.
The importance of Accountability and Transparency (A&T) can be understood by the role
they play. Accountability provides the framework by which the public executives (both the
elected politician and the public servant) become answerable to the stakeholders.
Transparency provides the methods by which the stakeholder-sensitive information is
shared with them. While accountability contributes to strengthen the governance
processes, transparency paves way for communication and information sharing. Hence
these contribute towards ‘participatory governance’, which is the hallmark of democracy.
Therefore A&T issues assume extreme importance in a democracy like India.
5

The A&T issues take possibly the driver’s seat when it comes to financial matters. Every
stakeholder’s main expectation from public executives is ‘clean administration’. The word
“clean” connotes ‘do not defraud the resources given to you for governance’. While it is a
fact that still the stakeholders have not understood their participation their expectations
remain whether they express or not.
The field of Public Governance is still a black box for most of the stakeholders as an
extension of British legacy. This closed room practice (as it is practiced now) is
conceptually against the twin issues of accountability and transparency. When this focus is
turned towards ‘local governance’ – the governance of the local bodies, the situation is
rather cloudy. With decentralization initiatives kicked-off on a national basis with specific
programmes by both the Central and State Governments, in implementing the 73rd and 74th
CAA, there is a great need to address these issues of A&T, to ensure the success of the
decentralization. Unless there is clarity and proper implementation of these and related
issues, there could be jeopardy to the grand plan of India becoming a developed economy.
Taking this line of thought and argument, this thesis proposes to examine the A&T issues
in the urban sector. For this purpose the city of Chennai has been taken as the sample.
Importance and Role of Accountability and Transparency: the case of Public Finance
In order to understand the concept of accountability and transparency, the case of public
finance is taken up for discussion. In general, accounting and finance are considered as
part or functions of internal management of an organization. The same logic is extended to
the field of public governance also. “Accounting - a convincing explanation that reveals
basic causes”, “Accounting - a system that provides quantitative information about
6

finances” 7 are some of the definitions that are attributed to the term ‘Accounting’. Hence
Accounting has to do basically with ‘providing explanation’ which is the key ingredient of
accountability. “According to Y. Ijiri (1975, p. IX) accounting is a system designed to
facilitate the smooth functioning of accountability relationships among interested parties”.8
In the field of public finance, therefore, accounting gets its importance due to this very
characteristic. Accounting in government, particularly so in the case of local government,
has not received its due recognition - thanks to the British legacy. The focus of the British
was on the expenditure side in terms of accounting information. For the budget allotted,
what is the expense incurred? The British used accounting as a tool to understand whether
the natives used the budget properly as per the budget provisions allotted. The revenue
collection information was closely guarded for which ’Collectors’ were appointed. It is a
fact that still India has not come out of this legacy. This is the reason why the Budget
process in India has not undergone any major changes in the last 60 plus years after
independence. Some of the countries like New Zealand and Botswana prepare nation-wide
Balance Sheets, but India still prepares only Receipts and Payments accounts in various
tiers of the government. To this extent analytical and transparent information is not
provided by the Indian government.
The general awareness both inside and outside the government machinery is weak with
regard to the system of accounting followed by government organizations and the links
between the budget and accounting. Today, thanks to the communications technology and
media, even a common man understands that governments prepare budget, and taxation is
based on such an exercise. However in order to understand to what extent budget 7 http://www.thefreedictionary.com/accounting 8 Bartosz Kurek, (2004), Culture creating function of accounting, Accounting Department, Cracow University of Economics, pp- 1.
7

projection has been achieved, and how well public monies are managed for the purpose,
requires a good accounting system, and this is not understood by both the said insiders and
outsiders. It may be interesting to note that even today the divide between budgeting and
accounting does exist (dealt with in detail in the thesis discussions).
Until very recently there was inadequate recognition for accounting records even though it
was known that ‘accounting records formed the base for all authentic information within
government, for it is supported by records and documentation’. Even in areas where some
accountability was permitted, the watering down of management and governance standards
due to inefficiencies of public sector management, resulted in virtually total lack of
accountability practices. Though various interventions have been made to improve
governance, accounting was the least touched. Post 2000, there has been a major shift in
the focus in this regard in all the three tiers of governance, particularly at the local
governance level.
Local finance management is impossible without good accounting practices. The local
governments, unlike the other two levels, deal with operations and delivery of services.
Hence like any service organization in the private sector, the information requirements for
operational financial management were specific and specialized. However, these
institutions followed general government methods of accounting and did not have adequate
information for decision making. This coupled with inadequately qualified and
insufficiently trained personnel, accounting functions took a back seat. While the core
management of the urban governance (the Commissioner and senior officials) understood
this, they could not change the system.
8

Issues relating to transparency stem from accountability. For instance, in the case of
sharing information with the public, unless the information is generated from well defined
data recording process and is authenticated, the quality of information furnished would be
questionable. Moreover, most of the information required by the public is in relation to the
tax they pay and how well that money is used. Actually, these are directly related to the
process of ‘accounting’.
Considering the case of a local body, let us say a Corporation of a City or Town, what are
the types of information a citizen would like to know:
• The property tax she/he needs to pay.
• The status of road repair or drainage cleaning.
• When the garbage will be removed.
• And so on…
Though she may not be conceptually aware that her tax money is used for lifting the
garbage from her street or laying/maintaining her road, she would feel that the tax she pays
is not worth it. With the tax money and grants received by the Corporation from the higher
levels of government, it has to perform all its functions. In the literature of public finance,
the classical problem with local finance has always been ‘inadequate resource’ or
‘inadequate finance’. Suppose conceptually, these local bodies are analysed on par with
the service providers in the private sector the major differences arise from the
“management” (governance) aspects. The key area in this regard is the management of
finance. Finance management in any organization begins where accounting ends – that is
accounting is a prerequisite for good financial management. Hence it could be argued that
lack of good accounting system is one of the main reasons for the drawback in local
financial management.
9

These discussions on accounting provide the base for us to appreciate the philosophy and
behind accountability and transparency, with specific reference public finance. The local
body finance, an integral part of public finance, needs to have all these ingredients in order
to be an efficient and effective system that is both accountable and transparent. Apart from
those discussed earlier, the following factors have also contributed to the lack of A&T:
Lack of clear-cut policy discussions and dialogues;
Lack of accounting standards for local government;
Lack of comprehensive accounting system – the local governments follow cash
basis of accounting and hence there is total lack of asset/ liability management -
major weakness;
Lack of system for sharing of information with the public;
Lack of involvement of various stakeholders in public decision making.
Hence extending the argument of this accounting and finance related accountability and
transparency, this thesis looks at the A&T aspects in the urban sector. While accounting
and finance management are underlying issues, these have not been taken up exclusively
in this study. Various macro and operational issues have been considered in this study, as
this study is one of the firsts of its kind.
Section III: Key Issues in Urban Governance
Asian Development Bank (ADB) Strategy Document for Urban Sector9 lists out the key
issues that are required to be addressed. These are generic issues across all the Asian
9 http://www.adb.org/Documents/Policies/Urban_Sector/urban0203.asp?p=policies
10

countries and are very much applicable to India also. The major observations in this regard
are given in Figure1-1:
Figure 1-1: ADB - Dimensions of Urban Sector
An assessment by National Institute of Urban Affairs (NIUA), Government of India has
identified some of the important issues based on a study in 200310 given in Figure 1-2:
Financial • Declining fiscal base • Mismatch between functions and resources
Institutional • Multiplicity of agencies • Problems in inter-departmental coordination: overlapping of
functions, conflicts and wastage of resources • Poor information system and lack of attention on public
grievances Legal
• Fragmented Municipal laws in different states e.g. Maharashtra, Tamil Nadu; separate acts for separate corporations
Managerial • Lack of technical expertise to manage municipal functions and
finances • Difficult to make differences between capital and revenue budget • Small and medium cities have no full time engineer, public
health officer, qualified accountant, planner, etc.
C. Dimensions of the Urban Sector 1. Urban Governance a. Decentralization b. Community Participation c. The Private Sector 2. Urban Finance 3. Urban Infrastructure and Services a. Institutional Strengthening and Capability Building b. Water Supply, Sanitation, and Solid Waste c. Urban Transport d. Urban Housing e. Urban Land Management
Figure 1-2: NIUA – Issues in Urban Local Bodies
10 Mathur, Mukesh P.(2003) , Municipal Finance and Municipal Services in India - Present Status and Future Prospects, NIUA, pp-83
11

World Bank in a study of ULBs three specific states (Maharashtra, Karnataka, Tamil
Nadu) and their governance makes the following observations11 in the Executive Summary
to the report under the sub-heading Governance:
“……..Authority and financing are not congruent with ULB responsibilities, leading to instances where ULBs bear the financial responsibility for decisions in which they had little or no say. This separation of the decision maker (often a state entity), from the financier, the service deliverer, and the ultimate beneficiary, results in the provision of infrastructure and services that do not match local preferences and needs, and are often not repaid nor maintained. ULBs also have limited scope in managing their assets. Land is over-regulated and urban land markets are highly distorted (e.g.,land ceiling act, rent control, regulations on conversion of use, high stamp duties). Land use regulations, titling and permitting are generally opaque and ineffective. ULBs face numerous layers of oversight and regulation, with many decisions on procurement and staffing (e.g., recruitment, hiring, staffing levels, pay scales) taken by state officials. ULBs’ ability to respond to local demands is circumscribed by their inability to hire or fire qualified staff. Central government decisions on public employee wages made through the Pay Commission also have significant impacts on local wage payments. Low limits for municipal approval authority (technical and administrative sanction) and layers of bureaucratic reporting limit ULB autonomy, and discourage them from improving their performance or pursuing innovations. The appointment of senior municipal officials by the Indian Administrative Service or State Administrative Service brings capacity and professionalism to ULBs. However, this structure also directs the accountability of these officials upward rather than toward local politicians or citizens. Local politicians have very limited ability to hold appointed municipal officials accountable for their performance, which in turn limits citizens’ ability to hold local politicians accountable. The frequent rotation of these officers further limits accountability to local decision makers and the autonomy of local decision-making.”
Though the ADB study has been at the continent level, the NIUA study at the country
level, and the World Bank study at three specific state levels in India, the observations
converge on specific governance issues in relation to:
11 World Bank, Energy and Infrastructure Unit, South Asia Region, (December, 2004), INDIA: Urban Finance and Governance Review, Volume I (Executive Summary and Main Report), pp-iv.
12

• Management aspects of the ULBs
• Financial aspects of the ULBs
• Stakeholders participation of the ULBs
These three aspects are major ingredients of A&T, and examination of these aspects is
part of this thesis. Managerial and stakeholders’ participation aspects gain prominence in
this study as the study is from the demand side.
Section-III: Accountability and Transparency – the Demand and Supply sides
Accountability and Transparency (A&T) are instruments of governance in a democratic set
up. While accountability deals with the ‘ability of any institution/individuals to be
answerable to the stakeholders for various actions it/he/she (under) takes’, transparency
relates to ‘openness in procedures, and processes within the system to enable stakeholders
understand what is happening in the institution’. These twin reasons have changed the role
of urban local bodies with specific reference to its financial management.
According to UNDP12:
Figure 1-3: Demand and Supply sides of Accountability
The UNDP conceptualizes the demand side of accountability as citizens’ or stakeholders’
tool while the supply side of accountability belongs to service providers or the 12 UNDP: Strengthening accountability at the country level UNDP's approach to democratic governance assessments, UNDP Website: http://www.undp.org
13

government. According to World Bank13 the demand side is represented by Social
Accountability which is an approach towards building accountability that relies on civic
engagement, ii.e, iin which its citizens and/or civil society organizations participate
directly or indirectly in exacting accountability. Understanding of local government
constraints like resources for capital investment, reliability of transfers, own managed
revenue streams, capacity for data management and capacity building, changing macro
environments and overall regulatory policies are issues that require consideration.
Figure 1-4: Stakeholders – Demand and Supply sides in Urban Sector
The A&T issues need to be understood from the demand and supply viewpoints; the
demand and supply are with regard to the ‘public information’ that is being shared by the
ULBs with the stakeholders of the system. Without accountability no large organization,
be it private or public, could function effectively. Figure 1-4 shows various stakeholders in
13 World Bank (2007) based on a presentation on Social Accountability aspects in Bosnia Herzogovina, from http//:www.worldbank.org
14

the urban sector and the demand, supply sides. Rectangular boxes show various
institutions, while the oval shapes are represented by individuals. The shapes with dotted
lines are being considered for analysis in this research.
• One supply side is shown at the middle level and two levels of demand are shown
separated by the two dotted horizontal lines. These levels are relative levels, one
form the above and one from below;
• Central to the consideration is the Local body, which is accountable to the higher
levels of the government;
• Hierarchically the Central Government (GoI) and State Government demand
information from the Local Body;
• Similarly the citizens, citizen’s associations, auditors, and media demand
accountability from the Local Body. This is shown as the demand side on the lower
part of the diagram.
This research is on this aspect of the demand side of accountability.
Accountability is the obligation to answer for or be responsible for one’s actions,
ultimately to a party or authority that may impose a penalty for failure. In the case of the
Government, the challenge is to make all Public Servants work towards the common
objective of delivering improved services to citizens and to ensure that these services meet
the standards and quality citizens expect. Such accountability is enforced both within
Government (horizontally, on the supply side, between bodies) and between government
and citizens (vertically or on the demand side)14.
14http://www.utumishi.go.tz , Accountability and Responsiveness to the Public, (Last Updated Friday, 07 March 2008)
15

Demand Side
The demand side of the equation is represented by various stakeholders, the most
important one being the citizen. The government is accountable to the citizens. The
increasing awareness of the public: citizen’s forum, consumer forum,
media/press/TV/internet, etc. are also increasing the pressure on the public institutions and
hence on A&T issues.
Most of the State Governments in India have come up with legislations in this regard. The
Right to Information Act, Transparency in Public Procurement Act, inclusion of public
institutions under the Consumer Protection laws, etc. have been enacted based on the A&T
considerations. The multilateral funding agencies and the financing institutions have
started demanding complete A&T in order to understand the governance and management
empowerment in these institutions.
Next is the aspect relating to control: the normal control mechanism in the government has
not been working that well (consistent scams in ULBs, increasing politicization, lack of
provision/maintenance of infrastructure at local level, non-addressing of core
developmental issues, etc). The existing audit mechanism, except in a few and obvious
cases, has not been able to provide A&T deviations. There is now a pressure on the audit
mechanism also to change itself. Moreover, the ULBs do not have a mechanism equivalent
of Public Accounts Committee (PAC) at the Government level to oversee deviations. Now
there is a pressure to have a set up like PAC with regard to the finances of the ULBs.
16

Supply side
The supply side of AT information is very weak. The weakness arises from the following
factors:
Until recently ULBs were not given due importance as the ‘point of contact
between government and citizens’:
Internal systems within the ULBs are very weak and have not changed with times;
The quality of manpower within the ULBs does not have the wherewithal to handle
complicated issues;
The political system did not want transparency at ULB level for obvious benefits;
Lack of technological update to provide information to the stakeholders;
Lack of comprehensive approach by the administration to view ULBs as an integral
part of ‘governance’.
The system of transparency that is prevalent in any public system provides link between
the demand and supply sides. Sharing of information by making them available through
the websites, through media, etc. are acts of transparency. For instance, publishing of the
financial results of ULBs forms part of the transparency mechanism that provides direct
accountability to the citizens.
This thesis seeks to look, to the extent possible and practicable, at some of the key aspects
of the demand side of the accountability mechanisms in the urban sector.
Section IV: Significance of the Study
The issue of accountability and transparency are global. In this regard, areas like
municipal governance including municipal finance (and hence municipal accounting) are
17

by far the major areas that need to be reformed, supported by IT, if A&T objectives are to
be achieved. This has been understood by the governments and multilateral institutions
across the globe, and in the last two decades across the globe and in the last decade in
India the focus is on this. In the USA, for instance the Municipal Bond market is stated to
be the second largest money market next only to the Stock market. This implies that if the
municipal management is good, the citizens would be coming forward to purchase the
municipal bonds as they purchase shares in the stock market. In the emerging economies
like India also, all the public financial institutions are getting into this area. This is because
the urban infrastructure has to become world class, and this requires funding. Hence it is
not about getting funds, but also using the money properly (management) and in a way the
citizens want it. This shows the importance of the issues taken up in this study.
In the recent years there have been more cases of financial scandal across the globe in the
private sector15 where the accountability mechanisms are stated to be better. This means
such mechanisms need to be further tightened. In the case of urban sector even the
accounting mechanism is weak. Considering this unless a very strong accountability
system is built as the accounting systems are getting implemented, there are likely to be
future ethical shocks rocking the economy that can have damaging consequences. Various
initiatives at global to local level in India give us an idea about the seriousness and the
status of such initiatives.
Global Initiatives
New Zealand and Ireland were the first two countries to increase transparency in
governmental accounting system. Today in these two countries and in a few more
15 Enron, World Tel, Sub-prime crisis and Satyam are referred to here
18
countries like Botswana in Africa, the governments follow double entry accounting system
and present the annual balance sheet of the country to the highest Legislative Authority. In
the USA, Government Accounting Standards Board (GASB) is playing a lead role in
setting up governmental accounting standards and supervising the modernization of the
accounting systems. At a global level, institutions like International Federation of
Accountants (IFAC) are involved deeply in developing International Public Sector
Accounting Standards (IPSAS) and documenting case studies in governmental accounting
leading to A & T initiatives, through standardized accounting and disclosure practices.
Hence, both accountability (through audit and accounts) and transparency (through transfer
of information about the finances) are addressed by these initiatives.
Indian Initiatives
Thanks to the CAA (1992), the last decade has given rise to a spurt of activities in this
regard. However, the government agencies themselves have been given the task of
assessing and revamping the system. Only in the recent years (post 2000) there have been
discussions at national level: formation of Task force to look at Municipal Accounting
Practices by Comptroller and Auditor General of India, Accounting, Transparency, Public
Oversight studies initiated by the multilateral agencies like The World Bank, strengthening
of department of municipal administration in some of the states, formation of think tank on
e-governance initiatives in the municipalities, etc. The discussions in all of these, lead to
one point - the need for a robust accounting system in order to handle A & T issues. Right
to Information Act, 2005 is also a step in this direction.
Decentralization and Autonomy: Apart from the above points, the increasing powers at the
local body level increase the genuine pressure for authentic accounting information for
19

decision making on the one side and making them available to public on the other. This is
due to increased fund flows through scheme based funding from the higher levels of
government (JNNURM), revised strategies for increased revenue collections, and
structured borrowing by ULBs for infrastructure building. These initiatives are expected to
totally change the volume of financial transactions, while increasing the pressure of
accountability of the ULBs to multifarious institutions. This has definitely increased the
pressure on these institutions to have a robust accounting and information mechanism,
apart from the increased participation of various stakeholders.
As the issues in service delivery quality, accountability, and transparency increase, the
need for the use of technology becomes obvious. The availability of implementable
technologies at nominal cost with local talents to operate and maintain have given boost to
e-governance initiatives which again depend upon accounting information to be shared
with the public.
Initiatives in Tamil Nadu and Chennai
Tamil Nadu has been one of the few states in India that are leading in terms of municipal
reforms. Tamil Nadu is the first and the only state that has implemented double entry
accounting system in all its municipalities at the wake of the 21st century. Chennai
Corporation is one of the oldest Corporations in India, having started through a Royal
Charter, 1688 (29th September)16 - “The first municipal corporation was created by a
Royal Charter in Madras in 1688”.17 Also, Chennai Corporation was the first City
Corporation in India to move to double entry accounting system as early as 1983. The
16 http://www.chennaicorporation.gov.in 17 Mathur, Mukesh P Dr,(2003), ibid, pp-6
20

Corporation has put up a website with information on the various services provided by it,
aspects relating to RTI Act, payment facilities for taxes, etc.
It has to be studied whether these initiatives by the Chennai Corporation are properly
addressing the accountability and transparency aspects. This study is from the demand side
of accountability indicating that the focus would be from the citizens (the persons who
demand services from Corporation). Hence some of the financial and accounting aspects
discussed in this chapter may not be fully dealt with, as these are still considered internal
aspects and the expected accountability and transparency has not yet percolated down the
governance levels.
The study of Chennai Corporation on these aspects is likely to provide insights into
various aspects of accountability and transparency, with specific reference to urban
governance from the demand perspective.
Focus of the current Research
This research looks at various accountability and transparency models and definitions with
regard to urban (local) finance and seeks to understand the accountability arrangements in
the city of Chennai from the demand side of accountability. As seen in Figure 1-4, two
demand sides were discussed; however, this study focuses on the demand aspect of
accountability from the citizens’ viewpoint. The demand aspects are examined through a
field survey, and available documentation.
21

Research Objectives
The study aims to understand and establish the role of accountability, transparency
and action-ability (a term developed during the study) with regard to urban sector from
the perspective of governance in India. The specific objectives of this research are:
1. To understand the behavior of accountability variables from the demand
perspective through the ATA Model developed during this research;
2. To study the options available for the citizens with regard to the services
provided by the urban/local government, from the demand side of
accountability, through EVLN Model;
3. To understand the preparedness for accountability of the citizens through the
behavior of the two key variables (basic knowledge and participation) from the
citizen (demand) perspective.
Strengths and Limitations of the Study
Strengths
1. This is possibly the first empirical study of this size and depth on aspects relating to
accountability, transparency and action-ability with regard to the urban sector, and
hence documents various issues for the first time.
2. The study has resulted in the development of ATA Model, including the
identification of action-ability as an important ingredient of accountability related
parameters in urban governance.
3. The study has also studied some of the popular models like the EVLN model, at a
mega city level.
4. The study has been done in the Chennai metro and all the 155 wards have been
covered in the study with a sample size of 663.
22

5. The study has provided inputs for action for various levels of governance and also
has resulted in identification of some of the key parameters of performance in this
regard.
6. Various outputs arising out of the study are implementable in the field.
Limitations
1. Since the study of such a topic is for the first time, the extent of understanding of
the issues underlying may limit the study.
2. Limitations in understanding of various aspects of the study by the respondents can
be a limitation. The study covers both literate and illiterate population and the
levels of understanding are seen to be drastically different.
3. Various macro-economic models attempted in this study were not developed
specifically for the urban sector and hence there could be difference in their level
of fitness in the issues taken up.
Chapters of this Thesis
Chapter Two provides an overview for Understanding the Urban Sector in India. Various
aspects of governance initiatives in the urban sector as a whole, an update on the various
initiatives taken at national, state- Tamil Nadu, city- Chennai levels is given. This provides
the backdrop for various discussions that are done as part of this study.
Review of Literature and Theoretical Analysis are provided in Chapter Three. Literature
review for Accounting in Urban Sector, Accountability and Transparency in the Urban
23

Sector is undertaken. Discussion of various theoretical and conceptual aspects, models and
frameworks used in the research are covered in this chapter.
Chapter Four provides the complete Methodology and Survey. Research design for the
ATA Model, VSLN Model and the preparedness of the citizens for Accountability related
matters are explained in detail. The chapter covers the Survey done exclusively for the
research aspects, the details of the survey, etc. and the research questionnaire is also
included.
Analysis of Survey Findings is given in Chapter Five. Analysis brings out the findings
of the survey with reference to the three specific aspects of examining the ATA Model,
EVLN Model and the preparedness of the citizens for accountability related initiatives.
Basic tabulation and implications of the survey results are discussed.
Chapter Six provides details on the Hypotheses and Testing of the Hypotheses. Based on
the discussions in various chapters, three major hypotheses are set for the research. The
statistical validity of these hypotheses are tested to understand the overall results. Based on
the demographic variables, these hypotheses are analysed in order to bring out results of
the survey.
Chapter Seven provides Summary, Findings and Conclusions of the study. Summary of
study findings and conclusions for all the three hypotheses are brought out. The extent of
the achievement of the objectives of the entire research is brought out. The limitations of
the study are discussed based on the experience gained from this research. The inputs for
further research both from theoretical and practical aspects are summarized.
24

Chapter - 2
அஞ்சாைம ஈைக அறி க்கம் இந்நான்கும்
எஞ்சாைம ேவந்தற் கியல்
Dauntlessness, liberty, wisdom, diligence – it is the virtue of a king not to fail in these four.
Thirukkural – 382
If he brings in (the whole) for the King, he should be warned in case of minor offence, in case of a major offence should be punished according to the offence. Arthashastra – 2.9.16
25

Chapter – 2: Understanding the Urban Sector This chapter is divided into three sections. Section I provides an introduction to the urban
sector, Section II provides an account of accountability and transparency with reference to
urban sector. India, Tamil Nadu and Chennai specific aspects are also discussed. Section
III provides inputs on the importance of this research.
Section-I: Indian Urban Sector
Figure 2-1 Global Urbanization Scenario
In India, while its one billion-plus population is predominantly rural, over 300 million
people live in urban areas. One-third of this population lives in 35 urban agglomerations or
cities with population exceeding one million. The share of GDP generated in urban areas
26

has increased over the past 10 years…...18 Cities are responsible for delivering various
public services, yet severe infrastructure shortages in water supply and sanitation, roads,
transportation, housing and waste management, and inefficient management have resulted
in poor quality services with limited coverage.19
In India the process of urbanization seems to have slowed down on a national basis with its
contribution to GDP actually growing steadily. This is summarized by the graph and
discussions by Roopa Purushothaman (2009).20
Figure 2-2: Urbanization and Economy
With faster and more integrated economic growth, urbanization is gaining momentum in
the developing countries; nearly half of the world today is urban. India’s urban population
grew from 26 million in 1901 to 285 million in 2001, with the share of population in cities
and towns steadily rising from 10.8 per cent in 1901 to 27.8 per cent in 2001. The number
18 World Bank, (June 2001), India Urban Sector Strategy. The Strategy notes suggest that urban poverty is less well analyzed than rural poverty. 19 The 1996 Rakesh Mohan Infrastructure Report estimated that annual investments of about US$5 billion (1.5 percent of GDP) are needed to make up for past under investments and future demands on urban areas. 20 Roopa Purushothaman (2009), from chapter on The Next Urban Frontier, in India 2009, Business Standard Publication, pp-235.
27

of metropolitan cities went up from one in 1901 to 35 in 2001. The percentage of urban
population living in these million-plus cities increased from 5.84 in 1901 to 38.60 over the
same period21.
Table 2-1: Number and Population (in Million) of Urban Agglomerations (UAs) and Towns (1901-2001) in India
Census Year
Number of UAs/Town
s
Total Population Urban Population Urban Population as % of Total
Population 1901 1,830 238,396,327 25,851,873 10.8 1911 1,815 252,093,390 25,941,633 10.3 1921 1,944 251,321,213 28,086,167 11.2 1931 2,066 278,977,238 33,455,989 12.0 1941 2,253 318,660,580 44,153,297 13.9 1951 2,822 361,088,090 62,443,934 17.3 1961 2,334 439,234,771 78,936,603 18.0 1971 2,567 548,159,652 109,113,977 19.9 1981 3,347 683,329,097 159,462,547 23.3 1991 3,769 846,387,888 217,551,812 25.7 2001 4,378 1,028,610,328 286,119,689 27.8
1. Urban Agglomerations, which constitute a number of towns and their outgrowths, have been treated as one unit.
2. The total population and urban population of India for the year 2001 includes estimated population of those areas of Gujarat and Himachal Pradesh where census could not be conducted due to natural calamities.
3. The total population and urban population of India for the year 1991 includes interpolated population of Jammu & Kashmir where census could not be conducted.
4. The total population and urban population of India for the year 1981 includes interpolated population of Assam where census could not be conducted.
Source: Census of India 2001
The contribution of urban areas to country’s Net Domestic Product (NDP) has been
steadily increasing from about one-third in early 1970s to about 50 per cent in the post-
liberalization period (Table 2-2).
Table 2-2: Share of Urban Areas in National Income
Year Total NDP (Rs. Billion)
NDP Urban (Rs. Billion)
Share of Urban in Total NDP (%)
1970-71 368 139 37.7 1980-81 1103 453 41.1 1993-94 7161 3312 46.2 Source: Central Statistical Organisation, reported in Mohan (2004). Mohan, Rakesh and Shubhagato, Dasgupta (2004): Urban Development in India in the Twenty First Century: Policies for Accelerating Urban Growth, Fifth Annual Conference on Indian Economic Policy Reform at Stanford Center for International Development, June 4-5,
21 RBI (2007), Municipal Finance in India: An Assessment, Department of Economic Analysis and Policy, Reserve Bank of India, Mumbai, December 27, 2007
28

Similarly, the share of the urban areas to national income has also been steadily increasing.
It is estimated that the urban areas contribute to as high as 60 per cent of the National
Income (Table 2-3). According to the 2001 census, India has a population of 1027 million
with approximately 28 per cent or 285 million people living in urban areas. As a result of
the liberalization policies adopted by the Government of India it is expected that the share
of the urban population may increase to about 40 per cent of total population by the year
2021. It is estimated that by the year 2011, urban areas would contribute about 65 per cent
of Gross Domestic Product (GDP).22
Table 2-3: Contribution of Urban Areas to National Income
Year Share of Population (%) Share of National Income (%)
1951 17.3 29.0 1981 23.3 47.0 1991 25.7 55.0 2001 27.8 60.0 Source: Ministry of Urban Affairs, Government of India, reported in Kumar (2003). Kumar Dhirendra (2003): Environmental Management Systems – An Exemplary for Urban Local Bodies.
While the contribution of the urban areas to National Income is overwhelming, the
contribution of the urban local bodies in this regard seems to be limited. The recent
analysis by the Reserve Bank of India on the ULBs brings out the significance of ‘local
public finance’23. As per the Report of the Twelfth Finance Commission, India has 3,723
ULBs, of which 109 are MCs, 1432 are municipalities and 2182 are Nagar Panchayats.
The total revenue of the municipalities grew from Rs.11,515 crore in 1998-99 to Rs.15,149
crore in 2001-02 at a compounded average growth rate (CAGR) of 9.6 per cent. The total
expenditure increased from Rs 12,035 crore to Rs 15,914 crore during the same period,
22 Ministry of Urban Development, Jawaharlal Nehru National urban Renewal Mission, Overview, , pp-3, from http//:www.jnnurm.nic.in 23 RBI (2007), ibid
29

registering a CAGR of 9.8 per cent. In spite of the growth of the municipal sector in the
country, it accounts for a very small proportion of both Gross Domestic Product (GDP) (at
current prices) as well as revenue and expenditure of the upper tiers of Government.
Table 2-4: Revenue Significance of the Municipal Sector Year Municipal
Revenue (Rs.Crore)
Percentage of GDP at
Factor Cost
Relative share of Municipal Revenue (as per cent of Total
Revenue of) State Govt.
Central Govt.
Combined State & Central Govt.
1998-99 11,515 0.72 4.4 4.1 2.5 1999-00 13,173 0.75 4.2 4.4 2.5 2000-01 14,581 0.77 4.2 4.5 2.4 2001-02 15,149 0.73 4.1 4.2 2.3 Source: (i) Reports of Eleventh and Twelfth Finance Commission, (ii) Economic Survey, GoI 2004-05
Total revenue of the municipal sector accounts for about 0.75 per cent of GDP of the
country (Table 2-4). In contrast, the ratio is 4.5 per cent for Poland, 5 per cent for Brazil
and 6 per cent for South Africa [Buckley (2005)]. Similarly, municipal revenue forms a
little more than 2 per cent of combined revenue of State and Central Governments. Total
revenue of ULBs has been growing at a lower rate (9.7 per cent during 1998-99 to 2001-
02) than the growth of combined revenue of Central and State Governments (10.8 per cent
during 1998-99 to 2001-02). This is reflected by a marginal decline in the share of
municipal revenue in total government revenues from 2.5 per cent in 1998-99 to 2.3 per
cent in 2001-02.
30

Table 2-5: Expenditure Significance of the Municipal Sector
Year Municipal Expenditure (Rs.Crore)
Percentage of GDP at
Factor Cost
Relative share of Municipal Revenue (as per cent of Total Expenditure of)
State Govt.
Central Govt.
Combined State & Central Govt.
1998-99 12,035 0.75 4.52 4.31 2.21 1999-00 14,452 0.82 4.60 4.85 2.36 2000-01 15,743 0.83 4.53 4.84 2.34 2001-02 15,914 0.76 4.22 4.39 2.15 Source: (i) Reports of Eleventh and Twelfth Finance Commission, (ii) Handbook of statistics on Indian Economy, RBI 2005-06
In terms of total expenditure, the municipal sector accounts for about 0.79 per cent of the
GDP of the country (Table 2-5). While municipal expenditure accounts for little over 2 per
cent of the combined expenditure of State and Central Governments, it declined further
between 1999-2000 and 2001-2002.
With over 50 per cent of GDP from the Urban areas, the revenue generated by the local
government which provides the basic infrastructure is less than 1 per cent. This requires a
systematic investigation. Thus the economic role of urban sector and hence the role of
urban finance in the performance of India’s economy is extremely important, as the urban
local bodies provide the basic infrastructure. Unless the Corporation provides good
infrastructure like roads, drainages, water supply, etc., no enterprise will be happy to invest
in the locality. Today, with globalization and networking of economies, a country like
India is likely to lose to a country like China due to lack of infrastructure provision and
maintenance, which in urban sector is governed by the local institutions like the
Corporation.
31

The performance of the Corporation (in providing proper adequate infrastructure) directly
affects the economic performance of the urban areas, which in turn affects the performance
of the country as a whole. For providing infrastructure, financial resources and their
management become the key issues. “Inadequate financial resource is one of the principal
reasons that municipal services are inadequate in almost all developing countries and
transitional countries. Even when local governments have been assigned clear service
delivery responsibilities, lack of revenue-raising powers and unpredictable
intergovernmental transfers often hinder the ability of municipalities from efficiently
discharging these functions in a way that is responsive to local constituencies.”24
The role of public finance with regard to the urban sector is undergoing a massive change
across the globe. While the basic reasons for the same stems from the increasing demands
of the citizens and the need to create better quality public infrastructure, different
approaches to financing in the public finance arena is also increasing. With the information
technology (IT) revolution and availability/accessibility of information, differences in the
public financial practices across the globe are becoming similar.
In India while the private sector has the wherewithal to adapt itself to the changing
pressures, the public sector, particularly the governmental institutions have always been
slow to react. Until recently the Urban Local Bodies (ULBs25), were considered as ‘some
24 USAID (2006), Municipal Finance: Assessment and Implementation Toolkit, pp-1 PADCO in association with Andrew Young School of Policy Studies, Georgia State University, TCG International, LL C 25Urban Local Bodies (ULBs) of India are the constitutionally provided administrative units that provide basic infrastructure and services in cities and towns. According to Census of India 1991, there are 3255 ULBs in the country classified into four major categories:
• Nagar Nigams • Nagar Palikaa • Nagar Panchayats
Large urban areas are governed by Nagar Nigams, often simply called corporations. The area under a corporation is further divided up into wards. Individual wards or collections of wards within a corporation sometimes have their own administrative body known as ward committees. Smaller urban areas are governed by Nagar Palika, which are often referred to simply as municipalities. Municipalities are also divided into
32

insignificant small government offices’ doing some maintenance works like garbage
removal, road/drain maintenance works, etc. In recent times with the increasing focus on
service delivery and its ‘infrastructure’ for the same, ULBs have become the centre of
infrastructure creation and maintenance. This particular aspect itself has changed the role
with specific reference to public finance. They are no more ‘small/petty government
offices’ but infrastructure managers for that part of the country. This means the
management has to be top class.
An analysis of the fund requirement for the urban sector during the Eleventh Five Year
Plan26 clearly shows the focus on the infrastructure. The total fund required for
implementation of Eleventh Five Year Plan targets in respect of urban sector is shown in
Table 2-6. Note that most of the investment is for infrastructure.
Table 2-6: Eleventh 5 year plan estimates for Urban Sector
Sl.No. Sub-Sector Plan Estimated Amount (Rs. In Crore)
(i) Urban water supply 53,666
(ii) Urban sewerage & sewage treatment 53,168
(iii) Urban drainage 20,173
(iv) Solid waste management 2,212
(v) Management Information system (MIS) 8
(vi) R & D and PHE training 10
Total 1,27,025
Source of funding (i) Central Sector outlay 70,000*
(ii) State Sector outlay 35,000*
(iii) Institutional Financing 10,000
(iv) Assistance from External Support Agencies 10,000 (v) FDI & Private sector 2025
Total 1,27,025 Source: Eleventh Five Year Plan 2005-12; Report of the Steering Committee
wards, which may be grouped together into ward councils. One or more representatives are elected to represent each ward. (wikipedia). 26 Report of the Steering Committee on Urban Development for Eleventh Five Year Plan (2007-2012); pp-55-56
33

Table 2-6 clarifies two issues: one relating to the size of investments in infrastructure
required and the other relating to the key aspect of urban management. To manage the
estimated Rs.1.27 lakh crores or Rs 1,027 billion, the urban sector executives need to be
professionals of the top order. They need to migrate to the role of infrastructure manager
with excellent finance management skills. The infra-manager and finance manager roles of
the urban manager have forced the need to have excellent information, based on which
funding and management of urban infrastructure could be attempted. This implies directly
the responsibility of both accountability and transparency towards stakeholders on urban
managers. Thus, issues relating to maintaining proper accounting records, maintaining
details of various works taken up in individual wards of citizens etc. and providing
information of the ‘source and uses of money’ to various levels of information seekers,
from local citizens to government/funding agencies, have cropped up.
In such a change process, the issues relating to accountability and transparency have
gained extreme importance in relation to access to finance, as newer instrument and
governance issues demand different types/depth of information from the public bodies.
With the 74th CAA in India, the role of ULBs has changed. The concept of subsidiarity27
brings with it increased devolution/decentralization of power from the State to the ULBs.
Also there is an increased role for the ‘participation’ of the citizen, which enables the
citizen to be real ‘stakeholder’ in the local governance. Hence, the basic pressure on the
ULBs arises from:
27 According to Wikipedia Subsidiarity is an organizing principle that matters ought to be handled by the smallest, lowest or least centralized competent authority. The Oxford English Dictionary defines subsidiarity as the idea that a central authority should have a subsidiary function, performing only those tasks which cannot be performed effectively at a more immediate or local level.
34

Having information to understand the actual performance: Increased pressure on
the operational performance (project implementation/asset maintenance) and
financial data (actual cash flows)
Providing information on the performance: Need for finding newer instruments to
finance their projects (like bonds, pool financing, public – private participatory
finance, etc)
Sharing of information with the public : Providing information on governance as
required by the CAA for the understanding and participation of public in the affairs
of the ULBs
Reporting to authorities: State, Central and other funding agencies and authorities.
Across the globe, and more so in countries like India, which have fast changing macro-
economic scenario, there are serious issues in public financial management in this regard.
It is in this perspective that this thesis attempts to look at ‘accountability’ and
‘transparency’ issues.
Section-II: The Urban Local Bodies
Urban Local Bodies (ULBs) play an important role in the planning and development of
urban areas. The governance of the urban localities lies with the ULBs. After the 74th
Constitutional Amendment Act (CAA), the ULBs govern the urban areas of the country.
While this has conceptually taken governance to the level of citizens, the most important
stakeholders in the economy, the ULBs have not geared themselves up in governance,
which is their key role. According to Prof.Mathur28 “… most studies undertaken to assess
the functioning of municipalities in India point out that the performance of municipalities
in the discharge of their duties has continued to deteriorate over time. It is noted that
municipalities in India are confronted with a number of problems, such as inefficiency in 28 Mathur,M.P. (2007), Impact of the Constitution (74th) Amendment Act on the Urban Local Bodies: A Review, National Institute of urban Affairs, NIUA-WP 07-02, pp-3
35

the conduct of business, ineffective participation by the weaker sections of the population
in local governance, weak financial condition, lack of transparency in the planning and
implementation of projects, etc., which affect their performance adversely”.
According to Prof. Mathur, an important initiative of the Government of India to
strengthen municipal governance is the enactment of the Constitution (74th Amendment)
Act (CAA) in 1992. Until the recent amendment, local governments in India were
organised on the basis of the ‘ultra vires’ principle (beyond the powers or authority
granted by law) and the state governments were free to extend or control the functional
sphere through executive decisions without an amendment to the legislative provisions.
Through this initiative, an attempt is being made to improve the performance ability of
municipalities, so that they are able to discharge their duties efficiently.
With the enactment of the CAA, the municipalities have acquired constitutional status for
the first time in the history of local governments. The important provisions specified in the
Act include constitution of three types of municipalities, devolution of greater functional
responsibilities and financial powers to municipalities, adequate representation of weaker
sections and women in municipalities, regular and fair conduct of municipal elections, and
constitution of Wards Committees, District Planning Committees, Metropolitan Planning
Committees and State Finance Commissions.
The CAA provisions provide a basis for the State Legislatures to guide the State
Governments in the assignment of various responsibilities to municipalities and to
strengthen municipal governance. Accordingly, several State Governments have amended
their Municipal Acts/Laws/Legislations so as to bring these in conformity with the
Constitutional Provisions. It is also learnt that the municipalities are confronted with a
number of problems, despite the amendments in the State Municipal Acts and the
implementation of the 74th CAA provisions. For instance, in several States, there exists a
problem of ineffective participation in the decision-making process, delays in the transfer
of funds to the municipalities despite constitution of State Finance Commissions, poor
recovery from various tax and non-tax sources despite devolution of powers, etc. It is
further learnt that there is an influence of various social, economic and political factors on
the functioning of municipalities in India.
36

Table 2-7: ULB distribution in States of India (2004)29
Sl No:
Name of State/UT
Number of Urban Local Bodies
Municipal Corporation
Municipal Council
Nagar Panchayat
Total
1 Andhra Pradesh 8 108 1 117 2 Arunachal Pradesh # 3 Assam 1 29 55 85 4 Bihar 5 32 80 117 5 Chattisgarh 10 28 72 110 6 Delhi 1 1 0 2 7 Goa 1 12 0 13 8 Gujarat 6 143 0 149 9 Haryana 1 24 43 68
10 Himachal Pradesh 1 20 28 49 11 Jharkhand 1 20 22 43 12 Karnataka 6 123 93 222 13 Kerala 5 53 0 58 14 Madhya Pradesh 14 48 48 110 15 Maharashtra 22 225 0 247 16 Manipur 0 7 20 27 17 Meghalaya @ 18 Mizoram @ 19 Nagaland @ 0 3 16 19 20 Orissa 2 35 66 103 21 Punjab 5 97 31 133 22 Rajasthan 3 11 169 183 23 Sikkim 0 0 8 8 24 Tamil Nadu 6 151 0 157 25 Tripura 0 1 12 13 26 Uttaranchal 1 31 31 63 27 Uttar Pradesh 12 194 422 628 28 West Bengal 6 117 3 126
Total 117 1513 1220 2850
Notes: 1. # - There are no municipalities in Arunachal Pradesh. 2. @ - The 74 " Amendment Act provisions have not been applied to certain Scheduled Areas and the Tribal Areas of India. 3. Blank spaces in the table indicate that data are not available. 4. Status of Information provided in the table is based on data collected over a period of time and may therefore not tally with the latest position of different states of the country.
29 NIUA (2007)
37

Implementation of the CAA is an important step in the governance of the ULBs. NIUA
study (2007) provides an insight into the status of the CAA implementation. Though the
data is as at 2004, the study provides an idea of the pace of the progress and also how
some states are ahead of the others. It may be noted that some important provisions of the Act
have been included in the table. These are: constitution of ULBs; reservation of seats in ULBs,
regular conduct of elections, constitution of Ward Committees (WC), District Planning
Committees (DPCs), Metropolitan Planning Committees (MPCs) and State Finance Commissions
(SFCs).
Table 2-8: Status of Implementation of CAA – Key Reforms30
Sl No:
State/UT
Con
stitu
tion
of U
LB
's
Res
erva
tion
of
Seat
s
Reg
ular
C
ondu
ct o
f E
lect
ions
Con
stitu
tion
of W
Cs
Con
stitu
tion
of D
PCs
Con
stitu
tion
of M
PCs
Con
stitu
tion
of S
FCs
1 Andhra Pradesh √ √ √ √ √ 2 Arunachal Pradesh # √ 3 Assam √ √ √ √ 4 Bihar √ √ √ √ √ 5 Chattisgarh √ √ √ √ √ 6 Delhi √ √ √ √ √ 7 Goa √ √ √ √ 8 Gujarat √ √ √ √ 9 Haryana √ √ √ √
10 Himachal Pradesh √ √ √ √ 11 Jharkhand √ √ √ 12 Karnataka √ √ √ √ √ √ 13 Kerala √ √ √ √ √ √ 14 Madhya Pradesh √ √ √ √ √ √ 15 Maharashtra √ √ √ √ √ 16 Manipur √ √ √ √ 17 Meghalaya @ 18 Mizoram @ 19 Nagaland @ 20 Orissa √ √ √ √ √ 21 Punjab √ √ √ √ 22 Rajasthan √ √ √ √ √ 23 Sikkim √ √ √ √ 24 Tamil Nadu √ √ √ √ √ √ 25 Tripura √ √ √ √
30 NIUA (2007)
38

Sl No:
State/UT
Con
stitu
tion
of U
LB
's
Res
erva
tion
of
Seat
s
Reg
ular
C
ondu
ct o
f E
lect
ions
Con
stitu
tion
of W
Cs
Con
stitu
tion
of D
PCs
Con
stitu
tion
of M
PCs
Con
stitu
tion
of S
FCs
26 Uttaranchal √ √ √ √ 27 Uttar Pradesh √ √ √ √ 28 West Bengal √ √ √ √ √ √ √
Notes: 1. # - There are no municipalities in Arunachal Pradesh. 2. @ - The 74 " Amendment Act provisions have not been applied to certain Scheduled Areas and the Tribal Areas of India. 3. Blank spaces in the table indicate that data are not available. 4. Status of Information provided in the table is based on data collected over a period of time and may therefore not tally with the latest position of different states of the country.
The main objective of the CAA was to take governance nearer to the people. This would
mean increased participation of the citizens. This would also mean making the system
more transparent to the stakeholders. Transparency of information with regard to
governance would be possible only if the administrators (who run the system as different
from the citizen stakeholder) are made accountable for their actions. Thus accountability
and transparency are part of the objectives of the CAA. Participation of the stakeholders,
particularly the citizens, is another area of focus of the CAA. Hence the analysis provided
in Table 2-2 shows that in most of the initiatives like formation of WCs, DPCs, MPCs that
involve external stakeholders (outside the local governance system) are yet to be
implemented. One of the major reasons for the lack of implementation in this regard is the
availability of a well laid out accountability and transparency mechanism that will expose
these facts to the general public. Also lack of monitoring mechanisms at the government
level contributes for lack of timely implementation. In fact, though these are citizen-centric
initiatives, most of the elite and educated citizens themselves are not aware about their
own rights and obligations in this regard. This is one of the areas considered in this study.
Government of India (GOI) strategy for Urban Development
According to the 2001 census, India has a population of 1027 million with approximately
28 per cent or 285 million people living in urban areas. As a result of the liberalization
policies adopted by the Government of India, the share of the urban population is expected
39

to increase to about 40 per cent of total population by the year 2021. It is estimated that by
the year 2011, urban areas would contribute about 65 per cent of gross domestic product
(GDP). However, this higher productivity is contingent upon the availability and quality of
infrastructure services. Urban economic activities are dependent on infrastructure, such as
power, telecom, roads, water supply and mass transportation, coupled with civic
infrastructure, such as sanitation and solid waste management. All these depend upon the
availability of finances with ULBs. Hence finance is possibly the major area that requires
attention in the urban sector.
Investment Requirements in the Urban Sector31: It is estimated that over a seven-year
period, the Urban Local Bodies (ULBs) would require a total investment of Rs. 1,20,536
crores. This includes investment in basic infrastructure and services, that is, annual funding
requirement of Rs. 17,219 crores. It is well recognised that in order to fructify these
investments, a national level initiative is required that would bring together the State
Governments and enable ULBs catalyse investment flows in the urban infrastructure
sector.
According to the JNNURM the expected outcomes32 are:
On completion of the Mission period, it is expected that ULBs and parastatal agencies will
have achieved the following:
(1) Modern and transparent budgeting, accounting, and financial management systems
will be designed and adopted for all urban service and governance functions
(2) City-wide framework for planning and governance will be established and become
operational
(3) All urban residents will be able to obtain access to a basic level of urban services
(4) Financially self-sustaining agencies for urban governance and service delivery will be
established, through reforms to major revenue instruments
(5) Local services and governance will be conducted in a manner that is transparent
and accountable to citizens
(6) E-governance applications will be introduced in core functions of ULBs/Parastatal
resulting in reduced cost and time of service delivery processes.
31 Ministry of Urban Development, ibid, pp-3 32 Ministry of Urban Development, ibid, pp-6-7
40

One of the outcomes of the JNNURM project itself is with regard to accountability and
transparency aspect laid out clearly in the GOI document. This stresses the importance of
the topic taken up in this study. It is also observed that the first and foremost outcome in
this regard is the ‘modern and transparent budgeting, accounting and financial
management system’.
Apart from this, the synthesis of various initiatives in the urban reforms in India highlight
the concepts of auditability (control) and information transfer (reporting); these clearly
indicate respectively accountability and transparency aspects of the reforms. These are
summarized as follows:
• Finance is a major area of concern for creation of required urban infrastructure and
provision of urban services (to the extent that CAA includes specific sections in
this regard);
• Accountability is sought to be introduced by introduction of accrual accounting in
the ULBs – in order to provide basis for better management/governance of ULBs;
• Auditability of the financial statements increases the accountability of the ULBs;
• Financial statement reporting to concerned authorities and auditors increase the
transparency aspects;
• The infusion of technology for the purpose of public interface (like payment
counters, web-sites, etc.) not only increases the information transfer but also
increases participation of the stakeholders and transparency.
Since the ULBs deal with the public money, the transparency and accountability in
financial transactions seems to be the major focus. However, in order to use the public
funds properly in a way that is appropriate for developing infrastructure and providing
services to citizens accountability and transparency are required. This is the centre point
of this thesis.
41

Section III: Key issues in Governance in relation to ULBs
In his path breaking work based on Indian conditions Dr.Samuel Paul33 (2002) brings out
the issues in governance with regard to the public services:
• Resource constraints
• Incompetent and unmotivated service providers
• Corruption
• Civil Society’s weaknesses
• Productivity of services not a priority
Resource constraints act as the key barrier to provision and maintenance of public services.
In the case of ULBs the resource constraints result not only in poor maintenance of the
existing infrastructure but also restricts the creation of new infrastructure. The
management of ULB is not able to make both ends meet. Most of the revenue collected
gets spent towards the administration of the ULB, and there is no scope for additional
infrastructure creation as required by the citizens. This results in dissatisfaction of the
citizens. Hence service delivery and satisfaction levels are directly influenced by resource
constraints. The financial resources cannot be managed properly if the accounting systems
are not robust. Hence the accounting system forms the basis of good governance by
providing accountability and transparency platforms.
Incompetent and unmotivated service providers. In the ULBs incentives for good
performance and punishment for bad performance are not easy. These result in absolutely
no check on the quality of the personnel recruited for the services. Apart from this the
working conditions are poor (triggered by organization culture and resource constraints).
All these impact the availability of qualified and talented persons in the ULBs to handle
public services. So, even if the infrastructure is created, there is inadequate quantity/quality
of human resources for service delivery. There has to be a transparent mechanism of
recruitment of the employees, and systems for holding them accountable if the
incompetency and motivation issues are to be addressed.
33 Paul, Samuel (2002), Holding the State to Account – Citizen Monitoring in Action, Books for Change, pp-7-25
42

Corruption takes several forms. It could vary from taking bribe to providing concessions to
influential persons, thereby prejudicing the interest of the common citizen. It is stated that
the elite get their jobs done in public institutions either through influence or money. “We
have evidence…..proving that the poor pay a larger proportion of their income as bribes
than the rest of the population”34.One of the major reasons for corruption is the lack of
transparency. People are not aware of rules and hence need to depend upon someone
working in the ULB, or touts. This also happens when there is no system for complaints
and, in case it is there, the complaints are not resolved at all. The Right to Information Act
(RTI) seeks to address certain aspects in this regard. Increasing accountability through
severe consequences for corruption and transparent decision process only can control
corruption in a positive way.
Civil Society’s weaknesses do influence the way governance is handled by ULBs. First
and foremost the neighbourhood communities, residents’ associations, etc. are not
organized properly. While some of them are quite active, there are very few cases of them
playing a lead role as envisaged in the policy documents or vision for good urban
governance. Still the citizens of India are carried away by the concept of ‘representative
democracy’ and not ‘participatory democracy’, which is the key for the functioning of civil
societies. Also, the civil societies take up more of advocacy issues rather than urban
governance issues. The civil societies actually play a vital role in connecting ULB
management and the citizens through accountable governance system and transparent
information transfer.
Productivity of services is not a priority in the ULBs. This is due to the complete lack of
accountable systems within government. In case a PWD engineer is not productive in
comparison to his private sector counterpart or in case he has not completed a project as
per plans, there is no rigid system of holding him accountable. Also there are no quality or
service benchmarks (now contemplated under JNNURM) that are transparently made
known to the citizens in order that they understand the quality they get. Some of the
Corporations do have Citizens’ Charter. But these are neither transparently made available
nor is there a system of follow-up.
34 Paul, Samuel (2002), ibid, pp-15
43

Thus we see that in all the areas of governance of the ULBs, the issues relating to
accountability and transparency play a key role. Hence there is a need to design, establish
and review accountability and transparency systems for the benefit of citizens.
In the words of Harry Kitchen35 (2005), the entire aspects of accountability and
transparency with regard to the municipal services are summarized succinctly:
“In the provision of local public sector services, accountability is achieved when a
customer or tax payer is able to identify who is responsible for what and is able to link the
governing unit responsible for the service direct to its funding.”
“Transparency is achieved when citizens or taxpayers have access to information and
decision-making forums, so that the general public knows what is happening and is able to
judge whether it is appropriate”.
Having provided a backdrop of the urban sector with specific reference to transparency
and accountability aspects, this study examines available literature in this regard.
35 Kitchen, H (2005), Delivering Local/Municipal Services, Public Services Delivery edited by Anwar Shah, The World Bank, pp-121-122
44

Chapter - 3
ெசயற்ைக அறிந்தக் கைடத் ம் உலகத்
தியற்ைக அறிந் ெசயல்
Besides being well versed in the methods of action, one should also understand the current ways of the world and act suitably.
Thirukkural – 637
He who makes out as expenditure the revenue (he has raised) consumes the works of men. He should be punished according to the offence in case of loss (or waste) of days of work, the price of goods and the wages of men.
Arthrasasthra - 2.9.17 & 18
45

Chapter – 3: Review of Literature and Theoretical Analysis
This chapter is presented in five sections. Section-I deals with the definition and context of
accountability and transparency, after giving a brief historical perspective of
accountability. While Section-II focuses on various accountability relationships, Section-
III analyses various Models of accountability. The options available for the citizens are
examined in Section-IV using Voice, Exit, Loyalty, Neglect models. Section-V deals with
the issues relating to preparedness for accountability.
Section I - Definition and context of Accountability and Transparency
Historical perspectives
Historically India has been a major contributor for well structured political administration
and economic management. This has been the major reason why various countries across
the globe have shown interest to have trading ties and other relationship with India. Local
administration had been extremely strong in ancient India. Some of the major observations
in this regard across centuries are discussed here.
Pre-Mauriyan period
“The earliest system of local government may also be traced to the pre-Mauryan period.
The structure of local government consisted of a parallel machinery for the administration
of the rural and urban areas. According to Apasthamba Dharma Sutra, state officials
(Adhyaksas and Adhipas) were appointed by the king for towns and villages with well
defined jurisdictions. In Vishnu Sruti, we read that a chain of officials is to be placed by
the king in charge of 1, 10 and 100 villages as well as of the whole rural areas36”. This
indicates the local governance set up prevalent in India over 2,500 years. The system of
36Publications Division, Government of India, (1990), India: Government and Economic Life in Ancient and Medieval Periods, pp.17-18
46
accountability commences with the clarity in the job where responsibilities were given to
the village officials.
Around 300 BC
“Arthasasthra means the science of economics of livelihood of people….Revenue was
collected mostly in kind. There were granaries, warehouses and storehouses which were
looked after with great care, and if they were not, the people accountable were punished
for their carelessness…People who were not tax exempt were strictly monitored, and were
not allowed to settle down in tax-exempt areas. Obstruction, misuse of public funds and
false accounting were heavily penalized37”. Arthasasthra provided sophisticated system of
public administration and macroeconomic management system that are enviable even in
today’s standards. This text has very clearly identified the roles and responsibilities of
various officials and also included the penalties to the officials in case they did not deliver
services as prescribed. Also citizens’ participation in governance and good grievance
redress system have been addressed well.
Pallavas and Cholas
In the south of India, excellent administrative systems made the kings consolidate not only
their rule in India but also outside India through professional trade relationships and
control of the high seas. Accountability systems were well established. Observations on
the administration in Uttaramallur (near the city of Chennai – towards Chingleput district)
give a good insight in this regard. “..Then there is a schedule of disqualifications. They
were not to be eligible for the next year who defaulted in the work in the previous year.
Not merely that, all their relations of the first degree were to be excluded from the
privilege of holding office. Those that had shown to be incompetent, those that had been
addicted to ordinary vices, such as drink, theft, etc., were to be excluded altogether. Those
who were generally foolhardy or otherwise guilty of acts of rashness were to be
avoided”38. This is a very good point in accountability related systems.
37 Ramachandran, Padma (1995), Public Administration in India, National Book Trust, 1995, pp-7 38 “Aiyangar, S.Krishnawamy (1931), Evolution of Hindu Administrative Institutions in South India, University of Madras, (AES Reprint, New Delhi, 1994), p-138
47
British Period
During the British period a complete revamp of the existing systems and procedures in the
government was made. However the entire accountability system was established based on
the requirements of the British imperialism with the objective of controlling colonised
India. While the current Indian accountability system operating in the government is based
on the British legacy, there has been enough realisation that these need to change with the
requirements of the economy and in particular the requirements of the citizens, who are
becoming increasingly literate and are globally aware and connected.
With this historical perspective of the accountability and local governance in India, the
definitional and conceptual aspects of accountability related matters are discussed.
Defining Accountability and Transparency
According to Oxford Dictionary, to be accountable is being “responsible for your decisions
or actions”, “expected to explain them when you are asked39”. Such an account may
include both a description of an event or experience. Also from the perspective of business
the term account indicates a record of financial expenditure and receipts. It also implies a
relationship: that there is one party that is owed an explanation or justification and another
party that has a duty to give it. Beyond this, however, it becomes more difficult to pin
down what accountability means or what it means to be accountable. In so far as it
involves a relationship between two or more parties it implies that there is a common
language of accountability and a common set of expectations about what is involved. Yet it
is clear that across all sectors the language of accountability evolves over time and in
response to events such as well-publicized scandals and/or changing public expectations.
39 Oxford Advanced Learners Dictionary (2005), Seventh edition, pp-10
48

Hence accountability has various connotations. Apart from this generic meaning,
accountability has been defined from various perspectives.
The Oxford Dictionary meaning of being transparent is “allowing you to see through it” or
“allowing you to see the truth easily”40. The latter is a more appropriate definition in the
present context. The term truth indicates facts or actual data of any organization. Such a
truth about the organizational performance needs to be passed on to the stakeholders of the
organization, and when this happens, the organization is stated to be ‘transparent’. This
concept of transparency is extremely important in public finance as the public money is
handled by those responsible.
Hence the dual concept of Accountability and Transparency can be understood as the
process of being able to provide supporting and justification to various decisions and
actions, and making it known to the stakeholders.
The context of defining Accountability and Transparency for the purpose of this research
is important, as it would provide the specifics, boundaries and the limitations within which
the topic is being discussed. The context is with regard to ‘public governance’ and ‘public
finance’ in an overall perspective, with focus on the urban sector being taken up for this
research.
40 Ibid-pp-1632
49

Defining Accountability
'Accountability' has joined 'Democracy', 'Sustainability' and 'Globalisation' in the
fashionable lexicon of policy-makers. However, like so many buzzwords, accountability is
often ill defined and raises more questions than it answers. At its simplest, accountability
refers to a process by which individuals or organizations are answerable for their actions
and the consequences that follow from them. What is often disputed, however, is the issue
of who is entitled to hold these individuals or organizations to account, and the
mechanisms that should be used in order to do so.
"Accountability is one of those terms about which there is a widespread sense of what it
means, but difficult in coming to any agreement about its definition .... " 41.
Accountability has been defined differently by different people in different contexts. It
basically calls for a simplified structure that avoids duplication and achieves greater
impact; empowered and responsible staff managers; a leaner and more efficient local
government that fosters management excellence, and is accountable for achieving results.
“Conceptually, it is the ability to require that public officials, private employers, or service
providers answer for their policies, actions, and use of funds”42. “Accountability means
holding individuals and organizations responsible for performance measured as objectively
as possible”43. “Very often the terms accountability and transparency are used one for the
other. While accountability is effectively managing public resources, transparency is
availability of relevant information”44.
41 Raynard, (2000) by Hetty Kovach, Caroline Neligan and Simon Burall (2003), Power Without Accountability?, Global Accountability Report 2003, One World Trust. 42 The World Bank Institute(2004), Community Empowerment and Social Inclusion, concept paper from http//:www.worldbank.org 43 Paul, Samuel (1992), Accountability in Public Services: Exit, Voice and Control, World Development, Vol 20, No 7, pp-1047 44 NCRCL (2002), Public Financial Accountability in Urban Local Bodies in Karnataka.
50

From the perspective of the Government per se, the terminology has a different
connotation with focus on the administration and bureaucracy. According to the
Government of Australia, “Accountability means that officials are responsible for the
actions and decisions that they take in relation to procurement and for the resulting
outcomes. Officials are answerable for such activity through established lines of
accountability including the agency's executive and senior management, the Government
and the Parliament”45.
The American Government also seems to take the same bureaucratic view. “The existence
of a record that permits the identification of an individual, who performed some specific
activity, so that responsibility for that activity can be established”46.
In a case study UNDP states that, “Accountability is not only a government’s obligation
but also a necessary means to ensure responsiveness to the needs and rights of the target
population47”. This definition includes the entity to whom the government should be
accountable to: the citizens. This is an inclusive definition, aimed at participatory aspect of
the term. Effective accountability and responsiveness can only be assured through the
meaningful participation of the communities involved. Auditing is one of the mechanisms
to assess public performance in service delivery.
45 Government of Australia, Commonwealth Procurement Guidelines from http://www.finance.gov.au/procurement/ 46 United States General Accounting Office, Accounting and Information Management Division, (1999) Federal Information System Controls Audit Manual, Volume I: Financial Statement Audits, pp-227. 47 UNDP, Bergen Seminar Series (2002/2003), Responsiveness and Accountability for Poverty Reduction - CASE STUDY, pp-4.
51

Accountability has been variously defined as ‘the quality of being accountable’, ‘a liability
to give account of, and answer for, discharge of duties or conduct’ and ‘responsibility’48.
For the purposes of the report of Lord Sharman it refers to the requirement to provide
explanations about the stewardship of public money and how this money has been used. In
the United Kingdom, central government accountability is secured in a number of ways.
The most important is ministerial accountability to Parliament, for example, through
statements, debates and answers to oral questions on the floor of the chamber, appearances
before committees, answers to written questions and the laying of documents. But another
key mechanism for accountability, is external audit, the process by which the adequacy of
the explanations provided in financial statements is assessed and reported upon by an
independent party.
“In its broadest sense, accountability means responsiveness. Accountability in a democratic
society means responsiveness to the people - the responsiveness of the governors to the
governed. Mature democracies have developed a number of mechanisms to assure such
responsiveness”49. This is the argument of Anne Marie Slaughter (1999) who also supports
the inclusive and participatory definition of accountability.
In simpler terms accountability requires that one group (or an individual) provides a
professional or financial account (or justification) of its activities to another stake-holding
group (or individual). It presupposes that an organisation or institution has a clear policy
48Lord Sharman of Redlynch (2001), Holding to Account - The Review of Audit and Accountability for Central Government, February 2001. 49 Anne - Marie Slaughter (1999), Agencies on the Loose?- Holding Government Networks Accountable, Harvard Law School Public Law and Legal Theory Working Paper Series, Working Paper No. 006, pp5.
52

on who is accountable to whom and for what and expects that the accountable group would
be willing to accept advice or criticism and modify its practices accordingly50.
“The principal element that assures good government is the accountability of the public
officials. This involves both answerability, or “the obligation of public officials to inform
about and to explain what they are doing” and enforcement, or “the capacity of accounting
agencies to impose sanctions on powerholders who have violated their public duties”. The
only way to guarantee good government is by institutionalizing an accountability structure
that holds every public official responsible for his/her actions as a public servant.51
“Mehta (1998) looks at urban governance through a set of attributes. He introduces the
attribute of accountability which he suggests is derived from how cities manage their
finances, communicate on use of funds and achievements to their citizens, and adhere to
legal requirements and administrative policies.”52
Accountability can be defined as the obligation of power-holders to account for or take
responsibility for their actions. “Power-holders” refer to those who hold political, financial
or other forms of power and include officials in government, private corporations,
international financial institutions and civil society organizations53.
This definition focuses specifically on the accountability of government actors towards
citizens and, in particular, towards poor people. This accountability is a consequence of the
implicit ‘social compact’ between citizens and their delegated representatives and agents in a 50 www.gdrc.org 51 World Bank (2004), Working Paper No.30, State-Society Synergy for Accountability – Lessons from World Bank. 52 Kaufmann Daniel, Léautier Frannie, and Mastruzzi Massimo, (April 2004), Governance and the City: An Empirical Exploration into Global Determinants of Urban Performance, pp 7-9. Preliminary Draft 53 Carmen Malena, with Reiner Forster, Janmejay Singh (December 2004), Social Accountability: An Introduction to the Concept and Emerging Practice, SOCIAL DEVELOPMENT PAPERS, Participation and Civic Engagement,Paper No. 76, The World Bank, pp 2-3.
53

democracy. A fundamental principle of democracy is that citizens have the right to demand
accountability and public actors have an obligation to account.
Other definitions of Accountability from the World Wide Web:
• The obligation imposed by law or lawful order or regulation on an officer or other
person for keeping accurate record of property, documents, or funds.
www.shelflife.hq.dla.mil/Policy_4140_27/06Definitions.htm
• The responsibility of program managers and staff to provide evidence to
stakeholders and funding agencies that a program is effective and in conformance
with its coverage, service, legal, and fiscal requirements.
www.cdc.gov/tobacco/evaluation_manual/glossary.html
• To be answerable for the results of an assigned action. Accountability is associated
with delegated authority and is distinct from responsibility. A supervisor can assign
responsibility but cannot give away his/her accountability; the manager is
ultimately accountable.
www.ucsc.edu/matman/bppwg/glossary.htm
• In government, accountability can be thought of as enforcing or explaining
responsibility. It is often used as a synonym for “responsibility” because both are
defined by the office holder’s authority; they cover the same ground.
Accountability involves rendering an account to someone such as Parliament or a
superior, on how and how well one’s responsibilities are being met, on actions
taken to correct problems and to ensure they do not reoccur. (From: A Strong
Foundation: Report of the task force on public service values and ethics.)
www.inspection.gc.ca/english/corpaffr/publications/riscomm/riscomm_appe.shtml
• The demand by a community (public officials, employers, and taxpayers) for
school officials to prove that money invested in education has led to measurable
learning. “Accountability testing” is an attempt to sample what students have
learned, or how well teachers have taught, and/or the effectiveness of a school’s
principal’s performance as an instructional leader.
curriculumfutures.org/assessment/c01-glossary.html
• Responsibility for performance and results; holding political leaders and agency
managers accountable for results against agreed-to performance standards.
strategicsourcing.navy.mil/reference_documents/defs.cfm
54

• The obligation of an organization or its members to account for, report on, or
explain their actions and the use of resources entrusted to them. Originally,
accountability referred mainly to compliance with established norms of financial
management. In recent years, the meaning of accountability has broadened to
include the achievement of performance targets and compliance with norms
external to the organization - such as protection of human rights or preservation of
the environment.
www.isnar.cgiar.org/publications/planning-book5.htm
• Measures to assure that public funds are used to achieve the desired outcomes in a
cost-effective manner.
www.ddrcco.com/glossarya.htm
• ....is the responsibility to governing bodies, taxpayers, and funding agencies for
resources used and goods/services produced.
www.cnu.edu/admin/assess/about/plans/glossary.htm
• An obligation for an organisation or person who manages resources to answer or
report to others – whether higher level authorities, a donor or the public – about the
intended and effective use of the resources and on the achievement of results.
www.um.dk/da/menu/Udviklingspolitik/MaalOgResultatstyring/Evaluering/Retnin
gslinjer/AnnexIListKeyConcepts.htm
• ....is the imperative to answer for actions to the entity from which authority is
derived.
www.gov.sk.ca/finance/accountability/2005/keyterms.htm
• The notion that an individual must answer completely for his or her own actions,
regardless of circumstances. The term may also apply to the idea that one should
show that he or she can support others besides the self.
www.doaskdotell.com/refer/vocab.htm
• The obligation to account for responsibilities conferred; in this context, the
provision of documented assurance that publicly funded colleges, institutes and
agencies are effectively serving local and provincial needs through the appropriate
use of available resources.
www.scoea.bc.ca/glossary2001.htm
• responsibility to someone or for some activity
www.cogsci.princeton.edu/cgi-bin/webwn2.1
55

• Accountability is the aspect of responsibility involving giving a statistical or
judicial explanation for events. Judgement may follow.
en.wikipedia.org/wiki/Accountability
Defining Transparency
“An important complementary principle to accountability, transparency comprises all
means of facilitating the citizen's access to information and also his/her understanding of
decision-making mechanisms. Transparency is built on the free flow of information:
processes, institutions and information are directly accessible to those concerned, and
enough information is provided to understand and monitor them. Public sector
transparency begins with the application of clear standards”.54
“Transparency provides assurance that procurement processes undertaken by agencies are
appropriate and that policy and legislative obligations are being met. Transparency
involves agencies taking steps to support appropriate scrutiny of their procurement
activity”55.
“....... transparency describes the increased flow of timely and reliable economic, social,
and political information; about private investors’ use of loans and the creditworthiness of
borrowers; about government service provision, monetary and fiscal policy; as well as
about the activities of international institutions. Contrariwise, a lack of transparency may
be described as a situation where someone – whether a government minister, a public
institution, a corporation, or a bank - deliberately withholding access to, or misrepresenting
54 UNDP (2001),CONTACT, p 2-2 from http//:www.undp.org 55 Government of Australia, ibid
56

information or failure to ensure that the information provided is of adequate relevance or
quality.”56
“In democratic societies, access to information and transparency can also be considered as
a human right. As Stiglitz (1999) points out, there is a basic right to know, to be informed
about what the government is doing and why.”57
Other definitions of Transparency from the World Wide Web:
• The term "transparency" is often used to mean openness in the way the EU
institutions work. The EU institutions are committed to greater openness. They
are taking steps to improve public access to information, and they are working to
produce clearer and more readable documents. This includes better drafting of
laws and, ultimately, a single, simplified EU Treaty.
europa.eu.int/abc/eurojargon/index_en.htm
• The concept of making trade-related administrative processes easier to follow,
including opening them to public scrutiny and subject to clear methods of
challenge or amendment.
www.business-in-asia.com/glossary5.html
• This concept requires negotiations and agreements to be openly arrived at and
openly presented so that all can know and understand the process and terms.
www.afsc.org/trade-matters/learn-about/glossary.htm/
• Openness, honesty, and accountability in public and private transactions.
www.imf.org/external/pubs/ft/fabric/gloss.htm
• The clarity with which a regulation, policy, or institution can be understood and
anticipated. Depends on openness, predictability, and comprehensibility.
56 Vishwanath, Tara and Kaufmann, Daniel (1999), Towards Transparency in Finance and Governance (Draft), The World Bank, September 1999, pp-3,4 57 Bellver, Ana and Kaufmann, Daniel (2005), Transparenting Transparency- Initial Empirics and Policy Applications - Preliminary draft, August, 2005 -- for discussion and comments, The World Bank, pp-1.
57

Synthesis of Accountability and Transparency definitions
The definitions of accountability and transparency thus provided are based mostly on the
situations in which they were made. However in order to understand the core meaning of
these terms a research was done on the key words for the definitions in this study. These
are given in Table-3-1.
Table 3-1: Key Words in the definition of Accountability and Transparency Sl. No Source Key Words A Accountability 1 Oxford Advanced Learners Dictionary (2005) Responsible for, to explain 2 World Bank Institute (2004) Answer for 3 Paul, Samuel (1992) Holding individuals and organizations
responsible 4 NCRCL (2002) Managing effectively public resources 5 Government of Australia (website) Responsible for the actions and decisions 6 US General Accounting Office (1999) Existence of a record 7 UNDP (2002/2003) Responsiveness 8 Lord Sharman of Redlynch (2001) Liability to give account…answer for 9 Annie, Marie Slaughter (1999) Responsiveness 10 www.grdc.org Professional or financial account (justification) 11 World Bank (2004) To explain what they are doing 12 Daniel Kaufmann et.al (2004) Obligation of power-holders to
account….responsibility for their actions 13 Carmen Malena et.al (2004) Right to demand… and obligation to account 14 www.shelflife.hq.dla.mil/Policy_4140_27/06Definitions.htm Keeping accurate record 15 www.cdc.gov/tobacco/evaluation_manual/glossary.html To provide evidence to stakeholders 16 www.ucsc.edu/matman/bppwg/glossary.htm Answerable for the results 17 www.inspection.gc.ca/english/corpaffr/publications/riscomm/
riscomm_appe.shtml Enforcing or explaining responsibility
18 curriculumfutures.org/assessment/c01-glossary.html Demand by a community 19 strategicsourcing.navy.mil/reference_documents/defs.cfm Responsibility for performance and results 20 www.isnar.cgiar.org/publications/planning-book5.htm Explain their actions 21 www.ddrcco.com/glossarya.htm Measures to assure 22 www.cnu.edu/admin/assess/about/plans/glossary.htm Responsibility to 23 www.um.dk/da/menu/Udviklingspolitik/MaalOgResultatstyri
ng/Evaluering/Retningslinjer/AnnexIListKeyConcepts.htm Obligation
24 www.gov.sk.ca/finance/accountability/2005/keyterms.htm To answer for actions 25 www.doaskdotell.com/refer/vocab.htm Answer completely for his or her own actions 26 www.scoea.bc.ca/glossary2001.htm Obligation to account
27 www.cogsci.princeton.edu/cgi-bin/webwn2.1 Responsibility to someone 28 en.wikipedia.org/wiki/Accountability Responsibility involving…..explanation B Transparency 29 Oxford Advanced Learners Dictionary (2005) Allowing you to see the truth 30 UNDP (2001) Citizen’s access to information 31 Government of Australia website Increased flow of timely and reliable
…..information 32 europa.eu.int/abc/eurojargon/index_en.htm Openness in the way…institutions work 33 www.business-in-asia.com/glossary5.html Administrative processes easier to
follow……opening them to public scrutiny 34 www.afsc.org/trade-matters/learn-about/glossary.htm Openly arrived at and openly presented 35 www.imf.org/external/pubs/ft/fabric/gloss.htm Openness, honesty, and accountability 36 www-personal.umich.edu/~alandear/glossary/t.html Clarity with which a regulation, policy or
institution can be understood and anticipated Source: From the literature survey given in this chapter
58

The synthesis of the above definitions brings to light the following:
• Accountability:
o ‘Responsibility’, ‘answerability’ to stakeholders seem to be the key
characteristics of accountability
o Also there is focus on ‘obligatory’ nature in such responsibility or
answerability
o This indicates that such responsibility or answerability needs to be defined
by an arrangement or through a set of conditionality or understanding.
• Transparency:
o ‘Openness’ and ‘flow of information’ seem to be the key characteristics of
transparency
o Access to information and correctness of the information define the
characteristic features of the information
o Also, public presentation and scrutiny add credibility to transparency.
Accountability is a complex concept, but the basic idea is that an individual or body, acting
on behalf of another person or group, should report back on their actions. Accountability is
needed wherever there are hierarchical relationships, or where delegation of duties or
responsibilities takes place. This is to ensure that those with delegated authority act in
ways that their ultimate overseers would expect. An important aspect here is that in a
democracy, the responsibilities of the officials are being delegated by the citizens in a
broad sense. This explains why public servants should be accountable to the citizens.
Accountability can be compared to ‘responsibility’ to act as per obligations, while
transparency is being ‘responsive’ to the obligation by sharing the information58. Refining
further the concept of accountability and transparency, these two can be construed as the 58 These concepts are well discussed by John Martin, (Victoria University of Wellington- New Zealand) Changing Accountability Relations: Politics, Consumers and the Market, Public Management Service, OECD, 1997 (pp-1)
59

two sides of the same coin. In fact, both need to coexist strengthening each other. While
the former provides answerability of the concerned persons for their obligation to the
stakeholders both inside and outside the organization, such information is properly
conveyed and presented to the stakeholders only through the latter.
Types of Accountability
There are several types of, or dimensions to, accountability, based on the particular aspect
from which the accountability is viewed. Some of the important dimensions are: Political,
Financial and Social. Various institutions have defined accountability from various
dimensions, hence various other terminologies like administrative accountability,
legislative accountability, etc. have arisen.
UNDP59 has identified three types of accountability, which it calls as the “three integral
pillars”: financial, political and administrative. Financial accountability is the obligation of
anyone handling resources, public office or any other position of trust, to report on the
intended and actual use of the resources or of the designated office. This includes ensuring
transparency in the process and procedures to achieve that obligation. Administrative
accountability includes critical systems of control internal to the government, which
complements and ensures the proper functioning of checks and balances supplied by the
constitutional government and an engaged citizenry. These include civil service standards
and incentives, ethics codes, criminal penalties, and administrative review. Political
accountability, most fundamentally found in an election, is another effective form of
oversight. In an electoral democracy, people have a regular, open method for sanctioning
or rewarding those who hold positions of public trust. One mechanism to achieve this more
59 UNDP, (2001), ibid, p 2-2
60

specific oversight is to have the two political branches (executive and legislative) watch
over each other. In addition, separating the institution that raises and spends funds from
that which actually executes the spending decision helps ensure that the underlying public
interest is served.
In the case of urban sector the political and financial dimensions take precedence.
Accountability has political and financial dimensions60. It is about whether decisions are
made to address local preferences and needs and whether the mechanisms, such as the
electoral process, are effective in signaling voters’ views. Accountability is also about the
successful collection of revenues and subsequent use of public funds, which in turn
requires financial information. Some experts suggest regular financial reporting to both the
local users and the independent audit agencies. In particular, central evaluation could be
exercised by renewing financial commitments or approval for borrowing from capital
markets based on past performance. Realizing accountability depends on the quality of
supporting institutions to enforce fulfillment of commitments to local beneficiaries, for
conflict resolution, for financial accounting, and for technological assistance and expertise.
Both political and financial accountability generally deal from the perspective of the
person who is accountable. For instance political accountability is about how an elected
representative is responsible. Similarly financial accountability is about the prudence,
controls and propriety that exist in financial transactions. These two hence can be deemed
as definitions from the supply side (of governance).
Social accountability can be defined as an approach towards building accountability that
relies on civic engagement, i.e., in which it is ordinary citizens and/or civil society 60 Mody, Jyothsna (2004), Achieving Accountability Through Decentralization: Lessons for integrated river basin management, World Bank Policy Research Working Paper 3346, June 2004, pp-5.
61

organizations who participate directly or indirectly in exacting accountability. Hence social
accountability can be deemed to be from the demand side (of governance). Mechanisms of
social accountability can be initiated and supported by the state, citizens or both, but very
often they are demand-driven and operate from the bottom-up. Social accountability
mechanisms are sometimes referred to as “external” or “vertical” mechanisms of
accountability, depending on how the mechanism is looked at. Structurally they can be
deemed to be ‘external’ if the citizens are considered outside the box of governance, and
‘vertical’ in case the citizens are considered to be hierarchically above the governance
layer. Social accountability is used to refer to the broad range of actions and mechanisms
(beyond voting) that citizens, communities, civil societies, media, advocacy groups, etc.
use to hold public officials and servants accountable. From the traditional practice of
reporting and advocacy, the social accountability engagements today have changed to
coordinated activities like participatory budgeting, social audits, etc.
Thus all these types and dimensions of accountability are prevalent in all public service
delivery mechanisms and are very much applicable to urban local bodies.
Concept of Public Accountability and Public Financial Accountability
The concept of public accountability deals with accountability to public on the one side
and also accountability of the public servants on the other side. The words “Public
Accountability” mean that public servants are held “totally accountable” for their
management and disposal of money and assets they collect from the general public. The
word’s meaning, content, and social systems, however, have changed as time passed. In
recent years, public accountability to evaluation of public policy, achievement and
performance has been playing an increasingly important role in the public sector. This may
62

be due to the fact that the private sector’s free market principles have been gradually
introduced into the public sector, and emphasis has accordingly shifted from “input and
procedures” to what we call “output, outcome and results”. Consequently, “Public
Accountability” today requires submitting not only monetary statements such as Statement
of Accounts but also, performance evaluation reports, to the Legislative body61.
According to the World Bank, Financial accountability is ultimately about promoting and
reporting publicly on performance. Public financial accountability requires that
governments manage finances prudently; that they integrate their financial and non-
financial reporting, control, budgeting, and performance; that they report comprehensively
on what they have achieved with their expenditure of funds; and that stakeholders behave
ethically. This aspect of the public financial accountability summarizes the quintessence of
all the approaches of the concept of accountability. In the area of urban local finance, this
concept is extremely important, as the urban layer is a local governance layer that is in
immediate contact with the citizens. Also it is because of lack of finance that many of the
citizen centric services and infrastructure are stated not to be managed properly, that the
urban public financial accountability gains importance.
Manifesting financial accountability is much more than building and maintaining
accounting and auditing systems. It represents more than just the technical capability of
financial managers. Accountability is not complete until it encompasses the wide-ranging
61 Otsuka, Muneharu (2005), Enhancing Public Accountability, National Performance Indicators And The Role of The Board of Audit of Japan, OECD, pp-1, from www.asosai.org/journal2005_April/
63

activities, attitudes, and reporting relationships between all stakeholders62. An analysis of
various types of accountability and their implications is discussed in Table-3-2.
Table 3-2: Types of Accountability
Type of Accountability
Analysis Implications
Financial Public Financial
All financial aspects including funds utilization for intended purposes, transfer to information to the stakeholders in this regard
The concerned officials, personnel or institutions should in a transparent manner pass on the information to the concerned stakeholders
Administrative Overall control of activities including the legal implications
The controlled official, person or institution are accountable to the higher level official, person or institution
Political Accountability relating to persons elected to office
The elected representatives are responsible to the electorate
Social Accountability in matters relating to civic engagement operated through citizens or group of citizens
Institutions are held accountable by/to collective or individual stakeholder representation
To summarize, the definitions of accountability and transparency, and also the analysis of
various accountability mechanisms with reference to the Urban Sector brings to light the
following:
• The concept of accountability and transparency are two sides of the same coin;
• Accountability and transparency lead to proper service delivery;
• Public accountability is about both public (citizens) and public officials;
• Public financial accountability summarizes various aspects of accountability through the common tag of finance.
62 Sahgal, Vinod and Chakrapani, Deepa (2000), Clean Government and Public Financial Accountability, OED Working Paper Series No. 17, The World Bank, pp-2
64

Section II - Accountability Relationships – Vertical – Horizontal – Diagonal
Accountability
Authority
Accountable Organization/
Person C
Figure 3-1: Accountability Relationships
The accountability relationships are expressed in several ways. Understanding the
geometry of the relationships provides clarity to the concept of accountability
relationships. Three types of accountability relationships emerge:
Accountable Organization/
Person B
Accountable Organization/
Person A
V
D
H
V
Citizens
V – Vertical accountability D – Diagonal accountability H – Horizontal accountability Accountable to
65

• Vertical accountability (V): In this relationship an organization/person is
accountable to another organization/person. There is some sort of hierarchical
relationship between these two so that one person remains accountable to the other.
Examples of such relationships are aplenty. Elected representatives to the Citizens,
Municipal Corporation to the Citizens, Government department/officials to one
layer of Government above them, and so on. Such relationships are represented as
V in the Fig.3.1.
• Horizontal accountability (H): Horizontal accountability exists across the same
level of institutions, and across persons in same level in institutions. This
relationship is in both directions, i.e. two persons are mutually accountable to each
other and in terms of accountability hierarchy they can be assumed at the same or
equal level. For example, two heads of the department in a government are
accountable to each other, two entities like Municipal Corporation and Water
Supply agency are accountable to each other in many ways (and both are
accountable to citizens –V) and so on. Such a relationship is shown as H in the
Fig.3.1.
• Diagonal accountability (D): Diagonal accountability arises in all situations other
than V and H. This means there is an indirect accountability relationship between
two entities unlike the other two (V and H) where the accountability is a direct
relationship. A typical example of such relationship (as shown in Fig.3.1) is
between an organization and say an Audit organization. In this case there is no
direct vertical hierarchical relationship or a horizontal relationship; however the
organization is accountable to the Auditors.
Table 3-3: Accountability Relationships
Accountability Relationships
Analysis Implications
Vertical
This relationship is between two levels one higher and one lower. This could be within an organization or between two institutions.
Generally there is an hierarchical relationship between the accountable person/institution and the person/institution one is accountable to. Strongest of the three types of relationships.
66

Accountability Relationships
Analysis Implications
Horizontal Horizontal relationship could be at the same level or could be hierarchical
This relationship is generally at the same level within an organization (person to person) or between two organizations at the same level. The differentiation of this relationship from Vertical is necessary for understanding direct accountability or not.
Diagonal
The Diagonal relationship is generally external and powerful. This is created out of specific arrangements like audit, inspection, press, etc.
Diagonal accountability relationship though not very hierarchical is very powerful. Gaps in accountability can be easily exposed through this relationship.
Section III - Conceptual Models relating to Accountability and Transparency
1. Mark Bovens’ Model63
Mark Bovens in his work on government accountability has identified seven elements in a
‘social relationship’ giving rise to accountability. These seven elements together constitute
the characteristics to explain accountability in a country or in organizations. According to
Bovens, “a relationship qualifies as a case of accountability when:
1. There is a relationship between an actor and a forum
2. in which the actor is obliged
3. to explain and justify
4. his conduct,
5. the forum can pose questions,
6. pass judgments,
7. and the actor may face consequences.”64
63 Bovens, Mark (2006), Analyzing and Assessing Public Accountability - A Conceptual Framework, European Governance Papers No.C-06-01
67

In this model of accountability, four characteristics of forum, actor, conduct and
obligations explain the concept of accountability. While forum is the canvass on which the
entire act of accountability takes place (represented by points 1 and 2), the actor (the
accountable person) has to conduct himself (represented by points 3 and 4). The forum can
ask him questions, pass judgements (represented by points 5 and 6) and the actor may have
to face consequences based on the obligatory arrangements (represented by point 7).
Bovens calls this model a ‘narrow accountability’ as it is a closed box model simplifying
various ingredients of accountability. Bovens model provides a simplistic and micro view
of accountability.
The advantages of this model are:
• It is very simple
• It is broken up into components
• It is generic
The drawbacks in this model are:
• The term forum is loosely structured – it could be organization or people
• The information flow aspect is not that explicit (except for the terms ‘explain’ and
‘justify’)
• The approach seems to be rigid and prima facie does not exhibit participation
(though implied)
64 Bovens, Mark, (2006),Ibid, pp-12.
68

2. One World Trust Model of Accountability
According to One World Trust Global Accountability Project (GAP), Accountability
means “the processes through which an organisation makes a commitment to respond to
and balance the needs of stakeholders in its decision-making processes and activities, and
delivers against this commitment”65, and transparency means “the provision of accessible
and timely information to stakeholders and the opening up of organizational procedures,
structures and processes to their assessment”66.
In this model of accountability, the process of accountability centres around the
stakeholders, who are classified as: internal and external. This model of accountability acts
with four ingredients:
• Transparency: the information to the stakeholders on structure, process, etc.
• Participation: the stakeholders take part in the decision making process and
activities
• Evaluation: process through which performance is evaluated and feedback given
for corrective action
• Complaint and response mechanism: receipt and disposal of complaints.
65 One World Trust (2006), Pathways to Accountability – A short guide to the GAP Framework, pp-1 66 Ibid, pp-2
69

Transparency The provision of accessible and timely
information to stakeholders and the opening up of the organizational procedures,
structures and processes to their assessment
Participation The process through which aorganization enables key stakeholders to plan an active role in the decision making processes and activities w
n
hich affect them
Evaluation The process through which an organization
monitors and reviews its progress and results against goals and objective; feeds learning
from this back into organization on an ongoing basis; and reports on the results of
h
Complaint and response mechanisms
Mechanisms through which an organization enables stakeholders to address
complaints against its decisions and actions, and
ensures that these complaints are properly reviewed and
acted upon
Figure 3-2: Accountability Model of One World Trust As shown in the Fig 3-2 the model provides various steps through which accountability is
established. This model is carved out of principles of management science where
information flow and participatory decision making are key ingredients in any democratic
organization or set-up. This model brings out some of the key success factors necessary for
a good accountability mechanism.
The advantages of this model are:
• It is simple
• It is based on practical field realities
• It is being used currently
70

The drawbacks of this model are:
• Policy aspects are not very clearly dealt with
3. UN-ESCAP Model
The United Nations Economic and Social Commission for Asia and the Pacific (UN-
ESCAP) model for good governance focuses on the key ingredients of urban governance.
“Good Governance has 8 major characteristics. It is participatory, consensus oriented,
accountable, transparent, responsive, effective and efficient, equitable and inclusive and
follows the rule of law”67. This definition includes aspects relating to both accountability
and transparency.
Accountability is a key requirement of good governance. Not only governmental
institutions but also the private sector and civil society organizations must be accountable
to the public and to their institutional stakeholders. Who is accountable to whom varies
depending on whether decisions or actions taken are internal or external to an organization
or institution. In general an organization or an institution is accountable to those who will
be affected by its decisions or actions. “Accountability cannot be enforced without
transparency and the rule of law”68. This is important as the definition clearly states that
‘obligation’ is very important in order to create the case for accountability. Here rule of
law indicates the legal obligation.
Transparency means that decisions taken and their enforcement are done in a manner that
follows rules and regulations. “It also means that information is freely available and
directly accessible to those who will be affected by such decisions and their
enforcement”69. It also means that enough information is provided and that it is provided
in easily understandable forms and media. The free availability of information and
accessibility of the same to the stakeholders are extremely important in this regard.
67 UN-ESCAP, What is Good Governance?, from www.unescap.org/pdd 68 UN-ESCAP, ibid 69 UN-ESCAP, ibid
71
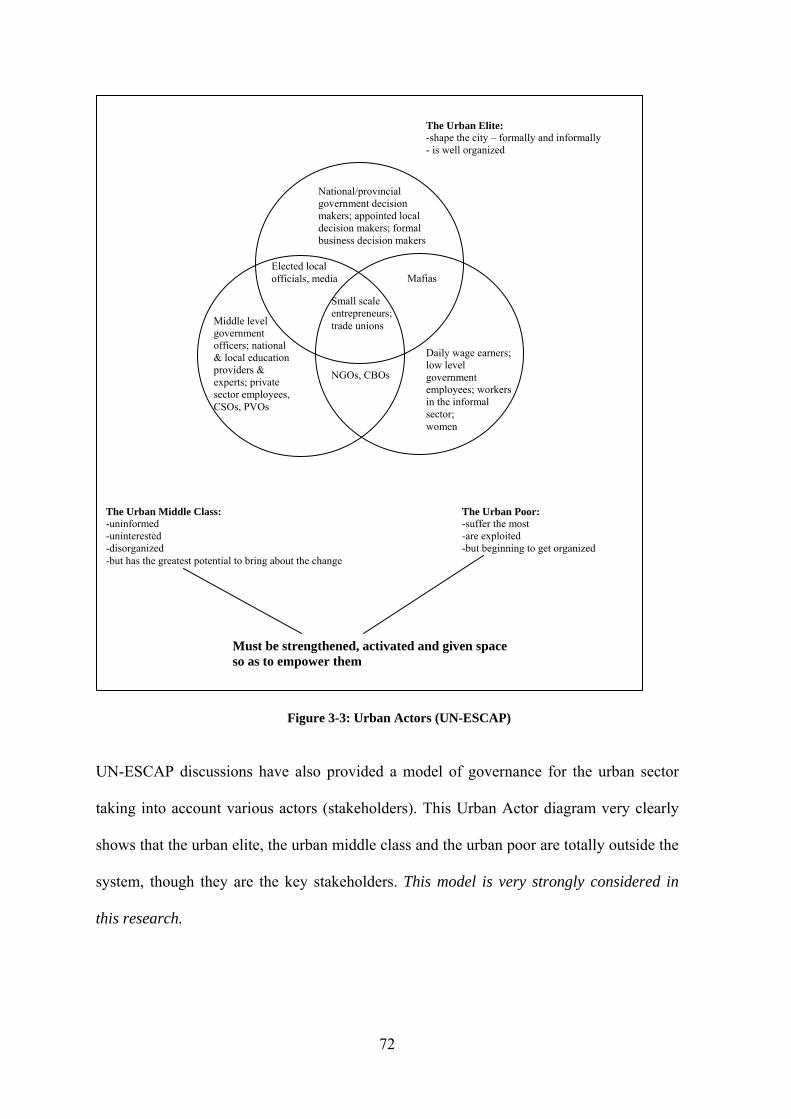
National/provincial government decision makers; appointed local decision makers; formal business decision makers
Elected local officials, media
Small scale entrepreneurs; trade unions Middle level
government officers; national & local education providers & experts; private sector employees, CSOs, PVOs
NGOs, CBOs
Mafias
Daily wage earners; low level government employees; workers in the informal sector; women
The Urban Middle Class: -uninformed -uninterested -disorganized -but has the greatest potential to bring about the change
The Urban Poor: -suffer the most -are exploited -but beginning to get organized
Must be strengthened, activated and given space so as to empower them
The Urban Elite: -shape the city – formally and informally - is well organized
Figure 3-3: Urban Actors (UN-ESCAP)
UN-ESCAP discussions have also provided a model of governance for the urban sector
taking into account various actors (stakeholders). This Urban Actor diagram very clearly
shows that the urban elite, the urban middle class and the urban poor are totally outside the
system, though they are the key stakeholders. This model is very strongly considered in
this research.
72

The advantages of this model are:
• It takes the stakeholders approach
• The model is very practical and can be used to study any governance mechanism
The drawbacks of this model are:
• It takes into account eight different variables
• Clarity on measurement of these variables is absent
4. The Global Development Research Centre – GDRC Model70
The GDRC’s literature on accountability is discussed very well on their website. This
virtual organization that is doing research on global governance issues, has dedicated
pages on urban governance. GDRC provides approach, rather than a model, and is very
practical in its definition of accountability and issues related to transparency.
“Accountability requires that one group or individual provides a professional or financial
account (or justification) of it activities to another stakeholding group or individual. It
presupposes that an organisation or institution has a clear policy on who is accountable to
whom and for what. It involves the expectation that the accountable group will be willing
to accept advice or criticism and to modify its practices in the light of that advice and
criticism”71.
The GDRC approach provides certain principles for accountability. The Four Principles
of Accountability enunciated are:
70 www.gdrc.org 71 www.gdrc.org/u-gov/accountability.html
73

• Specify responsibility and authority
• Provide guidance and support
• Monitor and assess exercise of responsibility and authority
• Take appropriate action
In this approach accountability is well structured with obligation through specifying
responsibility, information transfer for monitoring and assessing the progress, and taking
appropriate action towards achieving the accountability objectives.
The advantages of this model are:
• The model is simple
• Based on field research and experience
• Lays down specific guidance for implementation
The drawbacks of this model are:
• More of guidelines than of specific framework
5. Account Ability72
Account Ability is an organization for promoting accountability innovations in sustainable
development. The organization has come out with Assurance Standards for Accountability
called AA 1000, Assurance Standards for Stakeholders’ Engagement called AA 1000 SES,
and Accountability Principles Standards – AA 1000A. The objectives of all these
approaches are to provide a framework for accountability in public organizations. The
organization has been involved in studies relating to the accountability adherence of the
corporate sector across the globe.
72 www.accountability.org.uk or www.accountability21.net
74

“Accountability is about holding people to account for their impacts on the lives of people
and the planet. When it works, it means those impacted have the right to be heard and their
views taken into account. It means those with power have the obligation to listen and
respond. It means that there are adequate sanctions to enforce these rights and
obligations”73. In this approach, accountability has been viewed from the view of the
beneficiary stakeholders and seeks to focus on ‘holding the persons responsible for the
non-fulfillment of their obligations. For this purpose the AA model has proposed three
standards:
• AA 1000: Assurance Standards: This is a generally applicable standard for
assessing, attesting to, and strengthening the credibility and quality of
organizations’ sustainability reporting, and their underlying processes, systems and
competencies;
• AA 1000 SES: Stakeholder Engagement Standard: This standard becomes
important as the beneficiary stakeholders (say citizens) are generally left out in
many public projects. This is a generally applicable standard with open-source
framework for improving quality of design, implementation, assessment,
communication and assurance of stakeholder engagement;
• AA 1000 APS: Accountability Principles Standard: The purpose of the
AA1000APS (2008) is to provide organisations with an internationally accepted,
freely available set of principles to frame and structure the way in which they
understand, govern, administer, implement, evaluate and communicate their
accountability. The standard provides three principles: The foundation principle of
Inclusivity, the principle of Materiality, and the principle of Responsiveness.
The advantages of this model are:
• It sets standards for enabling accountability
• It is generic and can be applied for various institutions
The drawbacks are:
• It is still conceptual
• No clear measurement guidelines are available
73 Account Ability (2006), Reinventing Accountability for the 21st Century, pp-6.
75

6. World Bank’s Model
World Development Report 2004 titled “Making Service Work for Poor People”, brings
out an accountability model for public service delivery. This model provides for a five
stage process by which the accountability cycle is established as given in Fig.3.4.
Figure 3-4: Steps in Accountability (World Bank)
This five step process shows the relationship between the ‘actors’ and their ‘agents’. The
citizen as a stakeholder in the economy is a “principal” while the providers of services
(government) are “agents”. Between them there are five types74 of interactions. Only
when these five steps are present can it be said that ‘accountability mechanisms’ are
present.
• Delegating: this is the process by which an obligation is created by the principal on
the agent;
• Financing: this process indicates the transfer of money to the agent. In a typical
case of ULB, the tax paid by the citizen is part of this financing activity;
74 World Bank (2003), World Development Report 2004, pp-47
76
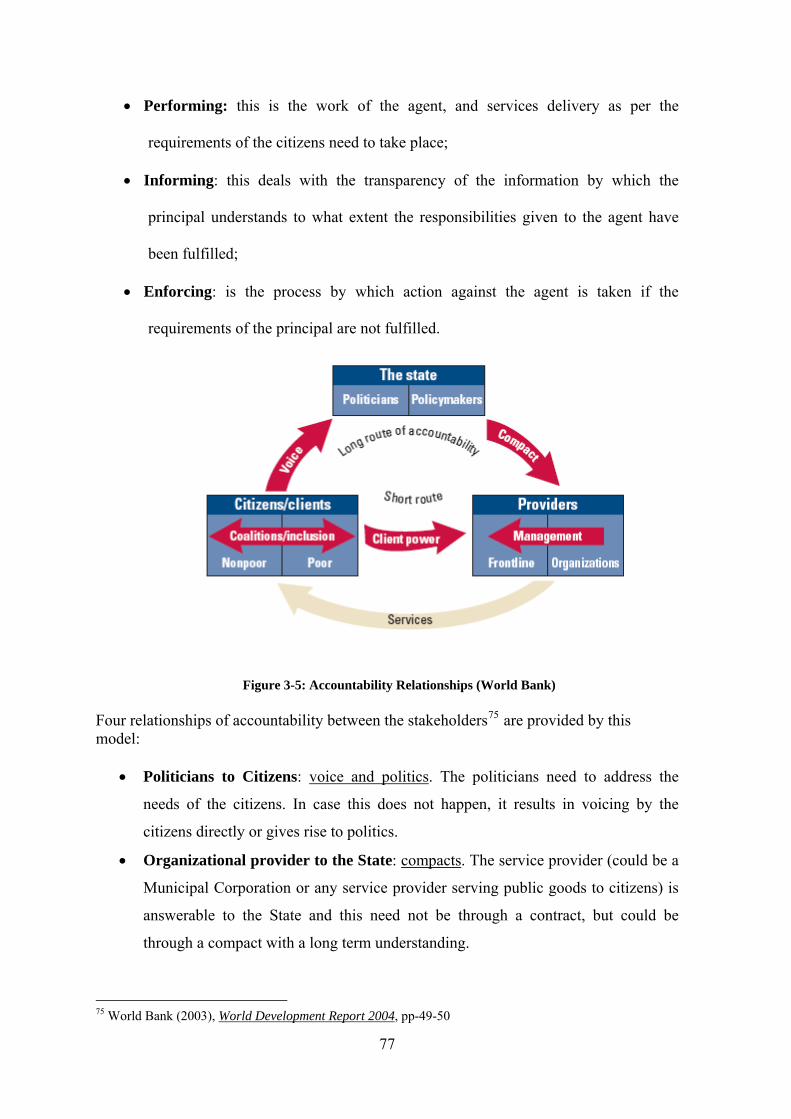
• Performing: this is the work of the agent, and services delivery as per the
requirements of the citizens need to take place;
• Informing: this deals with the transparency of the information by which the
• Enforcing: is the process by which action against the agent is taken if the
requirements of the principal are not fulfilled.
principal understands to what extent the responsibilities given to the agent have
been fulfilled;
Figure 3-5: Accountability Relationships (World Bank)
Four relationships of accountability between the stakeholders75 are provided by this model:
• Politicians to Citizens: voice and politics. The politicians need to address the
needs of the citizens. In case this does not happen, it results in voicing by the
citizens directly or gives rise to politics.
• Organizational provider to the State: compacts. The service provider (could be a
Municipal Corporation or any service provider serving public goods to citizens) is
answerable to the State and this need not be through a contract, but could be
through a compact with a long term understanding.
75 World Bank (2003), World Development Report 2004, pp-49-50
77

• Frontline professionals to the Organizational provider: management. The
g organization are accountable to the
organization for various activities by them, and the decisions taken.
professionals within the service providin
• Provider to the Citizen-client: client power. The service provider is also
answerable or accountable to the citizens.
When the client power works then there is the presence of the ‘short route to
sual ‘long route to accountability’ would be operating. The
• The model has both conceptual and operational clarity
types of interaction between stakeholders
ynthesis of the Accountability Models
Based on the analysis of the six accountability models provided, aspects relating to the
theme of this study have been given in Table-3-4.
Table
accountability’; otherwise the u
latter can be costly and time consuming.
The advantages of this model:
• Has considered various
• Steps in the process have been well laid out
The drawbacks of the model:
• Measurement of accountability relationship (parameters) not explained
S
3-4: Analysis of the Accountability
Models
Accountability Model Analysis – key Ingredients Implications Mark Bovens
ngredients
t
For accountability to be established seven iare required: forum, actor, conduct, questions, answers,judgement, consequences.
Issues relating to the e follow-up, action to fill th
accountability gap, etc. nodealt with clearly. Can be used to understand the accountability arrangement.
One World Trust Four ingredients: transparency, participation, ability
evaluation, complaint and response mechanism.
The focus seems to be on fixing the accountrather than on making the accountability system work;can be used for evaluation of accountability arrangement.
78

Accountability Model Analysis – key Ingredients Implications UN-ESCAP on,
free availability of
specific ded.
for mechanisms
vided o
Speaks about: obligati
information, and itsaccessibility. Noframework provi
The basic ingredients accountabilityto exist have been provery clearly. Can be used tset up accountability mechanisms.
GDRC
authority/responsibility, provide guidance/support, monitor/assess, take
e
he ppropriate
ly
s
Four Principles of Accountability: Specification of
appropriate action.
The guidance is very practical and provides thbasis for designing anaccountability system. Tkey aspect is the aaction, which basicalhelps implementing accountability systemthereby reducing accountability gaps.
Account Ability y
dard,
he design and
nal in
Provides standards to operate accountabilitsystems: assurance stanstakeholders engagement standard, accountabilityprinciples standard.
These standards provide tbasis forimplementation of accountability mechanisms. These are definitionature.
World Bank e steps in ements:
ur types of accountability relationships: voice and politics, compact,
framework for design, implementation, and follow-up of accountability arrangements.
Provides fivaccountability arrangdelegating, financing, performing, informing, and enforcing. Gives fo
Provides a good
management, and client power.
From the above analysis, any accountability echanism, needs to have the following
gredients, as given in Table-3-5:
m
in
79

ropo
Table 3-5: Basis for the p sed A-T-A Model
Key ingredients Model Comments Obligation to be accountable to others
DRC World Bank
rson
Mark BovensN-ESCAP U
G
This is considered as “Accountability” per se. The obligation element is the origin of accountability arrangement. This obligation identifies what type of conduct is required out of the peaccountable, and also the information that has to be transferred to the concerned persons.
Information transfer (transparency)
lity
information to the concerned
Mark BovensOne World Trust UN-ESCAP
AbiAccountWorld Bank
Transparency is ability of the systemto transfer such accountability
stakeholders.
Action based on the analysis of information transfer
DRC World Bank
a set of action is taken to achieve the intended accountability objectives.
UG
N-ESCAP Based on the transferred information,
Hence this study puts forth this A-T-A Model of Accountability, whereby Accountability,
Transparency and Action-ability are three related ingredients that need to be present in
any accountability arrangement. Without action-ability the accountability and
transparency arrangements are not completely useful in comprehensively giving all the
stakeholders the full benefit of the initiatives taken. This is being addressed in this
research to the extent possible. It is humbly believed that this A-T-A Model will provide
clarity to the users for understanding the gaps in existing accountability arrangements and
develop strategies for bridging such gaps.
Section IV - Hirschman’s Model: Exit, Voice and Loyalty
Accountability and transparency should result in the stakeholders expressing their opinion,
feedback and if required take part in the process of service delivery. Thus, in any
discussion on accountability and transparency one major consideration is with regard to
80

the options available for the stakeholders in various situations. In a typical public delivery
situation, where the citizens are faced with issues in public delivery, the options available
for citizens and how the citizens react under various circumstances need understanding. Is
there a redress mechanism that is available for citizens? Is such a mechanism working
effectively and efficiently? Are there options available for citizens and other stakeholders
in this regard? are some of the relevant questions in this regard. These are very important
withdraw from the relationship); or they can voice (attempt to repair or improve
e relationship through communication of the complaint, grievance or proposal for
vider – the
overnment – whether they find the service satisfactory or not. Hence there are three types
f people: those who “voice”, those who “exit”, and those who remain “loyal”.
considerations to understand the accountability mechanisms that are prevalent in a system.
Exit, Voice, and Loyalty is a treatise written by Albert O. Hirschman in 197076. The work
hinges on a conceptual ultimatum that confronts consumers in the face of deteriorating
quality of goods: either “exit” or “voice”. Hirschman uses his analysis of “exit” and
“voice” in order to strike at the foundational assumptions of liberalism. The basic concept
is as follows: members of an organization, whether a business, a nation or any other form
of human grouping, have essentially two possible responses when they perceive that the
organization is demonstrating a decrease in quality or benefit to the member: they
can exit (
th
change).
Hirschman’s concerns were that increasing the availability of exit through choice might
lead to a decline of voice activities. This can happen in two ways: citizens may not learn to
use the political methods to make demands, and exit, leaving behind the docile or the inert
ones; another set of persons may know how to use the voice mechanism to chose right
options or exit from poor service providers. In case the second option is not available they
will voice their concern. Only if nothing happens, they will choose to exit. There is another
set of people who neither voice not exit; they remain loyal to the service pro
g
o
76 Hirschman, Albert O. (1970), Exit, Voice, and Loyalty: Responses to Decline in Firms, Organizations, and States, Cambridge: Harvard University Press
81

Three Exit, Three Voice, and Loyalty framework77 (3E3VL) discussed by Dowding
and John (2008) adds a further dimension to Hirschman’s original work. According to this
wing options are available for a citizen to react to public services
o
•
lity to the other (one local service
rovision to private provision
rovision to the other
framework, the follo
pr
e – Campaign
• Loyalty – behavioural (it affects exit-voice) and institutional (vary across
Thus the model gives rise to
ur types of persons: Voicers (Action-positive), Exiters (Action-negative), Loyalists
olerance –positive) and Neglectors (Tolerance-negative).
vided to him/her:
Three Exits:
o Physical movement from one loca
provider to the other)
o Public p
o From one public p
• Three Voices:
o Individual Voice
o Collective Voice - Vote
o Collective Voic
institutional settings).
An extension to the 3E3VL model was made by the EVLN78 model. In this model, the
loyalty factor was further classified as loyalty and neglect.
fo
(T
Figure 3-6: EVLN Model
77 Dowding K. & John P. (2008), The Three Exit, Three Voice and Loyalty Framework: A Test with Survey Data on Local Services, Political Studies 56(2), pp. 288-311. 78 Campbell R., Dowding K., John P. (2007), Modelling the exit –voice trade-off; social capital and responses to public services, Paper presented at Centre for Democracy and Elections, University of Manchester, February 28, 2007.
EXIT
VOICE
NEGLECT
LOYAL
ACTION POSITIVE
NEGATIVE POSITIVE
TOLERANCE
NEGATIVE
82

Exit, Voice and Control is another variation of Hirschman’s model postulated by Paul S.
(1992), and he examines various options available to the citizens under various
onsiderations79. He builds a model using only voice and exit, but classifies them into
exit. Fig.3-7 provides an overview of the model.
w exit levels and weak and strong voices give rise to the
- High exit – weak voice
- High exit – strong voice
The characteristics of the above possibilities are giv the Fig.3-7.
of
on
ale
y of services
on barriers
c
weak and strong. Based on these classifications he derives models of weak and strong
voice, and low and high
The combinations of high and lo
following possibilities:
- Low exit – weak voice
- Low exit – strong voice
en in
Exit Ex- High spatial barriers - Local monopoly
Voice Voi- Low differentiability
services - High income barriers - High legal/instituti
barriers al
- Low income barriers - Low or moderate
informati- High information barriers
it - Large economies of sc- High legal barriers to entry ce - Low differentiabilit
Exit Ex- Legal barriers to entry
of
- High income barriers - High
barriers- High information barriers
omies
- High differentiability of services
- Low income barriers ct involvement
- Low economies of scale Voice Voi
- High differentiability services
legal/institutional
- High produ
it - Low to moderate econ
of scale ce
Weak Strong VOICE
Low
EXIT
High
Figure 3-7: Characteristics of services and public
79 Paul, Samuel (1992), Accountability in Public Services: Exit, Voice and Control, World Development, Vol.20, No.7, pp-1047-1060.
83

Significance of the Voice-Exit Model for this Study
The concept underlying the Exit-Voice models and various extensions of the same is very
important for the present study. While examining the accountability/transparency from the
perspective of City management, the Exit-Voice model provides various alternatives to the
key stakeholders - the citizens. When a stakeholder is faced with a situation for taking
action with regard to a public service, he needs to have options to voice his opinion or to
exit from the public services being provided. Availability of such options in a structured
anner would indicate the extent of ‘accountability arrangements’ available. Since the
odel and its implications are extremely relevant.
he globe and currently is under serious
nsideration. In this research two major ingredients of the ‘preparedness of the citizens’
governance is characterized by sustainability, subsidiarity, equity, efficiency,
m
present study is on accountability, this m
V – Preparedness for Accountability
The preparedness of accountability is a very important ingredient for enforcing
accountability arrangements. There are several factors that contribute for the preparedness
of citizens for governance. It has to be understood that the citizens are not sensitized to
various issues in urban governance. While issues like lack of adequate urban facilities like
roads are easily understood by the citizens, an average citizen does not know where to
lodge complaint when the road is not clean or garbage is not removed. Many citizens may
not even know the details of the ward they live in or the name of the ward representative.
The participatory role in governance whereby the citizens work with government – the
concept of local government and local governance is not understood by many of the
citizens. These are important issues in having proper accountability in urban management.
These have been discussed at various forum across t
co
for democracy are taken up. These relate to basic knowledge about ward/corporation and
participation of the citizens in urban governance.
The Global Campaign on Urban Governance in the year 2000 proposed that good urban
transparency and accountability, civic engagement and citizenship, and security, and
84

that these norms are interdependent and mutually reinforcing80. In this context civic
engagement and citizenship have been considered in parallel with accountability and
ansparency to contribute towards urban governance.
ugh free and fair municipal elections and
tr
Practical means of realizing the norms of urban governance include81:
• Promoting strong local democracies thro
participatory decision-making processes;
• Establishing the legal authority for civil society to participate effectively through such
civic responsibility among citizens
mechanisms as development councils and neighbourhood advisory committees;
• Promoting an ethic of through such mechanisms as
ons and participatory strategy development, including
“City Watch” groups;
• Making use of mechanisms such as public hearings and surveys, town hall meetings,
citizen’s forums, city consultati
issue-specific working groups;
• Undertaking city referenda concerning important urban development options.
ined portions clearly indicate all the ingredients of citizens’ participation for
overnance.
) - the knowledge of citizens on matters
oncerning governance is expected to be high.
All the underl
g
Knowledge
Knowledge of citizens as an important ingredient and pre-condition for implementing
reforms process does not seem to be focus of any particular research. However, several
direct and indirect mention of knowledge of governance as an important point have been
made. Also, in the knowledge-based economy and in particular in a country like India - a
global leader in Information Technology (IT
c
The Administrative Reforms Commission, Government of India, has stated that one of its
objectives is to “Promote knowledge sharing to realize continuous improvement in the
80 UNCHS (2000),: Good Urban Governance: A Normative Framework, Conference Room Paper 6, 26 February 2000. See the Global Campaign for Good Urban Governance Website http://www.unchs.org/govern/ 81 UNHABITAT (2001), Norms of Urban Governance – consultation draft, pp-3, from ww2.unhabitat.org/campaigns/governance/
85

quality of governance”. The ARC has clearly observed “The primary purpose of
governance is the welfare of citizens. While one aspect of governance relates to
safeguarding the legal rights of all citizens, an equally important aspect is concerned with
ensuring equitable access to public services and the benefits of economic growth to all. It
is expected that e-Governance would enable the government to discharge its functions
more effectively. However, this would require the government to change itself – its
processes, its outlook, laws, rules and regulations and also its way of interacting with the
citizens. It would also require capacity building within the government and creation of
general awareness about e-Governance among the citizens”82. While this observation is
strengthening. Finally, the knowledge management component of
e campaign focuses on lessons learned and on the development of good urban
eable residents who are known to have the ability to work in a collaborative
basically with regard to e-Governance, the focus is on knowledge and knowledge sharing.
While discussing about the need for knowledge of citizens for implementation of
successful evaluation of responsiveness to good governance, “Through normative debate,
the campaign seeks to develop and promote the fundamental principles of good urban
governance. The campaign’s advocacy strategy involves raising awareness of cities where
principles of good urban governance are being practiced. Capacity-building occurs via the
operational activities of regional offices, global programmes and partners relying on
training and institutional
th
governance toolkits”83.
While discussing about role of participation of the citizens in democracy, the authors
highlight the need for knowledge of the citizens in this regard. “In the conceptual shift
community residents will be actively encouraged to participate, invited into the process,
and fully armed with the knowledge and information to make participation
meaningful……. Considerable time must be devoted to finding a broad representative mix
of knowledg
82 Government of India (2007), Eleventh Administrative Reforms Commission Report, Chapter 1, pp-1, from www.darpg.nic.in 83 Carole Rakodi (2003), Evaluation of effectiveness of measures to increase the transparency, responsiveness and accountability of Local Governance, , School of Public Policy, University of Birmingham for the Global Steering Committee, UN-HABITAT Campaign for Good Urban Governance.
86

manner with others even in circumstances where they may disagree with the final
decision”84.
The Global e-cities programme formulated bringing in various urban stakeholders through
sharing of knowledge and experience, works on the premise that knowledge and sharing of
the same between various stakeholders is the basis for governance. “The wide gap that
parates knowledge, capacity and policies from different municipalities means that good
help increase accountability of elected/local government
nctionaries”86. This summarizes the need for knowledge on urban affairs and governance
proved
ublic accountability and citizen empowerment through discussion of revealed knowledge
se
work and experience, which could make a positive difference in the lives of millions of
people, are neither being shared nor utilized”85.
“It is increasingly felt that better informed citizens, local governments and key
stakeholders having knowledge about the nature of resource-related processes at the local
level, (i) have better understanding of dynamics of their interaction with each other therein,
(ii) are able to identify actual and possible impacts of participation that would lead to
improved citizens’ interaction and engagement with specific inputs towards poverty
reduction, and (iii)
fu
on the part of various stakeholders; but as given, the first and primary stakeholder in this
regard is the citizen.
Nallathiga R (2005) brings out the role of knowledge in improving governance of cities.
He observes, “It also took forward the FBAS to the citizens through launching Public
Record of Operations and Finance (PROOF) campaign, thereby, extending it to im
p
of civic finances”87 while discussing how the knowledge of citizens on urban finance
contributed for accountability in Bangaluru.
This observation by the WaterAid, though on water sector, brings out the role of the
citizens knowledge in governance. “To bridge the accountability gap requires local people
84 Pamela D. Gibson, Donald P. Lacy, Michael J. Dougherty (2005), Improving Performance and Accountability in Local Government with Citizen Participation, The Public Sector Innovation Journal, Volume 10(1). 85 The Glocal e-cities Network Portal; www.glocalforum.org 86 Policy Paper – Urban Development, LogoLink Research Project on ReCitE, pp-1, from www2.ids.ac.uk/logolink/initiatives/projects/ 87 Nallathiga, Ramakrishna, (2005), Institutional innovations of Urban Governance: Some examples of Indian cities, Urban India, Vol XXV, No. 2 (2005):pp-13.
87

to develop a fuller understanding of their entitlements to water and sanitation, their current
water and sanitation service situation and who is responsible for policy and service
elivery. Armed with such knowledge citizens can get into direct negotiation to change
urban governance. Ideally he/she should be
ade aware of all the information that is relevant to him/her. In this regard the Corporation
on. “ While the urban
sident can see herself as a producer of urban goods and services, more as a consumer of
rban comforts, she cannot so easily see herself as a citizen. In fact, her identity as a
India is one that is minimally developed, if at all”89.
cracy needs to be complemented by
echanisms of citizen participation, to enable those elected to gauge better what are the
d
policy and practice, and gain their rightful services. These form the basis of Citizens’
Action projects”88.
In the case of citizens, the acquiring of knowledge on the city governance is a voluntary
affair though as a good citizen he has to be aware of various issues (for the citizens) and
initiatives (by the Corporation) in this regard. While all other stakeholders (service
providers/contractors/employees of Corporations/elected representatives/and so on) are
dependent some way or the other on such knowledge for their existence, the citizens need
to take steps to acquire this knowledge on
m
(as the third tier in governance and not as a service provider) has an important role to play
and has to come out with specific strategies.
These words of Ramesh Ramanathan succinctly summarize the true position of an urban
citizen linking the aspects relating to both knowledge and participati
re
u
citizen in urban
Participation
“As in every society, elected, representative demo
m
needs and priorities of citizens, as well as to create a sense of ownership on the part of
citizens of the services provided by government”90.
88 Ryan, Peter et.al (2006), Bridging the gap - Citizens’ Action for accountability in water and sanitation, WaterAid, (www.wateraid.org), pp-7. 89 Ramanathan, Ramesh (2007), Federalism, Urban Decentralisation and Citizen Participation, Economic and Political Weekly, February 24, 2007, pp-675 90 International Development Department School of Public Policy, University of Birmingham, England, (May 2002), Local Government Decision-Making: Citizen Participation and Local Accountability - Examples of Good (and Bad) Practice in Kenya, pp-4.
88

“Citizen participation is a key element in promoting transparency and
accountability……People are the principal wealth of cities; they are both the object and
the means of sustainable human development. Civic engagement implies that living
together is not a passive exercise: in cities, people must actively contribute to the common
ood. Citizens, especially women, must be empowered to participate effectively in
ectively enhanced. The existence of mechanisms for public participation
in itself an important deterrent against corruption. It is expected to promote more
g
decision-making processes. The civic capital of the poor must be recognized and
supported”91.
Based on a case study in Phillipines, the following observation is made on the benefits
realized from citizen participation: “On the other hand, through strengthened direct citizen
participation in the auditing process, government accountability, transparency and
credibility are eff
is
prudence in the use of public resources for projects that would benefit local
communities”92.
Two interesting cases, one from Porto Alegre, Brazil and the other from Bengaluru, India
provide proven basis for citizen participation in urban governance.
Brazilian experiment: In the field of urban governance, the Brazilian experiment of
participatory is path breaking and has proven to the world that participation can be on a
large scale and also on technical matters like project and finance. “Porto Alegre spends
about 200 million dollars per year on construction and services, this money is subject to
participatory budgeting. Annual spend on fixed expenses such as debt service and
pensions, are not subject to public participation. Around fifty thousand residents of Porto
legre now take part in the participatory budgeting process (compared to 1.5 million city
A
inhabitants), with the number of participants growing year on year since 1989. Participants
are from diverse economic and political backgrounds”93.
91 Jusoh, Hamzah and Rashid, Azmizam Abdul (2008), , Efficiency in Urban Governance towards Sustainability and Competitiveness of City: A Case Study of Kuala Lumpur, World Academy of Science, Engineering and Technology 40 - 2008, pp-445. 92 Bergen Seminar Series (2002/2003), The Philippines: Enhancing public transparency and accountability through civil society participation in monitoring government services, CASE STUDY, pp-2 93 http://www.oecd.org/LongAbstract/0,3425,en_2649_34129_38983243_119666_1_1_37405,00.html
89

“The history of conceiving and executing public budgets in Brazil is marked by serious
deformations related to power concentration, resource waste, political affairs and
corruption. In Porto Alegre, this history has been changed...... The Participative Budget has
proved that the democratic and transparent administration of the resources is the only way
to avoid corruption and mishandling of public funds...... The Participative Budget has also
proved that the intention of having effective tools of participation and the commitment of
the Government in doing whatever the population decides, is essential to cut the chains and
e bureaucratic barriers that separate the society from the State, forming an active and th
mobilized citizenship. In Porto Alegre, today, the citizens know and decide on public
issues, transforming themselves, therefore, in agents of their own future”94.
Indian experiment: PROOF (Public Record of Operations and Finance) is a public
campaign launched in mid-2002 in Bangalore. As a result of the campaign, the city
unicipal Corporation - Bangalore Mahanagara Palike (BMP) - has been releasing its
nment? PROOF empowers citizens to impact change
rough understanding the budget. The cornerstone of the PROOF model is that it
M
quarterly performance data. Citizens have been participating in public debate and
discussions on the results, every quarter since then95.
PROOF is a Social Accountability model that uses performance indicators, budgets and
process analysis as a means to impact change. The fundamental goal of PROOF is to
provide citizens with good governance from public institutions much in the vein that
shareholders expect and demand from private companies. Citizens, as stakeholders in their
communities, have been taken for granted by local governments and have, over time,
assumed a passive role in demanding explanations for and change of resource allocations
for essential services. In the private sector, shareholders have the right to scrutinize
financial statements. Why shouldn’t citizens expect the same rights and level of financial
reporting from their local gover
th
measures performance of the government by evaluating financial statements and assessing
promised and actual outcomes96.
94 http://www.unesco.org/most/southa13.htm 95 http://indiatogether.org/campaigns/proofblr/ 96 Kamath Ashok (2005), Performance Measurement in Education – the PROOF Initiative, Akshara Foundation, Bangalore, India
90

These two live examples show how the participation of the citizens in urban affairs can
totally change the complexion of urban governance. This marks the basis of participatory
democracy that is advocated for a matured society. However, both these cases deal with
normally non-transparent area – budgeting and financial management. At least in
budgeting some public documents are available. By the Brazilian experiment this has been
made into a meaningful exercise so that the budget reflects the requirement of the people.
This is part of the planning activity. In the Indian case the role of citizens is in monitoring
the performance, that is the control activity. Ideally in both these phases the citizens should
be involved. With participatory planning and monitoring, the Corporation will look at only
e implementation of projects and schemes. Even in these, through PPP model, the non-
comprehensive meaning to the term
th
government entities participate providing a
participatory governance.
Citizen Participation – evaluation tool CLEAR
This is a diagnostic tool – the CLEAR97 model – that both anticipates obstacles to
empowerment and links these to policy responses. Based upon case studies of participation
e factors that underpin
• Enabled to—are provided with the opportunity for participation;
e been considered.
practices in contrasting English localities, the model identifies fiv
citizens’ uneven response to participation. The CLEAR tool argues that participation is
most effective where citizens:
• Can do—have the resources and knowledge to participate;
• Like to—have a sense of attachment that reinforces participation;
• Asked to—are mobilized through public agencies and civic channels;
• Responded to—see evidence that their views hav
An attempt is made in this research to look how the Chennai citizens respond to these
issues from demand side of accountability perspective.
97 Lowndes, Vivien and Pratchett, Lawrence (2007), CLEAR: Understanding Citizen Participation in Local Government – and How to Make it Work Better. The CLEAR tool was developed in collaboration with Gerry
anchallenge.eu/ Stoker, University of Southampton – pp1. From www.europe
91

Municipal Research and Service Centre of Washington provides various documents and
t of citizens in municipal governance.
model
an be applicable to Indian conditions will also be examined. The observations on the
s of the citizens would influence the extent of accountability of the
orporation from the demand perspective of accountability taken for this research.
for the citizens in terms of EVLN (exit,
voice, loyal, negate) is also tested during the survey. The research also attempts to study
the preparedness of the citizens to accountability, both in terms of basic knowledge of the
Corporation and their willingness to participate.
inputs for citizens participation in governance98. This indicates the importance of the
involvemen
Significance of the study of preparedness of Accountability (including CLEAR) for
this Study
The study of the accountability related matters get a completion only when the citizens’
role is understood both in terms of basic knowledge of the Corporation and their
willingness to participate in the activities of the Corporation. While the knowledge shows
the level to which they are aware and also the extent to which the Corporation does the
extension of its activities, the participation clarifies their willingness to be part of the
governance. This is also important as otherwise there will not be true ‘participatory
democracy; While these factors are being analysed, the extent to which the CLEAR
c
preparednes
C
Summary
Various theoretical models discussed in this study have resulted in an accountability model
called Accountability – Transparency – Action-ability (ATA) Model. This model has been
used in this thesis. The Survey tests the perception of the three variables through the
impressions of the citizens. The options available
98 http://www.mrsc.org/research/libraryresults.aspx?cat=409
92

Chapter - 4
ண்பதத்தான் ஓரா ைறெசய்யா மன்னவன்
ண்பதத்தான் தாேன ெக ம்
The inaccessible, unconsulting and unjust king sinks law in the
548
appointed by an order to a particular epartment shall communicate to him (i.e. the king) the real nature f that work and the income and expenditure (both) in detail and in e aggregate.
rthashastra – 2.9.19
எ
த
status and estimation, and perishes by himself. Thirukkural -
Therefore, he who isdoth A
93

Chapter – 4: Methodology, Survey, Validity, Reliability
This Chapter is presented in four sections. Section I deals with Sampling method, Section
itations. Section III discusses the demographic
he respondents; and Section IV deals with validity and reliability aspects of the
– II with the Survey methodology and lim
profile of t
survey.
Section I – Sampling method
Coverage
The Study has been carried out in the City of Chennai for the area under the Chennai
ion. Since the study focus was on accountability related matters, the basic sample
f Chennai City could be covered by the study.
tudy.
Corporat
criterion is citizenship. Hence any citizen o
Accordingly the samples were selected based on certain criteria specific to the s
Criteria
The criteria for the sample selection were:
on
understand the issues would be excluded from
the interview
• At least one male and one female will be interviewed in every ward
• As far as possible by making the sample criteria simple, various representative
d.
• The study has to cover all the areas coming under Chennai Corporati
• All categories of citizens need to be covered
• Only persons who will not be able to
citizenry to be covere
94

Stratified Random Sampling
above proposition, the sampling plan was made developed on “Stratified Based on the
Random Sampling” approach. The stratification primarily was geographical, secondary
was gender and at the third level - literacy. However, stress was more on the first two
criteria.
Sample size
The base for the sampling plan was 2001 Census. According to this Census, Chennai city
ad a population of 43,43,645 and considering an annual growth of 2% (based on overall
e for the study was arrived at 663.
63 was broken up first into the 10 zones and then to each of the wards
pulation. The base for
this ward wise ratio was the 20
Planned sam
h
decadal (1991-2001) growth rate of 21.5% as per 2001 Census) population of the city over
the previous year the 2009 population was estimated at 50,89,272. With tolerance of 5%
and confidence level of 99%, the sample siz
This sample of 6
based on the ratio of the Male and Female – literate and illiterate po
01 Census.
ple
Accordingly le size was arrived at as shown in Table 4-1.
ble 4-1: Ward/Zone Wise SamplWA D ZONE Sample
size ML
FL
MI FI
the samp
Ta e R WARD NAME
1 Kodungaiyur (West)
I
8 4 3 1 02 Kodungaiyur (East) 8 4 3 1 0
3 Dr.Radhakrishnan Nag(North)
ar 7 3 2 1 1
4 Cherian Nagar (North) 3 1 1 0 15 Jeeva Nagar (North) 6 3 2 1 06 Cherian Nagar (South) 3 1 1 0 17 Jeeva Nagar (South) 3 1 1 0 18 Korukupet 6 2 2 1 1
95

WARD WARD NAME ZONE Sample size
M L
F L
MI FI
9 2 1 1 0 0Mottai Thottam
10 Kumaraswamy Nagar (South) 5 2 2 1 0
11 Dr.Radhakrishnan Nagar (South) 5 2 1 1 1
12 Kumaraswamy Nagar (North) 3 1 1 0 1
13 Dr. Vijayaraghavalu
6 Nagar 3 4 1 1 1 114 Tondiarpet
II
6 2 2 1 115 Sanjeevarayanpet 2 1 1 0 016 Grace Garden 4 2 1 0 117 Ma Po Si Nagar 4 2 1 0 118 Royapuram 2 1 1 0 019 Singara Garden 2 1 1 0 020 Narayanappa Garden 2 1 1 0 021 Old Washermenpet 3 1 1 0 122 Meenakshiammanpet 5 2 1 1 123 Kondithope 2 1 1 0 024 Seven Wells (North) 2 1 1 0 025 Amman Koil 2 1 1 0 026 Muthialpet 3 2 1 0 027 Vallal Seethakadhi Nagar 4 1 1 1 128 Katchaleeswarar Nagar 5 2 1 1 129 Seven Wells (South) 2 1 1 0 030 Sowcarpet 2 1 1 0 031 Basin Bridge 57 5 2 1 1 132 Vysarpadi (South)
III
5 2 2 1 033 6 2 2 1 1Vysarpadi (North) 34 Perambur (North) 6 3 2 1 035 Perambur (East) 4 2 1 0 136 Elango Nagar 6 3 2 1 037 Perambur (South) 4 2 2 0 038 Thiru-Vi-Ka Nagar 5 2 2 1 039 Wadia Nagar 5 2 2 1 0
40 Dr.Sathiyavanimuthu Nagar 6 3 2 1 0
41 Pulianthope 3 1 1 0 142 Dr.Besant Nagar 4 1 1 1 143 Peddunaickenpet 2 1 1 0 044 Perumal Koil Garden 2 1 1 0 045 Thattankulam 3 1 1 0 146 2 1 1 0 0Choolai 47 Park Town 2 1 1 0 048 Elephant Gate 3 1 1 0 1
96

WARD WARD NAME ZONE Sample size
M L
F L
MI FI
49 70 2 1 1 0 0Edapalayam 50 Agaram (North)
IV
7 3 3 0 151 Chembium 7 3 3 1 052 3 2 1 0 0Siruvallur
53 Nagamaniammaiyar Nagar (North) 3 2 1 0 0
54 5 2 2 0 1Agaram (South)
55 ai Gurusamy
5 2 2 0 1ViduthalNagar (South)
56 Ayanavaram 5 2 2 0 1
57 Naganmaniammayar
uth) Nagar (So 2 1 1 0 058 Panneerselvam Nagar 6 2 2 1 1
59 Maraimalai Adigal Nagar (North) 2 1 1 0 0
60 Maraimalai Adigal Nagar (South) 6 2 2 1 1
61 Purasawalkam 2 2 0 0 062 Kolathur 12 5 4 1 263 Villivakkam (North) 76 11 5 4 1 164 Villivakkam (South)
V
1 0 5 4 1 065 Virugambakkam (North) 1 0 5 4 1 066 Anna Nagar (West) 7 3 3 1 067 Anna Nagar (Central) 5 2 2 0 168 Anna Nagar (East) 6 2 2 1 169 Shenoy Nagar 4 2 1 0 170 Kilpauk (North) 4 2 2 0 071 Gangadeeswarar Koil 2 1 1 0 072 Kilpauk (South) 6 2 2 1 173 Aminjikarai (East) 4 2 2 0 074 Aminjikarai (Central) 7 3 3 1 075 Aminjikarai (West) 8 4 3 1 076 Periyar Nagar (North) 3 2 1 0 077 Periyar Nagar (South) 3 2 1 0 078 Nungambakkam 83 4 2 2 0 079 Adikesavapuram
VI
4 2 1 0 180 Nehru Nagar 5 2 1 1 181 Chintadripet 4 3 1 0 082 Komaleeswaranpet 2 1 1 0 083 Balasubramaniam Nagar 3 1 1 1 084 Thiruvotteeswaranpet 3 1 1 1 085 Dr.Natesan Nagar 2 1 1 0 086 Chepauk 3 1 1 1 087 Zam Bazaar 2 1 1 0 088 Umarupulavar Nagar 3 1 1 1 0
97

WARD WARD NAME ZONE Sample size
M L
F L
MI FI
89 Thiruvallikeni 2 1 1 0 090 2 1 1 0 0Marina 91 Krishnampet 4 1 1 1 192 Bharathi Nagar 3 1 1 1 093 Azad Nagar (North) 2 1 1 0 094 Bharathidasan Nagar 4 1 1 1 195 Azad Nagar (South) 2 1 1 0 096 Vivekanandapuram 52 2 1 1 0 0
97 Anjukam Ammaiyar Nagar
VII
5 2 2 0 198 Kosapet 2 1 1 0 099 Pattalam 3 1 1 0 1100 Anbhazhagan Nagar 2 1 1 0 0101 Perumalpet 2 1 1 0 0102 Kannappar Nagar 2 1 1 0 0103 Dr.Ambedkar Nagar 2 1 1 0 0104 Chetpet 4 2 1 0 1105 Egmore 3 1 1 1 0106 Pudupet 4 2 1 1 0107 Ko-Si-Mani Nagar 5 2 2 0 1108 Nakkeerar Nagar 5 2 2 0 1109 Thousand Lights 3 2 1 0 0110 Azhagiri Nagar 2 1 1 0 0111 Amir Mahal 3 2 1 0 0112 Royapettah 2 1 1 0 0113 53 4 2 2 0 0Teynampet 114 Sathiyamoorthi Nagar
VIII
5 2 2 1 0115 5 2 2 0 1Alwarpet (North) 116 Alwarpet (South) 5 2 2 0 1117 Vadapalani (West) 4 2 2 0 0118 Vadapalani (East) 4 2 2 0 0119 Kalaivanar Nagar 4 2 1 0 1
120 Navalar Nedunchezian Nagar (East) 5 2 2 0 1
121 Navalar Nedunchezian Nagar (West) 5 2 2 0 1
122 Ashok Nagar 4 2 2 0 0123 M.G.R.Nagar 3 2 1 0 0124 Kamaraj Nagar (North) 3 2 1 0 0125 Kamaraj Nagar (South) 4 2 2 0 0126 Thiyagaraya Nagar 3 2 1 0 0127 Rajaji Nagar 3 2 1 0 0128 Virugambakkam (South) 7 3 3 1 0129 72 8 3 3 1 1Saligramam 130 Kodambakkam (North) IX 7 3 3 1 0
98

WARD WARD NAME ZONE Sample size
M L
F L
MI FI
131 Kodambakkam (South) 7 3 3 1 0132 Saidapet (West) 6 3 2 1 0133 rth) 3 2 1 0 0Kumaran Nagar (No134 Kumaran Nagar (South) 4 2 2 0 0135 Saidapet (East) 6 3 2 1 0
136 Kalaignar Karunanidhi Nagar 4 2 1 0 1
137 V.O.C.Nagar 3 2 1 0 0138 G.D. Naidu Nagar (East) 6 3 2 1 0
139 G.D. Naidu Nagar (South) 5 2 2 0 1
140 Guindy (West) 5 2 2 0 1141 Guindy (East) 63 7 3 3 1 0142 Bhemmannapet
X
4 2 2 0 0143 Thiruvalluvar Nagar 2 1 1 0 0144 Madhavaperumal Puram 2 0 1 1 0145 Karaneeswarapuram 3 1 1 0 1146 Santhome 5 2 2 0 1147 Mylapore 2 1 1 0 0148 Avvai Nagar (North) 3 2 1 0 0149 Raja nnamalaipuram A 4 2 2 0 0150 Avvai Nagar (South) 6 2 2 1 1151 Adyar (West) 6 3 3 0 0152 Adyar (East) 4 2 2 0 0153 Velacherry 14 6 5 2 1154 Thriuvanmiyur (West) 6 3 2 1 0155 Thiruvanmiyur (East) 74 13 6 5 1 1
Total 663 663 298 249 58 58
reality 720 persons were surveyed and 663 validated samples have been taken up for the
udy.
In
st
99

Su y Samprve les
Table 4-2: Pl and A al – stical alysi
f
umbers) is given in Table 4-2. Though there were slight deviations in the actual numbers
rveyed, it was observed that the actual survey population was statistically representing
e planned one. The p-value of Chi square test results, for every zone is above 0.05
dicating the acceptance of the samples of each of the zones at 95% level of confidence.
Z No of WARDS
CTUAL (Observed) LA xpected) SQUARE-
V
Survey an ctu Stati An s
ONE
A P N (E CHI-
p- ALUE
OML OFL OMI OFI EML E EMI EFI FL
I 13 26 21 8 8 23 21 7 9 0.8860 II 18 25 19 5 8 28 16 8 8 0.5706 III 18 30 26 8 6 26 25 6 11 0.3087 IV 14 34 28 5 9 30 26 4 12 0.6398 V 3 15 39 3 7 4 36 30 4 10 0.0937VI 18 18 22 8 4 20 18 5 9 0.1888VII 17 25 21 2 5 23 20 10 4 0.0760 VIII 16 34 29 3 6 31 26 3 11 0.4058 IX 12 30 24 6 3 27 23 8 7 0.3672 X 14 33 30 6 5 31 29 9 9 0.4008
Total 155 298 249 58 58 275 234 64 90 O – ObserveE – Expected
F – Female L – Literate
Based on the survey plan given in Table 4-1, the survey was conducted in all the ten zones
(155 wards) of Chennai. There were several practical issues while conducting the survey,
one major issue being the unwillingness of the citizens to respond to the questionnaire.
Efforts were taken to put the major points in Tamil and explain to them, as in many cases
the reluctance was from illiterate women. An attempt was made to stick to the targeted
numbers in each of the wards. The tabulation of the final set of respondents (in terms o
d
M – Male
I – Illiterate
Total Samples surveyed 663 Total Samples planned 663
n
su
th
in
100

Section II: Survey Methodology
earlier, the sampling was done through stratified random sampling method
les – literates and illiterates.
As mentioned
and sample size of 663 was arrived at. The sample size for each ward was based on the
break-up made for males and fema
Survey Map
Fig.4-1 shows the map of the Zones/Wards covered by the Chennai Corporation. The
rvey was held within this area.
nt
su
Survey Instrume
The Survey instrument (questionnaire) that was used for the survey is given in Annex-1 at
the end of this thesis.
Survey process
About 150 respondents covering all the 10 zones were covered by the researcher. The
balance respondents were covered by ten students of Vivekananda College. Based on the
experience of the researcher, structured training was given to the students during June-July
009. Operating procedures were established for ensuring good quality data, as every day
were scrutinized and in case of any discrepancies they were corrected in
2
the survey forms
the next few days by contacting the respondents. However there were less than 25 such
cases.
Pilot test survey
A pilot test survey was done with a preliminary questionnaire. A sample of 70 respondents
ey covered the male/female and
was used. This was not a stratified random sample; this was a convenient sample.
However, care was taken to see that the surv
101

literate/illiterate combinations. Some of the major findings (with regard to survey
methodology) were:
• The respondents would not give more than 15 to 20 minutes for the survey. The
survey instrument was accordingly modified;
Tamil to give explanation to the
respondents;
• Arrangement/sequencing of the questions had to be changed as the respondents
would prefer certain warm up questions and then take up serious questions.
Accordingly the instrument was modified.
• The respondents preferred to choose from alternatives rather than answering open
ended questions. Based on the responses from the pilot survey, the instruments
were revised to contain more of structured options, rather than open ended
questions;
• With regard to certain concepts like accountability, transparency, service delivery,
etc. proper examples needed to be given. The surveyors were trained and were
given a sheet containing major points in
102

Figure 4-1: The Zone/Ward Map – Chennai Corporation
103
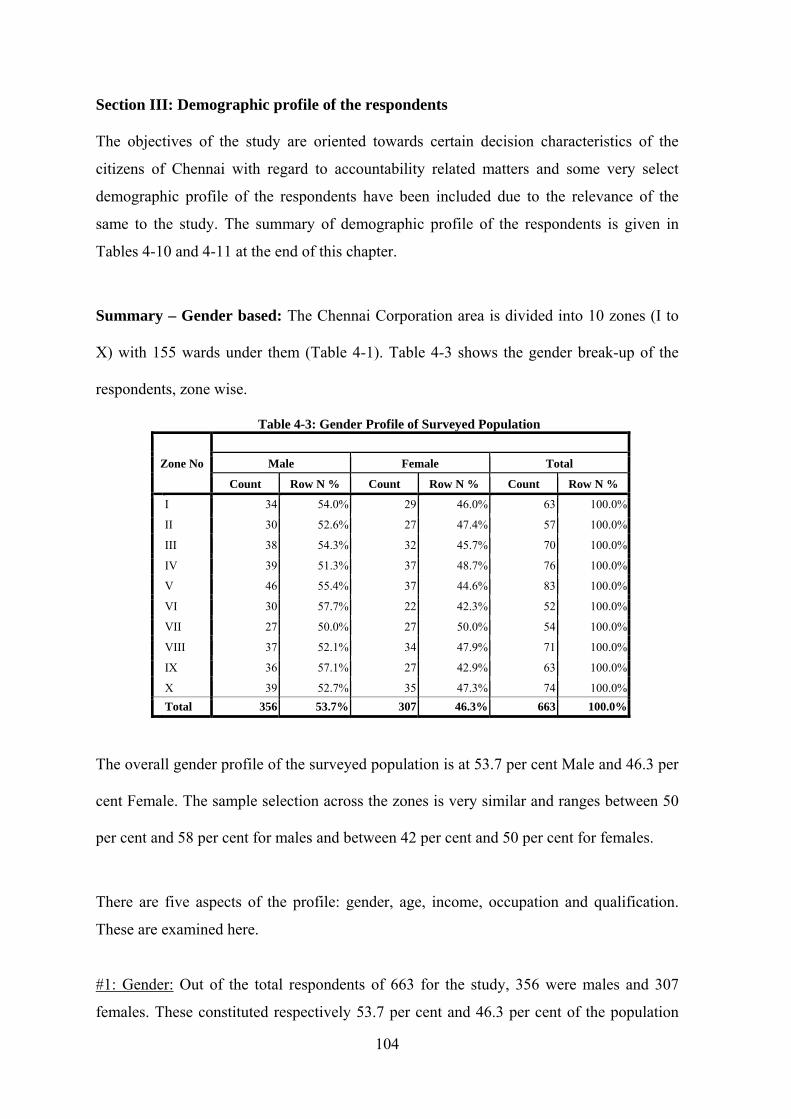
Section III: Demographic profile of the respondents
The objectives of the study are oriented towards certain decision characteristics of the
citizens of Chennai with regard to accountability related matters and some very select
demographic profile of the respondents have been included due to the relevance of the
same to the study. The summary of demographic profile of the respondents is given in
Tables 4-10 and 4-11 at the end of this chapter.
Summary – Gender based: The Chennai Corporation area is divided into 10 zones (I to
X) with 155 wards under them (Table 4-1). Table 4-3 shows the gender break-up of the
respondents, zone wise.
Table 4-3: Gender Profile of Surveyed Population
Zone No
Male Female Total
Count Row N % Count Row N % Count Row N %
I 34 54.0% 29 46.0% 63 100.0%
II 30 52.6% 27 47.4% 57 100.0%
III 38 54.3% 32 45.7% 70 100.0%
IV 39 51.3% 37 48.7% 76 100.0%
V 46 55.4% 37 44.6% 83 100.0%
VI 30 57.7% 22 42.3% 52 100.0%
VII 27 50.0% 27 50.0% 54 100.0%
VIII 37 52.1% 34 47.9% 71 100.0%
IX 36 57.1% 27 42.9% 63 100.0%
X 39 52.7% 35 47.3% 74 100.0% Total 356 53.7% 307 46.3% 663 100.0%
The overall gender profile of the surveyed population is at 53.7 per cent Male and 46.3 per
cent Female. The sample selection across the zones is very similar and ranges between 50
per cent and 58 per cent for males and between 42 per cent and 50 per cent for females.
There are five aspects of the profile: gender, age, income, occupation and qualification.
These are examined here.
#1: Gender: Out of the total respondents of 663 for the study, 356 were males and 307
females. These constituted respectively 53.7 per cent and 46.3 per cent of the population
104

respectively. This is very near the 2001 census break up of 51.1 per cent and 48.9 per cent
respectively. The p value for the above is 0.603 in a Chi-square test conducted to find out
the male:female ratio, was similar to that of the census 2001 ratio, and the hypothesis was
accepted. Hence, the sample taken for the survey is considered statistically representing
the population proportion.
Table 4-4: Gender Profile of Respondents
Classification Count N
Break-up N %
Male 356 53.7%Female 307 46.3%Total 663 100.0%
Source: Survey
#2: Age: The respondents have been chosen from the age group 19 and above. The basis
was that the respondents should be adults capable of casting their vote in the elections.
Based on the age the respondents were divided into five groups. The representation of
these five groups was: 19 to 24 years (17.5 per cent), 25 to 35 years (33.6 per cent), 36 to
45 years (26.8 per cent), 46 to 55 years (17.0 per cent) and above 55 years (5.0 per cent).
Since no particular analysis was based on the age profile of the respondents (by design) no
particular categorization has been made.
Table 4-5 : Age Profile of Respondents
Classification Count N Break-up
N %
19 to 25 years 116 17.5%
26 to 35 years 223 33.6%
36 to 45 years 178 26.8%
46 to 55 years 113 17.0%
About 55 years 33 5.0%
Total 663 100.0%
105

# 3: Income: 31 per cent of the respondents did not have any income. This includes
persons who are unemployed, retired persons without any pension, students, housewives,
etc. Only 8.3 per cent of the respondents earned less than Rs.5,000 per month. The persons
who earned between Rs.5,000 and Rs.10,000 per month, and Rs.10,000 to Rs.15,000 per
month represented 17.6 per cent and 19.9 per cent respectively of the respondents.
Rs.15,000 to Rs.25,000 income earners were at 13.6 per cent and those who earned above
Rs.25,000 per month represented 9.2 per cent of the respondents.
Table 4-6: Income Profile of Respondents
Classification Count N Break-up %
No Income 208 31.4%
Less than Rs.5,000 55 8.3%
Rs.5,000 to 10,000 117 17.6%
Rs.10,000 to 15,000 132 19.9%
Rs.15,000 to 25,000 90 13.6%
Above Rs.25,000 61 9.2%
Total 663 100.0%
#4: Occupation: The employment profile of the sample shows that 7.7 per cent were from
the public and government sectors, 46.3 per cent from the private sector, 14.5 per cent
were self- employed, while the balance 31.5 per cent are represented by the unemployed.
The unemployed percentage correlates well with the non-earning category (discussed
under the income). However a detailed analysis of the data showed that the actual
percentage of the jobless is only 0.5 per cent of the respondents. The others under the
unemployed category were: students, retirees, housewives, etc.
106

Table 4-7: Occupation profile of Respondents
Classification Count N
Break-up %
Public Sector 51 7.7%
Private Sector 307 46.3%
Self Employed 96 14.5%
Unemployed 209 31.5%
Total 663 100.0%
#5: Qualification: Education profile of the respondents shows that 17.5 per cent of the
persons were uneducated. This category included a few persons who had not been to
school at all; those who could not continue even their primary education. 23.7 per cent had
been to school and have completed their primary or secondary education and could not
continue further. 40.1 per cent represented graduates, while 18.7 per cent was represented
by post-graduates and above and included those who were professionally qualified like
doctors and those with doctoral degrees.
Table 4-8 : Education profile of Respondents
Classification Count N Break-up %
Uneducated 116 17.5%
School 157 23.7%
Graduate 266 40.1%
PG & Above 124 18.7%
Total 663 100.0%
Limitations
The limitations in the survey could arise due to the following factors:
• Lack of understanding of the concept of governance and accountability by the
respondents;
107

• The background of the respondents varied from illiterate to PhD holders and
persons without any regular income to those who earn over Rs.25,000 a month.
This wide variation could have resulted in differences in interpretation;
• In general, there is very little awareness about various initiatives of the corporation
and what it does, across the citizens; and hence conveying the objectives of the
survey itself was found difficult
• Though many cooperated, it was very difficult to find persons who were willing to
share their ideas and spare adequate time to respond to the survey questionnaire.
Section IV: Validity and Reliability In order to validate the findings of this research, as a part of structured methodology
discussed in this chapter, validity of the research instrument and its reliability were also
tested.
VALIDITY: A test or scale is said to be valid if it measures what it purports to measure.
Validity can also be thought of as utility. A test does not possess “all-purpose” validity. A
test which is highly valid for one purpose or type of subject, may not be valid in yet
another situation. Since invalid test cannot serve any useful purpose, a researcher must
present some evidence, which provides confidence that a test measures precise
characteristics for which it was designed.
RELIABILITY: A test or scale is said to be reliable if it consistently yields the same
results when repeated measurements of a property are taken (of the same entities under
same conditions) i.e. the reliable tests are stable in whatever they measure and yield
comparable scores upon repeated administrations.
Methodology: The validity and reliability of the survey and the survey instrument was
tested by conducting retest procedures. A sample of 50 respondents selected at five (5) of
the ten (10) zones was made on a random basis. Out of these respondents 25 were re-
interviewed by the same (original) interviewer and 25 by a different interviewer. Also in
order to address the content validity, the services of experts were sought to rate the
questionnaire in a scale of 1 to 10.
108

109
Validity and reliability tests
In order to establish scientifically the reliability and validity of the research instrument and
the strength of the survey results, an evaluation was conducted to the extent possible. The
following validity and reliability tests were made:
• Validity
o Translation validity
Face
Content
Construct
o Criterion related validity
Concurrent
Convergent
• Reliability
o Inter-rater
o Test-retest
The details of the tests, the results and the interpretations thereon are given in Table-4-9.

Table: 4-9: Summary of validity and Reliability Tests Parameter Definition Test Variables Test result Inference Remarks 1. VALIDITY
1.1 Translation Validity 1.1.1 Face Validity Whether ‘on the face’ it
seems like good translation of the construct.
There is no particular test in this regard.
There are three constructs in this research: 1. ATA components
are related to each other (3 components).
2. EVLN components validation (4 components).
3. Preparedness of the citizens (2 factors).
The three components are highly correlated. The 4 components records all the possible options of citizens. The citizens knowledge and willingness to participate fairly bring out the real situation.
Hence it is inferred that there is the presence of the ‘face’ validity of the instrument and the survey, as they are able to address all the aspects of the constructs taken up for the research.
1.1.2 Content Validity The operationalization against the content domain is examined
This has been done based on the feedback of a panel of SIX experts
The variables were divided into five groups: A-T-A elements, Voice/Exit, Preparedness of citizens, Performance of the Corporation and general feedback of the citizens.
Table-4.12 gives the result of the Tabulation.
Content validity can be taken to be achieved to the extent of 80.3%, based on the average score given by the experts.
The scoring for the core aspects of ATA components and Voice-Exit components have been consistently high and uniform.
1.1.3 Construct Validity The extent to which the test may be able to measure a theoretical construct or trait.
This is measured along with reliability, discussed in point 2 below.
High degree of achievement of construct validity established.
Inter-correlation of important sections, and Cronbach’s alpha have all been high. Refer tables in Chapters 5 and 6.
1.2 Criterion-related Validity 1.2.1 Predictive Validity Ability to predict something
it should theoretically be able to predict
Not considered Not considered Not considered Not considered There is no constructs that are of predictable nature, though some
110
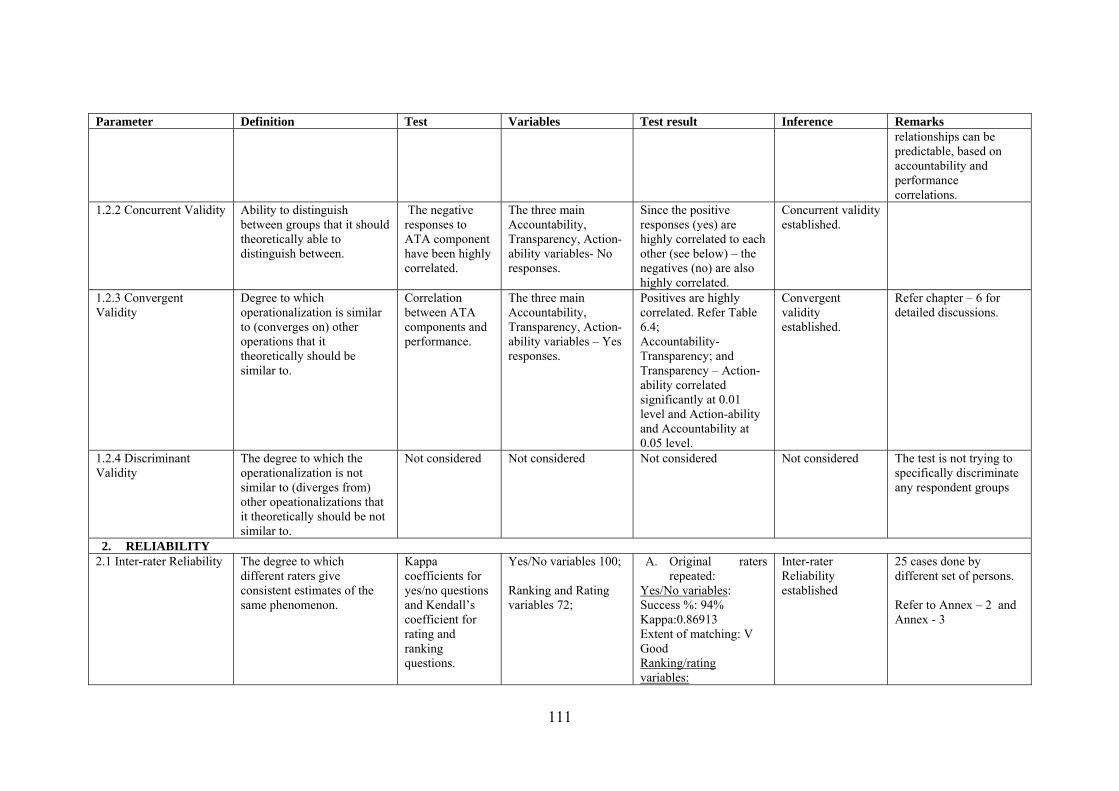
Parameter Definition Test Variables Test result Inference Remarks relationships can be predictable, based on accountability and performance correlations.
1.2.2 Concurrent Validity Ability to distinguish between groups that it should theoretically able to distinguish between.
The negative responses to ATA component have been highly correlated.
The three main Accountability, Transparency, Action-ability variables- No responses.
Since the positive responses (yes) are highly correlated to each other (see below) – the negatives (no) are also highly correlated.
Concurrent validity established.
1.2.3 Convergent Validity
Degree to which operationalization is similar to (converges on) other operations that it theoretically should be similar to.
Correlation between ATA components and performance.
The three main Accountability, Transparency, Action-ability variables – Yes responses.
Positives are highly correlated. Refer Table 6.4; Accountability-Transparency; and Transparency – Action-ability correlated significantly at 0.01 level and Action-ability and Accountability at 0.05 level.
Convergent validity established.
Refer chapter – 6 for detailed discussions.
1.2.4 Discriminant Validity
The degree to which the operationalization is not similar to (diverges from) other opeationalizations that it theoretically should be not similar to.
Not considered Not considered Not considered Not considered The test is not trying to specifically discriminate any respondent groups
2. RELIABILITY 2.1 Inter-rater Reliability The degree to which
different raters give consistent estimates of the same phenomenon.
Kappa coefficients for yes/no questions and Kendall’s coefficient for rating and ranking questions.
Yes/No variables 100; Ranking and Rating variables 72;
A. Original raters repeated:
Yes/No variables: Success %: 94% Kappa:0.86913 Extent of matching: V Good Ranking/rating variables:
Inter-rater Reliability established
25 cases done by different set of persons. Refer to Annex – 2 and Annex - 3
111

112
Parameter Definition Test Variables Test result Inference Remarks Kendall: 0.095812 Extent of matching: V Good B. New raters
replacing the old: Yes/No variables: Success %: 94% Kappa:0.90606 Extent of matching: V Good Ranking/rating variables: Kendall: 0.96076 Extent of matching: V Good
2.2 Test-retest Reliability Used to assess the consistency of a measure from one time to another.
Kappa coefficients for yes/no questions and Kendall’s coefficient for rating and ranking questions.
Yes/No variables 100; Ranking and Rating variables 72;
Yes/No variables: Success %: 93% Kappa:0.89328 Extent of matching: V Good Ranking/rating variables: Kendall: 0.096255 Extent of matching: V Good
Test-retest Reliability established
50 persons were retested. Refer Annex -4
2.3 Parallel Form Reliability
Used to assess the consistency of the results of two tests constructed in the same way from the same content domain.
Not considered Not considered Not considered Not considered Not applicable

Table 4-10: Summary of Demographic Variables (Count)
Demographic Variables Zone No
I II III IV V VI VII VIII IX X Total Count Count Count Count Count Count Count Count Count Count Count
GENDER Male 34 30 38 39 46 30 27 37 36 39 356 Female 29 27 32 37 37 22 27 34 27 35 307
Subtotal 63 57 70 76 83 52 54 71 63 74 663 AGE 19 to 24 years 12 11 21 14 17 9 5 6 9 12 116
25 to 35 years 25 21 14 25 16 16 30 37 13 26 223 36 to 45 years 16 14 19 12 23 16 10 25 16 27 178 46 to 55 years 7 11 13 15 23 9 6 2 19 8 113 About 55 years 3 0 3 10 4 2 3 1 6 1 33
Subtotal 63 57 70 76 83 52 54 71 63 74 663 MONTHLY INCOME
No Income 16 15 38 28 25 15 13 13 18 27 208 Less than Rs.5,000
9 5 5 8 6 1 3 7 7 4 55
Rs.5,000 to 10,000
19 16 10 7 14 8 18 10 11 4 117
Rs.10,000 to 15,000
15 13 10 15 10 9 13 22 11 14 132
Rs.15,000 to 25,000
4 5 5 11 17 8 5 8 10 17 90
Above Rs.25,000 0 3 2 7 11 11 2 11 6 8 61 Subtotal 63 57 70 76 83 52 54 71 63 74 663
OCCUPATION Public Sector 6 0 3 9 6 8 9 7 3 0 51 Private Sector 37 30 19 28 37 24 29 40 27 36 307 Self Employed 7 11 12 14 10 5 2 10 14 11 96 Unemployed 13 16 36 25 30 15 14 14 19 27 209
Subtotal 63 57 70 76 83 52 54 71 63 74 663 QUALIFICATION Uneducated 16 13 14 14 11 12 8 8 9 11 116
School 17 19 20 18 15 11 11 14 14 18 157 Graduate 23 23 30 18 35 19 27 36 22 33 266 PG&Above 7 2 6 26 22 10 8 13 18 12 124
Subtotal 63 57 70 76 83 52 54 71 63 74 663
113
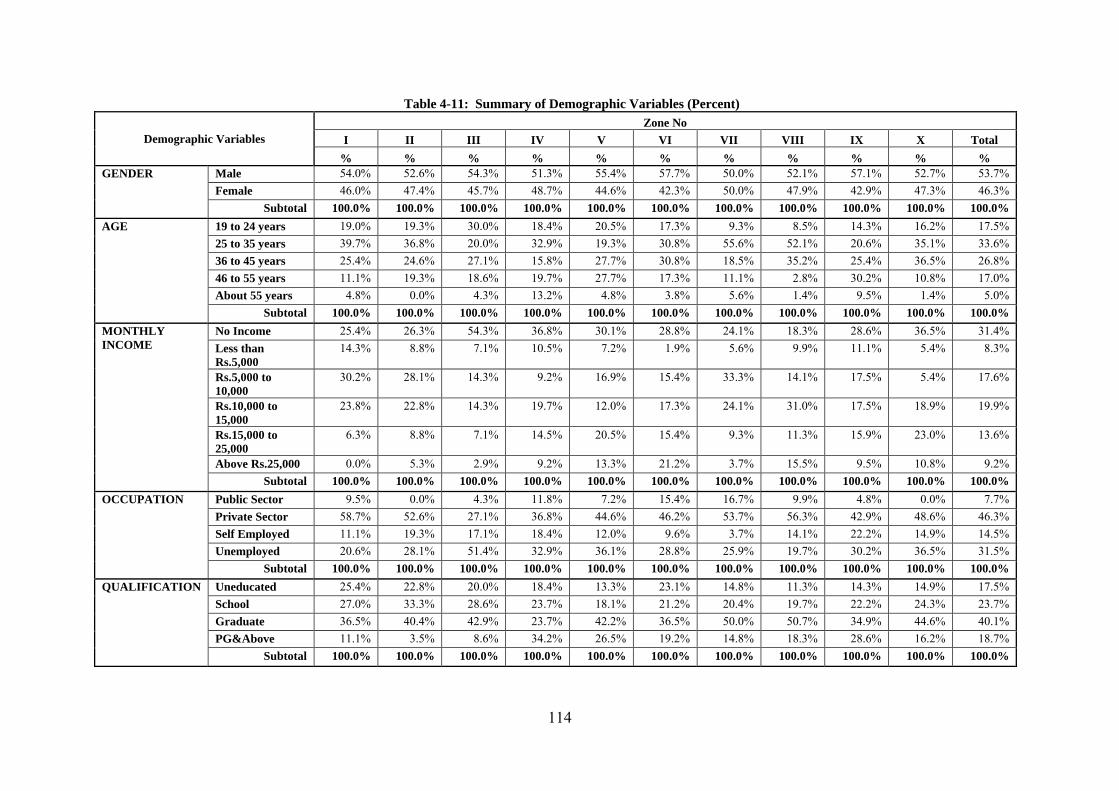
Table 4-11: Summary of Demographic Variables (Percent)
Demographic Variables Zone No
I II III IV V VI VII VIII IX X Total % % % % % % % % % % %
GENDER Male 54.0% 52.6% 54.3% 51.3% 55.4% 57.7% 50.0% 52.1% 57.1% 52.7% 53.7% Female 46.0% 47.4% 45.7% 48.7% 44.6% 42.3% 50.0% 47.9% 42.9% 47.3% 46.3%
Subtotal 100.0% 100.0% 100.0% 100.0% 100.0% 100.0% 100.0% 100.0% 100.0% 100.0% 100.0% AGE 19 to 24 years 19.0% 19.3% 30.0% 18.4% 20.5% 17.3% 9.3% 8.5% 14.3% 16.2% 17.5%
25 to 35 years 39.7% 36.8% 20.0% 32.9% 19.3% 30.8% 55.6% 52.1% 20.6% 35.1% 33.6% 36 to 45 years 25.4% 24.6% 27.1% 15.8% 27.7% 30.8% 18.5% 35.2% 25.4% 36.5% 26.8% 46 to 55 years 11.1% 19.3% 18.6% 19.7% 27.7% 17.3% 11.1% 2.8% 30.2% 10.8% 17.0% About 55 years 4.8% 0.0% 4.3% 13.2% 4.8% 3.8% 5.6% 1.4% 9.5% 1.4% 5.0%
Subtotal 100.0% 100.0% 100.0% 100.0% 100.0% 100.0% 100.0% 100.0% 100.0% 100.0% 100.0% MONTHLY INCOME
No Income 25.4% 26.3% 54.3% 36.8% 30.1% 28.8% 24.1% 18.3% 28.6% 36.5% 31.4% Less than Rs.5,000
14.3% 8.8% 7.1% 10.5% 7.2% 1.9% 5.6% 9.9% 11.1% 5.4% 8.3%
Rs.5,000 to 10,000
30.2% 28.1% 14.3% 9.2% 16.9% 15.4% 33.3% 14.1% 17.5% 5.4% 17.6%
Rs.10,000 to 15,000
23.8% 22.8% 14.3% 19.7% 12.0% 17.3% 24.1% 31.0% 17.5% 18.9% 19.9%
Rs.15,000 to 25,000
6.3% 8.8% 7.1% 14.5% 20.5% 15.4% 9.3% 11.3% 15.9% 23.0% 13.6%
Above Rs.25,000 0.0% 5.3% 2.9% 9.2% 13.3% 21.2% 3.7% 15.5% 9.5% 10.8% 9.2% Subtotal 100.0% 100.0% 100.0% 100.0% 100.0% 100.0% 100.0% 100.0% 100.0% 100.0% 100.0%
OCCUPATION Public Sector 9.5% 0.0% 4.3% 11.8% 7.2% 15.4% 16.7% 9.9% 4.8% 0.0% 7.7% Private Sector 58.7% 52.6% 27.1% 36.8% 44.6% 46.2% 53.7% 56.3% 42.9% 48.6% 46.3% Self Employed 11.1% 19.3% 17.1% 18.4% 12.0% 9.6% 3.7% 14.1% 22.2% 14.9% 14.5% Unemployed 20.6% 28.1% 51.4% 32.9% 36.1% 28.8% 25.9% 19.7% 30.2% 36.5% 31.5%
Subtotal 100.0% 100.0% 100.0% 100.0% 100.0% 100.0% 100.0% 100.0% 100.0% 100.0% 100.0% QUALIFICATION Uneducated 25.4% 22.8% 20.0% 18.4% 13.3% 23.1% 14.8% 11.3% 14.3% 14.9% 17.5%
School 27.0% 33.3% 28.6% 23.7% 18.1% 21.2% 20.4% 19.7% 22.2% 24.3% 23.7% Graduate 36.5% 40.4% 42.9% 23.7% 42.2% 36.5% 50.0% 50.7% 34.9% 44.6% 40.1% PG&Above 11.1% 3.5% 8.6% 34.2% 26.5% 19.2% 14.8% 18.3% 28.6% 16.2% 18.7%
Subtotal 100.0% 100.0% 100.0% 100.0% 100.0% 100.0% 100.0% 100.0% 100.0% 100.0% 100.0%
114

115
Table: 4-12: Validity – Content Validity – Feedback of Experts
Name: S.Sathyamoorthy S.Radhakrishnan Raj Cherubal S.Pitchai S.S.Moogle K.Skandan Designation: Former Deputy
Controller & Audit General of India
Economist & Academician; Trustee
Coordinator Retd. Additional Sec Finance ;
Chief Accounts Officer
Joint Secretary
Organization: Ex-Govt of India and presently Advisor & Consultant
Institute of Economic Education
Janaagraha (Citizen organization on Urban Issues)
Govt of Tamil Nadu
Bangalore City Corporation
Govt of India
Involvement in urban Sector: Auditor in the Public Sector & organized the preparation of National Municipal Accounting Manual
Minimal but not zero; conducts public studies through the Institute
Full time involvement in (urban) public policy issues
Was handling Finance of Chennai Corporation; involved in urban finance of the state of Tamil Nadu
Day to day involvement in Urban reforms and Finance in Bangalore City Corporation
Was in Finance Commission; was involved deeply in Urban Sector
Objective/Construct Question Reference Your Assessment in a Scale of: 1 to 10 (1 Highly Irrelevant - 10 Highly Relevant)
Average
1. Accountability, Transparency and Action-ability are correlated
18 – 22 a – 26 a
8 8 10 8 10 8 8.67 Reasons and support for the above: 19, 20,21, 22 b, 22c, 26 b, 26 c, 26 d, 27, 28
2. Reaction of the people (voice/exit) to various services by the Corporation
25 7 8 10 8 10 7 8.33 Support and validation
through 15 3. Preparedness of the citizens
through knowledge and willingness to participate
Knowledge: 7 a, 11, 12, 24
6 8 10 8 10 5 7.83 Participation: 29 a, 23 a Reasons and support: 16, 7c, 23 b, 29 b, 29 c, 30
4. Performance of the Corporation 13 a, 14 a
6 8 10 7 9 8 8.0 Reasons and support: 13b, 14 b, 14 c,
5. General feedback from the citizens
17, 31, 32 6 8 8 7 7 8 7.33
Average 6.6 8.0 9.6 7.6 9.2 7.2 8.03

Chapter - 5
ைணனலம் ஆக்கம் த உம் விைனநலம்
ேவண்டிய எல்லாம் த ம்
The efficacy of support will yield (only) wealth; but the efficacy of action will yield all that is desired. Thirukkural – 651
He should establish (each) department with many heads and without permanency (of tenure of office). Arthashastra – 2.9.31
116

Chapter – 5: Analysis of Survey Findings
This Chapter is presented in five sections. Section I deals with the framework for analysis.
Section II discusses on the general perspectives on the analysis taken up for the study,
Section III on the ATA Model (Accountability, Transparency, Action-ability), Section IV on
the EVLN Model (Exit, Voice, Loyalty, Neglect), and Section V on the accountability
preparedness of the citizens. The analysis is based on the demand perspectives of
accountability related issues taken up in this research.
Section I: Framework for Analysis
The framework for analysis provides the basis for the planned research and also the
methodology for analysis of various issues that come up during the research. Fig.5.1
summarises various components of the framework.
Figure 5-1: Framework for Analysis
The framework given shows four main aspects:
• Research components: the research components consist of three themes taken up for
the research: ATA aspects, the EVLN aspects and the Preparedness aspects. The
analysis of this study basically surrounds these three elements;
117

• Performance: For the purpose of this research two aspects of the performance i.e.
working of the Corporation and service delivery are linked to the research
components. This means that for various aspects discussed, the performance of the
Corporation is taken in to consideration. This is to make the research field oriented
and rigorous;
• The links: Two links between performance and the research criteria have been
provided.
o Comparison link is to enable the comparison of performance and service
delivery aspects to various research variables and hence acts from an inputs
perspective;
o Research Findings link is expected to provide inputs for improving the
accountability related aspects so that there is an impact on the performance of
the Corporation.
With this framework, the entire survey is analysed in the following sections and in the next
chapter.
Section II: General Perspective of the Analysis
This demand side accountability study focuses on three major aspects:
• Aspect #1: Accountability per se based on ATA Model
• Aspect #2: Options for citizens based on EVLN Model
• Aspect #3: Preparedness for accountability based on knowledge base of citizens
Aspect #1: Accountability aspects: These focus on aspects related to accountability and
transparency prevalent in the urban sector. Hence the study is based on the urban population.
The study looks at the demand side of the accountability in the urban sector. This would
indicate that the study is based on the opinions and impressions of the citizens (who actually
demand services from the third tier of governance) on the Corporation of Chennai. Hence the
study looks at some of the key elements of the said three aspects through citizens’
perceptions and opinions about:
• Performance/working
• Service delivery
118
• Accountability
• Transparency
• Action-ability
The ATA Model: Accountability-Transparency-Action-ability model developed during this
research is used as the base for analysis. The above listed items (variables) are collectively
called as “accountability” for the purpose of the study; and sometimes referred to as
‘accountability related’ issues. Each of the above aspects is supported by relevant data and
analysis, subject to the limitations of the survey. All the analyses in this regard are done
through the ATA Model discussed earlier in this study.
Aspect #2: Options for the citizens: Another major area of this research is about the options
available for the citizens in case the services provided by the Corporation are not up to the
mark; and the citizens’ approach towards the same. These options, as per the review of
literature made in this study, are generally referred to as EVLN or Exit-Voice-Loyalty-
Neglect options. This is used as the framework for analysis of options available for the
citizens.
Aspect #3: Preparedness for Accountability: This is a major contribution arising out of the
study and was recognized during the course of this research. Two aspects have emerged as
important in this regard: one, the knowledge of the citizens about the Corporation and its
functions – (external aspect) and two, the preparedness to participate in the programmes of
the Corporation – (internal aspect). Have the citizens really understood the issues relating to
urban accountability, and have they recognized their own role in this regard? is the basic
question with which this research looks at some analysis.
The results of the survey are analysed from these three aspects. All the above aspects are
hypothesized (later in this study) for the purpose of statistically establishing the issues and
relationships between the variables taken up for the study. These provide an update on the
current situation prevailing in the urban sector of the economy. Such an understanding also
could help in generalizing the behavior (of the population) based on the sample taken up for
the research.
119

Section III: Analysis around the ATA Model
Aspect #1: Accountability Aspects through ATA Model
The accountability study examines 5 ingredients (referred to as ‘accountability related
aspects’). These five ingredients can be logically grouped in to two parts:
• performance and service delivery,
• accountability/transparency/action-ability.
Before getting into the details of accountability, two questions on the performance of the
Corporation (the way it works), need to be addressed: Do the citizens feel that the
Corporation is working fine? and Do the citizens feel that there is proper service delivery by
the Corporation?
These two leading questions are examined through the survey and their pattern to various
aspects of accountability is examined in order to link the relationship between performance
and accountability.
Q1: Performance: Do the citizens feel that the Corporation is working fine?
Table 5-1: Working of the Corporation Is the Corporation of Chennai working fine?
Frequency Percent Valid No 410 61.8
Yes 253 38.2 Total 663 100
Source: Survey output
As given in the Table-5-1, 61.8 per cent of the respondents say that the Corporation of
Chennai is not working fine. This clearly indicates that the citizens are not happy with the
performance of the Corporation.
120

Table 5-2: Reasons for Corporation: Not working fine and Working fine
Corporation Not Working fine- Reasons Frequency Percent I. Services issues
a. Drainage/sewerage not maintained 49 12.5 b. Road maintenance not done 105 26.8 c. Garbage cleaning not done 50 12.8
Sub-total I 204 52.0 II. Infrastructure issues
a. Inadequate infra 30 7.7 b. Street light not okay 11 2.8
Sub-total II 41 10.5 III. Management issues
a. Corruption 33 8.4 b. Bad behaviour of employees 15 3.8 c. Bad work culture 33 8.4 d. Rules not followed 12 3.1 e. No Management/Admin 31 7.9 f. Other Reasons 23 5.9
Sub-total III 147 37.5 Total 392 100 Total saying Corporation is Not working fine 410 Percentage giving reasons why? 95.6%
Corporation Working fine – Reasons Frequency Percent I. Services issues a. Proper Drainage maintenance 22 10.6 b. Proper Road Maintenance 42 20.2 c. Proper Garbage cleaning 56 26.9 d. Good Maintenance 41 19.7
Sub-total I 161 77.4 II. Management issues
a. Good Management/Admin 31 14.9 b. Other Positive reasons 16 7.7
Sub-total II 47 22.6 Total 208 100.0 Total saying Corporation is working fine 253 Percentage giving reasons why? 82.2% Total opined 600 90% Total respondents 663 Source: Compiled from the Survey
121

Out of the total respondents (663), about 90 per cent of them have given their opinion about
why they feel that the Corporation is working fine or not. Table 5-2 provides the complete
details in this regard99.
• Out of the 410 person who stated that the Corporation is not working fine, 95.6 per
cent - 392 persons have provided reasons for why they say so. About 52.0 per cent of
the reasons relate to various service delivery aspects, 10.5 per cent deal with
infrastructure aspects and 37.5 per cent deal with management and human resource
related aspects;
• Out of the 253 persons who were in favour of the Corporation, only 82.2 per cent
(208) justified supporting their view. 77.4 per cent of them opined that the services
provided are good and 22.6 per cent attributed their support to management related
reasons. There were no points on the infrastructure aspects.
Q2: Do the citizens feel that there is proper service delivery by the Corporation?
The issue discussed was about the overall opinion or the feeling the citizens have about the
working of the Corporation. Another query was on the ‘service delivery’ aspect. The
objective was to understand about the services delivered by the Corporation and the citizens’
opinion and evaluation of the same.
Table 5-3: Service Delivery by the Corporation
Do you think there is proper delivery of various services by Corporation?
Frequency Percent Valid No 422 63.7
Yes 241 36.3 Total 663 100
Source: Survey output
The respondents were further stringent in their opinion about the service delivery as 63.7 per
cent opined that there is no proper service delivery by the Corporation. This is 1.9 per cent
less than those opined that the Corporation is working fine. Here, the term service delivery
refers to various services provided by the Corporation from removal of garbage in the street
to services delivered in the Corporation hospitals or schools. 99 The reasons attributed by the respondents were not prompted; the respondents were not asked to choose from a set of reasons. The reasons they attributed for their opinion were taken and grouped as shown in the Table 5.2.
122

Table 5-4: Citizen’s evaluation of the services delivered by the Corporation
Services Delivered
Totally Unsatisfied
Unsatisfied Undecided Satisfied Totally Satisfied
Total Mean Score Rank
(1) (2) (3) (4) (5) (6) (7) (8) (9)
1. Garbage Removal
188 150 37 272 16 663 2.665 4 28% 23% 6% 41% 2% 100% 2. Road maintenance
142 201 59 237 24 663 2.698 3 21% 30% 9% 36% 4% 100% 3. Cleaning of drains
176 196 54 218 19 663 2.560 6 27% 30% 8% 33% 3% 100% 4. Issue of birth/death certificate
96 86 261 203 17 663 2.938 1 14% 13% 39% 31% 3%
100% 5. Corporation Schools
131 147 174 199 12 663 2.719 2 20% 22% 26% 30% 2% 100% 6.Corporation Hospitals
140 161 169 184 9 663 2.640 5 21% 24% 25% 28% 1% 100%
Overall 873 941 754 1313 97 3978
2.703 Unsat <-->
Undec 22% 24% 19% 33% 2%
100% Cronbach's Alpha 0.901 Source: Compiled from Survey Output
The summary of the evaluation of some of the key services delivered by the Corporation is
shown in Table 5-4. The analysis of the same shows that:
• All the respondents (100 per cent) have rated the six important services provided by
the Corporation;
• According to the overall scores (summation of scores for all the six services), it is
found that 46 per cent of the scores related to totally unsatisfied (22 per cent) and
unsatisfied (24 per cent), and is higher than satisfied (33 per cent) and fully satisfied
(2 per cent) totaling to 35 per cent. The 19 per cent of undecided classification has
been taken as neutral. This clearly indicates that the services provided by the
Corporation do not seem to satisfy a major portion of the citizens;
• The satisfied portion of 35 per cent is just less than the 36.3 per cent of the persons
who have said that they feel that the Corporation is delivering proper services (Table
5.8);
• With the help of mean ranking these six services were evaluated, the result being:
o Rank #1: Issue of birth and death certificates
o Rank #2: Corporation Schools
o Rank #3: Road maintenance
123

o Rank #4: Garbage removal
o Rank #5: Corporation Hospital
o Rank #6: Cleaning of drains
• Hence cleaning of the drains seems to be the major issue for the citizens. The recent
introduction of on-line issue of birth and death certificate could have resulted in the
best rating for the same;
• Considering the five point Likert’s scale from Totally Unsatisfied (1) to Fully
Satisfied (5), the overall average score of 2.703 classifies the net result of the analysis
as between 2 and 3 i.e. between Unsatisfactory and Undecided. Out of the six
services, only two have scores above the average indicating an overall level of
dissatisfaction;
• Cronbach’s alpha of 0.901 is high and shows uni-dimensionality of the service factor
and high reliability of the service factor. Table 5-5: Reasons for lack of proper Service Delivery?
Reasons Rank #1 Rank #2 Rank #3 Rank #4 Rank #5 Total Score Rank
1.Lack of leadership
97 97 99 68 58 419 2.745 2 23% 23% 24% 16% 14% 100%
2.Quality of people
86 104 96 82 51 419 2.780 3 21% 25% 23% 20% 12% 100%
3.Political influence
90 84 88 88 69 419 2.909 4 21% 20% 21% 21% 16% 100%
4.Corruption 118 86 65 113 37 419
2.678 1 28% 21% 16% 27% 9% 100%
5.Lack of systems and procedures
28 48 71 68 204 419 3.888 5 7% 11% 17% 16% 49% 100%
Average Score 3.000 4
5
Kendall's W = 0.101 Source: Compiled from Survey Output
The respondents, who said the Corporation was not providing desired level of service
delivery (persons who said ‘No’ – refer Table 5-3), were asked for the reasons for their
opinion. They were also asked to rank the reasons in the order of seriousness according to
them. The results of the responses are given in Table 5-5.
124

• Out of the 422 persons who said ‘No’ in Table 5-3 (indicating that the Corporation
was not providing proper service delivery) 419 (99.3 per cent) ranked various
reasons;
• The mean scores have been taken for the purpose of ranking;
• The rankings are as follows:
o Rank #1: Corruption
o Rank #2: Lack of leadership
o Rank #3: Quality of people
o Rank #4: Political influence
o Rank #5: Lack of systems and procedures
• Corruption seems to be the major issue for the lack of proper service delivery by the
Corporation. Human resource aspects like lack of leadership and inadequate quality
of people are ranked next. However there is quite a gap in the score between the
political influence ranked fourth and the lack of systems and procedures ranked last;
• The average score for all the five taken together is 3.000 and would find a place
between the 4th and 5th ranks, indicating that the overall ranking is quite low;
• A very low Kendall’s W (0.101), indicates a very low concordance or association in
the way the respondents ranked.
Examination of the A-T-A Model
Accountability
Having discussed the working of the Corporation, and also having done an evaluation of its
service delivery, the study looks at the opinion of the citizens on ‘whether the Corporation is
acting in an accountable manner?’ This question is the core of the research. What is the
opinion of the citizens, why do they say so and according to them, who is actually
accountable in the Corporation? are the issues that are examined.
Table 5-6: How Accountable is Chennai Corporation Do you think Chennai Corporation is acting in an
accountable manner towards citizens?
Frequency Percent Valid No 352 53.1
Yes 311 46.9 Total 663 100
Source: Survey output
125

According to the survey, 53.1 per cent of the citizens feel that the Corporation is not acting in
an accountable manner towards the citizens. Only 46.9 per cent feel that the Corporation is
behaving in an accountable manner. This opinion on the accountability of the Corporation is
different from the citizens’ opinion on: (a) whether the Corporation is working fine (No -
61.8 per cent - Table 5-1) and (b) whether there is proper services delivery (No – 63.7 per
cent - Table 5-3). This indicates that many of the respondents were not happy with the
services provided by the Corporation feel that the Corporation is not acting in an accountable
manner.
Table 5-7: Relationship between Accountability - Working and Service delivery
Do you think chennai corporation is acting in an accountable manner towards citizens?
No Yes Total
Count Column
N % Row N
% Count Column
N % Row N
% Count Column
N % Row N
% According to you, is the Corporation of Chennai working fine?
No 294 83.5% 71.7% 116 37.3% 28.3% 410 61.8% 100.0%
Yes 58 16.5% 22.9% 195 62.7% 77.1% 253 38.2% 100.0%
Total 352 100.0% 53.1% 311 100.0% 46.9% 663 100.0% 100.0%
Do you think there is proper delivery of various services by Corporation?
No 287 81.5% 68.0% 135 43.4% 32.0% 422 63.7% 100.0%
Yes 65 18.5% 27.0% 176 56.6% 73.0% 241 36.3% 100.0%
Total 352 100.0% 53.1% 311 100.0% 46.9% 663 100.0% 100.0%
Source: Compiled from Survey Output
Table 5-7 clearly brings out the relationship between the variables. The analysis shows that:
• Of the 410 respondents who were not satisfied with the working of the Corporation
(by responding ‘No’), 28.3 per cent have said that the Corporation is working in an
accountable manner;
• Of the 422 respondent who said the services delivery of the Corporation was not up to
the mark (by responding ‘No’), 32 per cent have said that the Corporation is working
in an accountable manner;
• Of the 253 respondents who were satisfied with the working of the Corporation (by
saying ‘Yes’), 16.5 per cent of them have opined that the Corporation was not
working in an accountable manner;
126

• Of the 241 respondents who were happy with the service delivery of the people (by
saying ‘Yes’), 18.5 per cent have felt that the Corporation is not acting in an
accountable manner;
• Hence the respondents have been quite independent in their opinion.
The significance of the relationship was found out through statistical analysis, as shown in
Table 5-8.
Table 5-8: Analysis of the relationships: Accountability - Working and Service Delivery
A. Correlation Tests
Working of the
Corporation
Service delivery
Accountability
Working of the Corporation
Phi Coefficient 1 .542** .475** Sig. (2-tailed) .000 .000 N 663 663 663
Service delivery Phi Coefficient .542** 1 .396** Sig. (2-tailed) .000 .000 N 663 663 663
Accountability Phi Coefficient .475** .396** 1 Sig. (2-tailed) .000 .000 N 663 663 663
**. Correlation is significant at the 0.01 level (2-tailed). B. Chi-Square Tests
Do you think chennai corporation is acting in an accountable manner
towards citizens? According to you, is the Corporation of Chennai working fine?
Chi-square 149.500 Df 1 Sig. .000*
Do you think there is proper delivery of various services by Corporation?
Chi-square 103.735Df 1Sig. .000*
*. The Chi-square statistic is significant at the 0.05 level. Source: Compiled from Survey Output
The statistical analyses of the relationships show that both the correlation through the high
Phi coefficient (significant at 0.01 level) and the relationship between the variables through
Chi-square values (significant at 0.05 level), establish the relationship stating that
accountability is strongly related to both working of the Corporation and its service delivery.
The null hypothesis that there is no correlation between the variable (ATA) is rejected with
0.000 p-value.
127

Having established the relationship between the three variables of working, service delivery
and accountability, the study looked at the perception of respondents as to whom they hold to
account in the Corporation. Accountability is always linked to one or a set of persons who
is/are expected to deliver the services and be answerable to the citizens. The respondents
ranked the personnel of the Corporation with regard to whom they hold as accountable. The
results are shown in Table 5-9.
Table 5-9: Who is accountable in the Corporation?
Designation Rank
#1 Rank
#2 Rank
#3 Rank
#4 Total Mean
Score Rank
1. Mayor 167 206 193 88 654
2.309 3 26% 31% 30% 13% 100%
2. Commissioner 202 231 137 84 654
2.157 1 31% 35% 21% 13% 100%
3. Elected representative 238 126 190 100 654
2.232 2 36% 19% 29% 15% 100%
4. Employees of Corporation 47 91 134 382 654
3.301 4 7% 14% 20% 58% 100%
Kendall's W = 0.173 Source: Compiled from Survey output
Most of the respondents (654 out of the 663 respondents) i.e. 98.3 per cent have identified
and ranked the accountable persons. The analysis of the ranking shows that:
• The Commissioner is ranked first, indicating that the operational head is considered
most important;
• The elected representatives are ranked the next, as the person is nearest to the citizens;
• Mayor ranks only the third, possibly due to his role just as a policy maker;
• The respondents have ranked the employees of the Corporation the last.
Key points arising out of the analysis are:
• The stress on the accountability seems to be on the operational aspects - doing
operations properly with support from and monitoring by the operational chief i.e. the
Commissioner;
• This could have been due to the feeling that, if from higher levels the operational
persons are held responsible for their work and made accountable, they would
perform better.
128

The reasons as to why the Corporation (its employees) is (are) not acting in an accountable
manner was examined. The respondents ranked the various reasons underlying the lack of
accountability. Table 5-10 provides the tabulation of the results.
Table 5-10: Reasons for lack of accountability
Reasons for lack of accountability
Rank#1 Rank#2 Rank#3 Rank#4 Rank#5 Rank#6 Rank#7 Total Mean Score
Rank
1. Not bothered about the city or citizens
137 219 105 63 55 31 46 656 2.936 2 21% 33% 16% 10% 8% 5% 7% 100%
2. Bothered about their gains
248 126 97 59 60 40 26 656 2.666 1 38% 19% 15% 9% 9% 6% 4% 100%
3. Not properly instructed/trained
111 86 119 131 84 81 44 656 3.625 3 17% 13% 18% 20% 13% 12% 7% 100%
4. Not committed 82 79 115 138 87 73 82 656
3.939 4 13% 12% 18% 21% 13% 11% 13% 100%
5. They actually do not know what to do
35 63 91 90 148 128 101 656 4.586 5 5% 10% 14% 14% 23% 20% 15% 100%
6. Rules not strict to punish guilty
25 44 76 101 113 188 109 656 4.880 6 4% 7% 12% 15% 17% 29% 17% 100%
7. No public scrutiny of performance
18 39 53 74 109 115 248 656 5.368 7 3% 6% 8% 11% 17% 18% 38% 100%
Kendall's W = 0.216
Source: Compiled from Survey Output
The analysis of the reasons for lack of accountability, based on mean scores, shows the
following ranking pattern:
• Rank#1: Bothered about their gains
• Rank#2: Not bothered about the city or the citizens
• Rank#3: Not properly instructed or trained
• Rank#4: Not committed
• Rank#5: They actually do not know what to do
• Rank#6: Rules not strict to punish the guilty
• Rank#7: No public scrutiny of performance.
Some key observations in this regard are:
129

• The prioritization shows people centric reasons to be the main issues. The employees
are bothered about themselves (Rank#1) and not bothered about the citizens
(Rank#2);
• Those related to systems – in terms of punishing the guilty (Rank#6) or public
scrutiny (Rank#7) – seem to take a back seat. This augurs well with the low ranking
for systems and procedures (Table 5-10), indicating the consistency in the response.
An evaluation of the accountability relationship with the Corporation and within the
Corporation was examined. Table 5-11 provides an insight into this aspect.
Table 5-11: Accountability relationships with and in Corporation
Accountability Relationships
Very Low
Low Okay Good Very Good
Total Mean Score Rank
1. Do you think there is a system by which the Corporation employees are able to explain their conduct and justify the same
218 291 132 21 1 663
1.938 4 32.9% 43.9% 19.9% 3.2% 0.2% 100.0%
2. To what extent you think you can pose questions on the performance of people
229 232 170 30 2 663
2.011 3 34.5% 35.0% 25.6% 4.5% 0.3% 100.0%
3. To what extent are the mechanism to pass judgement on the conduct of persons who do not perform
215 255 159 30 4 663
2.024 2 32.4% 38.5% 24.0% 4.5% 0.6% 100.0%
4. To what extent you think guilty or wrong doers may face the due consequences
219 229 185 25 5 663
2.027 1 33.0% 34.5% 27.9% 3.8% 0.8% 100.0%
Overall 881 1007 646 106 12 2652 2.000 LOW 33.2% 38.0% 24.4% 4.0% 0.5% 100.0%
Source: Compiled from Survey Output
The scoring and ranking of various accountability relationships with and in the Corporation
show that:
• All the 663 (100 per cent) of the respondents have given their inputs;
• In the Likert Scale of Very Low (1) to Very Good (5), the average has been only at
2.000 indicating that on an average the assessment of the accountability relationship
is LOW;
• The respondents also feel that:
130

o There is no system by which the employees can explain their conduct and
justify the same – this option is with the least mean score (1.938 – Rank #4 -
weakest);
o The chance that the guilty or the wrong doers may get punished could be
relatively higher than the other alternatives given – with a mean score of
2.027 and Rank #1.
• The statistical analysis of the items show that:
o Cronbach’s alpha is high at 0.866, indicating a high consistency and reliability
in the items;
o ANOVA shows a F value of 4.917 rejecting the null hypothesis and
confirming that there is significant difference in the way the respondents
have scored the relationships;
o Single measure intra class correlation = 0.617, indicting the high uniformity in
the response.
It could be summarized that by properly monitoring and guiding the employees by the
accountable persons in the Corporation, the self-centric attitude of the employees could be
changed to make them more accountable. That is the reason why even as accountable
persons, the employees are ranked the last. The citizens opine that the responsibility for
accountability is at senior levels.
Transparency
Transparency is another key issue that has been taken for study. As discussed in the literature
survey, transparency is considered an integral part of accountability. In fact these two terms
are generally used together, and many a time used interchangeably. While accountability
makes an organization or a person answerable, transparency provides information on the
accountability. Only when there is information about the performance of an
organization/person, and such information is shared with the concerned stakeholders can the
accountability be monitored.
Corporation being an organization of the citizens should have transparent mechanisms for
providing information about its performance. As important stakeholders the citizens have a
right to the information. There are several detailed information about its accountability
available with the Corporation, which could be shared with all the stakeholders, the citizens
131

being the most important of them all. These information relate to the budget, plans, the
progress of various schemes, and so on.
Table 5-12: Transparency – Information about the Corporation
Information about the Schemes and Performance of the Corporation
Frequency Percent Valid No 481 72.5
Yes 182 27.5 Total 663 100
Source: Survey Output
According to 72.5 per cent of the respondents there is no information flow from the
Corporation, indicating that there is lack of transparency. Even the persons who stated that
the Corporation is acting in an accountable (Table 5.6 – 46.9 per cent) manner, have felt that
there is lack of required transparency.
Table 5-13: Relationship between Accountability and Transparency
Accountability
No Yes Total
Count Row N %
Column N % Count
Row N %
Column N % Count
Row N %
Column N %
Transparency No 296 61.5% 84.1% 185 38.5% 59.5% 481 100.0% 72.5%
Yes 56 30.8% 15.9% 126 69.2% 40.5% 182 100.0% 27.5%
Subtotal 352 53.1% 100.0% 311 46.9% 100.0% 663 100.0% 100.0%
Source: Survey Output
The relationship between transparency and accountability is examined further, from Table 5-
13:
• Of the respondents who said there was no proper accountability in the Corporation
(352), 30.8 per cent say that Corporation is transparent;
• Of those who were positive on the accountability (311), 38.5 per cent of them opine
that there is no transparency in the Corporation.
132

Table 5-14: Correlations between Accountability and Transparency
Accountability Transparency
Accountability Phi Coefficient 1 .275**
Sig. (2-tailed) .000 N 663 663
Transparency Phi Coefficeint .275** 1 Sig. (2-tailed) .000 N 663 663
**. Correlation is significant at the 0.01 level (2-tailed). Source: Survey Output
The correlation run between accountability and transparency shows that (Table 5-14) the
correlation is significant at 0.01 level with 0.275 as Phi coefficient. The analysis of
relationship between transparency and the working, service delivery of the Corporation
shows a very highly correlated relationship. Transparency and Working of the Corporation
has a Phi co-efficient of 0.352, and the relationship between Transparency and Service
delivery is also strong with 0.308 Phi co-efficient, indicating significant correlation between
the variables at 0.01 level (Table 5-15).
Table 5-15: Correlations between Transparency, Working and Service delivery
Transparency Working Service
delivery Transparency Phi Coefficient 1 .352** .308**
Sig. (2-tailed) .000 .000 N 663 663 663
Working Phi Coefficient .352** 1 .542** Sig. (2-tailed) .000 .000 N 663 663 663
Service delivery
Phi Coefficient .308** .542** 1 Sig. (2-tailed) .000 .000 N 663 663 663
**. Correlation is significant at the 0.01 level (2-tailed). Source: Survey Output
All the above points examine the relationship of transparency with other aspects of
accountability analysis, Table 5-16 seeks to examine as to why people say the Corporation is
not transparent.
133

Table 5-16: Reasons why people say Corporation is not Transparent
Negative Positive Total Importance
1.Information not available 231 238 469 2 49% 51% 100%
2.No system of informing public 211 258 469 1 45% 55% 100%
3.No info is provided through Media
296 173 469 3 63% 37% 100% 4.I am not aware about any information
305 164 469 4
65% 35% 100% 5.I am not interested in any information
379 90 469 X 81% 19% 100% Source: Compiled from Survey Output
The analysis of the Table 5-16 shows that:
• Out of the 481 people who said that the Corporation is not transparent, 469 (97.5 per
cent) have ranked key reasons in the order of importance;
• People feel that there is no system for informing the public about the matters related
to the Corporation, followed by information is not available (that the Corporation is
not prepared to share);
• Information not being provided through media like TV, new papers etc. is also
another opinion;
• One set of respondents say that they are not aware of any such information made
available;
• 19 per cent of the persons who opted to opine (13.6 per cent of the total surveyed),
have stated that they are ‘not interested in any information’ from the Corporation.
This is quite a shocking revelation. This shows the indifference of a set of
respondents. Table 5-17: Rating the Information is available
Totally
Unsatisfied Unsatisfied Undecided Satisfied Fully
Satisfied Total Mean
Score Rank
1.Accessibility 3 17 46 106 8 180
3.550 1 2% 9% 26% 59% 4% 100%
2.Relevance 2 12 74 78 14 180
3.500 2 1% 7% 41% 43% 8% 100%
3.Quality 6 12 72 70 20 180
3.478 3 3% 7% 40% 39% 11% 100%
Overall 11 41 192 254 42 540
3.509 Undec
<-> Satis
2% 8% 36% 47% 8% 100%
Source: Compiled from Survey Output
134

In order to get a complete idea about the transparency issues, the opinion of the persons who
say that the Corporation is transparent was also taken. Table 5-17 shows the way such
respondents have evaluated the information available. The main points arising out of the
analysis are:
• Out of the 182 who stated that the Corporation provides transparent information, 180
(98.9%) have evaluated the information characteristics;
• Accessibility, relevance and quality have been rated 1st to 3rd ranks respectively;
• The scores are in the region of 3.5 and the overall average (mean) score is 3.509,
indicating that the overall rating is tending towards satisfaction levels;
• The statistical analysis of the data reveals the following:
o Cronbach’s Alpha = 0.858, indicating the consistency and reliability of the
items;
o In ANOVA, the F score of 1.091 indicates the acceptance of the hypothesis
that there is uniform rating by the respondents with p= 0.337;
o Single measure intra class correlation = 0.669, indicting the high uniformity in
the response.
While most of the respondents feel that the information is not available and there are also
reasons as to why they do not get the information (from ‘not being provided by the
Corporation’ to ‘not interested in getting the information’), the persons who get the
information seem to feel quite satisfied with the information.
Table 5-18: Interested in Info from Corporation
Will you be interested in getting information about their working/Performance of corporation?
Frequency Percent Valid No 252 38
Yes 411 62 Total 663 100
Source: Survey Output
Having analysed the information availability, the research looked at whether the respondents
are really interested in getting the information and if yes, what type of information they
would like to get from the Corporation.
135

Table 5-18 shows that 62 per cent of the respondents have evinced interest in getting
information from the Corporation. This number is considered quite low, as it is felt that at
least those persons who have opined that the Corporation is not transparent (72.5% - Table 5-
07) would demand information from the Corporation. This shows that there is certain amount
of indifference in the attitude of the respondents.
Table 5-19: Analysis of the attitude of respondents on Transparency
Transparency
No Yes Total Count Row N
% Column
N % Count Row
N % Column
N % Count Row N
% Column
N % Will you be interested in getting information about their working/Performance of corporation?
No 220 87.3% 45.7% 32 12.7% 17.6% 252 100.0% 38.0%
Yes 261 63.5% 54.3% 150 36.5% 82.4% 411 100.0% 62.0%
Total 481 72.5% 100.0% 182 27.5% 100.0% 663 100.0% 100.0%
Source: Survey Output
Table 5-19 analyses the attitude of the persons with regard to their idea on transparency and
the information requirements.
• Out of 481 respondents who said that the Corporation was not transparent, 45.7% of
them have opined that they will not be interested in getting information from the
Corporation;
• Out of the 182 respondent who said that the Corporation was transparent 17.6% say
that they will not be interested in getting information from the Corporation;
• In all about 252 respondents (38%) seem to behave in an ‘indifferent way” towards
matters relating to transparency;
• This dichotomy in the behavior of the respondents requires deeper considerations.
In order to complete the discussions on transparency and information requirements of the
respondents, a prioritization of the key information required was done by the respondents.
According to the prioritization, the following information in that order is considered
important:
• Information on the ward works - how the local projects are progressing (taking place
in the respective wards and directly affecting the citizens);
136

• Financial information on how the money has been spent (expenditure related
information);
• Tax collection information (how far the Corporation is able to generate its own
revenues);
• Budget to actual details – indicating the extent of achievement of the budget (plans).
Table 5-20: Key Information required by Citizens
Key information requirements
Rank #1
Rank #2
Rank #3
Rank #4
Total Mean Score
Rank
1.Ward work Status 173 93 101 108
475 2.303 1 36% 20% 21% 23% 100%
2.Financial information (how money has been spent)
131 122 113 109 475 2.421 2
28% 26% 24% 23% 100%
3.Tax collection details
95 154 134 92 475 2.469 3 20% 32% 28% 19% 100%
4.Budget to Actual information
76 106 127 166 475 2.806 4 16% 22% 27% 35% 100%
Source: Compiled from Survey Output
Table 5-20 gives various details in this regard. 475 respondents (71.6%) have indicated they
would like to have these information. To summarize aspects relating to transparency and in
particular the preferences and attitudes of the citizens in this regard requires a deeper
examination. There are also some aspects relating to ‘indifferent behaviour’ by the citizens
that need to be taken into cognizance in order to understand various issues underlying.
Action-ability
The term action-ability has been derived during the course of the research and discussed
earlier in Chapter 3. According to the conceptual framework in the A-T-A (accountability –
transparency - action-ability) continuum, without proper arrangements for action-ability no
organization can achieve the objectives/benefits of accountability and transparency. This
concept in a basic way is considered in this research.
The action-ability in a Corporation, from the perspective of citizens, commences with the
ease of approachability. This means that for any requirement when a citizen approaches the
137

Corporation, it should be able to respond immediately and take action, based on the
immediate requirements. This, however, is only one aspect of the action-ability of the
Corporation. The respondents were asked as to whether they had approached the Corporation
for any help or for lodging any complaint. The responses are given in Table 5-21. This table
needs consideration along with Table 5-22 on the knowledge about the redressal mechanism
in the Corporation. Table 5-21: Complaints lodged to Corporation
Have you lodged any complaint so far to the Corporation authorities? Frequency Percent
Valid No 635 95.8 Yes 28 4.2 Total 663 100
Source: Survey Output
Table 5-22: Knowledge of Grievance Redressal Do you know that the Corporation has a grievance
redressal mechanism?
Frequency Percent Valid No 429 64.7
Yes 234 35.3 Total 663 100
Source: Survey Output
Only 4.2 per cent of the respondents have ever lodged a complaint to the Corporation
authorities. This seems rather a very low number. While the reasons behind why others have
not lodged complaint need to be studied as much as the experience of those who lodged
complaints requires examination, only 35.3 per cent of the respondents know that the
Corporation has a grievance redressal mechanism. This is a very important issue. This means
that the citizens, even if they have some issues which requires attention by Corporation
(issues where the citizens are bound to suffer), they may not lodge a complaint to the
Corporation. Table 5-23: Why complaints were not lodged
Reasons for not contacting No Yes Total Rank
1. No problems faced 400 263 663
1 60% 40% 100%
2. Not aware whom to contact 498 165 663
4 75% 25% 100%
3.I feel Corporation will not take any action
445 218 663 2
67% 33% 100%
138

Reasons for not contacting No Yes Total Rank
4.Due to corruption I do not feel like contacting
485 178 663 3
73% 27% 100%
Overall 1828 824 2652
69% 31% 100%
Source: Compiled from Survey
Table 5-23 provides an insight into the main reasons as to why people have not lodged
complaints at the Corporation. Each of the respondents were asked to rank various reasons.
• The main reason (40 per cent of respondents) seems to be that many respondents did
not have an opportunity or problem to face. This may not be solely due to the proper
service delivery by Corporation, the complaints are invariably lodged by the landlord
or the house/apartment owner, or by someone else in the family/household/building;
• 33 per cent of the respondents feel that the Corporation will not take any action, and
hence they remained silent;
• Corruption is the reason attributed by 27 per cent of the respondents, for not lodging
complaints;
• 25 per cent of the persons seem to be not aware of whom to contact, in case of any
issues requiring action;
• Overall only 31 per cent of the responses were positive about their experience while
contacting the Corporation. This is considered extremely low, particularly when there
is a grievance redressel mechanism and also a population which seems not to be very
happy about the services delivered by the Corporation.
The analysis of the experiences of the persons who lodged complaints provide us an insight
into the working of the grievance redressal mechanism present in Chennai Corporation. Only
4.2 per cent (28) of the respondents (663) have lodged complaints, and this seems very small;
and possibly is the true reflection of reality.
139

Table 5-24: Analysis of the Complaints Redressal
I. Nature of complaint
Complaint Nos Break-up Drainage problem 10 36% Garbage problem 6 21% Road problem 6 21% Street light problem 3 11% Water supply problem 3 11%
Total 28 100%
II. Complaint Redressal
How handled Nos Break-up No response 3 10% Not solved 9 32% Solved but delayed/improperly 8 29% Solved 8 29%
Total 28 100%
III. Satisfaction levels
Rating Score Break-up Totally Unsatisfactory 11 40% Unsatisfactory 6 21% Okay 4 14% Satisfactory 6 21% Fully Satisfactory 1 4%
Total 28 100%
Mean Score 2.286 Unsat Okay
Source: Compiled from Survey Output
Table 5-24 provides the three aspects of the complaints redressal mechanism: the nature of
the complaints lodged, how they were resolved, and the satisfaction levels of the respondents:
• Nature of the complaints: 36 per cent related to drainage problems100, 21 per cent
each with regard to garbage and road problems, and 11 per cent each were street light,
water supply related problems (though some of these are not directly related to
Corporation);
• Redressal: For 10 per cent of the complaints there was no response at all and 32 per
cent of the complaints were not solved at all. This means 42 per cent of the
complaints remain as such. This is an extremely important point, as this could
100 Refer Table 5-4 where drainage clearing has been expressed as the major issue in service delivery by the Chennai Corporation.
140

influence the other citizens not to lodge any complaint. 29 per cent of the cases were
solved, and another 29 per cent delayed but solved or not fully solved.
• Satisfaction levels: 40 per cent of the complainants feel totally unsatisfied, while 21
per cent feel unsatisfied. This puts the level of not satisfied persons at 61 per cent -
and this summarizes the overall pulse. While 14 per cent say okay, only 25 per cent
are satisfied (21 per cent satisfied and 4 per cent fully satisfied). The overall score of
2.286 regards the overall satisfaction level as - between unsatisfactory and okay (more
towards unsatisfactory).
All the above points provide an insight into one aspect of action-ability of the Corporation. In
order to understand the ideas of respondents from the perspective of action-ability, the
respondents were asked to prioritize various aspects of action items in this regard. The results
of the responses are given in Table 5-25.
Table 5-25: Action-ability Action Points
Inputs to improve action-ability
Rank #1
Rank #2
Rank #3
Rank #4
Rank #5
Total Mean Score
Rank
1. Technical service delivery 129 159 155 91 123 657 2.878 3
20% 24% 24% 14% 19% 100%
2.Proper use of the tax money collected
103 113 140 165 136 657 2.857 2 16% 17% 21% 25% 21% 100%
3.Coordination, monitoring and follow up of work
131 92 102 111 221 657 2.782 1 20% 14% 16% 17% 34% 100%
4.Public relations 103 113 140 165 136 657
3.180 4 16% 17% 21% 25% 21% 100%
5.Strong Administration 131 92 102 111 221 657
3.303 5 20% 14% 16% 17% 34% 100%
Source: Compiled from Survey Output
The ranking provided by the respondents prioritize the chief action points.
• Rank #1: Coordination, monitoring and follow-up of work gets priority;
• Rank #2: Proper use of the tax money collected. This is an action point as the
respondents feel that if there is focus on the proper use of money collected, then
proper action will be taken. This also supports the follow-up action;
• Rank #3: Technical service delivery is in relation to the works done by various
departments like Engineering, Health, etc. within the Corporation. By being
141

technically sound there may not be any serious necessity for complaints. At the same
time availability of technically sound teams can help in addressing various issues;
• Public relations and strong administration seems less important in relation to the other
two choices and hence the scoring for these options have been less;
Section IV: Analysis around the EVLN Model
Aspect #2: Options for Citizens – the EVLN Model
Various observations have been made with regard to the aspect#1 on accountability through
the ATA model and the working/performance and service delivery aspects of the
Corporation. In general it was observed that the respondents were not that happy with regard
to most of the key issues taken up for the study. In order to examine the causes for at least the
major ones, an analysis of the options available for the citizens, when they confront problems
with the Corporation is taken up for the study.
As discussed in detail in Chapter-3, the principal concept here is
‘Exit/Voice/Loyalty/Neglect’ or EVLN model. That is in a confronting situation where a
citizen faces problem with the provision of public services he/she either ‘voices’ his/her
opinion or ‘exits’ from the scene. Alternately the person could be ‘loyal’ and tolerate or be
indifferent and hence ‘neglect’. The behavior in this regard would depend on two dimensions:
an active-passive dimension (Action dimension) and a positive-negative dimension
(Tolerance dimension). Hence between these two dimensions there are four major options
available - EVLN. These are being examined in order to understand the issues mainly from
the demand (citizen) perspective, so that the supply (policy makers) could accordingly
respond. Table 5-26: EVLN Options for citizens
Services Provided by
Corporation EXIT VOICE LOYAL NEGLECT Total
Action/ Action/ Inaction/ Inaction/
Negative Positive Positive Negative
1.Corpn Hospital
339 237 50 32 658 51.5% 36.0% 7.6% 4.9% 100.0%
2.Corpn School
340 201 59 58 658 51.7% 30.5% 9.0% 8.8% 100.0%
3. Roads
235 295 91 37 658 35.7% 44.8% 13.8% 5.6% 100.0%
4.Sewerage, Drainage 216 344 71 27 658 32.8% 52.3% 10.8% 4.1% 100.0%
142

Services Provided by Corporation
EXIT VOICE LOYAL NEGLECT Total
Action/ Action/ Inaction/ Inaction/
Negative Positive Positive Negative
5.Garbage removal
211 337 87 23 658 32.1% 51.2% 13.2% 3.5% 100.0%
6. Issue of birth/death certificate
267 214 86 91 658 40.6% 32.5% 13.1% 13.8% 100.0%
Total 1608 1628 444 268 3948 40.7% 41.2% 11.2% 6.8% 100.0% Action/ Inaction 82.0% 18.0% 100.0% Positive/Negative 52.5% 47.5% 100.0% Source: Compiled from Survey Output
Table 5-26 shows options chosen by the respondents. Six different service delivery aspects:
Hospital, School, Roads, Sewerage/drainage, Garbage removal and issue of birth/death
certificates were taken up for the study for the examination of the choices opted by them.
• Action Dimension – the Action-inaction components:
o It is seen that Voice (41.3 per cent) and Exit (40.7 per cent) predominate the
choice;
o Loyalty (Tolerance) (11.2 per cent) and Neglect (6.8 per cent) seem to be
relatively less;
o The action choices thus dominate at 82.0 per cent and the inaction choices are
at 18.0 per cent;
• Tolerance Dimension: Positive-negative components:
o The positive choices Voice (41.3 per cent) and Loyalty (11.2 per cent) are
marginally more at 52.5 per cent;
o The negative choices Exit (40.7 per cent) and Neglect (6.8 per cent) are
marginally less at 47.5 per cent.
The implications are, in the order of the popularity of the choices, as follows. The
combination of the two dimensions Action x Tolerance result in four combination situations:
• Action/Positive: Voice option: When the citizen is not happy about the services
delivered, he generally chooses to complain. In case the complain system does not
work and he desperately requires those services, then he has other options. In general,
a citizen will raise his/her voice or complain – provided there is a redressal
mechanism and is working properly. This is what 41.3 per cent of the respondents
have opted for;
• Action/Negative: Exit option: When the services delivered by the Corporation are not
up to the mark, the citizen will chose to exit – provided an option is available.
143

Generally this happens when the complaints do not have any effect. However, he/she
will choose to exit only when suitable options are available. 40.7 per cent of the
respondents have chosen this option;
• Tolerance/Positive: Loyalty option: The citizen tolerates (or remains loyal to the
Corporation) if he/she has no options for exit or he/she does not have a redressal
mechanism. Alternatively one may choose to remain dormant and tolerate the issue
he/she is facing. 11.2 per cent of the respondents chose to behave this way;
• Tolerance/negative: Neglect option: The citizen who are indifferent and unconcerned
about using the choices available are stated to select the Neglect option. They may or
may not have faced such situations requiring service delivery requirements. When
they have problem with problems of service delivery – they do not move out (exit),
they do not complain (voice), they also do not tolerate (loyalty). Many of them are
able to possibly ‘afford’ indifference. 6.8 per cent of the respondents have reacted this
way. They seem to be totally unconcerned.
The overall analysis shows that the respondents would choose to exit from such options that
are present; and would voice their issues as complaints. However, this is in slight
contradiction to the observation that only 4.2 per cent of the respondents have so far lodged
any sort of complaints to the Corporation.
Table 5-27: EVLN Analysis - Overall
Overall Action
Inaction Action
18.7% 712 81.30% 3236 3948
Tol
eran
ce
Loyalty 444 Voice 1628 Positive
52.5% 11.2% 41.3% 2072
Neglect 268 Exit 1608 Within Corpn Pvt Sec
Negative
47.5% 6.8% 40.7% 935 673
1876 23.7% 17.0%
3948
Exit options: In the case of persons who Exit, they have choices within the Corporation (or in
the public domain) or outside the Corporation – say by a private sector service provider. For
instance in case one is not happy with Corporation school in a locality, they are free to move
144

to another Corporation school (the former choice) or to a private school (the latter choice).
But such options may not be available for all the services/infrastructure provided by the
Corporation. As may be observed in the EVLN Table 5.27, on an overall basis, out of the
40.7 per cent who chose for exit option, 23.7 per cent would choose alternatives within
Corporation or public sphere, while the 17.0 per cent would choose to seek private sector
alternatives.
EVLN Analysis for individual services Table 5-28: EVLN Analysis for Corporation hospitals
Corporation Hospitals
Action
Inaction Action
12.5% 82 87.5% 576 658
Tol
eran
ce
Loyalty 50 Voice 237 Positive
43.6% 7.6% 36.0% 287
Neglect 32 Exit 339 Within Corpn Pvt Sec
Negative
56.4% 4.9% 51.5% 155 184
371 23.6% 28.0%
658
Corporation Hospitals
• The ‘action’ (87.5 per cent) and ‘negative’ (56.4 per cent) seem to
predominate the behavior of the citizens with regard to hospital services;
• Only 36.0 per cent would lodge a complaint for bad quality of service;
• 7.6 per cent would tolerate without complaining remaining loyal to the
Corporation and 4.9 per cent would neglect;
• Out of the 51.5 per cent who would look for outside alternatives 28 per cent
would look for opportunities in the private sector, and 23.6 per cent would
search for alternatives within Corporation/public entities;
• The exit option is high in hospitals because of the alternatives available in the
private sector. There are also good hospitals within public manifold, which
the respondents have considered;
145
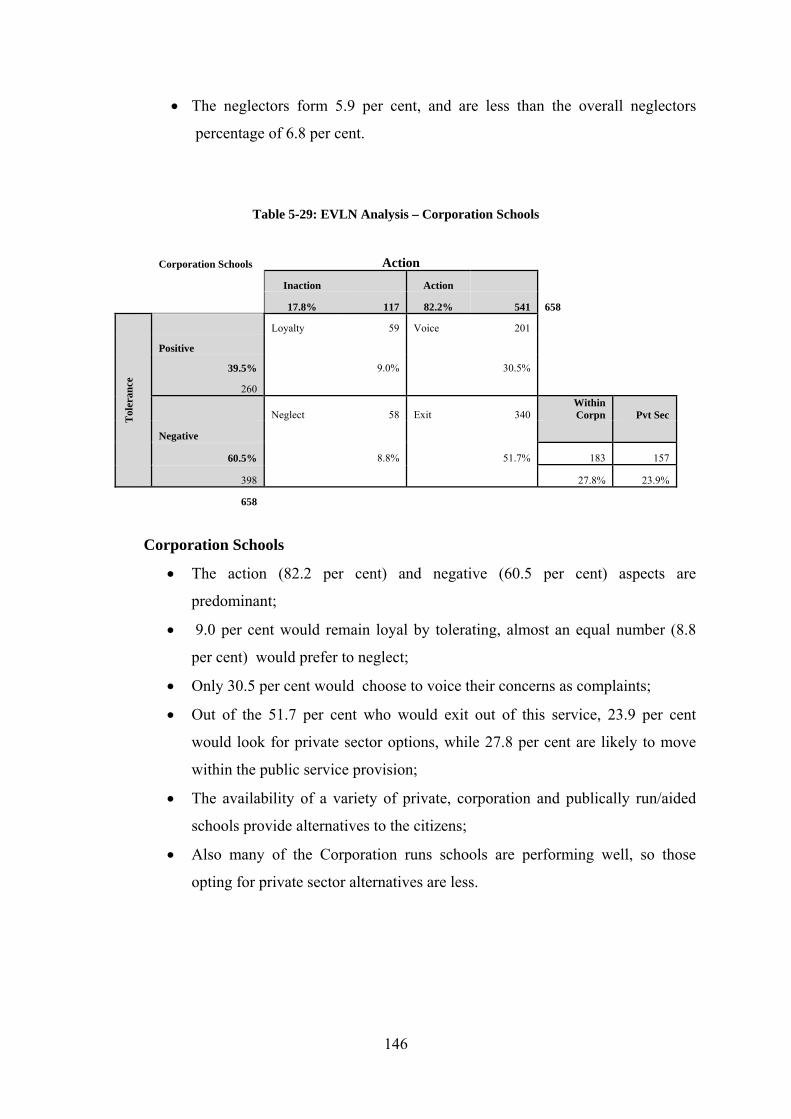
• The neglectors form 5.9 per cent, and are less than the overall neglectors
percentage of 6.8 per cent.
Table 5-29: EVLN Analysis – Corporation Schools
Corporation Schools Action
Inaction Action 17.8% 117 82.2% 541 658
Tol
eran
ce
Loyalty 59 Voice 201 Positive
39.5% 9.0% 30.5% 260
Neglect 58 Exit 340 Within Corpn Pvt Sec
Negative
60.5% 8.8% 51.7% 183 157
398 27.8% 23.9%
658
Corporation Schools
• The action (82.2 per cent) and negative (60.5 per cent) aspects are
predominant;
• 9.0 per cent would remain loyal by tolerating, almost an equal number (8.8
per cent) would prefer to neglect;
• Only 30.5 per cent would choose to voice their concerns as complaints;
• Out of the 51.7 per cent who would exit out of this service, 23.9 per cent
would look for private sector options, while 27.8 per cent are likely to move
within the public service provision;
• The availability of a variety of private, corporation and publically run/aided
schools provide alternatives to the citizens;
• Also many of the Corporation runs schools are performing well, so those
opting for private sector alternatives are less.
146

Table 5-30 : EVLN Analysis – Roads
Roads Action
Inaction Action
19.5% 128 80.5% 530 658
Tol
eran
ce
Loyalty 91 Voice 295 Positive
58.7% 13.9% 44.8% 386
Neglect 37 Exit 235 Within Corpn Pvt Sec
Negative
41.3% 5.6% 35.7% 141 94
272 21.4% 14.3%
658
Roads
• The behavior of the respondents with regard to the roads is in contrast to that
seen for the hospitals and schools;
• While the Action components are still predominant at 80.5 per cent, the
positive components are more at 58.7 per cent. This would mean that the
respondents would choose more of voice option than exit option;
• The main reason for the same is that the roads are monopoly of the public
service without any private players and hence most of the citizens would either
complain or tolerate;
• 44.8 per cent of the respondents would complain, while 13.9 per cent would
quietly tolerate;
• Only 5.6 per cent would take no notice by neglecting;
• Out of the 35.7 per cent of the persons who state they would exit, 21.4 per cent
would choose public options and 14.3 per cent private options;
• These options were discussed with the respondents, who state that:
o They would chose to use some other road (public option)
o The persons who choose private option are for more of toll and private
managed roads, though they do not have such options right now,
except for a few patches.
147

Table 5-31: EVLN Analysis – Sewerage/drainage
Sewerage/drainage Action
Inaction Action 14.9% 98 85.1% 560 658
Tol
eran
ce
Loyalty 71 Voice 344 Positive
63.1% 10.8% 52.3% 415
Neglect 27 Exit 216 Within Corpn Pvt Sec
Negative
36.9% 4.1% 32.8% 140 76
243 21.3% 11.6%
658
Sewerage/drainage
• Like roads the sewerage and drainage are a monopoly of the Corporation and
hence the responses are skewed towards Positive components (63.1 per cent)
and also action (85.1 per cent) oriented;
• 52.3 per cent would voice their concern and this gets the maximum response.
As discussed, this is basically due to monopoly ;
• 10.8 per cent are prepared to tolerate and 4.1 per cent choose to neglect;
• The persons who have chosen to exit – 32.8 per cent - opine that they have
chosen to seek private service providers (11.6 per cent) for maintenance of
sewerage and drainages. The 21.3 per cent who chose to remain with the
Corporation feel that they would seek the help of other government entities
like the TWAD board. It remains to be seen whether such options are
practicable and viable.
148
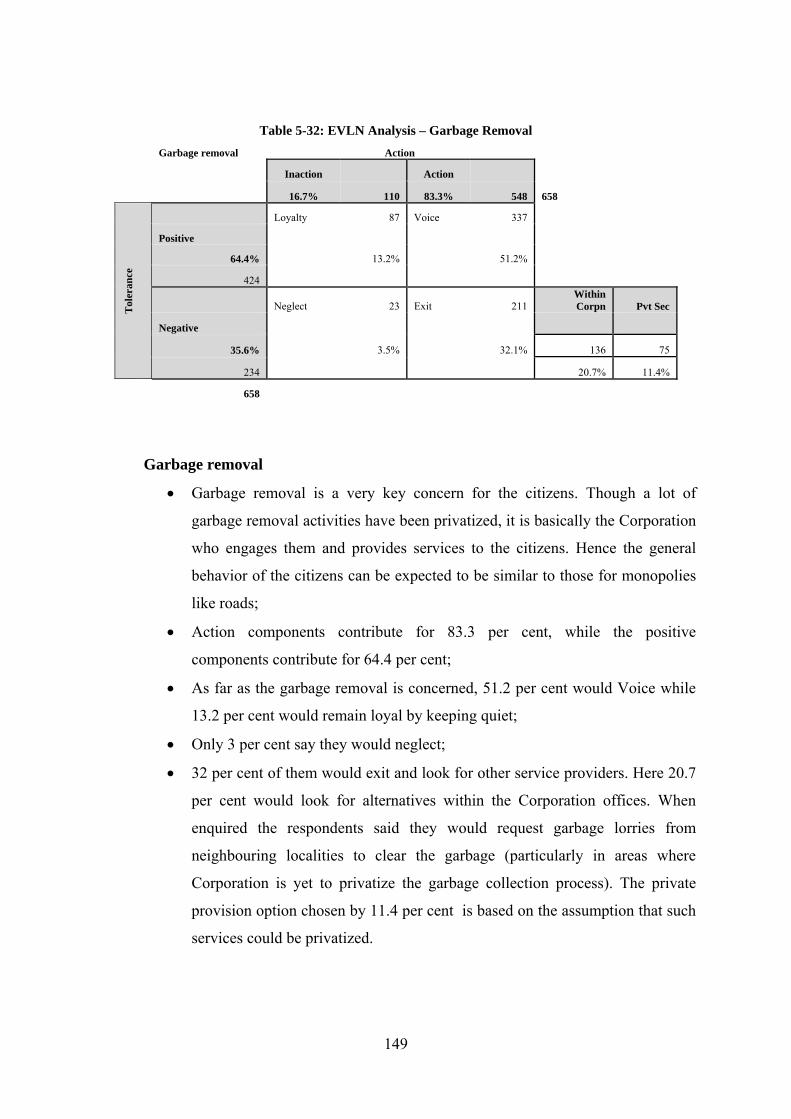
Table 5-32: EVLN Analysis – Garbage Removal
Garbage removal Action
Inaction Action
16.7% 110 83.3% 548 658
Tol
eran
ce
Loyalty 87 Voice 337 Positive
64.4% 13.2% 51.2% 424
Neglect 23 Exit 211 Within Corpn Pvt Sec
Negative
35.6% 3.5% 32.1% 136 75
234 20.7% 11.4%
658
Garbage removal
• Garbage removal is a very key concern for the citizens. Though a lot of
garbage removal activities have been privatized, it is basically the Corporation
who engages them and provides services to the citizens. Hence the general
behavior of the citizens can be expected to be similar to those for monopolies
like roads;
• Action components contribute for 83.3 per cent, while the positive
components contribute for 64.4 per cent;
• As far as the garbage removal is concerned, 51.2 per cent would Voice while
13.2 per cent would remain loyal by keeping quiet;
• Only 3 per cent say they would neglect;
• 32 per cent of them would exit and look for other service providers. Here 20.7
per cent would look for alternatives within the Corporation offices. When
enquired the respondents said they would request garbage lorries from
neighbouring localities to clear the garbage (particularly in areas where
Corporation is yet to privatize the garbage collection process). The private
provision option chosen by 11.4 per cent is based on the assumption that such
services could be privatized.
149

Table 5-33: EVLN Analysis – Issue of Birth/Death Certificate
Issue of birth/death certificate Action
Inaction Action
26.9% 177 73.1% 481 658
Tol
eran
ce
Loyalty 86 Voice 214 Positive
45.6% 13.1% 32.5% 300
Neglect 91 Exit 267 Within Corpn Pvt Sec
Negative
54.4% 13.8% 40.6% 180 87
358 27.4% 13.2%
658 Issue of birth/death certificate
• There are some specific issues with regard to the issue of birth/death
certificates in Chennai. The process has been computerized and web enabled.
However, there are some teething troubles and the system is yet to be
stabilized. In some of the localities the process is still manual. At the time of
this study there were some confusions in this regard. However, though these
factors may influence the options (under this EVLN model) for some of the
citizens, the overall impact is expected to be minimal;
• The action component, though high is relatively less in this case at 73.1 per
cent; and the negative component is also high at 54.4 per cent;
• Only 32.5 per cent would Voice and lodge a complaint;
• 40.6 per cent are prepared to exit. 27.4 per cent have preferred to move to
public institutions and 13.2 per cent to private sources. One very important
aspect in this regard is that the issue of birth/death certificates are related to
hospitals and the pattern of options available are on similar lines. One reason
why some of the respondents feel that this could be privatized. This is not true
– as the record of birth and death is a government record. Hence the
privatization option can be considered as far as some service provision by the
private players to improve the process efficiency through computerization.
• 13.1 per cent would keep quiet and tolerate. This is the highest percentage for
this option across six services taken in this EVLN analysis;
150

• 13.8 per cent have stated that they would simply neglect. This is the highest
percentage stated for any of the services. This could be because many of the
respondents may not be requiring this service immediately and could have
reacted in an indifferent manner.
Table 5-34: EVLN Analysis - Action/Inaction – Positive/Negative Aspects
Services Provided by Corporation
Action Tolerance
Action (1)
Inaction (2)
Positive (3)
Negative (4)
1.Corpn Hospital 576 82 287 371
87.5% 12.5% 43.6% 56.4%
2.Corpn School 541 117 260 398
82.2% 17.8% 39.5% 60.5%
3. Roads 530 128 386 272
80.5% 19.5% 58.7% 41.3%
4.Sewerage, Drainage 560 98 415 243
85.1% 14.9% 63.1% 36.9%
5.Garbage removal 548 110 424 234
83.3% 16.7% 64.4% 35.6%
6. Issue of birth/death certificate
481 177 300 358
73.1% 26.9% 45.6% 54.4%
Total 3236 712 2072 1876
82.0% 18.0% 52.5% 47.5% Note: Col (1) + Col (2) = 100% for each line item. Col (3) + Col (4) = 100% for each line item. Source: Compiled from Survey Output from SPSS
In the beginning of the EVLN discussions, the components were discussed predominantly to
give a framework for various discussions. Having discussed various observations for the six
specific services delivery using EVLN tables, analysis based on the action/inaction and
positive/negative aspects are being made, based on Table 5-34.
• A very interesting pattern is seen with regard to the monopoly and non-monopoly
services:
o For all the major monopoly items: roads (58.7 per cent), sewerage/drainage
(63.1 per cent), garbage removal (64.4 per cent) – the positive aspect is high
(as shown within the brackets);
151

o And the converse is true for the relatively non-monopoly items; Corporation
Hospital (56.4 per cent), Corporation School (60.5 per cent), and Issue of
birth/death certificates (54.4 per cent) have high negative aspect (as shown
within the brackets);
o From the perspective of action-inaction aspect, in all the services except the
issue of birth/death certificates, the action aspect is very high (over 80 per
cent). Even for the said service the action aspect is at 73.1 per cent, ( less than
the overall average of 82.0 per cent).
Two questions that arise out of this analysis are:
• Is the action-inaction pattern of citizens generally uniform for any Corporation
(indicating the governance and local participation aspects)?
• Is it true that for monopoly services, the positive approaches are preferred by citizens
and for non-monopoly services, the negative aspects are preferred by the citizens?
All the issues discussed in this regard are directly related to accountability from the demand
side perspective. It is because of the demand for accountability that people choose voice
options and only when there is faith in the accountability arrangements can the voice options
work. When there is lack of accountability, the service delivery parameters fail; it is because
of deteriorating services without any recourse or lack of service delivery that the citizens go
for exit options. While these options may be true for the ‘active’ participants, the inactive
ones can tolerate and remain idle – and this will not improve the situation and possibly would
worsen it. The other set of ‘indifferent’ persons who neglect need to be dealt with and be
brought to the main stream. Thus the accountability framework (ATA) is related to the EVLN
aspects. The EVLN analysis provides insights into specific aspects of accountability and
service delivery.
152

Section V: Preparedness of the Citizens for Accountability
Aspect #3: Preparedness for Accountability
Having studied the response to various aspects of accountability through ATA model and
also having examined the options available for the citizens through the EVLN models, a very
important aspect of the characteristics of the citizens is sought to be studied in this research.
This is the ‘preparedness for accountability’. Preparedness for accountability is dealt with
from two perspectives: Knowledge perspective and participation perspective.
• Knowledge perspective: This perspective seeks to examine the question: Are the
citizens ready for handling and managing accountability related issues? This is an
important question from the perspective of the demand side of accountability. Do the
citizens want accountability even without understanding the basic concepts,
ingredients, and their role in this regard? While this is a very complicated question,
as a part of this research some aspects of the knowledge of the citizens about the
Corporation were studied in this regard. The major aspects are presented here.
• Participation perspective: In this perspective the question: Are the citizens willing to
participate in the activities of the Corporation? is addressed. As part of the
participative democracy the citizens need to support the third tier of governance. Also,
newer and improved methods of governance through public private partnerships and
other methods of contracting for infrastructure development and service delivery are
considered today. Some of these issues are addressed in this part.
Knowledge Perspective:
1. Knowledge about the Key employees of corporation and ward details
As citizens of the city, the Chennai residents should know about the key office bearers of
the Corporation like Mayor and Commissioner at least; and also about the ward they live
in: in terms of the name of the ward, the ward number and the name of the ward
representative. The details of the survey results are given in Table 5.40. Table 5-35: Basic information about Corporation and Ward
Item No Yes Total No% Yes% Rank 1.Mayor 269 394 663 41% 59% 1 2.Commissioner 360 303 663 54% 46% 3 3.Ward representative 398 265 663 60% 40% 5 4.Ward Number 368 295 663 56% 44% 4 5.Ward Name 349 314 663 53% 47% 2
Overall 1744 1571 3315 53% 47% Source: Compiled from Survey Output
153

The analysis of Table 5-35 shows that:
• Except for the knowledge about the Mayor (59 per cent), for all the other items
less than 50 per cent of the respondent only seem to know;
• The ranking of the five items are as follows:
o #1 Mayor
o #2 Ward name
o #3 Commissioner
o #4 Ward number
o #5 Ward representative
• The ranking clearly brings out the fact that the citizens do not know their ward
representative. He is the key link between the citizens and the Corporation. This
link itself is weak;
• The overall knowledge – all the five items put together – indicated by the overall
yes percentage is very low at 47 per cent;
• Hence the foremost and basic knowledge about the Corporation itself is weak.
2. Municipal tax related matters
The next was to understand the tax payment profile of the respondents. Since the
sampling plan did not include municipal payment as a necessary criteria (as it is not
sensitive or relevant to the study objectives), an idea of the percentage of respondents
who paid municipal taxes, and the quantum, etc. were sought to be examined.
154

Table 5-36: Municipal tax related analysis
1. How many pay property tax Nos Total Percentage190 663 28.7%
2. How many know how much they paid Who
know Out of Percentage137 190 72.1%
3. Average municipal tax paid Rs.2,231 considering 137 persons
4. Which are the other municipal taxes paid Nos Total Percentage a. Professional Tax 32 663 4.8% b. Trade license 12 663 1.8%5. Is the municipal tax paid high? Nos Break-up a. Yes high 59 31% b. Not high 48 25% c. Reasonable 43 23% d. No opinion 40 21%
Total 190 100% 6. How do the citizens pay their municipal taxes Nos Break-up a. At the Corporation office 49 26% b. Through the tax collector 33 17% c. Through bank 62 33% d. Other methods 2 1% e. Not sure how I pay 44 23%
Total 190 100% Source: Compiled from Survey Output
There are several interesting observations that can be made from Table 5-36:
• Only 190 (28.7 per cent) of the 663 respondents pay property tax;
• Out of 190, only 137 (72.1 per cent of those who paid the tax) knew how much
property tax they paid. This again reflects the knowledge base and importance
attached to this matter;
• Taking the 137 persons who knew how much they paid, the annual average tax
paid comes to Rs.2,231; The other municipal taxes paid are: professional tax by
4.8 per cent and trade license by 1.8 per cent of the total respondents;
• Out of the 190 tax payers only 31 per cent opine that the tax paid is high; 25 per
cent feel that the tax paid is not high and 23 per cent feel that it is reasonable.
Here also 21 per cent of the respondents offer no opinion. This again is the
‘indifference’ category as discussed in other sections of this study.
• With regard to the municipal tax payment, 33 per cent pay through bank, 26 per
cent at the Corporation office, 17 per cent through the tax collectors. Here also 23
per cent do not know how they pay their municipal taxes; this group can again be
classified as the ‘indifference group’.
155

To summarize: the tax payer base is weak and the average tax collected is also quite
low. Over 20 per cent of the tax payers are not sure about the amount they pay, how
they pay and seek to offer no opinion on the level of the tax.
3. Citizen interfaces of the Corporation
In the earlier portions of the study, while discussing accountability and transparency
aspects various citizen interfaces like grievance redressal mechanism were discussed. In
this portion certain knowledge of other interfaces like the web-site, citizens’ charter, etc.
are discussed.
Table 5-37: Knowledge/experience about key interfaces Items Response Base Percentage 1. Do you know corporation has a web site? 202 663 30% 2. Have you seen it? 122 202 60% 3. Do you know about online facilities for making payment to Corporation? 189 663 29% 4. Have you used the same? 67 189 35% 5. Do you know you can apply for birth/death certificates, licenses online? 124 663 19% 6. Do you know what a Citizens' charter is? 94 663 14% 7. Do you know Chennai Corporation has a Citizen's charter? 104 663 16% 8. Have you seen a Citizens' charter 51 663 8% Source: Compiled from Survey Output
The public interfaces discussed in Table 5-37 are: some aspects of the on-line interfaces
provided to the citizens to transact with the Corporation in an easy manner, some aspects
of various services provided by the Corporation, and the knowledge of Citizen’s Charter.
The analysis shows that:
• Only 30 per cent of the respondents know that the Corporation has a website.
This is a low number considering the general awareness in Chennai and the usage
of internet in the city;
• Out of the persons who know the web-site only 60 per cent have seen the website;
• Only 29 per cent of the respondents know about the online facilities for making
payment to the Corporation;
• Only 35 per cent of this 29 per cent, have actually used it for making payment to
Corporation;
156
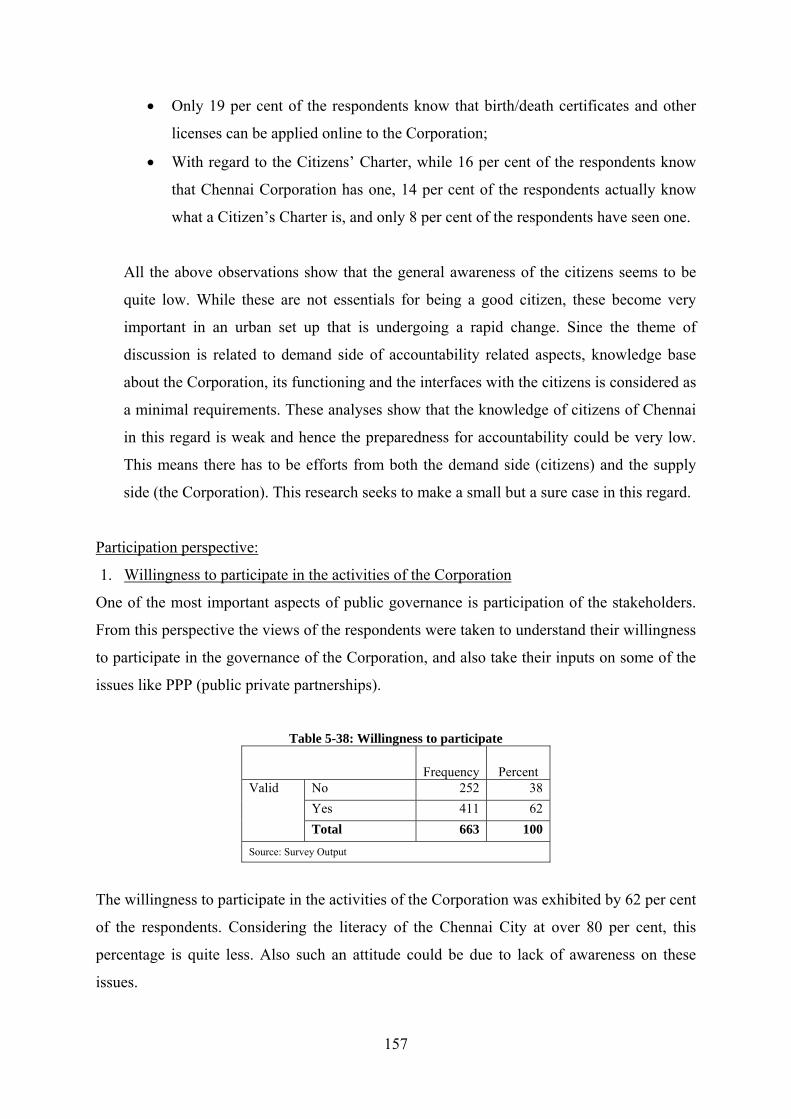
• Only 19 per cent of the respondents know that birth/death certificates and other
licenses can be applied online to the Corporation;
• With regard to the Citizens’ Charter, while 16 per cent of the respondents know
that Chennai Corporation has one, 14 per cent of the respondents actually know
what a Citizen’s Charter is, and only 8 per cent of the respondents have seen one.
All the above observations show that the general awareness of the citizens seems to be
quite low. While these are not essentials for being a good citizen, these become very
important in an urban set up that is undergoing a rapid change. Since the theme of
discussion is related to demand side of accountability related aspects, knowledge base
about the Corporation, its functioning and the interfaces with the citizens is considered as
a minimal requirements. These analyses show that the knowledge of citizens of Chennai
in this regard is weak and hence the preparedness for accountability could be very low.
This means there has to be efforts from both the demand side (citizens) and the supply
side (the Corporation). This research seeks to make a small but a sure case in this regard.
Participation perspective:
1. Willingness to participate in the activities of the Corporation
One of the most important aspects of public governance is participation of the stakeholders.
From this perspective the views of the respondents were taken to understand their willingness
to participate in the governance of the Corporation, and also take their inputs on some of the
issues like PPP (public private partnerships).
Table 5-38: Willingness to participate
Frequency Percent Valid No 252 38
Yes 411 62 Total 663 100
Source: Survey Output
The willingness to participate in the activities of the Corporation was exhibited by 62 per cent
of the respondents. Considering the literacy of the Chennai City at over 80 per cent, this
percentage is quite less. Also such an attitude could be due to lack of awareness on these
issues.
157

2. Preferred activities for participation Table 5-39: Activities for participation
Activities Nos Percentage Rank 1. Cleaning 174 26% 3 2. Maintenance 164 25% 4 3. Education 222 33% 1 4. Tree planting 179 27% 2 5. Supervision 113 17% 6 6. Spreading awareness 162 24% 5
Total Respondents 663
Overall Average response 25%
Source: Compiled from Survey Output
Table 5-39 gives the list of activities where the citizens are willing to participate.
• At the maximum only 33 per cent of the citizens are willing to participate;
• The overall average of the response to participate is only 25 per cent;
• The importance in terms of response received are in the following order:
o Education (support to corporation schools)
o Tree planting (environment)
o Cleaning (road, garbage)
o Maintenance (drain, parks)
o Spreading awareness (on schemes)
o Supervision (of activities in the ward)
• While support to education has the maximum response (33 per cent), the supervision
(for ward and local works) is minimum at 17 per cent. In fact, for a real participatory
governance, supervision by stakeholders particularly citizens is considered very
important and this requires public support. But this is not considered very relevant by
the respondents. This is an important point arising out of this study, and gives an idea
about the citizens;
3. Not willing/able to participate
While on an average 25 per cent of the respondents were willing to participate, another set of
respondents are either not willing or not able to participate in the activities. Table 5.40
provides information in this regard.
158

Table 5-40: Not willing to participate
Not interested in participation Nos Percentage Rank 1. Preoccupation with work 120 18% 2 2. Did not know I could participate 54 8% 3 3. Not interested 137 21% 1
Total Respondents 663
Overall Average response 16%
Source: Compiled from Survey Output
Pre-occupation seems to be the main issue for 18 per cent of the respondents, while 8 per cent
of them do not know that they could participate in the activities. This is an important finding.
There seems to be no awareness on the part of the general public in this regard or there are
inadequate efforts from the Corporation to promote the same. The most revealing finding is
that 21 per cent have responded stating that they are not interested in participating. This again
indicates a set of citizens who are ‘indifferent’ to the public cause. An analysis into such
cases is required.
4. Public Private Participation (PPP)
PPP is becoming increasingly popular, particularly in the urban public space. Discussing the
participation aspects of the public, irrespective of their personal interest/ability to participate
in the affairs of the Corporation, an analysis of the opinion and inputs of the respondents
were taken in this regard.
Table 5-41: Opinion on PPP
I. Should Corporation promote PPP
Frequency Percent Valid
Percent Cumulative
Percent Valid No 112 16.9 16.9 16.9
Yes 551 83.1 83.1 100 Total 663 100 100
II. Do organizations like EXNORA help in delivery of services
Frequency Percent Valid
Percent Cumulative
Percent Valid No 240 36.2 36.2 36.2
Yes 423 63.8 63.8 100 Total 663 100 100
Source: Survey Output
159

Table 5-41 shows the opinion of the people with regard to PPP and NGOs like EXNORA
who have been working in the urban issues for some time now. The key observations in this
regard are:
• 83.1 per cent of the people feel that Corporation should promote PPP. This is a very
positive and a clear mandate;
• 63.8 per cent of the respondents opine that NGOs like EXNORA do help in the
delivery of services.
The focus of the research is not looking at the efficacy of these services but to take opinion
about the ‘participatory’ aspects of urban governance. There seems to be an overwhelming
support for participation.
5. Areas for participation through PPP
The respondents provided their inputs on the major areas of participation. These are sensitive
to local issues. Table 5-42 provides details of the possible areas for participation and the
ranking according to their priority.
Table 5-42: PPPs: Areas for participation
Areas for participation Nos Percentage Rank 1. Cleaning 391 59% 1 2. Maintenance 346 52% 2 3. Environment 330 50% 3 4. Supervision 240 36% 5 5. Awareness 296 45% 4
Total Respondents 663
Overall Average response 48%
Source: Compiled from Survey Output
The main observations in this regard are:
• Using PPP/NGO for (in the order of ranking):
o Cleaning
o Maintenance
o Environment
o Awareness
o Supervision
160

• Here again the general focus is on cleanliness and maintenance. Since in the overall
analysis, the citizens are not happy with the service delivery, they are willing to make
Corporation take the support of organizations through PPP;
• Also, supervision by external agency seems to take a back seat. Possibly the
respondents feel that supervision of the work of the Corporation employees should be
done by their own superiors;
• The most important revelation is that the average response has been at 48% , which is
almost the double compared to the willingness to participate by themselves (25%
Table 5-32). This implies that the Citizens do understand that the Corporation requires
external support for improving quality of service delivery; some of them would also
take part in this regard, and they would prefer some external support for the same.
Applicability of the CLEAR Model
In the review of literature (Chapter-3) the CLEAR Model for citizen participation was
discussed. Based on the available information of the demand side of accountability, and on
the survey, the issues raised by the Model are examined.
• Can do—have the resources and knowledge to participate: the knowledge aspect was
taken up and it was observed that the knowledge about the Corporation was negligible
and the knowledge about the ward level was relatively better. This was verified at 51
per cent of the population. In summary, this issue is only partially answered ;
• Like to—have a sense of attachment that reinforces participation: the sense of
participation was found to be relatively more (in comparison to the knowledge level)
with over 62 per cent of the respondents having inclination to participate in the
activities related to ward. While this is welcome, this may not be a threshold level for
active participation;
• Enabled to—are provided with the opportunity for participation – this is from the
supply side and hence not addressed ;
• Asked to—are mobilized through public agencies and civic channels – this is also
from the supply side and hence not addressed;
• Responded to—see evidence that their views have been considered – currently there
is no system by which such issues are monitored. This aspect is the meeting point of
both demand and supply sides of accountability.
161

Thus this model brings to light the status of accountability prevailing in Chennai Corporation.
The efficacy of this model can be tested by considering both the demand and supply sides of
accountability.
Based on the three aspects of: ATA model of accountability and related matters, the EVLN
model of options for the citizens, and the preparedness for accountability, some of the key
hypotheses developed in this regard require statistical validation.
162

Chapter - 6
டி ம் இைட ம் ற்றியங் ெகய் ம்
ப பய ம் பார்த் ச் ெசயல்
Consider the aim, the obstacle and the greatness of the ultimate gain and then resort to action.
Thirukkural - 676
And he should make those who have amassed (money wrongfully) yield it up and should change them in (their) works, so that they do not consume (the king’s) property or disgorge what is consumed.
Arthashastra – 2.9.35
163

Chapter – 6: Hypothesis & Testing This chapter is presented in four sections. Section I deals with the rationale for the hypotheses
proposed for testing. While Section II deals with various statistical procedures and evaluates
the hypotheses, Section III provides a demography based sensitivity analysis of the
hypotheses tests. Section IV gives the summary and conclusions out of the testing that is
done.
Section I: Rationale for the Hypotheses This research on the demand side of accountability attempts to study various issues
underlying accountability through the proposed ATA Model, the options available for
citizens through EVLN Model and preparedness of the citizens for accountability. During the
research several interesting issues came up and many of them were worth hypothesizing in
order to understand the behavior of citizens by analyzing the key variables. In order to
understand the specific outputs of this study, key hypotheses are proposed to study the
statistical validity and establishing empirical relationships.
This research is taking a first look at some of the conceptual and key issues in accountability
in the urban sector. This is undertaken by studying three aspects of accountability:
1. Issues pertaining to accountability, transparency and action-ability, as per the ATA
Model developed as part of this thesis. Analysis of these issues and relationships
between the variables is likely to provide an understanding of both conceptual and
the practical issues underlying;
2. The options available for citizens for various services provided, when the services
provided are not up to the mark as desired by the citizen . This is expected to provide
an understanding of what the citizens actually want from the Corporation;
3. Having discussed the ingredients and options for the citizens with regard to
accountability, are the citizens yet ready (preparedness) for implementing an
accountability system? This question is important as at the third tier of governance,
knowledge of the Corporation and participation of the citizens in governance are
essential criteria.
164

The hypotheses have been developed based on various rationale as given in Table 6-1. The
statements given below form the basis of various hypotheses proposed for testing. Table 6-1: Basis for the hypotheses proposed
S.No Statements Key premises and issues A. ATA Model
1 a The Corporation of Chennai is acting in an accountable manner towards the citizens.
According to the citizens of Chennai, is the Corporation of Chennai working in an accountable manner? This is the principle theme. By testing this theme and also studying various issues underlying, an understanding can be developed on accountability and citizens perception and requirement of the same.
1 b The Corporation of Chennai is transparent in providing information to the city.
According to the citizens of Chennai is the Corporation of Chennai transparent in providing information to the city? Transparency is related to accountability and without this there is no interaction between the Corporation and citizens. The perception of the citizens on transparency matters need to be understood.
1 c The Corporation of Chennai has action-ability in addressing issues of the citizens.
According to the citizens of Chennai, is the Corporation of Chennai taking action as required by the citizens? Action-ability is the way various issues and concerns of the citizens are addressed. This completes the accountability cycle and is fully influenced by accountability and transparency.
2 Accountability – Transparency – Action-ability are correlated to each other.
The crux of the A-T-A Model is this. These three are interdependent and the cycle of accountability gets completed only when all these components are present. If one component is weak, it weakens the entire accountability mechanism.
B. EVLN Model 3 Citizens of Chennai are ‘action’ oriented and
choose to voice their opinion or exit to alternatives, rather than choosing ‘tolerance’ options.
The EVLN model gets tested based on the Chennai data – so that the behaviour (reactions) of the citizens with regard to the accountability mechanisms may be understood. The options available, in case service delivery by Corporation is weak, need to be examined.
C. Citizens’ preparedness for Accountability 4 Chennai citizens possess the basic knowledge
about their Corporation and are willing to participate in governance of the Corporation activities.
The citizens being ready for fully demanding accountability from the Corporation depends upon their knowledge, commitment in terms of willingness to participate in managing the city affairs along with Corporation, etc. Here the very basic knowledge about the Corporation and their ward is being tested. Their willingness to participate and their views in this regard are examined. These issues are being studied to get a clear picture about the citizens.
165

Considerations for hypothesis testing
There are some important considerations that come up while fixing the basis for hypothesis
testing and the interpretation of test results. These are:
1. Threshold level: One of the major issues confronting this research is the threshold
level for testing the hypotheses. This refers to the level at which we accept, that the
Corporation is acting in an accountable manner as per the citizen’sperception - Should
90 per cent or 70 per cent or 50 per cent of the respondents say ‘yes’ to such a
question? While there was no particular answer for this issue, the tests at 70 per cent,
60 per cent and even 55 per cent did not prove successful. Hence a very low threshold
of 51 per cent was fixed for a positive answer (yes) to accept the presence of such a
parameter or service. For instance if 51 per cent or more of the respondents say ‘yes’
to a particular question and it is statistically accepted, then such a parameter is
accepted as prevalent for the purpose of this research. Such a test is made for all the
hypotheses proposed. Though this threshold of 51 per cent is considered low, it
nevertheless brings to light the actual state of affairs and provides opportunity for
analyzing the sensitivity and variations based on demographic differences;
Table 6-2: Threshold levels for Hypotheses Testing
Variables/Test Threshold level Basis 1. ATA Model a. Hypotheses 1a to 1c 51% At least 51% of the population should answer
in positive to consider the presence of these factors
b. Hypothesis 2 Does not arise Here Correlation is examined and no threshold is involved
2. EVLN Model a. Hypothesis 3 75% The action elements of the EVLN model have
been acceptable at 75% level and hence considered as the base
3. Preparedness a. Hypothesis 4
Basic knowledge 51% At least 51% of the population should answer in positive to consider the presence of this factor
Participation 62% This is the population level which is prepared to participate in the Corporation activities
166

b. p-value101: The decision indicator for all the statistical tests is the p or the probability
value of the hypothesis being accepted. This is the indicator used in the current
research literature due to the usage of statistical packages. All statistical packages
including MS Excel use p-value as indicator. For this study both SPSS and Minitab
statistical packages have been used for computation/testing of the results;
c. Confidence level: All the tests have been considered at 95% level of confidence.
Since the study is an exploratory study on policy and governance aspects where all the
citizens are considered equal based on principles of equity and equality, most of the variables
studied are independent of the demographic status. However, in order to provide an
understanding about the approach of the citizens (the study being on the demand side of
accountability), the analysis is based on key demographic parameters like gender, age,
income, occupation and education has been made.
Section II: Statistical Test Results & Analysis
In this section, various statistical tests, results and analysis are discussed under the three main
considerations: (1) the ATA Model, (2) the EVLN Model and (3) the Preparedness for
accountability.
1. A-T-A Model
Two major hypotheses are tested under this model. In case of accountability elements, three-
sub hypotheses are together tested on the three individual elements of accountability,
transparency and action-ability; and the next one on the relationship between the three.
Statement #1a: The Corporation of Chennai is acting in an accountable manner towards the citizens. Statement #1b: The Corporation of Chennai is transparent in providing information to the city. Statement #1c: The Corporation of Chennai has action-ability to address issues of the citizens.
101 The p-value determines the appropriateness of rejecting the null hypothesis in a hypothesis test. p-value range from 0 to 1. The smaller the p-value, the smaller the probability that rejecting the null hypothesis is a mistake. Before conducting any analyses, determine the alpha level. A commonly used p-value is 0.05. If the p-value of a test statistic is less than the alpha, the null hypothesis is rejected.
167
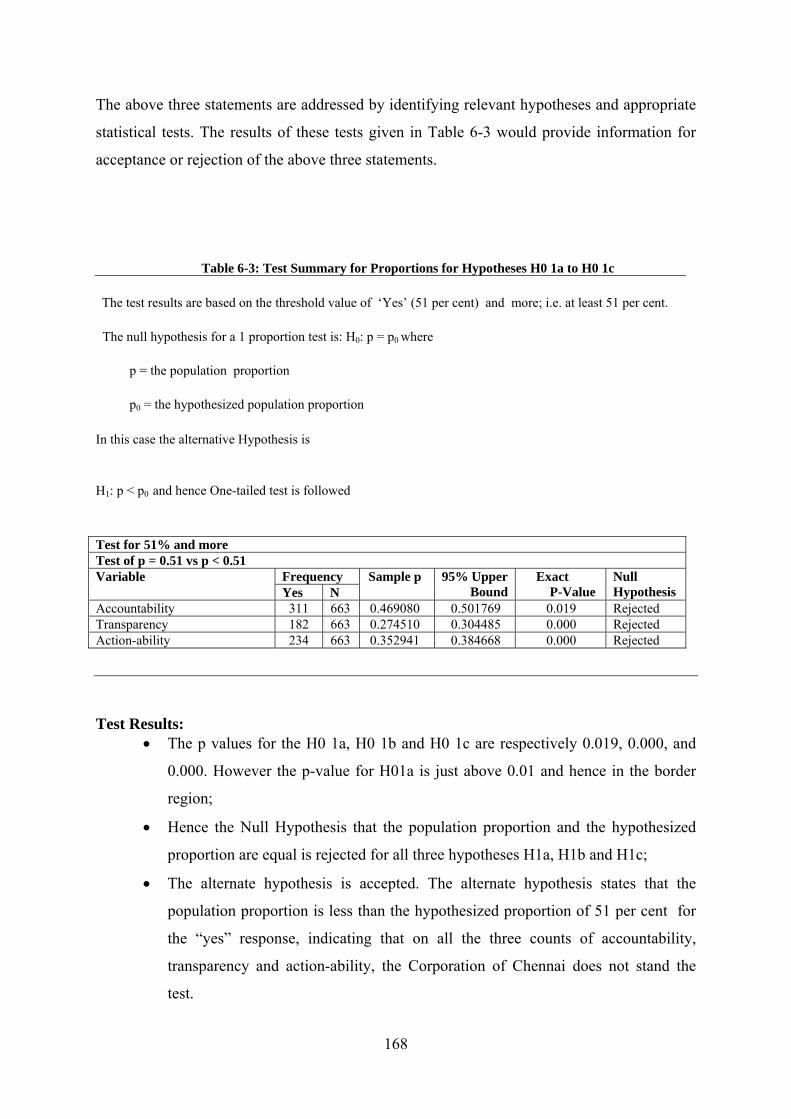
The above three statements are addressed by identifying relevant hypotheses and appropriate
statistical tests. The results of these tests given in Table 6-3 would provide information for
acceptance or rejection of the above three statements.
Table 6-3: Test Summary for Proportions for Hypotheses H0 1a to H0 1c
The test results are based on the threshold value of ‘Yes’ (51 per cent) and more; i.e. at least 51 per cent.
The null hypothesis for a 1 proportion test is: H0: p = p0 where
� p = the population proportion
� p0 = the hypothesized population proportion
In this case the alternative Hypothesis is
H1: p < p0 and hence One-tailed test is followed Test for 51% and more Test of p = 0.51 vs p < 0.51 Variable Frequency Sample p 95% Upper
Bound Exact
P-Value Null Hypothesis Yes N
Accountability 311 663 0.469080 0.501769 0.019 Rejected Transparency 182 663 0.274510 0.304485 0.000 Rejected Action-ability 234 663 0.352941 0.384668 0.000 Rejected
Test Results:
• The p values for the H0 1a, H0 1b and H0 1c are respectively 0.019, 0.000, and
0.000. However the p-value for H01a is just above 0.01 and hence in the border
region;
• Hence the Null Hypothesis that the population proportion and the hypothesized
proportion are equal is rejected for all three hypotheses H1a, H1b and H1c;
• The alternate hypothesis is accepted. The alternate hypothesis states that the
population proportion is less than the hypothesized proportion of 51 per cent for
the “yes” response, indicating that on all the three counts of accountability,
transparency and action-ability, the Corporation of Chennai does not stand the
test.
168

Observations/Conclusions:
• At 51 per cent threshold value all the three hypotheses have been rejected;
• The results of the test are:
o The Chennai Corporation is not acting in an accountable manner;
o The Chennai Corporation does not provide transparent information to the
public;
o The Chennai Corporation does not have any action-ability mechanism.
Statement # 2: Accountability - Transparency - Action-ability are correlated to each other. This statement attempts to establish relationships between the three ATA variables. High
correlation signifies the way the three variables move or behave.
The result of the Correlation test output is given in Table 6-4.
For this two-tailed test of the correlation:
H0: ρ = 0 versus H1: ρ ≠ 0 where ρ is the correlation between a pair of variables.
Here the null hypothesis is that there is no correlation between the variables.
Table 6-4: Testing of A T A – Correlation Hypothesis Accountability: Transparency: Action-ability:
Accountability: Phi Coefficient
1 .275** .077*
Sig. (2-tailed) .000 .046
N 663 663 663 Transparency: Phi
Coefficient .275** 1 .189**
Sig. (2-tailed)
.000 .000
N 663 663 663
Action-ability: Phi Coefficient
.077* .189** 1
Sig. (2-tailed)
.046 .000
N 663 663 663 **. Correlation is significant at the 0.01 level (2-tailed). *. Correlation is significant at the 0.05 level (2-tailed).
Test Results:
• The null hypothesis that there is no correlation between the variables is rejected as
indicated by very low (near zero) p values;
169

• All the three elements are correlated among each other significantly, as indicated by
the Phi coefficient – Table 6-4;
• Accountability and Transparency are correlated at 0.01 level of significance. Null
hypothesis is rejected as the p-value is 0.000;
• Accountability and Action-ability are correlated at 0.05 level of significance.
However null hypothesis rejected as the p-value is 0.046 (less than 0.05) and is a
border line case;
• Transparency and Action-ability are correlated at 0.01 level of significance. Null
hypothesis is rejected with 0.000 p-value;
• The rejection of null hypothesis concludes that the ATA relationship is significant for
Accountability-Transparency and Transparency-Action-ability. There is a significant
relation between Action-ability and Accountability; however, it is not statistically
significant.
Observations/Conclusions:
• There is a good relationship between the ATA elements and hence the Statement
#2 is accepted for Accountability-Transparency and Transparency-Action-ability;
(This does not imply any causal relationship between the variables).
2. EVLN Model
The Exit Voice Loyalty Neglect model basically looks at the choices available to the citizens
when they confront problem with various services provided by public institutions; in this case
the Corporation of Chennai. The EVLN model arises out of the combination of Action X
Inaction (action orientation) vis-à-vis Positive X Negative approach (tolerance orientation). It
is hypothesized that the citizens of Chennai are more action oriented. This hypothesis is
tested first. In this regard a threshold of 75 per cent 102has been considered, as preliminary
analysis (Chapter 5) has shown the action orientation of the citizens is quite high. The
hypothesis is to discuss the significance at this 75 per cent level.
Statement # 3: Citizens of Chennai are ‘action’ oriented and choose to voice their opinion or exit to
alternatives rather than choosing ‘tolerance’ options. Statistical test for proportions was conducted and the results are given in Table – 6-5. 102 By running several iterations, it was found that 75 per cent is a differentiating level. The 51 per cent used in other test does not provide any differentiating results and hence this threshold level used for EVLN related tests.
170
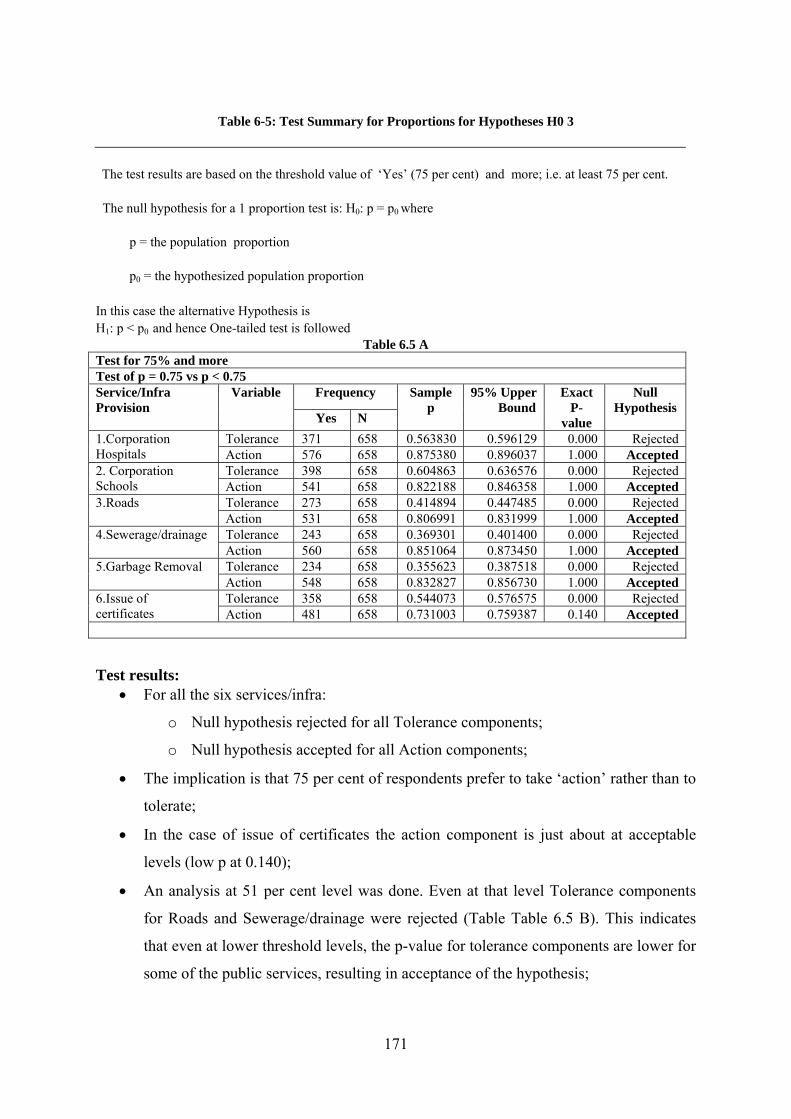
Table 6-5: Test Summary for Proportions for Hypotheses H0 3
The test results are based on the threshold value of ‘Yes’ (75 per cent) and more; i.e. at least 75 per cent.
The null hypothesis for a 1 proportion test is: H0: p = p0 where
� p = the population proportion
� p0 = the hypothesized population proportion
In this case the alternative Hypothesis is H1: p < p0 and hence One-tailed test is followed
Table 6.5 A Test for 75% and more Test of p = 0.75 vs p < 0.75 Service/Infra Provision
Variable Frequency Sample p
95% UpperBound
Exact P-
value
Null Hypothesis
Yes N 1.Corporation Hospitals
Tolerance 371 658 0.563830 0.596129 0.000 Rejected Action 576 658 0.875380 0.896037 1.000 Accepted
2. Corporation Schools
Tolerance 398 658 0.604863 0.636576 0.000 Rejected Action 541 658 0.822188 0.846358 1.000 Accepted
3.Roads Tolerance 273 658 0.414894 0.447485 0.000 Rejected Action 531 658 0.806991 0.831999 1.000 Accepted
4.Sewerage/drainage Tolerance 243 658 0.369301 0.401400 0.000 Rejected Action 560 658 0.851064 0.873450 1.000 Accepted
5.Garbage Removal Tolerance 234 658 0.355623 0.387518 0.000 Rejected Action 548 658 0.832827 0.856730 1.000 Accepted
6.Issue of certificates
Tolerance 358 658 0.544073 0.576575 0.000 Rejected Action 481 658 0.731003 0.759387 0.140 Accepted
Test results: • For all the six services/infra:
o Null hypothesis rejected for all Tolerance components;
o Null hypothesis accepted for all Action components;
• The implication is that 75 per cent of respondents prefer to take ‘action’ rather than to
tolerate;
• In the case of issue of certificates the action component is just about at acceptable
levels (low p at 0.140);
• An analysis at 51 per cent level was done. Even at that level Tolerance components
for Roads and Sewerage/drainage were rejected (Table Table 6.5 B). This indicates
that even at lower threshold levels, the p-value for tolerance components are lower for
some of the public services, resulting in acceptance of the hypothesis;
171

Observations/Conclusions:
• The statement that the citizens of Chennai choose to be ‘action oriented’ by either
voicing their opinion or exiting for some other service holds true; Table 6.5 B
Test for 51% and more Test of p = 0.51 vs p < 0.51 Service/Infra Provision
Variable Frequency Sample p
95% UpperBound
Exact P-
value
Hypothesis Acceptance
Yes N 1.Corporation Hospitals
Tolerance 371 658 0.563830 0.596129 0.997 Accepted Action 576 658 0.875380 0.896037 1.000 Accepted
2. Corporation Schools
Tolerance 398 658 0.604863 0.636576 1.000 Accepted Action 541 658 0.822188 0.846358 1.000 Accepted
3.Roads Tolerance 273 658 0.414894 0.447485 0.000 Rejected Action 531 658 0.806991 0.831999 1.000 Accepted
4.Sewerage/drainage Tolerance 243 658 0.369301 0.401400 0.000 Rejected Action 560 658 0.851064 0.873450 1.000 Accepted
5.Garbage Removal Tolerance 234 658 0.355623 0.387518 0.000 Accepted Action 548 658 0.832827 0.856730 1.000 Accepted
6.Issue of certificates
Tolerance 358 658 0.544073 0.576575 0.963 Accepted Action 481 658 0.731003 0.759387 1.000 Accepted
3. Preparedness for Accountability
The preparedness of the citizens of Chennai with regard to accountability is examined using
two important indicators: (a) basic knowledge of the citizens about the corporation (at ward
level and about the Corporation) and (b) the preparedness of the citizens for participating in
the governance of the activities of the Corporation. These are examined through this
hypothesis.
Statement #4: Chennai citizens possess the basic knowledge about their Corporation and are willing to
participate in the governance of the activities of the Corporation. a. Basic Knowledge
The preparedness for accountability was tested using the base and preliminary indicators
about the basic knowledge of the citizens about the Corporation. Some of the variables were
discussed in Chapter 5 while analyzing the issues underlying. Here the nine key variables
about the knowledge of the Mayor, Commissioner, Ward Number, Ward Name and the Ward
Representative Name; and some of the public interfaces like web-site and Citizens’ Charter
are being tested. These are evaluated at 51 per cent threshold in order to say that the citizens
do have a basic knowledge about Chennai Corporation.
172

Table 6-6: Test Summary for Proportions for Hypotheses H0 4 a
The test results are based on the threshold value of ‘Yes’ (51 per cent) and more; i.e. at least 51 per cent.
The null hypothesis for a 1 proportion test is: H0: p = p0 where
� p = the population proportion
� p0 = the hypothesized population proportion
In this case the alternative Hypothesis is
H1: p < p0 and hence One-tailed test is followed
Test for 51% and more Test of p = 0.51 vs p < 0.51 Variable on the knowledge of Corporation
Frequency Sample p 95% Lower Bound
Exact P-Value
Null Hypothesis Yes N
Q7a.i.Mayor 394 663 0.594268 0.626032 1.000 Accepted Q7a.ii.Commissioner 303 663 0.457014 0.489686 0.004 Rejected Q7a.iii.YourWardName 314 663 0.473605 0.506295 0.033 Rejected Q7a.iv.YourWardNo 295 663 0.444947 0.477584 0.000 Rejected Q7a.v.YourWardRepName 265 663 0.399698 0.432031 0.000 Rejected Q11.a.DoyouknowtheCorpor 189 663 0.285068 0.315338 0.000 Rejected Q11.d.Birthdeathcertific 124 663 0.187029 0.213713 0.000 Rejected Q12.a.i.DoyouknowtheChen 202 663 0.304676 0.335442 0.000 Rejected Q12.c.ii.Doyouknowtherei 104 663 0.156863 0.181979 0.000 Rejected Source: Survey output
Test results:
• Of the tests on the nine variables the test has rejected eight except for the variable:
‘knowledge about the Mayor’. This means that only about the Mayor and the Ward
name 51 per cent or more persons know at 95 per cent significance level;
• For all the other variables at 51 per cent level, the p value is 0.000, indicating the
strong rejection of the hypothesis that the respondents have knowledge about the
Corporation.
Observations and Conclusions
• The citizens of Chennai do not seem to have even basic knowledge about their local
government – Corporation;
• Only the name of the Mayor seems to be the familiar aspect of the citizens’
knowledge with regard to the Corporation;
173

• With regard to other information about the Corporation the level of knowledge seems
to be much less. This means even 51 per cent of the citizens do not know any aspect
of Corporation (considered here) other than Mayor’s name.
b. Participation
Another issue in consideration of the preparedness of the citizens in order to make them part
of the value chain in implementing accountability related activities is ‘participation’.
Participation is considered to be the key issue from the perspective of the stakeholders. In the
case of citizens this is of prime importance as the involvement of citizens at the ward level
activities (nearest to their dwelling) is likely to contribute for increased accountability of the
Corporation.
Considering these issues the respondents were asked for their willingness to participate in the
activities of the Corporation (at the ward level). The results are given in Table 6.6.
Table 6-7: Test Summary for proportions for Hypothesis 4b Test of p = 0.62 vs p < 0.62
Variable Frequency Sample p
95% Upper Bound
Exact P-Value
Acceptance of Null Hypothesis
Yes N
Participation 411 663 0.61991 0.651230 0.513 Accepted Test Results:
• The test was done at the threshold level of 62 per cent, which is based on the
percentage of ‘yes’ responses to this question on participation and the hypothesis was
accepted indicating that 62 per cent of the respondents accepted participation,
rejecting the hypothesis that the participation is greater than 62 per cent;
• Tests were simulated for 67.5 per cent and it was found that up to 67.5 per cent of the
citizens are willing to participate in the affairs of the Corporation.
Observations and Conclusions
• In general more people are willing to participate in the affairs of the Corporation at
the ward level, though this level (67.5 per cent) may be insufficient to stir a major
change.
174
Considering both the factors knowledge of the Corporation and willingness to participate, it is
found that the preparedness of the citizens is not up to the desired level. These characteristics
raise issues on the ‘preparedness’ of Chennai citizens to demand accountability from
Corporation.
Section III: Demography based analysis of the Hypothesis Tests
In order to understand the sensitivity of the entire analysis, the hypotheses tests were done for
the following demographic variables:
• Gender
• Age group
• Income
• Employment
• Education
These are considered for the three major considerations: ATA Model, EVLN Model, and
Preparedness for Accountability in this section.
1. Demographic Analysis of ATA Model
Analysis of ATA Model results for varying demographic considerations are discussed in this
section. Three issues: Accountability, Transparency and Action-ability were taken up and as
given in Table 6-3, it was found that Chennai Corporation was not considered to be behaving
in an accountable manner even by 51 per cent of the population. Also, even 51 per cent of the
citizens did not consider that the Corporation has transparency in sharing of information and
action-ability in addressing issues. Now these issues are examined for various demographic
variables like Gender, Age, Income, Employment, and Education.
This analysis is done similar to hypothesis testing for three different sets of variables: ATA
Model, EVLN Model and preparedness of the citizens for accountability.
175

1. ATA Model
a. Presence of ATA in Chennai Corporation
Statement #1a: The Corporation of Chennai is acting in an accountable manner towards the citizens. Statement #1b: The Corporation of Chennai is transparent in providing information to the city. Statement #1c: The Corporation of Chennai has action-ability in addressing issues of the citizens The behavior of the variables for the above three hypotheses is given in Table 6-8.
Table 6-8: Demography based analysis of ATA Statements – Hypotheses 1a to 1c Demographic indicator Test focus p-
value at 95%
Hypothesis Acceptancep >0.05
Variation or difference from the overall hypothesis testing
A. Gender 1. Male Accountability 0.022 Rejected No variation
Transparency 0.000 Rejected Action-ability 0.000 Rejected
2. Female Accountability 0.210 Accepted Here accountability has been accepted. Transparency 0.000 Rejected
Action-ability 0.000 Rejected B. Age Group
1. 19-25 years Accountability 0.054 Accepted Here accountability has been accepted. Transparency 0.000 Rejected
Action-ability 0.000 Rejected 2. 26-35 years Accountability 0.850 Accepted Here accountability has
been accepted. Transparency 0.000 Rejected Action-ability 0.000 Rejected
3. 36-45 years Accountability 0.711 Accepted Here accountability has been accepted. Transparency 0.000 Rejected
Action-ability 0.000 Rejected 4. 46-55 years Accountability 0.090 Accepted Here accountability has
been accepted. Transparency 0.000 Rejected Action-ability 0.000 Rejected
5. 55 years + Accountability 0.209 Accepted Only transparency has been rejected. Transparency 0.005 Rejected
Action-ability 0.209 Accepted C. Income level
1. No Income Accountability 0.040 Rejected No variation. Transparency 0.000 Rejected Action-ability 0.000 Rejected
2. < Rs.5,000 Accountability 0.745 Accepted Here accountability has been accepted. Transparency 0.005 Rejected
Action-ability 0.001 Rejected 3. Rs.5,000 – 10,000 Accountability 0.007 Rejected No Variation.
Transparency 0.000 Rejected Action-ability 0.000 Rejected
4. Rs.10,000– 15,000 Accountability 0.859 Accepted Here accountability has been accepted. Transparency 0.000 Rejected
Action-ability 0.003 Rejected 5. Rs.15,000 – 25,000 Accountability 0.127 Accepted Only transparency has
been rejected. Transparency 0.000 Rejected Action-ability 0.089 Accepted
6. Rs.25,000 + Accountability 0.340 Accepted Only transparency has been rejected. Transparency 0.001 Rejected
176

Demographic indicator Test focus p-value at 95%
Hypothesis Acceptancep >0.05
Variation or difference from the overall hypothesis testing
Action-ability 0.917 Accepted D. Occupation
1. Public sector Accountability 0.554 Accepted Only transparency has been rejected. Transparency 0.008 Rejected
Action-ability 0.241 Accepted 2. Private sector Accountability 0.015 Rejected No variation
Transparency 0.000 Rejected Action-ability 0.000 Rejected
3. Self employed Accountability 0.068 Accepted Here accountability has been accepted. Transparency 0.001 Rejected
Action-ability 0.016 Rejected 4. Un employed Accountability 0.104 Accepted Here accountability has
been accepted. Transparency 0.000 Rejected Action-ability 0.000 Rejected
E. Qualification 1. Uneducated Accountability 0.193 Accepted Here accountability has
been accepted. Transparency 0.000 Rejected Action-ability 0.000 Rejected
2. School education Accountability 0.760 Accepted Here accountability has been accepted. Transparency 0.000 Rejected
Action-ability 0.000 Rejected 3. Graduate Accountability 0.068 Accepted Here accountability has
been accepted. Transparency 0.000 Rejected Action-ability 0.000 Rejected
4. PG and + Accountability 0.011 Rejected No Variation. Transparency 0.000 RejectedAction-ability 0.040 Rejected
Test results: The Analysis of Table 6-8 shows that:
• The overall ATA Model observations do change for all the demographic variables;
• Gender: For males there is no change, while the females accept the presence of
accountability, though they also reject the other two factors;
• Age: All the age groups, except the senior ones (55 years +) accept the presence of
accountability, while this senior age group accept that even action-ability is present
and reject only the transparency;
• Income: In the case of three income levels all the three factors rejected by: No income
and Rs.5,000-10,000 levels, only accountability accepted by < Rs.5,000 and
Rs.10,000-15,000 levels. The other two higher income levels reject only transparency;
• Occupation: The public sector employees reject only transparency, while the private
sector employees say that all the three factors are absent. The other two sub-groups
accept only the presence of accountability;
177

• Education: The post graduate and above qualified persons reject the presence of all
the three parameters like the population as a whole. The other three sub-groups accept
only the presence of accountability.
Observations and Conclusions:
• There are demography sensitive variations;
• The female population accepts the presence of accountability, like most of the age
groups except the 55 plus;
• No particular pattern is observed from the income group classifications;
• The public sector employees support the presence of both accountability and action-
ability, while the private sector employees totally reject the presence of all the three
factors. Others accept only the presence of accountability;
• The most qualified group (PG+) reject all the three factors, while the others accept
only the presence of accountability;
• No category has accepted the presence of all the three factors;
• There has been no category of people who seem to feel that Corporation is working in
a transparent manner;
• Hence of the three components in ATA Model, Transparency is rated low for Chennai
Corporation; and all the three of them are generally not present up to the expected
level.
b. Relationship between ATA
Statement # 2: Accountability - Transparency - Action-ability are correlated to each other.
Table 6-9: Demography based analysis of ATA Correlations – Hypothesis 2
Acc-Tra Tra - Act Act-Acc Variation or difference from the overall hypothesis testing
P – Corr p-value 95%
P - Corr p-value 95%
P- Corr p-value 95%
A. Gender Male 0.298** 0.000 R 0.164** 0.002 R 0.047 0.378 A Variation only
in the case of males.
Female 0.248** 0.000 R 0.224** 0.000 R 0.118* 0.039 R
B. Age 19-24 yrs 0.221* 0.017 R 0.215* 0.020 R 0.131 0.161 A
Variation across all the age groups.
25-35 yrs 0.247** 0.000 R 0.139* 0.138 A 0.067 0.319 A 36-45 yrs 0.222** 0.003 R 0.204** 0.006 R 0.038 0.618 A 46-55yrs 0.462** 0.000 R 0.240* 0.010 R 0.117 0.215 A 55 yrs + 0.300 0.089 A 0.163 0.366 A 0.008 0.967 A
178

Acc-Tra Tra - Act Act-Acc Variation or difference from the overall hypothesis testing
P – Corr p-value 95%
P - Corr p-value 95%
P- Corr p-value 95%
C. Income No income 0.324** 0.000 R 0.165** 0.017 R 0.090 0.194 A Variation across
all the income groups.
<Rs.5,000 pm 0.248 0.068 A 0.406** 0.002 R 0.102 0.457 A Rs.5,000-10,000
0.146 0.117 A 0.252** 0.006 R 0.128 0.168 A
Rs.10,000 -15,000
0.343** 0.000 R 0.189* 0.030 R 0.119 0.175 A
Rs.15,000 – 25,000
0.169 0.112 A 0.132 0.215 A -0.015 0.888 A
\Rs.25,000 + 0.392** 0.000 R 0.101 0.440 A -0.074 0.569 A D. Occupation Public Sector 0.444** 0.001 R 0.111 0.436 A 0.022 0.880 A No variation
only in the case of self employed.
Private Sector 0.206** 0.000 R 0.192 0.001 R 0.067 0.241 A Self Employed 0.328** 0.001 R 0.311** 0.002 R 0.205* 0.045 R Unemployed 0.292** 0.000 R 0.136* 0.049 A 0.037 0.597 A
E. Qualification Uneducated 0.379** 0.000 R 0.197* 0.034 R 0.120 0.198 A Variation across
all the education levels.
School 0.233* 0.003 R 0.235** 0.003 R -0.021 0.798 A Graduate 0.209** 0.001 R 0.100 0.103 A 0.128* 0.038 R PG and + 0.361** 0.000 R 0.328** 0.000 R 0.087 0.335 A
Correlation 0.01 level 15/21 9/21 Nil Correlation 0.05 level 2/21 6/21 3/21 Low Correlation 4/21 5/21 18/21 Null hypothesis acceptance
4/21 5/21 18/21
** correlation is significant at 0.01 level (2-tailed) *correlation is significant at 0.05 level (2-tailed) p-value >0.05, Null hypothesis accepted Test results: The analysis of Table 6-9 shows as follows:
• The tabulation shows the correlations and p-values for Accountability-Transparency;
Transparency-Action-ability; Action-ability-Accountability;
• Gender: In the case of both males and females, the Action-ability-Accountability
relationship is weak as indicated by the acceptance of the hypothesis that the
variables are not correlated;
• Age: In general, the Action-ability-Accountability relationship is the weakest without
any strong correlations. The 55 years + do not seem to favour all the three
relationships;
• Income: The Action-ability- Accountability is weak across all income segments; for
the higher income levels the correlation is negative. In the case of Rs.15,000-25,000
all the three relationships have been accepted;
• Occupation: Accountability-Transparency relationship is very significant across all
the occupation segments. The self employed accept all the three relationships;
179

• Qualification: Accountability-Transparency relationship is very significant across all
the uneducated and educated. The Transparency-Action-ability, the Action-ability-
Accountability relationship is seen to be weak and mixed for all the segments.
Observations and Conclusions:
• The Accountability-Transparency relationship is very highly correlated indicated by
highest number of significant correlation coefficients (15 at 0.01 level and 2 at 0.05
level) out of total 21 correlations. Null hypothesis has been rejected by 17 out of 21
cases indicating the high correlation between these variables;
• Next correlated relationship is between Transparency and Action-ability with
relatively less number of significant correlation coefficients (9 at 0.01 level and 6 at
0.05 level) out of the total 21 correlations. Null hypothesis has been rejected by 16
cases, still indicating the acceptance of the correlations;
• The Action-ability and Accountability relationship seems the least with only 3
correlations at 0.05 level, and another three of the relationships show negative
relationship. The null hypothesis has been accepted by 18 demographic segments
taken up for the study;
• No specific pattern among the various demographic variations is observed;
• To Summarize:
o The Accountability-Transparency and Transparency-action-ability
relationships are significant across all the demographic levels;
o The Action-ability-Accountability relationship appears weak across all the
demographic segments.
2.Demographic Analysis of EVLN Model The sensitivity of both the Action-Tolerance orientation of the citizens is discussed here. Statement # 3: Citizens of Chennai are ‘action’ oriented and choose to voice their opinion or exit to alternatives rather than choosing ‘tolerance’ options.
180

Table 6-10: Demography based analysis of Action or Tolerance orientation – Hypothesis 3 Demographic indicator Services Test focus p-
value at 95%
Hypothesis Acceptance p >0.05
Variation or difference from the overall hypothesis testing
A. Gender 1. Male
1.Corporation Hospitals
Tolerance 0.000 Rejected Action more than tolerance; except in the case of issue of certificates.
Action 1.000 Accepted 2. Corporation Schools
Tolerance 0.000 Rejected Action 1.000 Accepted
3.Roads Tolerance 0.000 Rejected Action 0.997 Accepted
4.Sewerage/drainage Tolerance 0.000 Rejected Action 1.000 Accepted
5.Garbage Removal Tolerance 0.000 Rejected Action 1.000 Accepted
6.Issue of certificates
Tolerance 0.000 Rejected Action 0.034 Rejected
2. Female
1.Corporation Hospitals
Tolerance 0.000 Rejected No variation – Action more than tolerance.
Action 1.000 Accepted 2. Corporation Schools
Tolerance 0.000 Rejected Action 0.991 Accepted
3.Roads Tolerance 0.000 Rejected Action 0.987 Accepted
4.Sewerage/drainage Tolerance 0.000 Rejected Action 1.000 Accepted
5.Garbage Removal Tolerance 0.000 Rejected Action 0.998 Accepted
6.Issue of certificates
Tolerance 0.000 Rejected Action 0.675 Accepted
B. Age Group 1. 19-25 years
1.Corporation Hospitals
Tolerance 0.000 Rejected No variation – Action more than tolerance.
Action 1.000 Accepted 2. Corporation Schools
Tolerance 0.006 Rejected Action 0.997 Accepted
3.Roads Tolerance 0.000 Rejected Action 0.662 Accepted
4.Sewerage/drainage Tolerance 0.000 Rejected Action 0.962 Accepted
5.Garbage Removal Tolerance 0.000 Rejected Action 0.962 Accepted
6.Issue of certificates
Tolerance 0.000 Rejected Action 0.327 Accepted
2. 26-35 years
1.Corporation Hospitals
Tolerance 0.000 Rejected No variation – Action more than tolerance.
Action 1.000 Accepted 2. Corporation Schools
Tolerance 0.000 Rejected Action 0.921 Accepted
3.Roads Tolerance 0.000 Rejected Action 0.997 Accepted
4.Sewerage/drainage Tolerance 0.000 Rejected Action 0.999 Accepted
5.Garbage Removal Tolerance 0.000 Rejected Action 0.992 Accepted
6.Issue of certificates
Tolerance 0.000 Rejected Action 0.083 Accepted
181

Demographic indicator Services Test focus p-value at 95%
Hypothesis Acceptance p >0.05
Variation or difference from the overall hypothesis testing
3. 36-45 years
1.Corporation Hospitals
Tolerance 0.000 Rejected No variation – Action more than tolerance.
Action 1.000 Accepted 2. Corporation Schools
Tolerance 0.000 Rejected Action 0.980 Accepted
3.Roads Tolerance 0.000 Rejected Action 0.995 Accepted
4.Sewerage/drainage Tolerance 0.000 Rejected Action 1.000 Accepted
5.Garbage Removal Tolerance 0.000 Rejected Action 0.998 Accepted
6.Issue of certificates
Tolerance 0.000 Rejected Action 0.831 Accepted
4. 46-55 years
1.Corporation Hospitals
Tolerance 0.000 Rejected No variation – Action more than tolerance.
Action 0.996 Accepted 2. Corporation Schools
Tolerance 0.001 Rejected Action 0.993 Accepted
3.Roads Tolerance 0.000 Rejected Action 0.791 Accepted
4.Sewerage/drainage Tolerance 0.000 Rejected Action 0.998 Accepted
5.Garbage Removal Tolerance 0.000 Rejected Action 0.998 Accepted
6.Issue of certificates
Tolerance 0.000 Rejected Action 0.128 Accepted
5. 55 years +
1.Corporation Hospitals
Tolerance 0.000 Rejected No variation – Action more than tolerance.
Action 0.996 Accepted 2. Corporation Schools
Tolerance 0.001 Rejected Action 0.993 Accepted
3.Roads Tolerance 0.000 Rejected Action 0.791 Accepted
4.Sewerage/drainage Tolerance 0.000 Rejected Action 0.998 Accepted
5.Garbage Removal Tolerance 0.000 Rejected Action 0.998 Accepted
6.Issue of certificates
Tolerance 0.000 Rejected Action 0.128 Accepted
C. Income 1. No income
1.Corporation Hospitals
Tolerance 0.000 Rejected No variation – Action more than tolerance.
Action 1.000 Accepted 2. Corporation Schools
Tolerance 0.002 Rejected Action 1.000 Accepted
3.Roads Tolerance 0.000 Rejected Action 0.696 Accepted
4.Sewerage/drainage Tolerance 0.000 Rejected Action 0.991 Accepted
5.Garbage Removal Tolerance 0.000 Rejected Action 0.991 Accepted
6.Issue of certificates
Tolerance 0.000 Rejected Action 0.842 Accepted
2. < Rs.5,000 pm
1.Corporation Hospitals
Tolerance 0.021 Rejected Issue of certificates Action 0.521 Accepted
182

Demographic indicator Services Test focus p-value at 95%
Hypothesis Acceptance p >0.05
Variation or difference from the overall hypothesis testing
2. Corporation Schools
Tolerance 0.040 Rejected rejected at his income level.
Action 0.287 Accepted 3.Roads Tolerance 0.000 Rejected
Action 0.955 Accepted 4.Sewerage/drainage Tolerance 0.000 Rejected
Action 0.997 Accepted 5.Garbage Removal Tolerance 0.000 Rejected
Action 0.955 Accepted 6.Issue of certificates
Tolerance 0.000 Rejected Action 0.038 Rejected
3. Rs.5,000-10,000 pm
1.Corporation Hospitals
Tolerance 0.000 Rejected Issue of certificates rejected at his income level.
Action 0.932 Accepted 2. Corporation Schools
Tolerance 0.000 Rejected Action 0.089 Accepted
3.Roads Tolerance 0.000 Rejected Action 0.558 Accepted
4.Sewerage/drainage Tolerance 0.000 Rejected Action 0.958 Accepted
5.Garbage Removal Tolerance 0.000 Rejected Action 0.721 Accepted
6.Issue of certificates
Tolerance 0.000 Rejected Action 0.001 Rejected
4. Rs.10,000-15,000 pm
1.Corporation Hospitals
Tolerance 0.000 Rejected No variation – Action more than tolerance.
Action 1.000 Accepted 2. Corporation Schools
Tolerance 0.000 Rejected Action 0.960 Accepted
3.Roads Tolerance 0.000 Rejected Action 0.975 Accepted
4.Sewerage/drainage Tolerance 0.000 Rejected Action 1.000 Accepted
5.Garbage Removal Tolerance 0.000 Rejected Action 0.999 Accepted
6.Issue of certificates
Tolerance 0.000 Rejected Action 0.238 Accepted
5. Rs.15,000-25,000 pm
1.Corporation Hospitals
Tolerance 0.000 Rejected No variation – Action more than tolerance.
Action 1.000 Accepted 2. Corporation Schools
Tolerance 0.000 Rejected Action 1.000 Accepted
3.Roads Tolerance 0.000 Rejected Action 1.000 Accepted
4.Sewerage/drainage Tolerance 0.000 Rejected Action 1.000 Accepted
5.Garbage Removal Tolerance 0.000 Rejected Action 0.999 Accepted
6.Issue of certificates
Tolerance 0.000 Rejected Action 0.681 Accepted
6. Rs.25,000 + pm
1.Corporation Hospitals
Tolerance 0.000 Rejected No variation – Action more than
Action 1.000 Accepted 2. Corporation Tolerance 0.009 Rejected
183

Demographic indicator Services Test focus p-value at 95%
Hypothesis Acceptance p >0.05
Variation or difference from the overall hypothesis testing
Schools Action 0.999 Accepted tolerance. 3.Roads Tolerance 0.000 Rejected
Action 0.997 Accepted 4.Sewerage/drainage Tolerance 0.000 Rejected
Action 0.997 Accepted 5.Garbage Removal Tolerance 0.000 Rejected
Action 0.997 Accepted 6.Issue of certificates
Tolerance 0.004 Rejected Action 0.578 Accepted
D. Occupation 1. Public Sector 1.Corporation
Hospitals Tolerance 0.008 Rejected Public
sector employees prefer to be both active and tolerant with regard to Schools. Issue of Certificates rejected.
Action 0.961 Accepted 2. Corporation Schools
Tolerance 0.185 Accepted Action 0.762 Accepted
3.Roads Tolerance 0.000 Rejected Action 0.920 Accepted
4.Sewerage/drainage Tolerance 0.000 Rejected Action 0.998 Accepted
5.Garbage Removal Tolerance 0.000 Rejected Action 0.648 Accepted
6.Issue of certificates
Tolerance 0.001 Rejected Action 0.035 Rejected
2. Private Sector 1.Corporation Hospitals
Tolerance 0.000 Rejected Issue of certificates rejected.
Action 1.000 Accepted 2. Corporation Schools
Tolerance 0.000 Rejected Action 0.993 Accepted
3.Roads Tolerance 0.000 Rejected Action 1.000 Accepted
4.Sewerage/drainage Tolerance 0.000 Rejected Action 1.000 Accepted
5.Garbage Removal Tolerance 0.000 Rejected Action 1.000 Accepted
6.Issue of certificates
Tolerance 0.000 Rejected Action 0.047 Rejected
3. Self Employed
1.Corporation Hospitals
Tolerance 0.000 Rejected No variation – Action more than tolerance.
Action 0.999 Accepted 2. Corporation Schools
Tolerance 0.000 Rejected Action 0.905 Accepted
3.Roads Tolerance 0.000 Rejected Action 0.609 Accepted
4.Sewerage/drainage Tolerance 0.000 Rejected Action 0.941 Accepted
5.Garbage Removal Tolerance 0.000 Rejected Action 0.990 Accepted
6.Issue of certificates
Tolerance 0.000 Rejected Action 0.632 Accepted
4. Unemployed
1.Corporation Hospitals
Tolerance 0.000 Rejected No variation – Action more than tolerance.
Action 1.000 Accepted 2. Corporation Schools
Tolerance 0.001 Rejected Action 1.000 Accepted
3.Roads Tolerance 0.000 Rejected
184

Demographic indicator Services Test focus p-value at 95%
Hypothesis Acceptance p >0.05
Variation or difference from the overall hypothesis testing
Action 0.851 Accepted 4.Sewerage/drainage Tolerance 0.000 Rejected
Action 0.998 Accepted 5.Garbage Removal Tolerance 0.000 Rejected
Action 0.997 Accepted 6.Issue of certificates
Tolerance 0.000 Rejected Action 0.851 Accepted
E. Education 1. Uneducated
1.Corporation Hospitals
Tolerance 0.000 Rejected No variation – Action more than tolerance.
Action 1.000 Accepted 2. Corporation Schools
Tolerance 0.000 Rejected Action 0.950 Accepted
3.Roads Tolerance 0.000 Rejected Action 0.832 Accepted
4.Sewerage/drainage Tolerance 0.000 Rejected Action 0.998 Accepted
5.Garbage Removal Tolerance 0.000 Rejected Action 0.990 Accepted
6.Issue of certificates
Tolerance 0.000 Rejected Action 0.832 Accepted
2. School
1.Corporation Hospitals
Tolerance 0.000 Rejected No variation – Action more than tolerance.
Action 0.999 Accepted 2. Corporation Schools
Tolerance 0.002 Rejected Action 0.974 Accepted
3.Roads Tolerance 0.000 Rejected Action 0.913 Accepted
4.Sewerage/drainage Tolerance 0.000 Rejected Action 0.999 Accepted
5.Garbage Removal Tolerance 0.000 Rejected Action 0.995 Accepted
6.Issue of certificates
Tolerance 0.000 Rejected Action 0.107 Accepted
3. Graduate
1.Corporation Hospitals
Tolerance 0.000 Rejected No variation – Action more than tolerance.
Action 1.000 Accepted 2. Corporation Schools
Tolerance 0.000 Rejected Action 0.987 Accepted
3.Roads Tolerance 0.000 Rejected Action 0.930 Accepted
4.Sewerage/drainage Tolerance 0.000 Rejected Action 1.000 Accepted
5.Garbage Removal Tolerance 0.000 Rejected Action 0.987 Accepted
6.Issue of certificates
Tolerance 0.000 Rejected Action 0.135 Accepted
4. PG and +
1.Corporation Hospitals
Tolerance 0.000 Rejected No variation – Action more than tolerance.
Action 1.000 Accepted 2. Corporation Schools
Tolerance 0.001 Rejected Action 1.000 Accepted
3.Roads Tolerance 0.000 Rejected
185

Demographic indicator Services Test focus p-value at 95%
Hypothesis Acceptance p >0.05
Variation or difference from the overall hypothesis testing
Action 1.000 Accepted 4.Sewerage/drainage Tolerance 0.000 Rejected
Action 1.000 Accepted 5.Garbage Removal Tolerance 0.000 Rejected
Action 1.000 Accepted 6.Issue of certificates
Tolerance 0.042 Rejected Action 0.452 Accepted
Test results:
• The EVLN model’s behaviour with regard to both action and tolerance components is
generally very similar to the overall observation (16 out of the 21 demographic
indicators indicate the same);
• Gender: In the case of males, issue of certificates has been rejected;
• Age: No variation across all the sub-groups;
• Income: For <Rs.5,000 pm and Rs.5,000-10,000 pm issue of certificates has been
rejected. All other sub-groups are in line with the overall observation;
• Occupation: In the case of public sector employees, they seek action in the case of
schools, and they reject issue of certificates; in the case of private sector employees
also issue of certificates has been rejected;
• Education: Across all the sub-groups there is no variation from the overall
observations.
Observation and Conclusions:
• In general, the action components are more preferred by the respondents than
tolerance across all the demographic segments, except for a few identified above;
• This confirms that the respondents prefer ‘action’ behavior – exit and voice – as their
reaction to the services provided by the Corporation, than tolerant behaviour.
186

Statement #4: Chennai citizens possess the basic knowledge about their Corporation and are willing to participate in the governance of the activities of the Corporation.
Table 6-11: Demography based analysis of Preparedness for Accountability – Basic Knowledge - Hypothesis 4 (part a – basic knowledge)
Demographic indicator Test focus p-value at 95%
Hypothesis Acceptancep >0.05
Variation or difference from the overall hypothesis testing
A. Gender 1. Male
Mayor 1.000 Accepted Knowledge of
Commissioner and Ward name is found in the case of Males.
Commissioner 0.333 AcceptedWard name 0.260 AcceptedWard No 0.004 Rejected Ward rep name 0.000 Rejected Online facility 0.000 Rejected Birth/death 0.000 Rejected Website 0.000 Rejected Citizen Charter 0.000 Rejected
2. Female Mayor 0.930 Accepted No variation – only Mayor’s name is known. Commissioner 0.000 Rejected
Ward name 0.026 Rejected Ward No 0.026 Rejected Ward rep name 0.000 RejectedOnline facility 0.000 RejectedBirth/death 0.000 RejectedWebsite 0.000 RejectedCitizen Charter 0.000 Rejected
B. Age Group 1. 19-25 years Mayor 0.451 Accepted No variation – only
Mayor’s name is known. Commissioner 0.003 Rejected Ward name 0.024 Rejected Ward No 0.001 RejectedWard rep name 0.000 RejectedOnline facility 0.003 RejectedBirth/death 0.000 RejectedWebsite 0.005 RejectedCitizen Charter 0.000 Rejected
2. 26-35 years Mayor 0.9990 Accepted This age group seems to be well informed with the knowledge of Ward name, and Ward number.
Commissioner 0.0100 Rejected Ward name 0.4880 AcceptedWard No 0.4340 AcceptedWard rep name 0.0150 Rejected Online facility 0.0000 Rejected Birth/death 0.0000 Rejected Website 0.0000 Rejected Citizen Charter 0.0000 Rejected
3. 36-45 years Mayor 0.998 Accepted This age group seems to be well informed with the knowledge of Commissioner, Ward name, and Ward number.
Commissioner 0.173 AcceptedWard name 0.311 AcceptedWard No 0.260 AcceptedWard rep name 0.045 Rejected Online facility 0.000 Rejected
187

Demographic indicator Test focus p-value at 95%
Hypothesis Acceptancep >0.05
Variation or difference from the overall hypothesis testing
Birth/death 0.000 RejectedWebsite 0.000 RejectedCitizen Charter 0.000 Rejected
4. 46-55 years Mayor 0.998 Accepted This age group has knowledge of Commissioner, and Ward name.
Commissioner 0.902 AcceptedWard name 0.278 AcceptedWard No 0.018 RejectedWard rep name 0.043 RejectedOnline facility 0.000 Rejected Birth/death 0.000 Rejected Website 0.000 Rejected Citizen Charter 0.000 Rejected
5. 55 years + Mayor 0.824 Accepted This age groups has knowledge of Commissioner and the ward name.
Commissioner 0.322 AcceptedWard name 0.065 AcceptedWard No 0.005 RejectedWard rep name 0.002 RejectedOnline facility 0.000 RejectedBirth/death 0.000 RejectedWebsite 0.000 RejectedCitizen Charter 0.000 Rejected
C. Income level 1. No Income Mayor 0.578 Accepted No variation – only
Mayor’s name is known.
Commissioner 0.000 Rejected Ward name 0.011 Rejected Ward No 0.002 RejectedWard rep name 0.000 RejectedOnline facility 0.000 RejectedBirth/death 0.000 RejectedWebsite 0.000 RejectedCitizen Charter 0.000 Rejected
2. < Rs.5,000 Mayor 0.548 Accepted At this income level except for Commissioner’s name Other Ward level information is known.
Commissioner 0.005 Rejected Ward name 0.338 AcceptedWard No 0.652 AcceptedWard rep name 0.441 AcceptedOnline facility 0.000 RejectedBirth/death 0.000 RejectedWebsite 0.000 RejectedCitizen Charter 0.000 Rejected
3. Rs.5,000 – 10,000 Mayor 0.949 Accepted At this income level, respondents know Commissioner’s name and Ward name.
Commissioner 0.065 AcceptedWard name 0.279 AcceptedWard No 0.030 RejectedWard rep name 0.004 RejectedOnline facility 0.000 RejectedBirth/death 0.000 RejectedWebsite 0.000 RejectedCitizen Charter 0.000 Rejected
4. Rs.10,000– 15,000 Mayor 1.000 Accepted All the Ward level
188

Demographic indicator Test focus p-value at 95%
Hypothesis Acceptancep >0.05
Variation or difference from the overall hypothesis testing
Commissioner 0.895 Accepted information known to the respondents. Ward name 0.859 Accepted
Ward No 0.816 AcceptedWard rep name 0.376 AcceptedOnline facility 0.000 RejectedBirth/death 0.000 RejectedWebsite 0.000 RejectedCitizen Charter 0.000 Rejected
5. Rs.15,000 – 25,000 Mayor 0.996 Accepted All the Ward level information known to the respondents.
Commissioner 0.918 AcceptedWard name 0.237 AcceptedWard No 0.089 AcceptedWard rep name 0.237 AcceptedOnline facility 0.001 RejectedBirth/death 0.000 RejectedWebsite 0.014 Rejected Citizen Charter 0.000 Rejected
6. Rs.25,000 + Mayor 0.917 Accepted At this income level, respondents know Commissioner’s name and Ward name.
Commissioner 0.340 AcceptedWard name 0.252 AcceptedWard No 0.007 RejectedWard rep name 0.007 RejectedOnline facility 0.045 Rejected Birth/death 0.007 Rejected Website 0.045 Rejected Citizen Charter 0.001 Rejected
D. Occupation 1. Public sector Mayor 0.983 Accepted The public sector
employees have complete knowledge of the ward level information.
Commissioner 0.241 AcceptedWard name 0.661 AcceptedWard No 0.661 AcceptedWard rep name 0.443 AcceptedOnline facility 0.001 RejectedBirth/death 0.000 RejectedWebsite 0.001 RejectedCitizen Charter 0.000 Rejected
2. Private sector Mayor 1.000 Accepted Respondents working in this sector do not seem to have knowledge of the Ward representative’s name at ward level.
Commissioner 0.587 AcceptedWard name 0.244 AcceptedWard No 0.068 AcceptedWard rep name 0.003 RejectedOnline facility 0.000 RejectedBirth/death 0.000 RejectedWebsite 0.000 RejectedCitizen Charter 0.000 Rejected
3. Self employed Mayor 0.765 Accepted Self employed persons have knowledge of ward name and ward representative’s name.
Commissioner 0.027 RejectedWard name 0.462 AcceptedWard No 0.027 RejectedWard rep name 0.094 Accepted
189
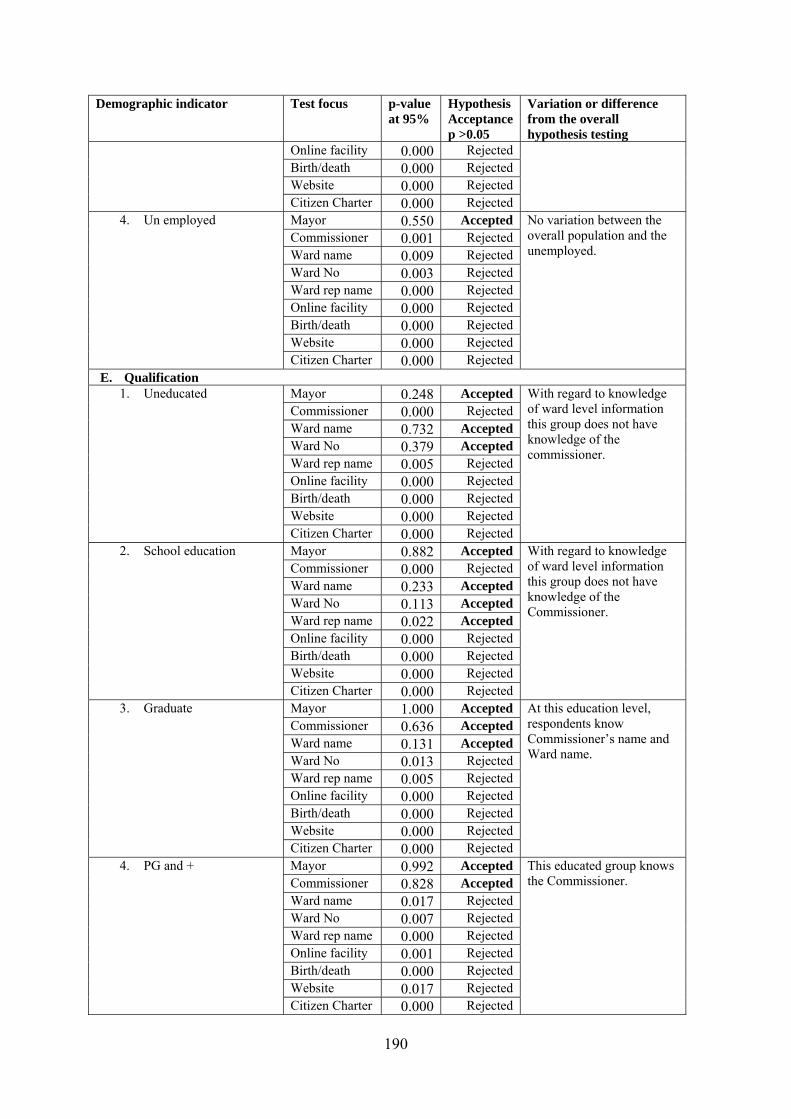
Demographic indicator Test focus p-value at 95%
Hypothesis Acceptancep >0.05
Variation or difference from the overall hypothesis testing
Online facility 0.000 RejectedBirth/death 0.000 RejectedWebsite 0.000 RejectedCitizen Charter 0.000 Rejected
4. Un employed Mayor 0.550 Accepted No variation between the overall population and the unemployed.
Commissioner 0.001 Rejected Ward name 0.009 Rejected Ward No 0.003 RejectedWard rep name 0.000 RejectedOnline facility 0.000 RejectedBirth/death 0.000 RejectedWebsite 0.000 RejectedCitizen Charter 0.000 Rejected
E. Qualification 1. Uneducated Mayor 0.248 Accepted With regard to knowledge
of ward level information this group does not have knowledge of the commissioner.
Commissioner 0.000 Rejected Ward name 0.732 AcceptedWard No 0.379 AcceptedWard rep name 0.005 RejectedOnline facility 0.000 RejectedBirth/death 0.000 RejectedWebsite 0.000 RejectedCitizen Charter 0.000 Rejected
2. School education Mayor 0.882 Accepted With regard to knowledge of ward level information this group does not have knowledge of the Commissioner.
Commissioner 0.000 Rejected Ward name 0.233 AcceptedWard No 0.113 AcceptedWard rep name 0.022 AcceptedOnline facility 0.000 RejectedBirth/death 0.000 RejectedWebsite 0.000 RejectedCitizen Charter 0.000 Rejected
3. Graduate Mayor 1.000 Accepted At this education level, respondents know Commissioner’s name and Ward name.
Commissioner 0.636 AcceptedWard name 0.131 AcceptedWard No 0.013 RejectedWard rep name 0.005 Rejected Online facility 0.000 Rejected Birth/death 0.000 Rejected Website 0.000 Rejected Citizen Charter 0.000 Rejected
4. PG and + Mayor 0.992 Accepted This educated group knows the Commissioner. Commissioner 0.828 Accepted
Ward name 0.017 RejectedWard No 0.007 RejectedWard rep name 0.000 RejectedOnline facility 0.001 Rejected Birth/death 0.000 Rejected Website 0.017 Rejected Citizen Charter 0.000 Rejected
190

Test results:
• The female population in the age group of 19 to 25, persons without any income, and
uneducated persons’ behavior matches one to one with the overall behavior of all the
respondents taken together;
• Gender: The males are more informed than the females with regard to ward level
information. However both the genders do not seem to be aware of any information
other than the ward level information;
• Age: Three age groups: 26 to 35 years; 36 to 45 years; and 46 to 55 years seem to be
more aware of all the ward level information. However, they seem to be ignorant
about all other information;
• Income: The Rs.10,000 – 15,000 pm and Rs.15,000 to Rs.25,000 pm income brackets
seem to have complete knowledge of the ward level information;
• Occupation: The public sector employees seem to have complete knowledge of the
ward level information. All the sub-groups have no knowledge of other aspects;
• Qualification: The persons with school level qualification alone seem to have
maximum knowledge of the ward level information.
Observations and Conclusions:
• The knowledge about the ward varies across all the sub-groups of the demographic
segments;
• The knowledge of items other than the ward information seems totally absent;
191

Table 6-12: Demography based analysis of Preparedness for Accountability – Participation - Hypothesis 4 (part b – participation)
Test of p = 0.62 vs p < 0.62
Frequency Sample p
95% Upper Bound
Exact P-
Value
Null Hypothesis Acceptance
Variation from
Hypothesis testing Yes N
A. Gender Male 213 356 0.59832 0.641727 0.215 Accepted No
variation Female 198 307 0.64495 0.690312 0.831 Accepted B. Age
19-25 years 77 160 0.66379 0.736427 0.857 Accepted No variation
26-35 years 129 223 0.57848 0.634078 0.114 Accepted 36-45 years 109 178 0.61236 0.673481 0.445 Accepted 45-55 years 76 113 0.67257 0.745498 0.895 Accepted 55 years + 20 33 0.60606 0.748892 0.500 Accepted C. Income
No Income 127 208 0.61058 0.667138 0.415 Accepted No variation
< Rs.5,000 38 55 0.69091 0.792542 0.890 Accepted Rs.5,000-10,000 68 117 0.58120 0.658261 0.220 Accepted Rs.10,000-15,000 84 132 0.63636 0.706162 0.681 Accepted Rs.15,000-25,000 55 90 0.61111 0.697402 0.471 Accepted Rs.25,000 + 39 61 0.63934 0.741666 0.668 Accepted D. Occupation
Public Sector 36 51 0.70588 0.809154 0.923 Accepted No variation
Private Sector 188 307 0.61238 0.658785 0.413 Accepted Self Employed 57 96 0.59375 0.678294 0.333 Accepted Unemployed 130 209 0.62201 0.678003 0.550 Accepted E. Education
Uneducated 66 116 0.56897 0.646885 0.150 Accepted No variation
School 99 157 0.63057 0.694842 0.637 Accepted Graduate 162 266 0.60902 0.659020 0.378 Accepted PG and Plus 84 124 0.67742 0.746711 0.922 Accepted
Test Results:
• The hypothesis test for participation was done at 62 per cent level. This means 62 per
cent of respondents expressed that they are willing to participate in the programmes of
the Corporation;
• When the demography based analysis was made, it was found that across all the sub-
groups also, the willingness to participate was expressed.
192
Observations and Conclusions:
• 62 per cent of the respondents are willing to participate in the activities of the
Corporation;
• Across all the demographic variations, the participation of 62 per cent of the
respondents can be expected.
Section IV: Overall Observations and Conclusions based on the Hypotheses Testing The testing of hypotheses was done at two levels for this research: at the basic level all the
hypotheses were tested. The sensitivity of the test results were done at the next level for all
the five demographic variables and their classifications (called sub-groups). A summary of
the observations and conclusions are given here to understand the overall results of this
research.
Basic level hypothesis testing:
• ATA Model: (at 51% population level)
o Hypothesis #1a: Accountability: The citizens of Chennai do not feel that
Corporation acts in an accountable manner;
o Hypothesis #1b: Transparency: The citizens of Chennai do not feel that the
Corporation provides transparent information;
o Hypothesis #1c: Action-ability: The citizens of Chennai feel that the
Corporation does not have action-ability arrangements;
o Hypothesis #2: Accountability – Transparency – Action-ability considerations
are correlated. However:
Accountability-Transparency and Transparency-Action-ability are
highly correlated;
The Action-ability-Accountability correlation is relatively weak.
• EVLN Model:
o Hypothesis #3: Action (than tolerance) is the preferred approach (for 75 per
cent and more) of the citizens, which they opt through either Exit or Voice
route for addressing service related issues of the Corporation.
193

• Preparedness for accountability:
o Hypothesis #4a:The overall knowledge on basic information about
accountability is highly limited even at 51 per cent level;
o Hypothesis #4b:The respondents (62 per cent) are willing to participate in the
affairs of the Corporation;
o Hence the preparedness of the citizens for accountability is considered below
the expected levels, though there is more willingness to participate than the
knowledge they possess about the Corporation.
Demographic analysis of hypotheses tests: The demographic analysis of the four hypotheses shows that: • ATA Model:
o ATA relationship (Hypothesis #1a to #1c):
There are demography sensitive variations;
The female population accepts the presence of accountability, as does all
the age groups except the 55 plus;
No particular pattern is observed from the income group classifications;
The public sector employees support the presence of both accountability
and action-ability, while the private sector employees totally reject the
presence of all the three factors. Others accept only the presence of
accountability;
The most qualified group (PG+) reject all the three factors, while the
others accept only the presence of accountability;
No category has accepted the presence of all the three factors;
There has been no category of people who seem to feel that Corporation is
working in a transparent manner;
• Summary: All the three components of the ATA model
(accountability, transparency, action-ability) are generally not
present up to the expected level (51 per cent). Of the three
components in ATA Model, Transparency is rated low for Chennai
Corporation;
o ATA Correlation (Hypothesis #2):
The Accountability-Transparency relationship is very highly correlated
indicated by highest number of significant correlations (15 at 0.01 level
194

and 2 at 0.05 level) out of total 21 correlations. Null hypothesis has been
rejected by 17 out of 21 cases indicating the high correlation between these
variables;
Next correlated relationship is between Transparency and Action-ability
with relatively less number of significant correlations (9 at 0.01 level and 6
at 0.05 level) out of the total 21 correlations. Null hypothesis has been
rejected by 16 cases, still indicating the acceptance of the correlations;
The Action-ability and Accountability relationship seems the least with
only 3 correlations at 0.05 level, and another three of the relationships
show negative signs. The null hypothesis has been accepted by 18
demographic segments taken up for the study;
No specific pattern among the various demographic variations is observed;
To Summarize:
o The Accountability-Transparency and Transparency-
action-ability relationships are significant across all the
demographic levels;
o The Action-ability-Accountability relationship appears
weak across all the demographic segments.
• EVLN Model: (Hypothesis #3)
o Action or Tolerance orientation:
• In general, the action components are more preferred by the
respondents than tolerance across all the demographic segments,
except for a few identified above;
• This confirms that the respondents prefer ‘action’ behavior – exit
and voice – as their reaction to the services provided by the
Corporation, than tolerant behaviour.
• Preparedness for Accountability: (Hypothesis #4)
o Knowledge base:
• The knowledge about the ward varies across all the sub-groups of
the demographic segments;
• The knowledge of items other than the ward information seems
totally absent;
195

o Participation:
• Majority (62 per cent) of the respondents are willing to participate
in the activities of the Corporation;
• Across all the demographic variations, the participation of
majority (62 per cent) of the respondents can be expected.
o Hence the preparedness of the citizens for accountability is considered below the
expected levels, though there is more willingness to participate than the
knowledge they possess about the Corporation.
Sum and Substance of the Research The following are the major research findings:
• The ATA Model (developed for the purpose of this research) has at the macro level
established that the three elements Accountability-Transparency-Action-ability are
interlinked. The validity of the Model is further enhanced by the other findings.
o In the case of Chennai Corporation the ATA elements are not present even to
the minimal level of 51 per cent. Ideally if 70 per cent of the citizens rate the
Corporation as positive on all the three parameters – then the ATA ingredients
(alternatively the accountability arrangements) can be stated to be strong.
However, at this point of time this does not seem to be true for the Chennai
Corporation. Hence the Chennai Corporation has a lot of work to be done in
this regard.
o The analysis of these for various demographic groups shows that to a great
extent the presence of Accountability is accepted by 16 out of the 21
demographic variations, while Transparency is completely rejected by all the
21 sub-groups. With regard to Account-ability, higher income groups show
some acceptance.
• The ATA Model has also proven the interrelationships between the three components
by the high correlation between them;
o In the case of Chennai Corporation, of the three correlations in between the
ATA components, the Action-ability – Accountability correlations are weak
indicating the improvements in action-ability aspects that the Chennai
Corporation has to take;
196
o The analysis of the variation of these findings for various demographic groups
shows that across gender, occupation and education sub-groups the
Accountability-Transparency correlation is high. In the case of Transparency-
Account-ability relations for gender alone the sub-groups are fully correlated,
for other groups also this relationship is predominantly correlated. In the case
of Action-ability-Accountability relationships only 3 of the 21 sub-groups
correlation is found and for age and income groups there has been absolutely
no correlations.
• The EVLN (Exit Voice Loyalty Neglect) Model was tested for understanding the
reactions of the citizens towards the services (six services was considered for this
research) provided by the Corporation. This model was seen to be effective in
classifying the reactions of the citizens;
o In the case of Chennai Corporation it was observed that the citizens preferred
to resort to action alternatives like Voice or Exit, rather than tolerance
alternatives like Loyalty or Neglect;
o The demography based analysis shows that out of most of the 6 services, the
Action alternative has been the predominant choice (over 75 per cent) over the
Tolerance alternative. This is fully true 6/6 for all the sub-groups of
respondents by Age and Education. With regard to others also the sub-groups
have chosen 6/6 except for 5 sub-groups out of 21. Even in these 5 sub-groups
the Action score if 5/6. All these indicate that across all the variations, Action
alternative seems to be preferred more than Tolerance.
• The preparedness for accountability based on the two components of knowledge of
the Corporation (ward level and overall level) has been assessed:
o In the case of Chennai Corporation the knowledge about the Corporation with
the people is very low even at 51 per cent cut-off level. However they are
prepared to participate in the works related to the Corporation. This shows that
the citizens, if proper information is provided, will increasingly participate in
the Corporation works and for this they need to be provided with adequate
knowledge about the working of the Corporation.
o The analysis of the various demographic factors show that in the case of basic
knowledge about the Corporation, maximum of 5 answers out of 9 questions
were known to the respondents. Thus out of the 21 sub-groups: 5/9 by 3 sub-
197

groups, 4/9 by 4 sub-groups, 3/9 by 9 sub-groups, 2/9 by 1 sub-groups, 1/9 by
4 sub-groups seem to be the knowledge levels of the citizens about the
Corporation. Out of these, maximum questions answered were with regard to
the wards and the knowledge about Corporation related matters are less.
o With regard to the interest of participation of the citizens in the affairs of
Corporation, all the sub-groups expressed their willingness at 62 per cent,
which is a very positive point.
To summarize:
• Using ATA Model the Chennai Corporation can understand its weak areas. Based on
the Survey data, the weak areas identified are:
o Specific accountability, transparency and action-ability initiatives are required
to increase the threshold levels up from 51 per cent;
o Action-ability- Accountability relationships need to be strengthened. This
means that the Corporation has to strengthen the follow-up action and
grievance redressing mechanism and need to involve senior persons in this
regard;
• The Citizens prefer to take up to Action based Voice or Exit options in case of any
problems with the services provided by the Corporation. Corporation need to
understand the options required to provide by classifying competitive services (like
hospitals, schools) and monopoly services (like infrastructure) and accordingly
provide scope for voicing (service feedback and resolution mechanism) and
preventing exit (quality improvement programmes).
• The preparedness of the citizens for introducing and sustaining ‘accountability’
mechanisms need to increased. The citizens are willing to participate (62 per cent).
However, since their knowledge levels are low, they need to be sensitized by the
Corporation in a systematic manner.
Details of these and the suggestions of the citizens are discussed in the next chapter.
198

Chapter - 7
ெபாைறெயா ங்கு ேமல்வ ங்கால் தாங்கி இைறவற்
கிைறெயா ங்கு ேநர்வ நா
That is a country which can bear a sudden inrush of burdens and pay its taxes regularly to the King.
Thirukkural – 733
But those who do not consume (the king’s) goods and increase them in just ways, should be made permanent in their offices, being devoted to what is agreeable and beneficial to the king.
Arthrasasthra – 2.9.36
199

Chapter - 7: Summary, Findings & Conclusions This Chapter is presented in three sections – the past, the present, and the future. Section I On
the past deals with complete summing up of the rationale and background of the study, and
recapitulates the objectives of the study. Section II – on the ‘present’ discusses the findings
and outcomes of the study including the suggestions provided by the citizens. The links
between the hypotheses, the findings and the suggestions are examined. Section III on the
‘future’ provides the possible areas of applications of the models and research findings
discussed in this research, scope for further research, listing out the major areas not covered
in this research.
Section I: The Past Background The rationale for this study on Accountability related matters for the urban sector arose from
the practical experience gained through several consultancy assignments and studies of the
researcher. The entire country is going through reform process. This reform process has been
very fast in the urban sector and is related to the growth of the Indian economy, which in the
recent times has been one of high growth. There is a need to look at the urban sector during
the reform phase. One of the major challenges faced during this phase of growth in the
implementation of the decentralization initiatives is the lack of accountability arrangements
or mechanism in various facets of government. The third tier of government – the urban local
bodies – is the nearest to the people and unless this level is reformed other layers above
cannot deliver what the people want in an efficient manner. For this the accountability of this
sector needs to be looked at – this is the basic idea with which this research topic ‘demand
side of accountability in the urban sector’ was looked at.
The research looked at certain definitional aspects of accountability and transparency to begin
with. These are yet to be defined both in generic and with specific reference to the urban
sector in India. This arduous task of defining these terms under Indian and more specifically
with regard to the urban sector was undertaken. The accountability cycle was looked at and a
gap in the cycle due to the absence of an ‘action-ability’ mechanism was understood. Based
on this analysis a model of accountability called ATA Model was conceptualized for the
purpose of this research. Accountability-Transparency-Action-ability (ATA) model gave the
200

necessary framework for analyzing and mapping the accountability process and gaps in the
urban sector. By surveying citizens of Chennai (663 samples based on 95% accuracy and 5%
variance, based on stratified random sampling based on 155 ward population) the opinions of
the citizens on accountability, transparency and action-ability were taken. The extent to
which these are present in Chennai Corporation was assessed. The relationship between these
three variables also was studied.
One of the major links in the process of accountability or the accountability chain (now
explained by the ATA framework) is the action-ability or the way the urban management
reacts to the voice of the citizens. This aspect was studied using Hirschman’s Voice Exit
model variant called the EVLN (Exit-Voice-Loyalty-Neglect) model. This model was used to
study the reactions of the citizens when the services provided by the Corporation were not up
to the mark. Based on Action and Tolerance components, these EVLN components and the
behaviour (reactions) of the citizens to service provision by Corporation were examined. The
preference of the citizens to Action or Tolerance was examined.
A major issue that arose during the research was on the ‘preparedness’ of the citizens to
accountability mechanisms. If the accountability mechanisms are to be established the
citizens should be ready to make use of them effectively. This calls for several prerequisites,
the principal of them being the knowledge of the city and also the readiness of the citizens to
participate in activities along with the Corporation. These two aspects of the preparedness of
the citizens were examined.
Thus the research looked at three aspects relating to demand side of accountability on the
accounting sector: the ATA Model, the EVLN Model, and the Preparedness for
accountability.
Objectives of the study The objectives of the study can be summarized as follows, based on the three aspects of
accountability:
• To understand the accountability mechanisms in Chennai Corporation based on ATA
Model;
201

• To examine the popular choice of citizens when the services provided by the
Corporation were not up to the mark;
• To understand the level of preparedness of the citizens for implementing
accountability mechanisms.
Section II: The Present Important Findings of the Research
• The ATA Model (developed for the purpose of this research) has at the macro level
established that the three elements Accountability-Transparency-Action-ability are
interlinked. The validity of the Model is further enhanced by the other findings.
o In the case of Chennai Corporation the ATA elements are not present even to
the minimal level of 51 per cent. Ideally if 70 per cent of the citizens rate the
Corporation as positive on all the three parameters – then the ATA ingredients
(alternatively the accountability arrangements) can be stated to be strong.
However, at this point of time this does not seem to be true for the Chennai
Corporation. Hence the Chennai Corporation has a lot of work to be done in
this regard.
o The analysis of these for various demographic groups shows that to a great
extent the presence of Accountability is accepted by 16 out of the 21
demographic variations, while Transparency is completely rejected by all the
21 sub-groups. With regard to Account-ability, higher income groups show
some acceptance.
• The ATA Model has also proven the interrelationships between the three components
by the high correlation between them;
o In the case of Chennai Corporation, of the three correlations (between the
three ATA components) the Action-ability – Accountability correlations are
weak indicating the improvements in action-ability aspects that the Chennai
Corporation has to take;
o The analysis of the variation of these findings for various demographic groups
shows that across gender, occupation and education sub-groups the
Accountability-Transparency correlation is high. In the case of Transparency-
Account-ability relations for gender alone the sub-groups are fully correlated;
202

for other groups also this relationship is predominantly correlated. In the case
of Action-ability-Accountability relationships only 3 of the 21 sub-groups
correlation is found and for age and income groups there has been absolutely
no correlations.
• The EVLN (Exit Voice Loyalty Neglect) Model was tested for understanding the
reactions of the citizens towards the services (six services was considered for this
research) provided by the Corporation. This model was seen to be effective in
classifying the reactions of the citizens;
o In the case of Chennai Corporation it was observed the citizens preferred to
resort to action alternatives like Voice or Exit, rather than tolerance
alternatives like Loyalty or Neglect;
o The demography based analysis shows that for most of the 6 services the
Action alternative has been the predominant choice (over 75 per cent) over the
Tolerance alternative. This is fully true (6/6) for all the sub-groups of
respondents by Age and Education. With regard to others also predominantly
the subgroups have chosen 6/6 except for 5 sub-groups out of 21. Even in
these 5 sub-groups the Action score is 5/6. All these indicate that across all the
variations, Action alternative seems to be preferred over Tolerance.
• The preparedness for accountability based on the two components of knowledge of
the Corporation (ward level and overall level) has been assessed:
o In the case of Chennai Corporation the knowledge about the Corporation with
the people is very low even at 51 per cent cut-off level. However they are
prepared to participate in the works related to the Corporation. This shows that
the citizens, if proper information is provided, will increasingly participate in
the Corporation works and for this they need to be provided with adequate
knowledge about the working of the Corporation.
o The analysis of the various demographic factors show that in the case of basic
knowledge about the Corporation maximum of 5 answers out of 9 questions
were known by the respondents. Thus out of the 21 sub-groups: 5/9 by 3 sub-
groups, 4/9 by 4 sub-groups, 3/9 by 9 sub-groups, 2/9 by 1 sub-groups, 1/9 by
4 sub-groups seem to be the knowledge levels of the citizens about the
Corporation. Out of these, the maximum questions answered were with regard
to the wards and knowledge about Corporation related matters are very low.
203

o With regard to the interest of participation of the citizens in the affairs of
Corporation, all the sub-groups expressed their willingness at 62 per cent,
which is a very positive point.
Suggestions arising out of the Findings
• Using ATA Model the Chennai Corporation can understand its weak areas. Based on
the Survey data, the weak areas identified are:
o Specific accountability, transparency and action-ability initiatives are required
to increase the threshold levels up from 51 per cent;
o Action-ability- Accountability relationships need to be strengthened. This
means that the Corporation has to strengthen the follow-up action and
grievance redressing mechanism and needs to involve the senior persons;
• The Citizens prefer to take up to Action based Voice or Exit options in case of any
problems with the services provided by the Corporation. Corporation need to
understand the options they need to provide by classifying competitive services (like
hospitals, schools) and monopoly services (like infrastructure) and accordingly
provide scope for voicing (service feedback and resolution mechanism) and
preventing exit (quality improvement programmes).
• The preparedness of the citizens for introducing and sustaining ‘accountability’
mechanisms need to be increased. The citizens are willing to participate (62 per cent).
However, since their knowledge levels are low, they need to be sensitized by the
Corporation in a systematic manner.
Respondents’ suggestions As a part of the study the respondents were asked an open ended question of what the
corporation should do and should not do. This is to bring out any other issues that might have
been missed in the structured questionnaire. Figure 7.1 shows the break-up of the major types
of the recommendations. Out of the 663 respondents, 531 responded (80 per cent) to this
question, and provided suggestions.
204

Figure 7-1: Suggestions of Respondents
Various suggestions put forth by the respondents were grouped into four major areas:
• What the Corporation should do (18 per cent)
• What the Employees (of Corporation) should do (17 per cent)
• What infrastructure requirements are required (33 per cent)
• What service (improvements) are required (32 per cent)
An analysis of these groups shows that the Citizens consider the building of infrastructure
and maintenance of the same as major issues, as these together constitute 65 per cent of the
suggestions. These have been given almost equal weight. Similarly in the case of what the
Corporation and employees should do, the weights are equal for both the Management and
Employees of the Corporation.
205

What the Corporation should do?
Figure 7-2: What the Corporation should do? The major suggestions of the Citizens are brought out well in the Figure 7-2. The
observations are:
• Strengthening the Management has been the major recommendation with 38 per cent
suggesting this. Various observations have been in relation to the Management of the
Corporation, strictness with employees, improvements in systems and procedures,
etc.;
• The recommendation of 15 per cent on review and supervision also expresses another
aspect of strengthening the Management. The Citizens feel that the works done by
lower level employees are not supervised, guided or reviewed by the senior
employees;
• 11 per cent feel that the Corporation Management should meet the Citizens
periodically to understand their requirements and various field level issues. The lack
of this results in widening the gap between the Citizens and the Corporation;
206

• The next observation is with regard to the speed with which the Corporation responds
to the needs of the Citizens. 10 per cent feel that responding quickly will enable
better service delivery;
• 8 per cent feel that the Corporation need to spread awareness to the public about the
schemes and projects of the Corporation in a systematic way;
• The other recommendations which make up 17 per cent in this regard: relate to
transparency (5 per cent), grievance redressing (4 per cent), proper utilization of
funds (3 per cent), avoiding political influence (2 per cent), coordination (2 per cent),
better policies (1 per cent) and better schemes (1 per cent).
What the Corporation Employees should do?
Figure 7-3: What the Corporation Employees should do? The respondents have been quite clear in the qualitative and behavioural aspects of the
employees. The 92 respondents, who gave their suggestions on what the Corporation
employees should do, as shown in the Figure 7-3, felt that the employees should:
• Be committed (26 per cent): This indicates that the respondents feel that the
employees are not committed to their work;
• Have concern for people (22 per cent): With concern for Citizens, the respondents feel
that the employees will be able to deliver better service. This also can be easily
understood as the reason for delay in responding to the needs of the citizens;
207

• Be friendly (10 per cent): Being friendly is another major character that the Citizens
are looking for in the employees of Corporation. This will enable the Citizens to be
friendly with them;
• Provide quality service (9 per cent): The respondents also feel that providing good
quality of service is individualistic and depends on the employees. It is also felt that
even within the limitations in the existing systems, the employees are not doing their
best to deliver good quality service;
• Avoid bribe (9 per cent): Bribery has been one of the underlying issues dealt with by
the respondents throughout this study. While suggesting what should be done by the
employees the respondents came out clearly that the employees should not take bribe;
• Behave ethically (8 per cent): Though ethical behavior is a very generic term, the
respondents included matters relating to corruption, acting as per rules, focusing on
solving problems of the Citizens, etc. as part of ethical behavior;
• Get trained (8 per cent): Fitting the job would mean proper training. The citizens feel
that the employees should demand proper training before taking up a job.
• Others (9 per cent): The other recommendations include: work in public interest (6
per cent), behave in an accountable manner (2 per cent), be qualified (1 per cent).
What Infrastructural improvements are required?
The major issue that has been taken up by the respondents is the improvements in
infrastructure. These are shown in Figure 7-4. The inputs on the infrastructure of Chennai as
provided by the respondents are:
• Roads: The need to improve road infrastructure was expressed by 23 per cent of the
respondents;
• Trees: 15 per cent of the respondents felt that the more tree must be planted to tackle
environment, water and greenery issues;
• Water: Water availability (including drinking water) has been expressed as an issue
by 10 per cent of the respondents. Though water is not dealt with directly by
Corporation, this issue needs consideration;
208

Figure 7-4: What Infrastructural improvements are required
• Drainage: 9 per cent felt that the drainage facilities are inadequate in Chennai;
• Lighting seems to be another issue in certain areas in Chennai, as expressed by 8 per
cent of the respondents;
• Beautification of the city is concern for 7 per cent of the respondents;
• General upgrading of city infrastructure is a major issue for 7 per cent of the
population;
• Health infrastructure like good hospitals and health care are the concern for 6 per
cent;
• 5 per cent felt that city Parks need further upgrading and new to be created;
• Other observations include: education (3 per cent), parking lot (2 per cent), pavement
(2 per cent), flyover (1 per cent), sub-ways (1 per cent), toilets (1 per cent).
209

What Service improvements are required?
Figure 7-5: What Service improvements are required
The service improvement needs as expressed by the respondents are given in Figure 7-5. The
Respondents identified the major areas in which service improvements have to be made.
These included:
• Roads (26 per cent): Maintenance and upkeep of roads seem to be the priority of the
citizens;
• Garbage clearance (25 per cent): Clearing the garbage everyday and in efficient way
is another major area of concern. Delay in garbage clearance has been considered as
one of the major problems by the respondents;
• Maintenance (21 per cent): The general maintenance of various infrastructure
facilities created by Corporation is considered important by the respondents;
• Cleanliness (14 per cent): The respondents felt that keeping the city clean is
important. This also supports the suggestions like garbage clearance; but this takes
into accounts aspects like beautification, etc.;
• Drainage clearance (9 per cent): Keeping the drainage clean is considered an
important service required by respondents;
• Others (5 per cent): Maintenance of subways, pavements, street lights, sewage, better
service each contribute for 1 per cent.
210

Analysis of the Research Findings and Respondent suggestions
In order to correlate the qualitative suggestions of the respondents (as discussed in the
preceding paragraphs) and also the research findings arising out of the testing of the models
through quantitative analysis, a matrix of the suggestions of the respondents X the research
models was prepared as shown in Table 7-1. In this matrix all the 26 suggestions arising out
of the respondents are classified under the four sub-headings (what the Corporation should
do?, What the Corporation Employees should do? What are the improvements to
infrastructure required and What are the improvements to service required?) and shown as
rows; and the three objectives of the research in relation to ATA Model, EVLN Model and
preparedness for accountability are shown as columns.
Table 7-1: Mapping of Research Findings and Respondent Suggestions
ATA Model EVLN Model Preparedness
A. What the Corporation should do?
1. Sensitize Public
2. Respond fast
3. Meet citizens
4. Review/Supervise
5. Strengthen Management
B. What the Employees of Corporation should do?
6. Avoid bribe
7. Be committed
8. Have concern for people
9. Behave ethically
10. Be friendly
11. Deliver quality service
12. Get trained
C. What Infrastructural improvements are required?
13. Beautification 14. Drainage 15. Health 16. Infrastructure 17. Lighting 18. Parks 19. Roads 20. Trees 21. Water
211

ATA Model EVLN Model Preparedness
D. What Service improvements are required?
22. Cleanliness 23. Drainage 24. Garbage 25. Maintenance 26. Roads
The analysis of Table 7-1 highlights the following:
• What Corporation should do: All the three objectives taken up for the research are
influenced by these suggestions;
• What the Corporation Employees should do: The qualitative aspects of the employee
related matters seem to impact all the three objectives taken up in this study.
• What infrastructure and Service delivery improvements are required? These
infrastructure, service delivery improvements are likely to influence the ‘Action x
Tolerance’ of EVLN Model, and provide opportunity for citizens to participate in the
affairs of the Corporation.
All the above validate the findings of the research correlating the qualitative and quantitative
aspects. The importance of the three objectives taken up for the study is also adequately
established by the matrix indicating that the models can be used to develop practical
strategies in relation to governance and service delivery. More importantly, they reiterate the
seriousness of the issues taken up for the study.
Section III: The Future
Areas not covered in this research
This research being exploratory research with regard to accountability and related matters,
there have been a lot of limitations and restrictions both in coverage and depth of certain
aspects. Some of such main areas are highlighted below:
• Legal/statutory arrangements for accountability;
• Role and success in implementation of Right to Information Act (RTI);
• Role of civil societies and neighbourhood organizations;
• Role of City Managers in ensuring accountability;
212

• Service delivery performance and Financial performance links;
• Key factor analysis for successful reform programme.
One of the main reasons for not having covered these issues is that the focus of the study has
been on ‘demand side’ of accountability and many of these topics involve the supply side of
accountability also.
Applications of research findings
This research study is expected to provide models that could be used for understanding field
realities in relation to accountability related matters. Since the research is on the demand side
of accountability, the inputs arising out of the following approaches would help the service
provider i.e. the Corporation to improve its performance through accountability initiatives.
While several possibilities and combinations of these applications do exist in reality, one
major area for application has been suggested to highlight the application power of these
models/approaches. The following areas are identified for specific application:
• #1: Extent of Accountability arrangements through ATA Model: The extent of
presence of (or absence of) the three components or their sub-components could be
arrived at, through identification of the relevant factors that are particular to an
organization or institution.
o The presence or absence of some of the factors can provide information on the
strength/gap in the particular area of governance or operations;
o The correlations between the ATA factors can provide information about the
strength or weakness between the three components and can provide
alternatives of the areas for concern, based on which strategies for
improvement can be developed.
• #2: Strategies for service improvements through EVLN Model: The study of the
action and tolerance orientation of citizens with regard to various services provided
by an institution/government can be studied using the model:
o Depending on the Exit or Voice, specific strategies for reorienting the services
or strengthening some of the aspects can be easily identified. In case of exit
preferences by the citizens, the analysis can show why the citizens choose to
213

move out and in the case of voice related inputs the areas of focus for service
delivery improvements can be identified;
o The analysis of Loyalty options would provide inputs about the areas in which
the citizens are‘putting up’ (Loyalty) particularly when the service delivery
quality is not up to the mark. Similarly the study of Neglect options can
provide inputs on the ‘indifference’ of people; this is an important input that
is likely to make the policy makers and managers understand why some
people refuse to participate with any scheme of the government institutions.
• #3: Preparedness for accountability: The preparedness for accountability in this
research was viewed from only two perspectives; knowledge of the citizens on the
Corporation and the willingness of the citizens to participate in the affairs of the
Corporation. Only some of the key aspects in this regard were examined. Other
factors in this regard could be included to study the gaps in the basic requirements
that are essential for improving the preparedness for accountability:
o The citizens are not sensitive to many of the basic aspects including
governance related matters like providing service benchmarks through
Citizens’ Charter and the initiatives taken by the Corporation like the web-site
and e-governance interfaces. The analysis would bring to light the
sensitization required to be made to the citizens that could be specific and
focus;
o Many citizens are willing to provide voluntary inputs for the improvement of
activities at local level. By studying this factor, the Corporation could develop
methods for approaching the citizens to enable local support and focus the
local projects to suit the requirements of the citizens.
Scope for further research
The current research has thrown open to light several questions that need to be answered.
These questions provide huge opportunities for research.
• ATA Model:
o ATA relationships: Does strength between ATA relationships signify good
accountability arrangements reflected in better quality of service delivery and
better performance of the public institutions?
o ATA factors:
214

What are the underlying reasons for a high or low response for
Accountability, Transparency, Action-ability?
What are the sensitive factors that need to be considered in order to
develop robust ATA framework?
o ATA index: developing an ATA index (a number) that will enable the rating
of various ULBs in a state. This also can help in allocation of resources by the
Government, and identify the ULBs that need to be immediately attended to as
the index is likely to reveal problem cases.
• EVLN:
o Testing the hypothesis that in the case of monopoly services people choose
Voice option and in the case of non monopoly services people choose exit
options;
o The reasons underlying tolerance options of Loyalty and Neglect. This could
provide insights into behavioural economics.
o EVLN Index: Based on the balance between Action and Tolerance options and
the balance between the components resulting in relative scores under each of
the possibilities, an EVLN balance score card could be developed. This would
help in prototyping organizations that will enable development of intervention
strategies for the stakeholders.
• Preparedness :
o What are the factors contributing for the preparedness of the citizens to enable
accountability arrangements?
o Preparedness index: for evaluating the preparedness score of a city. This will
provide inputs for the policy makers as to the requirements, so that appropriate
interventions could be designed.
• Private institutions: All the above can be tested for private institutions.
• Comparative studies: Comparative studies between private and public institutions in
the above areas.
Accountability is a very mature instrument reflecting true participatory democracy. Every
step we take towards using this instrument efficiently and effectively will contribute
towards better governance. This research is a very humble contribution in this regard.
215

Annex 1: Survey Questionnaire Sl. No Zone No Date Ward No Surveyed by: Ward Name
CITIZEN SURVEY QUESTIONNAIRE A. GENERAL 1. NAME: 2. GENDER: Male/Female
Address Telephone
3. AGE: 4. MONTHLY INCOME: a. 19 – 25yrs a. Less than Rs. 5000 b. 26 – 35yrs b. Rs.5000 – 10000 c. 36 – 45yrs c. Rs.10000 – 15000 d. 46 – 55yrs d. Rs.15000 – 25000 e. 56 – 65yrs e. More than Rs.25000 f. More than 65 yrs f. No income
5. OCCUPATION: a. Government f. Small trader b. Public Sector g. Retired c. Private Sector h. Student d. Business i. Housewife e. Self Employed j. Others (specify)
6. QUALIFICATION
a. School Primary e. Doctorate b. School Secondary f. Others (mention) c. Graduate g. Not educated d. Postgraduate
B. YOU & CORPORATION 7. Other information:
a. Do you know Chennai Corporation: i. Mayor Yes No.
ii. Commissioner Yes No. iii. Your Ward Name Yes No. iv. Your Ward No Yes No. v. Your Ward Representative/Councilor’s Name Yes No.
vi. How do you rate his/her work Very Poor Poor Okay Good Very Good
b. Voting:
i. Have you voted in Elections? Yes No. ii. If No why?
1-Under Age 2-No voter ID 3-Name not in list
4 – Out of Station
5- Not bothered to vote
iii. This time did you vote or not? Yes No.
216

iv. If No, why?
1-Under Age 2-No voter ID 3-Name not in list
4 – Out of Station
5- Not bothered to vote
c. Civil Society/resident association/local group
i. Are you member of any residents association or civil society? 1-Flat owner or Resident Association
2- Street or Locality Association
3- Social Service organization
4 – 5- Not a member
ii. Have you done any useful public work?
1- Cleaning 2- Maintenance 3- Social Service /Campaigns
4 – 5- Not done any such work
d. Political affiliation
1- AIADMK 2- Congress 3- Communist 4 – DMK 5- DMDK 6-MDMK 7-Lok Parivarthan 8- 9- 10 - NIL
8. PROPERTY TAX
a. Do you pay Property tax? Yes No (If no, the questions below are not applicable)
b. Do you know how much you pay? Yes No NA c. If yes how much per annum Rs.____________ NA d. Do you think the tax paid is high? Yes No Reasonable NA
9. How do you pay your Property Tax?
a. I go to Corporation office and pay b. Tax collector comes and I pay c. I pay through bank d. Other methods e. Not applicable
10. OTHER MUNICIPAL TAXES a. Do you pay any other Municipal Taxes? Yes No
(If no, the questions below are not applicable) Tax 1- Professional Tax 2- Trade License 3- Others 4 – NOT
APPLICABLE Rs/annum 11. Online transactions:
a. Do you know the Corporation has got on-line facilities for payment of your taxes Yes No (If No, the questions below are not applicable)
b. Have you used the same? Yes No NA c. If yes
i. Was it easy/simple to use? Yes No NA ii. How was your experience? Good Bad Okay NA
d. Do you know you can apply for birth/death certifications, various licenses, clearances online? Yes No
12. Interface with Citizens: a. Web-site:
i. Do you know the Chennai Corporation has a web site? Yes No ii. Have you seen Corporation web site? Yes No NA
b. If yes i. Was it easy/simple to use? Yes No NA
ii. How was your experience? Good Bad Okay NA
217

c. Citizens’ Charter: i. Do you know what a Citizen’s Charter is? Yes No
ii. Do you know there is one? Yes No NA iii. Have you seen Citizen’s Charter? Yes No NA
B. PERFORMANCE OF CORPORATION
13. Working of Corporation:
a. According to you, is the Corporation of Chennai working fine? Yes No b. Why do you say so? State reasons:
i.
ii.
iii.
14. Service Delivery a. Do you think there is proper delivery of various services by Corporation? Yes No
(If Yes, question (b) is not applicable) b. If No, what according to you are the reasons? Rank them. NA
(First record their responses. In case of difficulty, prompt one or two; then ask them to rank) Response Rank
1. Lack of leadership 2. Quality of people 3. Political influence 4. Corruption 5. Lack of systems and procedures 6.
c. Specific areas of service delivery by Corporation:
Service delivered Satisfaction levels
Totally Unsatisfied
Unsatisfied Undecided Satisfied Fully Satisfied
1. Garbage removal 2. Road maintenance
3. Cleaning of drains 4. Issue of birth/death
certificates
5. Corporation Schools 6. Corporation Hospitals 7. Others (mention)
15. How do you rate the Infrastructure and Initiatives by the Corporation:
Initiatives Totally Unsatisfied
Unsatisfied Undecided Satisfied Fully Satisfied
1. Roads a. Outcome (benefits) b. Suitability (appropriate) c. Quality
218

Initiatives Totally Unsatisfied
Unsatisfied Undecided Satisfied Fully Satisfied
2. Flyover a. Outcome (benefits) b. Suitability (appropriate) c. Quality
3. Sub-ways a. Outcome (benefits) b. Suitability (appropriate) c. Quality
4. Pavements a. Outcome (benefits) b. Suitability (appropriate) c. Quality
5. Parking (of vehicles) a. Outcome (benefits) b. Suitability (appropriate) c. Quality
6. Drainage a. Outcome (benefits) b. Suitability (appropriate) c. Quality
7. Parks a. Outcome (benefits) b. Suitability (appropriate) c. Quality
8. City beautification a. Outcome (benefits) b. Suitability (appropriate) c. Quality
9. Online payments a. Outcome (benefits) b. Suitability (appropriate) c. Quality
16. What according to you are the major issues for citizens : Prioritize them according to your
experience or perception: (First record their responses. In case of difficulty, prompt one or two; then ask them to rank) Response Priority Road maintenance not done Drainage not cleaned up Garbage not cleaned regularly Platforms not laid properly and not usable Inadequate parking facilities Inadequate Parks Inadequate greening (trees, plants)
219

17. What do you think that are needed to be done in order to improve the performance/quality of governance of the Corporation. Tick the appropriate.
Inputs for Improvement Tick a. Have Strong Leadership b. Improve Employee quality c. Involve citizens in planning and monitoring d. Involve participation of corporate (maintenance of infra) e. Privatize some activities f. Have strict audit mechanism g. Punish severely the wrong doers h. Public scrutiny/supervision of performance i. Professionalize the Management j.
C. ACCOUNTABILITY
18. Do you think Chennai Corporation is acting in an accountable manner towards citizens? Yes No
19. Who do you think is accountable in corporation? Rank them: Response Rank Mayor Commissioner Elected representative (MLC) Employees of Corporation
20. In case you think they are generally not working properly, why do you think they behave so:
Reasons Rank a. Not bothered about the city or citizens b. Bothered about their gains c. Not properly instructed/trained d. Not committed e. They actually do not know what to do f. Rules not strict to punish guilty g. No public scrutiny of performance
21. Your overall impressions:
Very Low
Low Okay Good Very Good
1.To what extent do you think there is relationship between you and Corporation
2.Do you think there is a system by which the Corporation employees are able to explain their conduct and justify the same
3.To what extent you think you can pose questions on the performance of people
4.To what extent are the mechanism to pass judgement on the conduct of persons who do not perform
5.To what extent you think guilty or wrong doers may face the due consequences
220

D. TRANSPARENCY
22. Information Availability? a. Do you think you get information about the Schemes and Performance of the
Corporation? Yes No
(If Yes, question (c) is not applicable, If No, question (b) is not applicable) b. If Yes: NA
The information is Totally Unsatisfied
Unsatisfied Undecided Satisfied Fully Satisfied
Accessible Relevant Reliable/Good Quality
c. If No: Why do you say so? NA
Reasons Tick i. Info not available
ii. No system for info to public iii. No information provided by Corporation through Media
(TV, Newspapers)
iv. I am not aware that info is available v. I am not looking for info
23. Information requirement:
a. Will you be interested in getting information about the working/performance of Corporation? Yes No
b. What is the type of information you would like to get from the Corporation? (They must respond, do not prompt)
Information Requirement Rank a. Ward work Status b. Financial information (how money has been spent) c. Tax collection details d. Budget to Actual information e. Any other information (mention)
24. Finances of Corporation: a. Where does Corporation get its finances from? Do you know? Yes No.
(If no, question (b) is not applicable) b. If yes, what are its sources? (They must respond, do not prompt) NA
i. Corporation tax Yes No ii. Parking charges Yes No
iii. Rent from Corporation buildings Yes No iv. State Govt budget allocation Yes No v. Central Govt budget allocation Yes No
vi. Birth/Death Certification Yes No vii. Licenses Yes No
viii. Others (mention) c. Do you know for what purposes the funds of Corporation are used for? Yes No.
(If no, question (d) is not applicable) d. If yes, what do you think the Corporation spends for? (They must respond, do not prompt) NA
i. Salaries Yes No ii. Infrastructure (roads, flyover, drain, etc.) Yes No
221

iii. Maintenance (cleaning, etc.) Yes No iv. Running corporation schools, hospitals, etc. Yes No v. Others (mention)
E. VOICE/EXIT 25. What do you do in the following situations:
Problem in following
Lodge Complaint
Look for Alternatives within Corporation (same place or other locality)
Look for alternatives in private sector
Tolerate without dissent
Neglect
1.Corpn Hospital
2.Corpn School
3. Roads 4.Sewerage, Drainage
5.Garbage removal
6.Issue of birth/death certificate
26. Approachability/Complaint redressal mechanism – your experience
a. Do you know that the Corporation has a grievance redressel mechanism? Yes No b. Have you lodged any complaint so far to the Corporation authorities? Yes No c. If Yes,
Nature of Complaint
When (Month/Year)
To Whom How resolved Satisfaction level (1 to 5)
d. If No, Why? 1.No problem faced 3.I feel Corporation will not take any action 2.Not aware of whom to contact
4. Due to corruption I do not feel like contacting
F. ACTION-ABILITY
27. Management of Corporation. For efficient management of Corporation, which function you think is important? Prioritize them:
Function Rank a. Technical service delivery (Cleaning, Road, Drainage, Education, Hospital etc.) b. Proper use of the tax money collected c. Coordination, monitoring and follow-up of work d. Public relations e. Strong administration
222

28. Your impression/views on the Policies/Approach of the Corporation:
Policy on Totally Unsatisfied
Unsatisfied Undecided Satisfied Fully Satisfied
a. Recruitment of employees b. Selection of contractors
(construction, garbage cleaning , etc.)
c. Management of infrastructure
d. Management of services e. Management of funds/money
29. Participation in Governance
(If Yes, question (c) is not applicable, If No, question (b) is not applicable)
a. In case the Corporation asks you to take part in some of the activities with regard to ward level work, will you be interested to take part? Yes No.
b. If yes , what activities NA i. Cleaning iv. Tree planting
ii. Maintenance v. Supervision iii. Education vi. Spreading awareness
c. If No, why? NA i. Preoccupation with work
ii. Did not know I can participate iii. Not interested
30. a. Are you satisfied with organizations like EXNORA working to improve the City? Yes No b. If yes, how do you rate your level of satisfaction about their work?
Totally Unsatisfied
Unsatisfied Undecided Satisfied Fully Satisfied
c. Do you think Corporation should involve NGOs, Companies and public to improve the city conditions? Yes No d. If yes, which are the areas you think they should be involved in? i. Cleaning (roads, removing garbage) iv. Supervision of works done in wards ii. Maintenance (roads, drains) v. Spreading awareness (schemes, roles) vi. Environment (planting trees) vi.
31. What according to you are the three Dos and Don’ts for the Corporation DO DON’T
32. Any other inputs/comments:
223

Annex 2: Retest Results – Group #1 with Same Interviewer Tabulation of Retest Results: Sample Size: 25
Group #1: Same Interviewer S.No Variable
No Matched
cases Matched
% Kappa
Coefficient Extent of Matching
Kendall's Coefficient
Extent of Matching
1 Q7a i 21 84% 0.40476 Fair N/A 2 Q7a ii 23 92% 0.83766 V Good N/A 3 Q7a iii 23 92% 0.82639 V Good N/A 4 Q7a iv 25 100% 1.00000 V Good N/A 5 Q7a v 25 100% 1.00000 V Good N/A 6 Q7a vi 21 84% N/A 0.93224 V Good 7 Q7b i 25 100% N/A 1.00000 V Good 8 Q7b ii 25 100% N/A 1.00000 V Good 9 Q7b iii 25 100% N/A 1.00000 V Good 10 Q7b iv 25 100% N/A 1.00000 V Good 11 Q7c i 23 92% N/A 0.72163 Good 12 Q7 cii 25 100% N/A 1.00000 V Good 13 Q7 d 24 96% N/A 0.92675 V Good 14 Q8a 25 100% N/A 1.00000 V Good 15 Q8b 25 100% N/A 1.00000 V Good 16 Q8d 25 100% N/A 1.00000 V Good 17 Q9 22 88% N/A 0.90611 V Good 18 Q10a 25 100% N/A 1.00000 V Good 19 Q10 b 25 100% N/A 1.00000 V Good 20 Q11a 24 96% 0.91511 V Good N/A 21 Q11b 25 100% 1.00000 V Good N/A 22 Q11c i 25 100% 1.00000 V Good N/A 23 Q11c ii 24 96% 0.88124 V Good N/A 24 Q11d 25 100% 1.00000 V Good N/A 25 Q12 a i 24 96% 0.91949 V Good N/A 26 Q12 a ii 25 100% 1.00000 V Good N/A 27 Q12 b i 25 100% 1.00000 V Good N/A 28 Q12 b ii 24 96% N/A 0.96462 V Good 29 Q12 c i 25 100% 1.00000 V Good N/A 30 Q12 c ii 25 100% 1.00000 V Good N/A 31 Q12 c iii 25 100% 1.00000 V Good N/A 32 Q13 a 25 100% 1.00000 V Good N/A 33 Q13 b 23 92% N/A 0.87982 V Good 34 Q14 a 22 88% 0.71429 Good N/A 35 Q14 b 1 21 84% N/A 0.85948 V Good 36 Q14 b 2 21 84% N/A 0.87462 V Good 37 Q14 b 3 22 88% N/A 0.85892 V Good 38 Q14 b 4 21 84% N/A 0.89676 V Good 39 Q14 b 5 21 84% N/A 0.79079 Good 40 Q14 c 1 25 100% N/A 1.00000 V Good 41 Q14 c 2 23 92% N/A 0.98166 V Good 42 Q14 c 3 22 88% N/A 0.96756 V Good 43 Q14 c 4 24 96% N/A 0.98638 V Good 44 Q14 c 5 24 96% N/A 0.99211 V Good 45 Q14 c 6 24 96% N/A 0.97626 V Good 46 Q15 1 a 25 100% N/A 1.00000 V Good 47 Q15 1 b 25 100% N/A 1.00000 V Good 48 Q15 1 c 25 100% N/A 1.00000 V Good 49 Q15 2 a 25 100% N/A 1.00000 V Good 50 Q15 2 b 25 100% N/A 1.00000 V Good
224

Tabulation of Retest Results: Sample Size: 25
Group #1: Same Interviewer S.No Variable
No Matched
cases Matched
% Kappa
Coefficient Extent of Matching
Kendall's Coefficient
Extent of Matching
51 Q15 2 c 25 100% N/A 1.00000 V Good 52 Q15 3 a 22 88% N/A 0.97657 V Good 53 Q15 3 b 22 88% N/A 0.97657 V Good 54 Q15 3 c 22 88% N/A 0.97691 V Good 55 Q15 4 a 23 92% N/A 0.99160 V Good 56 Q15 4 b 23 92% N/A 0.98964 V Good 57 Q15 4 c 23 92% N/A 0.98964 V Good 58 Q15 5 a 23 92% N/A 0.98318 V Good 59 Q15 5 b 24 96% N/A 0.98318 V Good 60 Q15 5 c 22 88% N/A 0.94467 V Good 61 Q15 6 a 21 84% N/A 0.94018 V Good 62 Q15 6 b 21 84% N/A 0.93333 V Good 63 Q15 6 c 22 88% N/A 0.96734 V Good 64 Q15 7 a 21 84% N/A 0.93792 V Good 65 Q15 7 b 21 84% N/A 0.93428 V Good 66 Q15 7 c 22 88% N/A 0.95386 V Good 67 Q15 8 a 22 88% N/A 0.98113 V Good 68 Q15 8 b 22 88% N/A 0.98281 V Good 69 Q15 8 c 22 88% N/A 0.97915 V Good 70 Q15 9 a 22 88% N/A 0.96232 V Good 71 Q15 9 b 22 88% N/A 0.96600 V Good 72 Q15 9 c 22 88% N/A 0.96232 V Good 73 Q16 a 21 84% N/A 0.81016 V Good 74 Q16 b 20 80% N/A 0.92989 V Good 75 Q16 c 23 92% N/A 0.95733 V Good 76 Q16 d 20 80% N/A 0.77882 Good 77 Q16 e 21 84% N/A 0.94897 V Good 78 Q16 f 22 88% N/A 0.93396 V Good 79 Q16 g 21 84% N/A 0.80538 Good 80 Q17 a 21 84% 0.66667 Good N/A 81 Q17 b 24 96% 0.91949 V Good N/A 82 Q17 c 21 84% 0.66667 Good N/A 83 Q17 d 21 84% 0.67533 Good N/A 84 Q17 e 23 92% 0.80159 Good N/A 85 Q17 f 24 96% 0.90476 V Good N/A 86 Q17 g 23 92% 0.83333 V Good N/A 87 Q17 h 24 96% 0.90476 V Good N/A 88 Q 17 i 24 96% 0.92000 V Good N/A 89 Q18 24 96% 0.91949 V Good N/A 90 Q19 a 22 88% N/A 0.97689 V Good 91 Q19 b 23 92% N/A 0.94513 V Good 92 Q19 c 23 92% N/A 0.95837 V Good 93 Q19 d 24 96% N/A 0.98354 V Good 94 Q20 a 24 96% N/A 0.92501 V Good 95 Q20 b 24 96% N/A 0.94479 V Good 96 Q20 c 24 96% N/A 0.99071 V Good 97 Q20 d 24 96% N/A 0.99645 V Good 98 Q20 e 24 96% N/A 0.90785 V Good 99 Q20 f 24 96% N/A 0.90785 V Good 100 Q20 g 24 96% N/A 0.99337 V Good 101 Q21.1 25 100% N/A 1.00000 V Good
225

Tabulation of Retest Results: Sample Size: 25
Group #1: Same Interviewer S.No Variable
No Matched
cases Matched
% Kappa
Coefficient Extent of Matching
Kendall's Coefficient
Extent of Matching
102 Q21.2 20 80% N/A 0.93654 V Good 103 Q21.3 24 96% N/A 0.99481 V Good 104 Q21.4 25 100% N/A 1.00000 V Good 105 Q21.5 25 100% N/A 1.00000 V Good 106 Q22 a 23 92% 0.82639 V Good N/A 107 Q22 b 1 25 100% N/A 1.00000 V Good 108 Q22 b 2 22 88% N/A 0.99460 V Good 109 Q22 b 3 24 96% N/A 0.99698 V Good 110 Q22 c i 24 96% 0.90476 V Good N/A 111 Q22 c ii 22 88% 0.76000 Good N/A 112 Q22c iii 24 96% 0.88345 V Good N/A 113 Q22c iv 25 100% 1.00000 V Good N/A 114 Q22c v 24 96% 0.86450 V Good N/A 115 Q23 a 22 88% 0.65035 Good N/A 116 Q23 b a 25 100% 1.00000 V Good N/A 117 Q23 b b 23 92% N/A 0.92736 V Good 118 Q23 b c 22 88% N/A 0.91103 V Good 119 Q23 b d 24 96% N/A 0.99627 V Good 120 Q24 a 24 96% 0.91790 V Good N/A 121 Q24 b i 25 100% 1.00000 V Good N/A 122 Q24 b ii 23 92% 0.78070 Good N/A 123 Q24 b iii 23 92% 0.80159 Good N/A 124 Q24 b iv 24 96% 0.89605 V Good N/A 125 Q24 b v 25 100% 1.00000 V Good N/A 126 Q24 b vi 24 96% 0.89605 V Good N/A
127 Q24 b
vii 24 96% 0.91087 V Good N/A 128 Q24 c 25 100% 1.00000 V Good N/A 129 Q24 d i 25 100% 1.00000 V Good N/A 130 Q24 d ii 24 96% 0.89605 V Good N/A 131 Q24 d iii 25 100% 1.00000 V Good N/A 132 Q24 d iv 24 96% 0.88345 V Good N/A 133 Q25.1 25 100% N/A 1.00000 V Good 134 Q25.2 24 96% N/A 0.98925 V Good 135 Q25.3 24 96% N/A 0.98233 V Good 136 Q25.4 24 96% N/A 0.98142 V Good 137 Q25.5 25 100% N/A 1.00000 V Good 138 Q25.6 24 96% N/A 0.96631 V Good 139 Q26 a 24 96% 0.88345 V Good N/A 140 Q26 b 25 100% 1.00000 V Good N/A 141 Q26 d i 23 92% 0.81618 V Good N/A 142 Q26 d ii 23 92% 0.80159 Good N/A 143 Q26 d iii 23 92% 0.78070 Good N/A 144 Q26 d iv 24 96% 0.91511 V Good N/A 145 Q27 a 24 96% N/A 0.97120 V Good 146 Q27 b 24 96% N/A 0.95445 V Good 147 Q27 c 21 84% N/A 0.89021 V Good 148 Q27 d 23 92% N/A 0.88944 V Good 149 Q27 e 24 96% N/A 0.99041 V Good 150 Q28 a 24 96% N/A 0.98339 V Good 151 Q28 b 24 96% N/A 0.96775 V Good
226

Tabulation of Retest Results: Sample Size: 25
Group #1: Same Interviewer S.No Variable
No Matched
cases Matched
% Kappa
Coefficient Extent of Matching
Kendall's Coefficient
Extent of Matching
152 Q28 c 24 96% N/A 0.99309 V Good 153 Q28 d 25 100% N/A 1.00000 V Good 154 Q28 e 25 100% N/A 1.00000 V Good 155 Q29 a 24 96% 0.70238 Good N/A 156 Q29 b i 24 96% 0.89605 V Good N/A 157 Q29 b ii 24 96% 0.89605 V Good N/A 158 Q29 b iii 24 96% 0.91790 V Good N/A 159 Q29 b iv 24 96% 0.91790 V Good N/A 160 Q29 b v 24 96% 0.86450 V Good N/A 161 Q29 b vi 24 96% 0.88345 V Good N/A 162 Q29 c i 24 96% 0.77778 Good N/A 163 Q29 c ii 24 96% -0.02041 Poor N/A 164 Q29 c iii 24 96% 0.83389 V Good N/A 165 Q30 a 24 96% 0.89605 V Good N/A 166 Q30 b 23 92% N/A 0.97211 V Good 167 Q30 c 24 96% 0.86450 V Good N/A 168 Q30 d i 23 92% 0.83974 V Good N/A 169 Q30 d ii 22 88% 0.75845 Good N/A 170 Q30 d iii 25 100% 1.00000 V Good N/A 171 Q30 d iv 24 96% 0.86450 V Good N/A 172 Q30 d v 24 96% 0.90476 V Good N/A Average 23 94% 0.86913 V Good 0.95812 V Good
Summary Kappa Kendall Nos 100 72 172 Poor 1 1% 0 0% Fair 1 1% 0 0% Moderate 0 0% 0 0% Good 14 19% 4 4% V Good 56 78% 96 96%
Total 72 100% 100 100%
227

Annex 3: Retest Results – Group #2 with Different Interviewer
Tabulation of Retest Results: Sample Size:25
Group#2: Different Interviewer S.No Variable
No Matched
cases Matched
% Kappa
Coefficient Extent of Matching
Kendall's Coefficient
Extent of Matching
1 Q7a i 21 84% 0.67949 Good N/A 2 Q7a ii 20 80% 0.60000 Moderate N/A 3 Q7a iii 23 92% 0.81618 V Good N/A 4 Q7a iv 21 84% 0.67533 Good N/A 5 Q7a v 22 88% 0.75370 Good N/A 6 Q7a vi 18 72% N/A 0.87779 V Good 7 Q7b i 25 100% N/A 1.00000 V Good 8 Q7b ii 25 100% N/A 1.00000 V Good 9 Q7b iii 25 100% N/A 1.00000 V Good 10 Q7b iv 25 100% N/A 1.00000 V Good 11 Q7c i 25 100% N/A 1.00000 V Good 12 Q7 cii 24 96% N/A 0.77778 Good 13 Q7 d 24 96% N/A 0.90171 V Good 14 Q8a 25 100% N/A 1.00000 V Good 15 Q8b 25 100% N/A 1.00000 V Good 16 Q8d 23 92% N/A 0.91718 V Good 17 Q9 24 96% N/A 0.94234 V Good 18 Q10a 25 100% N/A 1.00000 V Good 19 Q10 b 25 100% N/A 1.00000 V Good 20 Q11a 24 96% 0.89605 V Good N/A 21 Q11b 24 96% 0.77778 Good N/A 22 Q11c i 24 96% 0.83389 V Good N/A 23 Q11c ii 25 100% 1.00000 V Good N/A 24 Q11d 25 100% 1.00000 V Good N/A 25 Q12 a i 25 100% 1.00000 V Good N/A 26 Q12 a ii 24 96% 0.91653 V Good N/A 27 Q12 b i 25 100% 1.00000 V Good N/A 28 Q12 b ii 23 92% N/A 0.87333 V Good 29 Q12 c i 25 100% 1.00000 V Good N/A 30 Q12 c ii 25 100% 1.00000 V Good N/A 31 Q12 c iii 25 100% 1.00000 V Good N/A 32 Q13 a 24 96% 0.91949 V Good N/A 33 Q13 b 18 72% N/A 0.79241 Good 34 Q14 a 25 100% 1.00000 V Good N/A 35 Q14 b 1 25 100% N/A 1.00000 V Good 36 Q14 b 2 25 100% N/A 1.00000 V Good 37 Q14 b 3 25 100% N/A 1.00000 V Good 38 Q14 b 4 25 100% N/A 1.00000 V Good 39 Q14 b 5 25 100% N/A 1.00000 V Good 40 Q14 c 1 24 96% N/A 0.98198 V Good 41 Q14 c 2 23 92% N/A 0.96959 V Good 42 Q14 c 3 23 92% N/A 0.98840 V Good 43 Q14 c 4 23 92% N/A 0.98452 V Good 44 Q14 c 5 24 96% N/A 0.99622 V Good 45 Q14 c 6 23 92% N/A 0.98161 V Good 46 Q15 1 a 25 100% N/A 1.00000 V Good 47 Q15 1 b 24 96% N/A 0.99536 V Good 48 Q15 1 c 24 96% N/A 0.99783 V Good 49 Q15 2 a 23 92% N/A 0.98638 V Good
228

Tabulation of Retest Results: Sample Size:25
Group#2: Different Interviewer S.No Variable
No Matched
cases Matched
% Kappa
Coefficient Extent of Matching
Kendall's Coefficient
Extent of Matching
50 Q15 2 b 23 92% N/A 0.98750 V Good 51 Q15 2 c 23 92% N/A 0.98999 V Good 52 Q15 3 a 24 96% N/A 0.99067 V Good 53 Q15 3 b 24 96% N/A 0.98902 V Good 54 Q15 3 c 24 96% N/A 0.99329 V Good 55 Q15 4 a 23 92% N/A 0.98170 V Good 56 Q15 4 b 23 92% N/A 0.98141 V Good 57 Q15 4 c 23 92% N/A 0.97998 V Good 58 Q15 5 a 24 96% N/A 0.98727 V Good 59 Q15 5 b 24 96% N/A 0.98563 V Good 60 Q15 5 c 24 96% N/A 0.95024 V Good 61 Q15 6 a 21 84% N/A 0.97994 V Good 62 Q15 6 b 21 84% N/A 0.97894 V Good 63 Q15 6 c 21 84% N/A 0.97951 V Good 64 Q15 7 a 21 84% N/A 0.97575 V Good 65 Q15 7 b 20 80% N/A 0.97362 V Good 66 Q15 7 c 20 80% N/A 0.94113 V Good 67 Q15 8 a 16 64% N/A 0.95113 V Good 68 Q15 8 b 17 68% N/A 0.95343 V Good 69 Q15 8 c 17 68% N/A 0.95343 V Good 70 Q15 9 a 19 76% N/A 0.89403 V Good 71 Q15 9 b 20 80% N/A 0.90696 V Good 72 Q15 9 c 19 76% N/A 0.89403 V Good 73 Q16 a 23 92% N/A 0.94101 V Good 74 Q16 b 22 88% N/A 0.94149 V Good 75 Q16 c 22 88% N/A 0.91428 V Good 76 Q16 d 22 88% N/A 0.95112 V Good 77 Q16 e 23 92% N/A 0.85729 V Good 78 Q16 f 23 92% N/A 0.94433 V Good 79 Q16 g 25 100% N/A 1.00000 V Good 80 Q17 a 24 96% 0.89605 V Good N/A 81 Q17 b 22 88% 0.74533 Good N/A 82 Q17 c 23 92% 0.83333 V Good N/A 83 Q17 d 19 76% 0.51299 Moderate N/A 84 Q17 e 24 96% 0.91949 V Good N/A 85 Q17 f 24 96% 0.91790 V Good N/A 86 Q17 g 24 96% 0.91949 V Good N/A 87 Q17 h 24 96% 0.91511 V Good N/A 88 Q 17 i 24 96% 0.91790 V Good N/A 89 Q18 24 96% 0.92000 V Good N/A 90 Q19 a 25 100% N/A 1.00000 V Good 91 Q19 b 25 100% N/A 1.00000 V Good 92 Q19 c 25 100% N/A 1.00000 V Good 93 Q19 d 25 100% N/A 1.00000 V Good 94 Q20 a 22 88% N/A 0.87237 V Good 95 Q20 b 22 88% N/A 0.91708 V Good 96 Q20 c 23 92% N/A 0.94698 V Good 97 Q20 d 23 92% N/A 0.97953 V Good 98 Q20 e 22 88% N/A 0.89147 V Good 99 Q20 f 22 88% N/A 0.81454 V Good 100 Q20 g 23 92% N/A 0.98823 V Good
229

Tabulation of Retest Results: Sample Size:25
Group#2: Different Interviewer S.No Variable
No Matched
cases Matched
% Kappa
Coefficient Extent of Matching
Kendall's Coefficient
Extent of Matching
101 Q21.1 24 96% N/A 0.99434 V Good 102 Q21.2 21 84% N/A 0.90954 V Good 103 Q21.3 22 88% N/A 0.95696 V Good 104 Q21.4 24 96% N/A 0.98297 V Good 105 Q21.5 23 92% N/A 0.97515 V Good 106 Q22 a 25 100% 1.00000 V Good N/A 107 Q22 b 1 24 96% N/A 0.99742 V Good 108 Q22 b 2 24 96% N/A 0.99828 V Good 109 Q22 b 3 23 92% N/A 0.99742 V Good 110 Q22 c i 24 96% 0.91511 V Good N/A 111 Q22 c ii 23 92% 0.83974 V Good N/A 112 Q22c iii 24 96% 0.91087 V Good N/A 113 Q22c iv 24 96% 0.90476 V Good N/A 114 Q22c v 25 100% 1.00000 V Good N/A 115 Q23 a 23 92% 0.83974 V Good N/A 116 Q23 b a 23 92% 0.89282 V Good N/A 117 Q23 b b 22 88% N/A 0.95777 V Good 118 Q23 b c 21 84% N/A 0.95206 V Good 119 Q23 b d 21 84% N/A 0.96446 V Good 120 Q24 a 25 100% 1.00000 V Good N/A 121 Q24 b i 25 100% 1.00000 V Good N/A 122 Q24 b ii 24 96% 0.89661 V Good N/A 123 Q24 b iii 23 92% 0.70238 Good N/A 124 Q24 b iv 24 96% 0.75000 Good N/A 125 Q24 b v 25 100% 1.00000 V Good N/A 126 Q24 b vi 25 100% 1.00000 V Good N/A
127 Q24 b
vii 25 100% 1.00000 V Good N/A 128 Q24 c 25 100% 1.00000 V Good N/A 129 Q24 d i 24 96% 0.89605 V Good N/A 130 Q24 d ii 24 96% 0.89605 V Good N/A 131 Q24 d iii 23 92% 0.78070 Good N/A 132 Q24 d iv 24 96% 0.89605 V Good N/A 133 Q25.1 23 92% N/A 0.91198 V Good 134 Q25.2 22 88% N/A 0.90046 V Good 135 Q25.3 23 92% N/A 0.91026 V Good 136 Q25.4 24 96% N/A 0.92022 V Good 137 Q25.5 24 96% N/A 0.91927 V Good 138 Q25.6 23 92% N/A 0.97283 V Good 139 Q26 a 25 100% 1.00000 V Good N/A 140 Q26 b 25 100% 1.00000 V Good N/A 141 Q26 d i 25 100% 1.00000 V Good N/A 142 Q26 d ii 25 100% 1.00000 V Good N/A 143 Q26 d iii 25 100% 1.00000 V Good N/A 144 Q26 d iv 25 100% 1.00000 V Good N/A 145 Q27 a 24 96% N/A 0.98184 V Good 146 Q27 b 24 96% N/A 0.95072 V Good 147 Q27 c 24 96% N/A 0.99043 V Good 148 Q27 d 24 96% N/A 0.98011 V Good 149 Q27 e 24 96% N/A 0.93787 V Good 150 Q28 a 24 96% N/A 0.99002 V Good
230

Tabulation of Retest Results: Sample Size:25
Group#2: Different Interviewer S.No Variable
No Matched
cases Matched
% Kappa
Coefficient Extent of Matching
Kendall's Coefficient
Extent of Matching
151 Q28 b 24 96% N/A 0.99059 V Good 152 Q28 c 25 100% N/A 1.00000 V Good 153 Q28 d 24 96% N/A 0.97485 V Good 154 Q28 e 24 96% N/A 0.95350 V Good 155 Q29 a 23 92% 0.78070 Good N/A 156 Q29 b i 25 100% 1.00000 V Good N/A 157 Q29 b ii 23 92% 0.80159 Good N/A 158 Q29 b iii 25 100% 1.00000 V Good N/A 159 Q29 b iv 25 100% 1.00000 V Good N/A 160 Q29 b v 25 100% 1.00000 V Good N/A 161 Q29 b vi 25 100% 1.00000 V Good N/A 162 Q29 c i 25 100% 1.00000 V Good N/A 163 Q29 c ii 25 100% 1.00000 V Good N/A 164 Q29 c iii 25 100% 1.00000 V Good N/A 165 Q30 a 24 96% 0.91949 V Good N/A 166 Q30 b 24 96% N/A 0.98209 V Good 167 Q30 c 23 92% 0.75000 Good N/A 168 Q30 d i 23 92% 0.83766 V Good N/A 169 Q30 d ii 24 96% 0.91790 V Good N/A 170 Q30 d iii 23 92% 0.83766 V Good N/A 171 Q30 d iv 24 96% 0.90476 V Good N/A 172 Q30 d v 25 100% 1.00000 V Good N/A Average 23 94% 0.90606 V Good 0.96076 V Good
Summary Kappa Kendall Nos 100 72 172 Poor 0 0% 0 0% Fair 0 0% 0 0% Moderate 2 3% 0 3% Good 11 15% 2 15% V Good 59 82% 98 82%
Total 72 100% 100 100%
231

Annex 4: Retest Results – Sample 50 Repeat Respondents
Tabulation of Retested Samples: Sample Size - 50 S.No Variable
No Matched
cases Matched
% Kappa
Coefficient Extent of Matching
Kendall's Coefficient
Extent of Matching
1 Q7a i 42 84% 0.63235 Good N/A 2 Q7a ii 43 86% 0.71899 Good N/A 3 Q7a iii 46 92% 0.83974 V Good N/A 4 Q7a iv 46 92% 0.82639 V Good N/A 5 Q7a v 47 94% 0.87390 V Good N/A 6 Q7a vi 39 78% N/A 0.90840 V Good 7 Q7b i 50 100% N/A 1.00000 V Good 8 Q7b ii 50 100% N/A 1.00000 V Good 9 Q7b iii 50 100% N/A 1.00000 V Good 10 Q7b iv 50 100% N/A 1.00000 V Good 11 Q7c i 48 96% N/A 0.88390 V Good 12 Q7 cii 49 98% N/A 0.95853 V Good 13 Q7 d 48 96% N/A 0.91638 V Good 14 Q8a 50 100% N/A 1.00000 V Good 15 Q8b 50 100% N/A 1.00000 V Good 16 Q8d 48 96% N/A 0.95104 V Good 17 Q9 46 92% N/A 0.92694 V Good 18 Q10a 50 100% N/A 1.00000 V Good 19 Q10b 50 100% N/A 1.00000 V Good 20 Q11a 48 96% 0.90809 V Good N/A 21 Q11b 49 98% 0.92157 V Good N/A 22 Q11c i 49 98% 0.93060 V Good N/A 23 Q11c ii 49 98% 0.92769 V Good N/A 24 Q11d 50 100% 1.00000 V Good N/A 25 Q12 a i 49 98% 0.95797 V Good N/A 26 Q12 a ii 49 98% 0.96113 V Good N/A 27 Q12 b i 50 100% 1.00000 V Good N/A 28 Q12 b ii 47 94% N/A 0.92473 V Good 29 Q12 c i 50 100% 1.00000 V Good N/A 30 Q12 c ii 50 100% 1.00000 V Good N/A 31 Q12 c iii 50 100% 1.00000 V Good N/A 32 Q13 a 49 98% 0.95920 V Good N/A 33 Q13b 41 82% N/A 0.83216 V Good 34 Q14 a 47 94% 0.86813 V Good N/A 35 Q14 b 1 46 92% N/A 0.92824 V Good 36 Q14 b 2 46 92% N/A 0.93083 V Good 37 Q14 b 3 47 94% N/A 0.92837 V Good 38 Q14 b 4 46 92% N/A 0.95142 V Good 39 Q14 b 5 46 92% N/A 0.94479 V Good 40 Q14 c 1 49 98% N/A 0.98748 V Good 41 Q14 c 2 46 92% N/A 0.97590 V Good 42 Q14 c 3 45 90% N/A 0.98303 V Good 43 Q14 c 4 47 94% N/A 0.98430 V Good 44 Q14 c 5 48 96% N/A 0.99456 V Good 45 Q14 c 6 47 94% N/A 0.98213 V Good 46 Q15 1 a 50 100% N/A 1.00000 V Good 47 Q15 1 b 49 98% N/A 0.99676 V Good 48 Q15 1 c 49 98% N/A 0.99758 V Good 49 Q15 2 a 48 96% N/A 0.99295 V Good 50 Q15 2 b 48 96% N/A 0.99321 V Good
232

Tabulation of Retested Samples: Sample Size - 50 S.No Variable
No Matched
cases Matched
% Kappa
Coefficient Extent of Matching
Kendall's Coefficient
Extent of Matching
51 Q15 2 c 48 96% N/A 0.99373 V Good 52 Q15 3 a 46 92% N/A 0.98606 V Good 53 Q15 3 b 46 92% N/A 0.98457 V Good 54 Q15 3 c 46 92% N/A 0.98768 V Good 55 Q15 4 a 46 92% N/A 0.98536 V Good 56 Q15 4 b 46 92% N/A 0.98429 V Good 57 Q15 4 c 46 92% N/A 0.98490 V Good 58 Q15 5 a 47 94% N/A 0.98575 V Good 59 Q15 5 b 47 94% N/A 0.98532 V Good 60 Q15 5 c 46 92% N/A 0.95033 V Good 61 Q15 6 a 42 84% N/A 0.96374 V Good 62 Q15 6 b 42 84% N/A 0.96094 V Good 63 Q15 6 c 43 86% N/A 0.97484 V Good 64 Q15 7 a 42 84% N/A 0.96228 V Good 65 Q15 7 b 41 82% N/A 0.96309 V Good 66 Q15 7 c 42 84% N/A 0.94461 V Good 67 Q15 8 a 38 76% N/A 0.96079 V Good 68 Q15 8 b 39 78% N/A 0.96492 V Good 69 Q15 8 c 39 78% N/A 0.96205 V Good 70 Q15 9 a 41 82% N/A 0.95332 V Good 71 Q15 9 b 42 84% N/A 0.95485 V Good 72 Q15 9 c 41 82% N/A 0.95332 V Good 73 Q16 a 44 88% N/A 0.88841 V Good 74 Q16 b 42 84% N/A 0.94778 V Good 75 Q16 c 45 90% N/A 0.93962 V Good 76 Q16 d 42 84% N/A 0.86867 V Good 77 Q16 e 44 88% N/A 0.90405 V Good 78 Q16 f 45 90% N/A 0.94006 V Good 79 Q16 g 46 92% N/A 0.89506 V Good 80 Q17 a 45 90% 0.77386 Good N/A 81 Q17 b 46 92% 0.83897 V Good N/A 82 Q17 c 44 88% 0.76000 Good N/A 83 Q17 d 40 80% 0.59416 Moderate N/A 84 Q17 e 47 94% 0.87130 V Good N/A 85 Q17 f 48 96% 0.91319 V Good N/A 86 Q17 g 47 94% 0.87957 V Good N/A 87 Q17 h 48 96% 0.91087 V Good N/A 88 Q 17 i 48 96% 0.91949 V Good N/A 89 Q18 48 96% 0.91987 V Good N/A 90 Q19 a 47 94% N/A 0.98797 V Good 91 Q19 b 48 96% N/A 0.96851 V Good 92 Q19 c 48 96% N/A 0.97697 V Good 93 Q19 d 49 98% N/A 0.99018 V Good 94 Q20 a 46 92% N/A 0.90357 V Good 95 Q20 b 46 92% N/A 0.92769 V Good 96 Q20 c 47 94% N/A 0.96781 V Good 97 Q20 d 47 94% N/A 0.98733 V Good 98 Q20 e 46 92% N/A 0.90305 V Good 99 Q20 f 46 92% N/A 0.91887 V Good 100 Q20 g 47 94% N/A 0.98816 V Good 101 Q21.1 49 98% N/A 0.99447 V Good 102 Q21.2 41 82% N/A 0.92355 V Good
233

Tabulation of Retested Samples: Sample Size - 50 S.No Variable
No Matched
cases Matched
% Kappa
Coefficient Extent of Matching
Kendall's Coefficient
Extent of Matching
103 Q21.3 46 92% N/A 0.97530 V Good 104 Q21.4 49 98% N/A 0.99199 V Good 105 Q21.5 48 96% N/A 0.98574 V Good 106 Q22 a 48 96% 0.90476 V Good N/A 107 Q22 b 1 48 96% N/A 0.99842 V Good 108 Q22 b 2 45 90% N/A 0.99524 V Good 109 Q22 b 3 46 92% N/A 0.99574 V Good 110 Q22 c i 49 98% 0.91087 V Good N/A 111 Q22 c ii 45 90% 0.79992 Good N/A 112 Q22c iii 48 96% 0.90079 V Good N/A 113 Q22c iv 49 98% 0.94926 V Good N/A 114 Q22c v 49 98% 0.92913 V Good N/A 115 Q23 a 45 90% 0.78022 Good N/A 116 Q23 b a 48 96% 0.94889 V Good N/A 117 Q23 b b 45 90% N/A 0.94395 V Good 118 Q23 b c 43 86% N/A 0.93421 V Good 119 Q23 b d 45 90% N/A 0.97721 V Good 120 Q24 a 49 98% 0.95604 V Good N/A 121 Q24 b i 50 100% 1.00000 V Good N/A 122 Q24 b ii 44 88% 0.83652 V Good N/A 123 Q24 b iii 43 86% 0.76263 Good N/A 124 Q24 b iv 44 88% 0.82731 V Good N/A 125 Q24 b v 50 100% 1.00000 V Good N/A 126 Q24 b vi 46 92% 0.93868 V Good N/A
127 Q24 b
vii 46 92% 0.94804 V Good N/A 128 Q24 c 50 100% 1.00000 V Good N/A 129 Q24 d i 50 100% 1.00000 V Good N/A 130 Q24 d ii 39 78% 0.88736 V Good N/A 131 Q24 d iii 39 78% 0.88218 V Good N/A 132 Q24 d iv 39 78% 0.88218 V Good N/A 133 Q25.1 48 96% N/A 0.95692 V Good 134 Q25.2 46 92% N/A 0.94631 V Good 135 Q25.3 47 94% N/A 0.94909 V Good 136 Q25.4 48 96% N/A 0.95212 V Good 137 Q25.5 49 98% N/A 0.96074 V Good 138 Q25.6 47 94% N/A 0.97299 V Good 139 Q26 a 49 98% 0.94926 V Good N/A 140 Q26 b 50 100% 1.00000 V Good N/A 141 Q26 d i 48 96% 0.91949 V Good N/A 142 Q26 d ii 48 96% 0.87500 V Good N/A 143 Q26 d iii 48 96% 0.90079 V Good N/A 144 Q26 d iv 49 98% 0.95920 V Good N/A 145 Q27 a 48 96% N/A 0.97426 V Good 146 Q27 b 46 92% N/A 0.95871 V Good 147 Q27 c 45 90% N/A 0.93343 V Good 148 Q27 d 47 94% N/A 0.93200 V Good 149 Q27 e 48 96% N/A 0.96466 V Good 150 Q28 a 48 96% N/A 0.98994 V Good 151 Q28 b 48 96% N/A 0.98556 V Good 152 Q28 c 49 98% N/A 0.99755 V Good 153 Q28 d 49 98% N/A 0.98337 V Good
234

Tabulation of Retested Samples: Sample Size - 50 S.No Variable
No Matched
cases Matched
% Kappa
Coefficient Extent of Matching
Kendall's Coefficient
Extent of Matching
154 Q28 e 49 98% N/A 0.97819 V Good 155 Q29 a 46 92% 0.75000 Good N/A 156 Q29 b i 49 98% 0.94667 V Good N/A 157 Q29 b ii 47 94% 0.84779 V Good N/A 158 Q29 b iii 49 98% 0.95920 V Good N/A 159 Q29 b iv 49 98% 0.95710 V Good N/A 160 Q29 b v 49 98% 0.94667 V Good N/A 161 Q29 b vi 49 98% 0.95325 V Good N/A 162 Q29 c i 49 98% 0.84639 V Good N/A 163 Q29 c ii 49 98% 0.65636 Good N/A 164 Q29 c iii 49 98% 0.93502 V Good N/A 165 Q30 a 48 96% 0.91319 V Good N/A 166 Q30 b 47 94% N/A 0.97904 V Good 167 Q30 c 47 94% 0.80507 Good N/A 168 Q30 d i 46 92% 0.83974 V Good N/A 169 Q30 d ii 46 92% 0.83974 V Good N/A 170 Q30 d iii 48 96% 0.91511 V Good N/A 171 Q30 d iv 48 96% 0.89035 V Good N/A 172 Q30 d v 49 98% 0.95866 V Good N/A Average 47 93% 0.89328 V Good 0.96255 V Good
Summary Kappa Kendall Nos 100 72 172 Poor 0 0% 0 0% Fair 0 0% 0 0% Moderate 1 1% 0 0% Good 10 14% 0 0% V Good 61 85% 100 100%
Total 72 100% 100 100%
The ratings for the above tests were based on Landis and Koch103 observations for dichotomous data (Yes/No); and Kendall and Smith104 :
Value Rating <0.20 Poor
0.21-0.40 Fair 0.41-0.60 Moderate 0.61-0.80 Good 0.81-1.00 V Good
While the above rating has been suggested mainly for the dichotomous variables, the same rating has been used for Kendall’s coefficient of concordance also to maintain uniformity.
103 Landis J.R., Koch G.G. (1979), The measurement of Observer agreement for categorical data, Biometrics, 33, pp159-174. 104 Kendall, M. G.; Babington Smith, B. (Sep 1939), The Problem of m Rankings,. The Annals of Mathematical Statistics 10 (3): 275–287.
235

Bibliography
Account Ability (2006), Reinventing Accountability for the 21st Century, pp-6.
Aiyangar, S.Krishnawamy (1931), Evolution of Hindu Administrative Institutions in South India, University of Madras, (AES Reprint, New Delhi, 1994), p-138
Anne - Marie Slaughter (1999), Agencies on the Loose?- Holding Government Networks Accountable, Harvard Law School Public Law and Legal Theory Working Paper Series, Working Paper No. 006, pp5.
Bartosz Kurek, (2004), Culture creating function of accounting, Accounting Department, Cracow University of Economics, pp- 1.
Bellver, Ana and Kaufmann, Daniel (2005), Transparenting Transparency- Initial Empirics and Policy Applications - Preliminary draft, August, 2005 -- for discussion and comments, The World Bank, pp-1.
Bergen Seminar Series (2002/2003), The Philippines: Enhancing public transparency and accountability through civil society participation in monitoring government services, CASE STUDY, pp-2
Bovens, Mark (2006), Analyzing and Assessing Public Accountability - A Conceptual Framework, European Governance Papers No.C-06-01
Campbell R., Dowding K., John P. (2007), Modelling the exit –voice trade-off; social capital and responses to public services, Paper presented at Centre for Democracy and Elections, University of Manchester, February 28, 2007.
Carmen Malena, with Reiner Forster, Janmejay Singh (December 2004), Social Accountability: An Introduction to the Concept and Emerging Practice, SOCIAL DEVELOPMENT PAPERS, Participation and Civic Engagement,Paper No. 76, The World Bank, pp 2-3.
Carole Rakodi (2003), Evaluation of effectiveness of measures to increase the transparency, responsiveness and accountability of Local Governance, , School of Public Policy, University of Birmingham for the Global Steering Committee, UN-HABITAT Campaign for Good Urban Governance.
Carstens, Agustin (2005), (Deputy Managing Director of the International Monetary Fund), The Role of Transparency and Accountability for Economic Development in Resource-rich Countries at the Regional Workshop on Transparency and Accountability in Resource Management in CEMAC Countries, Malabo, Equatorial Guinea, January 27, 2005.
Dowding K. & John P. (2008), The Three Exit, Three Voice and Loyalty Framework: A Test with Survey Data on Local Services, Political Studies 56(2), pp. 288-311.
Government of Australia, Commonwealth Procurement Guidelines from http://www.finance.gov.au/procurement/
Government of India (2007), Eleventh Administrative Reforms Commission Report, Chapter 1, pp-1, from www.darpg.nic.in
236

Hirschman, Albert O. (1970), Exit, Voice, and Loyalty: Responses to Decline in Firms, Organizations, and States, Cambridge: Harvard University Press
http://www.utumishi.go.tz , Accountability and Responsiveness to the Public, (Last Updated Friday, 07 March 2008)
International Development Department School of Public Policy, University of Birmingham, England, (May 2002), Local Government Decision-Making: Citizen Participation and Local Accountability - Examples of Good (and Bad) Practice in Kenya, pp-4.
Jusoh, Hamzah and Rashid, Azmizam Abdul (2008), , Efficiency in Urban Governance towards Sustainability and Competitiveness of City: A Case Study of Kuala Lumpur, World Academy of Science, Engineering and Technology 40 - 2008, pp-445.
Kamath Ashok (2005), Performance Measurement in Education – the PROOF Initiative, Akshara Foundation, Bangalore, India
Kaufmann Daniel, Léautier Frannie, and Mastruzzi Massimo, (April 2004), Governance and the City: An Empirical Exploration into Global Determinants of Urban Performance, pp 7-9. Preliminary Draft
Kendall, M. G.; Babington Smith, B. (Sep 1939). "The Problem of m Rankings". The Annals of Mathematical Statistics 10 (3): 275–287.
Kitchen, H (2005), Delivering Local/Municipal Services, Public Services Delivery edited by Anwar Shah, The World Bank, pp-121-122
Landis J.R., Koch G.G. (1979), “The measurement of Observer agreement for categorical data”, Biometrics, 33, pp159-174.
Lord Sharman of Redlynch (2001), Holding to Account - The Review of Audit and Accountability for Central Government, February 2001.
Lowndes, Vivien and Pratchett, Lawrence (2007), CLEAR: Understanding Citizen Participation in Local Government – and How to Make it Work Better. The CLEAR tool was developed in collaboration with Gerry Stoker, University of Southampton – pp1, from www.europeanchallenge.eu/
Martin, John (Victoria University of Wellington- New Zealand) Changing Accountability Relations: Politics, Consumers and the Market, Public Management Service, OECD, 1997 (pp-1)
Mathur, Mukesh P.(2003), Municipal Finance and Municipal Services in India - Present Status and Future Prospects, NIUA, pp-83
Mathur,M.P. (2007), Impact of the Constitution (74th) Amendment Act on the Urban Local Bodies: A Review, National Institute of urban Affairs, NIUA-WP 07-02, pp-3
Ministry of Urban Development, Jawaharlal Nehru National urban Renewal Mission, Overview, pp-3, from http//:www.jnnurm.nic.in
Mody, Jyothsna (2004), Achieving Accountability Through Decentralization: Lessons for integrated river basin management, World Bank Policy Research Working Paper 3346, June 2004, pp-5.
237

Nallathiga, Ramakrishna, (2005), Institutional innovations of Urban Governance: Some examples of Indian cities, Urban India, Vol XXV, No. 2 (2005):pp-13.
NCRCL (2002), Public Financial Accountability in Urban Local Bodies in Karnataka.
One World Trust (2006), Pathways to Accountability – A short guide to the GAP Framework, pp-1
Otsuka, Muneharu (2005), Enhancing Public Accountability, National Performance Indicators And The Role of The Board of Audit of Japan, OECD, pp-1, from www.asosai.org/journal2005_April/
Pamela D. Gibson, Donald P. Lacy, Michael J. Dougherty (2005), Improving Performance and Accountability in Local Government with Citizen Participation, The Public Sector Innovation Journal, Volume 10(1).
Paul, Samuel (1992), Accountability in Public Services: Exit, Voice and Control, World Development, Vol.20, No.7, pp-1047-1060.
Paul, Samuel (2002), Holding the State to Account – Citizen Monitoring in Action, Books for Change, pp-7-25
Policy Paper – Urban Development, LogoLink Research Project on ReCitE, pp-1, from www2.ids.ac.uk/logolink/initiatives/projects/
Publications Division, Government of India, (1990), India: Government and Economic Life in Ancient and Medieval Periods, pp.17-18
Ramachandran, Padma (1995), Public Administration in India, National Book Trust, 1995, pp-7
Ramanathan, Ramesh (2007), Federalism, Urban Decentralisation and Citizen Participation, Economic and Political Weekly, February 24, 2007, pp-675
Raynard, (2000) by Hetty Kovach, Caroline Neligan and Simon Burall (2003), Power Without Accountability?, Global Accountability Report 2003, One World Trust.
RBI (2007), Municipal Finance in India: An Assessment, Department of Economic Analysis and Policy, Reserve Bank of India, Mumbai, December 27, 2007
Report of the Steering Committee on Urban Development for Eleventh Five Year Plan (2007-2012); pp-55-56
Roopa Purushothaman (2009), from chapter on The Next Urban Frontier, in India 2009, Business Standard Publication, pp-235.
Ryan, Peter et.al (2006), Bridging the gap - Citizens’ Action for accountability in water and sanitation, WaterAid, (www.wateraid.org), pp-7.
Sahgal, Vinod and Chakrapani, Deepa (2000), Clean Government and Public Financial Accountability, OED Working Paper Series No. 17, The World Bank, pp-2
The 1996 Rakesh Mohan Infrastructure Report estimated that annual investments of about US$5 billion (1.5 percent of GDP) are needed to make up for past under investments and future demands on urban areas.
238

The Glocal e-cities Network Portal; www.glocalforum.org
The World Bank Institute (2004), Community Empowerment and Social Inclusion, concept paper from http//:www.worldbank.org
UNCHS (2000),: Good Urban Governance: A Normative Framework, Conference Room Paper 6, 26 February 2000. See the Global Campaign for Good Urban Governance Website http://www.unchs.org/govern/
UNDP (2001),CONTACT, p 2-2 from http//:www.undp.org
UNDP, Bergen Seminar Series (2002/2003), Responsiveness and Accountability for Poverty Reduction - CASE STUDY, pp-4.
UNDP, Governance for Livelihoods and Development in the Pacific (GOLD) Programme,
UNDP website.
UNDP: Strengthening accountability at the country level UNDP's approach to democratic governance assessments, UNDP Website: http://www.undp.org
UN-ESCAP, What is Good Governance?, from www.unescap.org/pdd
UNHABITAT (2001), Norms of Urban Governance – consultation draft, pp-3, from ww2.unhabitat.org/campaigns/governance/
United States General Accounting Office, Accounting and Information Management Division, (1999) Federal Information System Controls Audit Manual, Volume I: Financial Statement Audits, pp-227.
USAID (2006), Municipal Finance: Assessment and Implementation Toolkit, pp-1 PADCO in association with Andrew Young School of Policy Studies, Georgia State University, TCG International, LL C
Vishwanath, Tara and Kaufmann, Daniel (1999), Towards Transparency in Finance and Governance (Draft), The World Bank, September 1999, pp-3,4
World Bank (2003), World Development Report 2004, pp-47
World Bank (2004), Working Paper No.30, State-Society Synergy for Accountability – Lessons from World Bank.
World Bank (2007) based on a presentation on Social Accountability aspects in Bosnia Herzogovina, from http//:www.worldbank.org
World Bank, (June 2001), India Urban Sector Strategy. The Strategy notes suggest that urban poverty is less well analyzed than rural poverty.
World Bank, Energy and Infrastructure Unit, South Asia Region, (December, 2004), INDIA: Urban Finance and Governance Review, Volume I (Executive Summary and Main Report), pp-iv.
239

Web-based References
curriculumfutures.org/assessment/c01-glossary.html
en.wikipedia.org/wiki/Accountability
europa.eu.int/abc/eurojargon/index_en.htm
http://en.wikipedia.org/wiki/Governance
http://indiatogether.org/campaigns/proofblr/
http://tutor2u.net/business/accounts/intro_accounting.htm
http://www.accountability.org.uk or www.accountability21.net
http://www.adb.org/Documents/Policies/Urban_Sector/urban0203.asp?p=policies
http://www.chennaicorporation.gov.in
http://www.gdrc.org/u-gov/accountability.html
http://www.mrsc.org/research/libraryresults.aspx?cat=409
http://www.oecd.org/LongAbstract/0,3425,en_2649_34129_38983243_119666_1_1_37405,00.html
http://www.thefreedictionary.com/accounting
http://www.unesco.org/most/southa13.htm
strategicsourcing.navy.mil/reference_documents/defs.cfm
www.accountability.org.uk or www.accountability21.net
www.afsc.org/trade-matters/learn-about/glossary.htm
www.business-in-asia.com/glossary5.html
www.cdc.gov/tobacco/evaluation_manual/glossary.html
www.cnu.edu/admin/assess/about/plans/glossary.htm
www.cogsci.princeton.edu/cgi-bin/webwn2.1
www.ddrcco.com/glossarya.htm
www.doaskdotell.com/refer/vocab.htm
www.gdrc.org
www.gdrc.org/u-gov/accountability.html
240

241
www.glocalforum.org, “The Glocal e-cities Network Portal”
www.gov.sk.ca/finance/accountability/2005/keyterms.htm
www.imf.org/external/pubs/ft/fabric/gloss.htm
www.inspection.gc.ca/english/corpaffr/publications/riscomm/riscomm_appe.shtml
www.isnar.cgiar.org/publications/planning-book5.htm
www.scoea.bc.ca/glossary2001.htm
www.shelflife.hq.dla.mil/Policy_4140_27/06Definitions.htm
www.thefreedictionary.com (American Heritage Dictionary® of English Language 2000, Revision 2003)
www.thinkexist.com
www.ucsc.edu/matman/bppwg/glossary.htm
www.um.dk/da/menu/Udviklingspolitik/MaalOgResultatstyring/Evaluering/Retningslinjer/AnnexIListKeyConcepts.htm
www-personal.umich.edu/~alandear/glossary/t.html