A STUDY ON STOCK PERFORMANCE ANALYSIS WITH SPECIAL ...
20
International Journal of Innovative Research in Management Studies (IJIRMS) ISSN (Online): 2455-7188, Impact Factor: 0.7261 Volume 1 | Issue 6 | July 2016 www.ijirms.com Page | 115 A STUDY ON STOCK PERFORMANCE ANALYSIS WITH SPECIAL REFERENCE TO BHEL N.Prabha* B.Mathiarasi** *Associate Professor, Department of Management Studies, Paavai Engineering College, Pachal, Namakkal **II MBA Student, Department of Management Studies, Paavai Engineering College, Pachal, Namakkal. ABSTRACT This paper related to stock performance analysis towards BHEL, which is specifically focused on share trading of the company. As in every management of business has the task of conducting business performance analysis. But in the recent periods the modern corporate looks not only for financial ambition but also they analyze the study on stock performance of the company. This current study will be undergoing by comparing BHEL’s major share trading in the market. The present study covered a period of Five years (2010-2015). It should be estimate the BHEL’s share value position in the market. This study exhibits the BHEL share value position and also it reveals that the company where it’s positioned in the market i.e. Strength or Weakness among the market. The study on BHEL stock performance seems to be know that whether the company’s performance is in good condition or else in the volatile position. It shows the clear picture about the company’s improvement among the share. By analyzing the Fundamental and Technical tools of Share Value some findings and recommendations are given. Key words: Investment, Return, Risk, Share Trading, Stock. INTRODUCTION BHEL is a leading manufacturer of variety of Industrial Systems & Products. Industry business of the company aims at meeting the growing demand for a number of industries like Metallurgical, Mining, Cement, Paper, Fertilizers, Refineries & Petrochemicals, etc. besides Captive/ Industrial Utilities. A stock market, equity market or share market is the aggregation of buyers and sellers (a loose network of economic transactions, not a physical facility or discrete entity) of stocks (also called shares); these may include securities listed on a stock exchange as well as those only traded privately.
Transcript of A STUDY ON STOCK PERFORMANCE ANALYSIS WITH SPECIAL ...

International Journal of Innovative Research in Management Studies (IJIRMS) ISSN (Online): 2455-7188, Impact Factor: 0.7261 Volume 1 | Issue 6 | July 2016
www.ijirms.com Page | 115
A STUDY ON STOCK PERFORMANCE ANALYSIS
WITH SPECIAL REFERENCE TO BHEL
N.Prabha* B.Mathiarasi**
*Associate Professor, Department of Management Studies, Paavai Engineering College, Pachal, Namakkal
**II MBA Student, Department of Management Studies, Paavai Engineering College, Pachal, Namakkal.
ABSTRACT
This paper related to stock performance analysis towards BHEL, which is specifically focused on
share trading of the company. As in every management of business has the task of conducting
business performance analysis. But in the recent periods the modern corporate looks not only for
financial ambition but also they analyze the study on stock performance of the company. This
current study will be undergoing by comparing BHEL’s major share trading in the market. The
present study covered a period of Five years (2010-2015). It should be estimate the BHEL’s share
value position in the market. This study exhibits the BHEL share value position and also it reveals
that the company where it’s positioned in the market i.e. Strength or Weakness among the market.
The study on BHEL stock performance seems to be know that whether the company’s performance
is in good condition or else in the volatile position. It shows the clear picture about the company’s
improvement among the share. By analyzing the Fundamental and Technical tools of Share Value
some findings and recommendations are given.
Key words: Investment, Return, Risk, Share Trading, Stock.
INTRODUCTION
BHEL is a leading manufacturer of variety of Industrial Systems & Products. Industry
business of the company aims at meeting the growing demand for a number of industries like
Metallurgical, Mining, Cement, Paper, Fertilizers, Refineries & Petrochemicals, etc. besides
Captive/ Industrial Utilities. A stock market, equity market or share market is the aggregation
of buyers and sellers (a loose network of economic transactions, not a physical facility or discrete
entity) of stocks (also called shares); these may include securities listed on a stock exchange as
well as those only traded privately.

International Journal of Innovative Research in Management Studies (IJIRMS) ISSN (Online): 2455-7188, Impact Factor: 0.7261 Volume 1 | Issue 6 | July 2016
www.ijirms.com Page | 116
NEED OF THE STUDY
This study curious to know the in depth knowledge about the stock details.
This study carves to enter into the field of share market.
This study makes to understand the unknown things that how to analyze the data related to
the share market.
OBJECTIVES OF THE STUDY
This study is used to analyze the present trend of buying and selling of shares of the
company.
This study exhibits that the company position in the market
To know the formal functional activities of a company.
This study helps to summarize the findings.
SCOPE OF THE STUDY
The study is to analyze the financial and future investment prospective of the key players
from power sector of the economy.
The fundamental analysis is to determine the value of the shares.
The technical analysis is to predict the future stock behavior.
Rational investors always focus on maximum return which bears minimum risk.
LIMITATIONS OF THE STUDY
Figures for this analysis from the company were only for last 5 years.
The data which is collected that the estimation is subject to change in the future. (i.e..,)
high or low.
This historical value may be different from actual values
The analysis has been constructed on the basis of data available
The technical analyzes of the data shows neither the approximate values nor accurate.
The usage of both Fundamental and Technical tools are only a market indicator; they
cannot have taken as final regarding financial position of the firm.
International Journal of Innovative Research in Management Studies (IJIRMS) ISSN (Online): 2455-7188, Impact Factor: 0.7261 Volume 1 | Issue 6 | July 2016
www.ijirms.com Page | 117
LITERATURE REVIEW
As the activities of stock market tend to be specialized and not understood by common people, but
this topic will clearly review the stock performance and so as to serve as a basis for understanding
the BHEL’s stock positions compare with their competitors and trade in a monetary zone. Besides
it accompanied the stock trading details of the individual company for 5 years taking 1-month data.
Mr. Vivek. N, professor, Department of Management of Science, PSG College of Technology,
Coimbatore, 2003 has published a research paper titled "A Study on volatility and entry point
options for BSE listed Stocks", in the business Research conference (2003) held at PSG college of
Technology. His main research objectives are,
To measure the volatility of fixed Stocks in BSE for six years,
To study the general market volatility year by year. He has used judgment sampling and
selects 28 stocks from the BSE listed stocks.
Ms. Preethi Singh, Department of Commerce, Jesus and Marry College, University of Delhi,
Delhi, 2003 have published a paper titled “A study on stock volatility and Financial Performance
of L& T Limited, her main objectives are, the technical analysis do believe that the Prices of stock
fluctuate around the true intrinsic value of stock.
Dr.Ravichandran.K, Reader, Bharathidasan Institute of Management (school of excellence of
Bharathidasan University) Tiruchirapalli, 2003 have published a research paper titled “A study on
Stock volatility and technical performance in TNPL”, His main research objectives are,
To know about the company’s general performance and current year stock value
position of the company.
To know about the competitor’s position, compare to TNPL.
Varma Venkiteswaran explored the relationship of the Indian stock markets as reflected by the
Bombay Stock Exchange Index, vis-a-vis other prominent international stock markets. Twenty-
three international stock indices are used over the period 1983-87. He concluded that there was
practically no meaningful relationship between the BSE index and other international stock market
indices, though the British and South Korean indices are inversely related to BSE.
Barua and Srinivasan worked on the investment decision making process of individuals has been
explored through experiments. They conclude that the risk perception of individuals is

International Journal of Innovative Research in Management Studies (IJIRMS) ISSN (Online): 2455-7188, Impact Factor: 0.7261 Volume 1 | Issue 6 | July 2016
www.ijirms.com Page | 118
significantly influenced by the skewness of the return distribution. This implies that while taking
investment decisions, investors are concerned about the possibility of maximum losses in addition
to the variability of returns. Thus the mean variance framework does not fully explain the
investment decision making process of individuals. Indian stock market is not efficient and
investors can improve their returns by timing their investment.
Gupta (2011) studied on Comparative Study of Distribution of Indian Stock Market with Other
Asian Markets. She studied whether Indian stock market returns were correlated to the stock
market returns of other selected Asian Economies or not and compared the distribution of the stock
market returns of India with other selected Asian economies. She included BSE(India), Heng Seng
(Hong Kong), JKS(Indonesia), KLSE (Malaysia), Nikkie (Japan), KS11 (Korea) in her study. She
used the descriptive statistics of the six Asian markets for the period between 2005 and 2009. She
found that the mean of the weekly returns of India and the Indonesian markets were observed to
be the highest around 23%. Japanese markets were flat during the study period. Volatility as
measured by standard deviation and its square, the variance was the least observed in the Malaysian
markets. The other five Asian markets generated variance in the range of 11%-15%. Indian markets
showed maximum variance. Kurtosis, as referred to as the volatility of the volatility, measures the
peakedness of the distribution. The weekly returns of Hong Kong and Malaysian markets were
more near to their respective means, as their kurtosis were nearing 3. Weekly returns of Indian
stock markets indicate a low peak with a fat mid-range on either side.
RESEARCH METHODOLOGY
Research methodology is a way to systematically solve the research problem. It may be understood
as a science of studying how the research is done systematically. With the help of the data taken
from the previous 5 years’ annual reports the various important parameters are analyzed in order
to ascertain the share position of the company. The data needed for the present study had been
collected through secondary data sources.
RESEARCH DESIGN
The study was designed to Analytical research in nature. Research of any type is a method to
discover information. Within analytical research articles, data and other important facts that pertain

International Journal of Innovative Research in Management Studies (IJIRMS) ISSN (Online): 2455-7188, Impact Factor: 0.7261 Volume 1 | Issue 6 | July 2016
www.ijirms.com Page | 119
to a project is compiled; after the information is collected and evaluated, the sources are used to
prove a hypothesis or support an idea.
METHODS OF DATA COLLECTION
This study is purely based on the “SECONDARY DATA The data used for the research
are collected from the secondary sources. In the secondary data the most of the data are gathered
from the,
Company’s Annual Report from 2010-2016.
Company’s catalogue and Share Prices from the BSE websites.
Company’s websites, Books and other finance related websites.
PERIOD OF THE STUDY:
This study covers a period of five years from 2010-2016.
TOOLS AND TECHNIQUES
The collected data was analyzed through the some financial analysis such it consists of,
Fundamental Tools
Technical Tools
1. Dow Jones Industrial Average(DJIA)
2. Bollinger Bands (BB)
3. Relative Strength Index (RSI)
4. Moving Average Convergent and Divergent (MACD)
ANALYSIS AND INTERPRETATION
The objective of fundamental analysis is to appraise the 'intrinsic value' of a security.
International Journal of Innovative Research in Management Studies (IJIRMS) ISSN (Online): 2455-7188, Impact Factor: 0.7261 Volume 1 | Issue 6 | July 2016
www.ijirms.com Page | 120
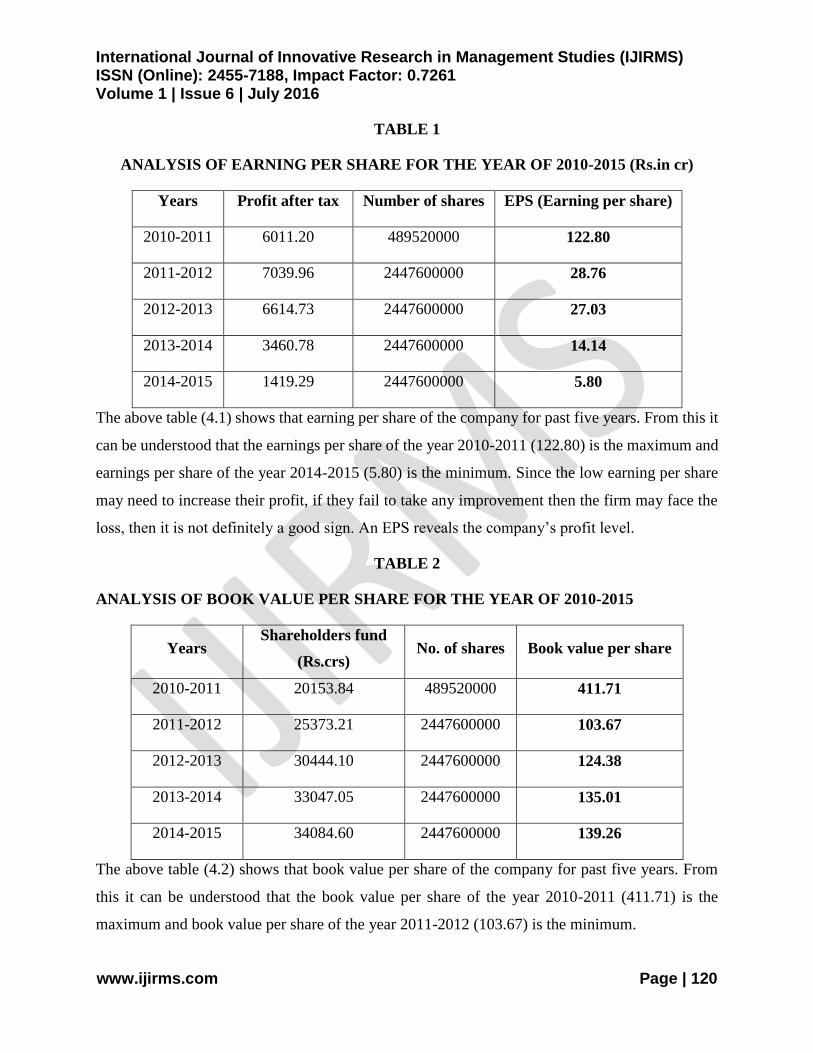
TABLE 1
ANALYSIS OF EARNING PER SHARE FOR THE YEAR OF 2010-2015 (Rs.in cr)
Years Profit after tax Number of shares EPS (Earning per share)
2010-2011 6011.20 489520000 122.80
2011-2012 7039.96 2447600000 28.76
2012-2013 6614.73 2447600000 27.03
2013-2014 3460.78 2447600000 14.14
2014-2015 1419.29 2447600000 5.80
The above table (4.1) shows that earning per share of the company for past five years. From this it
can be understood that the earnings per share of the year 2010-2011 (122.80) is the maximum and
earnings per share of the year 2014-2015 (5.80) is the minimum. Since the low earning per share
may need to increase their profit, if they fail to take any improvement then the firm may face the
loss, then it is not definitely a good sign. An EPS reveals the company’s profit level.
TABLE 2
ANALYSIS OF BOOK VALUE PER SHARE FOR THE YEAR OF 2010-2015
Years Shareholders fund
(Rs.crs) No. of shares Book value per share
2010-2011 20153.84 489520000 411.71
2011-2012 25373.21 2447600000 103.67
2012-2013 30444.10 2447600000 124.38
2013-2014 33047.05 2447600000 135.01
2014-2015 34084.60 2447600000 139.26
The above table (4.2) shows that book value per share of the company for past five years. From
this it can be understood that the book value per share of the year 2010-2011 (411.71) is the
maximum and book value per share of the year 2011-2012 (103.67) is the minimum.
International Journal of Innovative Research in Management Studies (IJIRMS) ISSN (Online): 2455-7188, Impact Factor: 0.7261 Volume 1 | Issue 6 | July 2016
www.ijirms.com Page | 121
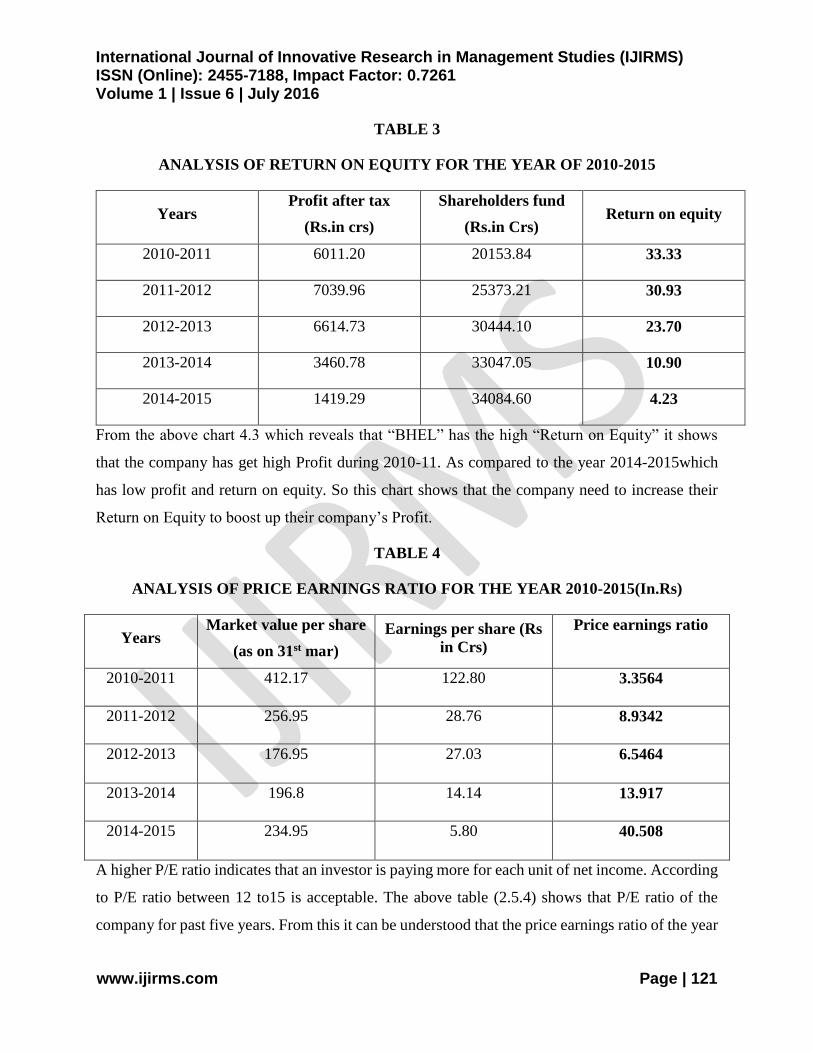
TABLE 3
ANALYSIS OF RETURN ON EQUITY FOR THE YEAR OF 2010-2015
Years Profit after tax
(Rs.in crs)
Shareholders fund
(Rs.in Crs) Return on equity
2010-2011 6011.20 20153.84 33.33
2011-2012 7039.96 25373.21 30.93
2012-2013 6614.73 30444.10 23.70
2013-2014 3460.78 33047.05 10.90
2014-2015 1419.29 34084.60 4.23
From the above chart 4.3 which reveals that “BHEL” has the high “Return on Equity” it shows
that the company has get high Profit during 2010-11. As compared to the year 2014-2015which
has low profit and return on equity. So this chart shows that the company need to increase their
Return on Equity to boost up their company’s Profit.
TABLE 4
ANALYSIS OF PRICE EARNINGS RATIO FOR THE YEAR 2010-2015(In.Rs)
Years Market value per share
(as on 31st mar)
Earnings per share (Rs
in Crs)
Price earnings ratio
2010-2011 412.17 122.80 3.3564
2011-2012 256.95 28.76 8.9342
2012-2013 176.95 27.03 6.5464
2013-2014 196.8 14.14 13.917
2014-2015 234.95 5.80 40.508
A higher P/E ratio indicates that an investor is paying more for each unit of net income. According
to P/E ratio between 12 to15 is acceptable. The above table (2.5.4) shows that P/E ratio of the
company for past five years. From this it can be understood that the price earnings ratio of the year

International Journal of Innovative Research in Management Studies (IJIRMS) ISSN (Online): 2455-7188, Impact Factor: 0.7261 Volume 1 | Issue 6 | July 2016
www.ijirms.com Page | 122
2014-2015(40.508) is the maximum and the year of 2010-2011 (3.35) is the minimum. So P/E
ratio of BHEL from the year 2013-14 (13.917) is acceptable.
TABLE 5
ANALYSIS OF PRICE TO SALES RATIO FOR THE YEAR OF 2010-2015(in Rs)
Years Stock price
(as on 31st Mar)
Sales price
(Yearly closing
price)
Price to sales ratio
2010-2011 412.17 239 1.724
2011-2012 256.95 228.4 1.125
2012-2013 176.95 176.45 1.002
2013-2014 196.8 265.2 0.742
2014-2015 234.95 169.25 1.388
From the above chart PSR reveals that BHEL has the better investment during the year of 2010-
11, whereas they have very low investment during the year of 2013-14. As like the rest of year
also needs to reduce their PSR. They have to quote the lowest price for its better investment. So
for that purpose they need to increase the sales then the company may boost up their sales.
TABLE 6
ANALYSIS OF PRICE TO BOOK RATIO FOR THE YEAR OF 2010-2015 (in Rs.)
Years Share price Book value per
share Price to book ratio
2010-2011 412.17 411.71 1.002
2011-2012 256.95 103.67 2.478
2012-2013 176.95 124.38 1.422
2013-2014 196.8 135.01 1.462
2014-2015 234.95 139.26 1.687
International Journal of Innovative Research in Management Studies (IJIRMS) ISSN (Online): 2455-7188, Impact Factor: 0.7261 Volume 1 | Issue 6 | July 2016
www.ijirms.com Page | 123
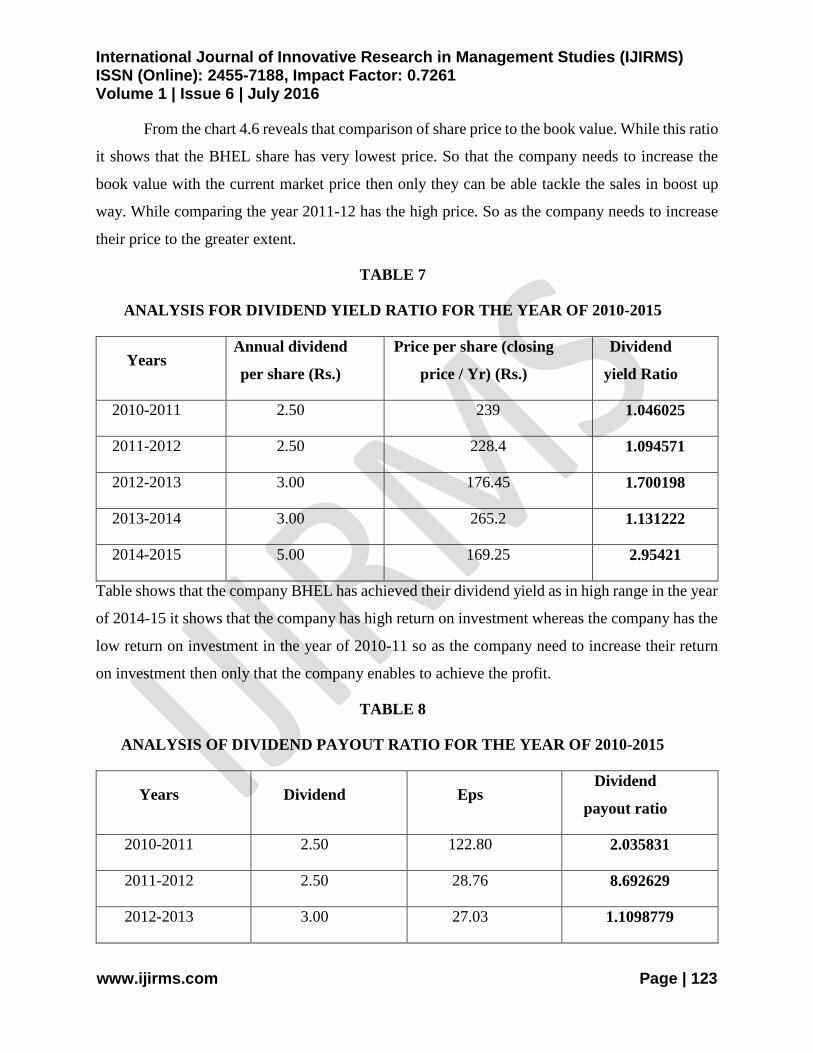
From the chart 4.6 reveals that comparison of share price to the book value. While this ratio
it shows that the BHEL share has very lowest price. So that the company needs to increase the
book value with the current market price then only they can be able tackle the sales in boost up
way. While comparing the year 2011-12 has the high price. So as the company needs to increase
their price to the greater extent.
TABLE 7
ANALYSIS FOR DIVIDEND YIELD RATIO FOR THE YEAR OF 2010-2015
Years Annual dividend
per share (Rs.)
Price per share (closing
price / Yr) (Rs.)
Dividend
yield Ratio
2010-2011 2.50 239 1.046025
2011-2012 2.50 228.4 1.094571
2012-2013 3.00 176.45 1.700198
2013-2014 3.00 265.2 1.131222
2014-2015 5.00 169.25 2.95421
Table shows that the company BHEL has achieved their dividend yield as in high range in the year
of 2014-15 it shows that the company has high return on investment whereas the company has the
low return on investment in the year of 2010-11 so as the company need to increase their return
on investment then only that the company enables to achieve the profit.
TABLE 8
ANALYSIS OF DIVIDEND PAYOUT RATIO FOR THE YEAR OF 2010-2015
Years Dividend Eps Dividend
payout ratio
2010-2011 2.50 122.80 2.035831
2011-2012 2.50 28.76 8.692629
2012-2013 3.00 27.03 1.1098779
International Journal of Innovative Research in Management Studies (IJIRMS) ISSN (Online): 2455-7188, Impact Factor: 0.7261 Volume 1 | Issue 6 | July 2016
www.ijirms.com Page | 124
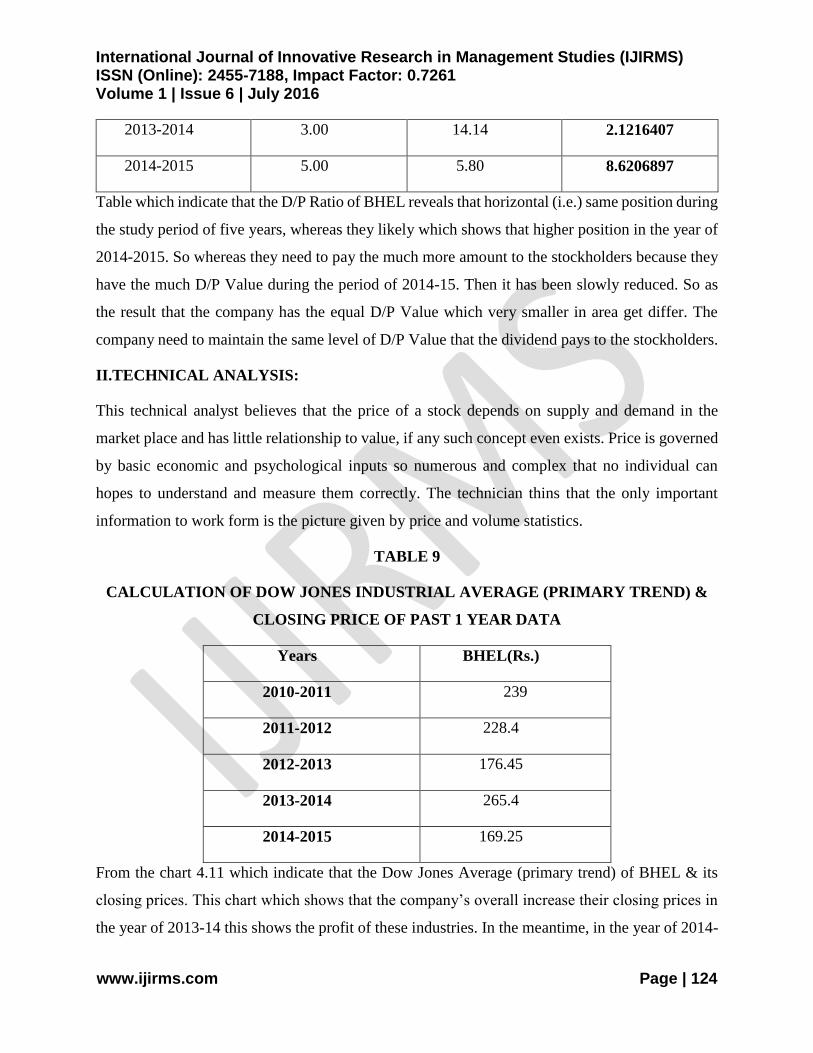
2013-2014 3.00 14.14 2.1216407
2014-2015 5.00 5.80 8.6206897
Table which indicate that the D/P Ratio of BHEL reveals that horizontal (i.e.) same position during
the study period of five years, whereas they likely which shows that higher position in the year of
2014-2015. So whereas they need to pay the much more amount to the stockholders because they
have the much D/P Value during the period of 2014-15. Then it has been slowly reduced. So as
the result that the company has the equal D/P Value which very smaller in area get differ. The
company need to maintain the same level of D/P Value that the dividend pays to the stockholders.
II.TECHNICAL ANALYSIS:
This technical analyst believes that the price of a stock depends on supply and demand in the
market place and has little relationship to value, if any such concept even exists. Price is governed
by basic economic and psychological inputs so numerous and complex that no individual can
hopes to understand and measure them correctly. The technician thins that the only important
information to work form is the picture given by price and volume statistics.
TABLE 9
CALCULATION OF DOW JONES INDUSTRIAL AVERAGE (PRIMARY TREND) &
CLOSING PRICE OF PAST 1 YEAR DATA
Years BHEL(Rs.)
2010-2011 239
2011-2012 228.4
2012-2013 176.45
2013-2014 265.4
2014-2015 169.25
From the chart 4.11 which indicate that the Dow Jones Average (primary trend) of BHEL & its
closing prices. This chart which shows that the company’s overall increase their closing prices in
the year of 2013-14 this shows the profit of these industries. In the meantime, in the year of 2014-

International Journal of Innovative Research in Management Studies (IJIRMS) ISSN (Online): 2455-7188, Impact Factor: 0.7261 Volume 1 | Issue 6 | July 2016
www.ijirms.com Page | 125
15 it shows very less price. So as the primary trend of the closing share will not move up and it is
not moves down. It is fluctuated in its share price.
FIGURE 1
GRAPH FOR CALCULATION DOW JONES INDUSTRIAL AVERAGE
(PRIMARY TREND) & ITS CLOSING PRICE OF 1 YEAR DATA
BOLLINGER BANDS:
Bollinger Bands Technical Indicator (BB) is similar to Envelopes. The only difference is that the
bands of Envelopes are plotted a fixed distance (%) away from the moving average, while the
Bollinger Bands are plotted a certain number of standard deviations away from it. Standard
deviation is a measure of volatility; therefore, Bollinger Bands adjust themselves to the market
conditions. When the markets become more volatile, the bands widen and they contract during less
volatile periods. Bollinger Bands are usually plotted on the price chart, but they can be also added
to the indicator chart (Custom Indicators).
The following traits are particular to the Bollinger Band:
1. Abrupt changes in prices tend to happen after the band has contracted due to decrease of
volatility.
2. If prices break through the upper band, a continuation of the current trend is to be expected.
3. If the pikes and hollows outside the band are followed by pikes and hollows inside the
band, a reverse of trend may occur is useful for forecasting price guideposts.
239 228.4176.45
265.4
169.25
2010-2011 2011-2012 2012-2013 2013-2014 2014-2015
Dowjones Industrial Average(primary Trend)
BHEL(Rs.)

International Journal of Innovative Research in Management Studies (IJIRMS) ISSN (Online): 2455-7188, Impact Factor: 0.7261 Volume 1 | Issue 6 | July 2016
www.ijirms.com Page | 126
4. The price movement that has started from one of the band’s lines usually reaches the
opposite one. The last observation
Developed by John Bollinger, Bollinger Bands are volatility bands placed above and below a
moving average. Volatility is based on the standard deviation, which changes a volatility increase
and decreases. The bands automatically widen when volatility increases and narrow when
volatility decreases. This dynamic nature of Bollinger Bands also means they can be used on
different securities with the standard settings. For signals, Bollinger Bands can be used to identify
M-Tops and W-Bottoms or to determine the strength of the trend.
SHARP CHARTS CALCULATION:
1. * Middle Band = 20-day simple moving average (SMA)
2. * Upper Band = 20-day SMA + (20-day standard deviation of price x 2)
3. * Lower Band = 20-day SMA - (20-day standard deviation of price x 2
In the graph of Bollinger Bands of BHEL reveals that bandwidth of company is high in their
position and becomes volatile in their period but this bandwidth may adjust the position based on
the volatile in their market. In the date of Oct15 to Dec 15 it becomes high volatile in the market.
Then the company has somewhat same in their position it has been slightly changed in the market.
By comparing the year of 2015-16 the bandwidth is decreasing in the market. So as they need to
increase their bandwidth to make the market without any volatility.
FIGURE 2
ANALYSIS OF BOLLINGER BANDWIDTH OF BHEL BY USING THREE BANDS
0
50
100
150
200
250
Bollingers Band
Period Upper Band Middle Band Lower Band

International Journal of Innovative Research in Management Studies (IJIRMS) ISSN (Online): 2455-7188, Impact Factor: 0.7261 Volume 1 | Issue 6 | July 2016
www.ijirms.com Page | 127
RELATIVE STRENGTH INDEX:
The Relative Strength Index (RSI) is a technical indicator used in the analysis of financial
markets. It is intended to chart the current and historical strength or weakness of a stock or market
based on the closing prices of a recent trading period. The indicator should not be confused with
relative strength.
The chart below shows how the RSI can generate easy to follow buy and sell signals
FIGURE 3
CALCULATION:
100
RSI = 100 - _________
1 + RS
RS = Average Gain / Average Loss
To simplify the calculation explanation, RSI has been broken down into its basic components: RS,
Average Gain and Average Loss. This RSI calculation is based on 14 periods, which is the default
suggested by Wilder in his book. Losses are expressed as positive values, not negative values.
The very first calculations for average gain and average loss are simple 14 period averages.
First Average Gain = Sum of Gains over the past 10 periods / 10.
International Journal of Innovative Research in Management Studies (IJIRMS) ISSN (Online): 2455-7188, Impact Factor: 0.7261 Volume 1 | Issue 6 | July 2016
www.ijirms.com Page | 128
First Average Loss = Sum of Losses over the past 10 periods / 10.
The second, and subsequent, calculations are based on the prior averages and the current gain loss:
Average Gain = [(previous Average Gain) x 9 + current Gain] / 10.
Average Loss = [(previous Average Loss) x 9 + current Loss] / 10.
Taking the prior value plus the current value is a smoothing technique similar to that used in
exponential moving average calculation. This also means that RSI values become more accurate
as the calculation period extends. Sharp Charts uses at least 250 data points prior to the starting
date of any chart (assuming that much data exists) when calculating its RSI values.
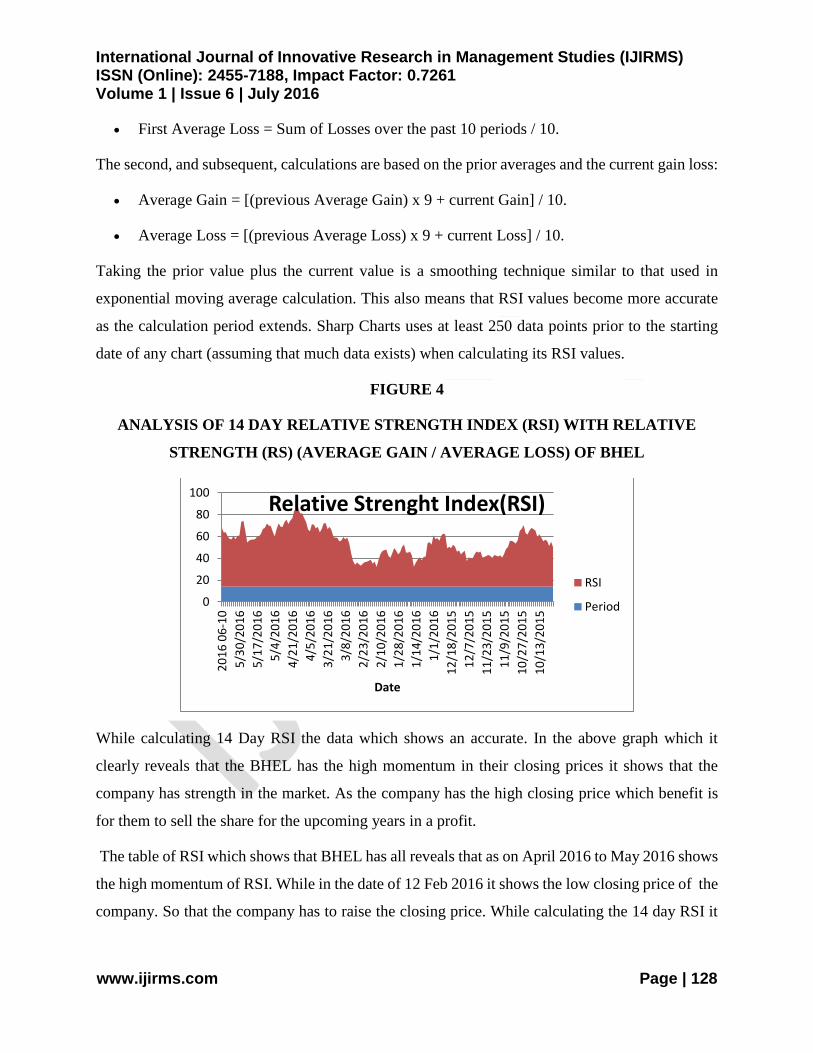
FIGURE 4
ANALYSIS OF 14 DAY RELATIVE STRENGTH INDEX (RSI) WITH RELATIVE
STRENGTH (RS) (AVERAGE GAIN / AVERAGE LOSS) OF BHEL
While calculating 14 Day RSI the data which shows an accurate. In the above graph which it
clearly reveals that the BHEL has the high momentum in their closing prices it shows that the
company has strength in the market. As the company has the high closing price which benefit is
for them to sell the share for the upcoming years in a profit.
The table of RSI which shows that BHEL has all reveals that as on April 2016 to May 2016 shows
the high momentum of RSI. While in the date of 12 Feb 2016 it shows the low closing price of the
company. So that the company has to raise the closing price. While calculating the 14 day RSI it
0
20
40
60
80
100
20
16
06
-10
5/3
0/2
01
6
5/1
7/2
01
6
5/4
/20
16
4/2
1/2
01
6
4/5
/20
16
3/2
1/2
01
6
3/8
/20
16
2/2
3/2
01
6
2/1
0/2
01
6
1/2
8/2
01
6
1/1
4/2
01
6
1/1
/20
16
12
/18
/20
15
12
/7/2
01
5
11
/23
/20
15
11
/9/2
01
5
10
/27
/20
15
10
/13
/20
15
Date
Relative Strenght Index(RSI)
RSI
Period

International Journal of Innovative Research in Management Studies (IJIRMS) ISSN (Online): 2455-7188, Impact Factor: 0.7261 Volume 1 | Issue 6 | July 2016
www.ijirms.com Page | 129
shows the accurate data as the company where it is positioned and it shows the strength and
weakness of the company.
MOVING AVERAGE CONVERGENT AND DIVERGENT:
Developed by Gerald Appel in the late seventies, the Moving Average Convergence-Divergence
(MACD) indicator is one of the simplest and most effective momentum indicators available. The
MACD turns two trend-following indicators, moving averages, into a momentum oscillator by
subtracting the longer moving average rom the shorter moving average. As a result, the MACD
offers the best of both worlds: trend following and momentum. The MACD fluctuates above and
below the zero line as the moving averages converge, cross and diverge. Traders can look for
signal line crossovers, centerline crossovers and divergences to generate signals. Because the
MACD is unbounded, it is not particularly useful for identifying overbought and oversold levels.
MACD (moving average convergence/divergence) is a technical analysis indicator. The MACD
"oscillator" or "indicator" is a collection of three signals (or computed data-series), calculated from
historical price data, most often the closing price. These three signal lines are: the MACD line, the
signal line (or average line), and the difference (or divergence). The term "MACD" may be used
to refer to the indicator as a whole, or specifically to the MACD line itself. The first line, called
the "MACD line", equals the difference between a "fast" (short period) exponential moving
average (EMA), and a "slow" (longer period) EMA. The MACD line is charted over time, along
with an EMA of the MACD line, termed the "signal line" or "average line". The difference (or
divergence) between the MACD line and the signal line is shown as a bar graph or histogram time
series.
FIGURE 5
BUY AND SELL SIGNALS

International Journal of Innovative Research in Management Studies (IJIRMS) ISSN (Online): 2455-7188, Impact Factor: 0.7261 Volume 1 | Issue 6 | July 2016
www.ijirms.com Page | 130
FIGURE 6
MACD HISTOGRAM
CALCULATION:
MACD Line: (12-day EMA - 26-day EMA)
Signal Line: 9-day EMA of MACD Line
MACD Histogram: MACD Line - Signal Line
FIGURE 7
COMPARISON OF MOVING AVERAGE CONVERGENT AND DIVERGENT LINES
OF MACD, EMA AND MACD HISTOGRAM OF BHEL
The graph above shows a stock with a MACD indicator underneath it. The MACD evaluation will
be high in BHEL. Whereas the MACD signal line will be high in the company (9 DAY EMA).
MACD Histogram of BHEL doesn’t shows up to their level because it show the very low value of
-20
-10
0
10
Moving Average Convergent Divergent(MACD)
MACD(26,12)
EMA(9)
MACD Histogram

International Journal of Innovative Research in Management Studies (IJIRMS) ISSN (Online): 2455-7188, Impact Factor: 0.7261 Volume 1 | Issue 6 | July 2016
www.ijirms.com Page | 131
0.00677 so when they increase the MACD line and Signal line then MACD histogram will finally
get increased.
The period for the moving averages on which an MACD is based can vary, but the most commonly
used parameters involve a faster EMA of 12 days, a slower EMA of 26 days, and the signal line
as a 9 day EMA of the difference between the two. It is written in the form, MACD (faster, slower,
and signal) or in this case, MACD (12, 26, and 9).
Exponential moving averages highlight recent changes in a stock's price. By comparing EMAs of
different lengths, the MACD line gauges’ changes in the trend of a stock. By then comparing
differences in the change of that line to an average, an analyst can identify subtle shifts in the
strength and direction of a stock's trend.
FINDINGS
The data for the calculation is limited to five years only (i.e.) 2010-2015.The data which is
calculated as both the “Fundamental and Technical tools” are accurate.
Fundamental Analysis
According to Earnings per share of the year 2010-2011 (122.80) is the maximum and the
year 2014-2015 (5.80) is the minimum.
“Return on Equity” during the year of 2010-11 it shows that the company has get high
Profit while it issuing their shares to shareholders.
According to CAGR in sales will be high in the year of 2014-2015, obviously while
comparing to the year 2010-2011.
According to Dividend Yield Ratio found that BHEL stock is highly volatile and currently
it shows a decreasing trend.
According to Dividend Payout shows that the amount of dividend which is paid to their
shareholders will get decrease as 2.50 in the year of 2010-11 as compared to the year of
2014-15. So the company of BHEL wants to raise the dividend.
International Journal of Innovative Research in Management Studies (IJIRMS) ISSN (Online): 2455-7188, Impact Factor: 0.7261 Volume 1 | Issue 6 | July 2016
www.ijirms.com Page | 132
Technical analysis
The Dow Jones Average (primary trend) of BHEL & its overall increase their closing
prices in the year of 2013-14 this shows the profit& in the year of 2014-15 it shows very
less price.
The Dow Jones Average (Intermediate Trend) in the year of 2010-11 of intermediate
trend reveals that the BHEL high range of closing price in its share.In the addition to that
the year of 2010 quarter the industry has occupied in its position, they where increase in
closing price.
The Relative Strength Index is calculated for 14 Day to show the accurate data of RSI
and to reveal the volatility of RSI of BHEL.
The Bollinger Bands which is the new technical analysis used in the technical tools it
shows that the bandwidth of the company of deducting Upper Band with the Lower Band
and Middle Band. It is calculated by the help of “Standard Deviation”.
SUGGESTIONS AND RECOMMENDATIONS
Based on the Findings observed from the analysis the following suggestions are offered,
The company stock was highly volatile in the last 5 years and the stock price was moving
up and down based on the industry fluctuation.
In the current year it showed a positive trend moving up the ladder which is a good sign
for the company.
To keep it as the company must try to improve the financial performance which will
improve the company's performance as a whole.
By plotting a technical chart of moving average shows that the company wants to raise the
sales position by providing the credit sales to reliable customers.
So the stock is an idle one and the investors are very rational. The investors are very much
interested in knowing the company's performance which forces the company to perform
well.
The company’s current profit are lower than the past years.
International Journal of Innovative Research in Management Studies (IJIRMS) ISSN (Online): 2455-7188, Impact Factor: 0.7261 Volume 1 | Issue 6 | July 2016
www.ijirms.com Page | 133
Taking in to the view of company’s volatility we can suggest that the company’s share
price movement is not satisfactory and the management should try to change in the future.
By applying the technical analysis, it is found that we can buy the company's stock as a
Speculator and also as an investor.
While calculating the technical analysis the closing price of BHEL is so as the company
has to raise the closing price to achieve the profit in the business.
CONCLUSION
From the study on “Stock Performance Analysis with Special Reference to BHEL” we can
conclude that the company's general performance is good and the company has maintain their
capital in the past five years. In the year of 2010-11 the dividend gives 50% of the Net profit. So
the stock became highly volatile due this reason. So as the company of BHEL has needed to
increase the sales.
When the company has increase their sales then it should become boom in the market at the same
time if any financial constraints occur they be able to bear when the sales reach up to the level. As
the company of BHEL has low closing price and also price become volatile in the market. So the
company needs to reduce their volatility to rear strength in the market.
Even though public knows the information the stock price has slightly increase in the year of 2010-
11, but in recent years the share price of BHEL is under decline condition. So the company has to
concentrate on its improvisation. So to conclude the company uses the suggestions given by the
researches and try to implement those suggestions will improve the performance of the company.
REFERENCES
Dr. S. N. MAHESWARI - Financial Management Principles and practice - Sultan Chand
& sons, New Delhi.
V. K. BALLA - Investment Management (SAPM) - S. Chand and Company Limited, New
Delhi.
DONALD E. FISCHER AND RONALD J. JORDAN - Security Analysis and Portfolio
Management - Prentice Hall of India Private Limited.

International Journal of Innovative Research in Management Studies (IJIRMS) ISSN (Online): 2455-7188, Impact Factor: 0.7261 Volume 1 | Issue 6 | July 2016
www.ijirms.com Page | 134
WEBSITE
www.bhel.com
www.bse.com
www.moneycontrol.com
www.yahoofinance.com
www.stockcharts.com
www.marketvolume.com
*****