A Study on Parametric Appraisal of Fused Deposition...
146
A Study on Parametric Appraisal of Fused Deposition Modelling (FDM) Process Dissertation submitted to the National Institute of Technology Rourkela In partial fulfilment of the requirements for the degree of Doctor of Philosophy in Mechanical Engineering by Swayam Bikash Mishra Roll Number. 512ME111 Under the supervision of Prof. Siba Sankar Mahapatra January, 2016 Department of Mechanical Engineering National Institute of Technology Rourkela
-
Upload
vuongxuyen -
Category
Documents
-
view
243 -
download
8
Transcript of A Study on Parametric Appraisal of Fused Deposition...
A Study on Parametric Appraisal of Fused
Deposition Modelling (FDM) Process
Dissertation submitted to the
National Institute of Technology Rourkela
In partial fulfilment of the requirements
for the degree of
Doctor of Philosophy
in
Mechanical Engineering
by
Swayam Bikash Mishra
Roll Number. 512ME111
Under the supervision of
Prof. Siba Sankar Mahapatra
January, 2016
Department of Mechanical Engineering
National Institute of Technology Rourkela
Mechanical Engineering Department
National Institute of Technology Rourkela
January 29, 2016
Certificate of Examination
Roll Number: 512ME111
Name: Swayam Bikash Mishra
Title: A Study on Parametric Appraisal of Fused Deposition Modelling (FDM) Process
We the below signed, after checking the dissertation mentioned above and the official
record book (s) of the student, hereby state our approval of the dissertation submitted in
partial fulfilment of the requirements for the degree of Doctor of Philosophy in Mechanical
Engineering at National Institute of Technology Rourkela. We are satisfied with the volume,
quality, correctness, and originality of the work.
Siba Sankar Mahapatra
Principal Supervisor
Raj Kishore Patel
Member, DSC
Anindya Basu
Member, DSC
Subrata Kumar Panda,
Member, DSC
Examiner
Ranjit Kumar Sahoo
Chairman (DSC)

Mechanical Engineering Department
National Institute of Technology Rourkela
Dr. Siba Sankar Mahapatra
Professor
January 29, 2016
Supervisor's Certificate
This is to certify that the work presented in this dissertation entitled “A Study on Parametric
Appraisal of Fused Deposition Modelling (FDM) Process” by ''Swayam Bikash Mishra'',
Roll Number 512ME111, is a record of original research carried out by him/her under my
supervision and guidance in partial fulfilment for the requirements of the degree of Doctor
of Philosophy in Department of Mechanical Engineering. Neither this dissertation nor any
part of it has been submitted for any degree or diploma to any institute or university in India
or abroad.
Siba Sankar Mahapatra

This thesis is dedicated to lord Jagannath, my
teachers, my parents and all who have inspired me.

Declaration of Originality
I, Swayam Bikash Mishra, Roll Number 512ME111 hereby declare that this dissertation
entitled “A Study on Parametric Appraisal of Fused Deposition Modelling (FDM) Process”
represents my original work carried out as a doctoral student of NIT Rourkela and, to the
best of my knowledge, it contains no material previously published or written by another
person, nor any material presented for the award of any other degree or diploma of NIT
Rourkela or any other institution. Any contribution made to this research by others, with
whom I have worked at NIT Rourkela or elsewhere, is explicitly acknowledged in the
dissertation. Works of other authors cited in this dissertation have been duly acknowledged
under the section ''Bibliography''. I have also submitted my original research records to the
scrutiny committee for evaluation of my dissertation. I am fully aware that in case of any
non-compliance detected in future, the Senate of NIT Rourkela may withdraw the degree
awarded to me on the basis of the present dissertation.
January 29, 2016
NIT Rourkela
Swayam Bikash Mishra

Acknowledgement
While bringing out this thesis to its final form, I came across a number of people whose
contributions in various ways helped my field of research and they deserve special thanks.
It is a pleasure to convey my gratitude to all of them.
I would like to express my sincere gratitude to all of them. First of all, I would like to
express my deep sense of gratitude and indebtedness to my supervisors Prof. S. S.
Mahapatra for his valuable guidance, suggestions, support, scholarly inputs and
invaluable encouragement throughout the research work that instil confidence in me during
research and writing of this thesis.
Besides my supervisors, I would like to thank the rest of my doctoral scrutiny
committee (DSC) members: Prof. R. K. Sahoo, Chairman (DSC Member), Prof. R. K.
Patel, Prof. S. K. Panda and Prof. A. Basu for their encouragement and insightful
comments.
I am highly grateful to Prof. S. K. Sarangi, Director, National Institute of Technology
(NIT) for the academic support and the facilities provided to carry out the research work at
the Institute.
I also express my thankfulness to the faculty and staff members of the Department of
Mechanical Engineering, for their continuous encouragement and suggestions. Among
them, Dr. S. Datta and Sri P. K. Pal deserve special thanks for their kind cooperation in
academic and non-academic matters during the research work
I am obliged to, Chinmaya Prasad Mohanty, Sanjita Jaipuria, Suman Chatterjee,
Rameez Malik, Mantra Prasad Satpathy, Ashutosh Pattanaik, Alok Ranjan Biswal,
P.T.R. Swain and Swastik Pradhan for their support and co-operation that is difficult to
express in words. The time spent with them will remain in my memory for years to come.
I owe a lot to my parents, Mr. Golak Bihari Mishra (Father) and Mrs. Saudamini
Devi (Mother), who encouraged and helped me at every stage of my personal and
academic life, and longed to see this achievement come true.
I am very much indebted to my brother Mr. Swayam Prakash Mishra for his
understanding, patience, co-operation and support in every possible way to see the
completion of this doctoral work.
Above all, I owe it to almighty Lord Jagannath for granting me the wisdom,
health and strength to undertake this research task and enabling me to its
completion.
Abstract
The manufacturing industries are contemplating to develop new technologies for
production of complex end use parts possessing high strength and low product
development cycle in order to meet the global competition. Rapid prototyping (RP) is one
of the proficient processes having the ability to build complex geometry parts in reasonably
less time and material waste. Fused deposition modelling (FDM) is one of the RP
processes that can manufacture 3D complex geometry accurately with good mechanical
strength and durability. Normally, the FDM process is a parametric dependant process due
to its layer-by-layer build mechanism. As FDM build parts are used as end use parts, it is
prudent to study the effect of process parameters on the mechanical strength under both
static and dynamic loading conditions and wear (sliding) behaviour. In order to investigate
the behaviour of build parts in a systematic manner with less number of experimental runs,
design of experiment (DOE) approach has been used to save cost and time of
experimentation. As the selection of input process parameters influence on build
mechanism, the mechanical properties and wear behaviour of FDM build parts change
with process parameters. Notably, the raster fill pattern during part building causes FDM
build parts to exhibit anisotropic behaviour when subject to loading (static or dynamic). In
this research work, an attempt has been made to minimise the anisotropic behaviour
through controlling the raster fill pattern during part building by adequate selection of
process parameters. Statistical significance of the process parameters is analysed using
analysis of variance (ANOVA). Influence of process parameters on performance
characteristics like mechanical strength, fatigue life and wear of build part is analysed with
the help of surface plots. Internal structure of rasters, failure of rasters, formation of pits
and crack are evaluated using scanning electron machine (SEM) micro-graphs. Empirical
models have been proposed to relate the performance characteristics with process
parameters. Optimal parameter setting has been suggested using a nature inspired
metaheuristic firefly algorithm to improve the mechanical strength. Finally, genetic
programming (GP) and least square support vector machine (LS-SVM) are adopted to
develop predictive models for various performance characteristics
Key words: Rapid prototyping; Fused deposition modelling; Analysis of variance;
Genetic programming; least square support vector machine.
viii
Contents
Certificate of Examination ................................................................................................... ii
Supervisor's Certificate ....................................................................................................... iii
Declaration of Originality .................................................................................................... v
Acknowledgement .............................................................................................................. vi
Abstract .............................................................................................................................. vii
Contents ............................................................................................................................ viii
List of Figures ..................................................................................................................... xi
List of Tables .................................................................................................................... xiii
Glossary of terms .............................................................................................................. xiv
.............................................................................................................................. 1
Background and Motivations ............................................................................................... 1
Introduction ................................................................................................ 1
Rapid Prototyping process ......................................................................... 2
1.2.1. Stereolithography (SL) ........................................................................ 4
1.2.2. Selective Laser Sintering (SLS) .......................................................... 4
1.2.3. Laminated Object Manufacturing (LOM) ............................................. 4
1.2.4. Fused Deposition Modelling (FDM) ..................................................... 5
1.2.5. Three Dimensional Printing (3DP)....................................................... 5
1.2.6. Multi Jet Modelling (MJM) ................................................................... 5
1.2.7. Solid Ground Curing (SGC) ................................................................ 6
Need for the research ................................................................................ 6
Research objectives ................................................................................... 7
Outline of the thesis ................................................................................... 8
Conclusion ................................................................................................. 9
............................................................................................................................ 10
Literature Review .............................................................................................................. 10
2.1. Introduction ...............................................................................................10

ix
2.2. Application of RP ......................................................................................13
2.3. RP process selection ................................................................................14
2.4. RP material issue ......................................................................................16
2.5. Assessment of strength of RP build parts .................................................18
2.6. Assessment of fatigue life of RP build parts ..............................................21
2.7. Wear characteristics of RP build parts ......................................................22
2.8. Discussion on RP issues ..........................................................................23
2.9. Conclusion ................................................................................................23
............................................................................................................................ 25
Parametric assessment of static strength of FDM build parts............................................ 25
3.1. Introduction ...............................................................................................25
3.2. Fuzzy Inference Systems ..........................................................................26
3.2.1. Fuzzifier .............................................................................................27
3.2.2. Knowledge base ................................................................................27
3.2.3. Inference engine ................................................................................27
3.2.4. Defuzzifier ..........................................................................................27
3.3. Firefly Algorithm ........................................................................................28
3.4. Genetic programming ...............................................................................30
3.5. Least Square Support Vector Machine .....................................................32
3.6. Experimental Details .................................................................................33
3.7. Results and Discussion .............................................................................40
3.8. Conclusion ................................................................................................66
............................................................................................................................ 69
Parametric assessment of fatigue life of FDM build parts ................................................ 69
4.1. Introduction ...............................................................................................69
4.2. Experimental plan .....................................................................................70
4.3. Results and Discussions ...........................................................................76
4.4. Conclusion ................................................................................................92
x
............................................................................................................................ 93
Parametric assessment of wear behaviour of FDM build parts ......................................... 93
5.1. Introduction ...............................................................................................93
5.2. Experimental Details .................................................................................94
5.3. Results and Discussions ...........................................................................96
5.4. Conclusion .............................................................................................. 107
.......................................................................................................................... 108
Executive Summary and Conclusion ............................................................................... 108
6.1. Introduction ............................................................................................. 108
6.2. Summary of findings ............................................................................... 108
6.3. Contribution of the research work ........................................................... 110
6.4. Limitation of the study ............................................................................. 111
6.5. Scope for future work .............................................................................. 111
Bibliography .................................................................................................................... 113
Dissemination .................................................................................................................. 124
Vitae ................................................................................................................................. 126
xi
List of Figures
Figure 1.1. Main process stage to common RP process ................................................. 3
Figure 2.1 Research issues in RP ..................................................................................12
Figure 2.2. Percentage of Paper Surveyed ....................................................................12
Figure 3.1. Structure of fuzzy inference system ..............................................................28
Figure 3.2. GP tree representation of a symbolic expression: 9tan(x) +5y ......................31
Figure 3.3. Sub-tree crossover between parents ............................................................31
Figure 3.4. Overlaying raster orientation style ................................................................35
Figure 3.5. ASTM D638 standard test specimen for tensile test .....................................37
Figure 3.6. ASTM D695 standard specimen for compressive test ..................................37
Figure 3.7. standard test method for flexural properties of plastics .................................37
Figure 3.8. ASTM D256 standard specimen for izod test ...............................................37
Figure 3.9. Instron 1195 series IX automated material testing machine .........................38
Figure 3.10 FDM Fortus 400mc series ...........................................................................38
Figure 3.11. Monomers in acrylonitrile butadiene styrene (ABS) plastic .........................39
Figure 3.12. Normal probability plot of residual at 95% confidence interval for tensile
strength ........................................................................................................44
Figure 3.13. Surface plot for tensile strength ..................................................................46
Figure 3.14. SEM image of part showing raster failure ...................................................47
Figure 3.15. SEM image of overlaying raster orientation ................................................47
Figure 3.16. Stress strain curve for tensile strength .......................................................48
Figure 3.17. Normal probability plot of residual at 95% confidence interval for
compressive strength ................................................................................49
Figure 3.18. Surface plots for compressive strength ......................................................51
Figure 3.19. Normal probability plot of residual at 95% confidence interval for Flexural
strength .....................................................................................................52
Figure 3.20. Surface plots for flexural strength ...............................................................54
Figure 3.21. Stress strain curve for flexural strength ......................................................55
Figure 3.22. Normal probability plot of residual at 95% confidence interval for impact
strength .....................................................................................................56
Figure 3.23. Surface plots for flexural strength ...............................................................58
Figure 3.24. Membership function for each normalised response ..................................59
Figure 3.25. Membership function for MPCI ...................................................................59
xii
Figure 3.26. Normal distribution of residuals at 95% confidence interval for MPCI .........62
Figure 3.27. Diagram of GP formulation of fatigue life of FDM built parts .......................63
Figure 3.28. Relative errors comparison between GP and LS-SVM models for static
strength .....................................................................................................66
Figure 4.1. ASTM standard specimen for strain controlled fatigue test ...........................74
Figure 4.2. BISS machine (Bangalore Integrated System Solutions) ..............................75
Figure 4.3. Failure of FDM build parts under static loading ............................................78
Figure 4.4 Failure of FDM build parts under dynamic loading .........................................78
Figure 4.5. Strain amplitude vs fatigue life curve for strain controlled fatigue test (ɛ -Nf)
for run order 18 ............................................................................................79
Figure 4.6. Strain amplitude vs fatigue life curve for strain controlled fatigue test (ɛ -Nf)
for run order 23 ............................................................................................80
Figure 4.7. Stress strain-curve for fatigue test for run order 18 .......................................81
Figure 4.8. Stress strain-curve for fatigue test for run order 23 .......................................81
Figure 4.9 Normal probability plot of residual at 95% confidence interval for fatigue life .83
Figure 4.10 Surface plots for fatigue life .........................................................................85
Figure 4.11. Raster failure during static loading .............................................................86
Figure 4.12 Raster failure in zig-zag manner during cyclic loading .................................86
Figure 4.13 Rupture of adhesive bond during cyclic loading...........................................87
Figure 4.14 Crack formation during cyclic loading ..........................................................87
Figure 4.15. Diagram of GP formulation of Wear of FDM built parts ...............................88
Figure 4.16. Relative errors comparison between GP and LS-SVM models for
fatigue life ..................................................................................................91
Figure 5.1 ASTM standard specimen for wear test (all dimensions are in mm) ..............95
Figure 5.2. Pin on disk wear testing machine .................................................................96
Figure 5.3. Response surface plots for wear ................................................................ 100
Figure 5.4. SEM plots of the FDM specimen after wear testing .................................... 101
Figure 5.5. Wear volume with sliding distance ............................................................. 102
Figure 5.6. Friction coefficient with sliding distance ...................................................... 102
Figure 5.7. Diagram of GP formulation of wear of FDM built parts................................ 103
Figure 5.8. Relative errors comparison between LS-SVM and GP models for
wear behaviour .......................................................................................... 106
xiii
List of Tables
Table 2.1 Materials in rapid prototyping processes (Sood, 2011) ...................................16
Table 3.1.Factors and their levels ..................................................................................36
Table 3.2. Experimental results ......................................................................................40
Table 3.3. Effect of contour number on tensile strength of FDM parts ............................42
Table 3.4. Effect of delta angle on tensile strength .........................................................43
Table 3.5. ANOVA table for tensile strength ...................................................................44
Table 3.6. ANOVA table for compressive strength .........................................................49
Table 3.7. ANOVA table for flexural strength ..................................................................53
Table 3.8. ANOVA table for Impact Strength .................................................................56
Table 3.9. Individual normalised values of responses with MPCI value ..........................59
Table 3.10. Optimum parameter setting to achieve the best MPCI .................................61
Table 3.11. Parameter setting for genetic programming .................................................63
Table 3.12. Relative error (%) of the GP model and LS-SVM Model ..............................64
Table 3.13. Comparison of strength of injection moulded parts with FDM parts .............67
Table 3.14. Comparison of results of present study with previous research work ...........67
Table 4.1. Experimental results ......................................................................................76
Table 4.2. ANOVA for fatigue life ...................................................................................83
Table 4.3. Optimum parameter setting to achieve the best fatigue life ...........................88
Table 4.4. Parameter setting for genetic programming ...................................................89
Table 4.5. Relative error (%) of the GP model and LS-SVM Model ................................90
Table 5.1. Experimental results ......................................................................................96
Table 5.2. ANOVA table for wear ...................................................................................98
Table 5.3. Optimum parameter seting to achieve the best wear behaviour .................. 103
Table 5.4. Parameter setting for genetic programming ................................................. 104
Table 5.5. Relative error of LS-SVM model and RSM model. ....................................... 105
xiv
Glossary of terms
3D Three Dimensional
3-DP 3D Printing
ABS Acrylonitrile Butadiene Styrene
AF Automated Fabrication
AM Additive Manufacturing
ANSI American National Standards Institute
ASCII American Standard Code for Information Interchange
ASTM American Society of Testing And Materials
CAD Computer Aided Design
CAGR Compound Annual Growth Rate
CAM Computer Aided Manufacturing
CCD Central Composite Design
CLI Common Layer Interface
CNC Computer Numerical Control
CSG Constructive Solid Geometry
DFM Design for Manufacture
DLF Directed Light Fabrication
DMD Direct Metal Deposition
DMLS Direct Metal Laser Sintering
DOE Design of Experiment
DXF Drawing Exchange Format
EDM Electrical Discharge Machining
FCCCD Face Centred Central Composite Design
FDM Fused Deposition Modelling
FDMet Fused Deposition Of Metals
FE Finite Element
FIS Fuzzy Inference System
GP Genetic Programing
IC Investment Casting
LENS Laser Engineered Net Shaping
LM Layered Manufacturing
LOM Laminated Object Manufacturing
LS-SVM Least Square Support Vector Machine
LV Low Vacuum
MADM Multi Attribute Decision Making
MAPE Mean Absolute Percentage Error
MJM Multi Jet Modelling
MPCI Multi Performance Characteristic Index
NRMS Normalized Root Mean Square
PC Polycarbonate

xv
RE Reverse Engineering
RM Rapid Manufacturing
RP Rapid Prototyping
RPI Rapid Prototyping Interface
RSM Response Surface Methodology
RT Rapid Tooling
SEM Scanning Electron Microscope
SFFF Solid Free Form Fabrication
SGC Solid Ground Curing
SL Stereolithography
SLM Selective Laser Melting
SLS Selective Laser Sintering
STL Stereolithography File
SVM Support Vector Machine
UC Ultrasonic Consolidation
UV Ultra Violet
Background and Motivations
Introduction
In the post era of globalisation, the manufacturing industries are facing stiff competitions
to sustain in the market place due to reduction in product life cycle. To meet the challenging
demands in the global market, the industries depend in technological advancements in the
manufacturing field so that design and manufacturing lead time can be reduced. These
days, market demands durable parts with complex profiles at reasonable manufacturing
time and cost. As the complexity of the part increases, it demands more advanced
manufacturing processes in order to reduce manufacturing cost as well as time. In the
recent decades, new manufacturing technologies have been developed to address these
issues. Among them, additive manufacturing (AM) is one such process that can produce
precise durable end use parts in less time. Generally, the manufacturing processes are
categorised into two types depending upon the machining processes i.e. additive and
subtractive. The subtractive manufacturing (SM) processes include turning, milling, cutting
and grinding in which material is removed from the work piece to get the final shape. In
case of SM, the work piece has to pass through various machining processes which
increases the manufacturing time and wastage of material. On the other hand, AM process
develops product by adding material layer one over another in a sequential manner. Since
the material is added as defined by the machining software, material wastage and product
development time can be subsequently reduced as compared to SM process.
The AM process alternatively known as Rapid Prototyping (RP) is widely appreciated
for its tremendous ability in producing complex 3D geometry parts directly from computer
aided design (CAD) generated models without requirements of tools, dies, fixture and
human intervention. The RP process can easily manufacture physical models from
conceptual designs processes through computer aided design (CAD) data saved in the .stl
(stereolithographic) format. The rapid prototyping (RP) enables quick and easy transition
from concept generation in the form of computer images to the fabrication of 3D physical
models. Although the RP process can produce durable parts in less time, the availability
of material type limits its wide spread application in daily life and industrial applications.
However, the ongoing advances in the fields of material and manufacturing technologies
Chapter 1 Background and Motivations
2
have boosted the wide spread application of RP process to produce end use parts rather
than a prototype model (Yan et al., 2009).
In order to increase the industrial application of RP process, some technological
advancements are needed. In this direction, overcoming the limitation of materials
functionality of RP build parts, the strength and durability of the build parts must be
enhanced to face the demands of the customer. The strength of RP build parts under both
static loading and dynamic loading condition must be assessed to enhance functionality.
The wear behaviour of the RP build parts needs to be examined to assess its durability.
Rapid Prototyping process
Manufacturing of three dimensional (3D) solid parts directly from the computer aided
design (CAD) file (solid modelling softwares like Solid Works, CATIA, Pro-E, UG and Auto
CAD) is conventionally adopted by removing or forming of material from a block of work
piece to a desirable shape. Conventional machining processes have their own limitation
in manufacturing of complex jobs. In case of moulding process, the cost of the mould is
very high and accuracy of the mould decreases after batches of production (Tromans,
2003; Ghosh and Mallik, 1985). Generally, the machining process is automated through
integration of CAD and computer aided manufacturing (CAM) so that benefits like cost and
time reduction can be realized in manufacturing parts with complex geometry. These days,
RP is gaining popularity because parts with complex geometry or complete assembly can
be built in significantly less time. The RP process involves fabrication of physical part
directly from the CAD data without any human intervention. The build mechanism is almost
same for all RP processes i.e. addition of layer one over another in the x-y plane. The
addition of material occurs in the z- direction (Onuh and Tusuf, 1999; Upcraft and Fletcher,
2003). To form an object, RP processes add and bond materials in a layer wise manner.
The RP process is also known as additive manufacturing (AM), solid freeform fabrication
(SFF), layered manufacturing (LM), automated fabrication (AF) and other variants.
The RP process came into existence in the mid of 1980 when advanced version of
stereolithography (SL) process was commercialised. After several years of research,
laminated object manufacturing (LOM), fused deposition modelling (FDM) and 3D printing
(3DP) are commercialised. One survey by Wohelers Associates in 2010 reveals that the
demand for RP parts has been increased over last 22 years (Wohler, 2010). Industrial
applications of RP parts indicate that it is a widely appreciated technology to address
variety of problems in a diverse number of industrial problems (Chua et al., 1999; Liu et
Chapter 1 Background and Motivations
3
al., 2005; Raja et al., 2005). Since the cost of RP machine is prohibitive to be possessed
by medium and small enterprises, the web based RP system can improve productivity,
manufacturing speed and economic advantage of such firms (Lan H., 2009; Dong et al.,
2008).
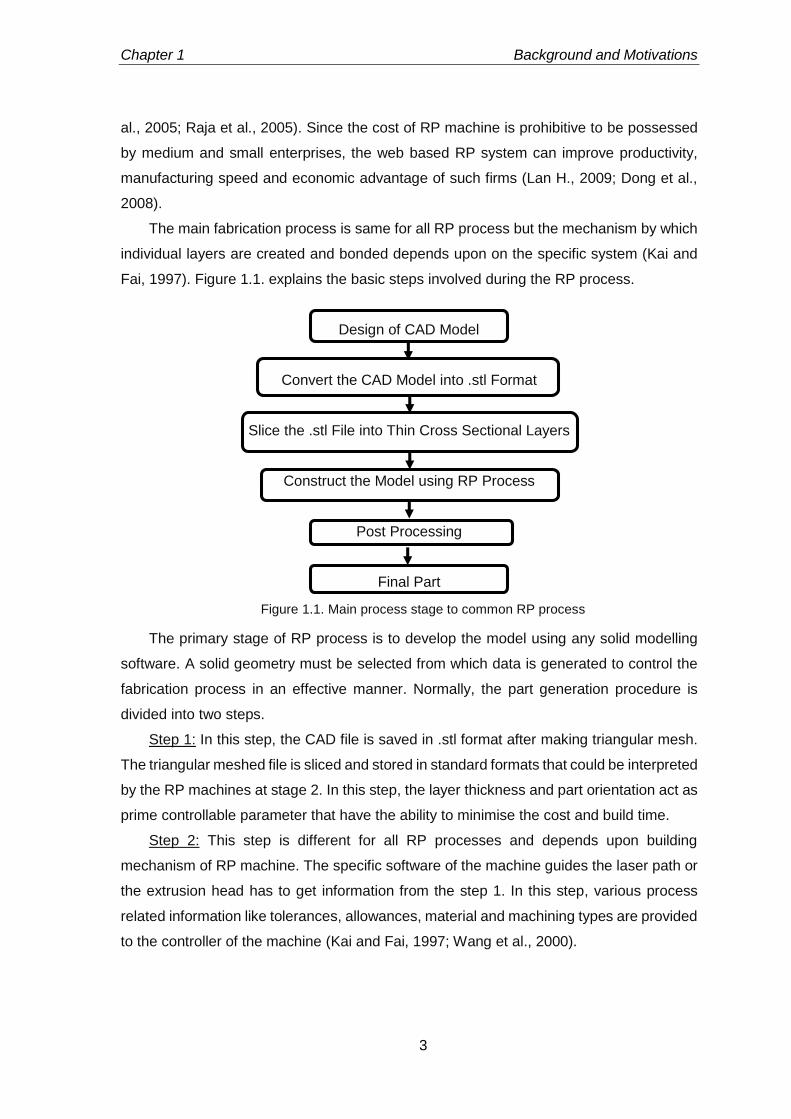
The main fabrication process is same for all RP process but the mechanism by which
individual layers are created and bonded depends upon on the specific system (Kai and
Fai, 1997). Figure 1.1. explains the basic steps involved during the RP process.
Design of CAD Model
Convert the CAD Model into .stl Format
Slice the .stl File into Thin Cross Sectional Layers
Construct the Model using RP Process
Post Processing
Final Part
Figure 1.1. Main process stage to common RP process
The primary stage of RP process is to develop the model using any solid modelling
software. A solid geometry must be selected from which data is generated to control the
fabrication process in an effective manner. Normally, the part generation procedure is
divided into two steps.
Step 1: In this step, the CAD file is saved in .stl format after making triangular mesh.
The triangular meshed file is sliced and stored in standard formats that could be interpreted
by the RP machines at stage 2. In this step, the layer thickness and part orientation act as
prime controllable parameter that have the ability to minimise the cost and build time.
Step 2: This step is different for all RP processes and depends upon building
mechanism of RP machine. The specific software of the machine guides the laser path or
the extrusion head has to get information from the step 1. In this step, various process
related information like tolerances, allowances, material and machining types are provided
to the controller of the machine (Kai and Fai, 1997; Wang et al., 2000).
Chapter 1 Background and Motivations
4
Some of well-known RP processes such as Stereolithography (SL), Selective laser
sintering (SLS), Laminated object manufacturing (LOM), Fused deposition modelling
(FDM), 3D printing (3DP), Multi jet modelling (MJM) and Solid ground curing (SGC)
commercialised since 90s have been discussed below (Noorani, 2005).
1.2.1. Stereolithography (SL)
This is the first RP machine commercialised in mid 1980s by 3D Systems, California, USA.
In this process, parts are manufactured from a photo curable liquid resin that solidifies
when exposed to laser beam. The solidified layer is then lowered into the tank in such a
manner that another layer of liquid will come over it to be exposed to the laser. This process
continues until all layers are added to develop the model as original as developed in the
CAD model. The build platform is removed from the tank and excess liquid polymers are
cleaned off. In the post processing stage the build part is cured in an ultra-violet oven.
1.2.2. Selective Laser Sintering (SLS)
This process was developed and patented by Dr. Carl Deckard from University of Texas
at Austin and brought into market by DTM Inc. In this process, a thin layer of thermoplastic
powder is spread by a roller over the surface of build platform and heated below its melting
temperature by infrared heating panels attached to the side of the platform. Then a laser
beam traces out the edge of the cross section of the part. The laser beam is used to sinter
or fuse together the particle of the layer. After deposition of the first layer, it goes down
exactly to layer thickness and another layer of powder is spread over for sintering process.
The unsintered powder is removed by brushing off.
1.2.3. Laminated Object Manufacturing (LOM)
In this process, a layer of sheets having an adhesive coating on one side is placed on the
build platform with adhesive side down. The sheet sticks to the platform when a heated
roller passes over it. Then, a laser beam is pointed to trace the outline of the slice of the
part from the sheet. When one layer is formed, the build platform is lowered down up to
one layer thickness and another layer of sheet is then stuck onto the previous layer to
continue the process. After addition of all layers, the solid block of material is removed
from the platform and subjected to post treatment processes.
Chapter 1 Background and Motivations
5
1.2.4. Fused Deposition Modelling (FDM)
Fused deposition modelling (FDM) was introduced and marketed by Stratasys Inc., USA.
In this process, semi molten plastic materials like acrylonitrile butadiene styrene (ABS) or
polycarbonate (PC) is extruded from the nozzle over the build platform in the form of thin
rasters to build a 3D part. Extruded filaments are placed inside the build chamber in a
sequential manner and bonded with the previously placed rasters in the adjacent layer.
The build platform is then lowered down relative to the nozzle and next layer of material is
deposited over the previous layer. In order to manufacture hanging structures, support
material is deposited from a secondary nozzle. Once the part is developed, the support
structures are broken away from the part.
1.2.5. Three Dimensional Printing (3DP)
The 3DP technology was invented and patented by the researchers of Massachusetts
Institute of Technology (MIT), USA. The inkjet technology is used in 3DP process for model
development in a layer-by-layer method. Using the inkjet technology a binder is spread
over the powered material to form a layer. The bed is then lowered by a fixed distance
(layer height). Then, powered is deposited and spread evenly over the bed using a roller
mechanism to build the next layer. This process continues till the completion of part
building. Once the part building is completed, the part is removed from the unprocessed
powder and set for post processing.
1.2.6. Multi Jet Modelling (MJM)
In this technology, around ninety six small nozzles are attached to the print head and
placed in the x-y plane over the build platform. Thermoplastic polymer are sprinkled over
the build platform from the nozzle in droplet form where material is needed. Depending on
the shape of layer, jets are activated simultaneously. Hot droplets of material bind with the
previously placed material layer. Support structures are also build up inside the part where
support is necessary. After completion of a layer, the bed moves down with respect to the
print head and the next layer is build up. After completion of the full part, the part is
removed from the machine and the support structure is broken off.
Chapter 1 Background and Motivations
6
1.2.7. Solid Ground Curing (SGC)
In this system, photo polymer resin and ultra-violet (UV) light are used. The computer
generated CAD data is used to generate a mask which is placed above the resin surface.
Once the layer has been cured, excess resin is wiped away and gaps are filled with wax
material. The wax is cooled and the chips are removed. New layer of resin is applied and
the process repeated until the object is completed. In this process, large amount of wax is
wasted and cannot be recycled.
From above discussions, it has been noted that various RP process have been
developed and successfully commercialised for industrial applications. Irrespective of the
build mechanism, RP processes are distinguished on their use of material types, strength,
durability and surface roughness of the build part. In order to improve the usability and
industrial application of RP processed parts, research work needs to be carried out to
address the above characteristics. Among all RP processes, fused deposition modelling
(FDM) process has the ability to build 3D complex part accurately having reasonable
strength and durability. Since the FDM process is parametric dependant, the performance
characteristics of the build parts are largely influenced by the selection of process
parameters. Therefore, in this research work, efforts have been made to assess the effect
of FDM process parameters on the strength, fatigue life and wear behaviour of the FDM
build parts.
Need for the research
Due to design flexibility and ability to handle complex geometry, RP manufacturing
processes are gaining significant importance in the industrial application. Manufacturing of
functional parts and accurate prototypes without any human intervention can be made
using rapid prototyping process only. The application of RP has been diversified in fields
like medical, aerospace, automobile, tooling, pattern manufacturing, mould manufacturing
and for design verifications (Hopkinson et al., 2006). Apart from these advantages, some
limitations exist in the industrial application that drag the popularity of RP. (Wohlers T,
1992). Significant variations are noticed in the geometry and properties of identical parts
built using different RP processes. Therefore, industrial standards are required for data
transfer between dissimilar RP processes, testing and characterisation of build parts
(Campbell et al., 2002; Chockalingam et al., 2005; Ippolito et al., 1995). Use of variable of
materials in RP is a major drawback (Gibson et al., 2010).
Chapter 1 Background and Motivations
7
These limitations of RP technologies open doors for advancements and development
as follows:
Some new design tools and techniques are needed to ease handling of complex
geometry that meet specific design as well as strength requirements.
New RP materials are needed as per the industrial demands.
To ensure the reliability and predictability of the RP processes, technological and
operation related advancements are required.
In order to predict the performance characteristics of RP build parts, artificial
intelligence techniques are needed.
Some industrial standards for RP processes should be set up to increase the
growth rate and further advancement of RP technologies.
Research objectives
In this context, extensive literature review has been carried out on various efforts directed
to improve the industrial feasibility of FDM process. It is well-established fact that FDM
build parts are not gaining that much importance in daily life due to limitation of materials
used and strength of the part. Therefore, present work focuses on the characterisation of
FDM process to make it reliable and predictable like other conventional manufacturing
processes simply by extensive study on parametric appraisal rather than resorting to
change in the material. Based on these ideas, the objectives of present research are listed
below:
To study the effect of process parameters on static strength, fatigue life and wear
resistance of the FDM build parts.
To effectively control the process parameters to minimise the anisotropic behaviour of
the FDM build parts.
To develop empirical models relating the FDM process parameters with performance
characteristics of the FDM build parts.
To propose predictive models to assess strength, fatigue life and wear resistance of
FDM build parts.
Use of artificial intelligent techniques (AI) to develop models relating process
parameters with the performance characteristics of FDM build parts.
To select optimum parameter setting for the improvement of static strength, fatigue
life and wear behaviour of the FDM processes parts.

Chapter 1 Background and Motivations
8
To use artificial intelligence techniques for prediction of static strength, fatigue life and
wear behaviour of the FDM build part, because prediction models enables to predict
the performance measures with reasonable accuracy so that costly experimental time
can be minimized.
Outline of the thesis
The dissertation is organized into six chapters as follows:
Chapter 1. Background and motivation
This chapter introduces fused deposition modelling, its related issues and end use
applications. The chapter also provides the problem statements to be addressed in this
research.
Chapter 2. Literature survey
This chapter reviews related literature to provide background information on the issues to
be considered in the thesis and emphasize the relevance of the present study. The search
is restricted on those articles for which full text is available. The study is mainly categorized
into six parts such as application of RP, material issue, process selection, assessment of
static strength, fatigue life and wear behaviour of FDM build parts.
Chapter 3. Parametric assessment of static strength of FDM build parts
In this chapter, effect of six controlling process parameter such as contour number, layer
thickness, raster width, raster orientation, part orientation and air gap on the mechanical
strength (tensile, compressive, flexural and impact strength) are studied using design of
experiment approach. Empirical models relating process parameters and mechanical
strength have been developed using regression analysis. Optimum parameter setting has
been suggested using a nature inspired meta-heuristic known as firefly algorithm to
improve the mechanical strength of the FDM build parts. To predict the mechanical
strength, two latest artificial intelligence techniques known as genetic programming (GP)
and least square support vector machine (LS-SVM) have been adopted. The prediction
model enables to predict the performance measures with reasonable accuracy so that
costly experimental time can be minimized.
Chapter 4. Parametric assessment of fatigue life of FDM build parts
In this chapter, effect of six controlling process parameter on the fatigue life of the build
parts has been studied using strain-controlled fatigue test based on ASTM E 606. The
failure mechanism of rasters has been analysed and discussed using SEM micrographs.
A statically valid empirical model relating process parameters and fatigue life has been

Chapter 1 Background and Motivations
9
developed using regression analysis. Optimum parameter setting has been suggested
firefly algorithm to improve the fatigue life of the FDM build parts. To predict the fatigue
life, genetic programing and least square support vector machine have been adopted.
Chapter 5. Parametric assessment of wear characteristics of the FDM build parts
In this chapter, effect of six controlling process parameter on sliding wear behaviour of the
build parts have been studied. From the scanning electron microscope (SEM) micro-
graphs, wear surfaces and internal structures of the specimens are evaluated. Empirical
model relating process parameter and wear volume has been suggested. Again genetic
programing and least square support vector machine have been adopted to predict the
wear behaviour of FDM build parts.
Chapter 6. Executive summary and conclusions
In this chapter, conclusions, scope for future work and contribution of the research work
have been highlighted.
This chapter also presents the brief summary of findings, major contribution to
research work and future scope of the research.
Conclusion
Present chapter highlights the importance and significance of RP as a manufacturing
technology having the ability to build the part accurately without any human intervention.
The advantage of RP over traditional manufacturing may be listed as follows:
An additive manufacturing process (Layer-by-Layer build mechanism).
Have the ability to build 3D complex geometry of reasonable strength with less
time and material wastage.
Fully automatic process and depends on the CAD data.
RP process does not require any jig and fixture arrangement.
Parts can be built directly from CAD data without any human intervention.
The advantages of RP, draws the attention of the manufacturers for direct
implementation of RP in industries. To overcome the limitations of RP processes
particularly in the application of FDM process, research objectives are set and the work
outline is presented in this chapter. An exhaustive literature survey is presented in the next
chapter (Chapter 2).
Literature Review
2.1. Introduction
In order to face the challenging demands of global customers, manufacturing industries
are adopting new processes to minimise the product development cycle and wastage of
material. Among all processes, rapid prototyping (RP) is widely appreciated for its ability
to manufacture accurate and durable parts in reasonable time with less material waste.
For proper implementation of RP process, the related issues associated RP process must
be addressed. Therefore, in this direction, the current chapter elaborates the development
and problems associated with the RP process with specific attention to the fused
deposition modelling (FDM) process. RP literature survey in this work begins with journals
and books published after 1990. The literature survey is limited to those article for which
full text was available. Table 2.1 provides the name of journal and the number of citations
from the journal. The International Journal of Advanced Manufacturing Technology and
Journal of Material Processing Technology together account 30% of the total cited articles.
Table 2. 1 Summary of publication referred
Journal name Citation
Advanced Engineering Informatics 1
Advanced Engineering Materials 1
Assembly Automation 1
ASTM standards 6
CIRP Annals-Manufacturing Technology 6
CIRP Journal of Manufacturing Science and Technology 1
Composites Part B: Engineering 1
Computational Materials Science 1
Computer and Geosciences 2
Computer-Aided Design 1
Computers in Industry 4
Expert Systems with Applications 1
ICIC Express Letters 2
International Journal of Current Research 1
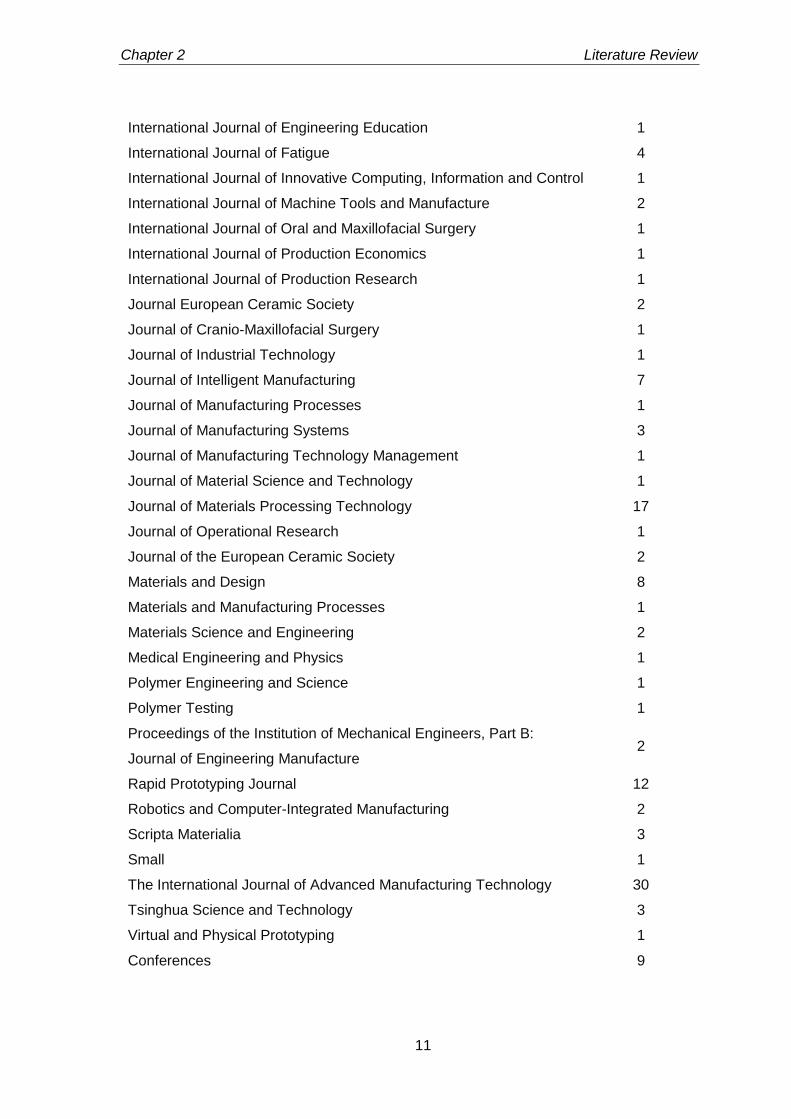
Chapter 2 Literature Review
11
International Journal of Engineering Education 1
International Journal of Fatigue 4
International Journal of Innovative Computing, Information and Control 1
International Journal of Machine Tools and Manufacture 2
International Journal of Oral and Maxillofacial Surgery 1
International Journal of Production Economics 1
International Journal of Production Research 1
Journal European Ceramic Society 2
Journal of Cranio-Maxillofacial Surgery 1
Journal of Industrial Technology 1
Journal of Intelligent Manufacturing 7
Journal of Manufacturing Processes 1
Journal of Manufacturing Systems 3
Journal of Manufacturing Technology Management 1
Journal of Material Science and Technology 1
Journal of Materials Processing Technology 17
Journal of Operational Research 1
Journal of the European Ceramic Society 2
Materials and Design 8
Materials and Manufacturing Processes 1
Materials Science and Engineering 2
Medical Engineering and Physics 1
Polymer Engineering and Science 1
Polymer Testing 1
Proceedings of the Institution of Mechanical Engineers, Part B:
Journal of Engineering Manufacture 2
Rapid Prototyping Journal 12
Robotics and Computer-Integrated Manufacturing 2
Scripta Materialia 3
Small 1
The International Journal of Advanced Manufacturing Technology 30
Tsinghua Science and Technology 3
Virtual and Physical Prototyping 1
Conferences 9
Chapter 2 Literature Review
12
Books 6
Web sites 2
Total 162
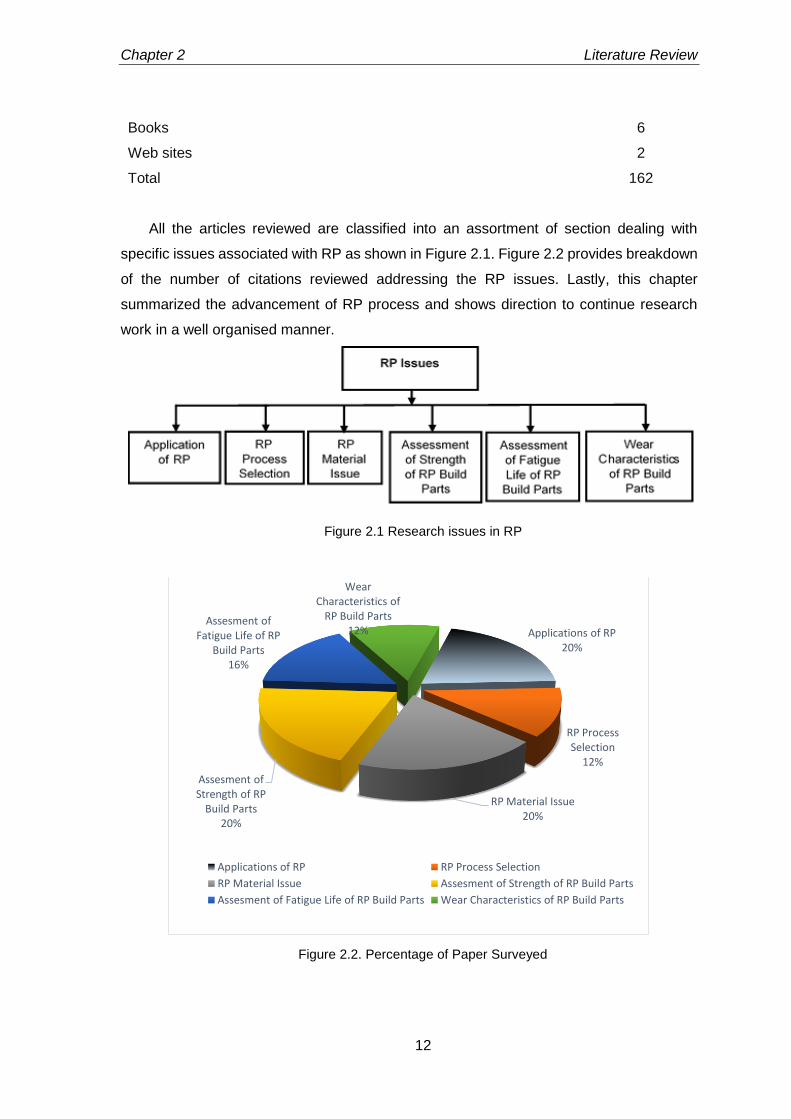
All the articles reviewed are classified into an assortment of section dealing with
specific issues associated with RP as shown in Figure 2.1. Figure 2.2 provides breakdown
of the number of citations reviewed addressing the RP issues. Lastly, this chapter
summarized the advancement of RP process and shows direction to continue research
work in a well organised manner.
Figure 2.1 Research issues in RP
Figure 2.2. Percentage of Paper Surveyed
Applications of RP20%
RP Process Selection
12%
RP Material Issue20%
Assesment of Strength of RP
Build Parts20%
Assesment of Fatigue Life of RP
Build Parts16%
Wear Characteristics of
RP Build Parts12%
Applications of RP RP Process Selection
RP Material Issue Assesment of Strength of RP Build Parts
Assesment of Fatigue Life of RP Build Parts Wear Characteristics of RP Build Parts
Chapter 2 Literature Review
13
2.2. Application of RP
In order to decrease the product development cycle time due to stiff competition in the
market place, manufacturing industries are forced to adopt new technologies for part
design and fabrication. Among all technologies, RP process is distinguished due its ability
to develop accurate 3D parts directly from CAD (computer aided design) data without any
human intervention. RP helps the manufacturer to get competitive advantage due to
reduction of cycle time. Hence the process is widely adopted in manufacturing industries
(Krause et al., 1997; Bernard and Fischer, 2002; Kruth et al., 1998). Wiedemann and
Jantzen (1999) reveals that complete engine mock-ups for Daimer- Benz can be
manufactured using the RP process at a cost of 80% than the conventional manufacturing
process.
Application of RP in the medical field increases the possibility of viewing and physical
handling of anatomically precision parts so that information can be gathered before any
surgical operations (Berry et al., 1997; Giannatsis and Dedoussis, 2009). Some bio-
models manufactured through RP processes are used for planning to assist surgery and
preparation of implants (Liu et al., 2005; Girod et al., 2001; Heissler et al., 1998; Lohfeld
et al., 2007). Studies also reveal that CAD, finite element (FE) analysis and RP techniques
can be simultaneously adopted for direct manufacturing of customized implant parts
(Colombo et al., 2010). Normally, RP produced parts are porous in nature due to the
presence of small air gaps between layers and these porosity is advantageous for the
construction of specific scaffolds (Too et al., 2002).
Primarily, RP processes are used to manufacture prototype parts for design
verifications but design freedom, less tooling and less human intervention enables RP
process to be used for batch production economically. Direct manufacturing of end use
and kinematic functional parts from CAD model is termed as rapid manufacturing (RM)
process. Using the RM process, the product development cycle and the requirement of
equipment can be minimised (Levy et al., 2002; Hon K., 2003). Multi-layer printed circuit
board (PCB) can be accurately fabricated using RP technology like solid ground curing
(SGC) (Im et al., 2007).
Though RP processes are not well developed to use metal as build material directly
but the combination of RP process with metal casting increases the feasibility of rapid
manufacturing process. This combination gives rise to a new application of RP known as
rapid tooling (RT). The RT process proves its existence in the manufacturing industries by
producing complex moulds which are capable of forming millions of parts at a single time.
Chapter 2 Literature Review
14
RT, an application of RP process, describes a technology which either use RP parts as a
pattern to develop a mould or use of RP parts directly as a tool (Ding et al., 2004; Dunne
et al., 2004; Chua et al., 1999). Depending on the application RT process, it is divided into
two type i.e. direct tooling and indirect tooling. In case of indirect tooling, the master pattern
is manufactured using a RP process. Now-a-days, RP patterns can be manufactured using
almost all RP processes such as stereolithography (SL), selective laser sintering (SLS),
laminated object manufacturing (LOM), fused deposition modelling (FDM), 3D printing (3-
DP) and solid ground clearing (SGC) (Shan et al., 2003; Rahamati and Dickens, 2007;
Mueller and Kochan, 1999; Czyzewski et al., 2009). In case of direct tooling, tool cavities
are directly manufactured using the RP processes avoiding the intermediate steps of
generating patterns (Cheah et al., 2002; Karapatis et al., 1998). The FDM technology have
shown its capability in the manufacturing of acrylonitrile butadiene styrene (ABS) patterns
for the investment casting processes (Gosh and Malik, 1985; Cheah et al., 2004). Another
interesting area for the application of rapid tooling is in the electrical discharge machining
(EDM) process. Some RP processes have already shown their potential in the
manufacturing of EDM tools by using abrading process, copper electroforming and spray
metal deposition (Tang et al., 2002). To make an EDM tool using RP process, post
processing of parts are needed to meet the EDM specifications. For non-conductive
material, metallisation is required to make it conductivity i.e. by applying conductive paste
over the outer surface (Monzon et al., 2008). One effective method has been proposed by
Hsu et al. (2007) for the manufacturing of EDM tool using Zcorp 402 3DP rapid prototyping
process and the experimental results indicate that the performance of the EDM tool is
reasonable. Zhang et al. (2009) have used the integration of RP with reverse engineering
(RE) process for the die making of clutch house of a diesel engine. The LOM process is
used to manufacture the die by collecting data from the RE process. Most effective RP
processes that are used to fabricate composite structures are laminated object
manufacturing (LOM), fused deposition modelling (FDM), stereolithography (SL), 3D
printing (3DP), ultrasonic consolidation (UC), laser engineering net shaping (LENS) and
selective laser sintering/ melting (SLS/SLM) (Ma et al., 2007; Kumar and Kruth, 2010 ).
2.3. RP process selection
Appropriate selection of RP process requires a focus on various criteria such part cost,
part quality, part properties, temperature of the build platform, build time and other
parameters that suits the build condition. In this direction a large number of articles have
Chapter 2 Literature Review
15
been published to proposed decision support systems assisted with software tool for the
selection of most suitable RP process. A data base has been developed by Mahesh et al.
(2005) that stores all the features of individual RP systems. The data base structure use
of queries of the users for the selection of suitable RP process. The selection of RP
process depends upon the benchmarking studies which compares different RP system on
the basis of part accuracy, part strength, part quality and other aspects (Campbell and
Bernine, 1996; Pham and Gault, 1998; Bibb et al., 1999). Comparison of RP processes
using benchmark problems has some limitation due to the selection of a standard part for
the benchmarking issue.
As selection of RP process can be viewed as multi criteria decision making process,
analytic hierarchy process (AHP) is gaining popularity for the selection of RP process to
suit the manufacturer’s requirements (Vaidya and Kumar, 2006; Bragila and Petroni, 1999;
Kengpol and Brien, 2001). A rule based RP process selector has been developed by
Industrial Research Institute, Swinburne (IRIS) and it uses selection criteria such as part
accuracy, machine cost, surface finish, build envelop, build material and building speed.
The database includes the full specification of RP machines and displays it when
recommended by the selector program (Masood and Al-alawi, 2002; Masood and Soo,
2002). Byun and Lee (2004) have proposed a modified version of technique order
preference by a similarity to ideal solution (TOPSIS), a multi attribute decision making
(MADM) approach, for ranking the RP systems. The key factors used for the selection of
RP processes are part accuracy, strength, surface roughness, build time, part cost of the
build part. Lan et al. (2005) have proposed a method of integrating the expert system with
the fuzzy synthetic evaluation (FSE) to select an appropriate RP process as required by
the user. The selection process is divided into two stages. In the first stage, possible
alternatives are developed while executed under the expert system environment.
Subsequently, in the second stage FSE approach is made to produce a ranking order of
the RP processes. Chowdary et al. (2007) have implemented a back propagation artificial
neural network (ANN) for the selection of different types of machines. The major attributes
that are considered during the selection process of SL machines are laser configuration
types (wavelength and power), layer thickness, beam diameter, drawing speed, maximum
part weight, capacity, maximum build size, part cost build time and operating system. Rao
and Padmanabhan (2007) have proposed a methodology for selection of RP process using
the graph theory and matrix approach. Subburaj and Ravi (2008) have proposed a
computer aided rapid tooling (RT) process selection and manufacturability evaluation
Chapter 2 Literature Review
16
methodology that not only help in RT process selection but also identifies the difficulties to
manufacture a part.
2.4. RP material issue
The RP process has the ability to use base material in the form of solid, liquid and powder
but choice of material is totally depends upon the selection of RP process by the user. The
material used in the RP must satisfy some criteria such as proper range for melting and
solidification temperature, minimum shrinkage value, low viscosity, low coefficient of
thermal expansion and must be capable of rapid solidification relatively in short time in
order to achieve good strength and part quality. Normally, the part building temperature
range lies in between 70-100°C. The preferable solidification temperature is 5-10°C below
the glass transient temperature of the build material. Thermoplastic material such as poly-
carbonate (PC), polyphenylsulfone (PPSF) and acrylonitrile butadiene styrene (ABS)
satisfy above material properties and preferred as build material for RP processes
(Noorani, 2005; Hopkinson, 2006). Based on the above characteristics, each RP process
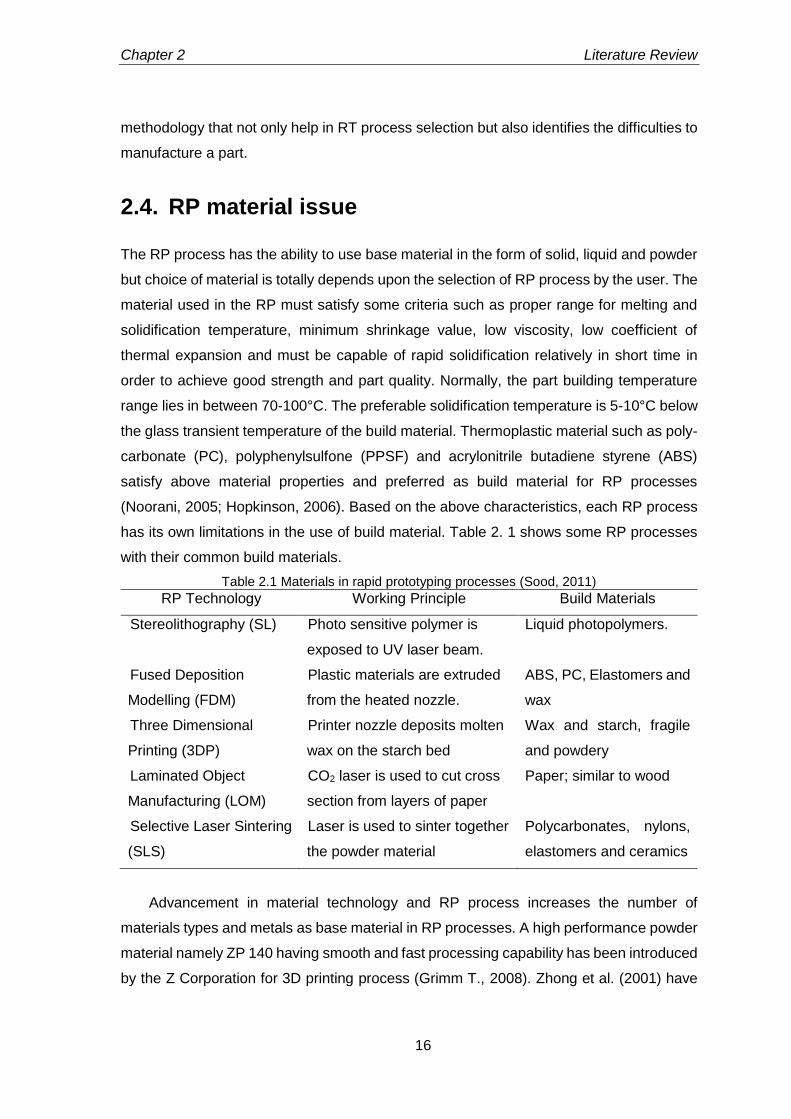
has its own limitations in the use of build material. Table 2. 1 shows some RP processes
with their common build materials.
Table 2.1 Materials in rapid prototyping processes (Sood, 2011)
RP Technology Working Principle Build Materials
Stereolithography (SL) Photo sensitive polymer is
exposed to UV laser beam.
Liquid photopolymers.
Fused Deposition
Modelling (FDM)
Plastic materials are extruded
from the heated nozzle.
ABS, PC, Elastomers and
wax
Three Dimensional
Printing (3DP)
Printer nozzle deposits molten
wax on the starch bed
Wax and starch, fragile
and powdery
Laminated Object
Manufacturing (LOM)
CO2 laser is used to cut cross
section from layers of paper
Paper; similar to wood
Selective Laser Sintering
(SLS)
Laser is used to sinter together
the powder material
Polycarbonates, nylons,
elastomers and ceramics
Advancement in material technology and RP process increases the number of
materials types and metals as base material in RP processes. A high performance powder
material namely ZP 140 having smooth and fast processing capability has been introduced
by the Z Corporation for 3D printing process (Grimm T., 2008). Zhong et al. (2001) have
Chapter 2 Literature Review
17
shown that the blending of ABS with composite fibres and small amount of plasticizer have
improved the strength of the build parts (Zhong et al., 2001). Composite manufacturing
using iron particles with nylon matrix have shown better mechanical strength as functional
parts when manufactured by direct rapid tooling on FDM process (Masood and Song,
2004). Mostafa et al. (2009) have reported development of a new composite materials
involving ABS plastic with iron. A high performance thermoplastic composite has been
developed using thermotropic liquid crystalline polymer (TLCP) fibre that can be used as
a build material for FDM process. The mechanical strength exhibited by the composite is
approximately four times that of ABS (Robert et al., 1998). In medical application, medical
grade polymethyl-methacrylate (PMMA) is used in FDM to manufacture porous
customised freeform parts for applications in craniofacial reconstruction and orthopaedic
spacers (Espline et al., 2010). Hinczewski et al. (1998) and Greco et al. (2001) have shown
the capability of stereolithography (SL) process for processing of the ceramic slurry
containing alumina powder. The study has focused on the necessity of minimising the
organic concentration in the suspension and maintaining the viscosity of the suspension
as low as possible to make a good coat of liquid monomer on the polymerised layer. Yen
et al. (2009) have used ceramic slurry, a mixture of silica powder, clay, silica gel, water
and inorganic binders to manufacture interconnected porous structure having high
strength and better surface quality using the SLS process. Liu et al. (2011) have fabricated
ceramic-metal composites by combining the SLS and gelation techniques. Apart from SLS
process which sinter the powered particles to form an object, they increases the
concentration silica solution by evaporation using laser beam. In comparison to other
manufacturing processes for making ceramic-metal composites, this approach requires
less laser forming energy and the fabrication process is faster. Using the above
manufacturing process, a composite prototype is manufactured having bending strength
45MPa, surface finish of 32 m and dimensional variation of 10% under a laser energy
density of 0.4 J/mm2. Zhang et al. (2001) have used laminated object manufacturing (LOM)
process for the fabrication of Al2O3 ceramic parts with complex geometry. Use of ceramic
materials in the manufacturing of 3D parts using FDM principle gives rise to new type of
process known as fused deposition of ceramics (FDC). In FDC process, the ceramic
powder is compounded with binder and solvent and the extruded filaments are joined
together by diffusion process. All the organic contents are removed by sintering at a high
temperature to form a pure ceramic lattice (Hattiangadi et al., 2000; Grida et al., 2003;
Bose et al., 1999).
Chapter 2 Literature Review
18
With the recent advancements in the RP technology, some RP machines have
increased their capability to produce metal parts directly. The most emerging technology
in this field is selective laser sintering (SLS) which sinter the powder metal to form an
object (Kumar, 2009). In order to develop metal parts from RP technology, other RP
processes have been involved like direct metal laser sintering (DMLS), laser engineering
net shaping (LENS), direct metal deposition (DMD), ultrasonic consolidation (UC),
selective laser sintering (SLS) and direct light fabrication (DLF) processes. Now-a-days, a
variety of materials is available to operate in DMLS process like bronze-based alloy, low
carbon steel based alloy and tool steel based alloy (Luo et al., 2005). Direct metal
deposition (DMD) is a laser based fabrication process that produces fully dense metal
products using tool steel alloy, stainless steel, cobalt based alloy and copper based alloy
(Lewis and Schlienger, 2000). Zaang et al. (2002) and Zhang et al. (2003) have developed
a control technology which includes slicing, system implementation and post processing
for RP process using gas metal arc welding as the deposition mechanism. The metal
transfer control system controls the frequency and size of the droplets to improve the part
accuracy. The deposition parameters includes travel speed of head, torch angle, welding
current and arc voltage are controlled to get required 3D geometry. A novel method has
been designed by researcher of Rutgers University to use metallic and ceramic based
materials in the FDM process for rapid fabrication of functional parts having improved
mechanical strength (Wu et al., 2002; Allahverdi et al., 2001).
2.5. Assessment of strength of RP build parts
Since RP process is a parametric dependant process, the mechanical properties of the
RP parts can be increased by the proper selection of process parameters. Cheah et al.,
(1997) have studied the mechanical strength of a stereolithography (SL) processed parts
fabricated using acrylic-based-polymer (De Solite SCR-300) and post cured using intense
ultra violet (UV) light. It was observed that the post cured specimen exhibits high modulus
of elasticity, ultimate tensile strength and elongation to fracture. The mechanical properties
of the post cured prototype can be increased by decreasing the layer height and increasing
the laser exposure density. The effect of part orientation on the tensile, compressive and
flexural strength of the laser sintered parts has been investigated by Ajoku et al. (2006).
The results indicate that the anisotropy is exhibited by the test specimen manufactured by
laser sintering process. Specimens built in the direction parallel to the movement of laser
head exhibit highest tensile and compressive strength whereas specimens exhibit highest
Chapter 2 Literature Review
19
flexural strength when the parts are manufacture in the direction perpendicular to the
movement of laser head. Chockalingam et al. (2005) have found that the layer thickness,
part orientation and post curing time have significant effect on the strength of SL
manufactured parts. Using finite element analysis approach, Nickel et al. (2001) have
shown that the raster pattern used to build the interior of a layer has significant effect on
the resulting residual stresses and deformation of the shape deposition manufacturing
(SDM) build parts. Pandey et al. (2008) have improved the tensile strength of SLS build
part by optimising the time difference for laser exposer between two points on successive
line on a single layer. As the time difference totally depends on the part orientation of build
part, an algorithm has been developed and implemented to find out the optimum part
orientation for improvement of the tensile strength.
However, FDM is a widely used technology because of its low material cost, less
manufacturing time, less material wastage and use of non-toxic materials. The major
challenge in industrial applications of FDM build parts lies with production of quality parts
for end use applications. This can be achieved if the relation between the performances of
the FDM processed parts with the process parameters is clearly understood. Ahn et al.
(2002) have studied the effect of raster orientation, air gap, raster width, model
temperature and colour on tensile strength of specimen built through FDM route. The
results indicate that raster orientation and air gap have strong influence on tensile strength
whereas raster width, model temperature and colour have small or no effect. The tensile
strength reaches maximum when the raster direction is parallel to the applied force and
exhibits failure of individual rasters as load is taken by all rasters in a collective manner.
Number of contours at the perimeter (offset contours) helps to reduce stress concentration
at the edges and overcomes premature failure of the specimen. Es Said et al. (2000) have
studied the effect of raster orientation on tensile strength, modulus of rupture and impact
resistance of FDM built parts. It is concluded that the anisotropic property in FDM built
parts is observed due to raster fill pattern. The strength is severely affected due to weak
interlayer bonding between rasters and the presence of interlayer porosity. An analytical
model validated by experimentation has been proposed by Croccolo et al. (2013) to predict
the tensile strength and stiffness of FDM processed parts considering number of contours
deposited around the edges of perimeter and other deposition parameters. Using design
of experiment (DOE) approach, Onwubolu and Rayegani (2004) have experimentally
investigated the effect of layer thickness, part orientation, raster angle and air gap on the
tensile strength of the specimens. Gurrala et al. (2014) have investigated the effect of bond
quality of interlayer and intra-layer rasters on the tensile strength of the specimen, both
Chapter 2 Literature Review
20
experimentally and analytically considering build direction as a variable. A strong
correlation between the tensile strength and the neck growth has been developed and the
contribution of amalgamation of filaments to the strength of the specimen is studied. Lee
et al. (2007) have observed anisotropic behaviour of FDM built parts caused mainly due
to build direction when compressive test is carried out on standard specimen. Villalpando
et al. (2014) have developed an optimisation model considering the material usages, part
build time, surface roughness, strength features and other related FDM parameters. They
have concluded that the internal matrix structure inside the part based on normal element
deposition style balances the compressive strength, material usage and build time.
Bellehumeur et al. (2008) have experimentally demonstrated that the interlayer bond
quality and bond quality between adjacent filaments depends on temperature and
convective heat transfer condition within the build chamber when FDM specimen is
subjected to flexural strength test. The temperature profiles on built parts indicate that
temperature at the bottom layers rises above the glass transition temperature and
decreases in the direction of movement of extrusion head. It is concluded that strong
interlayer bonding between rasters as well as layers can be achieved with less layer
number and cooling and heating cycle. Simulation of finite element analysis revels that
part distortion occurs due to accumulation of thermo-residual stress at the bottom surface
of the part during manufacturing (Chou and Zhang, 2008). Lee et al. (2005) have studied
the effect of layer thickness, raster angle and air gap on elastic behaviour and surface
quality of the FDM built parts using Taguchi method.
Sood et al. (2010) have studied the effect of layer thickness, part orientation, raster
width, raster angle and air gap on the mechanical strength of the FDM processed parts
conducting experiments based on central composite design and proposed functional
relationship between process parameters and mechanical strength. It is suggested that
deposition parameters largely influence meso-structural configuration of the built parts,
distortion and bonding of rasters within the built part. Wang et al. (2007) have investigated
the effect of material characteristics, setup of the fabrication parameters, geometrical
structure of the CAD model and the deposition path planning on mechanical strength. It is
observed that sudden cooling of extruded material from semi-molten temperature to
chamber temperature develops thermal residual stresses that affects interlayer bonding
strength resulting in layer deformation and cracking in parts. It has been observed that
deformation and cracking is more pronounced in bottom layer than the upper layer due to
involvement of rapid cooling and heating cycles. However, thermal residual stresses can
be minimised by maintaining small difference between the glass transition temperature of
Chapter 2 Literature Review
21
the material and chamber temperature of the FDM machine. Sood et al. (2009) have
studied the effect of FDM process parameters on the part quality and dimensional
accuracy of the parts manufactured through FDM route. It has been observed that the
shrinkage is dominant along length and width direction of FDM built parts affecting
dimensional accuracy of built parts. Anitha et al. (2001) have studied the effect of layer
thickness, raster width and deposition speed on surface roughness and part quality of FDM
built parts using a systematic design of experiments approach and concluded that layer
thickness has significant influence. Peng et al. (2014) have studied the effect of raster
width, extrusion velocity, filling velocity and layer thickness over dimensional error, warp
deformation and build time.
Byun and Lee (2005) have used multi-attribute decision making (MADM) for selection
of RP process considering part accuracy, roughness, strength, elongation, part cost and
build time. Chang and Huang (2011) have studied the effect of contour width, contour
depth, part raster width and raster angle on profile error of FDM built parts. Phatak and
Pande (2012) have proposed a methodology to obtain optimum part orientation of the RP
parts to minimise the build time and the material used in a hollowed model. Rezaie et al.
(2013) have developed an approach for the production of topological optimised FDM built
part.
2.6. Assessment of fatigue life of RP build parts
Normally, fatigue occurs due to repetitive cyclic loading of the specimen where the loading
is just below the static strength of the material. The fatigue of the material is characterised
by the rate of failure which is a function of amplitude and frequency of the stress intensity
factor. Starr and Wegener (2013) have investigated the effect of surface finish on the
fatigue life of SLM build parts under strain controlled mode. Polishing of the selective laser
melting (SLM) build part improves the fatigue life at low stress amplitude fatigue test.
Marissen et al. (2001) have shown that the fracture strain during cyclic loading decreases
due to the presence of large number of micro-cracks in the build material. These micro
cracks initiate the crack growth in the build parts and lead to failure. Riemer et al. (2014)
have found that the presence of residual stress and micro-porous gaps inside the part lead
to premature failure and lower the performance in many alloys fabricated through SLM
process. Edwards et al. (2014) have experimentally found that residual stresses, surface
roughness, microstructure and internal porosity are the key factors responsible for lowering
fatigue performance of the SLM Ti-6AL-4V build parts. Presence of porous gaps inside the
Chapter 2 Literature Review
22
parts has significant influence on the fatigue behaviour of SLM processed Ti-6-4
specimens. By adopting stress relieving post processing methods, the crack growth in SLM
processed Ti-6-4 part is similar to the conventional processes part.
The estimation of fatigue life is not adequately addressed to assess the long term
durability and sustainability of the FDM build parts. Therefore, the present research work
intends to analyse the effect of process parameters on fatigue life on the FDM build part.
Ziemian et al. (2015) have experimentally studied the effect of stress controlled fatigue on
the FDM build parts. It is observed that FDM build parts exhibits anisotropic behaviour due
to the influence of part orientation. Under stress controlled fatigue mode, the amount of
strain energy absorbed by two different types of FDM build materials are examined by Lee
and Huang (2013) considering the part orientation as the process parameter. Since the life
cycle of acrylonitrile butadiene styrene (ABS) plastic, one of the work materials of FDM
process, is less than 105 cycles, low cycle fatigue (LCF) test is recommended under strain
controlled mode for better characterisation of fatigue life of FDM build parts (ASTM E606).
Kallrath et al. (1999) and Tao and Xia (2007) have studied the fatigue crack growth in
polymers and their composites under strain controlled low cycle fatigue test.
2.7. Wear characteristics of RP build parts
One of the important characteristics to assess the functionality is the wear resistance of
end use parts built through FDM route. To this end, Sood et al. (2012) have experimentally
studied the effect of five process parameters such as layer thickness, part orientation,
raster angle, raster width and air gap on the sliding wear of the FDM build parts using
design of experiment (DOE) approach. It is observed that wear occurs due to rupture of
interfacial adhesive bonds and formation of cracks in the surface region. Among all
process parameters, layer thickness, part orientation and air gap have significant effect on
the sliding wear of the FDM build part. Singh and Singh (2015) have studied the effect of
input process parameters on the wear of Al-Al2O3 functionally graded material prepared by
FDM assisted by investment casting. The wear characteristics of alumide material
fabricated through selective laser sintering (SLS) process have been investigated by
Minetola and Iuliano (2014). Ramesh and Shrinivas (2009) have observed that the iron
silicon carbide metal matrix composites manufactured by direct metal laser sintering
(DMLS) process exhibits better micro-hardness and co-efficient of friction. It is concluded
that density, micro-hardness and wear resistance of the DMLS manufactured parts can be
improved by lowering the laser speed. Kumar and Kurth (2008) have shown that parts
Chapter 2 Literature Review
23
manufactured through selective laser melting (SLM), a variant of selective laser sintering
(SLS), exhibit superior fretting wear performance to selective laser sintering.
2.8. Discussion on RP issues
RP processes have increased the capability of manufacturing industries by increasing the
ability to develop 3D complex geometry directly from CAD data with reduced time and
material waste. Present application of RP is not limited to form, fit and functional testing
but it is widely used as an end use product where durable precision components are
needed. Moreover, integrating RP technology with other post processes, not only
increases the strength but also reduces the cost and product development cycle. The RP
parts are mostly used in orthodontic application, aerospace and automobile industries
(Wiedemann et al., 1999; Berry et al., 1997; Giannatsis and Dedoussis, 2009). Growing
demands and popularity of RP technologies in the industries and research works get rise
to development of new integrated RP technologies in the market every year (Onuh and
Yusif, 1999; Hopkinson, 2006). The selection of RP process totally depends upon some
key factors such as time, cost, surface roughness, temperature of build envelop, material
type and part accuracy. Although extensive research work has been reported on RP, very
less work has been performed to explore the improvement of fused deposition modelling
(FDM) process. Among all RP technologies, fused deposition modelling (FDM) technology
is widely appreciated due to ability to manufacture accurate and durable product with less
time and material waste. Literature suggests that the FDM process is parametric
dependant and the selection of suitable process parameter can increase the strength and
durability of the FDM build parts. Therefore, a systematic approach is needed to
understand the influence of process parameters on the part quality and part strength.
Empirical models should be developed relating the process parameters and the
performance characteristics so that the user can easily predict the measures and control
the process parameters.
2.9. Conclusion
This chapter provides the various past research and development work in the area of RP
technology. For the sake of easy understanding the chapter is divided into six main
sections. In the section 2. 2, the application of RP in various fields has been discussed.
The material limitation of RP processes is the key factor that decreases the growth rate of
Chapter 2 Literature Review
24
industrial application of RP processes. Many research works have been performed in the
past to overcome this limitation by integrating RP process with other post processing
technology. In section 2. 3, the proper selection of RP process for appropriate
manufacturing task has been explored. The literatures are discussed on the selection of
RP process suiting a particular task taking account the quantitative and qualitative data.
Each RP process has its own advantage and limitations in terms of strength, accuracy and
part quality of the build part, few approaches have been highlighted in this section to
enable the user for finding out practical solution to the problem. Section 2. 4, reviews the
issue of limitation and advantage of the RP processed materials. The material limitation is
the key factor which drag the popularity of RP process for the industrial applications. In
section 2. 5, the improvement of mechanical strength has been addressed for the RP
processed parts. Since RP processes are parametric dependant, the effect of process
parameters on the mechanical strength of RP processed parts have been discussed.
Chapter 2 .6 reveals the parametric effect of process parameters on the fatigue life of the
RP processed parts. It has been observed that few studies have been devoted to
determine the fatigue life of the FDM parts under strain controlled mode. The effect of
sliding wear on the RP process parts have been addressed in chapter 2. 7. Major steps
taken by the researcher to minimise the sliding wear of the RP processes parts are noted
down.
In this direction, present research work attempts to explain the effect of process
parameters and their possible interactions with performance characteristics. It is found that
proper tuning of process parameter of RP process can enhance the part strength, part life
and durability of the build part.
Parametric assessment of static strength of FDM build parts
3.1. Introduction
To sustain in the competitive market, it is necessary to minimise the product development
time. Therefore, manufacturing firms attempt to change to rapid prototyping (RP)
technology. The major advantage of RP lies in manufacturing end use assembly parts
proficiently directly form computer aided design (CAD) file saved in .stl format (Gibson et
al.,2010; Keause et al., 1997; Bernard et al., 2002; Kruth et al., 1998). Although RP is a
well-developed manufacturing technology, limitation in availability of compatible material
types restrict its wide spread application (Zhang et al., 2001; Hattiangadi et al., 2000; Grida
et al., 2003; Bose et al., 1999). In order to overcome material issue, modification has been
made to improve the material performance (Zhong et al., 2001; Masood et al., 2004;
Mostafa et al., 2004; Greco et al.,2001; Yen et al., 2009). Even with the existing materials,
controlling of process parameter may influence the properties of the parts build through
RP route due to its inherent building mechanism (Ahn et al., 2009; Galantucci et al., 2009;
Cheah et al., 1997; Es-Said et al., 2000; Ahn et al., 2002; Crocclolo et al., 2013). It is noted
that RP build part exhibits anisotropic effect under tensile compressive and flexural test
(Ajoku et al., 2006; Ahn et al., 2002; Lee et al., 2007). Literature suggests that adjustment
of process parameters has significant influence over properties of RP parts (Sood et al.,
2010; Chou et al., 2008; Onwubolu and Rayegani, 2004). The influence of process
parameters on the mechanical strengths needs a distinct study to select a suitable
parameter setting for the improvement of strength. The present chapter is devoted to study
the effect of process parameters on the mechanical strength such as tensile, compressive,
flexural and impact strength of fused deposition modelling (FDM) build parts.
Exhaustive analysis of literature reveals that relatively less research works address
the issue of influence of contour number on the mechanical property of FDM built parts.
Similarly, the influence of delta angle, which is capable of reducing the anisotropic
behaviour of the built parts and improving the mechanical strength in different directions is
not adequately considered in the literature. Therefore, in this research work, contour

Chapter 3 Parametric Appraisal of Static Strength of FDM Build Parts
26
number along with five FDM process parameters such as layer thickness, raster width,
raster orientation, part orientation and air gap have been considered for analysing their
effect on mechanical strength of FDM build parts. A face centred central composite design
(FCCCD) of response surface methodology (RSM) approach has been adopted to conduct
the experiments in a systematic manner and to obtain maximum information from less
number of experimental runs. Empirical relationship between mechanical strength and
process variables have been developed and statistical validity ensured. The effect of raster
fill pattern (delta angle) is investigated and compared with the default delta angle. The
analysis based on fuzzy logic finds applications in vague and uncertain environment. In
the recent years, fuzzy logic based multi-criteria decision making approaches have
become very popular in optimization of manufacturing processes. Utility of fuzzy logic
based optimization technique can be further improved when it is integrated with other
optimization methodologies. Therefore, fuzzy inference system (FIS) has been adopted
for the sake of converting multiple performance measures into single equivalent
performance measure. Finally, the nature inspired meta-heuristic known as firefly
algorithm is applied to obtain a best parametric combination for the improvement of all the
performance measures simultaneously. To predict the mechanical strength, two latest
artificial intelligence techniques known as genetic programming (GP) and least square
support vector machine (LS-SVM) have been adopted. The prediction model enables to
predict the performance measures with reasonable accuracy so that costly experimental
time can be minimized.
3.2. Fuzzy Inference Systems
Fuzzy logic (FL) is a technique that allows evaluation and simplification of complexities
with regard to the relationship in a process by presenting the relation between input
parameters and responses in a linguistic manner. Fuzzy rules may be formulated based
on expert knowledge in the field. Out of two most popular fuzzy inference systems
(Mamdani and Sugeno fuzzy model), Mamdani fuzzy model is widely used for solving
many real world problems because of its easiness. The Mamdani fuzzy model based on
the collection of IF-THEN rules with fuzzy antecedents and consequent can predict the
output in an efficient manner. A linguistic variable is a variable whose values are defined
in words or in sentences by man-made language. A fuzzy set is commonly defined by its
membership function. Normally, triangular or trapezoidal membership functions are used
to the crisp inputs because of computational efficiency (Chang et al., 2005; Gungor et al.,
Chapter 3 Parametric Appraisal of Static Strength of FDM Build Parts
27
2007; Sapkota et al., 2009; Wang et al., 2010; Li et al., 2010). Various steps involved in
fuzzy rule based system consist of four parts as explained below. The pictorial
representation of FIS is shown in Figure 3.1.
3.2.1. Fuzzifier
The crisp value is fuzzified using the fuzzification operator inside the fuzzifier. The precise
crisp value (input) is converted into imprecise value by using the linguistic terms such as
low, medium and high.
3.2.2. Knowledge base
The knowledge base is the main part of the fuzzy system in which both database and rule
base are jointly referred. In knowledge base part, the membership function and rules (IF-
THEN) are defined
3.2.3. Inference engine
The inference operation on the rules is performed by the inference system. It decides the
way in which the rules are combined. It applies reasoning to compute the fuzzy outputs.
3.2.4. Defuzzifier
The output of the inference block is in the form fuzzy value. To translate this fuzzy value
to the crisp value or to the real world output value, defuzzifier is used.
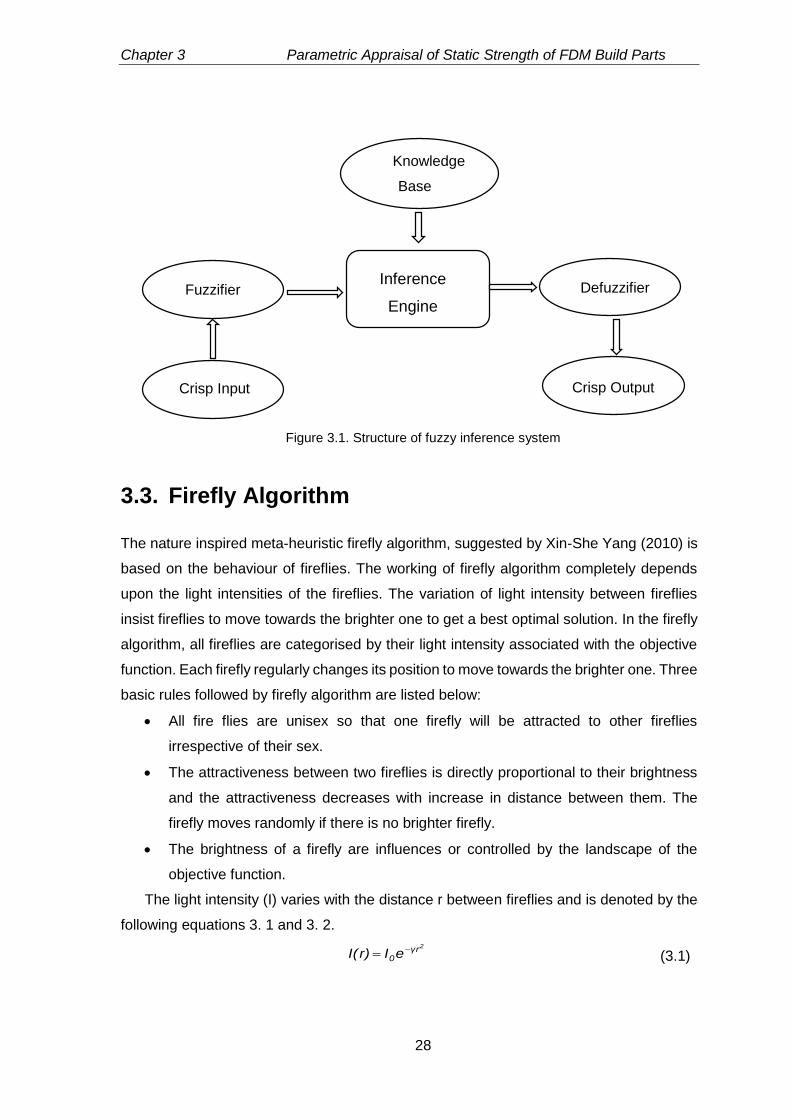
Chapter 3 Parametric Appraisal of Static Strength of FDM Build Parts
28
Figure 3.1. Structure of fuzzy inference system
3.3. Firefly Algorithm
The nature inspired meta-heuristic firefly algorithm, suggested by Xin-She Yang (2010) is
based on the behaviour of fireflies. The working of firefly algorithm completely depends
upon the light intensities of the fireflies. The variation of light intensity between fireflies
insist fireflies to move towards the brighter one to get a best optimal solution. In the firefly
algorithm, all fireflies are categorised by their light intensity associated with the objective
function. Each firefly regularly changes its position to move towards the brighter one. Three
basic rules followed by firefly algorithm are listed below:
All fire flies are unisex so that one firefly will be attracted to other fireflies
irrespective of their sex.
The attractiveness between two fireflies is directly proportional to their brightness
and the attractiveness decreases with increase in distance between them. The
firefly moves randomly if there is no brighter firefly.
The brightness of a firefly are influences or controlled by the landscape of the
objective function.
The light intensity (I) varies with the distance r between fireflies and is denoted by the
following equations 3. 1 and 3. 2.
2γr0eIr)(I (3.1)
Inference
Engine
Defuzzifier Fuzzifier
Crisp Input Crisp Output
Knowledge
Base
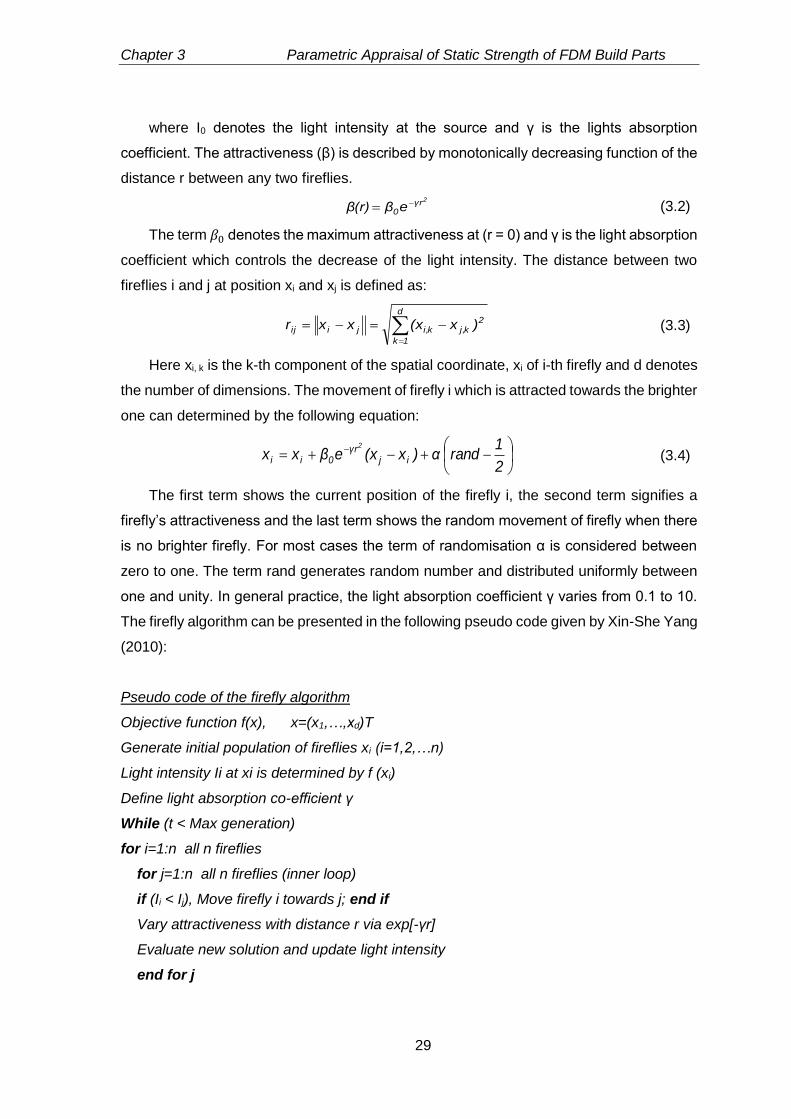
Chapter 3 Parametric Appraisal of Static Strength of FDM Build Parts
29
where I0 denotes the light intensity at the source and γ is the lights absorption
coefficient. The attractiveness (β) is described by monotonically decreasing function of the
distance r between any two fireflies.
2γr0eββ(r) (3.2)
The term 𝛽0 denotes the maximum attractiveness at (r = 0) and γ is the light absorption
coefficient which controls the decrease of the light intensity. The distance between two
fireflies i and j at position xi and xj is defined as:
d
1k
2kj,ki,jiij )x(xxxr (3.3)
Here xi, k is the k-th component of the spatial coordinate, xi of i-th firefly and d denotes
the number of dimensions. The movement of firefly i which is attracted towards the brighter
one can determined by the following equation:
2
1rand α)x(xeβxx ij
γr0ii
2
(3.4)
The first term shows the current position of the firefly i, the second term signifies a
firefly’s attractiveness and the last term shows the random movement of firefly when there
is no brighter firefly. For most cases the term of randomisation α is considered between
zero to one. The term rand generates random number and distributed uniformly between
one and unity. In general practice, the light absorption coefficient γ varies from 0.1 to 10.
The firefly algorithm can be presented in the following pseudo code given by Xin-She Yang
(2010):
Pseudo code of the firefly algorithm
Objective function f(x), x=(x1,…,xd)T
Generate initial population of fireflies xi (i=1,2,…n)
Light intensity Ii at xi is determined by f (xi)
Define light absorption co-efficient γ
While (t < Max generation)
for i=1:n all n fireflies
for j=1:n all n fireflies (inner loop)
if (Ii < Ij), Move firefly i towards j; end if
Vary attractiveness with distance r via exp[-γr]
Evaluate new solution and update light intensity
end for j

Chapter 3 Parametric Appraisal of Static Strength of FDM Build Parts
30
end for i
Rank the fireflies and find the current global best *g
End while
Post process results and visualisation
3.4. Genetic programming
The genetic programming (GP) is the most powerful tool used to predict the behaviour of
various processes and for formation empirical modelling. Normally, GP follows the process
of evolution in nature Darwin’s theory of ‘survival of the fittest’ to find out best solution to
assigned problem. The GP is known as the generalised form of genetic algorithm (GA)
and was extensively studied by Koza (1992). In GP, the model is represented as a
hierarchical tree structures of terminals and functions. A well-known implementation of GP
is in symbolic regression and is used to determine the mathematical expression for a given
set of variable and functions. The function are generated using Boolean operator (AND,
OR), nonlinear operators (sin, cos, tan, exp, tanh, log) and from basic mathematical
operators (+, -, / and ×). The fitness function is calculated as the error between the actual
value and the predicted value of the symbolic expressions. In GP individual terms are
randomly initialised and the population is progressed to find out the optimal solutions
through various operations such as reproduction, crossover and mutation. The
reproduction process produces children as an input to the next generation by replicating a
fraction of the parent selected by the current generation. Individuals having highest fitness
values in the population are selected as the parent and used for reproduction. Normally,
the crossover operation produces children by exchanging some parts of their selected
parents. The crossover operation is divided in to two types i.e. sub-tree crossover and
node crossover. However the sub-tree crossover has shown more significant effect than
the node crossover. Figure 3.2 shows the tree representation of a symbolic expression.
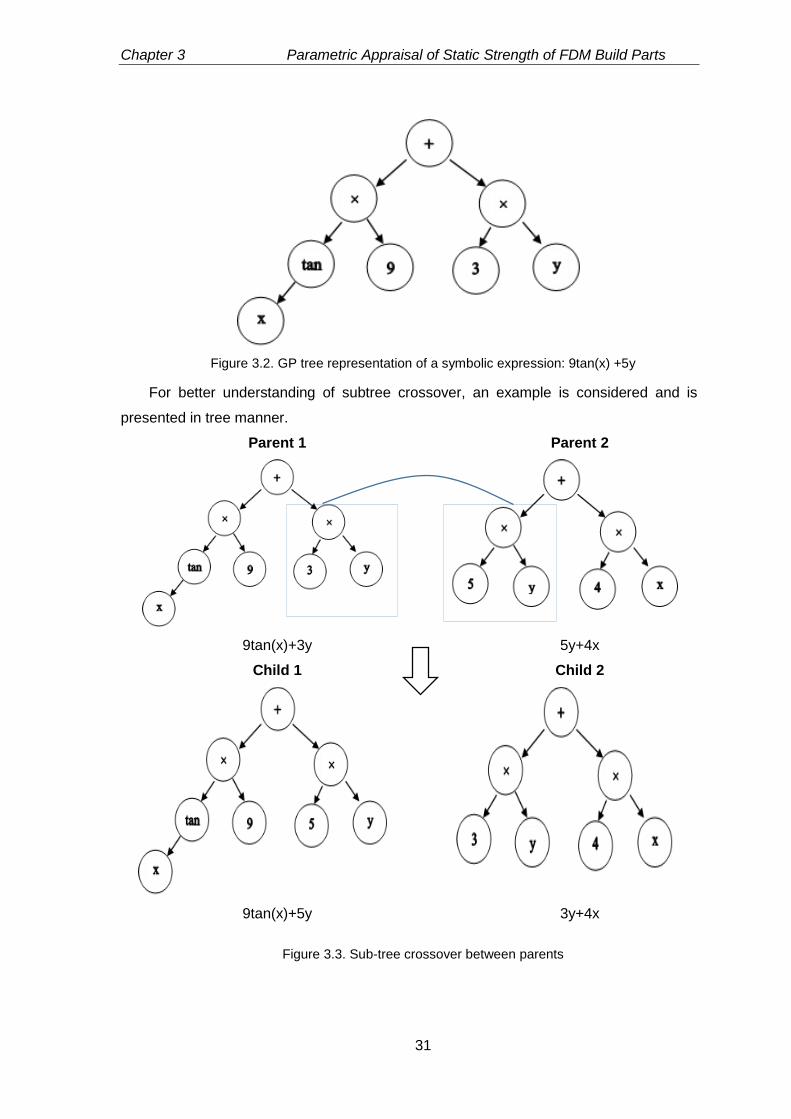
Chapter 3 Parametric Appraisal of Static Strength of FDM Build Parts
31
Figure 3.2. GP tree representation of a symbolic expression: 9tan(x) +5y
For better understanding of subtree crossover, an example is considered and is
presented in tree manner.
Parent 1
Parent 2
9tan(x)+3y 5y+4x
Child 1 Child 2
9tan(x)+5y 3y+4x
Figure 3.3. Sub-tree crossover between parents
Chapter 3 Parametric Appraisal of Static Strength of FDM Build Parts
32
In the present work GPTIPS was applied to perform a genetic programming for
prediction of fatigue life of the FDM build parts (Searson, 2009). Some application of
GPTIPS have been already successfully reported (Garg et al., 2014a; Garg et al., 2013;
Garg et al., 2014b; Baziar et al., 2011). The GPTIPS is an add-on code written based on
the multigene GP to compile with MATLAB 14. The mean absolute percentage error
(MAPE) between actual value and the GP value is used as a fitness function to evaluate
each individual of the population.
3.5. Least Square Support Vector Machine
The most widespread and advanced technique in the field of machine learning is support
vector machine (SVM). The SVM technique has been applied to regression problem known
as support vector regression (SVR). The SVR is an artificial intelligent tool based on
statistical learning process and have the ability to develop appropriately predictive models
from given set of data. In a given problem, the training data set is represented in the form
xi and yi where xi represents the input data, yi represents the output data and i=1, 2, 3…N.
The regression model can be generated using a nonlinear mapping function ϕ(x) and the
predictive model is given in equation 3.5.
b)x(wy T (3.5)
where w represents the weight vector and b is the bias term.
The least square vector machine (LS-SVM) is the advance version of the SVR because
the error is minimised through least square method. The LS-SVM technique uses quadratic
loss function for optimisation purpose whereas SVR uses the inequality constraint which
is facing difficulty for solving optimisation problems. Using the cost function (equation 3.6)
and constrained function (equation 3.7) the optimisation problems can be handled
smoothly (Tripathy et al., 2012).
N
1i
2i
T e2
1ww
2
1)e,w(Cmin
(3.6)
iiT eb)x(wy (i= 1, 2, 3…N.) (3.7)
where γ is the penalty factor and ei is the loss function also known as regression error.
The LS-SVM technique minimises the penalty regression error which is associated with
cost function and equality constraint function. The first part of the cost function known as
weight degeneration process mainly used to regularise the weight size and convert the
large weight in to fixed value. The second part known as the regression error for the
Chapter 3 Parametric Appraisal of Static Strength of FDM Build Parts
33
training data and regularisation parameter (γ). For solving the optimisation problem,
equation is converted into Lagrange function as given below (equation 3.8).
iiiT
1i
i
N
1i
2i
2yeb)X(Wew
2
1),e,b,w(L
(3.8)
where the term α represents the Lagrange multipliers. The term γ must be greater than
zero. The term αi and b can be calculated using Karush-Kuhn-Tucker (KKT) conditions.
For the nonlinear system, the LS-SVM model is converted to:
bx,xkb)x(.wy i
k
1i
ii
(3.9)
where k(xi, x)=ϕ(xi)T ϕ(x) represents the kernel function.
The kernel function plays a vital role in understanding of hyperspace from the training data
set. Among all kernel functions, radial basis function (RBF) is chosen for its advantage of
shorter training mechanism and high generalisation ability to the model. The mathematical
model of the RBF kernel function is represented in equation 3.10.
2SV
ji
ji
xxexpx,xK
(3.10)
where 2SV represents the square variation of the Gaussian function. This function should
be optimised by the user to get a support vector. For better generalisation of the model,
the tuning parameters such as α and γ should be selected very carefully. Using the
combination of coupled simulated annealing (CSA) and the grid search method (GSM),
the RBF parameters (α, γ) are estimated. All the codes are generated and run through
MATLAB 2014 software.
3.6. Experimental Details
The FDM modelling process is one of the wide appreciated technology that produces
prototypes from acrylonitrile butadiene styrene (ABS) plastic materials by putting semi
molten filaments one over another. The heated filaments ate extruded from the extrusion
nozzle as defined by the machine software (Insight 10. 2) in a layer wise manner. The semi
melted plastic material rapidly solidify to chamber temperature, which develops thermo
residual stress inside the build part. This thermo residual stress adversely affects the
mechanical strength of the build parts. The mechanical strength of the FDM parts is
significantly influenced by some process parameters, among them contour number along
with raster orientation, part orientation, layer thickness, air gap and raster width are
Chapter 3 Parametric Appraisal of Static Strength of FDM Build Parts
34
considered from experimental work. Some process parameters are kept constant such as
delta angle, part fill style, contour width, part interior style, shrinkage factor and perimeter
to raster air gap are kept constant. All the process parameters are defined as:
1. Contour Number: Number of offset contour or perimeter added during part building.
2. Raster Orientation: It is the angle between raster and x- axis of the build platform.
3. Part Orientation: Part building orientation refers to placing of the build part with respect
to the x, y. z axis of the building platform of the machine.
4. Layer Thickness: it is the thickness of the raster deposited from the extrusion nozzle.
5. Air Gap: This is the distance between two adjacent rasters in a layer.
6. Raster Width: The width of the raster deposited by the extrusion nozzle in a particular
layer.
7. Delta Angle: Delta angle refers to the angle of rotation of the raster fill pattern from the
previous raster fill pattern. By default, the raster angle alternates every layer based on
the delta angle.
8. Part Fill Style: it refers to the filling style of a model. It is of two type i.e. single contour/
rasters and multiple contours. In case of single contour / raster type, single perimeter is
present followed by filled rasters at the inner part. Multiple contours include part building
with the use of several perimeters.
Part Interior style: It defines the interior part filling pattern of the build part using
rasters.
Solid normal: The part is fully filled with rasters.
Sparse: Internal section of the part is filled with unidirectional rasters.
Sparse double dense: crisscross sparse structure are used to fill the internal
structure of the part. Utilises minimum material than the sparse filling style.
9. Sparse fill pattern: it defies the filling pattern of the build parts. Three types of fill
pattern are available i.e. hexagonal, porous hexagonal and saw tooth types.
10. Shrinkage factor: This is the shrinkage allowance applied in all direction such as x, y
and z axis during part building.
11. Perimeter to raster air gap: Air gap between inner perimeters to the primary raster
inside that perimeter is termed as perimeter to raster air gap.
The variation of delta angle with respect to its adjacent layer has a strong influence
over the anisotropic effect and bond strength between the rasters. The raster fill pattern
changes at an incremental angle of 30º to its previous raster fill angle as shown in Figure
3. 4. The delta angle is fixed at 300 throughout the study.
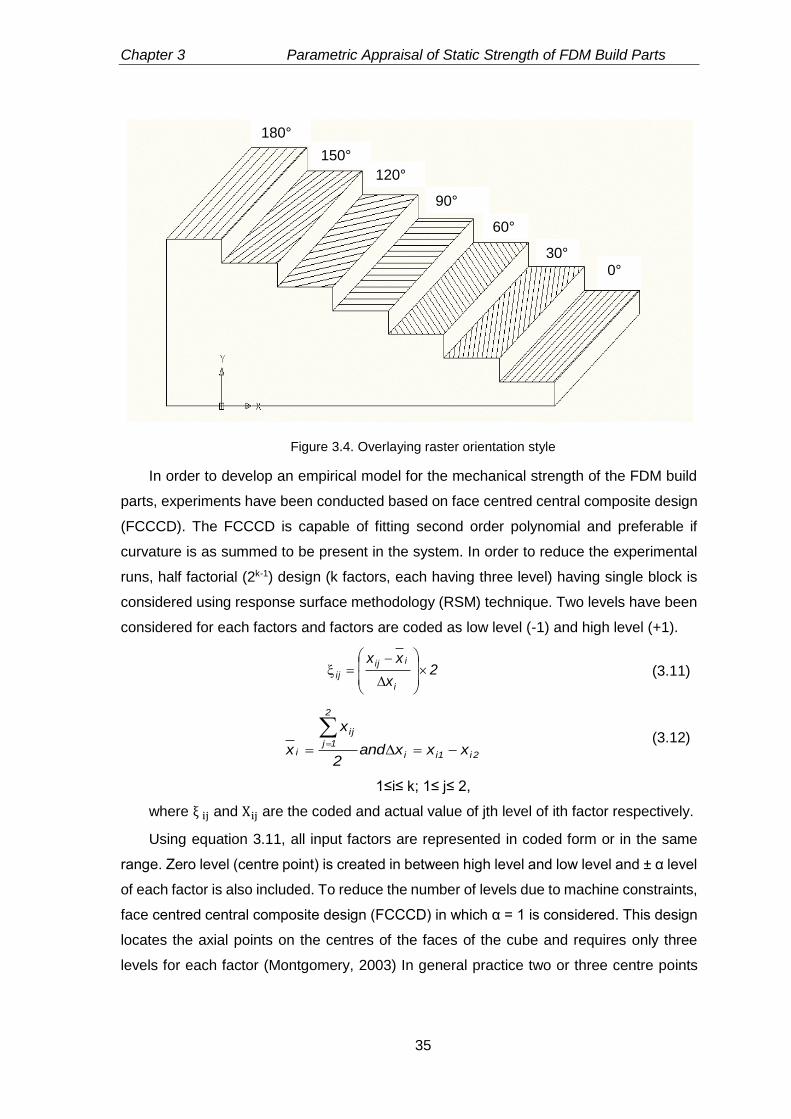
Chapter 3 Parametric Appraisal of Static Strength of FDM Build Parts
35
Figure 3.4. Overlaying raster orientation style
In order to develop an empirical model for the mechanical strength of the FDM build
parts, experiments have been conducted based on face centred central composite design
(FCCCD). The FCCCD is capable of fitting second order polynomial and preferable if
curvature is as summed to be present in the system. In order to reduce the experimental
runs, half factorial (2k-1) design (k factors, each having three level) having single block is
considered using response surface methodology (RSM) technique. Two levels have been
considered for each factors and factors are coded as low level (-1) and high level (+1).
2x
xx
i
iij
ij
(3.11)
2i1ii
2
1j
ij
i xxxand2
x
x
(3.12)
1≤i≤ k; 1≤ j≤ 2,
where ξ ij and Xij are the coded and actual value of jth level of ith factor respectively.
Using equation 3.11, all input factors are represented in coded form or in the same
range. Zero level (centre point) is created in between high level and low level and ± α level
of each factor is also included. To reduce the number of levels due to machine constraints,
face centred central composite design (FCCCD) in which α = 1 is considered. This design
locates the axial points on the centres of the faces of the cube and requires only three
levels for each factor (Montgomery, 2003) In general practice two or three centre points
0° 30°
120°
90°
60°
180°
150°
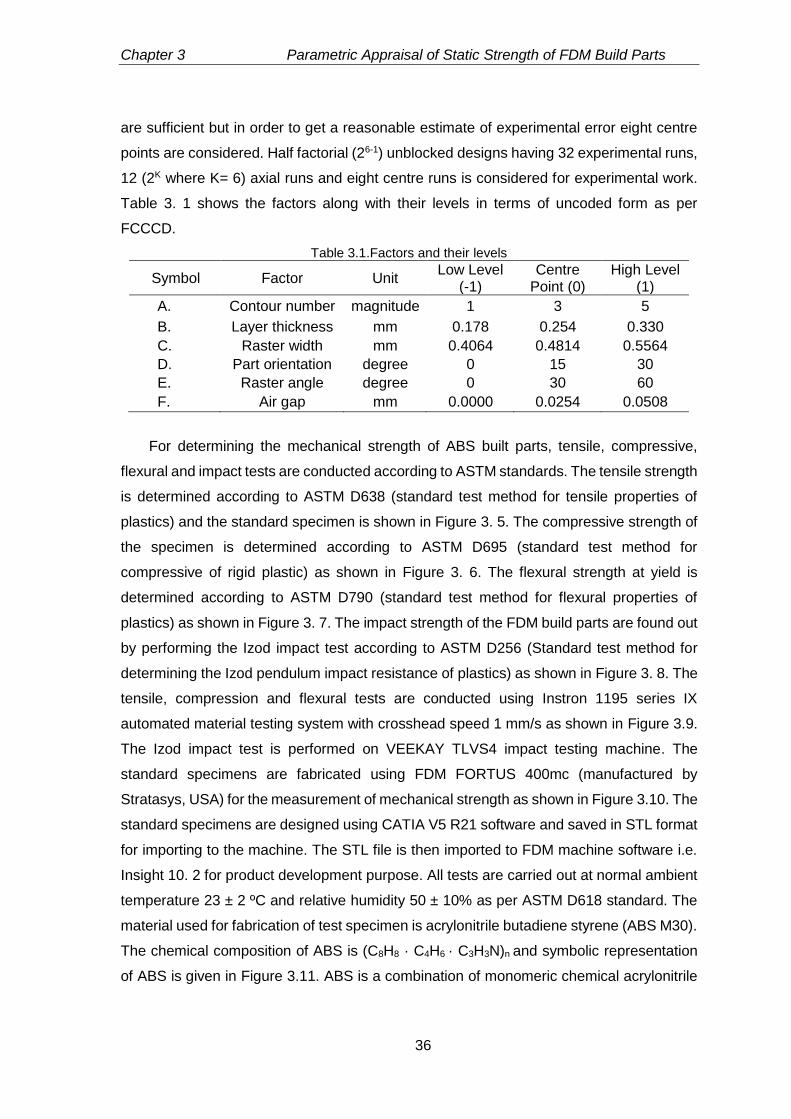
Chapter 3 Parametric Appraisal of Static Strength of FDM Build Parts
36
are sufficient but in order to get a reasonable estimate of experimental error eight centre
points are considered. Half factorial (26-1) unblocked designs having 32 experimental runs,
12 (2K where K= 6) axial runs and eight centre runs is considered for experimental work.
Table 3. 1 shows the factors along with their levels in terms of uncoded form as per
FCCCD.
Table 3.1.Factors and their levels
Symbol Factor Unit Low Level
(-1) Centre
Point (0) High Level
(1)
A. Contour number magnitude 1 3 5
B. Layer thickness mm 0.178 0.254 0.330
C. Raster width mm 0.4064 0.4814 0.5564
D. Part orientation degree 0 15 30
E. Raster angle degree 0 30 60
F. Air gap mm 0.0000 0.0254 0.0508
For determining the mechanical strength of ABS built parts, tensile, compressive,
flexural and impact tests are conducted according to ASTM standards. The tensile strength
is determined according to ASTM D638 (standard test method for tensile properties of
plastics) and the standard specimen is shown in Figure 3. 5. The compressive strength of
the specimen is determined according to ASTM D695 (standard test method for
compressive of rigid plastic) as shown in Figure 3. 6. The flexural strength at yield is
determined according to ASTM D790 (standard test method for flexural properties of
plastics) as shown in Figure 3. 7. The impact strength of the FDM build parts are found out
by performing the Izod impact test according to ASTM D256 (Standard test method for
determining the Izod pendulum impact resistance of plastics) as shown in Figure 3. 8. The
tensile, compression and flexural tests are conducted using Instron 1195 series IX
automated material testing system with crosshead speed 1 mm/s as shown in Figure 3.9.
The Izod impact test is performed on VEEKAY TLVS4 impact testing machine. The
standard specimens are fabricated using FDM FORTUS 400mc (manufactured by
Stratasys, USA) for the measurement of mechanical strength as shown in Figure 3.10. The
standard specimens are designed using CATIA V5 R21 software and saved in STL format
for importing to the machine. The STL file is then imported to FDM machine software i.e.
Insight 10. 2 for product development purpose. All tests are carried out at normal ambient
temperature 23 ± 2 ºC and relative humidity 50 ± 10% as per ASTM D618 standard. The
material used for fabrication of test specimen is acrylonitrile butadiene styrene (ABS M30).
The chemical composition of ABS is (C8H8 · C4H6 · C3H3N)n and symbolic representation
of ABS is given in Figure 3.11. ABS is a combination of monomeric chemical acrylonitrile
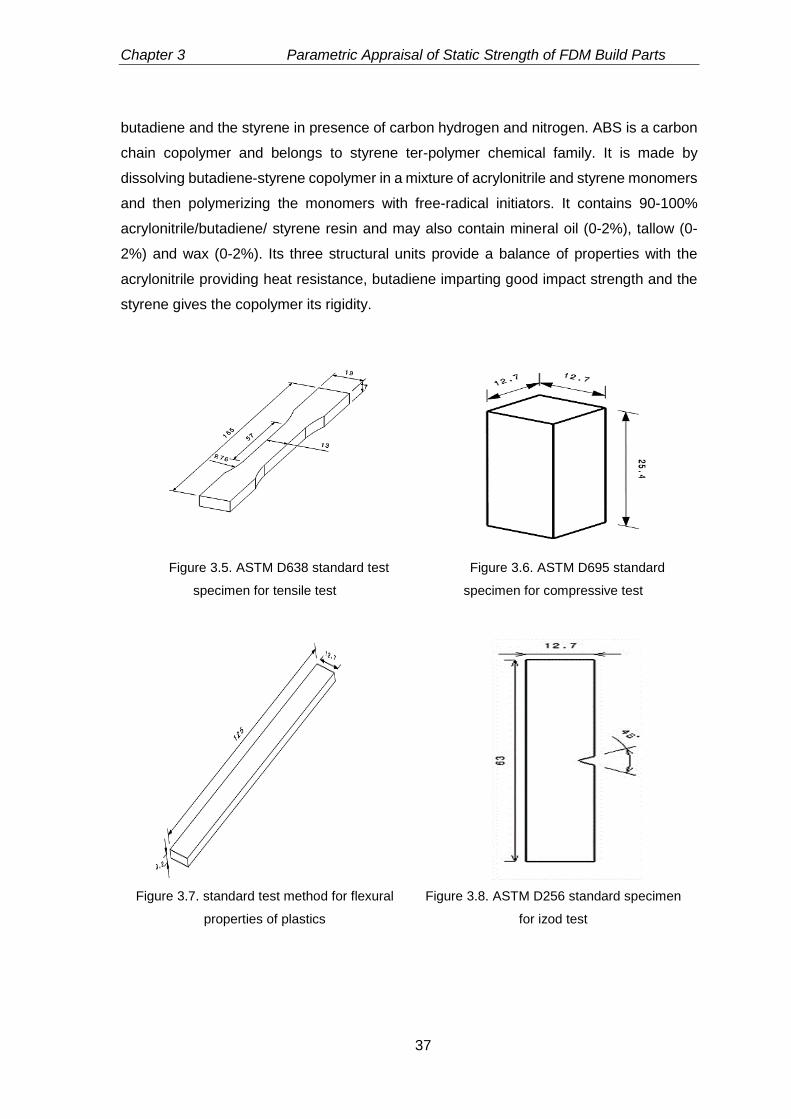
Chapter 3 Parametric Appraisal of Static Strength of FDM Build Parts
37
butadiene and the styrene in presence of carbon hydrogen and nitrogen. ABS is a carbon
chain copolymer and belongs to styrene ter-polymer chemical family. It is made by
dissolving butadiene-styrene copolymer in a mixture of acrylonitrile and styrene monomers
and then polymerizing the monomers with free-radical initiators. It contains 90-100%
acrylonitrile/butadiene/ styrene resin and may also contain mineral oil (0-2%), tallow (0-
2%) and wax (0-2%). Its three structural units provide a balance of properties with the
acrylonitrile providing heat resistance, butadiene imparting good impact strength and the
styrene gives the copolymer its rigidity.
Figure 3.5. ASTM D638 standard test
specimen for tensile test
Figure 3.6. ASTM D695 standard
specimen for compressive test
Figure 3.7. standard test method for flexural
properties of plastics
Figure 3.8. ASTM D256 standard specimen
for izod test
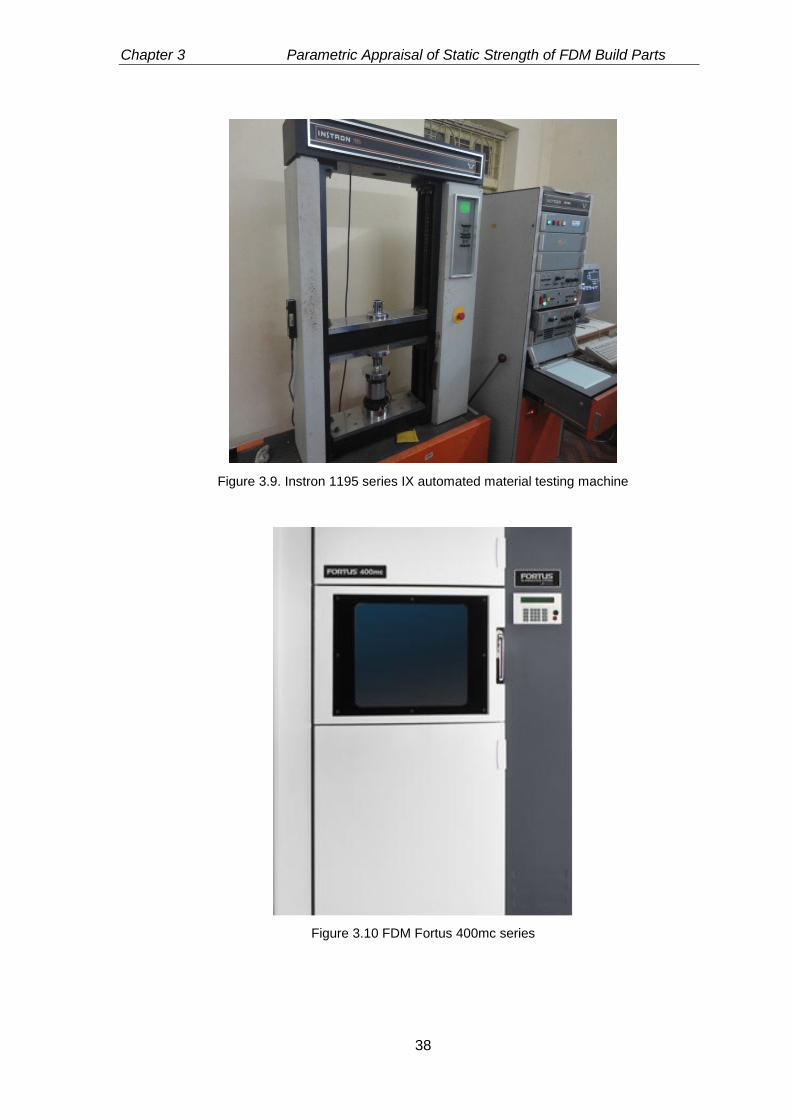
Chapter 3 Parametric Appraisal of Static Strength of FDM Build Parts
38
Figure 3.9. Instron 1195 series IX automated material testing machine
Figure 3.10 FDM Fortus 400mc series

Chapter 3 Parametric Appraisal of Static Strength of FDM Build Parts
39
Figure 3.11. Monomers in acrylonitrile butadiene styrene (ABS) plastic
Chapter 3 Parametric Appraisal of Static Strength of FDM Build Parts
40
3.7. Results and Discussion
For each experimental run, build parameters are set as per FCCCD design matrix and three specimens are prepared. Tests have been
conducted on the specimens and the average value for each run is listed in Table 3.2.
Table 3.2. Experimental results
Run Order
Factors in coded form Average Strengths
A B C D E F Tensile Strength
(MPa) Compressive
Strength (MPa) Flexural Strength
(MPa) Impact Strength (J/m)
1 -1.00 -1.00 -1.00 -1.00 -1.00 -1.00 25.90 98.41 56.634 243.438 2 +1.00 -1.00 -1.00 -1.00 -1.00 +1.00 23.70 21.57 50.728 350.000 3 -1.00 +1.00 -1.00 -1.00 -1.00 +1.00 20.41 95.34 52.618 301.250 4 +1.00 +1.00 -1.00 -1.00 -1.00 -1.00 31.30 93.75 65.933 321.250 5 -1.00 -1.00 +1.00 -1.00 -1.00 +1.00 20.63 89.12 35.492 031.563 6 1.00 -1.00 +1.00 -1.00 -1.00 -1.00 27.87 102.4 44.764 266.563 7 -1.00 1.00 +1.00 -1.00 -1.00 -1.00 26.58 91.14 52.024 169.063 8 +1.00 +1.00 +1.00 -1.00 -1.00 +1.00 25.12 67.47 46.949 402.188 9 -1.00 -1.00 -1.00 +1.00 -1.00 +1.00 14.43 66.73 23.681 176.250 10 1.00 -1.00 -1.00 +1.00 -1.00 -1.00 19.97 79.91 11.811 133.438 11 -1.00 +1.00 -1.00 +1.00 -1.00 -1.00 24.85 51.30 25.866 184.063 12 +1.00 +1.00 -1.00 +1.00 -1.00 +1.00 20.16 45.55 11.102 301.563 13 -1.00 -1.00 +1.00 +1.00 -1.00 -1.00 19.42 105.5 21.791 133.438 14 +1.00 -1.00 +1.00 +1.00 -1.00 +1.00 19.42 64.21 08.858 243.438 15 -1.00 +1.00 +1.00 +1.00 -1.00 +1.00 15.35 40.89 06.614 243.438 16 +1.00 +1.00 +1.00 +1.00 -1.00 -1.00 22.49 69.52 04.823 169.063 17 -1.00 -1.00 -1.00 -1.00 +1.00 +1.00 18.57 82.89 28.791 205.938 18 +1.00 -1.00 -1.00 -1.00 +1.00 -1.00 27.05 50.37 40.445 281.875 19 -1.00 +1.00 -1.00 -1.00 +1.00 -1.00 29.18 73.85 63.248 243.438 20 +1.00 +1.00 -1.00 -1.00 +1.00 +1.00 22.50 64.48 55.866 273.750 21 -1.00 -1.00 +1.00 -1.00 +1.00 -1.00 26.00 106.8 53.268 278.750
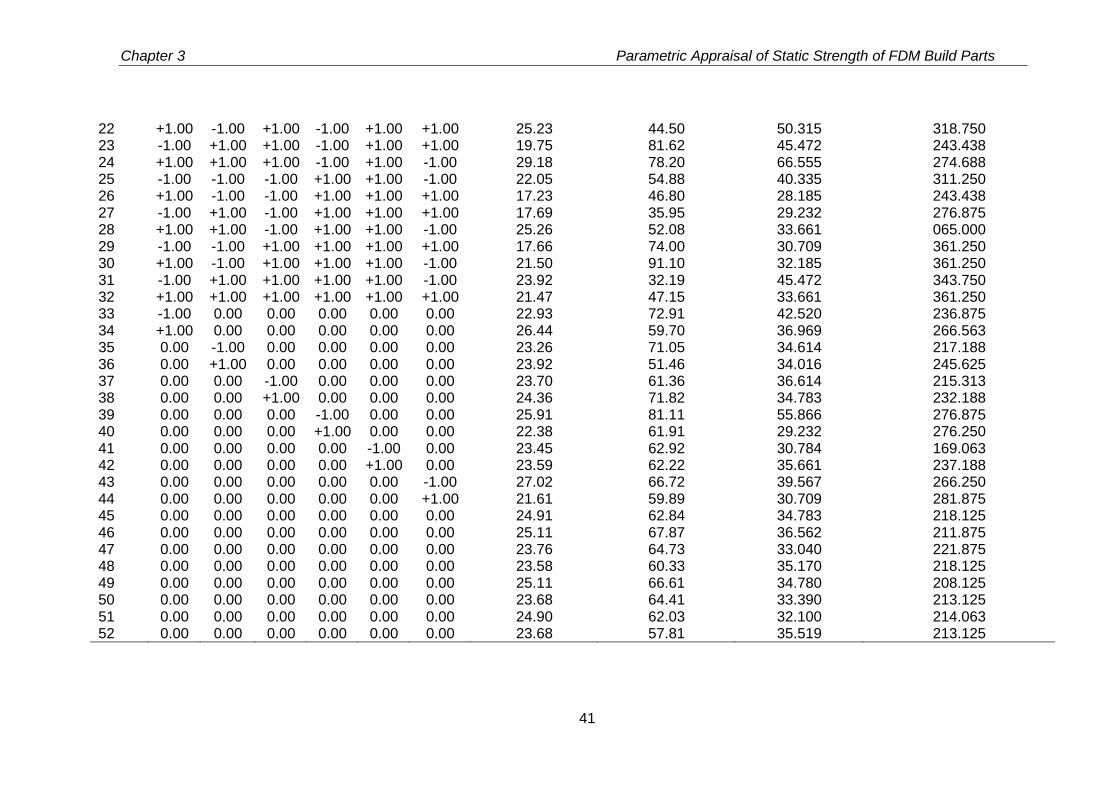
Chapter 3 Parametric Appraisal of Static Strength of FDM Build Parts
41
22 +1.00 -1.00 +1.00 -1.00 +1.00 +1.00 25.23 44.50 50.315 318.750 23 -1.00 +1.00 +1.00 -1.00 +1.00 +1.00 19.75 81.62 45.472 243.438 24 +1.00 +1.00 +1.00 -1.00 +1.00 -1.00 29.18 78.20 66.555 274.688 25 -1.00 -1.00 -1.00 +1.00 +1.00 -1.00 22.05 54.88 40.335 311.250 26 +1.00 -1.00 -1.00 +1.00 +1.00 +1.00 17.23 46.80 28.185 243.438 27 -1.00 +1.00 -1.00 +1.00 +1.00 +1.00 17.69 35.95 29.232 276.875 28 +1.00 +1.00 -1.00 +1.00 +1.00 -1.00 25.26 52.08 33.661 065.000 29 -1.00 -1.00 +1.00 +1.00 +1.00 +1.00 17.66 74.00 30.709 361.250 30 +1.00 -1.00 +1.00 +1.00 +1.00 -1.00 21.50 91.10 32.185 361.250 31 -1.00 +1.00 +1.00 +1.00 +1.00 -1.00 23.92 32.19 45.472 343.750 32 +1.00 +1.00 +1.00 +1.00 +1.00 +1.00 21.47 47.15 33.661 361.250 33 -1.00 0.00 0.00 0.00 0.00 0.00 22.93 72.91 42.520 236.875 34 +1.00 0.00 0.00 0.00 0.00 0.00 26.44 59.70 36.969 266.563 35 0.00 -1.00 0.00 0.00 0.00 0.00 23.26 71.05 34.614 217.188 36 0.00 +1.00 0.00 0.00 0.00 0.00 23.92 51.46 34.016 245.625 37 0.00 0.00 -1.00 0.00 0.00 0.00 23.70 61.36 36.614 215.313 38 0.00 0.00 +1.00 0.00 0.00 0.00 24.36 71.82 34.783 232.188 39 0.00 0.00 0.00 -1.00 0.00 0.00 25.91 81.11 55.866 276.875 40 0.00 0.00 0.00 +1.00 0.00 0.00 22.38 61.91 29.232 276.250 41 0.00 0.00 0.00 0.00 -1.00 0.00 23.45 62.92 30.784 169.063 42 0.00 0.00 0.00 0.00 +1.00 0.00 23.59 62.22 35.661 237.188 43 0.00 0.00 0.00 0.00 0.00 -1.00 27.02 66.72 39.567 266.250 44 0.00 0.00 0.00 0.00 0.00 +1.00 21.61 59.89 30.709 281.875 45 0.00 0.00 0.00 0.00 0.00 0.00 24.91 62.84 34.783 218.125 46 0.00 0.00 0.00 0.00 0.00 0.00 25.11 67.87 36.562 211.875 47 0.00 0.00 0.00 0.00 0.00 0.00 23.76 64.73 33.040 221.875 48 0.00 0.00 0.00 0.00 0.00 0.00 23.58 60.33 35.170 218.125 49 0.00 0.00 0.00 0.00 0.00 0.00 25.11 66.61 34.780 208.125 50 0.00 0.00 0.00 0.00 0.00 0.00 23.68 64.41 33.390 213.125 51 0.00 0.00 0.00 0.00 0.00 0.00 24.90 62.03 32.100 214.063 52 0.00 0.00 0.00 0.00 0.00 0.00 23.68 57.81 35.519 213.125
Chapter 3 Parametric Appraisal of Static Strength of FDM Build Parts
42
Due to the complexity of the problem, a full quadratic model is attempted for suitably
explaining the performance measures like tensile, compressive, flexural and impact
strength. In this present context, experimental data obtained using FCCCD design runs
are fitted with following empirical model (equation 3.13):
jiji ii2
i
k
1i iii
k
1i i0 xxxxy (3.13)
where y is the performance measure and xi and xj are ith and jth factor respectively, k
is the total number of factors. In the analysis of variance (ANOVA) table, the terms which
have the P value less than 0.05 are considered as the significance parameters with 95%
confidence level.
To analyse the effect of contour number on the tensile strength of FDM built parts, two
new experimental run sets are considered having contour numbers 1 and 5 keeping other
process parameters at their fixed level. The experimental results are shown in Table 3. 3.
Table 3.3. Effect of contour number on tensile strength of FDM parts
Set No.
A B C D E F Avg. Tensile strength (MPa)
1. 1 0.178 0.4064 0 0 0 25.67
2. 5 0.178 0.4064 0 0 0 28.95
It is evident from Table 3. 3 that addition of contour numbers to the specimen shifts
the stress concentration zone towards the centre avoiding premature failure resulting in
increase of strength due to uniform distribution of stress. The strength of the FDM built
parts increases by 12.7% by addition of external perimeter to the specimen.
The effect of delta angle which plays a vital role in determining the anisotropic property
of the built parts is studied. Generally, FDM build parts show anisotropic properties due to
the raster fill pattern style in neighbouring layers. An attempt is made to decrease the
anisotropic effect of the FDM build parts by changing the raster fill pattern style one over
another. Previously some researchers (Ahn et al., 2002; Es Said et al., 2000; Rayegani et
al., 2014; Lee et al., 2007; Sood et al., 2010; Wang et al., 2007) have focused on the study
of the effect of raster orientation on the FDM build parts but no such experiments are
conducted to decrease the anisotropic effect. The delta angle i.e. the angle between
rasters in adjacent layers is modified and the effect is studied experimentally. The
experimental investigation is given below in Table 3. 4 It is observed that change of delta
angle to 300 (Figure 3. 4) from normal criss-cross pattern of delta angle of 900 causes an
increase of 15% in average tensile strength due to enhancement of interlayer bond quality.
Chapter 3 Parametric Appraisal of Static Strength of FDM Build Parts
43
Table 3.4. Effect of delta angle on tensile strength
Set No.
A B C D E F Delta angle
Avg. Tensile strength (MPa)
1. 1 0.178 0.4064 0 0 0 30 25.67
2. 1 0.178 0.4064 0 0 0 90 22.25
In analysis of variance (ANOVA) table shown in Table 3. 5, the significant terms
influencing the tensile strength of the FDM built parts can be identified at significance level
of 0.05. However, raster width (C) is not a significant parameters but its interaction with
other parameters exhibits significant influence. The coefficient of determination (R2), which
indicates the percentage of variation explained by the terms in the model to the total
variation in the response is 0.9818 for tensile strength. It is to be noted from the table that
lack of fit is not significant. Residual analysis has been carried out and found that residuals
are normally distributed Figure 3. 12. The model for tensile strength involving important
terms is shown in equation 3.14.
Tensile Strength = 11.12055-0.34022×A+131.87162×B+6.47730×C-
0.24266×D+4.48923e-03×E-234.63368×F+
1.850×A×C-0.013333×A×D-4.09375e-003×A×E+
14.53002×A×F-9.47368 ×B×C+0.28618×B×D-
282.00114×B×F+ 0.12528 ×C×E+304.13386
×C×F+1.02361e-03×D× E+0.91043×D×F-
146.87624 × B2 -1.02040e-03×E2 (uncoded
form) (3.14)
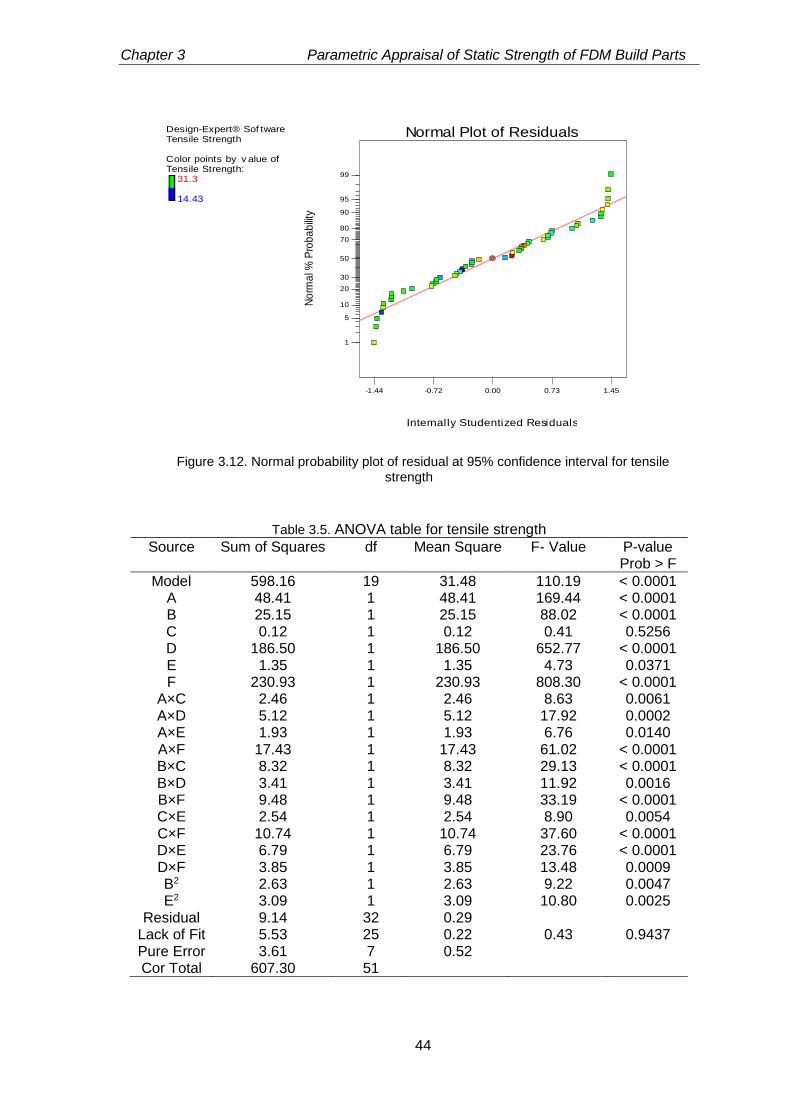
Chapter 3 Parametric Appraisal of Static Strength of FDM Build Parts
44
Figure 3.12. Normal probability plot of residual at 95% confidence interval for tensile strength
Table 3.5. ANOVA table for tensile strength
Source Sum of Squares df Mean Square F- Value P-value Prob > F
Model 598.16 19 31.48 110.19 < 0.0001 A 48.41 1 48.41 169.44 < 0.0001 B 25.15 1 25.15 88.02 < 0.0001 C 0.12 1 0.12 0.41 0.5256 D 186.50 1 186.50 652.77 < 0.0001 E 1.35 1 1.35 4.73 0.0371 F 230.93 1 230.93 808.30 < 0.0001
A×C 2.46 1 2.46 8.63 0.0061 A×D 5.12 1 5.12 17.92 0.0002 A×E 1.93 1 1.93 6.76 0.0140 A×F 17.43 1 17.43 61.02 < 0.0001 B×C 8.32 1 8.32 29.13 < 0.0001 B×D 3.41 1 3.41 11.92 0.0016 B×F 9.48 1 9.48 33.19 < 0.0001 C×E 2.54 1 2.54 8.90 0.0054 C×F 10.74 1 10.74 37.60 < 0.0001 D×E 6.79 1 6.79 23.76 < 0.0001 D×F 3.85 1 3.85 13.48 0.0009 B2 2.63 1 2.63 9.22 0.0047 E2 3.09 1 3.09 10.80 0.0025
Residual 9.14 32 0.29 Lack of Fit 5.53 25 0.22 0.43 0.9437 Pure Error 3.61 7 0.52 Cor Total 607.30 51
Design-Expert® Sof twareTensile Strength
Color points by v alue ofTensile Strength:
31.3
14.43
Internally Studentized Residuals
No
rma
l % P
rob
ab
ility
Normal Plot of Residuals
-1.44 -0.72 0.00 0.73 1.45
1
5
10
20
30
50
70
80
90
95
99

Chapter 3 Parametric Appraisal of Static Strength of FDM Build Parts
45
From response surface plots (Figure 3.13 T1-T5), it is observed that the tensile
strength increases with increase in contour number (A) because increasing the contour
number or offset contours in the build parts shifts the stress concentration zone towards
the centre. In tensile loading, specimen fails prematurely due to shearing at stress
concentration zone (Ahn et al., 2002). Therefore, shifting of stress concentration towards
the centre of the part diminishes the chance of failure at the edge. Past research suggests
that increasing the number of contours deposited around the specimen edge, both tensile
strength and stiffness of the specimen increase (Croccolo et al., 2013). Figure 3. 13 T1,
T6, T7 and T8 reveals that tensile strength increases as layer thickness (B) increases.
Increase of layer thickness causes decrease in number of layers required for building the
part. Consequently, it results in less number of interlayer bonds. As the strength of
interlayer bonding depends on variations in the convective heat transfer coefficient and
cooling temperature profile inside the chamber, less number of interlayer bonds is
subjected to variations causing improvement in part strength. Figure 3. 13 T3 indicates
that increase in part orientation angle (D) causes decrease in part strength. In fact,
increase in part orientation angle results in increase in number of layers required for part
building and subjected exposure to more heating-cooling cycles. As a result, the strength
of the part decreases. Figure 3. 13 T5 and T8 shows that increase in air gap between
rasters reduces the strength of the build parts due to voids and pores are resulted among
layers. The voids and pores adversely influence the bond quality causing in decrease in
strength. Zero air gap (rasters are just in contact with each other) exhibits good strength
than that of any positive value of air gap.
Design-Expert® Sof tware
Tensile Strength31.3
14.43
X1 = A: AX2 = C: C
Actual FactorsB: B = 0.25D: D = 15.00E: E = 30.00F: F = 0.03
1.00
2.00
3.00
4.00
5.00
0.41
0.44
0.48
0.52
0.56
22.9
23.8
24.7
25.6
26.5
T
ensile
Str
eng
th
A: A C: C
Design-Expert® Sof tware
Tensile Strength31.3
14.43
X1 = A: AX2 = B: B
Actual FactorsC: C = 0.48D: D = 15.00E: E = 30.00F: F = 0.03
1.00
2.00
3.00
4.00
5.00
0.18
0.22
0.25
0.29
0.33
21.9
23.05
24.2
25.35
26.5
T
ensile S
trength
A: A B: B T1 T2

Chapter 3 Parametric Appraisal of Static Strength of FDM Build Parts
46
Figure 3.13. Surface plot for tensile strength
From the scanning electron microscope (SEM) micrograph (JEOL JSM-6480LV in the
LV mode) shown in Figure 3. 14, it can be clearly seen that the failure of the specimens
Design-Expert® Sof tware
Tensile Strength31.3
14.43
X1 = B: BX2 = E: E
Actual FactorsA: A = 3.00C: C = 0.48D: D = 15.00F: F = 0.03
0.18
0.22
0.25
0.29
0.33 0.00
15.00
30.00
45.00
60.00
21.6
22.525
23.45
24.375
25.3
T
ensile
Str
eng
th
B: B E: E
Design-Expert® Sof tware
Tensile Strength31.3
14.43
X1 = A: AX2 = F: F
Actual FactorsB: B = 0.25C: C = 0.48D: D = 15.00E: E = 30.00
1.00
2.00
3.00
4.00
5.00 0.00
0.01
0.03
0.04
0.05
20.1
22.025
23.95
25.875
27.8
T
ensile
Str
eng
th
A: A F: F
Design-Expert® Sof tware
Tensile Strength31.3
14.43
X1 = A: AX2 = D: D
Actual FactorsB: B = 0.25C: C = 0.48E: E = 30.00F: F = 0.03
1.00
2.00
3.00
4.00
5.00 0.00
7.50
15.00
22.50
30.00
21.3
23.1
24.9
26.7
28.5
T
ensile
Str
eng
th
A: A D: D
Design-Expert® Sof tware
Tensile Strength31.3
14.43
X1 = B: BX2 = C: C
Actual FactorsA: A = 3.00D: D = 15.00E: E = 30.00F: F = 0.03
0.18
0.22
0.25
0.29
0.33
0.41
0.44
0.48
0.52
0.56
21.8
22.675
23.55
24.425
25.3
T
ensile S
trength
B: B C: C
Design-Expert® Sof tware
Tensile Strength31.3
14.43
X1 = B: BX2 = F: F
Actual FactorsA: A = 3.00C: C = 0.48D: D = 15.00E: E = 30.00
0.18 0.22
0.25 0.29
0.33 0.00 0.01
0.03 0.04
0.05
20.6
22.35
24.1
25.85
27.6
T
ensile
Str
eng
th
B: B F: F
Design-Expert® Sof tware
Tensile Strength31.3
14.43
X1 = A: AX2 = E: E
Actual FactorsB: B = 0.25C: C = 0.48D: D = 15.00F: F = 0.03
1.00
2.00
3.00
4.00
5.00
0.00
15.00
30.00
45.00
60.00
22.2
23.275
24.35
25.425
26.5
T
ensile S
trength
A: A
E: E
T3 T4
T6 T5
T7
T8
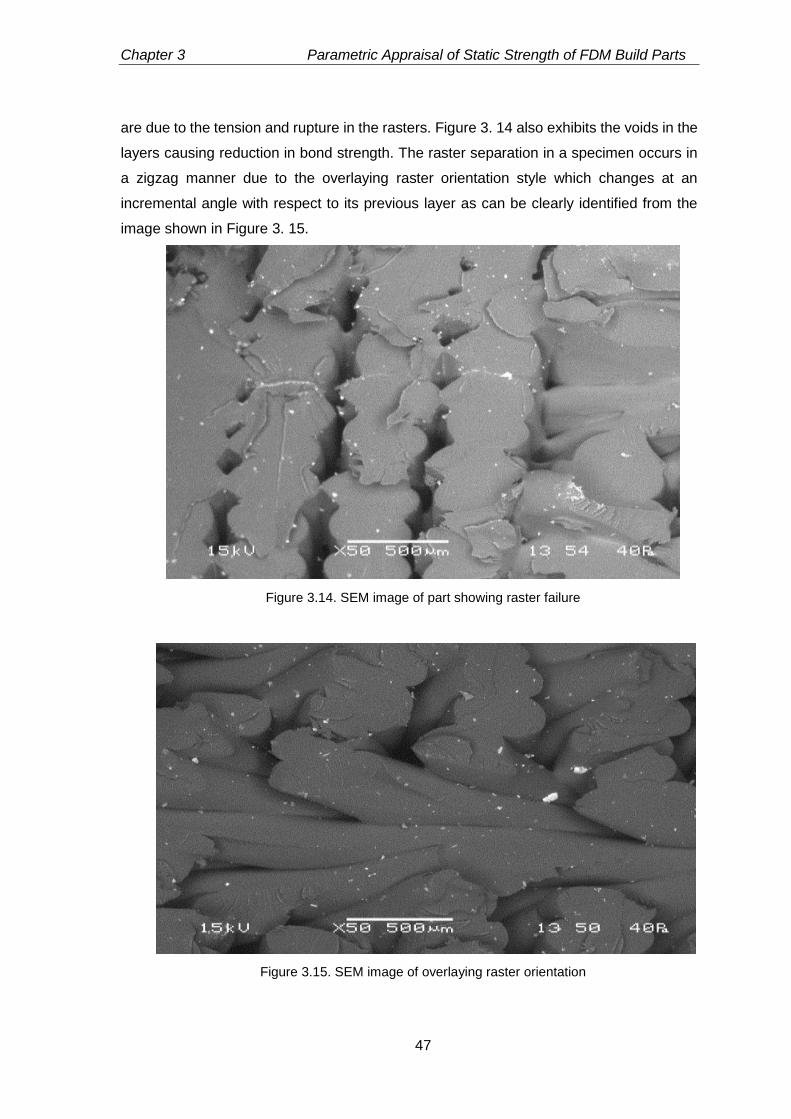
Chapter 3 Parametric Appraisal of Static Strength of FDM Build Parts
47
are due to the tension and rupture in the rasters. Figure 3. 14 also exhibits the voids in the
layers causing reduction in bond strength. The raster separation in a specimen occurs in
a zigzag manner due to the overlaying raster orientation style which changes at an
incremental angle with respect to its previous layer as can be clearly identified from the
image shown in Figure 3. 15.
Figure 3.14. SEM image of part showing raster failure
Figure 3.15. SEM image of overlaying raster orientation
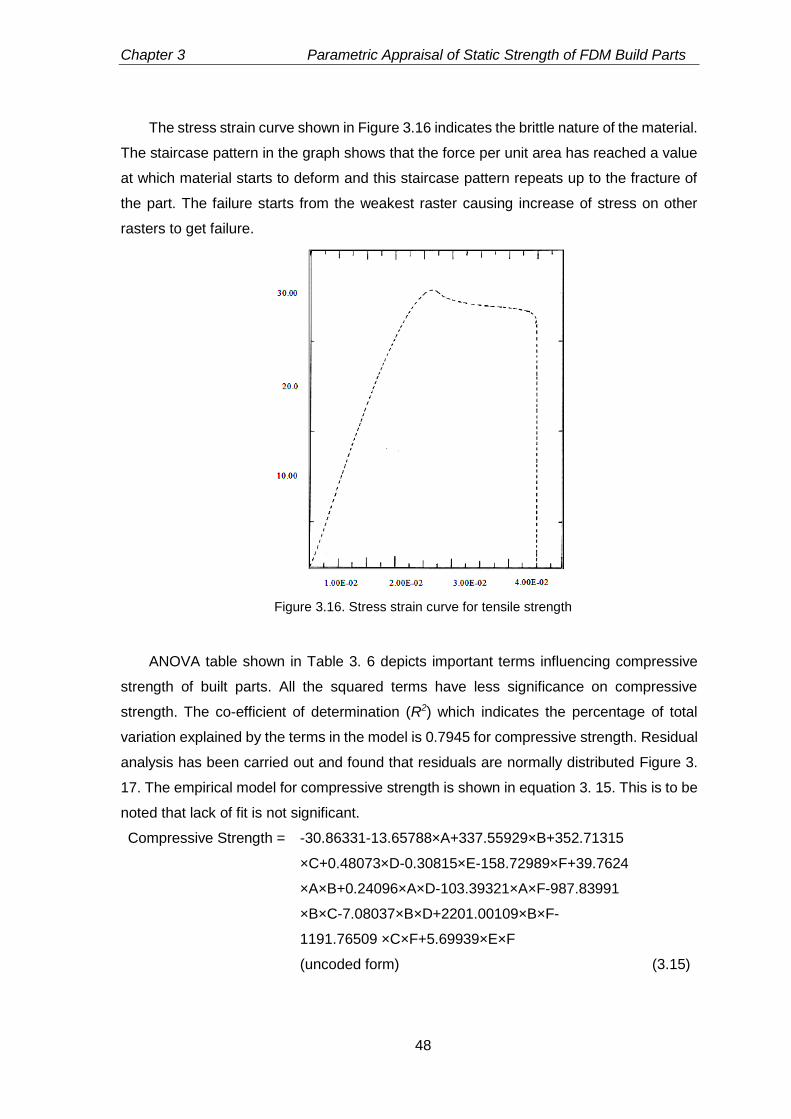
Chapter 3 Parametric Appraisal of Static Strength of FDM Build Parts
48
The stress strain curve shown in Figure 3.16 indicates the brittle nature of the material.
The staircase pattern in the graph shows that the force per unit area has reached a value
at which material starts to deform and this staircase pattern repeats up to the fracture of
the part. The failure starts from the weakest raster causing increase of stress on other
rasters to get failure.
Figure 3.16. Stress strain curve for tensile strength
ANOVA table shown in Table 3. 6 depicts important terms influencing compressive
strength of built parts. All the squared terms have less significance on compressive
strength. The co-efficient of determination (R2) which indicates the percentage of total
variation explained by the terms in the model is 0.7945 for compressive strength. Residual
analysis has been carried out and found that residuals are normally distributed Figure 3.
17. The empirical model for compressive strength is shown in equation 3. 15. This is to be
noted that lack of fit is not significant.
Compressive Strength = -30.86331-13.65788×A+337.55929×B+352.71315
×C+0.48073×D-0.30815×E-158.72989×F+39.7624
×A×B+0.24096×A×D-103.39321×A×F-987.83991
×B×C-7.08037×B×D+2201.00109×B×F-
1191.76509 ×C×F+5.69939×E×F
(uncoded form) (3.15)
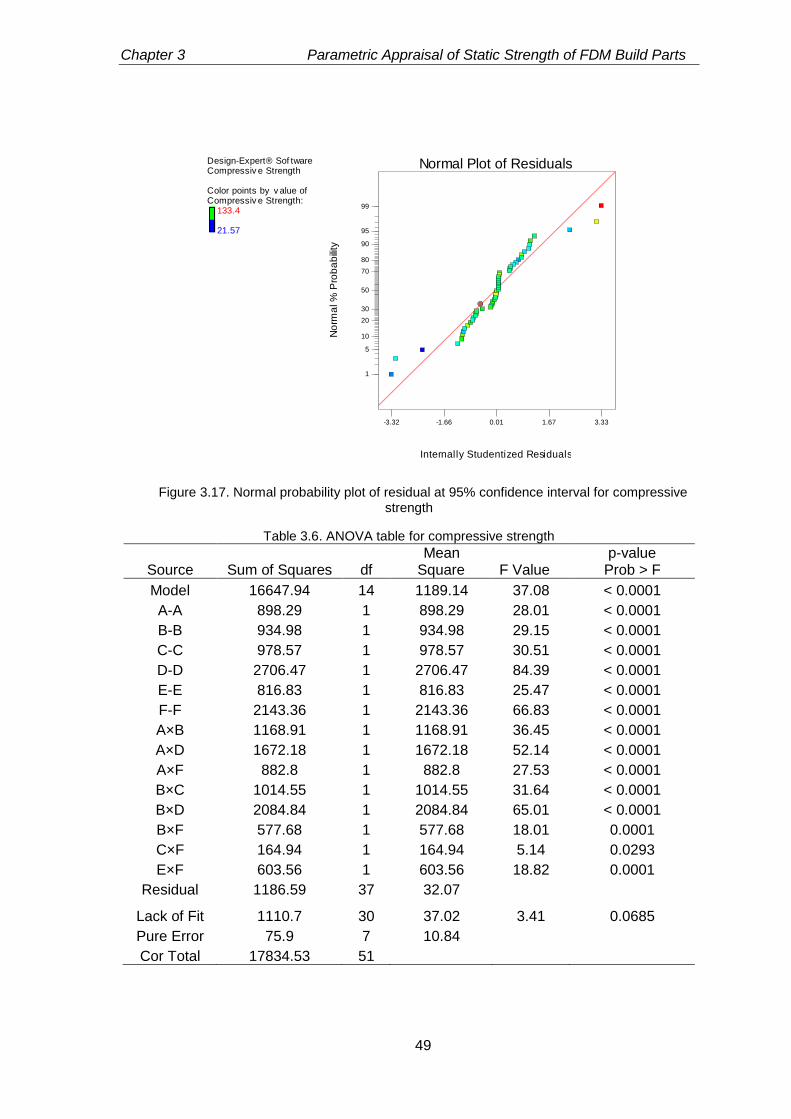
Chapter 3 Parametric Appraisal of Static Strength of FDM Build Parts
49
Figure 3.17. Normal probability plot of residual at 95% confidence interval for compressive strength
Table 3.6. ANOVA table for compressive strength
Source Sum of Squares df Mean
Square F Value p-value
Prob > F
Model 16647.94 14 1189.14 37.08 < 0.0001
A-A 898.29 1 898.29 28.01 < 0.0001
B-B 934.98 1 934.98 29.15 < 0.0001
C-C 978.57 1 978.57 30.51 < 0.0001
D-D 2706.47 1 2706.47 84.39 < 0.0001
E-E 816.83 1 816.83 25.47 < 0.0001
F-F 2143.36 1 2143.36 66.83 < 0.0001
A×B 1168.91 1 1168.91 36.45 < 0.0001
A×D 1672.18 1 1672.18 52.14 < 0.0001
A×F 882.8 1 882.8 27.53 < 0.0001
B×C 1014.55 1 1014.55 31.64 < 0.0001
B×D 2084.84 1 2084.84 65.01 < 0.0001
B×F 577.68 1 577.68 18.01 0.0001
C×F 164.94 1 164.94 5.14 0.0293
E×F 603.56 1 603.56 18.82 0.0001
Residual 1186.59 37 32.07
Lack of Fit 1110.7 30 37.02 3.41 0.0685
Pure Error 75.9 7 10.84
Cor Total 17834.53 51
Design-Expert® Sof twareCompressiv e Strength
Color points by v alue ofCompressiv e Strength:
133.4
21.57
Internally Studentized Residuals
No
rma
l %
Pro
ba
bili
ty
Normal Plot of Residuals
-3.32 -1.66 0.01 1.67 3.33
1
5
10
20
30
50
70
80
90
95
99
Chapter 3 Parametric Appraisal of Static Strength of FDM Build Parts
50
The effect of part orientation (D) and air gap (F) have similar effect on compressive
strength as on tensile strength. As contour number increases, compressive strength of the
specimen also increases but its influence on compressive strength seems to be less as
compared to tensile strength (Figure 3.18 T2 and 3.18 C1). The part orientation adversely
affects the compressive strength because increase in part orientation increases the
chance of shear failure between the rasters in adjacent layers (Lee et al., 2007). Hence,
with an increase in part orientation (D), the compressive strength decreases (Figure 3.18
C1, C3 and C5). Decrease in the raster width increases the number of rasters in a layer
which increases the involvement of rapid heating and cooling cycle producing distortions
effect (Bellehumeue et al., 2008) Hence, with the increase in raster width (C) increases
the compressive strength with involvement of less distortion effect (Figure 3.18 C2).
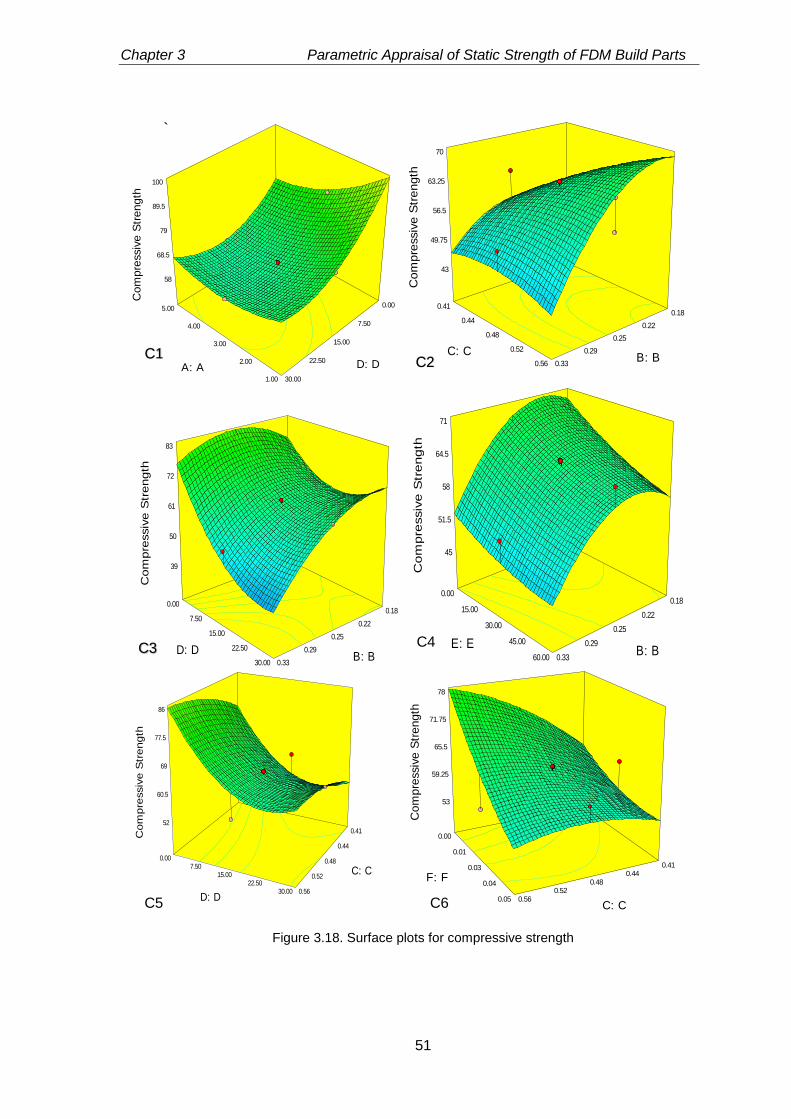
Chapter 3 Parametric Appraisal of Static Strength of FDM Build Parts
51
`
Figure 3.18. Surface plots for compressive strength
Design-Expert® Sof tware
Compressiv e Strength133.4
21.57
X1 = C: CX2 = F: F
Actual FactorsA: A = 3.00B: B = 0.25D: D = 15.00E: E = 30.00
0.41 0.44
0.48 0.52
0.56
0.00
0.01
0.03
0.04
0.05
53
59.25
65.5
71.75
78
C
om
pre
ssiv
e S
tre
ng
th
C: C
F: F
Design-Expert® Sof tware
Compressiv e Strength133.4
21.57
X1 = C: CX2 = D: D
Actual FactorsA: A = 3.00B: B = 0.25E: E = 30.00F: F = 0.03
0.41
0.44
0.48
0.52
0.56
0.00 7.50
15.00 22.50
30.00
52
60.5
69
77.5
86
C
om
pre
ssiv
e S
tre
ng
th
C: C
D: D
Design-Expert® Sof tware
Compressiv e Strength133.4
21.57
X1 = B: BX2 = E: E
Actual FactorsA: A = 3.00C: C = 0.48D: D = 15.00F: F = 0.03
0.18
0.22
0.25
0.29
0.33
0.00
15.00
30.00
45.00
60.00
45
51.5
58
64.5
71
Co
mp
ressiv
e S
tre
ng
th
B: B E: E
Design-Expert® Sof tware
Compressiv e Strength133.4
21.57
X1 = B: BX2 = D: D
Actual FactorsA: A = 3.00C: C = 0.48E: E = 30.00F: F = 0.03
0.18
0.22
0.25
0.29
0.33
0.00
7.50
15.00
22.50
30.00
39
50
61
72
83
C
om
pre
ssiv
e S
tre
ng
th
B: B D: D
Design-Expert® Sof tware
Compressiv e Strength133.4
21.57
X1 = B: BX2 = C: C
Actual FactorsA: A = 3.00D: D = 15.00E: E = 30.00F: F = 0.03
0.18
0.22
0.25
0.29
0.33
0.41
0.44
0.48
0.52
0.56
43
49.75
56.5
63.25
70
C
om
pre
ssiv
e S
trength
B: B C: C
Design-Expert® Sof tware
Compressiv e Strength133.4
21.57
X1 = A: AX2 = D: D
Actual FactorsB: B = 0.25C: C = 0.48E: E = 30.00F: F = 0.03
1.00
2.00
3.00
4.00
5.00 0.00
7.50
15.00
22.50
30.00
58
68.5
79
89.5
100
C
om
pre
ssiv
e S
trength
A: A D: D
C3 C4
C5 C6
C1 C2
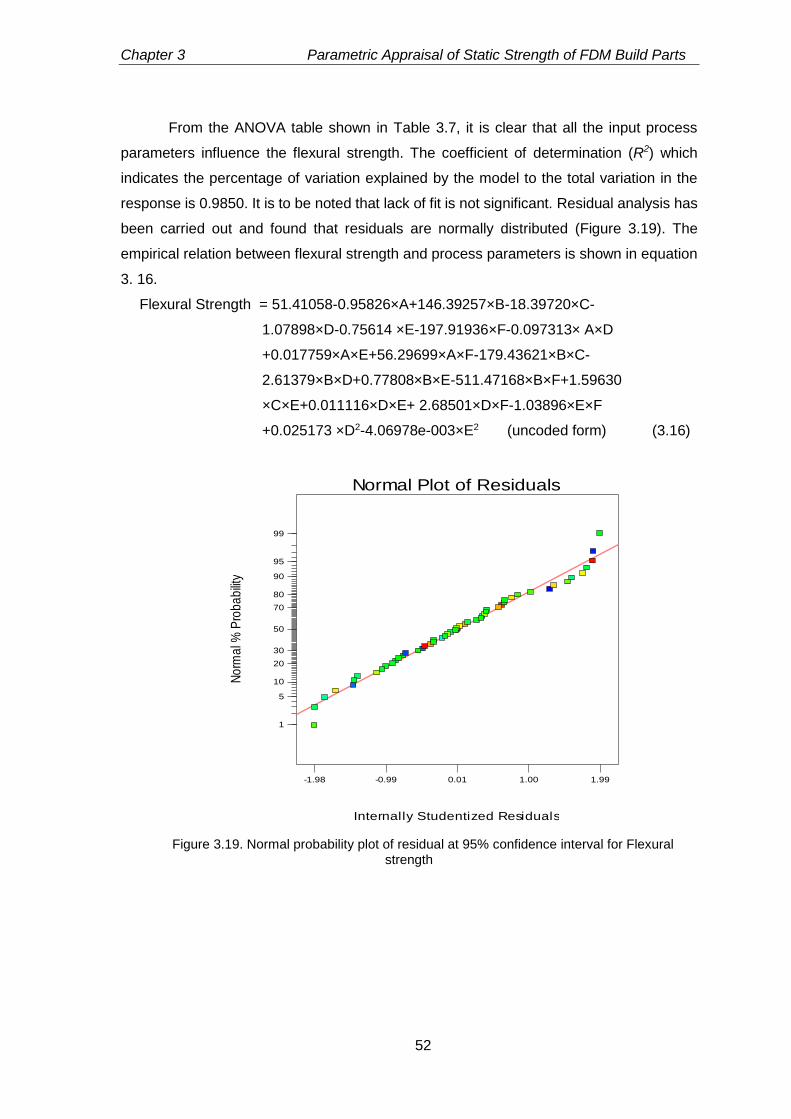
Chapter 3 Parametric Appraisal of Static Strength of FDM Build Parts
52
From the ANOVA table shown in Table 3.7, it is clear that all the input process
parameters influence the flexural strength. The coefficient of determination (R2) which
indicates the percentage of variation explained by the model to the total variation in the
response is 0.9850. It is to be noted that lack of fit is not significant. Residual analysis has
been carried out and found that residuals are normally distributed (Figure 3.19). The
empirical relation between flexural strength and process parameters is shown in equation
3. 16.
Flexural Strength = 51.41058-0.95826×A+146.39257×B-18.39720×C-
1.07898×D-0.75614 ×E-197.91936×F-0.097313× A×D
+0.017759×A×E+56.29699×A×F-179.43621×B×C-
2.61379×B×D+0.77808×B×E-511.47168×B×F+1.59630
×C×E+0.011116×D×E+ 2.68501×D×F-1.03896×E×F
+0.025173 ×D2-4.06978e-003×E2 (uncoded form) (3.16)
Figure 3.19. Normal probability plot of residual at 95% confidence interval for Flexural strength
Design-Expert® Sof twareFlexural Strength
Color points by v alue ofFlexural Strength:
66.5551
4.8228
Internally Studentized Residuals
No
rma
l % P
rob
ab
ility
Normal Plot of Residuals
-1.98 -0.99 0.01 1.00 1.99
1
5
10
20
30
50
70
80
90
95
99
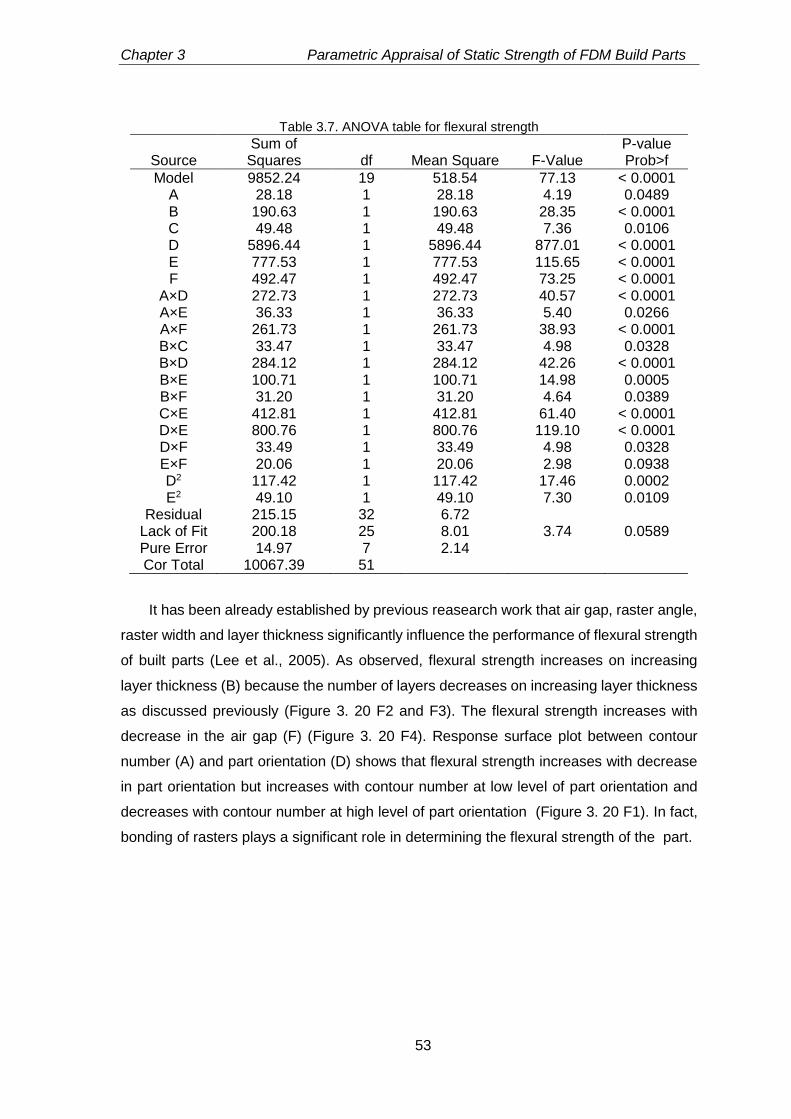
Chapter 3 Parametric Appraisal of Static Strength of FDM Build Parts
53
Table 3.7. ANOVA table for flexural strength
Source
Sum of Squares
df Mean Square F-Value
P-value Prob>f
Model 9852.24 19 518.54 77.13 < 0.0001 A 28.18 1 28.18 4.19 0.0489 B 190.63 1 190.63 28.35 < 0.0001 C 49.48 1 49.48 7.36 0.0106 D 5896.44 1 5896.44 877.01 < 0.0001 E 777.53 1 777.53 115.65 < 0.0001 F 492.47 1 492.47 73.25 < 0.0001
A×D 272.73 1 272.73 40.57 < 0.0001 A×E 36.33 1 36.33 5.40 0.0266 A×F 261.73 1 261.73 38.93 < 0.0001 B×C 33.47 1 33.47 4.98 0.0328 B×D 284.12 1 284.12 42.26 < 0.0001 B×E 100.71 1 100.71 14.98 0.0005 B×F 31.20 1 31.20 4.64 0.0389 C×E 412.81 1 412.81 61.40 < 0.0001 D×E 800.76 1 800.76 119.10 < 0.0001 D×F 33.49 1 33.49 4.98 0.0328 E×F 20.06 1 20.06 2.98 0.0938 D2 117.42 1 117.42 17.46 0.0002 E2 49.10 1 49.10 7.30 0.0109
Residual 215.15 32 6.72 Lack of Fit 200.18 25 8.01 3.74 0.0589 Pure Error 14.97 7 2.14 Cor Total 10067.39 51
It has been already established by previous reasearch work that air gap, raster angle,
raster width and layer thickness significantly influence the performance of flexural strength
of built parts (Lee et al., 2005). As observed, flexural strength increases on increasing
layer thickness (B) because the number of layers decreases on increasing layer thickness
as discussed previously (Figure 3. 20 F2 and F3). The flexural strength increases with
decrease in the air gap (F) (Figure 3. 20 F4). Response surface plot between contour
number (A) and part orientation (D) shows that flexural strength increases with decrease
in part orientation but increases with contour number at low level of part orientation and
decreases with contour number at high level of part orientation (Figure 3. 20 F1). In fact,
bonding of rasters plays a significant role in determining the flexural strength of the part.
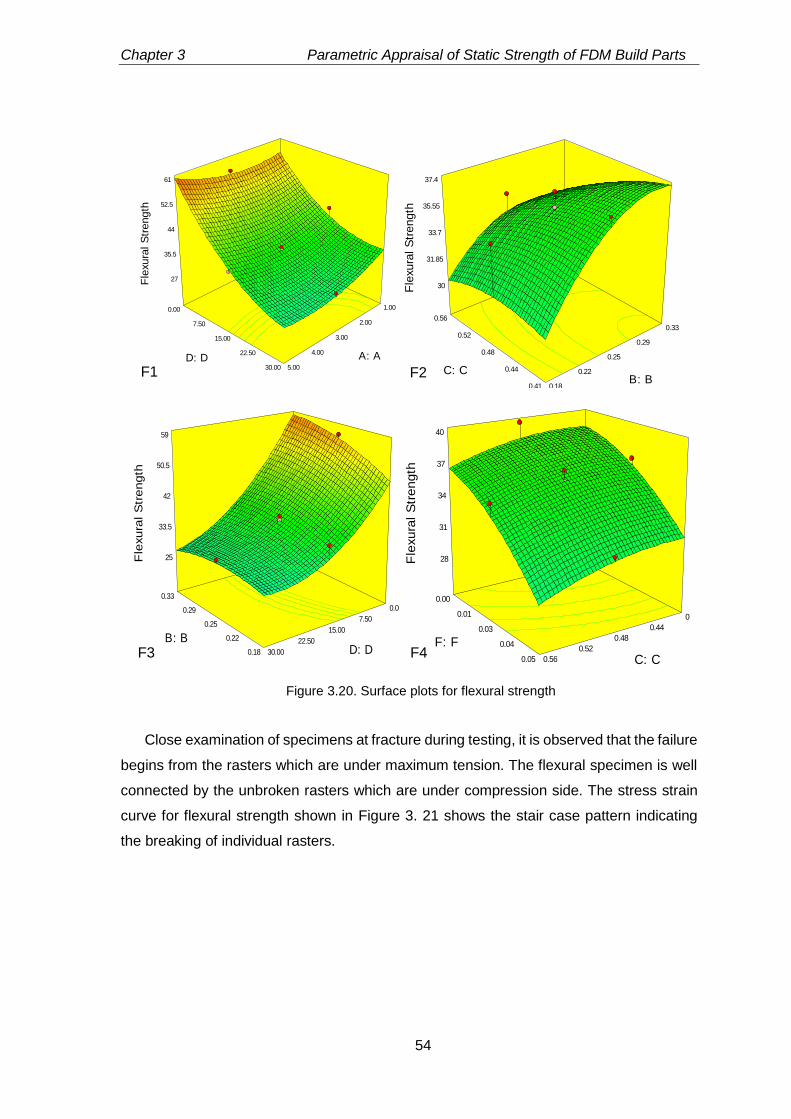
Chapter 3 Parametric Appraisal of Static Strength of FDM Build Parts
54
Figure 3.20. Surface plots for flexural strength
Close examination of specimens at fracture during testing, it is observed that the failure
begins from the rasters which are under maximum tension. The flexural specimen is well
connected by the unbroken rasters which are under compression side. The stress strain
curve for flexural strength shown in Figure 3. 21 shows the stair case pattern indicating
the breaking of individual rasters.
Design-Expert® Sof tware
Flexural Strength66.5551
4.8228
X1 = C: CX2 = F: F
Actual FactorsA: A = 3.00B: B = 0.25D: D = 15.00E: E = 30.00
0.41
0.44
0.48
0.52
0.56
0.00
0.01
0.03
0.04
0.05
28
31
34
37
40
F
lexura
l S
trength
C: C
F: F
Design-Expert® Sof tware
Flexural Strength66.5551
4.8228
X1 = B: BX2 = D: D
Actual FactorsA: A = 3.00C: C = 0.48E: E = 30.00F: F = 0.03
0.18
0.22
0.25
0.29
0.33
0.00
7.50
15.00
22.50
30.00
25
33.5
42
50.5
59
F
lexura
l S
trength
B: B D: D
Design-Expert® Sof tware
Flexural Strength66.5551
4.8228
X1 = B: BX2 = C: C
Actual FactorsA: A = 3.00D: D = 15.00E: E = 30.00F: F = 0.03
0.18
0.22
0.25
0.29
0.33
0.41
0.44
0.48
0.52
0.56
30
31.85
33.7
35.55
37.4
F
lexura
l S
trength
B: B C: C
Design-Expert® Sof tware
Flexural Strength66.5551
4.8228
X1 = A: AX2 = D: D
Actual FactorsB: B = 0.25C: C = 0.48E: E = 30.00F: F = 0.03
1.00
2.00
3.00
4.00
5.00
0.00
7.50
15.00
22.50
30.00
27
35.5
44
52.5
61
F
lexura
l S
trength
A: A D: D
F4
F1 F2
F3
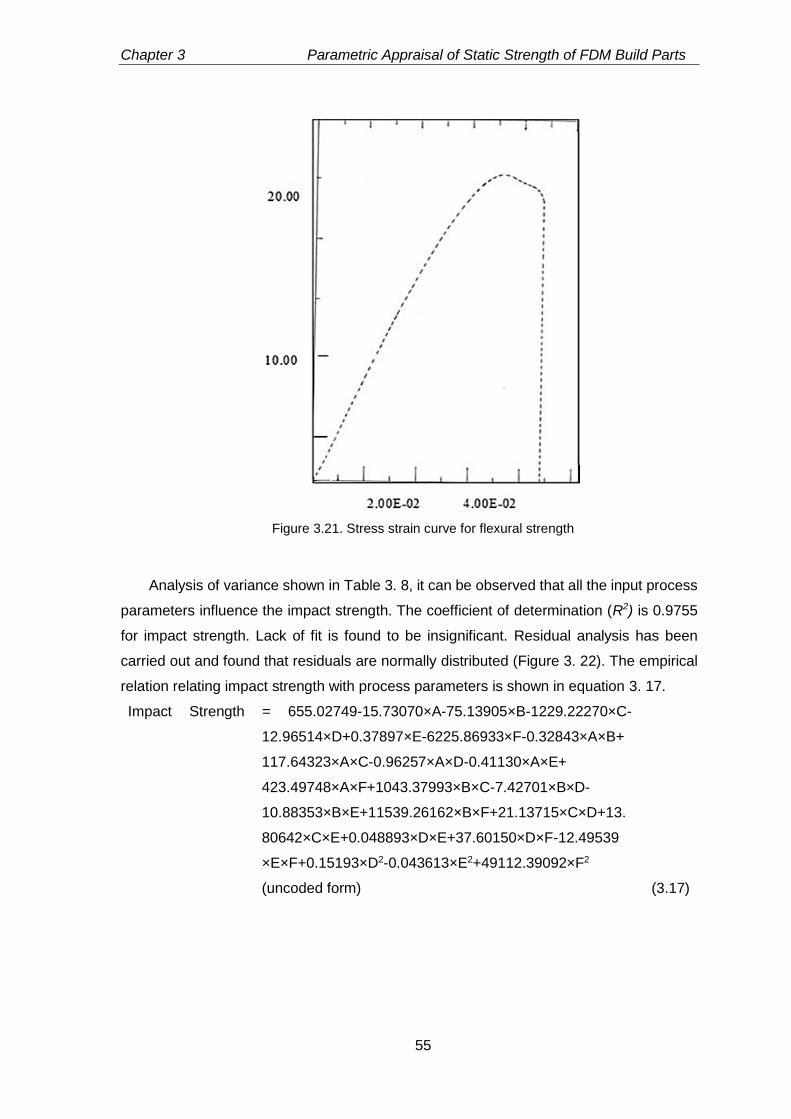
Chapter 3 Parametric Appraisal of Static Strength of FDM Build Parts
55
Figure 3.21. Stress strain curve for flexural strength
Analysis of variance shown in Table 3. 8, it can be observed that all the input process
parameters influence the impact strength. The coefficient of determination (R2) is 0.9755
for impact strength. Lack of fit is found to be insignificant. Residual analysis has been
carried out and found that residuals are normally distributed (Figure 3. 22). The empirical
relation relating impact strength with process parameters is shown in equation 3. 17.
Impact Strength = 655.02749-15.73070×A-75.13905×B-1229.22270×C-
12.96514×D+0.37897×E-6225.86933×F-0.32843×A×B+
117.64323×A×C-0.96257×A×D-0.41130×A×E+
423.49748×A×F+1043.37993×B×C-7.42701×B×D-
10.88353×B×E+11539.26162×B×F+21.13715×C×D+13.
80642×C×E+0.048893×D×E+37.60150×D×F-12.49539
×E×F+0.15193×D2-0.043613×E2+49112.39092×F2
(uncoded form) (3.17)
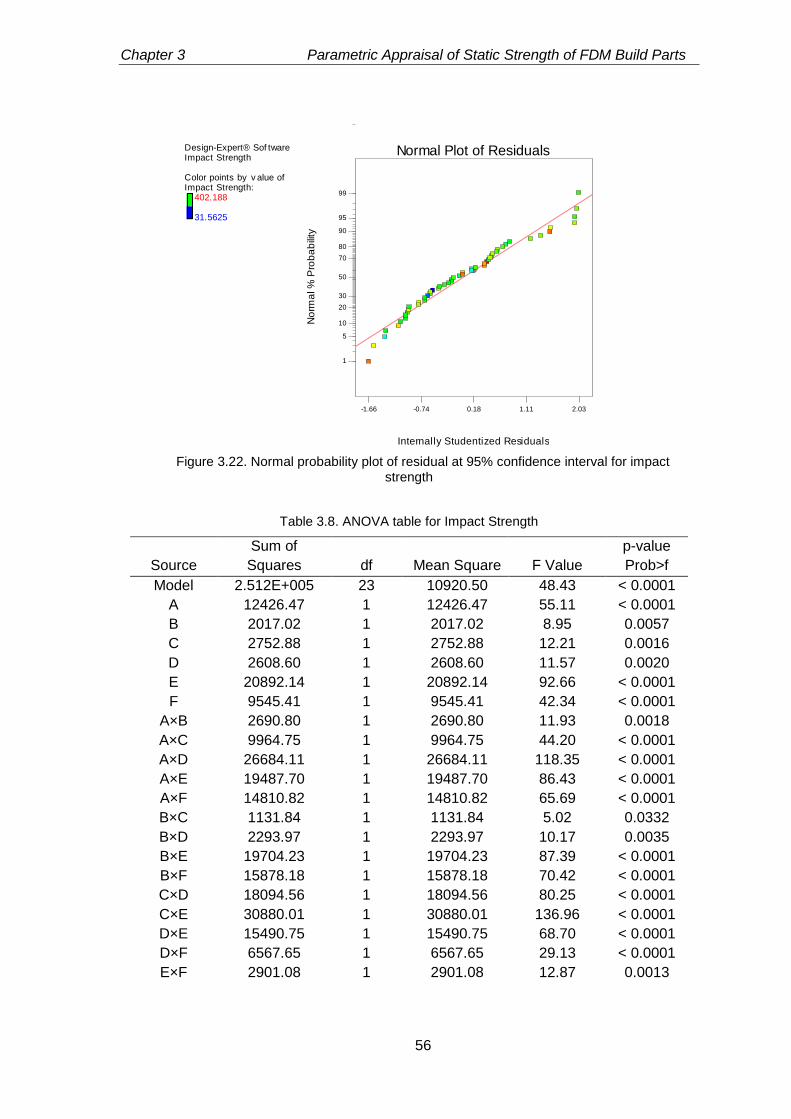
Chapter 3 Parametric Appraisal of Static Strength of FDM Build Parts
56
Figure 3.22. Normal probability plot of residual at 95% confidence interval for impact strength
Table 3.8. ANOVA table for Impact Strength
Source
Sum of
Squares
df Mean Square F Value
p-value
Prob>f
Model 2.512E+005 23 10920.50 48.43 < 0.0001
A 12426.47 1 12426.47 55.11 < 0.0001
B 2017.02 1 2017.02 8.95 0.0057
C 2752.88 1 2752.88 12.21 0.0016
D 2608.60 1 2608.60 11.57 0.0020
E 20892.14 1 20892.14 92.66 < 0.0001
F 9545.41 1 9545.41 42.34 < 0.0001
A×B 2690.80 1 2690.80 11.93 0.0018
A×C 9964.75 1 9964.75 44.20 < 0.0001
A×D 26684.11 1 26684.11 118.35 < 0.0001
A×E 19487.70 1 19487.70 86.43 < 0.0001
A×F 14810.82 1 14810.82 65.69 < 0.0001
B×C 1131.84 1 1131.84 5.02 0.0332
B×D 2293.97 1 2293.97 10.17 0.0035
B×E 19704.23 1 19704.23 87.39 < 0.0001
B×F 15878.18 1 15878.18 70.42 < 0.0001
C×D 18094.56 1 18094.56 80.25 < 0.0001
C×E 30880.01 1 30880.01 136.96 < 0.0001
D×E 15490.75 1 15490.75 68.70 < 0.0001
D×F 6567.65 1 6567.65 29.13 < 0.0001
E×F 2901.08 1 2901.08 12.87 0.0013
Design-Expert® Sof twareImpact Strength
Color points by v alue ofImpact Strength:
402.188
31.5625
Internally Studentized Residuals
No
rma
l %
Pro
ba
bili
ty
Normal Plot of Residuals
-1.66 -0.74 0.18 1.11 2.03
1
5
10
20
30
50
70
80
90
95
99
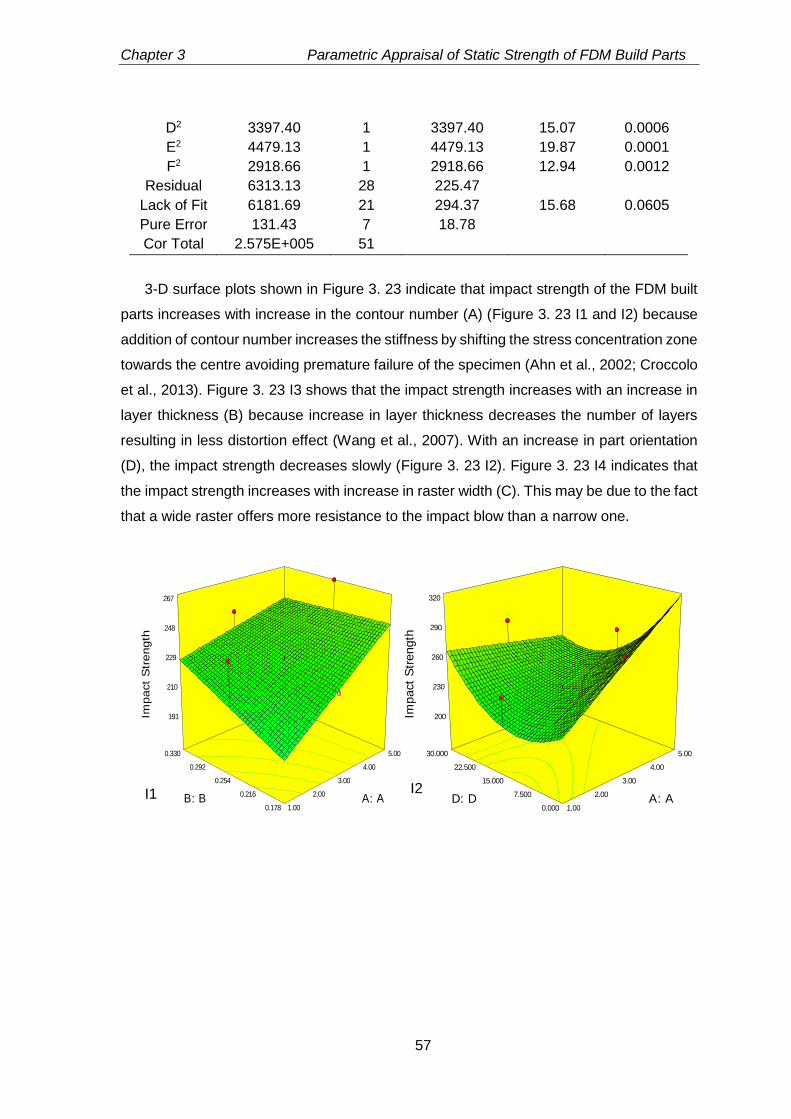
Chapter 3 Parametric Appraisal of Static Strength of FDM Build Parts
57
D2 3397.40 1 3397.40 15.07 0.0006
E2 4479.13 1 4479.13 19.87 0.0001
F2 2918.66 1 2918.66 12.94 0.0012
Residual 6313.13 28 225.47
Lack of Fit 6181.69 21 294.37 15.68 0.0605
Pure Error 131.43 7 18.78
Cor Total 2.575E+005 51
3-D surface plots shown in Figure 3. 23 indicate that impact strength of the FDM built
parts increases with increase in the contour number (A) (Figure 3. 23 I1 and I2) because
addition of contour number increases the stiffness by shifting the stress concentration zone
towards the centre avoiding premature failure of the specimen (Ahn et al., 2002; Croccolo
et al., 2013). Figure 3. 23 I3 shows that the impact strength increases with an increase in
layer thickness (B) because increase in layer thickness decreases the number of layers
resulting in less distortion effect (Wang et al., 2007). With an increase in part orientation
(D), the impact strength decreases slowly (Figure 3. 23 I2). Figure 3. 23 I4 indicates that
the impact strength increases with increase in raster width (C). This may be due to the fact
that a wide raster offers more resistance to the impact blow than a narrow one.
Design-Expert® Sof tware
Impact Strength402.188
31.5625
X1 = A: AX2 = D: D
Actual FactorsB: B = 0.254C: C = 0.4814E: E = 30.00F: F = 0.0254
1.00
2.00
3.00
4.00
5.00
0.000
7.500
15.000
22.500
30.000
200
230
260
290
320
Im
pact
Str
eng
th
A: A D: D
Design-Expert® Sof tware
Impact Strength402.188
31.5625
X1 = A: AX2 = B: B
Actual FactorsC: C = 0.4814D: D = 15.000E: E = 30.00F: F = 0.0254
1.00
2.00
3.00
4.00
5.00
0.178
0.216
0.254
0.292
0.330
191
210
229
248
267
Im
pact
Str
ength
A: A B: B I1 I2
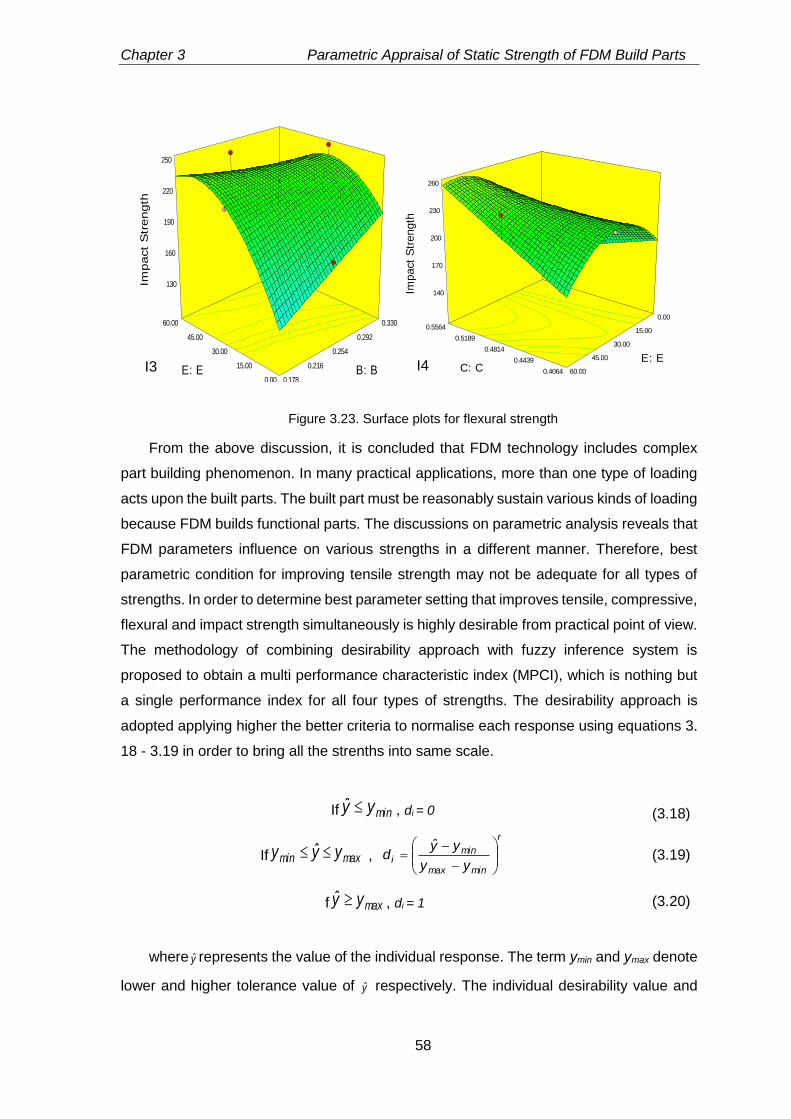
Chapter 3 Parametric Appraisal of Static Strength of FDM Build Parts
58
Figure 3.23. Surface plots for flexural strength
From the above discussion, it is concluded that FDM technology includes complex
part building phenomenon. In many practical applications, more than one type of loading
acts upon the built parts. The built part must be reasonably sustain various kinds of loading
because FDM builds functional parts. The discussions on parametric analysis reveals that
FDM parameters influence on various strengths in a different manner. Therefore, best
parametric condition for improving tensile strength may not be adequate for all types of
strengths. In order to determine best parameter setting that improves tensile, compressive,
flexural and impact strength simultaneously is highly desirable from practical point of view.
The methodology of combining desirability approach with fuzzy inference system is
proposed to obtain a multi performance characteristic index (MPCI), which is nothing but
a single performance index for all four types of strengths. The desirability approach is
adopted applying higher the better criteria to normalise each response using equations 3.
18 - 3.19 in order to bring all the strenths into same scale.
If minyy , di = 0 (3.18)
If maxmin yyy ,
r
minmax
mini
yy
yyd
(3.19)
f maxyy , di = 1 (3.20)
where y represents the value of the individual response. The term ymin and ymax denote
lower and higher tolerance value of y respectively. The individual desirability value and
Design-Expert® Sof tware
Impact Strength402.188
31.5625
X1 = C: CX2 = E: E
Actual FactorsA: A = 3.00B: B = 0.254D: D = 15.000F: F = 0.0254
0.4064
0.4439
0.4814
0.5189
0.5564
0.00
15.00
30.00
45.00
60.00
140
170
200
230
260
Im
pact
Str
ength
C: C E: E
Design-Expert® Sof tware
Impact Strength402.188
31.5625
X1 = B: BX2 = E: E
Actual FactorsA: A = 3.00C: C = 0.4814D: D = 15.000F: F = 0.0254
0.178
0.216
0.254
0.292
0.330
0.00
15.00
30.00
45.00
60.00
130
160
190
220
250
Im
pact
Str
eng
th
B: B E: E I4 I3
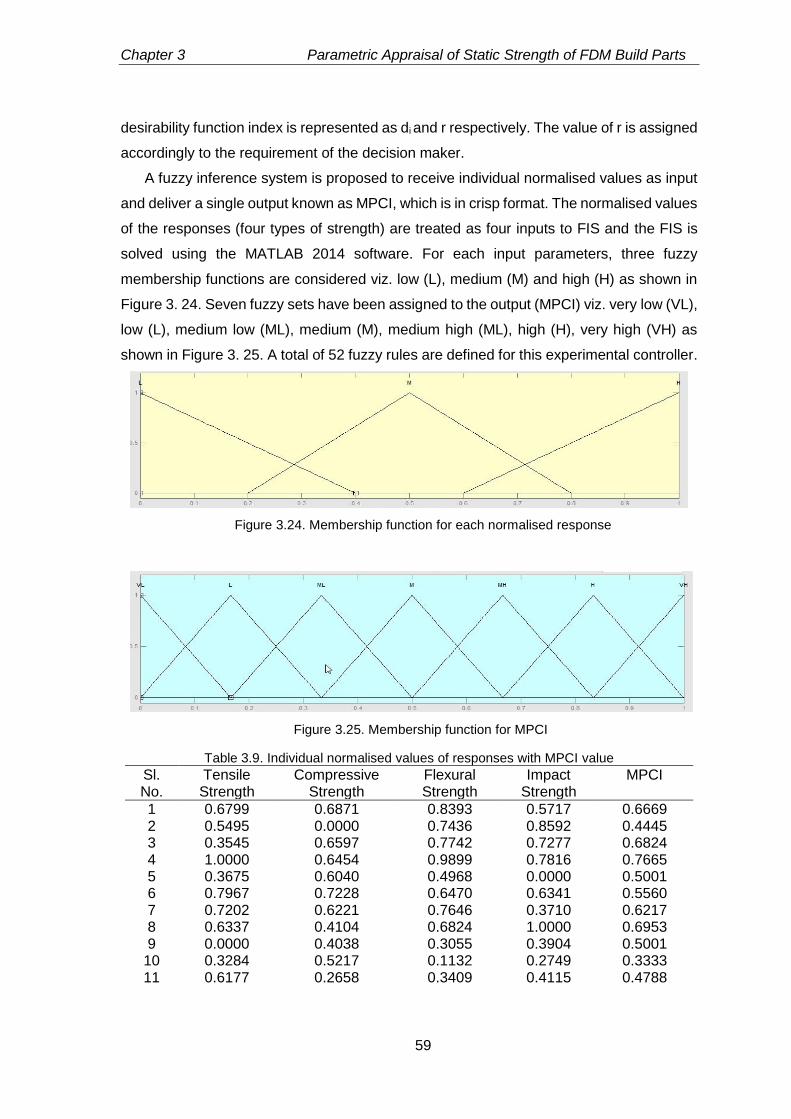
Chapter 3 Parametric Appraisal of Static Strength of FDM Build Parts
59
desirability function index is represented as di and r respectively. The value of r is assigned
accordingly to the requirement of the decision maker.
A fuzzy inference system is proposed to receive individual normalised values as input
and deliver a single output known as MPCI, which is in crisp format. The normalised values
of the responses (four types of strength) are treated as four inputs to FIS and the FIS is
solved using the MATLAB 2014 software. For each input parameters, three fuzzy
membership functions are considered viz. low (L), medium (M) and high (H) as shown in
Figure 3. 24. Seven fuzzy sets have been assigned to the output (MPCI) viz. very low (VL),
low (L), medium low (ML), medium (M), medium high (ML), high (H), very high (VH) as
shown in Figure 3. 25. A total of 52 fuzzy rules are defined for this experimental controller.
Figure 3.24. Membership function for each normalised response
Figure 3.25. Membership function for MPCI
Table 3.9. Individual normalised values of responses with MPCI value
Sl. No.
Tensile Strength
Compressive Strength
Flexural Strength
Impact Strength
MPCI
1 0.6799 0.6871 0.8393 0.5717 0.6669 2 0.5495 0.0000 0.7436 0.8592 0.4445 3 0.3545 0.6597 0.7742 0.7277 0.6824 4 1.0000 0.6454 0.9899 0.7816 0.7665 5 0.3675 0.6040 0.4968 0.0000 0.5001 6 0.7967 0.7228 0.6470 0.6341 0.5560 7 0.7202 0.6221 0.7646 0.3710 0.6217 8 0.6337 0.4104 0.6824 1.0000 0.6953 9 0.0000 0.4038 0.3055 0.3904 0.5001
10 0.3284 0.5217 0.1132 0.2749 0.3333 11 0.6177 0.2658 0.3409 0.4115 0.4788
Chapter 3 Parametric Appraisal of Static Strength of FDM Build Parts
60
12 0.3397 0.2144 0.1017 0.7285 0.4055 13 0.2958 0.7505 0.2749 0.2749 0.5001 14 0.2958 0.3813 0.0654 0.5717 0.3332 15 0.0545 0.1728 0.0290 0.5717 0.3333 16 0.4778 0.4288 0.0000 0.3710 0.3333 17 0.2454 0.5484 0.3883 0.4705 0.5508 18 0.7481 0.2575 0.5770 0.6754 0.5045 19 0.8743 0.4675 0.9464 0.5717 0.6669 20 0.4784 0.3837 0.8269 0.6535 0.6669 21 0.6858 1.0000 0.7848 0.6669 0.7095 22 0.6402 0.2050 0.7369 0.7749 0.4387 23 0.3154 0.5370 0.6585 0.5717 0.5835 24 0.8743 0.5064 1.0000 0.6560 0.7004 25 0.4517 0.2979 0.5753 0.7546 0.5128 26 0.1660 0.2256 0.3784 0.5717 0.3604 27 0.1932 0.1286 0.3954 0.6619 0.4571 28 0.6420 0.2728 0.4672 0.0902 0.5001 29 0.1915 0.4688 0.4193 0.8895 0.5001 30 0.4191 0.6217 0.4432 0.8895 0.5564 31 0.5625 0.0949 0.6585 0.8423 0.4603 32 0.4173 0.2287 0.4672 0.8895 0.5210 33 0.5039 0.4591 0.6107 0.5540 0.5834 34 0.7119 0.3410 0.5207 0.6341 0.5331 35 0.5234 0.4424 0.4826 0.5008 0.5180 36 0.5625 0.2673 0.4729 0.5776 0.4803 37 0.5495 0.3558 0.5150 0.4958 0.5578 38 0.5886 0.4494 0.4853 0.5413 0.5235 39 0.6805 0.5324 0.8269 0.6619 0.7130 40 0.4713 0.3607 0.3954 0.6602 0.5610 41 0.5347 0.3698 0.4205 0.3710 0.5663 42 0.5430 0.3635 0.4996 0.5548 0.5626 43 0.7463 0.4037 0.5628 0.6332 0.6127 44 0.4256 0.3427 0.4193 0.6754 0.5491 45 0.6212 0.3690 0.4853 0.5034 0.5659 46 0.6331 0.4140 0.5141 0.4865 0.5657 47 0.5531 0.3859 0.4571 0.5135 0.5659 48 0.5424 0.3466 0.4916 0.5034 0.5659 49 0.6331 0.4028 0.4853 0.4764 0.5657 50 0.5483 0.3831 0.4628 0.4899 0.5659 51 0.6206 0.3618 0.4419 0.4924 0.5659 52 0.5483 0.3241 0.4972 0.4899 0.5659
The fourth run from the normalised experimental data shown in Table 3. 9 indicates
best parameter setting because it exhibits highest MPCI value i.e. 0.7665. To achieve the
optimum solution or to achieve the best parameter setting than suggested by the fuzzy
inference system, a nature inspired metaheuristic known as firefly algorithm is applied. The
objective function used in the firefly optimisation algorithm is empirically developed using
non-linear regression analysis relating MPCI values shown in Table 3. 9 and process
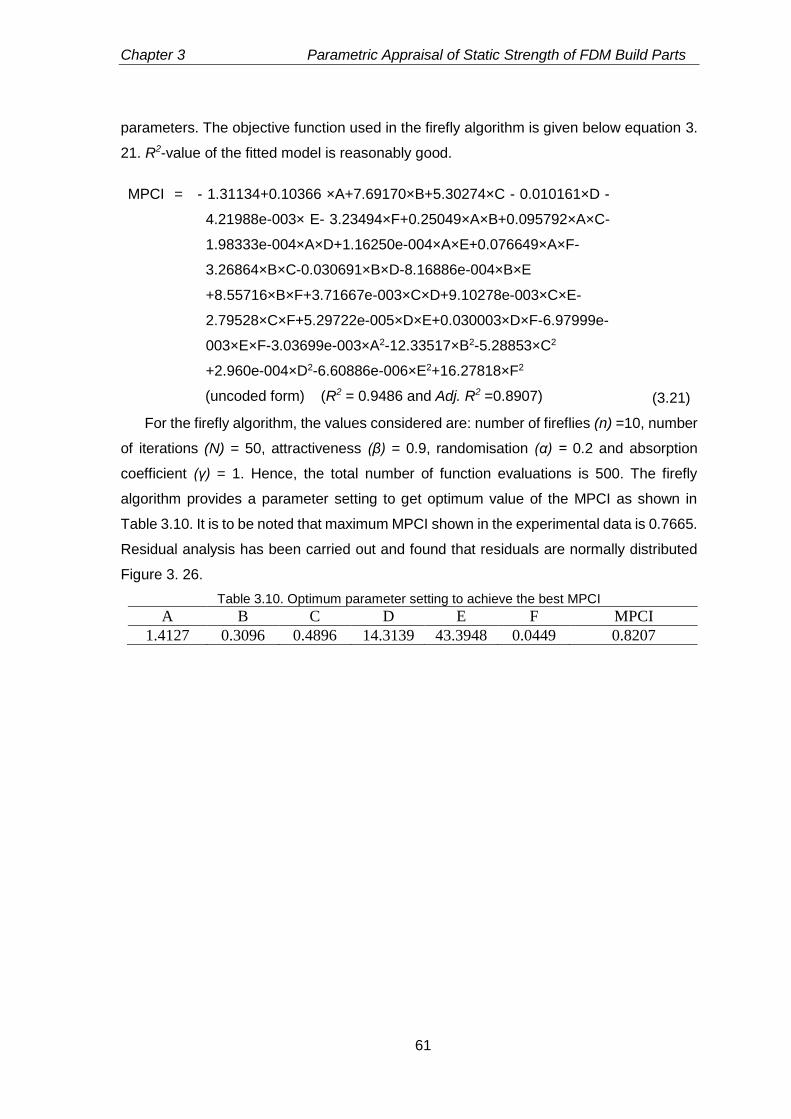
Chapter 3 Parametric Appraisal of Static Strength of FDM Build Parts
61
parameters. The objective function used in the firefly algorithm is given below equation 3.
21. R2-value of the fitted model is reasonably good.
MPCI = - 1.31134+0.10366 ×A+7.69170×B+5.30274×C - 0.010161×D -
4.21988e-003× E- 3.23494×F+0.25049×A×B+0.095792×A×C-
1.98333e-004×A×D+1.16250e-004×A×E+0.076649×A×F-
3.26864×B×C-0.030691×B×D-8.16886e-004×B×E
+8.55716×B×F+3.71667e-003×C×D+9.10278e-003×C×E-
2.79528×C×F+5.29722e-005×D×E+0.030003×D×F-6.97999e-
003×E×F-3.03699e-003×A2-12.33517×B2-5.28853×C2
+2.960e-004×D2-6.60886e-006×E2+16.27818×F2
(uncoded form) (R2 = 0.9486 and Adj. R2 =0.8907) (3.21)
For the firefly algorithm, the values considered are: number of fireflies (n) =10, number
of iterations (N) = 50, attractiveness (β) = 0.9, randomisation (α) = 0.2 and absorption
coefficient (γ) = 1. Hence, the total number of function evaluations is 500. The firefly
algorithm provides a parameter setting to get optimum value of the MPCI as shown in
Table 3.10. It is to be noted that maximum MPCI shown in the experimental data is 0.7665.
Residual analysis has been carried out and found that residuals are normally distributed
Figure 3. 26.
Table 3.10. Optimum parameter setting to achieve the best MPCI A B C D E F MPCI
1.4127 0.3096 0.4896 14.3139 43.3948 0.0449 0.8207
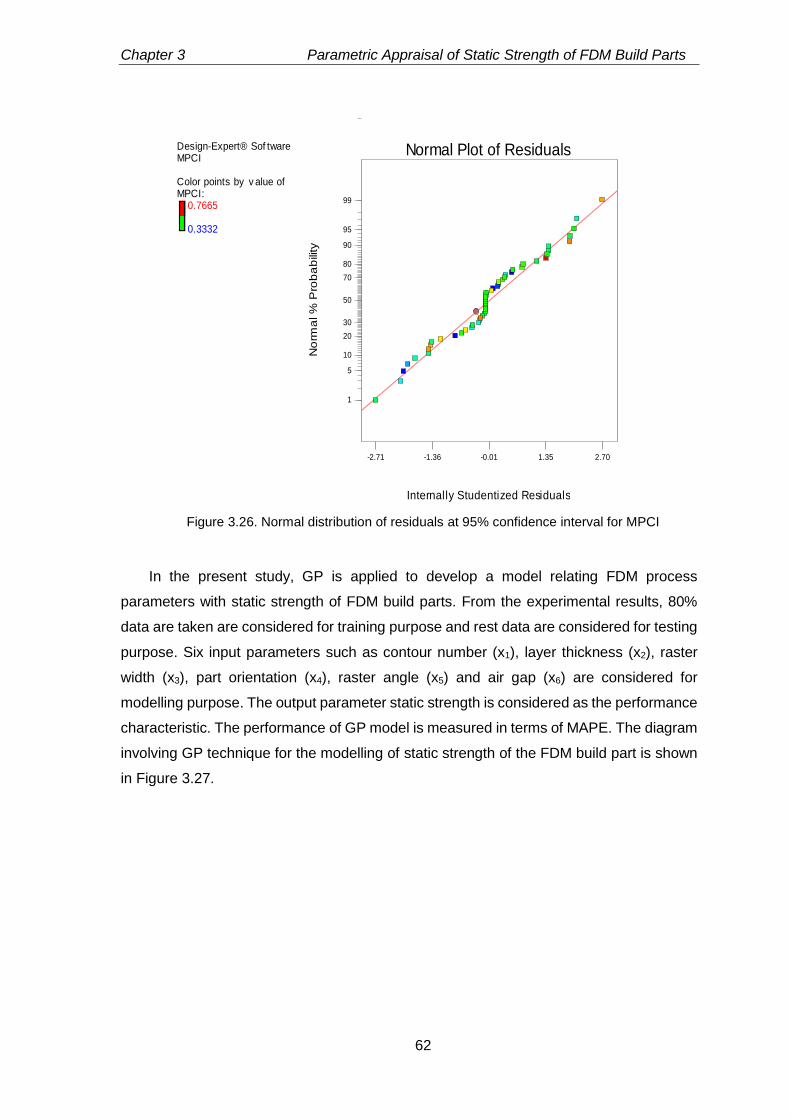
Chapter 3 Parametric Appraisal of Static Strength of FDM Build Parts
62
Figure 3.26. Normal distribution of residuals at 95% confidence interval for MPCI
In the present study, GP is applied to develop a model relating FDM process
parameters with static strength of FDM build parts. From the experimental results, 80%
data are taken are considered for training purpose and rest data are considered for testing
purpose. Six input parameters such as contour number (x1), layer thickness (x2), raster
width (x3), part orientation (x4), raster angle (x5) and air gap (x6) are considered for
modelling purpose. The output parameter static strength is considered as the performance
characteristic. The performance of GP model is measured in terms of MAPE. The diagram
involving GP technique for the modelling of static strength of the FDM build part is shown
in Figure 3.27.
Design-Expert® Sof twareMPCI
Color points by v alue ofMPCI:
0.7665
0.3332
Internally Studentized Residuals
No
rma
l %
Pro
ba
bili
ty
Normal Plot of Residuals
-2.71 -1.36 -0.01 1.35 2.70
1
5
10
20
30
50
70
80
90
95
99
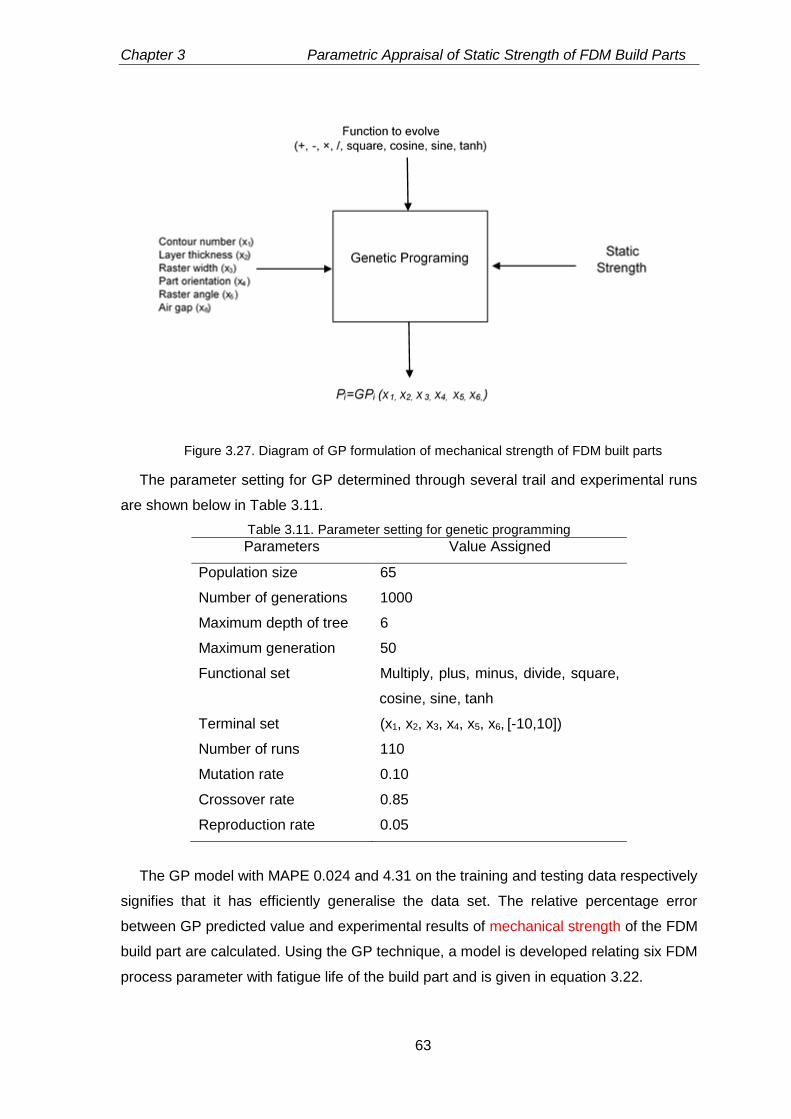
Chapter 3 Parametric Appraisal of Static Strength of FDM Build Parts
63
Figure 3.27. Diagram of GP formulation of mechanical strength of FDM built parts
The parameter setting for GP determined through several trail and experimental runs
are shown below in Table 3.11.
Table 3.11. Parameter setting for genetic programming
Parameters Value Assigned
Population size 65
Number of generations 1000
Maximum depth of tree 6
Maximum generation 50
Functional set Multiply, plus, minus, divide, square,
cosine, sine, tanh
Terminal set (x1, x2, x3, x4, x5, x6, [-10,10])
Number of runs 110
Mutation rate 0.10
Crossover rate 0.85
Reproduction rate 0.05
The GP model with MAPE 0.024 and 4.31 on the training and testing data respectively
signifies that it has efficiently generalise the data set. The relative percentage error
between GP predicted value and experimental results of mechanical strength of the FDM
build part are calculated. Using the GP technique, a model is developed relating six FDM
process parameter with fatigue life of the build part and is given in equation 3.22.
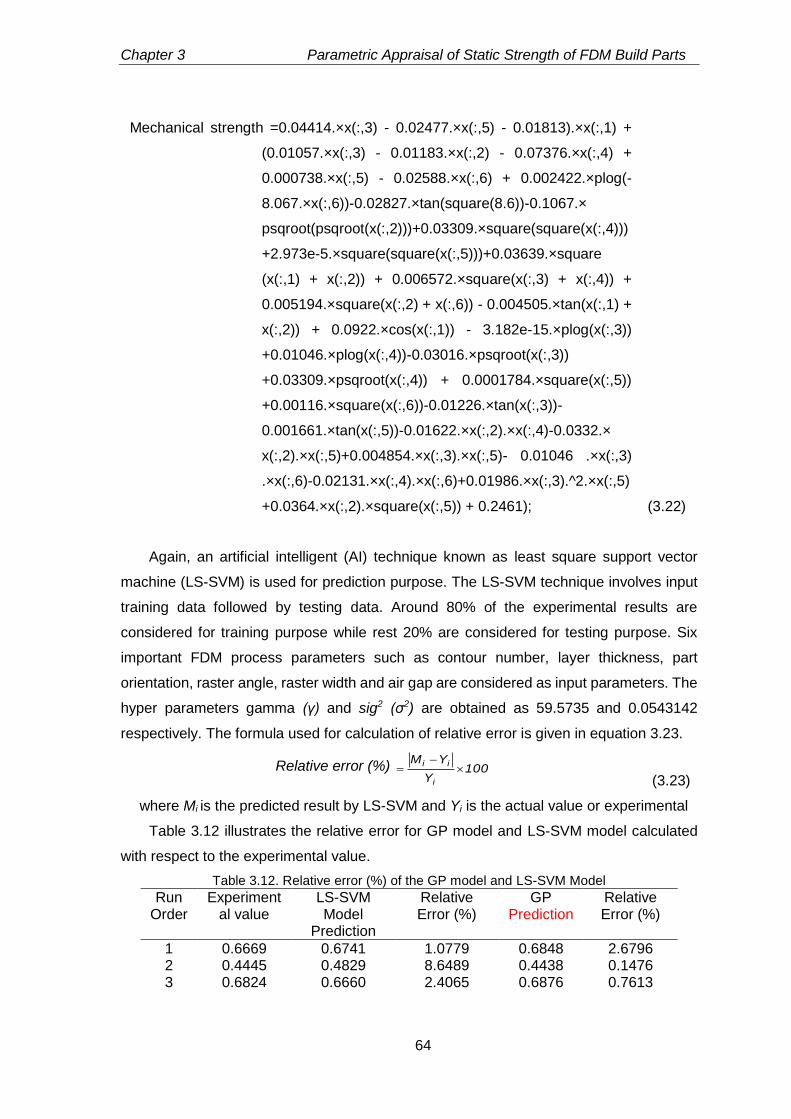
Chapter 3 Parametric Appraisal of Static Strength of FDM Build Parts
64
Mechanical strength =0.04414.×x(:,3) - 0.02477.×x(:,5) - 0.01813).×x(:,1) +
(0.01057.×x(:,3) - 0.01183.×x(:,2) - 0.07376.×x(:,4) +
0.000738.×x(:,5) - 0.02588.×x(:,6) + 0.002422.×plog(-
8.067.×x(:,6))-0.02827.×tan(square(8.6))-0.1067.×
psqroot(psqroot(x(:,2)))+0.03309.×square(square(x(:,4)))
+2.973e-5.×square(square(x(:,5)))+0.03639.×square
(x(:,1) + x(:,2)) + 0.006572.×square(x(:,3) + x(:,4)) +
0.005194.×square(x(:,2) + x(:,6)) - 0.004505.×tan(x(:,1) +
x(:,2)) + 0.0922.×cos(x(:,1)) - 3.182e-15.×plog(x(:,3))
+0.01046.×plog(x(:,4))-0.03016.×psqroot(x(:,3))
+0.03309.×psqroot(x(:,4)) + 0.0001784.×square(x(:,5))
+0.00116.×square(x(:,6))-0.01226.×tan(x(:,3))-
0.001661.×tan(x(:,5))-0.01622.×x(:,2).×x(:,4)-0.0332.×
x(:,2).×x(:,5)+0.004854.×x(:,3).×x(:,5)- 0.01046 .×x(:,3)
.×x(:,6)-0.02131.×x(:,4).×x(:,6)+0.01986.×x(:,3).^2.×x(:,5)
+0.0364.×x(:,2).×square(x(:,5)) + 0.2461); (3.22)
Again, an artificial intelligent (AI) technique known as least square support vector
machine (LS-SVM) is used for prediction purpose. The LS-SVM technique involves input
training data followed by testing data. Around 80% of the experimental results are
considered for training purpose while rest 20% are considered for testing purpose. Six
important FDM process parameters such as contour number, layer thickness, part
orientation, raster angle, raster width and air gap are considered as input parameters. The
hyper parameters gamma (γ) and sig2 (σ2) are obtained as 59.5735 and 0.0543142
respectively. The formula used for calculation of relative error is given in equation 3.23.
Relative error (%) 100Y
YM
i
ii
(3.23)
where Mi is the predicted result by LS-SVM and Yi is the actual value or experimental
Table 3.12 illustrates the relative error for GP model and LS-SVM model calculated
with respect to the experimental value.
Table 3.12. Relative error (%) of the GP model and LS-SVM Model
Run Order
Experimental value
LS-SVM Model
Prediction
Relative Error (%)
GP Prediction
Relative Error (%)
1 0.6669 0.6741 1.0779 0.6848 2.6796 2 0.4445 0.4829 8.6489 0.4438 0.1476 3 0.6824 0.6660 2.4065 0.6876 0.7613
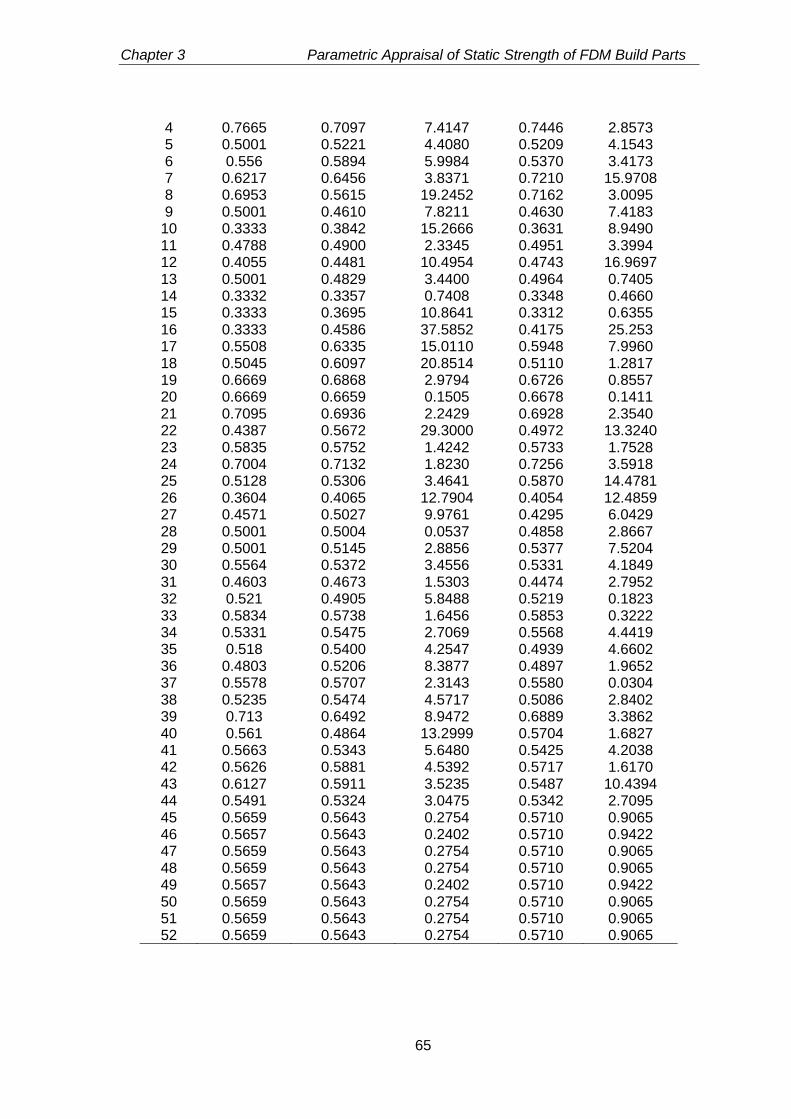
Chapter 3 Parametric Appraisal of Static Strength of FDM Build Parts
65
4 0.7665 0.7097 7.4147 0.7446 2.8573 5 0.5001 0.5221 4.4080 0.5209 4.1543 6 0.556 0.5894 5.9984 0.5370 3.4173 7 0.6217 0.6456 3.8371 0.7210 15.9708 8 0.6953 0.5615 19.2452 0.7162 3.0095 9 0.5001 0.4610 7.8211 0.4630 7.4183
10 0.3333 0.3842 15.2666 0.3631 8.9490 11 0.4788 0.4900 2.3345 0.4951 3.3994 12 0.4055 0.4481 10.4954 0.4743 16.9697 13 0.5001 0.4829 3.4400 0.4964 0.7405 14 0.3332 0.3357 0.7408 0.3348 0.4660 15 0.3333 0.3695 10.8641 0.3312 0.6355 16 0.3333 0.4586 37.5852 0.4175 25.253 17 0.5508 0.6335 15.0110 0.5948 7.9960 18 0.5045 0.6097 20.8514 0.5110 1.2817 19 0.6669 0.6868 2.9794 0.6726 0.8557 20 0.6669 0.6659 0.1505 0.6678 0.1411 21 0.7095 0.6936 2.2429 0.6928 2.3540 22 0.4387 0.5672 29.3000 0.4972 13.3240 23 0.5835 0.5752 1.4242 0.5733 1.7528 24 0.7004 0.7132 1.8230 0.7256 3.5918 25 0.5128 0.5306 3.4641 0.5870 14.4781 26 0.3604 0.4065 12.7904 0.4054 12.4859 27 0.4571 0.5027 9.9761 0.4295 6.0429 28 0.5001 0.5004 0.0537 0.4858 2.8667 29 0.5001 0.5145 2.8856 0.5377 7.5204 30 0.5564 0.5372 3.4556 0.5331 4.1849 31 0.4603 0.4673 1.5303 0.4474 2.7952 32 0.521 0.4905 5.8488 0.5219 0.1823 33 0.5834 0.5738 1.6456 0.5853 0.3222 34 0.5331 0.5475 2.7069 0.5568 4.4419 35 0.518 0.5400 4.2547 0.4939 4.6602 36 0.4803 0.5206 8.3877 0.4897 1.9652 37 0.5578 0.5707 2.3143 0.5580 0.0304 38 0.5235 0.5474 4.5717 0.5086 2.8402 39 0.713 0.6492 8.9472 0.6889 3.3862 40 0.561 0.4864 13.2999 0.5704 1.6827 41 0.5663 0.5343 5.6480 0.5425 4.2038 42 0.5626 0.5881 4.5392 0.5717 1.6170 43 0.6127 0.5911 3.5235 0.5487 10.4394 44 0.5491 0.5324 3.0475 0.5342 2.7095 45 0.5659 0.5643 0.2754 0.5710 0.9065 46 0.5657 0.5643 0.2402 0.5710 0.9422 47 0.5659 0.5643 0.2754 0.5710 0.9065 48 0.5659 0.5643 0.2754 0.5710 0.9065 49 0.5657 0.5643 0.2402 0.5710 0.9422 50 0.5659 0.5643 0.2754 0.5710 0.9065 51 0.5659 0.5643 0.2754 0.5710 0.9065 52 0.5659 0.5643 0.2754 0.5710 0.9065
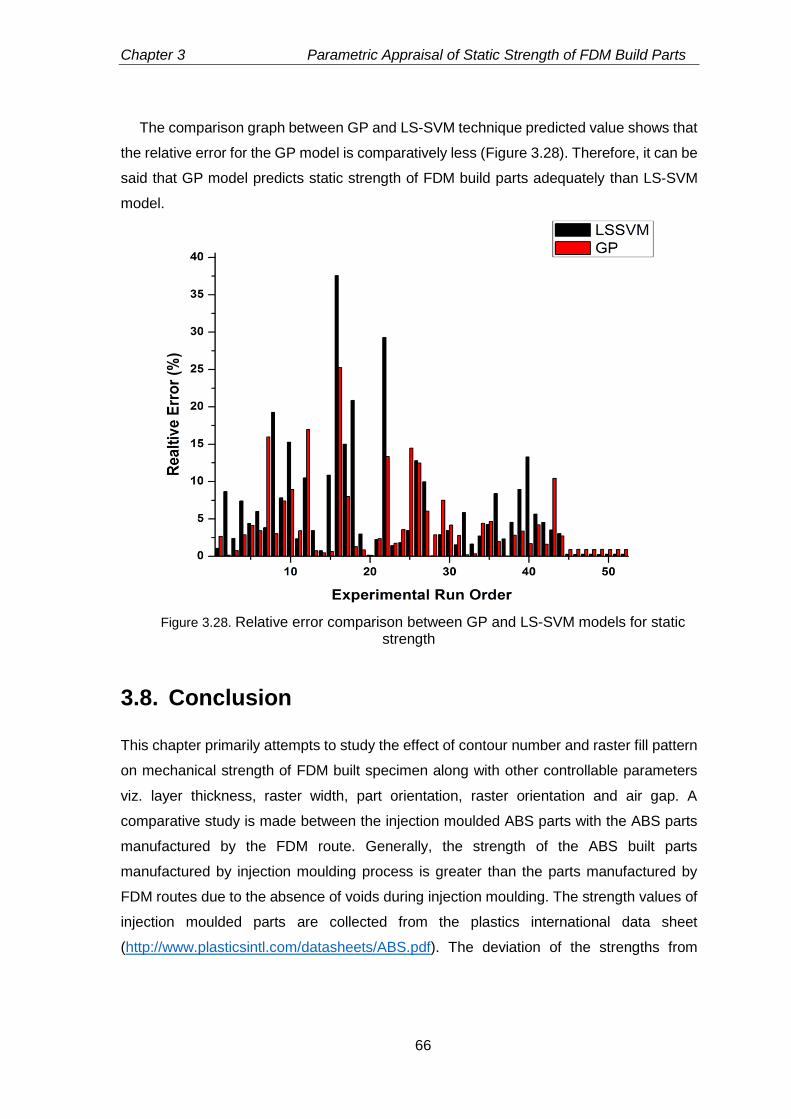
Chapter 3 Parametric Appraisal of Static Strength of FDM Build Parts
66
The comparison graph between GP and LS-SVM technique predicted value shows that
the relative error for the GP model is comparatively less (Figure 3.28). Therefore, it can be
said that GP model predicts static strength of FDM build parts adequately than LS-SVM
model.
Figure 3.28. Relative error comparison between GP and LS-SVM models for static strength
3.8. Conclusion
This chapter primarily attempts to study the effect of contour number and raster fill pattern
on mechanical strength of FDM built specimen along with other controllable parameters
viz. layer thickness, raster width, part orientation, raster orientation and air gap. A
comparative study is made between the injection moulded ABS parts with the ABS parts
manufactured by the FDM route. Generally, the strength of the ABS built parts
manufactured by injection moulding process is greater than the parts manufactured by
FDM routes due to the absence of voids during injection moulding. The strength values of
injection moulded parts are collected from the plastics international data sheet
(http://www.plasticsintl.com/datasheets/ABS.pdf). The deviation of the strengths from
Chapter 3 Parametric Appraisal of Static Strength of FDM Build Parts
67
injection moulded parts to FDM parts considering highest strength in Table 3. 2 is
presented in Table 3.13.
Table 3.13. Comparison of strength of injection moulded parts with FDM parts
Sl.
No.
Strength Units Injection
Moulded Parts
FDM Parts
(Present study)
Improvement/
Decrement in
percentage
1. Tensile MPa 42 31.3 25.48 (↓)
2. Compressive MPa 52 106.8 105.3(↑)
3. Flexural MPa 72 66.5 7.6 (↓)
It is observed that flexural of the FDM built parts closely approach to the strengths of
the injection moulded parts due to the modification in contour number and raster
orientation style resulting in the improvement of bond quality. The compressive strength of
the FDM build parts is two times greater than the strength of the moulded parts due to the
presence of voids in between rasters resulting in absorption of more energy than the solid
parts. The results of the previous research work (Sood et al., 2010) are compared with the
current experimental results and the findings are shown in Table 3.14.
Table 3.14. Comparison of results of present study with previous research work
SL.
No.
Strength Units Sood et al.
(2010)
Present study Improvement in
percentage
1. Tensile MPa 18.09 31.3 73.02 (↑)
2. Compressive MPa 74.4 106.8 43.50 (↑)
3. Flexural MPa 39.24 66 68.19 (↑)
It can be observed from Table 3.14 that tensile strength, compressive strength and
flexural strength significantly improve from previous study (Sood et al., 2010) simply by
modifying contour number and raster fill pattern instead of using default values. Since the
FDM process is complex one, it is really challenging to derive the functional relationship
between process parameters and mechanical strength using response surface
methodology. The surface plots have been analysed exhaustively and following
observations have been made:
Among the six controlling process parameters, contour number seems to be a
significant parameter for improving tensile, flexural and the impact strength of specimen
built through FDM build route. Addition of contour number (offset contour) to build parts
shifts the stress concentration zone towards the centre of the specimen from the outer
edge surface resulting in evading premature failure of the built parts.
Chapter 3 Parametric Appraisal of Static Strength of FDM Build Parts
68
An attempt is made to decrease the anisotropic nature of FDM build parts by changing
the raster fill pattern in adjacent layers. The raster orientation changes at certain
incremental angle with respect to its previously placed raster on the layer below
resulting in a strong bond between the rasters.
Negative air gap between rasters increases the strength but it decreases the part quality
and surface quality of the build part. Use of positive air gap between the rasters
increases the heat removal by convection process but decreases the mechanical
strength due to the generation of voids inside the part. Zero air gap increases the
diffusion between rasters and increases the cooling area resulting in a stronger bond
which increases the strength and the part quality.
The involvement of layer number depends on the layer thickness and part orientation.
With an increase in the number of layers, the involvement of rapid heating and cooling
cycles increases causing decrease in the part strength. The increase in part orientation
angle develops a staircase effect resulting in the deterioration of part quality.
In order to reduce the experimental cost and time, genetic programming and least
square support vector machine have been adopted for prediction of static strength of
the FDM build parts. A relative error of 4.31% and 6.16% has been obtained
respectively
The study also proposes a best parametric combination for simultaneously improving
four types of strengths such as tensile, compressive, flexural and impact strength using a
recently proposed meta-heuristic known firefly algorithm. The effective search in the
optimization landscape is made using exploration and exploitation capability of the
algorithm. The study can be extended to analyse thermos-residual stress developed during
the sequential deposition of rasters and its impact on mechanical strength.
Parametric assessment of fatigue life of FDM build parts
4.1. Introduction
The RP process, also known as additive manufacturing (AM) process, is finding its
technical ability to face the batch production requirements of manufacturing industries. RP
process has been successfully used in last two decades with the prime objective of
manufacturing models for design verifications, visualisation and functionality testing of the
assembly parts. Among all RP processes, fused deposition modelling (FDM) is widely
appreciated for its ability to build 3D complex geometry with reasonable strength directly
from computer aided design (CAD) file saved in .stl (stereo lithography) format. Due to the
layer-by-layer build mechanism, the FDM process parameters have significant effect on
the strength of the build parts (Sood et al., 2010; Croccolo et al., 2013; Onwubolu and
Rayegani, 2004). While used as an end use part, FDM build parts are subjected to static
as well as dynamic loading. The parametric assessment of static strength has been
already explored in the previous chapter (Chapter 3). The behaviour of RP build parts
under repetitive cyclic (dynamic) loading resulting in fatigue needs to be established
because it affects functionality as well as the durability (Ziemian et al., 2015; Lee and
Huang, 2013). Normally, fatigue occurs due to repetitive cyclic loading of the specimen
where the loading is just below the static strength of the material. The fatigue of the
material is characterised by the rate of failure which is a function of amplitude and
frequency of the stress intensity factor. The fatigue life is measured under strain, stress
and energy controlled mode (Kallrath et al., 1999; Tao and Xia, 2007b). The fatigue life of
acrylonitrile butadiene styrene (ABS) build part has been investigated under stress
controlled mode by Ziemian et al. (2015) considering the part orientation as a major
process parameter. Since the life cycles of the FDM build parts are below 105 cycles, low
cycle fatigue (LCF) test are carried out under strained controlled mode for better
characterisation of the FDM build parts (ASTM E606). In this direction, present research
work focuses on the better understanding of the influence of FDM process parameters on
the fatigue life of build parts when subjected to repetitive cyclic loads
Chapter 4 Parametric Assessment of Fatigue Life of FDM Build Parts
70
Foregoing discussions reveal that static strength of FDM parts have been widely
investigated by the researchers (Sood et al., 2010; Gurrala et al., 2014; Wang et al., 2007;
Ahn et al., 2002; Croccolo et al., 2013). But estimation of fatigue life is not adequately
addressed to assess the long term durability and sustainability of the FDM build parts.
Therefore, in this chapter, experiments are conducted based on face centred central
composite design (FCCCD) of response surface methodology (RSM) considering six FDM
process parameters namely contour number, layer thickness, raster width, part orientation,
raster angle and air gap to evaluate the fatigue life of the build specimen. Effect of cyclic
loading, like failure of rasters, rapture of adhesive bond between rasters, formation of crack
and crack propagation inside the build part are analysed from the scanning electron
microscope (SEM) micrographs and broken samples. In order to establish a clear
relationship between process parameters and fatigue life of the FDM build part, a statically
valid empirical model is developed. From analysis of variance (ANOVA) table, the
significance of process parameters is analysed. Finally, a nature inspired meta-heuristic
known as firefly algorithm is applied to obtain a best parametric combination for the
improvement of fatigue life of the FDM build part. To predict the Fatigue life, two latest
artificial intelligence techniques known as genetic programming (GP) and least square
support vector machine (LS-SVM) have been adopted. The prediction model enables to
predict the performance measures with reasonable accuracy so that costly experimental
time can be minimized.
4.2. Experimental plan
The durability and life span of the build part depends upon the type of loading and on the
material quality. While used as a functional part, the life span of the build part is badly
affected by the induced fatigue strain. The fatigue mechanism states that the fatigue
occurs due to the application repetitive or cyclic stresses on a body. Fatigue is also known
as progressive fracture mechanism because when a crack is initiated it goes on increases
further with the number of cycle. Normally, material loading is classified in to two types i.e.
monotonic and cyclic. Both monotonic and cyclic tests are used to characterise the
mechanical properties of metal, composites and polymers. The cyclic test apply oscillating
loads until the fracture of the specimen occurs. The cyclic load may include either cyclical
tension, compression or a combination of both. In case of fatigue test, the applied load
should be low enough so that the specimen will not break at a single cycle. The fatigue
test is divided into two type such as low cycle and high cycle considering the sustainable
Chapter 4 Parametric Assessment of Fatigue Life of FDM Build Parts
71
life cycle of the specimen. Materials having life cycle above 105 is known as high cycle
fatigue (HCF) and below known as low cycle fatigue (LCF). Since the plastics, composites
and polymer cannot sustain more than 105 cycles, LCF test are conducted to characterise
the material properties. So far as LCF tests are concerned, it gives better results when it
is operated in strain control mode. In the strain controlled fatigue test, result plays a vital
role in the field of mechanical design, material research, product development and failure
analysis. Before experimentation, the static tensile strength of the material should be
measured. Considering the ASTM D638 standard, five sets specimens of each
experimental runs are tested to measure the average stress at break. The frequency for
plastic must be limited to about 3 Hz in order to prevent premature failure due to heat built
up inside the specimen (Driscoll, 2004). All fatigue test are conducted according to the
ASTM E606 (standard test method for strain controlled fatigue testing) standard
procedure. All tests are conducted at zero strain ratio (R) means the specimen are subject
to tension followed by relaxation. The term R is the ratio between mean strain (εm) and
strain amplitude (εa). The area under stress strain curve during loading is defined as the
strain energy per unit volume induced into the specimen. Subsequently, the area under
the unloading curve is the energy released by the specimen (Ziemian et al., 2015). These
two stress strain curves and the respective areas are equal for perfectly elastic material
and more complex for non-perfectly elastic material. These loading and unloading curves
between stress and strain give rise to the formation hysteresis loop. Considering six FDM
process parameters, specimens are manufactured according to ASTM D638 standard
using a face centred central composite design (Table 3.2) approach and tensile tests are
conducted. The experimental data on tensile test reveals that tensile strength of the FDM
build parts largely depends on input process parameters setting. It is clear from the table
that tensile strength lies between 14.56- 31.34 MPa (Table 4.2). This indicates the material
property of the specimen is severely influenced by input parameters due to FDM build
mechanism for static tensile strength. It is corroborated that variation of input process
parameter may also affect the fatigue life of the FDM build part. Therefore, Low cycle
fatigue test under fully reversed strain controlled mode is selected to determine the fatigue
life of the build parts manufactured in adherence to parameter setting suggested by face
centred central composite design of design of experiment (DOE) approach. Among all
experimental runs, run order 18 and 23 having tensile strength 26.92 and 19.62 MPa are
chosen for analysis of fatigue life of the FDM build part.
Chapter 4 Parametric Assessment of Fatigue Life of FDM Build Parts
72
For accurate prediction of fatigue life of the FDM build part, a suitable damage
parameter is needed. The relation between fatigue life and damage parameter can be
expressed as suggested by Tao and Xia (2007a) (equation 4.1).
0fN.k (4.1)
where ψ denotes the damage parameter and Nf represents the total number of cycles
undergone before failure. The terms k and γ are material constants. The fatigue limit is
denoted by ψ0. Normally, the fatigue test are classified into three categories i.e. stress
based, strain based and energy based approach depending upon the type damage
parameter considered for experimentation (Ellyin, 1997). One common stress/strain
function is introduced including the damage parameter for the evolution of stress/strain
effect. The mean stress function in the form of power law for epoxy resin proposed by
Kujawski and Ellyin (1995) and Tao and Xia (2007b) is given below (equation 4.2).
n
a
m
a
m 1f
(4.2)
where σm and σa represents the mean stress and stress amplitude. The term η and n
are material constants. Similarly, the mean strain function can be written as
n
a
m
a
m 1f
(4.3)
where εm and εa represents the mean strain and strain amplitude. The equivalent
damage parameter (ψ) including the mean strain function is defined in equation 4. 4.
a
n
a
meq 1
(4.4)
For fully reverse cycles i.e. tension followed by compression loading the mean strain
is equal to zero (m = 0). Thus, equation 4. 4 becomes eq = -1, here the subscript -1
represents fully reversed cycle test. In case of strain approach, the equivalent damage
parameter can be clearly understood if the tests are conducted under fully reversed mode.
No mean strain effect exists in the fully reversed fatigue tests. Using statistical software
Systat version 12, a nonlinear equations are developed relating strain amplitude (a) and
fatigue life (Nf). The equation are generated by the regression analyses of the best fitting
curve (Figure 4.7 and Figure 4.8) drawn for the run order 18 and 23 having R-square value
0.861 and 0.993 respectively.
%5.0N.584.0051.0
feq - (For run order 18) (4.5)
Chapter 4 Parametric Assessment of Fatigue Life of FDM Build Parts
73
%5.0N.071.2432.0
feq - (For run order 23) (4.6)
It can be observed from equation 4. 6 and 4. 7 that the equivalent strain (eq) of the
build part varies along with the selection set of parameter setting. Hence, the material
properties of FDM build parts vary along with the selection set of parameters setting. For
the test within mean strain, the equation 4. 5 can be written as:
a
meq
a
f
1
(4.7)
FDM is one of the proficient RP processes that produces 3D complex models by
depositing heated filament one over another. Materials from the extruded nozzle are
placed accordingly as defined by the machining software (Insight 10.2). The semi-melted
plastic rapidly solidifies to chamber temperature (95°C), which develops thermos-residual
stress inside the build part causing adverse effect on build part. Since FDM is a parametric
controllable process, the strength and part quality are severely influenced by the process
parameters. Among all FDM parameters, six controllable process parameters such as
contour number, layer thickness, raster width, part orientation, raster angle and air gap are
considered to study their effect on FDM build parts experimentally. Other process
parameters such as part fill style, contour width, shrinkage factor, part interior style, delta
angle and perimeter to raster gap are kept constant. The process parameters considered
for experimental purpose are selected as described in Table 3.1.
FDM build part exhibits anisotropic effect when rasters are placed in a single
direction. To decrease the anisotropic effect to some extent, filaments are deposited in a
crisscross manner known as default raster fill pattern style. Furthermore, the potentiality
of the machine is explored in this research to modify the raster fill pattern so as to decrease
the anisotropic effect. The raster fill pattern controlled by delta angle is modified in such a
manner that the raster angle will change at an incremental angle of 300 to its previously
placed rasters in the adjacent layer (Figure 3. 4). By changing the raster orientation at an
incremental angle, FDM will place the rasters on the build platform in all direction with
respect to the z- axis.
In order to develop an empirical model for fatigue life of the FDM build parts,
experiments are conducted based on face centred central composite design (FCCCD) of
response surface methodology (RSM). 11. Parameters and their levels are considered as
shown in Table 3.1 for experimental purpose. For determining the fatigue life of FDM build
parts, specimens are manufactured in accordance with ASTM D638 standard (Figure 4.1).
Specimens are fabricated using FDM FORTUS 400mc (manufactured by Stratasys, USA)
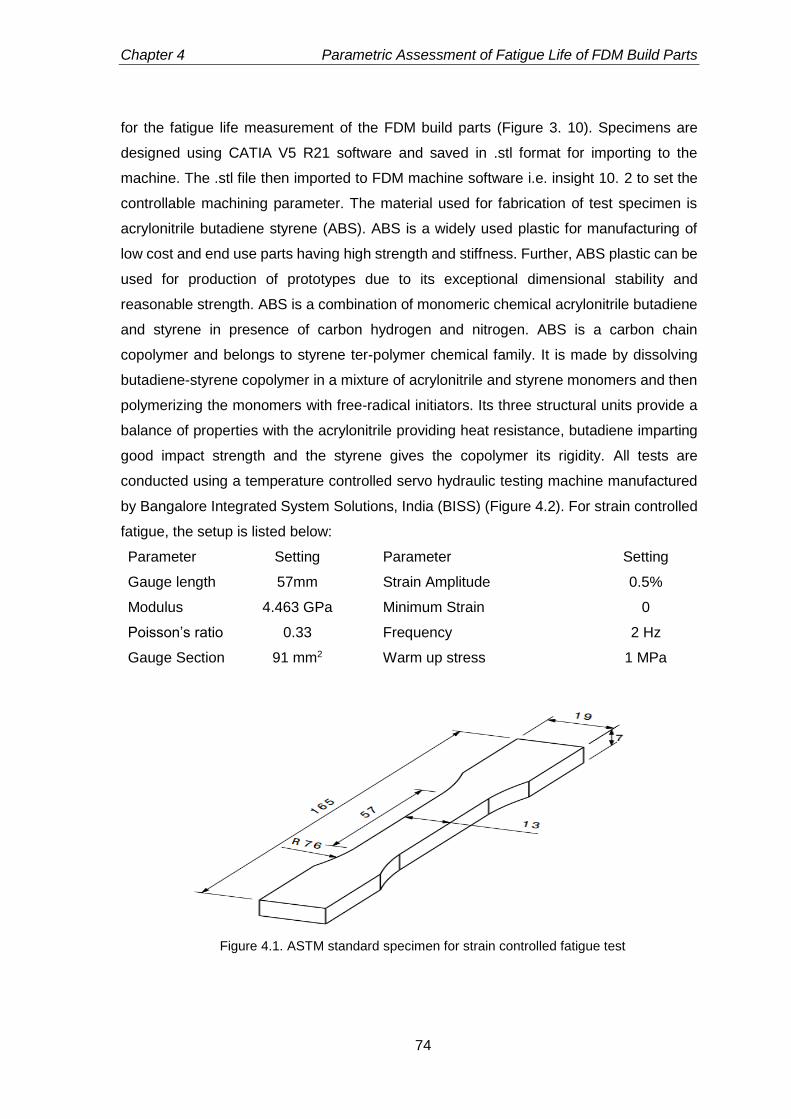
Chapter 4 Parametric Assessment of Fatigue Life of FDM Build Parts
74
for the fatigue life measurement of the FDM build parts (Figure 3. 10). Specimens are
designed using CATIA V5 R21 software and saved in .stl format for importing to the
machine. The .stl file then imported to FDM machine software i.e. insight 10. 2 to set the
controllable machining parameter. The material used for fabrication of test specimen is
acrylonitrile butadiene styrene (ABS). ABS is a widely used plastic for manufacturing of
low cost and end use parts having high strength and stiffness. Further, ABS plastic can be
used for production of prototypes due to its exceptional dimensional stability and
reasonable strength. ABS is a combination of monomeric chemical acrylonitrile butadiene
and styrene in presence of carbon hydrogen and nitrogen. ABS is a carbon chain
copolymer and belongs to styrene ter-polymer chemical family. It is made by dissolving
butadiene-styrene copolymer in a mixture of acrylonitrile and styrene monomers and then
polymerizing the monomers with free-radical initiators. Its three structural units provide a
balance of properties with the acrylonitrile providing heat resistance, butadiene imparting
good impact strength and the styrene gives the copolymer its rigidity. All tests are
conducted using a temperature controlled servo hydraulic testing machine manufactured
by Bangalore Integrated System Solutions, India (BISS) (Figure 4.2). For strain controlled
fatigue, the setup is listed below:
Parameter Setting Parameter Setting
Gauge length 57mm Strain Amplitude 0.5%
Modulus 4.463 GPa Minimum Strain 0
Poisson’s ratio 0.33 Frequency 2 Hz
Gauge Section 91 mm2 Warm up stress 1 MPa
Figure 4.1. ASTM standard specimen for strain controlled fatigue test
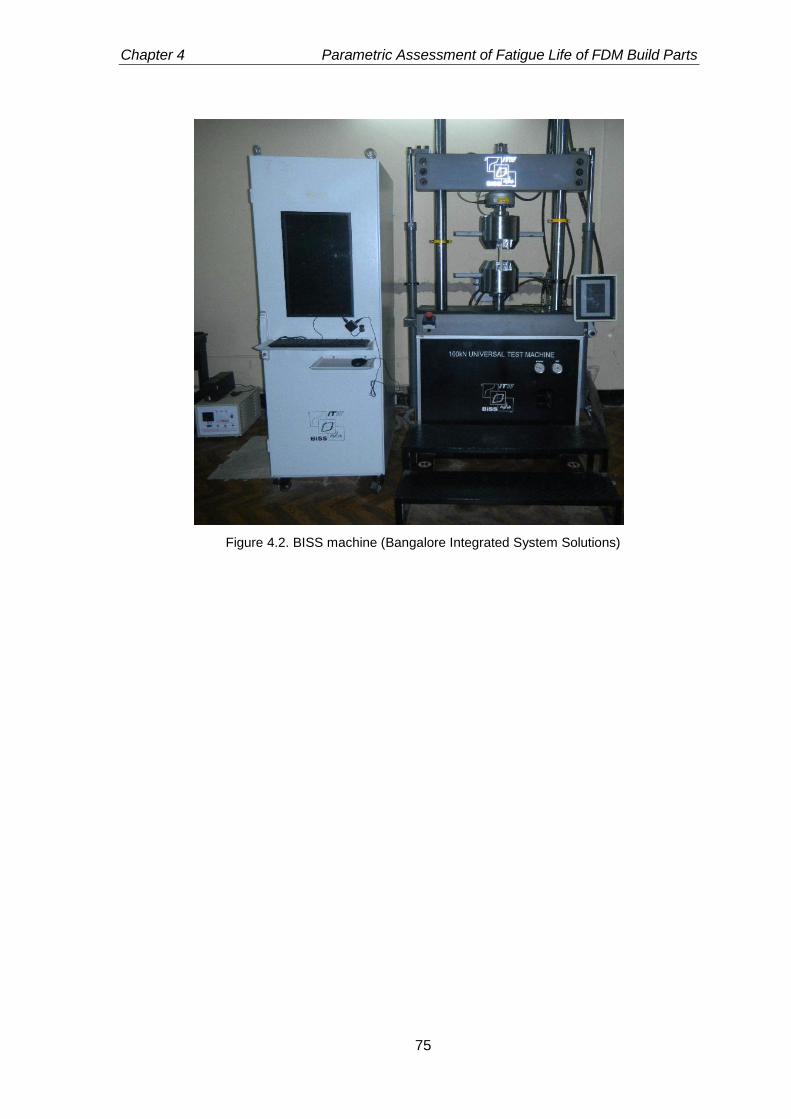
Chapter 4 Parametric Assessment of Fatigue Life of FDM Build Parts
75
Figure 4.2. BISS machine (Bangalore Integrated System Solutions)
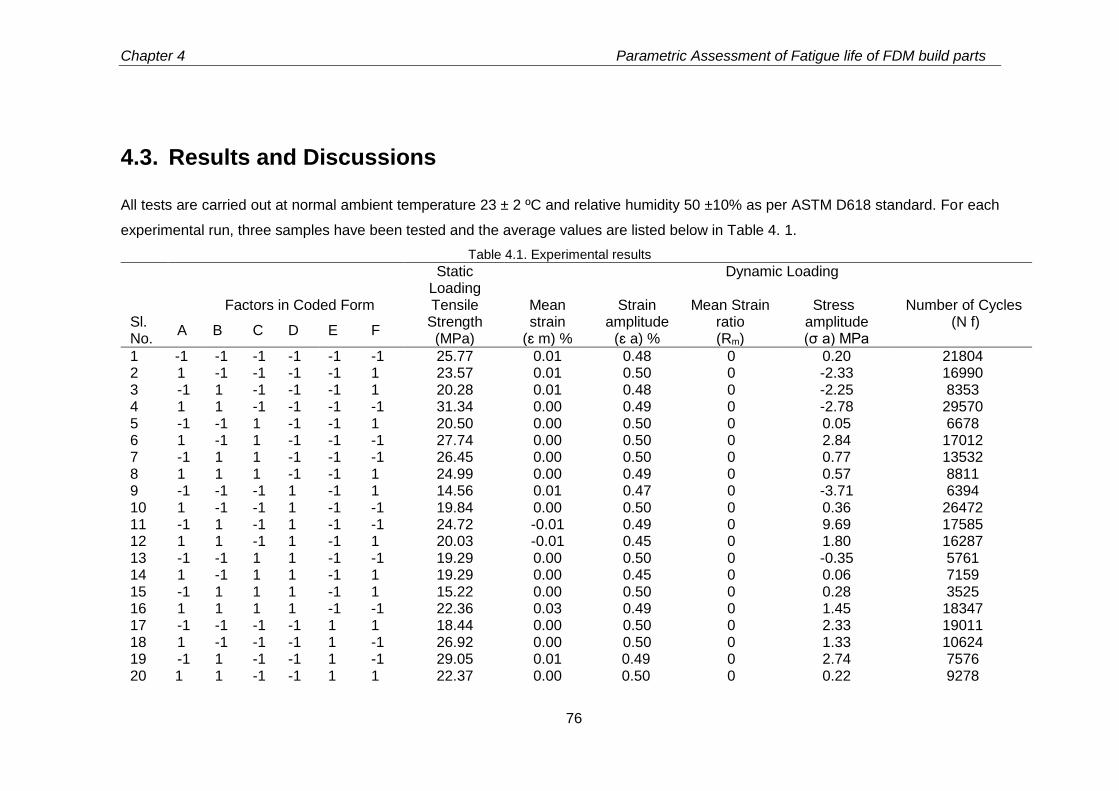
Chapter 4 Parametric Assessment of Fatigue life of FDM build parts
76
4.3. Results and Discussions
All tests are carried out at normal ambient temperature 23 ± 2 ºC and relative humidity 50 ±10% as per ASTM D618 standard. For each
experimental run, three samples have been tested and the average values are listed below in Table 4. 1.
Table 4.1. Experimental results
Static Loading
Dynamic Loading
Sl. No.
Factors in Coded Form Tensile Strength (MPa)
Mean strain
(ɛ m) %
Strain amplitude
(ɛ a) %
Mean Strain ratio (Rm)
Stress amplitude (σ a) MPa
Number of Cycles (N f)
A B C D E F
1 -1 -1 -1 -1 -1 -1 25.77 0.01 0.48 0 0.20 21804 2 1 -1 -1 -1 -1 1 23.57 0.01 0.50 0 -2.33 16990 3 -1 1 -1 -1 -1 1 20.28 0.01 0.48 0 -2.25 8353 4 1 1 -1 -1 -1 -1 31.34 0.00 0.49 0 -2.78 29570 5 -1 -1 1 -1 -1 1 20.50 0.00 0.50 0 0.05 6678 6 1 -1 1 -1 -1 -1 27.74 0.00 0.50 0 2.84 17012 7 -1 1 1 -1 -1 -1 26.45 0.00 0.50 0 0.77 13532 8 1 1 1 -1 -1 1 24.99 0.00 0.49 0 0.57 8811 9 -1 -1 -1 1 -1 1 14.56 0.01 0.47 0 -3.71 6394 10 1 -1 -1 1 -1 -1 19.84 0.00 0.50 0 0.36 26472 11 -1 1 -1 1 -1 -1 24.72 -0.01 0.49 0 9.69 17585 12 1 1 -1 1 -1 1 20.03 -0.01 0.45 0 1.80 16287 13 -1 -1 1 1 -1 -1 19.29 0.00 0.50 0 -0.35 5761 14 1 -1 1 1 -1 1 19.29 0.00 0.45 0 0.06 7159 15 -1 1 1 1 -1 1 15.22 0.00 0.50 0 0.28 3525 16 1 1 1 1 -1 -1 22.36 0.03 0.49 0 1.45 18347 17 -1 -1 -1 -1 1 1 18.44 0.00 0.50 0 2.33 19011 18 1 -1 -1 -1 1 -1 26.92 0.00 0.50 0 1.33 10624 19 -1 1 -1 -1 1 -1 29.05 0.01 0.49 0 2.74 7576 20 1 1 -1 -1 1 1 22.37 0.00 0.50 0 0.22 9278
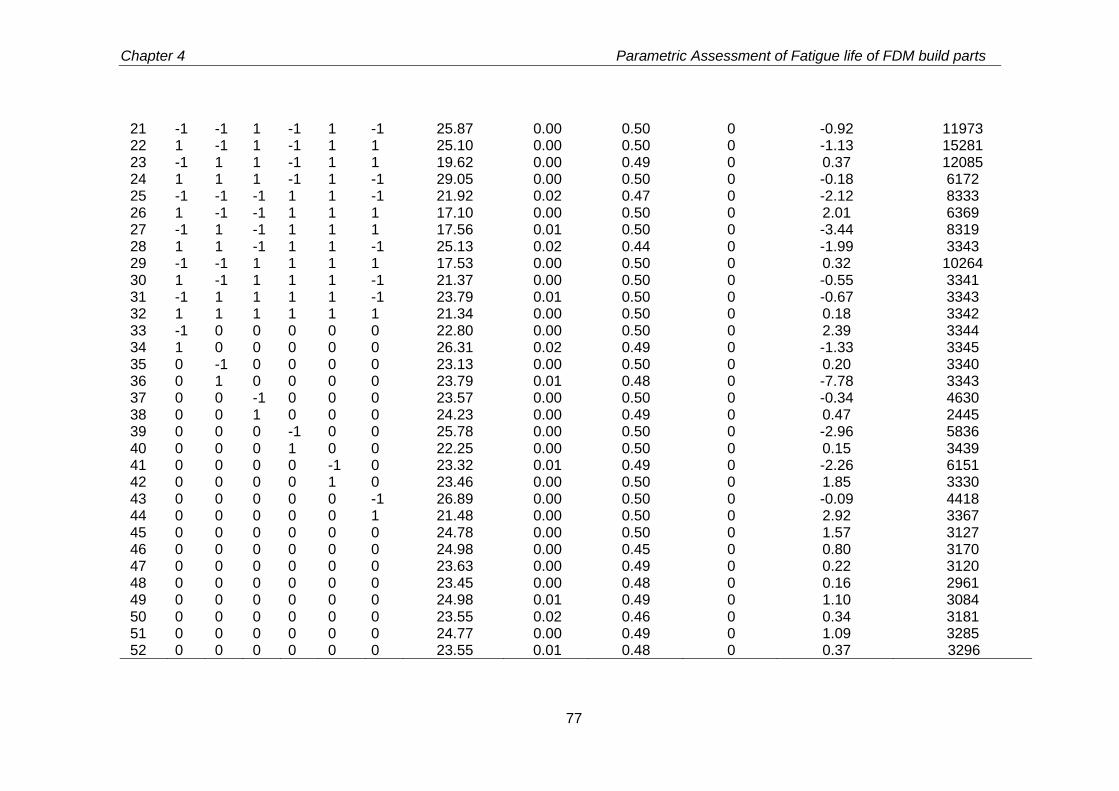
Chapter 4 Parametric Assessment of Fatigue life of FDM build parts
77
21 -1 -1 1 -1 1 -1 25.87 0.00 0.50 0 -0.92 11973 22 1 -1 1 -1 1 1 25.10 0.00 0.50 0 -1.13 15281 23 -1 1 1 -1 1 1 19.62 0.00 0.49 0 0.37 12085 24 1 1 1 -1 1 -1 29.05 0.00 0.50 0 -0.18 6172 25 -1 -1 -1 1 1 -1 21.92 0.02 0.47 0 -2.12 8333 26 1 -1 -1 1 1 1 17.10 0.00 0.50 0 2.01 6369 27 -1 1 -1 1 1 1 17.56 0.01 0.50 0 -3.44 8319 28 1 1 -1 1 1 -1 25.13 0.02 0.44 0 -1.99 3343 29 -1 -1 1 1 1 1 17.53 0.00 0.50 0 0.32 10264 30 1 -1 1 1 1 -1 21.37 0.00 0.50 0 -0.55 3341 31 -1 1 1 1 1 -1 23.79 0.01 0.50 0 -0.67 3343 32 1 1 1 1 1 1 21.34 0.00 0.50 0 0.18 3342 33 -1 0 0 0 0 0 22.80 0.00 0.50 0 2.39 3344 34 1 0 0 0 0 0 26.31 0.02 0.49 0 -1.33 3345 35 0 -1 0 0 0 0 23.13 0.00 0.50 0 0.20 3340 36 0 1 0 0 0 0 23.79 0.01 0.48 0 -7.78 3343 37 0 0 -1 0 0 0 23.57 0.00 0.50 0 -0.34 4630 38 0 0 1 0 0 0 24.23 0.00 0.49 0 0.47 2445 39 0 0 0 -1 0 0 25.78 0.00 0.50 0 -2.96 5836 40 0 0 0 1 0 0 22.25 0.00 0.50 0 0.15 3439 41 0 0 0 0 -1 0 23.32 0.01 0.49 0 -2.26 6151 42 0 0 0 0 1 0 23.46 0.00 0.50 0 1.85 3330 43 0 0 0 0 0 -1 26.89 0.00 0.50 0 -0.09 4418 44 0 0 0 0 0 1 21.48 0.00 0.50 0 2.92 3367 45 0 0 0 0 0 0 24.78 0.00 0.50 0 1.57 3127 46 0 0 0 0 0 0 24.98 0.00 0.45 0 0.80 3170 47 0 0 0 0 0 0 23.63 0.00 0.49 0 0.22 3120 48 0 0 0 0 0 0 23.45 0.00 0.48 0 0.16 2961 49 0 0 0 0 0 0 24.98 0.01 0.49 0 1.10 3084 50 0 0 0 0 0 0 23.55 0.02 0.46 0 0.34 3181 51 0 0 0 0 0 0 24.77 0.00 0.49 0 1.09 3285 52 0 0 0 0 0 0 23.55 0.01 0.48 0 0.37 3296
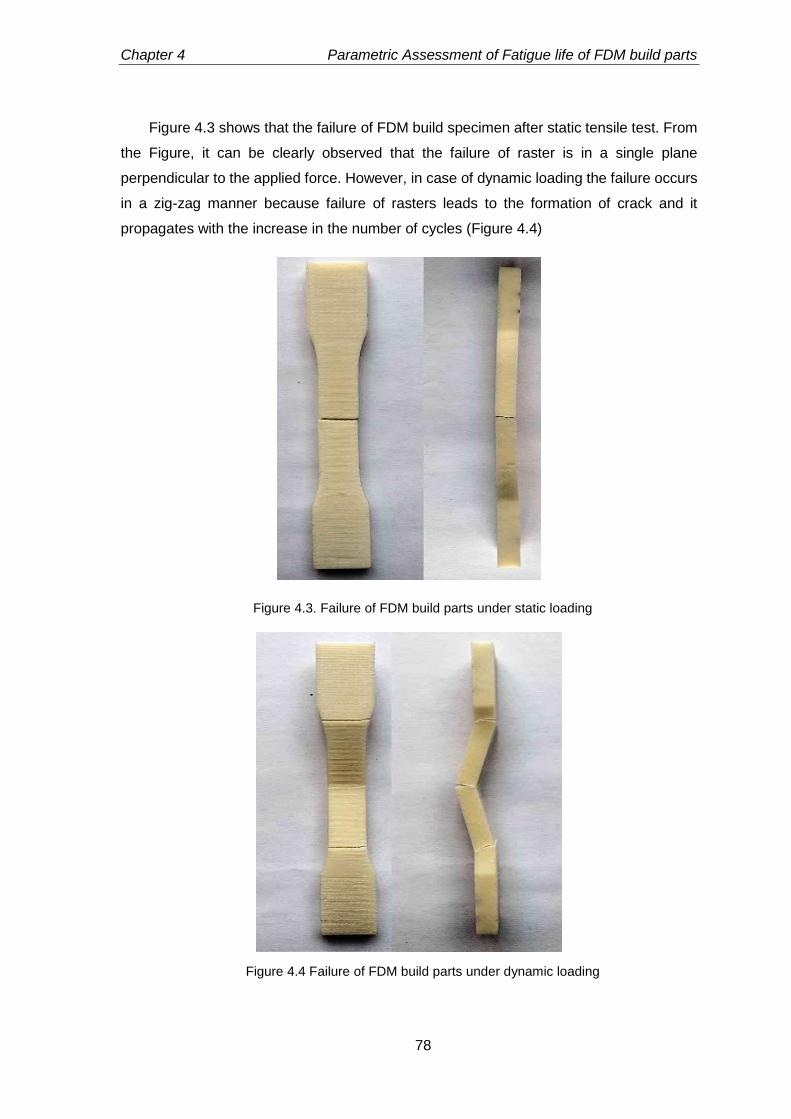
Chapter 4 Parametric Assessment of Fatigue life of FDM build parts
78
Figure 4.3 shows that the failure of FDM build specimen after static tensile test. From
the Figure, it can be clearly observed that the failure of raster is in a single plane
perpendicular to the applied force. However, in case of dynamic loading the failure occurs
in a zig-zag manner because failure of rasters leads to the formation of crack and it
propagates with the increase in the number of cycles (Figure 4.4)
Figure 4.3. Failure of FDM build parts under static loading
Figure 4.4 Failure of FDM build parts under dynamic loading
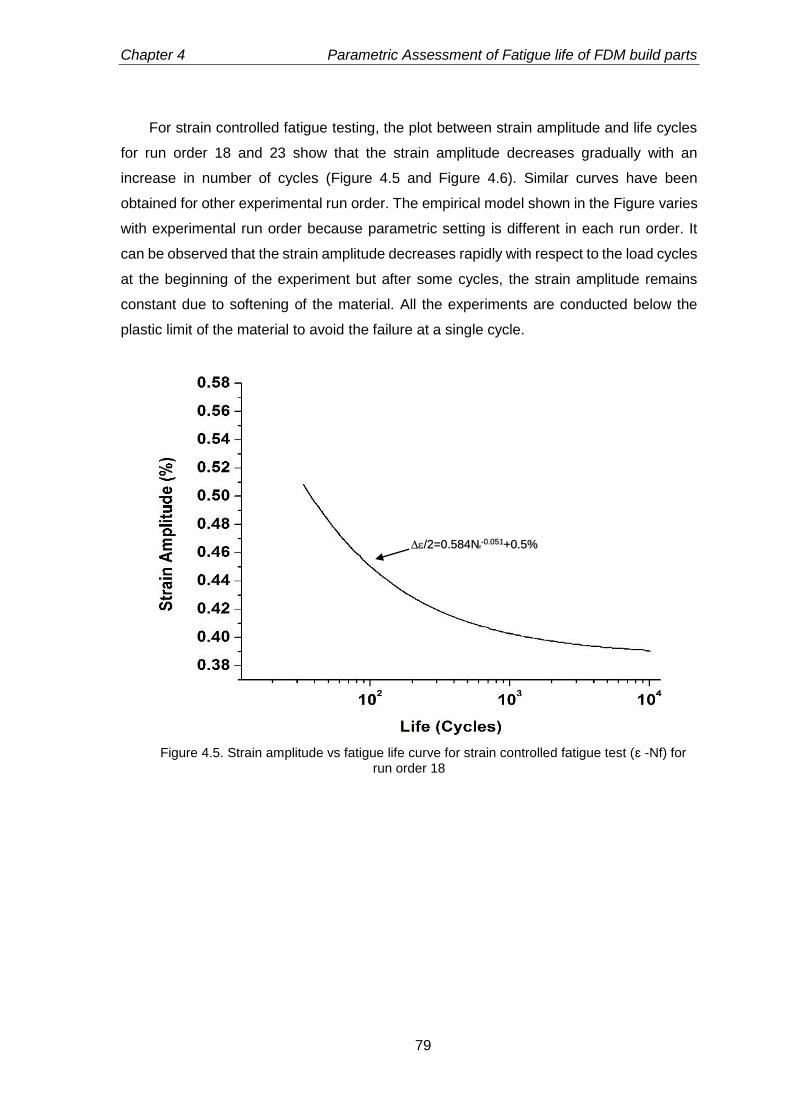
Chapter 4 Parametric Assessment of Fatigue life of FDM build parts
79
For strain controlled fatigue testing, the plot between strain amplitude and life cycles
for run order 18 and 23 show that the strain amplitude decreases gradually with an
increase in number of cycles (Figure 4.5 and Figure 4.6). Similar curves have been
obtained for other experimental run order. The empirical model shown in the Figure varies
with experimental run order because parametric setting is different in each run order. It
can be observed that the strain amplitude decreases rapidly with respect to the load cycles
at the beginning of the experiment but after some cycles, the strain amplitude remains
constant due to softening of the material. All the experiments are conducted below the
plastic limit of the material to avoid the failure at a single cycle.
Figure 4.5. Strain amplitude vs fatigue life curve for strain controlled fatigue test (ɛ -Nf) for run order 18
/2=0.584Nf-0.051+0.5%
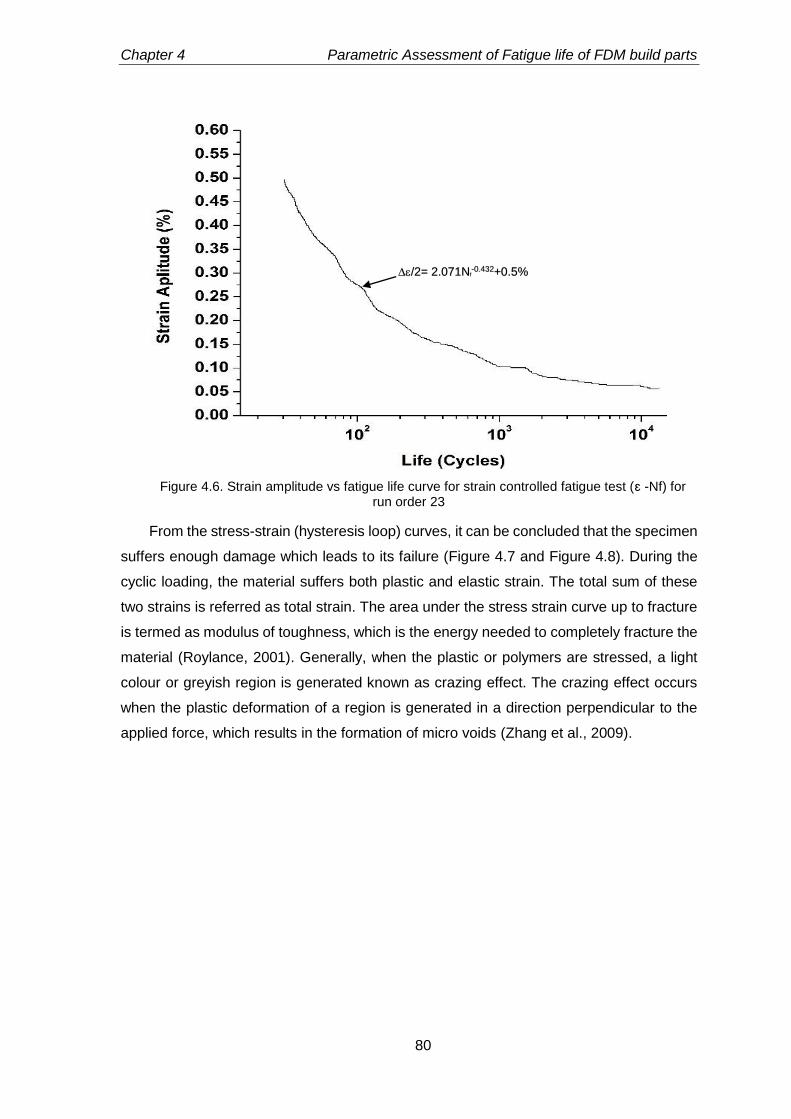
Chapter 4 Parametric Assessment of Fatigue life of FDM build parts
80
Figure 4.6. Strain amplitude vs fatigue life curve for strain controlled fatigue test (ɛ -Nf) for run order 23
From the stress-strain (hysteresis loop) curves, it can be concluded that the specimen
suffers enough damage which leads to its failure (Figure 4.7 and Figure 4.8). During the
cyclic loading, the material suffers both plastic and elastic strain. The total sum of these
two strains is referred as total strain. The area under the stress strain curve up to fracture
is termed as modulus of toughness, which is the energy needed to completely fracture the
material (Roylance, 2001). Generally, when the plastic or polymers are stressed, a light
colour or greyish region is generated known as crazing effect. The crazing effect occurs
when the plastic deformation of a region is generated in a direction perpendicular to the
applied force, which results in the formation of micro voids (Zhang et al., 2009).
/2= 2.071Nf-0.432+0.5%
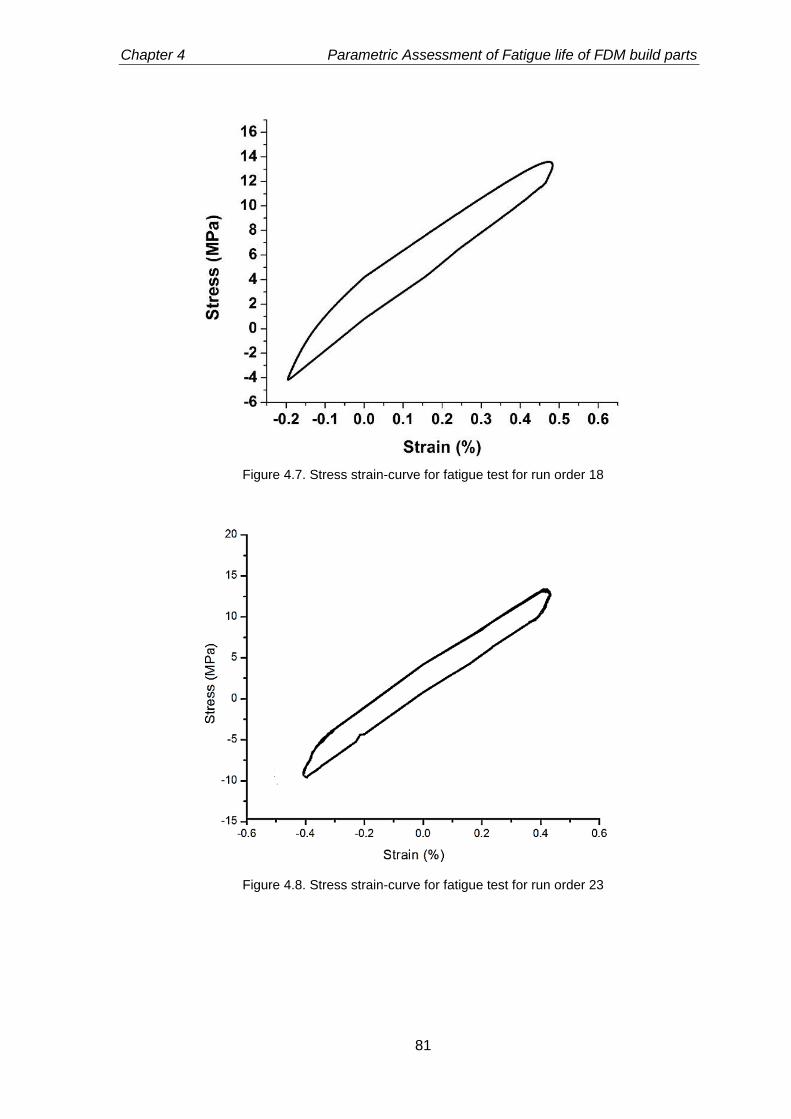
Chapter 4 Parametric Assessment of Fatigue life of FDM build parts
81
Figure 4.7. Stress strain-curve for fatigue test for run order 18
Figure 4.8. Stress strain-curve for fatigue test for run order 23
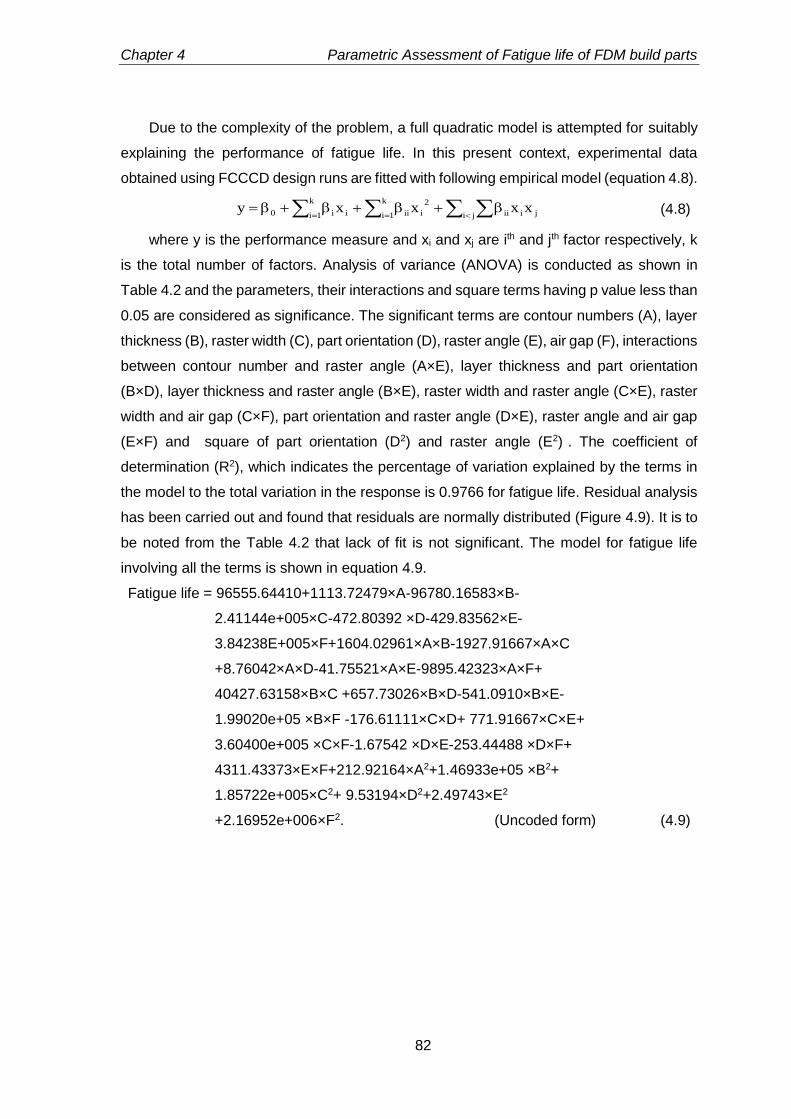
Chapter 4 Parametric Assessment of Fatigue life of FDM build parts
82
Due to the complexity of the problem, a full quadratic model is attempted for suitably
explaining the performance of fatigue life. In this present context, experimental data
obtained using FCCCD design runs are fitted with following empirical model (equation 4.8).
jiji ii
2
i
k
1i iii
k
1i i0 xxxxy (4.8)
where y is the performance measure and xi and xj are ith and jth factor respectively, k
is the total number of factors. Analysis of variance (ANOVA) is conducted as shown in
Table 4.2 and the parameters, their interactions and square terms having p value less than
0.05 are considered as significance. The significant terms are contour numbers (A), layer
thickness (B), raster width (C), part orientation (D), raster angle (E), air gap (F), interactions
between contour number and raster angle (A×E), layer thickness and part orientation
(B×D), layer thickness and raster angle (B×E), raster width and raster angle (C×E), raster
width and air gap (C×F), part orientation and raster angle (D×E), raster angle and air gap
(E×F) and square of part orientation (D2) and raster angle (E2) . The coefficient of
determination (R2), which indicates the percentage of variation explained by the terms in
the model to the total variation in the response is 0.9766 for fatigue life. Residual analysis
has been carried out and found that residuals are normally distributed (Figure 4.9). It is to
be noted from the Table 4.2 that lack of fit is not significant. The model for fatigue life
involving all the terms is shown in equation 4.9.
Fatigue life = 96555.64410+1113.72479×A-96780.16583×B-
2.41144e+005×C-472.80392 ×D-429.83562×E-
3.84238E+005×F+1604.02961×A×B-1927.91667×A×C
+8.76042×A×D-41.75521×A×E-9895.42323×A×F+
40427.63158×B×C +657.73026×B×D-541.0910×B×E-
1.99020e+05 ×B×F -176.61111×C×D+ 771.91667×C×E+
3.60400e+005 ×C×F-1.67542 ×D×E-253.44488 ×D×F+
4311.43373×E×F+212.92164×A2+1.46933e+05 ×B2+
1.85722e+005×C2+ 9.53194×D2+2.49743×E2
+2.16952e+006×F2. (Uncoded form) (4.9)
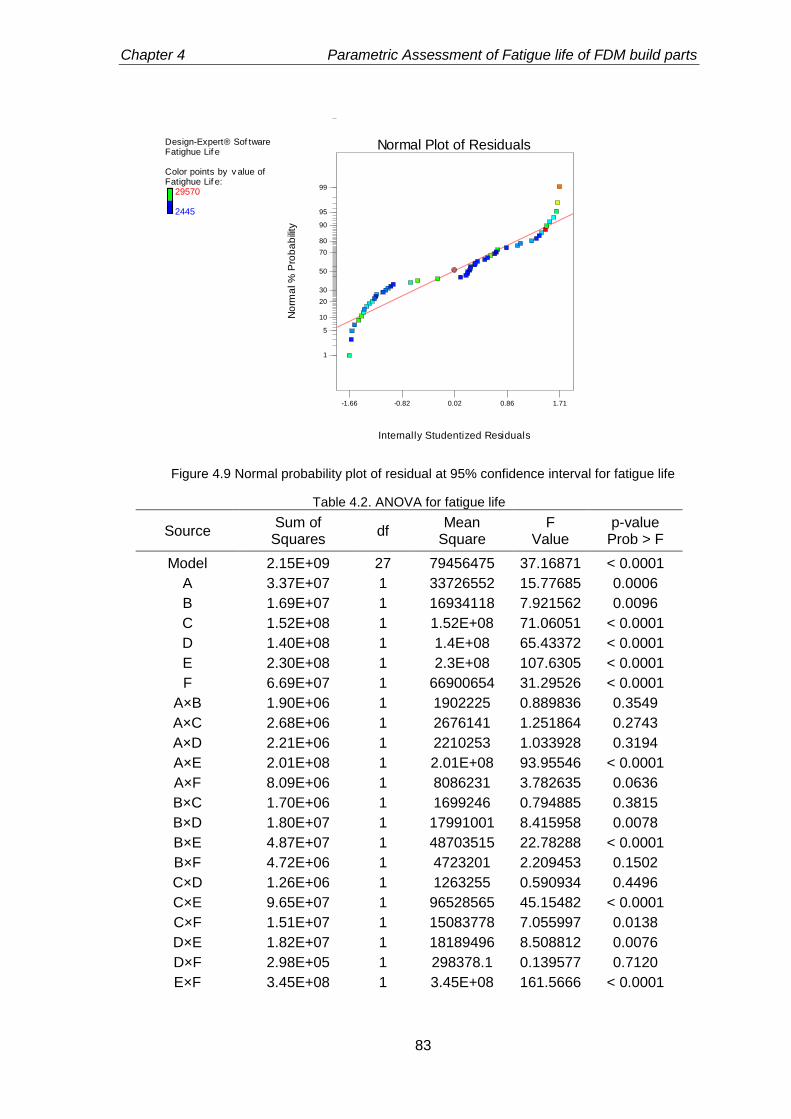
Chapter 4 Parametric Assessment of Fatigue life of FDM build parts
83
Figure 4.9 Normal probability plot of residual at 95% confidence interval for fatigue life
Table 4.2. ANOVA for fatigue life
Source Sum of
Squares df
Mean Square
F Value
p-value Prob > F
Model 2.15E+09 27 79456475 37.16871 < 0.0001
A 3.37E+07 1 33726552 15.77685 0.0006
B 1.69E+07 1 16934118 7.921562 0.0096
C 1.52E+08 1 1.52E+08 71.06051 < 0.0001
D 1.40E+08 1 1.4E+08 65.43372 < 0.0001
E 2.30E+08 1 2.3E+08 107.6305 < 0.0001
F 6.69E+07 1 66900654 31.29526 < 0.0001
A×B 1.90E+06 1 1902225 0.889836 0.3549
A×C 2.68E+06 1 2676141 1.251864 0.2743
A×D 2.21E+06 1 2210253 1.033928 0.3194
A×E 2.01E+08 1 2.01E+08 93.95546 < 0.0001
A×F 8.09E+06 1 8086231 3.782635 0.0636
B×C 1.70E+06 1 1699246 0.794885 0.3815
B×D 1.80E+07 1 17991001 8.415958 0.0078
B×E 4.87E+07 1 48703515 22.78288 < 0.0001
B×F 4.72E+06 1 4723201 2.209453 0.1502
C×D 1.26E+06 1 1263255 0.590934 0.4496
C×E 9.65E+07 1 96528565 45.15482 < 0.0001
C×F 1.51E+07 1 15083778 7.055997 0.0138
D×E 1.82E+07 1 18189496 8.508812 0.0076
D×F 2.98E+05 1 298378.1 0.139577 0.7120
E×F 3.45E+08 1 3.45E+08 161.5666 < 0.0001
Design-Expert® Sof twareFatighue Lif e
Color points by v alue ofFatighue Lif e:
29570
2445
Internally Studentized Residuals
No
rma
l %
Pro
ba
bili
ty
Normal Plot of Residuals
-1.66 -0.82 0.02 0.86 1.71
1
5
10
20
30
50
70
80
90
95
99
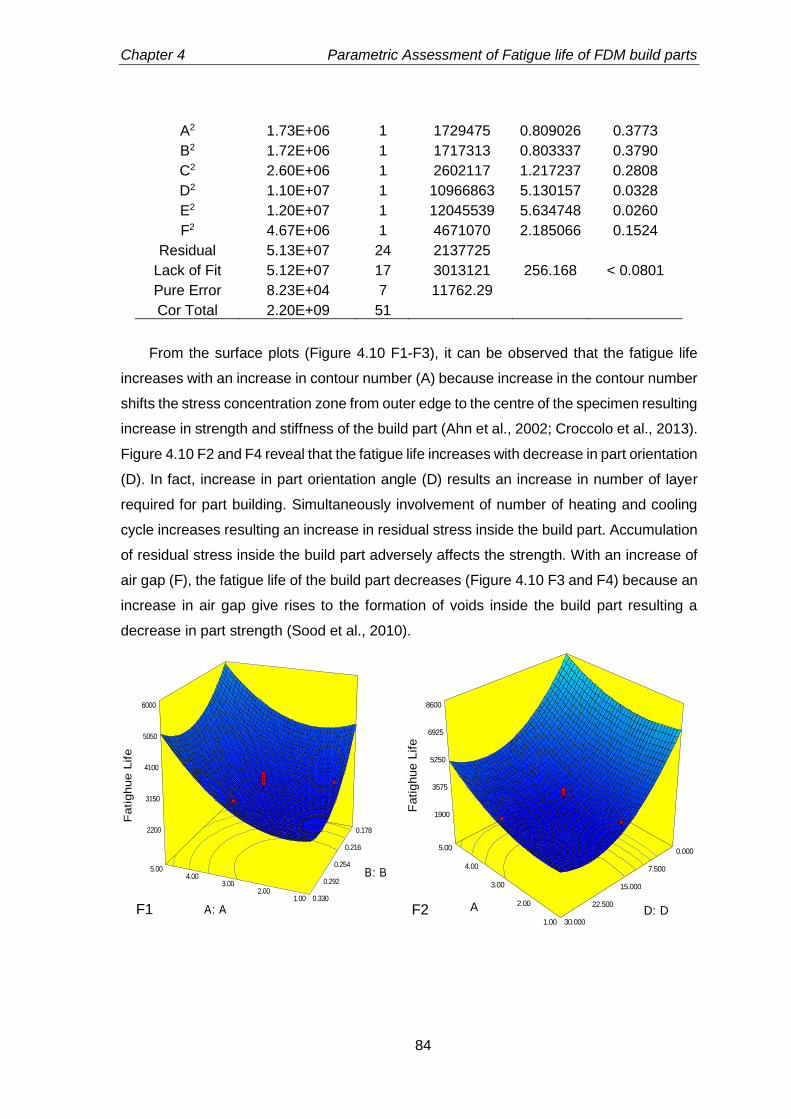
Chapter 4 Parametric Assessment of Fatigue life of FDM build parts
84
A2 1.73E+06 1 1729475 0.809026 0.3773
B2 1.72E+06 1 1717313 0.803337 0.3790
C2 2.60E+06 1 2602117 1.217237 0.2808
D2 1.10E+07 1 10966863 5.130157 0.0328
E2 1.20E+07 1 12045539 5.634748 0.0260
F2 4.67E+06 1 4671070 2.185066 0.1524
Residual 5.13E+07 24 2137725
Lack of Fit 5.12E+07 17 3013121 256.168 < 0.0801
Pure Error 8.23E+04 7 11762.29
Cor Total 2.20E+09 51
From the surface plots (Figure 4.10 F1-F3), it can be observed that the fatigue life
increases with an increase in contour number (A) because increase in the contour number
shifts the stress concentration zone from outer edge to the centre of the specimen resulting
increase in strength and stiffness of the build part (Ahn et al., 2002; Croccolo et al., 2013).
Figure 4.10 F2 and F4 reveal that the fatigue life increases with decrease in part orientation
(D). In fact, increase in part orientation angle (D) results an increase in number of layer
required for part building. Simultaneously involvement of number of heating and cooling
cycle increases resulting an increase in residual stress inside the build part. Accumulation
of residual stress inside the build part adversely affects the strength. With an increase of
air gap (F), the fatigue life of the build part decreases (Figure 4.10 F3 and F4) because an
increase in air gap give rises to the formation of voids inside the build part resulting a
decrease in part strength (Sood et al., 2010).
Design-Expert® Sof tware
Fatighue Lif e29570
2445
X1 = A: AX2 = B: B
Actual FactorsC: C = 0.4814D: D = 15.000E: E = 30.00F: F = 0.0254
1.00 2.00
3.00 4.00
5.00
0.178
0.216
0.254
0.292
0.330
2200
3150
4100
5050
6000
F
atighue L
ife
A: A
B: B
Design-Expert® Sof tware
Fatighue Lif e29570
2445
X1 = A: AX2 = D: D
Actual FactorsB: B = 0.254C: C = 0.4814E: E = 30.00F: F = 0.0254
1.00
2.00
3.00
4.00
5.00 0.000
7.500
15.000
22.500
30.000
1900
3575
5250
6925
8600
F
atig
hu
e L
ife
A: A D: D F1 F2
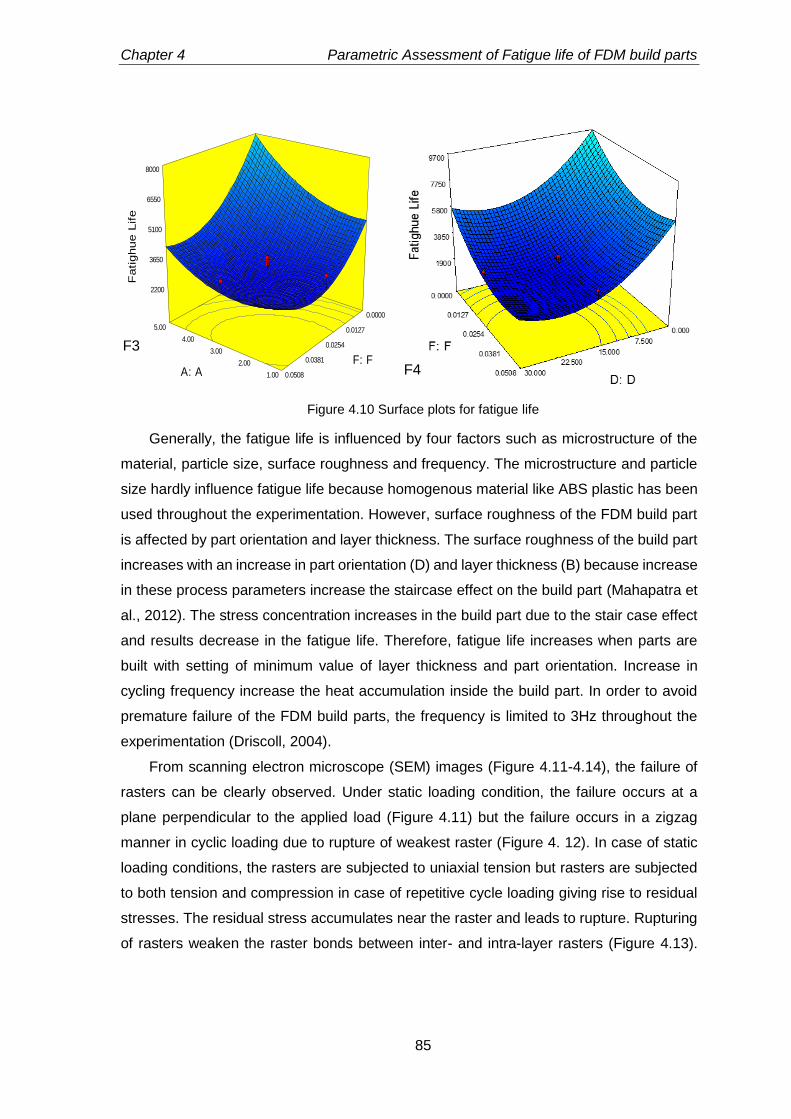
Chapter 4 Parametric Assessment of Fatigue life of FDM build parts
85
Figure 4.10 Surface plots for fatigue life
Generally, the fatigue life is influenced by four factors such as microstructure of the
material, particle size, surface roughness and frequency. The microstructure and particle
size hardly influence fatigue life because homogenous material like ABS plastic has been
used throughout the experimentation. However, surface roughness of the FDM build part
is affected by part orientation and layer thickness. The surface roughness of the build part
increases with an increase in part orientation (D) and layer thickness (B) because increase
in these process parameters increase the staircase effect on the build part (Mahapatra et
al., 2012). The stress concentration increases in the build part due to the stair case effect
and results decrease in the fatigue life. Therefore, fatigue life increases when parts are
built with setting of minimum value of layer thickness and part orientation. Increase in
cycling frequency increase the heat accumulation inside the build part. In order to avoid
premature failure of the FDM build parts, the frequency is limited to 3Hz throughout the
experimentation (Driscoll, 2004).
From scanning electron microscope (SEM) images (Figure 4.11-4.14), the failure of
rasters can be clearly observed. Under static loading condition, the failure occurs at a
plane perpendicular to the applied load (Figure 4.11) but the failure occurs in a zigzag
manner in cyclic loading due to rupture of weakest raster (Figure 4. 12). In case of static
loading conditions, the rasters are subjected to uniaxial tension but rasters are subjected
to both tension and compression in case of repetitive cycle loading giving rise to residual
stresses. The residual stress accumulates near the raster and leads to rupture. Rupturing
of rasters weaken the raster bonds between inter- and intra-layer rasters (Figure 4.13).
Design-Expert® Sof tware
Fatighue Lif e29570
2445
X1 = A: AX2 = F: F
Actual FactorsB: B = 0.254C: C = 0.4814D: D = 15.000E: E = 30.00
1.00
2.00
3.00
4.00
5.00
0.0000
0.0127
0.0254
0.0381
0.0508
2200
3650
5100
6550
8000
F
atig
hu
e L
ife
A: A F: F
F3
F4
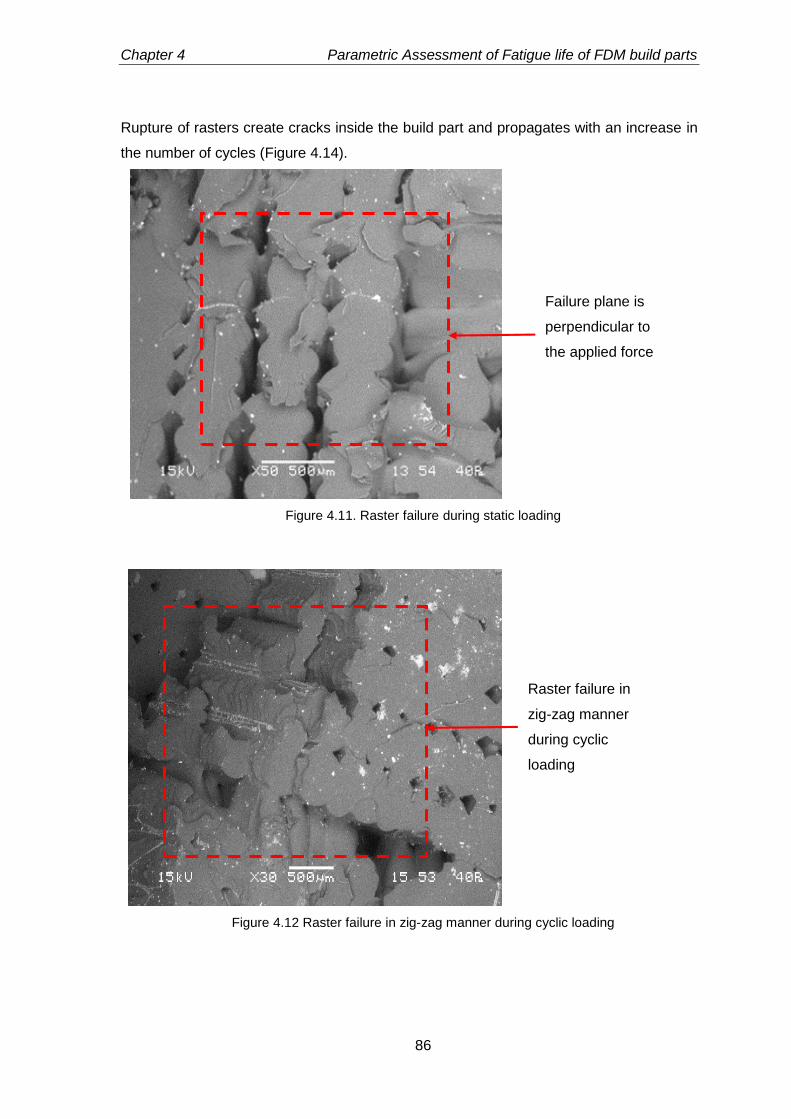
Chapter 4 Parametric Assessment of Fatigue life of FDM build parts
86
Rupture of rasters create cracks inside the build part and propagates with an increase in
the number of cycles (Figure 4.14).
Figure 4.11. Raster failure during static loading
Figure 4.12 Raster failure in zig-zag manner during cyclic loading
Failure plane is
perpendicular to
the applied force
Raster failure in
zig-zag manner
during cyclic
loading
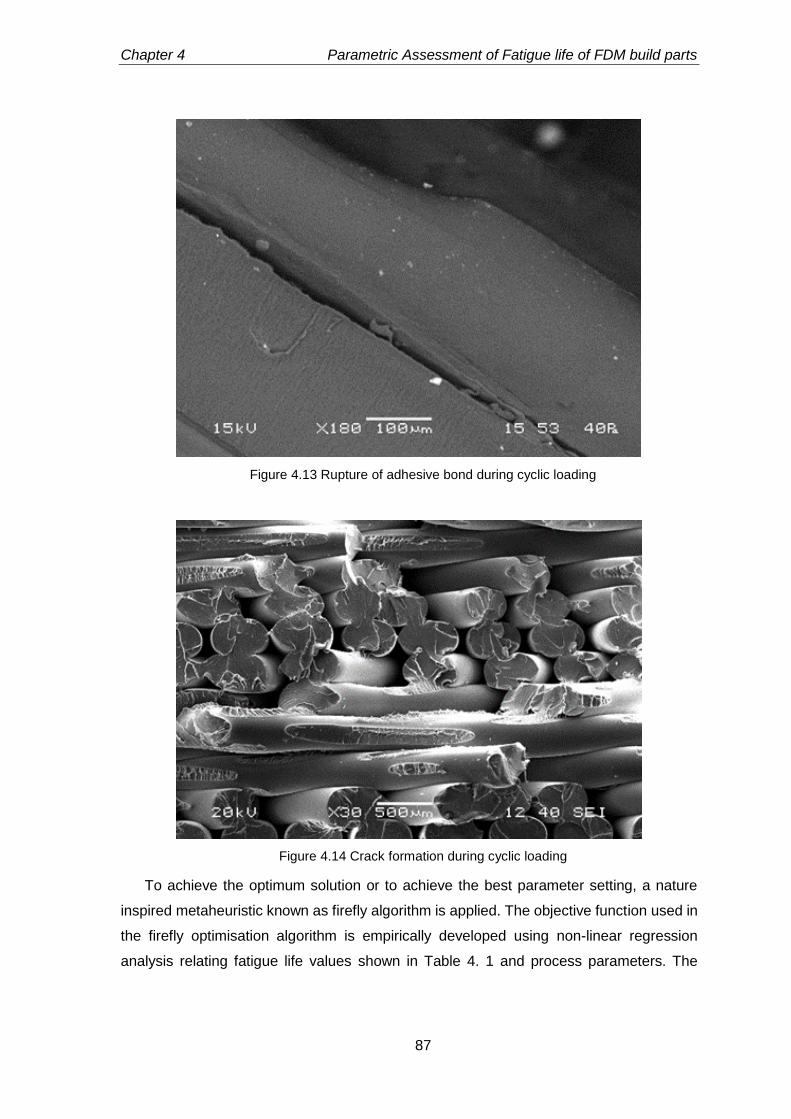
Chapter 4 Parametric Assessment of Fatigue life of FDM build parts
87
Figure 4.13 Rupture of adhesive bond during cyclic loading
Figure 4.14 Crack formation during cyclic loading
To achieve the optimum solution or to achieve the best parameter setting, a nature
inspired metaheuristic known as firefly algorithm is applied. The objective function used in
the firefly optimisation algorithm is empirically developed using non-linear regression
analysis relating fatigue life values shown in Table 4. 1 and process parameters. The
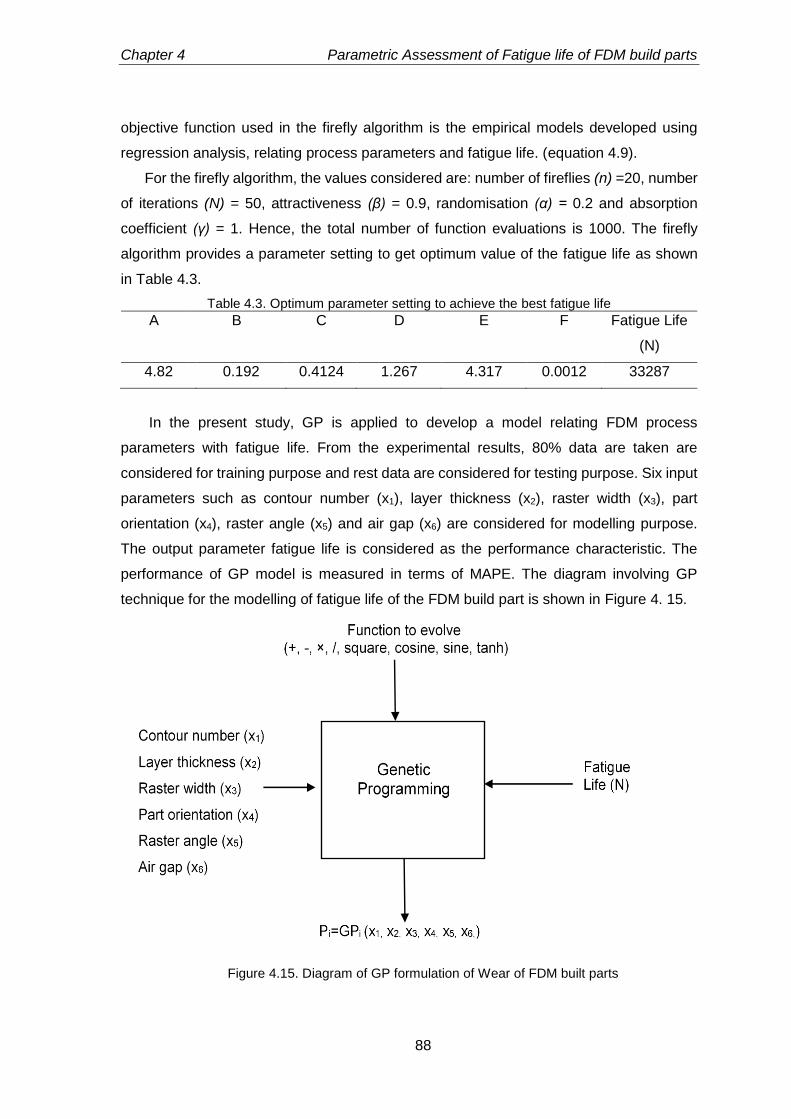
Chapter 4 Parametric Assessment of Fatigue life of FDM build parts
88
objective function used in the firefly algorithm is the empirical models developed using
regression analysis, relating process parameters and fatigue life. (equation 4.9).
For the firefly algorithm, the values considered are: number of fireflies (n) =20, number
of iterations (N) = 50, attractiveness (β) = 0.9, randomisation (α) = 0.2 and absorption
coefficient (γ) = 1. Hence, the total number of function evaluations is 1000. The firefly
algorithm provides a parameter setting to get optimum value of the fatigue life as shown
in Table 4.3.
Table 4.3. Optimum parameter setting to achieve the best fatigue life
A B C D E F Fatigue Life
(N)
4.82 0.192 0.4124 1.267 4.317 0.0012 33287
In the present study, GP is applied to develop a model relating FDM process
parameters with fatigue life. From the experimental results, 80% data are taken are
considered for training purpose and rest data are considered for testing purpose. Six input
parameters such as contour number (x1), layer thickness (x2), raster width (x3), part
orientation (x4), raster angle (x5) and air gap (x6) are considered for modelling purpose.
The output parameter fatigue life is considered as the performance characteristic. The
performance of GP model is measured in terms of MAPE. The diagram involving GP
technique for the modelling of fatigue life of the FDM build part is shown in Figure 4. 15.
Figure 4.15. Diagram of GP formulation of Wear of FDM built parts
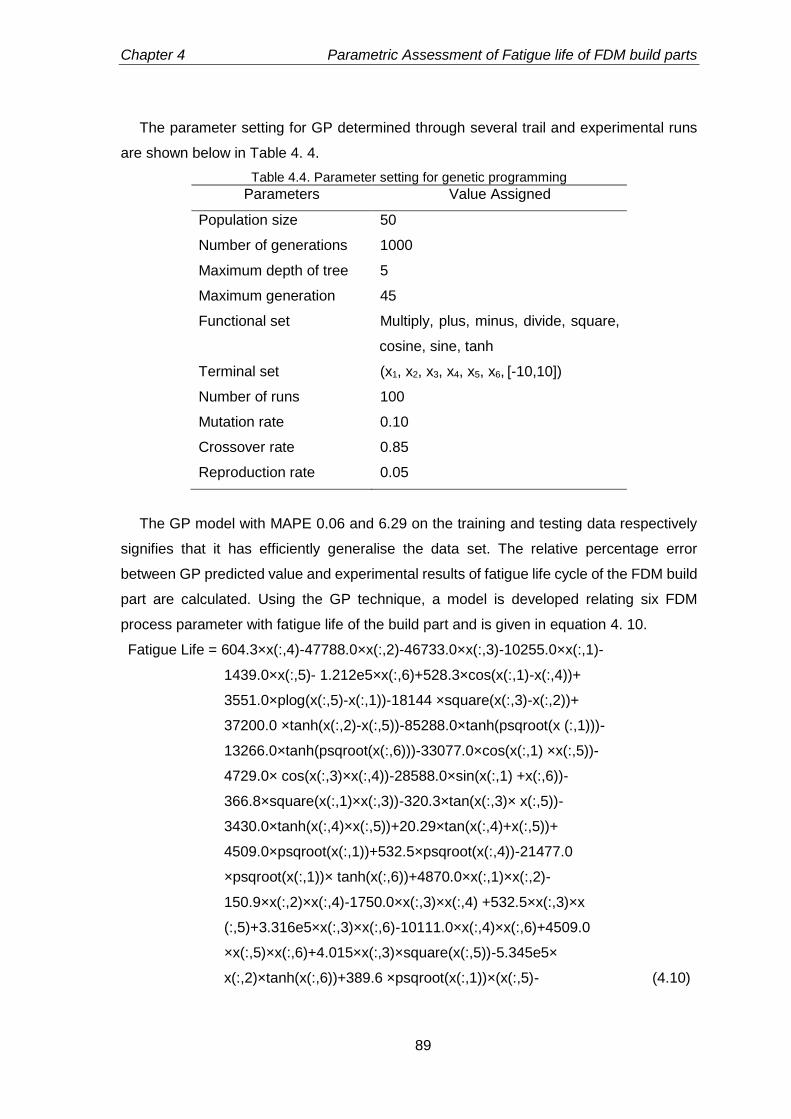
Chapter 4 Parametric Assessment of Fatigue life of FDM build parts
89
The parameter setting for GP determined through several trail and experimental runs
are shown below in Table 4. 4.
Table 4.4. Parameter setting for genetic programming
Parameters Value Assigned
Population size 50
Number of generations 1000
Maximum depth of tree 5
Maximum generation 45
Functional set Multiply, plus, minus, divide, square,
cosine, sine, tanh
Terminal set (x1, x2, x3, x4, x5, x6, [-10,10])
Number of runs 100
Mutation rate 0.10
Crossover rate 0.85
Reproduction rate 0.05
The GP model with MAPE 0.06 and 6.29 on the training and testing data respectively
signifies that it has efficiently generalise the data set. The relative percentage error
between GP predicted value and experimental results of fatigue life cycle of the FDM build
part are calculated. Using the GP technique, a model is developed relating six FDM
process parameter with fatigue life of the build part and is given in equation 4. 10.
Fatigue Life = 604.3×x(:,4)-47788.0×x(:,2)-46733.0×x(:,3)-10255.0×x(:,1)-
1439.0×x(:,5)- 1.212e5×x(:,6)+528.3×cos(x(:,1)-x(:,4))+
3551.0×plog(x(:,5)-x(:,1))-18144 ×square(x(:,3)-x(:,2))+
37200.0 ×tanh(x(:,2)-x(:,5))-85288.0×tanh(psqroot(x (:,1)))-
13266.0×tanh(psqroot(x(:,6)))-33077.0×cos(x(:,1) ×x(:,5))-
4729.0× cos(x(:,3)×x(:,4))-28588.0×sin(x(:,1) +x(:,6))-
366.8×square(x(:,1)×x(:,3))-320.3×tan(x(:,3)× x(:,5))-
3430.0×tanh(x(:,4)×x(:,5))+20.29×tan(x(:,4)+x(:,5))+
4509.0×psqroot(x(:,1))+532.5×psqroot(x(:,4))-21477.0
×psqroot(x(:,1))× tanh(x(:,6))+4870.0×x(:,1)×x(:,2)-
150.9×x(:,2)×x(:,4)-1750.0×x(:,3)×x(:,4) +532.5×x(:,3)×x
(:,5)+3.316e5×x(:,3)×x(:,6)-10111.0×x(:,4)×x(:,6)+4509.0
×x(:,5)×x(:,6)+4.015×x(:,3)×square(x(:,5))-5.345e5×
x(:,2)×tanh(x(:,6))+389.6 ×psqroot(x(:,1))×(x(:,5)- (4.10)
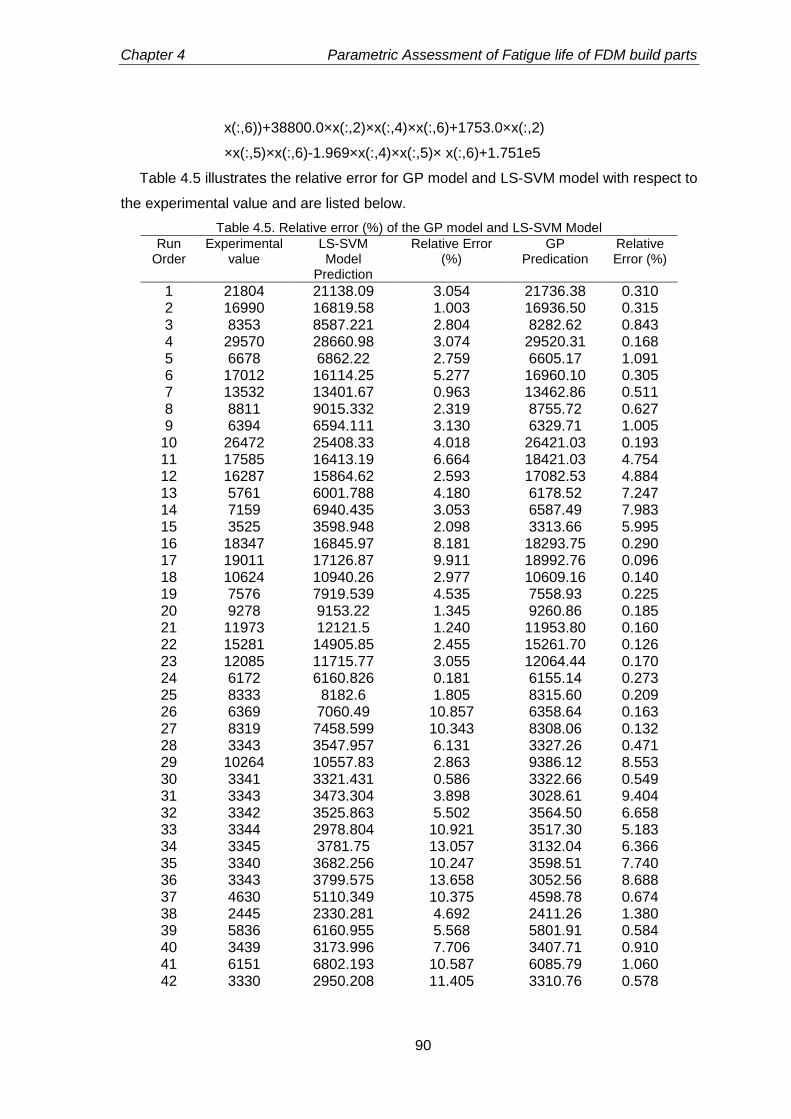
Chapter 4 Parametric Assessment of Fatigue life of FDM build parts
90
x(:,6))+38800.0×x(:,2)×x(:,4)×x(:,6)+1753.0×x(:,2)
×x(:,5)×x(:,6)-1.969×x(:,4)×x(:,5)× x(:,6)+1.751e5
Table 4.5 illustrates the relative error for GP model and LS-SVM model with respect to
the experimental value and are listed below.
Table 4.5. Relative error (%) of the GP model and LS-SVM Model
Run Order
Experimental value
LS-SVM Model
Prediction
Relative Error (%)
GP Predication
Relative Error (%)
1 21804 21138.09 3.054 21736.38 0.310 2 16990 16819.58 1.003 16936.50 0.315 3 8353 8587.221 2.804 8282.62 0.843 4 29570 28660.98 3.074 29520.31 0.168 5 6678 6862.22 2.759 6605.17 1.091 6 17012 16114.25 5.277 16960.10 0.305 7 13532 13401.67 0.963 13462.86 0.511 8 8811 9015.332 2.319 8755.72 0.627 9 6394 6594.111 3.130 6329.71 1.005
10 26472 25408.33 4.018 26421.03 0.193 11 17585 16413.19 6.664 18421.03 4.754 12 16287 15864.62 2.593 17082.53 4.884 13 5761 6001.788 4.180 6178.52 7.247 14 7159 6940.435 3.053 6587.49 7.983 15 3525 3598.948 2.098 3313.66 5.995 16 18347 16845.97 8.181 18293.75 0.290 17 19011 17126.87 9.911 18992.76 0.096 18 10624 10940.26 2.977 10609.16 0.140 19 7576 7919.539 4.535 7558.93 0.225 20 9278 9153.22 1.345 9260.86 0.185 21 11973 12121.5 1.240 11953.80 0.160 22 15281 14905.85 2.455 15261.70 0.126 23 12085 11715.77 3.055 12064.44 0.170 24 6172 6160.826 0.181 6155.14 0.273 25 8333 8182.6 1.805 8315.60 0.209 26 6369 7060.49 10.857 6358.64 0.163 27 8319 7458.599 10.343 8308.06 0.132 28 3343 3547.957 6.131 3327.26 0.471 29 10264 10557.83 2.863 9386.12 8.553 30 3341 3321.431 0.586 3322.66 0.549 31 3343 3473.304 3.898 3028.61 9.404 32 3342 3525.863 5.502 3564.50 6.658 33 3344 2978.804 10.921 3517.30 5.183 34 3345 3781.75 13.057 3132.04 6.366 35 3340 3682.256 10.247 3598.51 7.740 36 3343 3799.575 13.658 3052.56 8.688 37 4630 5110.349 10.375 4598.78 0.674 38 2445 2330.281 4.692 2411.26 1.380 39 5836 6160.955 5.568 5801.91 0.584 40 3439 3173.996 7.706 3407.71 0.910 41 6151 6802.193 10.587 6085.79 1.060 42 3330 2950.208 11.405 3310.76 0.578
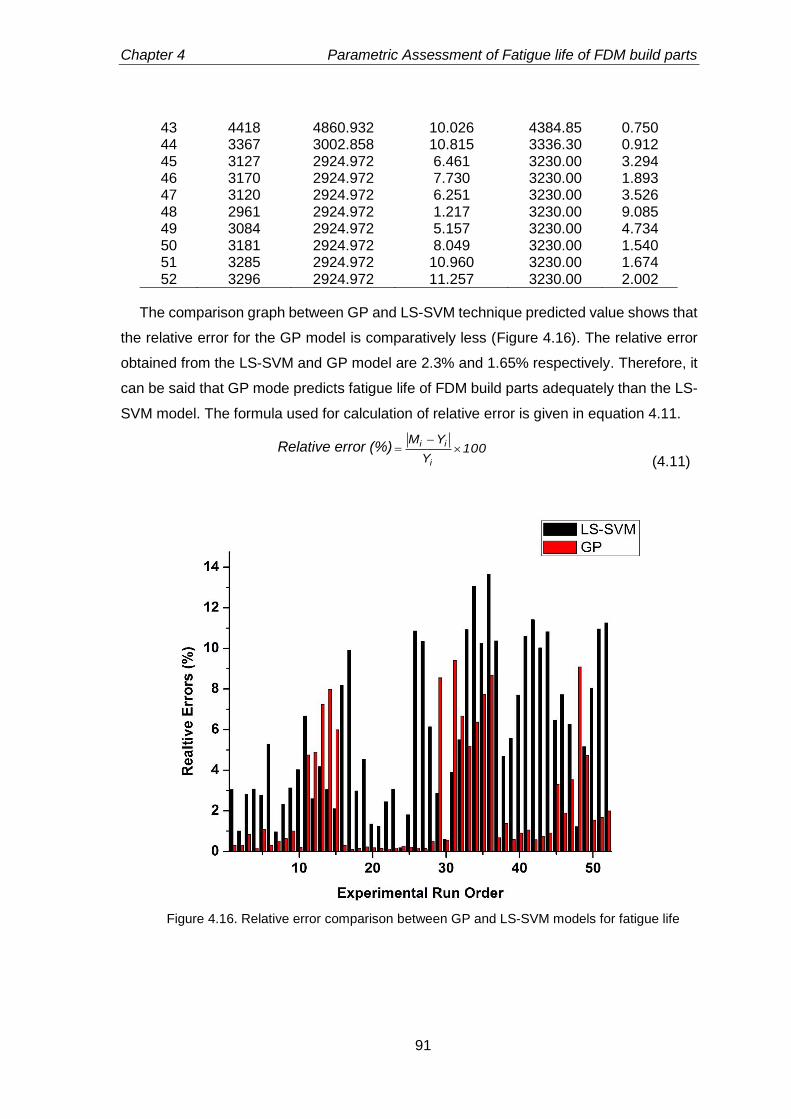
Chapter 4 Parametric Assessment of Fatigue life of FDM build parts
91
43 4418 4860.932 10.026 4384.85 0.750 44 3367 3002.858 10.815 3336.30 0.912 45 3127 2924.972 6.461 3230.00 3.294 46 3170 2924.972 7.730 3230.00 1.893 47 3120 2924.972 6.251 3230.00 3.526 48 2961 2924.972 1.217 3230.00 9.085 49 3084 2924.972 5.157 3230.00 4.734 50 3181 2924.972 8.049 3230.00 1.540 51 3285 2924.972 10.960 3230.00 1.674 52 3296 2924.972 11.257 3230.00 2.002
The comparison graph between GP and LS-SVM technique predicted value shows that
the relative error for the GP model is comparatively less (Figure 4.16). The relative error
obtained from the LS-SVM and GP model are 2.3% and 1.65% respectively. Therefore, it
can be said that GP mode predicts fatigue life of FDM build parts adequately than the LS-
SVM model. The formula used for calculation of relative error is given in equation 4.11.
Relative error (%) 100Y
YM
i
ii
(4.11)
Figure 4.16. Relative error comparison between GP and LS-SVM models for fatigue life
Chapter 4 Parametric Assessment of Fatigue life of FDM build parts
92
4.4. Conclusion
The effect of low cycle fatigue under fully reversed strain controlled mode on the FDM build
parts are experimentally studied and analysed. Influence of six FDM build parameters such
as contour number, raster angle, part orientation, air gap, raster width and layer thickness
on the fatigue life have been analysed using analysis of variance (ANOVA). The contour
number seems to be more important than other parameters since it shifts the stress
concentration zone from outer boundary to the centre of the specimen avoiding premature
failure of the build parts and helps to improve the stiffness and strength. The raster fill
pattern changes at an incremental angle of 30° to its previously placed raster fill pattern in
the adjacent layers which is helpful to reduce the anisotropic effect of the build parts in
comparison to the default raster fill pattern. Generally, build part having low surface
roughness exhibits high fatigue life. An increase in part orientation and layer thickness
increases the surface roughness of the build part due to the staircase effect. Therefore,
efforts must be made to reduce the staircase effect through controlling part orientation and
layer thickness in order to enhance fatigue life of build parts. Increase in layer thickness
and part orientation leads to residual stresses to be accumulated near the rasters due to
increase in number of cooling and heating cycle leading to failure of weak rasters and
rupturing of bond between rasters. Failure of bonds between rasters initiate formation
cracks inside the build part. Consequently, the crack propagates in a zigzag manner and
increases with an increase in the number of strain cycles. Since FDM process is a complex
one, it is difficult to develop a model relating fatigue life with the process parameters. Using
response surface methodology (RSM), a relation between process parameters with the
fatigue life is established. Using one nature inspired metaheuristic known as firefly
algorithm optimum parameter is suggested to improve the fatigue life of the build parts. In
order to improve the prediction capability, genetic programming (GP) and least square
support vector machine (LS-SVM) techniques are successfully adopted. Finally, the
predictive relations of GP and LS-SVM approaches are compared. It is observed that GP
predicts fatigue life in an accurate manner as compared to LS-SVM approach.
Parametric assessment of wear behaviour of FDM build parts
5.1. Introduction
Among all RP process, fused deposition modelling (FDM) is considered as the proficient
technology due to its ease of operation, reasonable durability of build parts and less
product development cycle (Dunne et al., 2004; Cheah et al., 2004; Pham and Gault,
1998). Since FDM is an additive manufacturing process, it offers a cost and time
advantage over conventional manufacturing processes (Upcraft and Fletcher, 2003; Chua
et al., 1999). However, due to the inherent build mechanism, performance characteristics
are largely influenced by the process parameters. In order to increase the reliability of the
FDM build parts, it is more essential to understand the effect of individual process
parameters on the performance characteristics. In this direction, previous chapters focus
on the assessment of static strength (Chapter 3) and assessment of fatigue life of the FDM
build parts (Chapter 4). These above said works reveal that properties of build part varies
with the selection of process parameters and can be improved by proper selection of
parameters. The effect of FDM process parameters such as layer thickness, raster angle,
air gap, raster width, model temperature and colour on strength have been extensively
studied (Ahn et al., 2002; Es said et al., 2000; Rayegani and Onwubolu, 2014; Sood et al.,
2010). The durability of the build part depends on the wear resistance offered during sliding
wear test. Less articles have been published addressing the wear behaviour of the RP
processed part (Sood et al., 2012; Singh and Singh 2015; Ramesh and Shrinivas, 2009;
Kumar and Kurth, 2008). To fill this research gap, present research work is focused on the
sliding wear behaviour of FDM build part and its relationship with the process parameters.
Since FDM process is complex one, it is really challenging to develop empirical models
which will help for ease understanding of the relation between process parameters and
wear behaviour. This analysis may be useful where sliding contact of mating surface
occurs such as gears, journal bearings, cams etc. when conventional parts are replaced
by FDM parts due to light weight and reasonable strength.
Chapter 5 Parametric Assessment of Wear Behaviour of FDM Build Parts
94
In order to assess the effect of process parameters on the wear behaviour of the FDM
build parts, six controllable process parameters such as contour number, layer thickness,
part orientation, raster width, raster angle and air gap are considered for experimental
purpose. Standard test specimens are manufactured using the Fortus 400mc (FDM
machine supplied by Stratasys) and tested according to ASTM G99-05 (standard test
method for wear testing with pin-on-disk apparatus) standards. Experiments have been
conducted based on face centred central composite design (FCCCD) of response surface
methodology (RSM) in order to standardise the experimental runs and to extract maximum
information from less experimental run orders. Sliding wear tests are conducted using pin
on disk apparatus and wear volumes are measured. The wear amount is calculated for
each build part by dividing the wear volume with the sliding distance (Sood et al., 2012)
Using analysis of variance (ANOVA) table the significance level of each process parameter
is checked. Using the surface plots, influence of process parameters on the wear
behaviour are analysed and discussed. From the SEM micrographs the failure criteria of
rasters, formation of pit and crack propagation inside the build part are analysed. Finally,
a nature inspired meta-heuristic known as firefly algorithm is applied to obtain a best
parametric combination for the improvement of wear behaviour of the FDM build part. To
predict the wear behaviour, two latest artificial intelligence techniques known as genetic
programming (GP) and least square support vector machine (LS-SVM) have been
adopted. The prediction model enables to predict the performance measures with
reasonable accuracy so that costly experimental time can be minimized.
5.2. Experimental Details
Fused deposition modelling manufacturing process is a parametric dependant process.
Some process parameters have large influence over the mechanical properties of the FDM
build parts. While used as an end use product, the wear (sliding) behaviour adversely
affects the durability of the FDM build part. Therefore, present research work is devoted to
study the effect of some important controllable process parameters (layer thickness,
contour number, contour width, raster angle, air gap and part orientation) on the wear
behaviour of the FDM build parts. Other supplementary parameter such as part interior
style, shrinkage factor, perimeter to raster gap etc. are kept at default levels. The process
parameters considered for experimental purpose are selected as defined in Table 3.1. To
study the wear behaviour of the FDM build part, tests are conducted using the parametric
suggestion of central composite design (Table 3.2). After that, specimens are
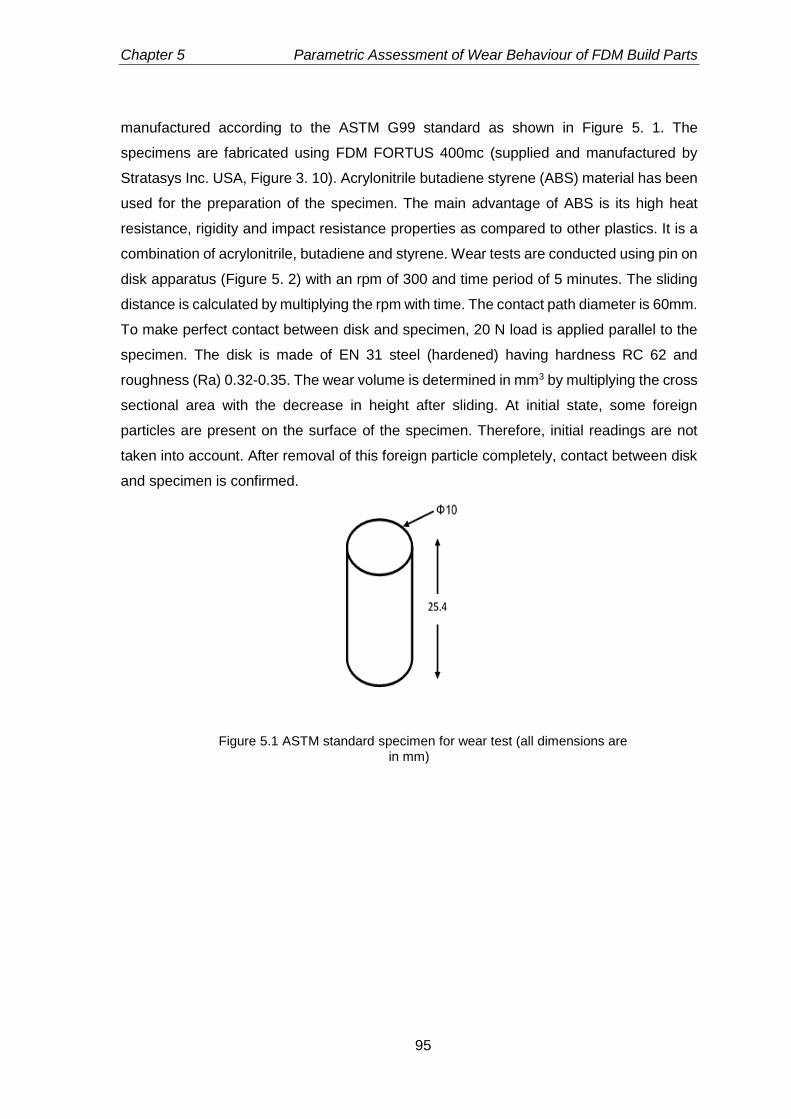
Chapter 5 Parametric Assessment of Wear Behaviour of FDM Build Parts
95
manufactured according to the ASTM G99 standard as shown in Figure 5. 1. The
specimens are fabricated using FDM FORTUS 400mc (supplied and manufactured by
Stratasys Inc. USA, Figure 3. 10). Acrylonitrile butadiene styrene (ABS) material has been
used for the preparation of the specimen. The main advantage of ABS is its high heat
resistance, rigidity and impact resistance properties as compared to other plastics. It is a
combination of acrylonitrile, butadiene and styrene. Wear tests are conducted using pin on
disk apparatus (Figure 5. 2) with an rpm of 300 and time period of 5 minutes. The sliding
distance is calculated by multiplying the rpm with time. The contact path diameter is 60mm.
To make perfect contact between disk and specimen, 20 N load is applied parallel to the
specimen. The disk is made of EN 31 steel (hardened) having hardness RC 62 and
roughness (Ra) 0.32-0.35. The wear volume is determined in mm3 by multiplying the cross
sectional area with the decrease in height after sliding. At initial state, some foreign
particles are present on the surface of the specimen. Therefore, initial readings are not
taken into account. After removal of this foreign particle completely, contact between disk
and specimen is confirmed.
Figure 5.1 ASTM standard specimen for wear test (all dimensions are in mm)

Chapter 5 Parametric Assessment of Wear Behaviour of FDM Build Parts
96
Figure 5.2. Pin on disk wear testing machine
5.3. Results and Discussions
All experiments are conducted according to ASTM D618 standard i.e. at ambient
temperature 23±2 °C and humidity 45 ±5. For each run order, three test specimens are
considered and the average wear is listed in the table below.
Table 5.1. Experimental results
Exp. No.
A B C D E F Wear
(mm3/m)
1 -1 -1 -1 -1 -1 -1 0.0198
2 1 -1 -1 -1 -1 1 0.0190
3 -1 1 -1 -1 -1 1 0.0210
4 1 1 -1 -1 -1 -1 0.0198
5 -1 -1 1 -1 -1 1 0.0220
6 1 -1 1 -1 -1 -1 0.0183
7 -1 1 1 -1 -1 -1 0.0239
8 1 1 1 -1 -1 1 0.0198
9 -1 -1 -1 1 -1 1 0.0215
10 1 -1 -1 1 -1 -1 0.0185
11 -1 1 -1 1 -1 -1 0.0231

Chapter 5 Parametric Assessment of Wear Behaviour of FDM Build Parts
97
12 1 1 -1 1 -1 1 0.0204
13 -1 -1 1 1 -1 -1 0.0209
14 1 -1 1 1 -1 1 0.0204
15 -1 1 1 1 -1 1 0.0245
16 1 1 1 1 -1 -1 0.0194
17 -1 -1 -1 -1 1 1 0.0229
18 1 -1 -1 -1 1 -1 0.0184
19 -1 1 -1 -1 1 -1 0.0232
20 1 1 -1 -1 1 1 0.0210
21 -1 -1 1 -1 1 -1 0.0220
22 1 -1 1 -1 1 1 0.0203
23 -1 1 1 -1 1 1 0.0220
24 1 1 1 -1 1 -1 0.0216
25 -1 -1 -1 1 1 -1 0.0224
26 1 -1 -1 1 1 1 0.0208
27 -1 1 -1 1 1 1 0.0250
28 1 1 -1 1 1 -1 0.0209
29 -1 -1 1 1 1 1 0.0231
30 1 -1 1 1 1 -1 0.0196
31 -1 1 1 1 1 -1 0.0230
32 1 1 1 1 1 1 0.0228
33 -1 0 0 0 0 0 0.0199
34 1 0 0 0 0 0 0.0187
35 0 -1 0 0 0 0 0.0201
36 0 1 0 0 0 0 0.0207
37 0 0 -1 0 0 0 0.0201
38 0 0 1 0 0 0 0.0198
39 0 0 0 -1 0 0 0.0196
40 0 0 0 1 0 0 0.0219
41 0 0 0 0 -1 0 0.0203
42 0 0 0 0 1 0 0.0201
43 0 0 0 0 0 -1 0.0189
44 0 0 0 0 0 1 0.0188
45 0 0 0 0 0 0 0.0188
46 0 0 0 0 0 0 0.0187
47 0 0 0 0 0 0 0.0189
48 0 0 0 0 0 0 0.0187
49 0 0 0 0 0 0 0.0188
50 0 0 0 0 0 0 0.0189
51 0 0 0 0 0 0 0.0189
52 0 0 0 0 0 0 0.0188
Chapter 5 Parametric Assessment of Wear Behaviour of FDM Build Parts
98
From the analysis of variance (ANOVA) table, the significant terms (0.05 significance
level) influencing the wear are identified and listed in Table 5. 2. It is observed that raster
width (C) is not significant term as far as sliding wear of test specimen is concerned. The
coefficient determination (R2) is 0.9002 and the value of adjusted R2 value is 0.8062. It is
to be noted that the value of lack of fit is insignificant. The residual analysis has been done
and found that the residuals are normally distributed. The RSM model for the wear
involving the parameters is given below in equation 5. 1.
Wear = 0.040135-3.37233e-004×A-0.059777×B-0.060071×C-1.14319e-
004×D+ 1.32759e-005×E+0.076645×F-1.43914e-004×A×B+
1.87500e-004×A×C-2.18750e-006×A× D+1.51042e-006×A×E
+2.64518e-003×A×F-3.83772e-003×B×C+6.30482e-005× B×D-
2.05592e-005×B×E-0.13760×B×F-1.02778e-004×C×D-8.75000e-
005×C×E +0.01148×C×F+7.63889e-008×D×E+7.95604e-004×D
×F+7.79199e-005×E×F-6.52919e-005×A2+0.14523×B2+ 0.069126
×C2+5.28370e-006×D2+7.09814e-007× E2-1.01021×F2
(uncoded form) (5.1)
Table 5.2. ANOVA table for wear
Source Sum of Squares
df Mean
Square F
Value p-value
Prob > F
Model 0.000138 27 5.12E-06 7.87E+00 < 0.0001
A 4.82E-05 1 4.82E-05 7.42E+01 < 0.0001
B 1.44E-05 1 1.44E-05 2.21E+01 < 0.0001
C 9.22E-07 1 9.22E-07 1.42E+00 0.2452
D 5.44E-06 1 5.44E-06 8.37E+00 0.0080
E 8.01E-06 1 8.01E-06 1.23E+01 0.0018
F 3.96E-06 1 3.96E-06 6.09E+00 0.0211
A×B 1.53E-08 1 1.53E-08 2.36E-02 0.8793
A×C 2.53E-08 1 2.53E-08 3.89E-02 0.8452
A×D 1.38E-07 1 1.38E-07 2.12E-01 0.6493
A×E 2.63E-07 1 2.63E-07 4.04E-01 0.5309
A×F 5.78E-07 1 5.78E-07 8.89E-01 0.3552
B×C 1.53E-08 1 1.53E-08 2.36E-02 0.8793
B×D 1.65E-07 1 1.65E-07 2.54E-01 0.6186
B×E 7.03E-08 1 7.03E-08 1.08E-01 0.7451
B×F 2.26E-06 1 2.26E-06 3.47E+00 0.0746
C×D 4.28E-07 1 4.28E-07 6.58E-01 0.4252
C×E 1.24E-06 1 1.24E-06 1.91E+00 0.1799
C×F 1.53E-08 1 1.53E-08 2.36E-02 0.8793
D×E 3.78E-08 1 3.78E-08 5.82E-02 0.8115
Chapter 5 Parametric Assessment of Wear Behaviour of FDM Build Parts
99
D×F 2.94E-06 1 2.94E-06 4.52E+00 0.0439
E×F 1.13E-07 1 1.13E-07 1.74E-01 0.6807
A2 1.63E-07 1 1.63E-07 2.50E-01 0.6215
B2 1.68E-06 1 1.68E-06 2.58E+00 0.1212
C2 3.6E-07 1 3.60E-07 5.55E-01 0.4637
D2 3.37E-06 1 3.37E-06 5.18E+00 0.0320
E2 9.73E-07 1 9.73E-07 1.50E+00 0.2330
F2 1.21E-06 1 1.21E-06 1.86E+00 0.1858
Residual 1.56E-05 24 6.50E-07
Lack of Fit 1.56E-05 17 9.147E-07 131.3542 < 0.085
Pure Error 4.87E-08 7 6.964E-09
Cor Total 0.000154 51
From the surface plots, it can be observed that wear is dependent upon the FDM
build parameters. The wear decreases with an increase in contour number (A) of the build
part because an increase in contour number moves the stress concentration from outer
corner to centre of the specimen exhibiting uniform distribution of stress and avoiding
premature failure of the specimen (Ahn et al., 2002) (Figure 5. 3 I, II, III). Normally, the
layer number depends upon the layer thickness (B) and the part orientation (D) of the build
part. During part building, layers are deposited in a sequential manner as programmed by
the machine software. Since, the newly deposited filament temperature is higher than the
previously deposited filaments, heat transfer occurs. So local re-melting and diffusion
between inter as well as intra layer rasters takes place resulting a strong adhesive bond.
These strong adhesive bonds between rasters decrease the wear at the part interface and
increases durability. Therefore, with the decrease of layer thickness, the wear decreases
favourably (Figure 5. 3 I, IV). The air gap (F) adversely affects the wear of the build part.
Increase in air gap increases the possibility of increase in the pit formation during sliding
wear test and results in failure of part (Figure 5. 3 III, IV).

Chapter 5 Parametric Assessment of Wear Behaviour of FDM Build Parts
100
Figure 5.3. Response surface plots for wear
Due to the relative motion between specimen and disk with a constant compressive
force, heat is generated at the interface and develops internal strain in the build part.
Excessive generation of heat at the interface decreases the bond strength between rasters
and give rise to the formation of cracks in the build part. These crack propagation gives
rise to the formation of small pits on the interface and increases the material removal rate.
Wear surfaces having small crack propagation can be clearly seen from the micrographs
Figure 5. 4 a, b. Normally, positive air gaps between rasters are responsible for the
generation of voids in the build part. During wear testing, these voids increase the wear
rate and develop pits in the build parts (Figure 5. 4 c, d).
Design-Expert® Sof tware
Wear0.025
0.0183
X1 = B: BX2 = F: F
Actual FactorsA: A = 3.00C: C = 0.48D: D = 15.00E: E = 30.00
0.18 0.22
0.25 0.29
0.33
0.00
0.01
0.03
0.04
0.05
0.0178
0.0186
0.0193
0.0201
0.0209
W
ear
B: B
F: F
Design-Expert® Sof tware
Wear0.025
0.0183
X1 = A: AX2 = D: D
Actual FactorsB: B = 0.25C: C = 0.48E: E = 30.00F: F = 0.03
1.00
2.00
3.00
4.00
5.00 0.00 7.50
15.00 22.50
30.00
0.0177
0.0187
0.0198
0.0209
0.0219
W
ear
A: A
D: D
Design-Expert® Sof tware
Wear0.025
0.0183
X1 = A: AX2 = B: B
Actual FactorsC: C = 0.48D: D = 15.00E: E = 30.00F: F = 0.03
1.00
2.00
3.00
4.00
5.00 0.18 0.22
0.25 0.29
0.33
0.0176
0.0186
0.0197
0.0207
0.0217
W
ear
A: A
B: B
Design-Expert® Sof tware
Wear0.025
0.0183
X1 = A: AX2 = F: F
Actual FactorsB: B = 0.25C: C = 0.48D: D = 15.00E: E = 30.00
1.00
2.00
3.00
4.00
5.00 0.00 0.01
0.03 0.04
0.05
0.0165
0.0175
0.0184
0.0194
0.0203
W
ear
A: A
F: F
II
IV III
I
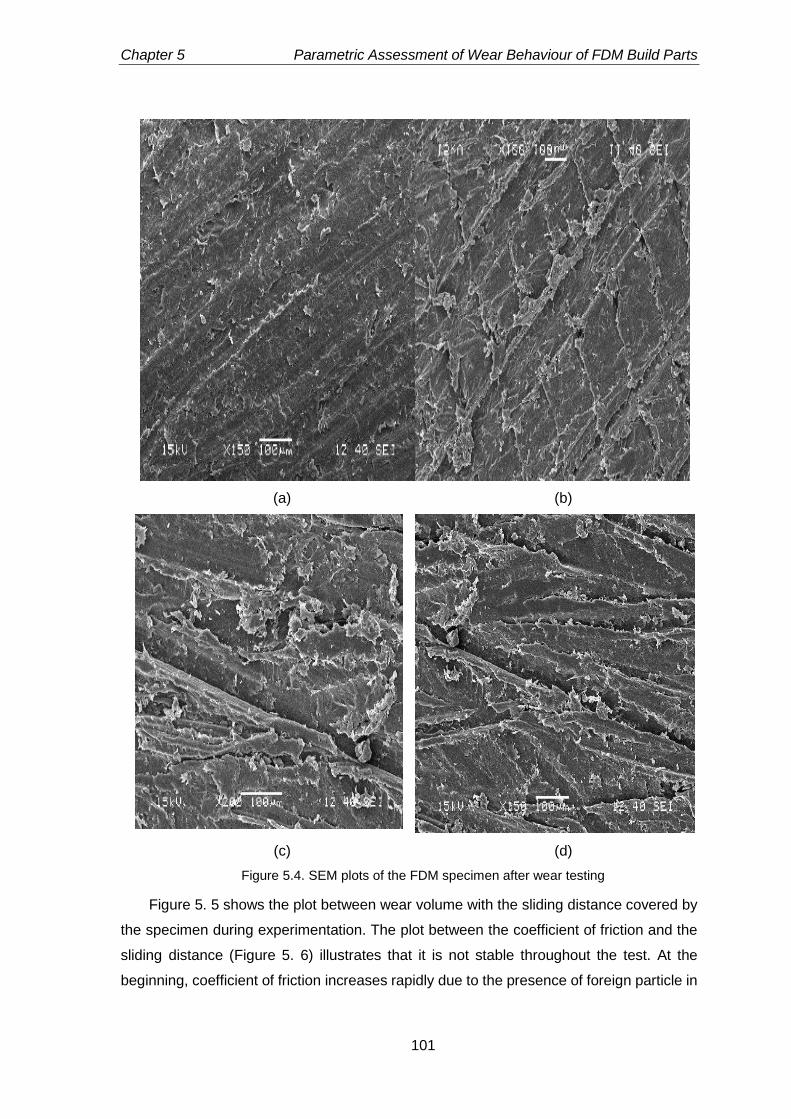
Chapter 5 Parametric Assessment of Wear Behaviour of FDM Build Parts
101
(a) (b)
(c) (d)
Figure 5.4. SEM plots of the FDM specimen after wear testing
Figure 5. 5 shows the plot between wear volume with the sliding distance covered by
the specimen during experimentation. The plot between the coefficient of friction and the
sliding distance (Figure 5. 6) illustrates that it is not stable throughout the test. At the
beginning, coefficient of friction increases rapidly due to the presence of foreign particle in
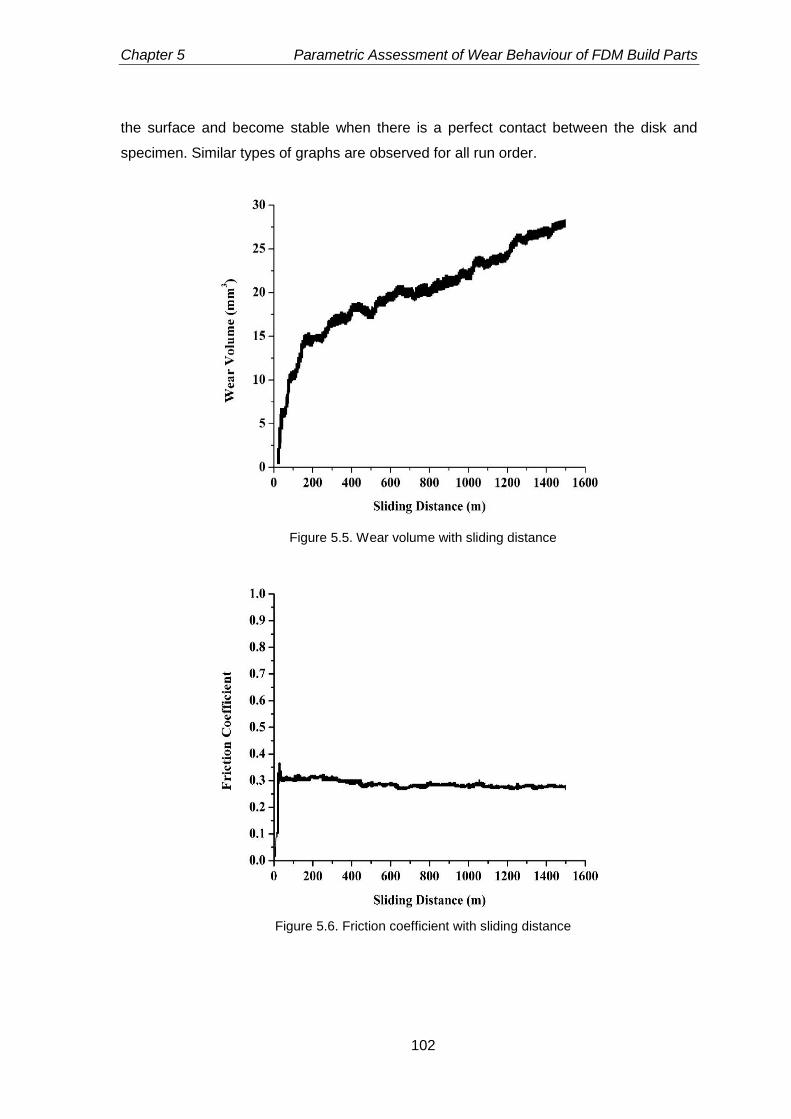
Chapter 5 Parametric Assessment of Wear Behaviour of FDM Build Parts
102
the surface and become stable when there is a perfect contact between the disk and
specimen. Similar types of graphs are observed for all run order.
Figure 5.5. Wear volume with sliding distance
Figure 5.6. Friction coefficient with sliding distance
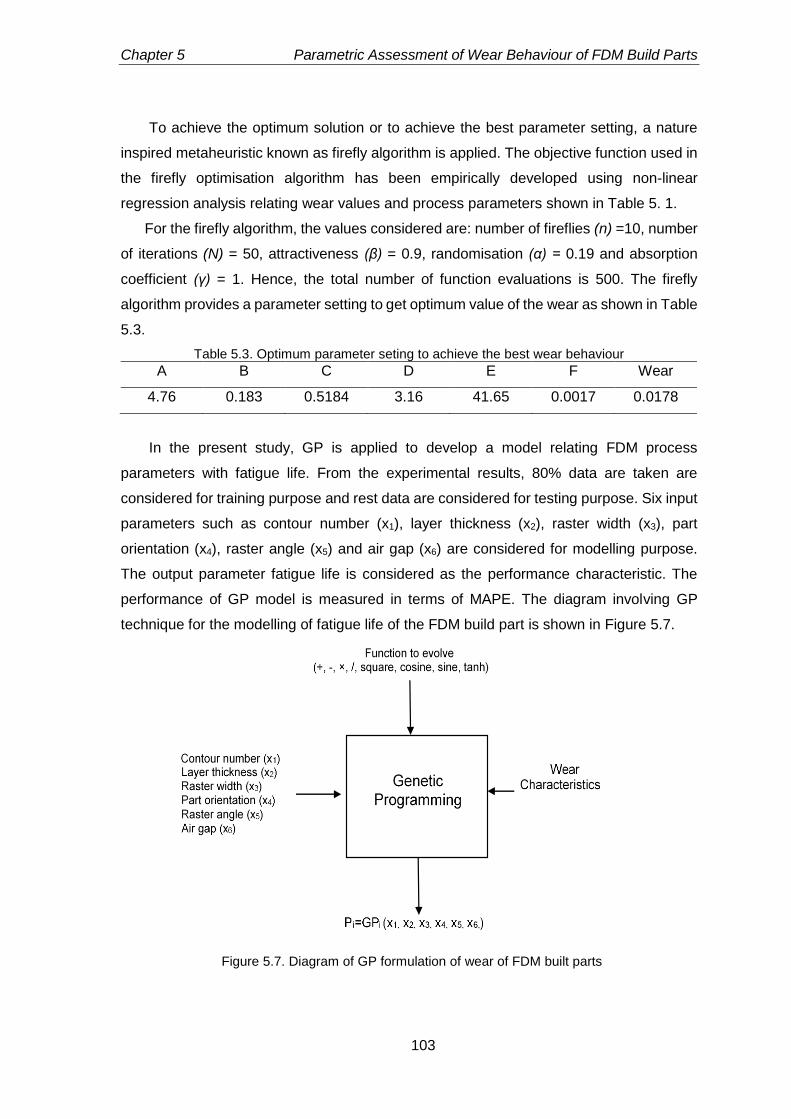
Chapter 5 Parametric Assessment of Wear Behaviour of FDM Build Parts
103
To achieve the optimum solution or to achieve the best parameter setting, a nature
inspired metaheuristic known as firefly algorithm is applied. The objective function used in
the firefly optimisation algorithm has been empirically developed using non-linear
regression analysis relating wear values and process parameters shown in Table 5. 1.
For the firefly algorithm, the values considered are: number of fireflies (n) =10, number
of iterations (N) = 50, attractiveness (β) = 0.9, randomisation (α) = 0.19 and absorption
coefficient (γ) = 1. Hence, the total number of function evaluations is 500. The firefly
algorithm provides a parameter setting to get optimum value of the wear as shown in Table
5.3.
Table 5.3. Optimum parameter seting to achieve the best wear behaviour
A B C D E F Wear
4.76 0.183 0.5184 3.16 41.65 0.0017 0.0178
In the present study, GP is applied to develop a model relating FDM process
parameters with fatigue life. From the experimental results, 80% data are taken are
considered for training purpose and rest data are considered for testing purpose. Six input
parameters such as contour number (x1), layer thickness (x2), raster width (x3), part
orientation (x4), raster angle (x5) and air gap (x6) are considered for modelling purpose.
The output parameter fatigue life is considered as the performance characteristic. The
performance of GP model is measured in terms of MAPE. The diagram involving GP
technique for the modelling of fatigue life of the FDM build part is shown in Figure 5.7.
Figure 5.7. Diagram of GP formulation of wear of FDM built parts
Chapter 5 Parametric Assessment of Wear Behaviour of FDM Build Parts
104
The parameter setting for GP determined through several trail and experimental runs
are shown below in Table 5. 4.
Table 5.4. Parameter setting for genetic programming
Parameters Value Assigned
Population size 50 Number of generations 700 Maximum depth of tree 6 Maximum generation 45 Functional set Multiply, plus, minus, divide, square,
cosine, sine, tanh Terminal set (x1, x2, x3, x4, x5, x6, [-10,10])
Number of runs 100 Mutation rate 0.10 Crossover rate 0.85 Reproduction rate 0.05
The GP model with MAPE 0.021% and 3.29% on the training and testing data
respectively signifies that it has efficiently generalise the data set. The relative percentage
error between GP predicted value and experimental results of fatigue life cycle of the FDM
build part are calculated. Using the GP technique, a model is developed relating six FDM
process parameter with fatigue life of the build part and is given in equation 5.2.
Wear = 0.000364.×x(:,2)-0.0003049.×x(:,1)+0.000133.×x(:,3)+ 0.0004924
.×x(:,4)-4.139e-5.×x(:,5)+0.0001713.×tan(x(:,1)-x(:,6))-
0.0002122.×square(-2.372)+0.003456.×cos(psqroot(x(:,3))-
0.001529.×sin(cos(x(:,1)))+ .0003639.× sin(tan(x(:,2))) +7.937e-
5.×exp(square(-2.372))-0.000309.×tanh(x(:,3).×x(:,4))+
0.000229.×tan(x(:,3) + x(:,4)) - 0.004242.×cos(x(:,4)) -1.648e-
17.×plog(x(:,3))+0.0014.×psqroot(x(:,5))+0.000214.×psqroot
(x(:,6))-6.966e-5.×sin(x(:,5))-0.0004749.× tan(x(:,1))+ 0.0001934
×tan(x(:,4)) -0.0001752. ×tanh(x(:,6))+0.0001933.×x(:,1).×x(:,3)-
0.0005948×x(:,2)×x (:,6)+0.0002138.×x(:,4).× x(:,5)+0.0003493.
×x(:,4).×x(:,6)+0.0004319×psqroot(x(:,4))×(x(:,3)+x(:,5))
+0.0001725.×x(:,6).×exp(x(:,3))-0.000164.×(x(:,1)-x(:,6))×
(x(:,2)-x(:,6))+ 0.000539.×x(:,2).×x(:,4).×x(:,6) + 2.855e-7; (5.2)
Again an artificial intelligent (AI) technique known as LS-SVM is used for prediction
purpose. The SVM technique involves input training data followed by testing data. Around
80% of the experimental results are considered for training purpose while rest 20% are
considered for testing purpose. Six important FDM process parameters such as contour
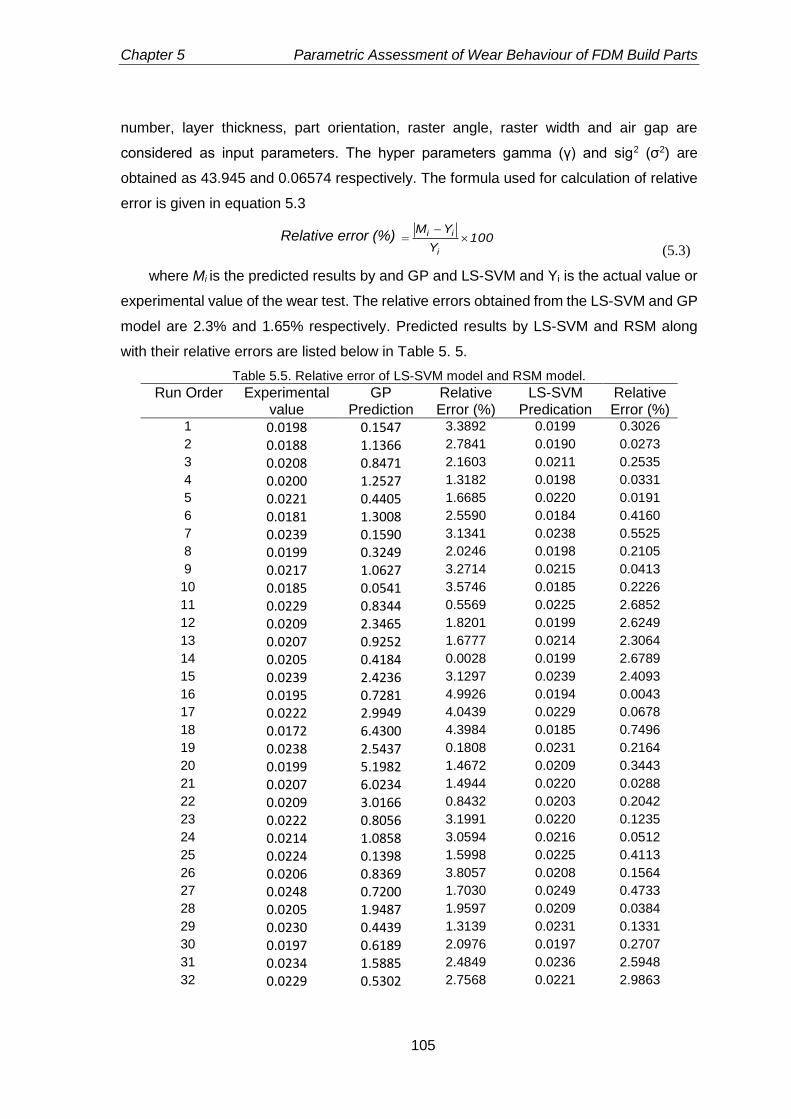
Chapter 5 Parametric Assessment of Wear Behaviour of FDM Build Parts
105
number, layer thickness, part orientation, raster angle, raster width and air gap are
considered as input parameters. The hyper parameters gamma (γ) and sig2 (σ2) are
obtained as 43.945 and 0.06574 respectively. The formula used for calculation of relative
error is given in equation 5.3
Relative error (%) 100Y
YM
i
ii
(5.3)
where Mi is the predicted results by and GP and LS-SVM and Yi is the actual value or
experimental value of the wear test. The relative errors obtained from the LS-SVM and GP
model are 2.3% and 1.65% respectively. Predicted results by LS-SVM and RSM along
with their relative errors are listed below in Table 5. 5.
Table 5.5. Relative error of LS-SVM model and RSM model.
Run Order Experimental value
GP Prediction
Relative Error (%)
LS-SVM Predication
Relative Error (%)
1 0.0198 0.1547 3.3892 0.0199 0.3026
2 0.0188 1.1366 2.7841 0.0190 0.0273
3 0.0208 0.8471 2.1603 0.0211 0.2535
4 0.0200 1.2527 1.3182 0.0198 0.0331
5 0.0221 0.4405 1.6685 0.0220 0.0191
6 0.0181 1.3008 2.5590 0.0184 0.4160
7 0.0239 0.1590 3.1341 0.0238 0.5525
8 0.0199 0.3249 2.0246 0.0198 0.2105
9 0.0217 1.0627 3.2714 0.0215 0.0413
10 0.0185 0.0541 3.5746 0.0185 0.2226
11 0.0229 0.8344 0.5569 0.0225 2.6852
12 0.0209 2.3465 1.8201 0.0199 2.6249
13 0.0207 0.9252 1.6777 0.0214 2.3064
14 0.0205 0.4184 0.0028 0.0199 2.6789
15 0.0239 2.4236 3.1297 0.0239 2.4093
16 0.0195 0.7281 4.9926 0.0194 0.0043
17 0.0222 2.9949 4.0439 0.0229 0.0678
18 0.0172 6.4300 4.3984 0.0185 0.7496
19 0.0238 2.5437 0.1808 0.0231 0.2164
20 0.0199 5.1982 1.4672 0.0209 0.3443
21 0.0207 6.0234 1.4944 0.0220 0.0288
22 0.0209 3.0166 0.8432 0.0203 0.2042
23 0.0222 0.8056 3.1991 0.0220 0.1235
24 0.0214 1.0858 3.0594 0.0216 0.0512
25 0.0224 0.1398 1.5998 0.0225 0.4113
26 0.0206 0.8369 3.8057 0.0208 0.1564
27 0.0248 0.7200 1.7030 0.0249 0.4733
28 0.0205 1.9487 1.9597 0.0209 0.0384
29 0.0230 0.4439 1.3139 0.0231 0.1331
30 0.0197 0.6189 2.0976 0.0197 0.2707
31 0.0234 1.5885 2.4849 0.0236 2.5948
32 0.0229 0.5302 2.7568 0.0221 2.9863
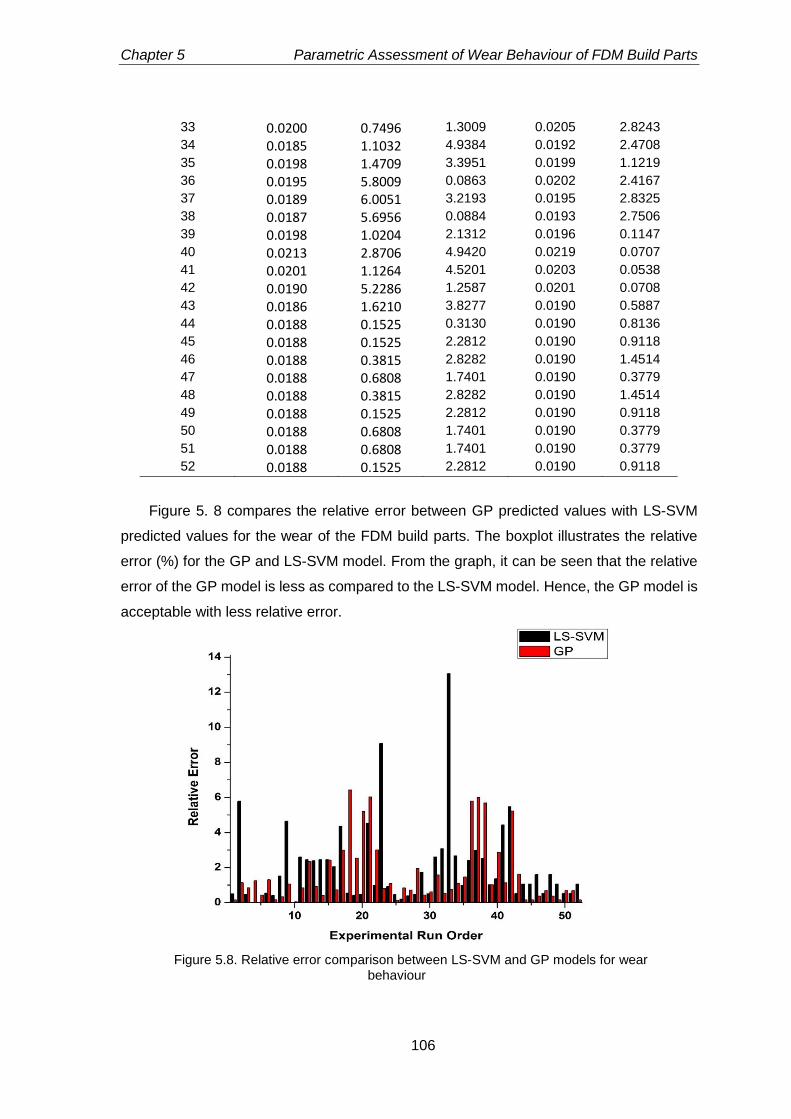
Chapter 5 Parametric Assessment of Wear Behaviour of FDM Build Parts
106
33 0.0200 0.7496 1.3009 0.0205 2.8243
34 0.0185 1.1032 4.9384 0.0192 2.4708
35 0.0198 1.4709 3.3951 0.0199 1.1219
36 0.0195 5.8009 0.0863 0.0202 2.4167
37 0.0189 6.0051 3.2193 0.0195 2.8325
38 0.0187 5.6956 0.0884 0.0193 2.7506
39 0.0198 1.0204 2.1312 0.0196 0.1147
40 0.0213 2.8706 4.9420 0.0219 0.0707
41 0.0201 1.1264 4.5201 0.0203 0.0538
42 0.0190 5.2286 1.2587 0.0201 0.0708
43 0.0186 1.6210 3.8277 0.0190 0.5887
44 0.0188 0.1525 0.3130 0.0190 0.8136
45 0.0188 0.1525 2.2812 0.0190 0.9118
46 0.0188 0.3815 2.8282 0.0190 1.4514
47 0.0188 0.6808 1.7401 0.0190 0.3779
48 0.0188 0.3815 2.8282 0.0190 1.4514
49 0.0188 0.1525 2.2812 0.0190 0.9118
50 0.0188 0.6808 1.7401 0.0190 0.3779
51 0.0188 0.6808 1.7401 0.0190 0.3779
52 0.0188 0.1525 2.2812 0.0190 0.9118
Figure 5. 8 compares the relative error between GP predicted values with LS-SVM
predicted values for the wear of the FDM build parts. The boxplot illustrates the relative
error (%) for the GP and LS-SVM model. From the graph, it can be seen that the relative
error of the GP model is less as compared to the LS-SVM model. Hence, the GP model is
acceptable with less relative error.
Figure 5.8. Relative error comparison between LS-SVM and GP models for wear behaviour
Chapter 5 Parametric Assessment of Wear Behaviour of FDM Build Parts
107
5.4. Conclusion
Effect of six controllable process parameters viz. contour number, raster orientation, raster
angle, layer thickness, air gap and raster width on the wear of the FDM build part is studied.
An increase in contour number decreases the wear rate by shifting the stress concentration
zone from outer edge to the centre of the specimen and decreases the chance of
premature failure of the build part. The air gap, which generates voids inside the build
parts, increases the material removal rate due to the formation of pits. The bond strength
between rasters decreases due to the generation of excess heat at the interface and
increases the material removal rate. A functional relationship between the FDM process
parameters and wear using response surface methodology is developed. Significance of
each process parameter on the wear has been studied using ANOVA. One nature inspired
Metaheuristic algorithm known as firefly algorithm is adopted to get optimum parameter
setting for the improvement of wear behaviour. In order to improve the prediction capability,
genetic programming (GP) and least square support vector machine (LS-SVM) techniques
are successfully adopted. Finally, the predictive relations of GP and LS-SVM approaches
are compared. It is observed that GP predicts wear behaviour in an accurate manner as
compared to LS-SVM approach.
Executive Summary and Conclusion
6.1. Introduction
Fused deposition modelling has the ability to build 3D complex geometry with reasonable
accuracy using layer-by-layer build mechanism in a temperature controlled environment
within a stipulated time. FDM process has significant advantages over conventional
manufacturing process in terms of avoidance in the preparation of jigs and fixtures,
flexibility in design modifications, less human intervention and capability of producing
complex shapes. Specifically, FDM has major advantage over conventional manufacturing
process in terms of time and cost. Since FDM process is a parametric dependent process,
process parameters largely influence the mechanical strength, part quality and durability
of the build parts. In this direction, the present research work emphasises on the
improvement of part strength under both static and cyclic loading through selection of
proper process parameters.
6.2. Summary of findings
Findings gathered from the current research work attempts to explain not only the complex
build mechanism of FDM process but also the effect of FDM process parameters on the
output performance characteristics.
Among six controlling process parameters, contour number happens to be the
significant parameter for improving mechanical strength, fatigue life and wear
resistance of FDM build part because existence of contour numbers shifts the
stress concentration zone from outer edge to inner surface. The delta angle is set
at 300 to change the raster fill pattern to its previously placed rasters so that
anisotropic behaviour of build part can be decreased to some extent.
Since the part building mechanism in FDM is a complex process, it is challenging
to develop analytical or numerical model to predict the performance measures.
Therefore, statistically valid empirical models have been proposed in this study to
relate process parameters with mechanical strength, fatigue life and wear
resistance. Latest evolutionary algorithm like firefly algorithm is adopted to obtain
Chapter 6 Executive Summary and Conclusion
109
optimum parameter settings for various performance measures so that effective
search can be made in optimization landscape.
The tensile strength of the specimen obtained at optimal parameter setting is 32.72
MPa which is almost 77.92% of the specimen produced through injection moulding
process. Interestingly, it is 73.02% above the previous study (Sood et al. 2010).
The optimal compressive strength (108.38 MPa) is two times greater than the
strength (52 MPa) of the injection moulded specimen due to the hollow structure
produced inside the build part resulting from air gap. Further, it is 45.6% higher
than the previous study (Sood et al. 2010). The optimal flexural strength of the
FDM specimen closely approaches to that of the injection moulded specimen
(96%). An improvement of 76.5% is observed in flexural strength over the previous
study (Sood et al. 2010) due to modification in contour number and raster fill
pattern style.
An increase in part orientation and layer thickness increases the surface
roughness of the build part due to the presence of staircase effect. A build part
having with high surface roughness exhibits low fatigue life under strain controlled
mode. Therefore, efforts must be made to reduce the staircase effect through
selection of suitable process parameters in order to enhance fatigue life of build
parts.
Increase in layer thickness and part orientation leads to residual stresses to be
accumulated near the rasters due to increase in number of cooling and heating
cycle leading to failure of weak rasters and rupturing of bond between rasters.
Failure of bonds between rasters initiates crack formation inside the build part.
Subsequently, this crack propagates in a zigzag manner and increases with an
increase in number of strain cycles as observed in fatigue test.
In order to reduce the experimental cost and time, genetic programming and least
square support vector machine have been adopted for prediction of performance
measures. A relative error of 5.24% and 6.71% has been reported with respect to
experimental value for GP and LS-SVM respectively for multi-performance
characteristics index (MPCI) an equivalent measure for tensile, compressive,
flexural and impact strength.
In the FDM process, the molten is extruded to the build platform at a temperature
of 230°C while the temperature of the build platform is maintained at 95°C. This
sudden cooling of the filament from high temperature to low temperature gives rise
Chapter 6 Executive Summary and Conclusion
110
to the formation of thermo-residual stresses inside the build part resulting in
decrease in part strength. This is to be noted that increase in layer numbers (due
to increase in part orientation or decrease in layer thickness) causes increase in
number of involvement of heating and cooling cycles during part building. This
phenomenon results in increase in residual stresses within the build part and
decreases the mechanical strength.
Accumulation of residual stresses near the rasters leads to failure of weak rasters
resulting in rupture of bonds between adjacent rasters. Failure of bonds between
rasters initiate formation cracks inside the build part. Consequently, this crack
propagates in a zigzag manner and increases with an increase in the number of
strain cycles.
Zero air gap means that rasters are placed in contact with each other. Zero air gap
increases the bond strength resulting an increase in load bearing capacity. If
negative air gap is maintained, rasters will be placed one over another on a single
layer and part geometry will be affected. Positive air gap increases the generation
of voids inside the build part resulting a decrease in part strength. It also observed
that generation of voids inside the build part increases the material removal rate
during sliding wear test. The bond strength between rasters decreases due to the
generation of excess heat at the interface and increases material removal rate
when FDM build part subjected to sliding wear.
6.3. Contribution of the research work
The effect of contour number on the strength of FDM build part has been studied
under static and dynamic loading conditions. Among all process parameters,
contour number seems to be more important than other controllable process
parameter since it shifts the stress concentration towards the centre of the
specimen from outer edge surface resulting in avoidance of premature failure
during static and dynamic loading.
An effort has been made to decrease the anisotropic effect of the FDM build part
by changing the raster fill pattern style.
Understandings generated in this research work explain the complex build
mechanism of FDM process and explain the effect of process parameters on the
output responses using surface plots and micrographs.

Chapter 6 Executive Summary and Conclusion
111
An empirical model has been developed relating process parameter with the
mechanical strength of FDM build parts. Optimum parameter setting has been
suggested using a nature inspired firefly algorithm and is experimentally validated.
The work can be seen as the first attempt to study the effect of process parameter
on the fatigue life of FDM part under strain controlled mode.
In order to improve the prediction capability, genetic programming (GP) is adopted
to develop an empirical model relating the process parameters with the fatigue life
of the FDM build parts.
An attempt is made to study the sliding wear mechanism of FDM build parts.
For prediction purpose, least square support vector machining (LS-SVM) is
adopted to assess the wear behaviour of the FDM build parts.
6.4. Limitation of the study
In spite of all these advantages obtained from the research work, following limitation has
been noticed and addressed below.
The work extensively studies the fatigue life of the FDM build parts under strain
controlled mode but fatigue life under stress control mode needs to be assessed.
Present work is focused on the study of sliding wear behaviour of the FDM build
parts but other type of mechanical wear such as fretting, abrasive and erosive wear
behaviour needs to be analysed for FDM build parts.
Effect of process parameters on the shape (cylinder, cone, prism, cuboid,
hexagonal pyramid) of the FDM build part need to be highlight.
Present work uses only ASTM standards for preparing the specimens. In order to
enhance the practical implication of FDM build parts experiments may be
conducted using the real end use parts manufactured through FDM route
In this research work, empirical models have been developed using various
statistical tools but mathematical or numerical approaches may be developed to
study the effect of process parameters on performance measures.
6.5. Scope for future work
Present research work provides ample opportunity for the investigation of usefulness of
FDM process. Some scopes for future research have been given below.
Chapter 6 Executive Summary and Conclusion
112
Effects of environmental variables like temperature and humidity on the part quality
may be explored.
Research on increase of build space and provision of multiple nozzles for part
deposition in FDM process needs to be explored to cater to the needs of medium
or large batch manufacturer.
FDM process specific CAD modelling and analysis tools need to be developed.
Option of depositing multiple materials in a single setting needs to be explored.
Possibility of using different materials or modification in the present material
composition may be explored.
Furthermore, research can be extended to study the effect of process parameters
on circularity of inner holes in FDM build parts.
Bibliography
Ahn, S. H., Montero, M., Odell, D., Roundy, S., and Wright, P. K. (2002). Anisotropic material
properties of fused deposition modeling ABS. Rapid Prototyping Journal, 8(4), 248-257.
Ajoku, U., Saleh, N., Hopkinson, N., Hague, R., and Erasenthiran, P. (2006). Investigating
mechanical anisotropy and end-of-vector effect in laser-sintered nylon parts. Proceedings of
the Institution of Mechanical Engineers, Part B: Journal of Engineering Manufacture, 220(7),
1077-1086.
Allahverdi, M., Danforth, S. C., Jafari, M., and Safari, A. (2001). Processing of advanced
electroceramic components by fused deposition technique. Journal of the European Ceramic
Society, 21(10), 1485-1490.
Anitha, R., Arunachalam, S., and Radhakrishnan, P. (2001). Critical parameters influencing the
quality of prototypes in fused deposition modelling. Journal of Materials Processing
Technology, 118(1), 385-8.
ASTM D256-93A. Standard Test Methods for Determining the Izod Pendulum Impact Resistance
of Plastics, ASTM International, West Conshohocken, PA 19428-2959.USA.
ASTM D638-10. Standard Test Method for Tensile Properties of Plastics. Annual Book of ASTM
Standards, ASTM International, West Conshohocken, PA 19428-2959.USA.
ASTM D695-10. Standard Test Method for Compressive Properties of Plastics. Annual Book of
ASTM Standards, ASTM International, West Conshohocken, PA 19428-2959.USA.
ASTM D790-10. Standard Test Methods for Flexural Properties of Unreinforced and Reinforced
Plastics and Electrical Insulation Materials. Annual Book of ASTM Standards, ASTM
International, West Conshohocken, PA 19428-2959.USA.
ASTM E606-12. Standard test method for strain controlled fatigue testing. Annual Book of ASTM
Standards, ASTM International, West Conshohocken, PA 19428-2959.USA.
ASTM G99-05 (2010). Standard Test Method for Wear Testing with a Pin-on-Disk Apparatus,
Annual Book of ASTM Standards, ASTM International, West Conshohocken, PA 19428-
2959. USA.
Baziar, M. H., Jafarian, Y., Shahnazari, H., Movahed, V., and Tutunchian, M. A. (2011). Prediction
of strain energy-based liquefaction resistance of sand–silt mixtures: an evolutionary
approach. Computers and Geosciences, 37(11), 1883-93.
Behera, A., Behera, S., Tripathy, R. K., and Mishra, S. C. (2012). Least square support vector
machine alternative to artificial neural network for prediction of surface roughness and
porosity of plasma sprayed copper substrates, 4(12), 399-404.
Bernard, A., and Fischer, A. (2002). New trends in rapid product development. CIRP Annals-
Manufacturing Technology, 51(2), 635-52.
Bibliography
114
Berry, E., Brown, J. M., Connell, M., Craven, C. M., Efford, N. D., Radjenovic, A., and Smith, M. A.
(1997). Preliminary experience with medical applications of rapid prototyping by selective
laser sintering. Medical Engineering and physics, 19(1), 90-6.
Bibb, R., Taha, Z., Brown, R., and Wright, D. (1999). Development of a rapid prototyping design
advice system. Journal of Intelligent Manufacturing, 10(3-4), 331-9.
Bose, S., Suguira, S., and Bandyopadhyay, A. (1999). Processing of Controlled Porosity Ceramic
structures via fused deposition. Scripta Materialia, 41(9), 1009-14.
Braglia, M., and Petroni, A. (1999). A management-support technique for the selection of rapid
prototyping technologies. Journal of Industrial Technology, 15(4), 2-6.
Byun, H. S., and Lee, K. H. (2005). A decision support system for the selection of a rapid prototyping
process using the modified TOPSIS method. The International Journal of Advanced
Manufacturing Technology, 26(11-12), 1338-47.
Campbell, R. I., and Bernie, M. R. N. (1996). Creating a database of rapid prototyping system
capabilities. Journal of Materials Processing Technology, 61(1), 163-67.
Campbell, R. I., Martorelli, M., and Lee, H. S. (2002). Surface roughness visualisation for rapid
prototyping models. Computer-Aided Design, 34(10), 717-25.
Çaydaş, U., and Ekici, S. (2012). Support vector machines models for surface roughness prediction
in CNC turning of AISI 304 austenitic stainless steel. Journal of Intelligent Manufacturing,
23(3), 639-50.
Chang, D. Y., and Huang, B. H. (2011). Studies on profile error and extruding aperture for the RP
parts using the fused deposition modelling process. The International Journal of Advanced
Manufacturing Technology, 53(9-12), 1027-37.
Chang, P. C., Hieh, J. C., and Liao, T. W. (2005). Evolving fuzzy rules for due-date assignment
problem in semiconductor manufacturing factory. Journal of Intelligent Manufacturing, 16(4-
5), 549-57.
Cheah, C. M., Chua, C. K., Lee, C. W., Feng, C., and Totong, K. (2005). Rapid prototyping and
tooling techniques: a review of applications for rapid investment casting. The International
Journal of Advanced Manufacturing Technology, 25(3-4), 308-20.
Cheah, C. M., Chua, C. K., Lee, C. W., Lim, S. T., Eu, K. H., and Lin, L. T. (2002). Rapid sheet
metal manufacturing. Part 2: direct rapid tooling. The International Journal of Advanced
Manufacturing Technology, 19(7), 510-5.
Cheah, C. M., Fuh, J. Y. H., Nee, A. Y. C., Lu, L., Choo, Y. S., and Miyazawa, T. (1997).
Characteristics of photopolymeric material used in rapid prototypes Part II. Mechanical
properties at post-cured state. Journal of Materials Processing Technology, 67(1), 46- 9.
Chockalingam, K., Jawahar, N., Chandrasekar, U., and Ramanathan, K. N. (2008). Establishment
of process model for part strength in stereolithography. Journal of Materials Processing
Technology, 208(1), 348-365.
Bibliography
115
Chockalingam, K., Jawahar, N., Ramanathan, K. N., and Banerjee, P. S. (2006). Optimization of
stereolithography process parameters for part strength using design of experiments. The
International Journal of Advanced Manufacturing Technology, 29(1-2), 79-88.
Chowdary, B. V. (2007). Back-propagation artificial neural network approach for machining centre
selection. Journal of Manufacturing Technology Management, 18(3), 315-332.
Chua, C. K., Hong, K. H., and Ho, S. L. (1999). Rapid tooling technology. Part 1. A comparative
study. The International Journal of Advanced Manufacturing Technology, 15(8), 604-608.
Chua, C. K., Teh, S. H., and Gay, R. K. L. (1999). Rapid prototyping versus virtual prototyping in
product design and manufacturing. The International Journal of Advanced Manufacturing
Technology, 15(8), 597-603.
Colombo, G., Filippi, S., Rizzi, C., and Rotini, F. (2010). A new design paradigm for the development
of custom-fit soft sockets for lower limb prostheses. Computers in Industry, 61(6), 513-23.
Croccolo, D., De Agostinis, M., and Olmi, G. (2013). Experimental characterization and analytical
modelling of the mechanical behaviour of fused deposition processed parts made of ABS-
M30. Computational Materials Science, 79, 506-18.
Czyżewski, J., Burzyński, P., Gaweł, K., and Meisner, J. (2009). Rapid prototyping of electrically
conductive components using 3D printing technology. Journal of Materials Processing
Technology, 209(12), 5281-5.
Ding, Y., Lan, H., Hong, J., and Wu, D. (2004). An integrated manufacturing system for rapid tooling
based on rapid prototyping. Robotics and computer-integrated manufacturing, 20(4), 281-
8.
Dong, B., Qi, G., Gu, X., and Wei, X. (2008). Web service-oriented manufacturing resource
applications for networked product development. Advanced Engineering Informatics, 22(3),
282-95.
Driscoll, S. B. (2004). The basics of testing plastics. ASTM, West Conshohocken.
Dunne, P., Soe, S. P., Byrne, G., Venus, A., and Wheatley, A. R. (2004). Some demands on rapid
prototypes used as master patterns in rapid tooling for injection moulding. Journal of
Materials Processing Technology, 150(3), 201-7.
Edwards, P., and Ramulu, M. (2014). Fatigue performance evaluation of selective laser melted Ti–
6Al–4V. Materials Science and Engineering: A, 598, 327-37.
Ellyin, F. (1997). Fatigue damage, crack growth and life prediction. Springer Science and Business
Media.
Espalin, D., Arcaute, K., Rodriguez, D., Medina, F., Posner, M., and Wicker, R. (2010). Fused
deposition modeling of patient-specific polymethylmethacrylate implants. Rapid Prototyping
Journal, 16(3), 164-73.
Bibliography
116
Es-Said, O. S., Foyos, J., Noorani, R., Mendelson, M., Marloth, R., and Pregger, B. A. (2000). Effect
of layer orientation on mechanical properties of rapid prototyped samples. Materials and
Manufacturing Processes, 15(1), 107-22.
Garg, A., Rachmawati, L., and Tai, K. (2013). Classification-driven model selection approach of
genetic programming in modelling of turning process. International Journal of Advanced
Manufacturing Technology, 69(5-8), 1137-51.
Garg, A., Tai. K., and Savalani, M. M. (2014). State-of-the-art in empirical modelling of rapid
prototyping processes. Rapid Prototyping Journal, 20(2), 164-178.
Garg, A., Vijayaraghavan, V., Mahapatra, S. S., Tai, K., and Wong, C. H. (2014a). Performance
evaluation of microbial fuel cell by artificial intelligence methods. Expert Systems with
Applications, 41(4), 1389-99.
Garg, A., Tai, K., and Savalani, M. M. (2014). State-of-the-art in empirical modelling of rapid
prototyping processes. Rapid Prototyping Journal, 20(2), 164-78.
Garg, A., Tai, K., Lee, C. H., and Savalani, M. M. (2014b). A hybrid M5' -prime-genetic programming
approach for ensuring greater trustworthiness of prediction ability in modelling of FDM
process. Journal of Intelligent Manufacturing, 25(6), 1349-65.
Garg, A., Vijayaraghavan, V., Mahapatra, S. S., Tai, K., and Wong, C. H. (2014). Performance
evaluation of microbial fuel cell by artificial intelligence methods. Expert systems with
applications, 41(4), 1389-99.
Ghosh, A., and Mallik, A. K. (1986). Manufacturing science. Ellis Horwood, 1986.
Giannatsis, J., and Dedoussis, V. (2009). Additive fabrication technologies applied to medicine and
health care: a review. The International Journal of Advanced Manufacturing Technology,
40(1-2), 116-27.
Gibson, I., Rosen, D., & Stucker, B. (2014). Additive manufacturing technologies: 3D printing, rapid
prototyping, and direct digital manufacturing. Springer.
Girod, S., Teschner, M., Schrell, U., Kevekordes, B., and Girod, B. (2001). Computer-aided 3-D
simulation and prediction of craniofacial surgery: a new approach. Journal of Cranio-
Maxillofacial Surgery, 29(3), 156-8.
Gray IV, R. W., Baird, D. G., and Helge Bohn, J. (1998). Effects of processing conditions on short
TLCP fiber reinforced FDM parts. Rapid Prototyping Journal, 4(1), 14-25.
Greco, A., Licciulli, A., and Maffezzoli, A. (2001). Stereolitography of ceramic suspensions. Journal
of Materials Science, 36(1), 99-105.
Grida, I., and Evans, J. R. (2003). Extrusion free forming of ceramics through fine nozzles. Journal
of the European Ceramic Society, 23(5), 629-35.
Gungor, Z., and Arıkan, F. (2007). Using fuzzy decision making system to improve quality-based
investment. Journal of Intelligent Manufacturing, 18(2), 197-207.
Bibliography
117
Gurrala, P. K., and Regalla, S. P. (2014). Part strength evolution with bonding between filaments in
fused deposition modelling: This paper studies how coalescence of filaments contributes to
the strength of final FDM part. Virtual and Physical Prototyping, 9(3), 141-9.
Hattiangadi, A., and Bandyopadhyay, A. (2000). Modeling of multiple pore ceramic materials
fabricated via fused deposition process. Scripta Materialia, 42(6), 581-8.
Heissler, E., Fischer, F. S., Boiouri, S., Lehrnann, T., Mathar, W., Gebhardt, A., and Bler, J. (1998).
Custom-made cast titanium implants produced with CAD/CAM for the reconstruction of
cranium defects. International Journal of Oral and Maxillofacial Surgery, 27(5), 334-8.
Hinczewski, C., Corbel, S., and Chartier, T. (1998). Ceramic suspensions suitable for
stereolithography. Journal of the European Ceramic Society, 18(6), 583-90.
Hon, K. K. B. (2007, January). Digital Additive Manufacturing: From Rapid Prototyping to Rapid
Manufacturing. In Proceedings of the 35th International MATADOR Conference (pp. 337-
340). Springer London.
Hon, K. K. B. (2007, January). Digital Additive Manufacturing: From Rapid Prototyping to Rapid
Manufacturing. In proceedings of the 35th international MATADOR conference, Springer
London, 337 – 40.
Hopkinson, N., Hague, R., and Dickens, P. (Eds.). (2006). Rapid manufacturing: an industrial
revolution for the digital age. John Wiley and Sons.
Hsu, C. Y., Chen, D. Y., Lai, M. Y., and Tzou, G. J. (2008). EDM electrode manufacturing using RP
combining electroless plating with electroforming. The International Journal of Advanced
Manufacturing Technology, 38(9-10), 915-24.
http://www.plasticsintl.com/datasheets/ABS.pdf.
Im, Y. G., Cho, B. H., Seo, S. H., Son, J. H., Chung, S. I., and Jeong, H. D. (2007). Functional
prototype development of multi-layer board (MLB) using rapid prototyping technology.
Journal of Materials Processing Technology, 187, 619-622.
Ippolito, R., Iuliano, L., and Gatto, A. (1995). Benchmarking of rapid prototyping techniques in terms
of dimensional accuracy and surface finish. CIRP Annals-Manufacturing Technology, 44(1),
157-60.
Jain, P. K., Pandey, P. M., and Rao, P. V. (2009). Effect of delay time on part strength in selective
laser sintering. The International Journal of Advanced Manufacturing Technology, 43(1),
117-26.
Kallrath, J., Altstädt, V., Schlöder, J. P., and Bock, H. G. (1999). Analysis of fatigue crack growth
behaviour in polymers and their composites based on ordinary differential equations
parameter estimation. Polymer Testing, 18(1), 11-35.
Karapatis, N. P., Van Griethuysen, J. P. S., and Glardon, R. (1998). Direct rapid tooling: a review
of current research. Rapid Prototyping Journal, 4(2), 77-89.
Bibliography
118
Kengpol, A., and O'Brien, C. (2001). The development of a decision support tool for the selection
of advanced technology to achieve rapid product development. International Journal of
Production Economics, 69(2), 177-91.
Koza, J. R. (1992). Genetic programming: on the programming of computers by means of natural
selection (Vol. 1). MIT press.
Krause, F. L., Ciesla, M., Stiel, C., and Ulbrich, A. (1997). Enhanced rapid prototyping for faster
product development processes. CIRP Annals-Manufacturing Technology, 46(1), 93-6.
Kruth, J. P., Leu, M. C., and Nakagawa, T. (1998). Progress in additive manufacturing and rapid
prototyping. CIRP Annals-Manufacturing Technology, 47(2), 525-40.
Kujawski, D., and Ellyin, F. (1995). A unified approach to mean stress effect on fatigue threshold
conditions. International Journal of Fatigue, 17(2), 101-6.
Kumar, S. (2009). Manufacturing of WC–Co moulds using SLS machine. Journal of materials
Processing Technology, 209(8), 3840-48.
Kumar, S., and Kruth, J. P. (2008). Wear performance of SLS/SLM materials. Advanced
Engineering Materials, 10(8), 750-3.
Kumar, S., and Kruth, J. P. (2010). Composites by rapid prototyping technology. Materials and
Design, 31(2), 850-6.
Lan, H. (2009). Web-based rapid prototyping and manufacturing system: a review. Computer in
Industry, 60(9), 643-56
Lan, H., Ding, Y., and Hong, J. (2005). Decision support system for rapid prototyping process
selection through integration of fuzzy synthetic evaluation and an expert system.
International Journal of Production Research, 43(1), 169-94.
Lee, B. H., Abdullah, J., and Khan, Z. A. (2005). Optimization of rapid prototyping parameters for
production of flexible ABS object. Journal of Materials Processing Technology, 169(1), 54-
61.
Lee, C. S., Kim, S. G., Kim, H. J., and Ahn, S. H. (2007). Measurement of anisotropic compressive
strength of rapid prototyping parts. Journal of Materials Processing Technology, 187, 627-
30.
Lee, J., and Huang, A. (2013). Fatigue analysis of FDM materials. Rapid Prototyping Journal, 19(4),
291-9.
Leuders, S., Thöne, M., Riemer, A., Niendorf, T., Tröster, T., Richard, H. A., and Maier, H. J. (2013).
On the mechanical behaviour of titanium alloy TiAl6V4 manufactured by selective laser
melting: Fatigue resistance and crack growth performance. International Journal of Fatigue,
48, 300-7.
Levy, G. N., Schindel, R., and Kruth, J. P. (2003). Rapid manufacturing and rapid tooling with layer
manufacturing (LM) technologies, state of the art and future perspectives. CIRP Annals-
Manufacturing Technology, 52(2), 589-609.
Bibliography
119
Lewis, G. K., and Schlienger, E. (2000). Practical considerations and capabilities for laser assisted
direct metal deposition. Materials and Design, 21(4), 417-23.
Li, C., Yi, J., and Zhao, D. (2009). Design of interval type-2 fuzzy logic system using sampled data
and prior knowledge. ICIC Express Letters, 3(3).
Liu, F. H., Shen, Y. K., and Liao, Y. S. (2011). Selective laser gelation of ceramic–matrix
composites. Composites Part B: Engineering, 42(1), 57-61.
Liu, Q., Leu, M. C., and Schmitt, S. M. (2006). Rapid prototyping in dentistry: technology and
application. The International Journal of Advanced Manufacturing Technology, 29(3-4),
317-35.
Lohfeld, S., McHugh, P., Serban, D., Boyle, D., O’Donnell, G., and Peckitt, N. (2007). Engineering
Assisted Surgery™: A route for digital design and manufacturing of customised
maxillofacial implants. Journal of Materials Processing Technology, 183(2), 333-8.
Luo, R. C., Chang, C. L., Pan, Y. L., & Tzou, J. H. (2005, November). Rapid tooling using laser
powered direct metallic manufacturing process. In Industrial Electronics Society, 2005.
IECON 2005. 31st Annual Conference of IEEE (pp. 6-pp). IEEE.
Ma, S., Gibson, I., Balaji, G., and Hu, Q. J. (2007). Development of epoxy matrix composites for
rapid tooling applications. Journal of Materials Processing Technology, 192, 75-82.
Mahapatra, S. S., and Sood, A. K. (2012). Bayesian regularization-based Levenberg–Marquardt
neural model combined with BFOA for improving surface finish of FDM processed part. The
International Journal of Advanced Manufacturing Technology, 60(9-12), 1223-35.
Mahesh, M., Fuh, J. Y., Wong, Y. S., and Loh, H. T. (2005, August). Benchmarking for decision
making in rapid prototyping systems. InAutomation Science and Engineering, 2005. IEEE
International Conference on (pp. 19-24). IEEE.
Marissen, R., Schudy, D., Kemp, A. J., Coolen, S. M. H., Duijzings, W. G., Van Der Pol, A. and Van
Gulick, A. J. (2001). The effect of material defects on the fatigue behaviour and the fracture
strain of ABS. Journal of Materials Science, 36(17), 4167-80.
Masood, S. H., and Al-Alawi, M. A. Z. E. N. (2002). The IRIS rapid prototyping system selector for
educational and manufacturing users. International Journal of Engineering Education,
18(1), 66-77.
Masood, S. H., and Song, W. Q. (2004). Development of new metal/polymer materials for rapid
tooling using fused deposition modelling. Materials and Design, 25(7), 587-94.
Masood, S. H., and Soo, A. (2002). A rule based expert system for rapid prototyping system
selection. Robotics and Computer-Integrated Manufacturing, 18(3), 267-74.
Minetola, P., and Iuliano, L. (2014). The reverse guillotine tribometer for evaluation of sliding wear
of additive manufactured fixtures. Rapid Prototyping Journal, 20(2), 105-14.
Montgomery DC (2003) Design and Analysis of Experiments. 5th ed. Singapore: John Wiley and
Sons Inc.
Bibliography
120
Monzon, M., Benítez, A. N., Marrero, M. D., Hernandez, N., Hernandez, P., and Aisa, J. (2008).
Validation of electrical discharge machining electrodes made with rapid tooling
technologies. Journal of Materials processing technology, 196(1), 109-14.
Mostafa, N., Syed, H. M., Igor, S., and Andrew, G. (2009). A study of melt flow analysis of an ABS-
Iron composite in fused deposition modelling process. Tsinghua Science and Technology,
14, 29-37.
Mueller, B., and Kochan, D. (1999). Laminated object manufacturing for rapid tooling and
patternmaking in foundry industry Computers in Industry, 39(1), 47-53.
Nickel, A. H., Barnett, D. M., and Prinz, F. B. (2001). Thermal stresses and deposition patterns in
layered manufacturing. Materials Science and Engineering: A, 317(1), 59-64.
Noorani, R. (2006). Rapid prototyping: principles and applications. John Wiley and Sons
Incorporated.
Onuh, S. O., and Yusuf, Y. Y. (1999). Rapid prototyping technology: applications and benefits for
rapid product development. Journal of intelligent manufacturing, 10(3-4), 301-11.
Peng, A., Xiao, X., and Yue, R. (2014). Process parameter optimization for fused deposition
modeling using response surface methodology combined with fuzzy inference system. The
International Journal of Advanced Manufacturing Technology, 73(1-4), 87-100.
Pham, D. T., and Gault, R. S. (1998). A comparison of rapid prototyping technologies. International
Journal of Machine Tools and Manufacture, 38(10),1257-87.
Phatak, A. M., and Pande, S. S. (2012). Optimum part orientation in Rapid Prototyping using genetic
algorithm. Journal of Manufacturing Systems, 31(4), 395-402.
Rahmati, S., and Dickens, P. (2007). Rapid tooling analysis of Stereolithography injection mould
tooling. International Journal of Machine Tools and Manufacture, 47(5), 740-7.
Raja, V., Zhang, S., Garside, J., Ryall, C., and Wimpenny, D. (2006). Rapid and cost-effective
manufacturing of high-integrity aerospace components. The International Journal of
Advanced Manufacturing Technology, 27(7-8), 759-73.
Ramesh, C. S., and Srinivas, C. K. (2009). Friction and wear behavior of laser-sintered iron–silicon
carbide composites. Journal of Materials Processing Technology, 209(14), 5429-36.
Rao, R. V., and Padmanabhan, K. K. (2007). Rapid prototyping process selection using graph
theory and matrix approach. Journal of Materials Processing Technology, 194(1), 81-8.
Rayegani, F., and Onwubolu, G. C. (2014). Fused deposition modelling (FDM) process parameter
prediction and optimization using group method for data handling (GMDH) and differential
evolution (DE). The International Journal of Advanced Manufacturing Technology, 73(1-4),
509-19.
Rezaie, R., Badrossamay, M., Ghaie, A., and Moosavi, H. (2013). Topology optimization for fused
deposition modeling process. Procedia CIRP, 6, 521-6.
Bibliography
121
Riemer, A., Leuders, S., Thöne, M., Richard, H. A., Tröster, T. and Niendorf, T. (2014). On the
fatigue crack growth behavior in 316L stainless steel manufactured by selective laser
melting. Engineering Fracture Mechanics, 120, 15-25.
Roylance, D. (2001). Stress-strain curves. Massachusetts Institute of Technology study,
Cambridge.
Sapkota, A., and Ohmi, K. (2009). Error detection and performance analysis scheme for particle
tracking velocimetry results using fuzzy logic. International Journal of Innovative
Computing, Information and Control, 5(12B), 4927-34.
Searson, D. P. (2009). GPTIPS: Genetic programming and symbolic regression for MATLAB. User
Guide, 2010.
Sehrt, J. T., and Witt, G. (2010, January). Dynamic strength and fracture toughness analysis of
beam melted parts. In Proceedings of the 36th International MATADOR Conference (pp.
385-388). Springer London.
Shan, Z., Yan, Y., Zhang, R., Lu, Q., and Guan, L. (2003). Rapid manufacture of metal tooling by
rapid prototyping. The International Journal of Advanced Manufacturing Technology, 21(7),
469-75.
Shengxian, C., Yanhui, Z., Jing, Z., and Dayu, Y. (2012). Experimental Study on Dynamic
Simulation for Biofouling Resistance Prediction by Least Squares Support Vector Machine.
Energy Procedia, 17, 74-78.
Singh, S., and Singh, R. (2015). Wear modelling of Al-Al2O3 functionally graded material prepared
by FDM assisted investment castings using dimensionless analysis. Journal of
Manufacturing Processes, 20(3), 507-14.
Sood, A. K., Equbal, A., Toppo, V., Ohdar, R. K., and Mahapatra, S. S. (2012). An investigation on
sliding wear of FDM built parts. CIRP Journal of Manufacturing Science and Technology,
5(1), 48-54.
Sood, A. K., Ohdar, R. K., and Mahapatra, S. S. (2009). Improving dimensional accuracy of fused
deposition modelling processed part using grey Taguchi method. Materials and Design,
30(10), 4243-52.
Sood, A. K., Ohdar, R. K., and Mahapatra, S. S. (2010). Parametric appraisal of mechanical
property of fused deposition modelling processed parts. Materials and Design, 31(1), 287-
95.
Sood, A. K. (2011). Study on Parametric Optimization of Fused Deposition Modelling (FDM)
Process (Doctoral dissertation, NATIONAL INSTITUTE OF TECHNOLOGY ROURKELA).
Spierings, A. B., Starr, T. L., and Wegener, K. (2013). Fatigue performance of additive
manufactured metallic parts. Rapid Prototyping Journal, 19(2), 88-94.
Subburaj, K., and Ravi, B. (2008). Computer aided rapid tooling process selection and
manufacturability evaluation for injection mold development. Computers in Industry, 59(2),
262-76.

Bibliography
122
Sun, Q., Rizvi, G. M., Bellehumeur, C. T., and Gu, P. (2008). Effect of processing conditions on the
bonding quality of FDM polymer filaments. Rapid Prototyping Journal, 14(2), 72-80.
Wohlers, T. (2012). Wohlers report 2012. Wohlers Associates, Inc.
Tang, Y., Zhou, H., Hong, J., and Lu, B. (2002). RP-based abrading technique for graphite EDM
electrode. Journal of Material Science and Technology, 18(6), 572-74.
Tao, G., and Xia, Z. (2007a). An experimental study of uniaxial fatigue behavior of an epoxy resin
by a new noncontact real‐time strain measurement and control system. Polymer
Engineering and Science, 47(6), 780-8.
Tao, G., and Xia, Z. (2007b). Mean stress/strain effect on fatigue behavior of an epoxy resin.
International journal of fatigue, 29(12), 2180-90.
Todd Grimm, (2008) Breakthroughs in Rapid Prototyping Materials, Desktop Engineering
(Magazine).
Too, M. H., Leong, K. F., Chua, C. K., Du, Z. H., Yang, S. F., Cheah, C. M., and Ho, S. L. (2002).
Investigation of 3D non-random porous structures by fused deposition modelling. The
International Journal of Advanced Manufacturing Technology, 19(3), 217-23.
Tromans, G. (2003). Developments in rapid casting (Vol. 2). John Wiley and Sons.
Upcraft, S., and Fletcher, R. (2003). The rapid prototyping technologies. Assembly Automation,
23(4), 318-30.
Vaidya, O. S., and Kumar, S. (2006). Analytic hierarchy process: An overview of applications.
European Journal of operational research, 169(1), 1-29.
Vijayaraghavan, V., Garg, A., Lam, J. S. L., Panda, B., and Mahapatra, S. S. (2014). Process
characterisation of 3D-printed FDM components using improved evolutionary
computational approach. The International Journal of Advanced Manufacturing
Technology, 78(5-8), 781-93.
Villalpando, L., Eiliat, H., and Urbanic, R. J. (2014). An optimization approach for components built
by fused deposition modeling with parametric internal structures. Procedia CIRP, 17, 800-
5.
Wang, T. M., Xi, J. T., and Jin, Y. (2007). A model research for prototype warp deformation in the
FDM process. The International Journal of Advanced Manufacturing Technology, 33(11-
12), 1087-96.
Wang, T., Li, L., and Tong, S. (2010). Application of type-2 fuzzy logic system in indoor temperature
control. ICIC Express Letters, 4(5B), 1919-24.
Wang, W. L., Conley, J. G., Yan, Y. N., and Fuh, J. Y. (2000). Towards intelligent setting of process
parameters for layered manufacturing. Journal of Intelligent Manufacturing, 11(1), 65-74.
Wiedemann, B., and Jantzen, H. A. (1999). Strategies and applications for rapid product and
process development in Daimler-Benz AG. Computers in Industry, 39(1), 11-25.
Bibliography
123
Wohler, T., (2010) Additive Manufacturing State of the Industry Annual Worldwide Progress
Report,” Wohler associates, Colorado, USA.
Wohlers, T. T. (1992). CAD meets rapid prototyping. COMP. AIDED ENG., 11(4), 66-75.
Wu, G., Langrana, N. A., Sadanji, R., and Danforth, S. (2002). Solid freeform fabrication of metal
components using fused deposition of metals. Materials and design, 23(1), 97-105.
Yan, Y., Li, S., Zhang, R., Lin, F., Wu, R., Lu, Q., and Wang, X. (2009). Rapid prototyping and
manufacturing technology: principle, representative technics, applications, and
development trends. Tsinghua Science and Technology, 14, 1-12.
Yang, X. S. (2010). Engineering optimization: an introduction with metaheuristic applications. John
Wiley and Sons.
Yen, H. C., Chiu, M. L., and Tang, H. H. (2009). Laser scanning parameters on fabrication of
ceramic parts by liquid phase sintering. Journal of the European Ceramic Society, 29(8),
1331-6.
Zhang, W., Srivastava, I., Zhu, Y. F., Picu, C. R., and Koratkar, N. A. (2009). Heterogeneity in epoxy
nanocomposites initiates crazing: significant improvements in fatigue resistance and
toughening. Small, 5(12), 1403-7.
Zhang, Y. M., Li, P., Chen, Y., and Male, A. T. (2002). Automated system for welding-based rapid
prototyping. Mechatronics, 12(1), 37-53.
Zhang, Y., and Chou, K. (2008). A parametric study of part distortions in fused deposition modelling
using three-dimensional finite element analysis. Proceedings of the Institution of
Mechanical Engineers, Part B: Journal of Engineering Manufacture, 222(8), 959-68.
Zhang, Y., and Liu, H. (2009). Application of rapid prototyping technology in die making of diesel
engine. Tsinghua Science and Technology, 14, 127-31.
Zhang, Y., Chen, Y., Li, P., and Male, A. T. (2003). Weld deposition-based rapid prototyping: a
preliminary study. Journal of Materials Processing Technology, 135(2), 347-57.
Zhang, Y., He, X., Du, S., and Zhang, J. (2001). Al2O3 ceramics preparation by LOM (laminated
object manufacturing). The International Journal of Advanced Manufacturing Technology,
17(7), 531-534.
Zhong, W., Li, F., Zhang, Z., Song, L., and Li, Z. (2001). Short fiber reinforced composites for fused
deposition modeling. Materials Science and Engineering: A, 301(2), 125-30.
Ziemian, S., Okwara, M., and Ziemian, C. W. (2015). Tensile and fatigue behavior of layered
acrylonitrile butadiene styrene. Rapid Prototyping Journal, 21(3), 270-8.
Vitae
Dissemination
PATENTS
1. Design registration for Portable Water Bottle (265832) patented on 18.09.2014,
(Swayam Bikash Mishra, Siba Sankar Mahapatra, Sandip Mondal and Raj Kishore
Patel).
2. Patent applied for Gravity Flow Portable Water Bottle with Filtration System
(961/KOL/2014) on 22.09.2014. (Swayam Bikash Mishra, Siba Sankar Mahapatra,
Sandip Mondal and Raj Kishore Patel). (Examination Awaited).
JOURNAL ARTICLES
1. Mishra, S. B. and Mahapatra, S. S. Improvement in Tensile Strength of FDM Built
Parts by Parametric Control. Applied Mechanics and Materials. 2014; 592:1075-9.
2. Mishra, S. B., Malik, R. and Mahapatra, S. S. Enhancement of Flexural Strength of
FDM Build Parts using a Metaheuristic Approach. Additive manufacturing (under
review).
3. Mishra, S. B. and Mahapatra, S. S. Strain controlled fatigue behaviour of FDM build
parts. Engineering failure analysis (under review).
4. Mishra, S. B. and Mahapatra, S. S. Effect of raster fill pattern and contour number on
mechanical property in fused deposition modelling parts. Robotics and computer
integrated manufacturing (under review).
5. Mishra, S. B. and Mahapatra, S. S. Parametric analysis of wear behaviour on fused
deposition modelling parts. International journal of productivity and quality
management (under review).
CONFERENCE PRESENTATIONS
1. Mishra, S. B. and Mahapatra, S. S. (2014), “Improvement in tensile strength of FDM
build parts using a parametric approach” International Mechanical Engineering
Congress 2014, NIT Tiruchirappalli, June 13-15.
2. Mishra, S. B., Malik, R. and Mahapatra, S. S. (2015), “An experimental investigation
on Flexural strength of FDM process parts” Advances in Materials, Manufacturing and
Applications 2015, NIT Tiruchirappalli, April 09-11
3. Mishra, S. B. and Mahapatra, S. S. (2015), “ Parametric assessments of FDM build
part”, National Seminar on Recent Advancements in Mechanical and Production
Engineering 2015, Nalanda institute of technology Bhubaneswar, October 10-11.

Bibliography
125
Bibliography
126
Vitae
Swayam Bikash Mishra
Ph.D. Research Scholar,
National Institute of Technology Rourkela
Sundargarh, Odisha 769008
Tel: +91-9937175116; 06721-270289;
Email: [email protected]
DOB: 27th May 1987, Male, Indian
EDUCATION / ACADEMIC BACKGROUND
2015 Ph.D. (Production Engineering, NIT Rourkela, India) (Continuing)
2012 M.Tech (Heat and Power, SOA University, Odisha, India)
2009 B.Tech (Mechanical Engineering, BPUT, Odisha, India)
WORK EXPERIENCE
Designation: Ph.D. Scholar
Duration: July 2012-till date
Organisation: National Institute of Technology, Rourkela
Job Profile: Research and Development in the area of Rapid Prototyping with special
importance on Fused Deposition Modelling and its applications. Designed
a water bottle by R.P technique which can purify water itself without the
help of any external machine.
Designation: Assistant Professor
Duration: Jan 2011-July 2012
Organisation: Aryan Institute of Engineering and Technology, Bhubaneswar
Job Profile: Responsible for assisting in the educational and social development of
B.Tech final and pre-final students. Conducted classes and labs in the
area of thermal and automobile engineering.
Duties:

Bibliography
127
1. Planning & delivering well-structured lessons which engage &
motivate students.
2. Planning and organising visits, field studies and special activities
connected with the teaching of the subject.
3. Organising and supporting a range of extra-curricular activities.
4. Achieving and maintain high standards of care and education.
5. Planning, preparing and reviewing the school curriculum with other
staff.
Designation: Graduate Engineer Trainee
Duration: Nov 2009-Dec 2010
Organisation: Central Tool Room and Training Centre, Bhubaneswar
Job Profile: Responsible for conducting classes of CATIA, SOLID WORKS and
other such mechanical systems softwares.
Teaching Attributes:
1. Able to create a vibrant and effective learning environment.
2. Familiar with a variety of approaches to teaching pupils.
3. Having the ability to motivate and earn the respect of students.
SKILLS Hands on Experience in: 1. CATIA
2. Pro-E
3. SOLID WORKS
4. Auto CAD
5. Uni-Graphics
6. ANSYS
7. MINITAB
8. MATLAB
9. Design of Experiments
Proficiency in: MS Office

Bibliography
128
MEMBERSHIP
1. Regular Student Membership "American Society of Mechanical Engineers (ASME)",
USA.
2. Associate Membership “The Institute of Engineers (IE)” India.
3. Life Membership “Additive Manufacturing Society of India (AMSI)”, India.
RESEARCH EXPERIENCE Doctoral Research
Parametric assessments of Fused Deposition Modelling (FDM) build parts on
Mechanical strength viz. Tensile, Compressive, Impact and Flexural strength.
Experimental investigation of the Effect of build Parameters on the Fatigue life of FDM
Build Parts and the best parameter setting improving the fatigue life has been
suggested.
Wear behaviour of the FDM build parts have been studied considering six important
controllable process parameters.
The effect of process parameters on the circularity and the surface roughness of build
part are studied.
Split Mould and Pattern Manufactured using FDM machine within minimum time and
less material waste.
The FDM build parts are made conductive for manufacturing of internal circuit board
design.
FDM build parts are made as replica using electrolysis and electro-less processes for
the preservation of the antique artefacts.
Master’s Research
Study of internal flow characteristics of an internal pinned fin tube at variable Reynolds
number and variable finned number.
Applying the optimisation technique for best parameter setting is suggested to
maximize the heat transfer rate through the internal pinned fin tube.

Bibliography
129
PUBLICATIONS Patents
Design registration for Portable Water Bottle (265832) patented on 18.09.2014,
(Swayam Bikash Mishra, Siba Sankar Mahapatra, Sandip Mondal and Raj Kishore
Patel).
Patent applied for Gravity Flow Portable Water Bottle with Filtration System
(961/KOL/2014) on 22.09.2014. (Swayam Bikash Mishra, Siba Sankar Mahapatra,
Sandip Mondal and Raj Kishore Patel). (Examination Awaited).
Referred journals
1. Mishra, S. B. and Mahapatra, S. S. Improvement in Tensile Strength of FDM Built
Parts by Parametric Control. Applied Mechanics and Materials. 2014; 592:1075-9.
2. Mishra, S. B., Malik, R. and Mahapatra, S. S. Enhancement of Flexural Strength of
FDM Build Parts using a Metaheuristic Approach. Additive manufacturing (under
review).
3. Mishra, S. B. and Mahapatra, S. S. Strain controlled fatigue behaviour of FDM build
parts. Engineering failure analysis (under review).
4. Mishra, S. B. and Mahapatra, S. S. Effect of raster fill pattern and contour number on
mechanical property in fused deposition modelling parts. Robotics and computer
integrated manufacturing (under review).
5. Mishra, S. B. and Mahapatra, S. S. Parametric analysis of wear behaviour on fused
deposition modeling parts. International journal of productivity and quality
management (under review).
6. Mishra, S. B. and Mahapatra, S. S. Parametric appraisal of compressive strength on
the FDM build parts. Under process
7. Mishra, S. B. and Mahapatra, S. S. An experimental investigation on circularity and
surface roughness of the FDM build parts. Under process
Conference publications
8. Mishra, S. S. (2012), “Characteristics of heat flow through internal finned tube under
mixed condition”, National seminar on Advancement in production technology and
engineering materials 2012, Aryan institute of technology Bhubaneswar, February 11-
12.
Bibliography
130
9. Mishra, S. B. and Mahapatra, S. S. (2013), “Optimisation of performance and analysis
of internal finned tube heat exchanger under mixed flow condition”, AEOTIT 2013,
SVNIT Surat, July 01-03.
10. Mishra, S. B. and Mahapatra, S. S. (2014), “Improvement in tensile strength of FDM
build parts using a parametric approach” IMEC 2014, NIT Tiruchirappalli, June 13-15.
11. Mishra, S. B., Malik, R. and Mahapatra, S. S. (2015), “An experimental investigation
on Flexural strength of FDM process parts” AMMA 2015, NIT Tiruchirappalli, April 09-
11
12. Mishra, S. B. and Mahapatra, S. S. (2015), “ Parametric assessments of FDM build
part”, NSRAMPE 2015, Nalanda institute of technology Bhubaneswar, October 10-11
PROJECTS HANDLED
1. “Design and development of moulds by RP route” for IFGL Refractories Limited
Kalunga Odisha for Rs. 34,996/- on 13.06.2014.
2. “End use part design for Gupchup machine” project undertaken by Prof. S. S.
Mahapatra and Dr. S. Panda, Mechanical Engineering department, NIT Rourkela.
14.06.2014
3. “Design and development of moulds by RP route” for IFGL Refractories Limited
Kalunga Odisha for Rs. 49,900/- on 08.08.2014.
4. “Design and manufacturing of portable water filter” project under taken by Prof. S. S.
Mahapatra, Mechanical Engineering Department, NIT Rourkela. 12.08.2014.
5. “Design and fabrication of casting core by RP route” for IFGL Refractories Limited
Kalunga Odisha for Rs. 30,000/- on 20.10.2014.
6. “Pattern manufacturing using FDM technique” For Eastern alloy Pvt. Ltd Kalunga
Odisha for Rs. 54,000/- on 19.02.2015.
7. “Design and manufacturing of end use parts for portable washing machine” For
Estinno Pvt. Ltd, Rourkela Odisha for Rs. 40,609/- on 10.07.2015.
8. “External fin design and manufacturing for under water robot” DRDO project
undertaken by Prof. B. Subudhi, Electrical Engineering Department, NIT Rourkela.
Bibliography
131
ORGANISING COMMITTEE MEMBER FOR STTP
1. A three day short term course on Design of Experiments: An Optimisation Tool
(DOEOT-2013) during 27th Dec. – 29th Dec. 2013 at Mechanical Engineering
Department of NIT Rourkela (a self-sponsored course for faculty, research scholars
and industry professionals (No. of participants 75)
2. A three day short term course on Multi-Objective Optimisation Methods and
Applications in Manufacturing (MOOMAM-14) during 6th June 8th June 2014 at
Mechanical Engineering Department of NIT Rourkela (a self-sponsored course for
faculty, research scholars and industry professionals (No. of participants 36).
3. A four day short term course on Design of Experiments: An Optimisation Tool
(DOEOT-2014) during 22nd Dec. – 25th Dec. 2014 at Mechanical Engineering
Department of NIT Rourkela (a self-sponsored course for faculty, research scholars
and industry professionals (No. of participants 68).
4. A four day short term course on Design of Experiments: An Optimisation Tool
(DOEOT-2015) during 21nd Dec. – 24th Dec. 2015 at Mechanical Engineering
Department of NIT Rourkela (a self-sponsored course for faculty, research scholars
and industry professionals (Expected participation 60).
REFEREES
Dr. Siba Sankar Mahapatra
Professor, NIT Rourkela, Odisha, India. Email: [email protected]
Dr. Saurav Datta
Asst. Professor, NIT Rourkela, Odisha, India. Email: [email protected]
Dr. Manasa Behera
Asst. Professor, IIT Bombay, Maharashtra, India. Email: [email protected]
Date: January 22, 2016 Swayam Bikash Mishra
Ph.D. Research Scholar, NIT Rourkela