A Study on Different Schemes With Comparison &
17
PRESENTED BY: HARSH JAIN PGDM, FINANCE ROLL- 5130
-
Upload
harsh-vardhan -
Category
Documents
-
view
223 -
download
0
Transcript of A Study on Different Schemes With Comparison &
8/7/2019 A Study on Different Schemes With Comparison &
http://slidepdf.com/reader/full/a-study-on-different-schemes-with-comparison- 1/17
PRESENTED BY:
HARSH JAINPGDM, FINANCE
ROLL- 5130

8/7/2019 A Study on Different Schemes With Comparison &
http://slidepdf.com/reader/full/a-study-on-different-schemes-with-comparison- 2/17
�
Mutual fund is a trust that pools the savings of anumber of investors who share a common financial
goal.
� Mutual fund is the most suitable investment for the
common man as it offers an opportunity to invest in adiversified, professionally managed basket of
securities at a relatively low cost.
� A mutual fund is a body corporate registered with the
SEBI that pools up the money fromindividual/corporate investors and invest the same on
behalf of the unit holders, in equity shares, government
securities, bonds, call money market etc. and distribute
the profits.

8/7/2019 A Study on Different Schemes With Comparison &
http://slidepdf.com/reader/full/a-study-on-different-schemes-with-comparison- 3/17
� To show the wide range of investment options availablein mutual funds by explaining its various schemes.
� To compare the schemes based on Sharpe¶s ratio,
Treynor¶s ratio, b Coefficient, Returns and show which
scheme is best for the investor based on his risk profile.
� To help an investor make a right choice of investment,
while considering the inherent risk factors.
� To understand the performance of different schemes
in different companies like LIC, SBI, RELIANCE
AND KOTAK.
8/7/2019 A Study on Different Schemes With Comparison &
http://slidepdf.com/reader/full/a-study-on-different-schemes-with-comparison- 4/17
� The study is basically made to analyze the various openended equity schemes of different asset managementcompanies to highlight the diversity of investment thatmutual fund offer.
� The study one would understand how a common mancould fruitfully convert an inadequate payment into great
penny by wisely investing into the right scheme accordingto his risk taking abilities.
� The study here has been limited to analyze open-ended
equity Growth schemes of different Asset ManagementCompanies namely Kotak Mahindra Mutual Fund,Reliance Mutual Fund, LIC and SBI Mutual Funds eachscheme is analyzed according to its performance againstthe other .
8/7/2019 A Study on Different Schemes With Comparison &
http://slidepdf.com/reader/full/a-study-on-different-schemes-with-comparison- 5/17
� The data collected for this project is basically from
one source, that is:-
Secondary sources: Collection of data from Internet
and Books.
� And some formulas or factors which help to find out
the performance of different schemes of mutual
funds and compare with the different companymutual funds.

8/7/2019 A Study on Different Schemes With Comparison &
http://slidepdf.com/reader/full/a-study-on-different-schemes-with-comparison- 6/17
8/7/2019 A Study on Different Schemes With Comparison &
http://slidepdf.com/reader/full/a-study-on-different-schemes-with-comparison- 7/17
� Kotak Mahindra Mutual Fund (KMMF) is managed by Kotak Mahindra Asset Management Company
Ltd., a wholly owned subsidiary of Kotak Mahindra
Bank Ltd.
� The Kotak Mahindra Group was born in 1985 as
Kotak Capital Management Finance Limited.
� Industrialists Harish Mahindra and Anand
Mahindra took a stake in 1986, and that's whenthe company changed its name to Kotak
Mahindra Finance Limited.
8/7/2019 A Study on Different Schemes With Comparison &
http://slidepdf.com/reader/full/a-study-on-different-schemes-with-comparison- 8/17
Company
nameReliance Kotak Lic Sbi
Month (R) (R) (R) (R)
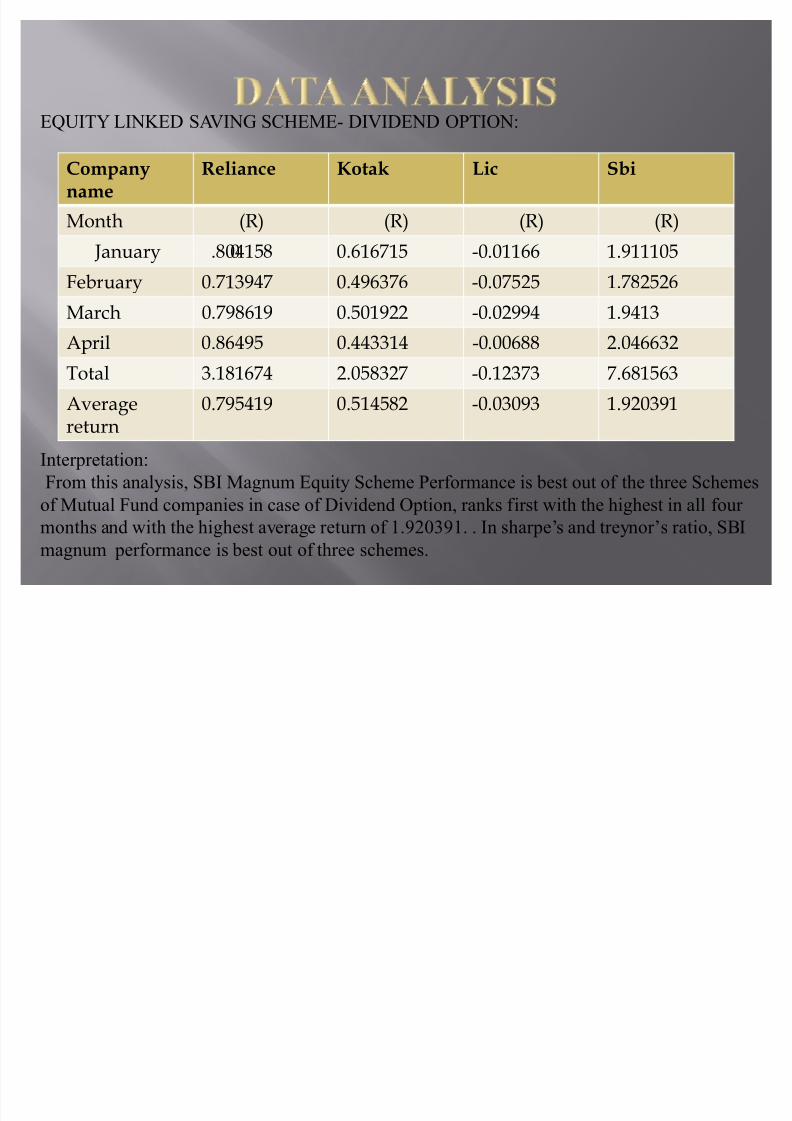
January 0.804158 0.616715 -0.01166 1.911105
February 0.713947 0.496376 -0.07525 1.782526
March 0.798619 0.501922 -0.02994 1.9413
April 0.86495 0.443314 -0.00688 2.046632
Total 3.181674 2.058327 -0.12373 7.681563
Averagereturn 0.79
5419
0.
51458
2 -0.
0309
3 1.9
2039
1
EQUITY LINKED SAVING SCHEME- DIVIDEND OPTION:
Interpretation:
From this analysis, SBI Magnum Equity Scheme Performance is best out of the three Schemes
of Mutual Fund companies in case of Dividend Option, ranks first with the highest in all four
months and with the highest average return of 1.920391. . In sharpe¶s and treynor¶s ratio, SBI
magnum performance is best out of three schemes.
8/7/2019 A Study on Different Schemes With Comparison &
http://slidepdf.com/reader/full/a-study-on-different-schemes-with-comparison- 9/17
Company
nameReliance Kotak Lic Sbi
Month (R) (R) (R) (R)
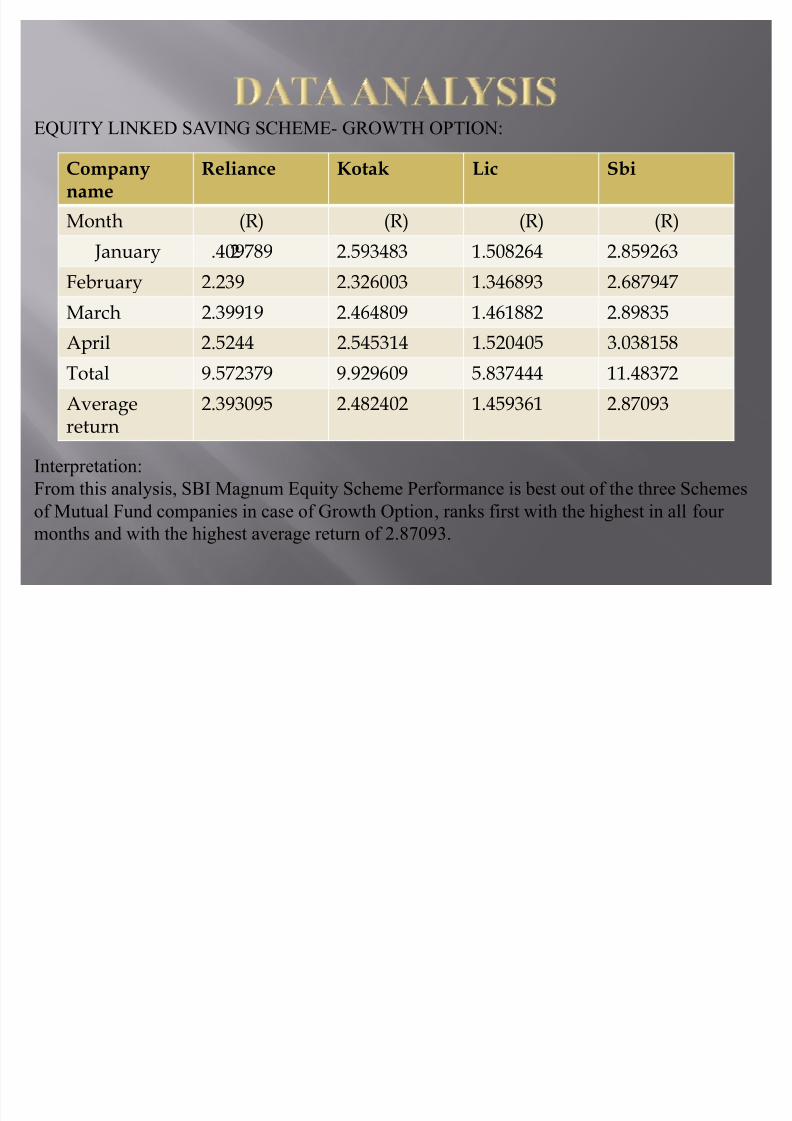
January 2.409789 2.593483 1.508264 2.859263
February 2.239 2.326003 1.346893 2.687947
March 2.39919 2.464809 1.461882 2.89835
April 2.5244 2.545314 1.520405 3.038158
Total 9.572379 9.929609 5.837444 11.48372
Averagereturn 2.
39
309
5 2.
48
2402 1.
459
36
1 2.87
09
3
EQUITY LINKED SAVING SCHEME- GROWTH OPTION:
Interpretation:
From this analysis, SBI Magnum Equity Scheme Performance is best out of the three Schemes
of Mutual Fund companies in case of Growth Option, ranks first with the highest in all four
months and with the highest average return of 2.87093.
8/7/2019 A Study on Different Schemes With Comparison &
http://slidepdf.com/reader/full/a-study-on-different-schemes-with-comparison- 10/17
Company
nameReliance Kotak Lic Sbi
Month (R) (R) (R) (R)
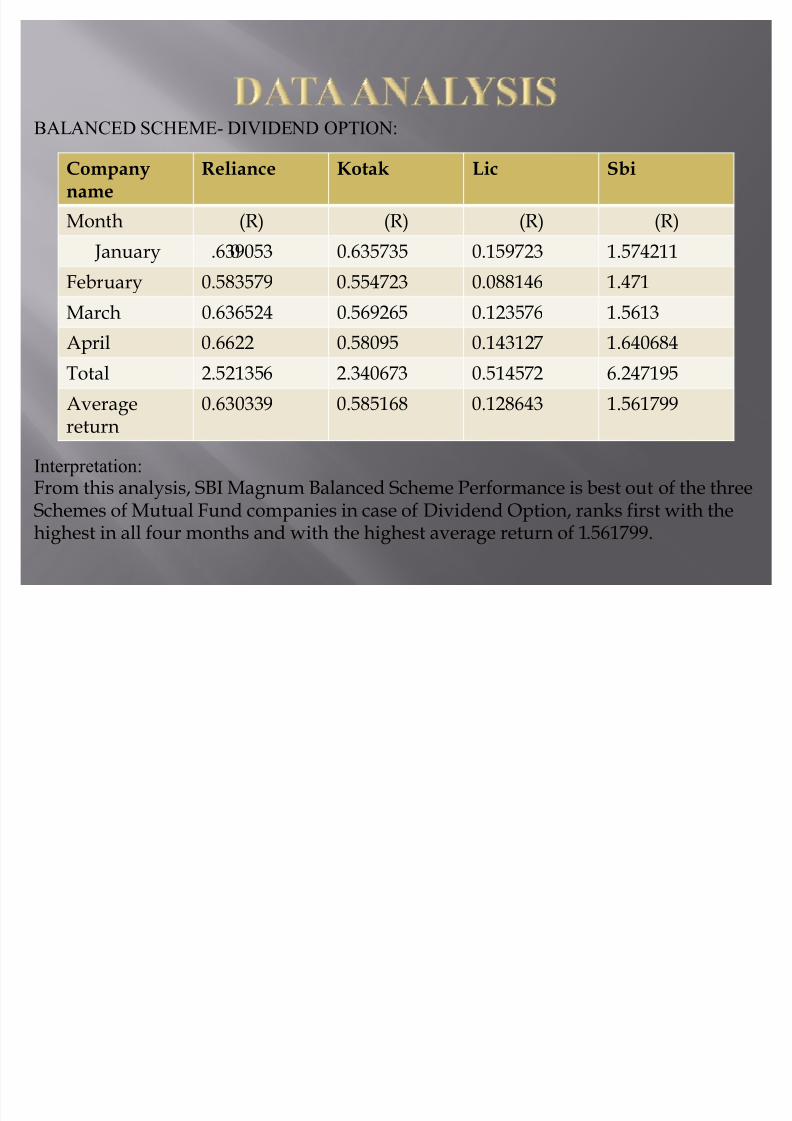
January 0.639053 0.635735 0.159723 1.574211
February 0.583579 0.554723 0.088146 1.471
March 0.636524 0.569265 0.123576 1.5613
April 0.6622 0.58095 0.143127 1.640684
Total 2.521356 2.340673 0.514572 6.247195
Averagereturn
0.630339 0.585168 0.128643 1.561799
BALANCED SCHEME- DIVIDEND OPTION:
Interpretation:
From this analysis, SBI Magnum Balanced Scheme Performance is best out of the threeSchemes of Mutual Fund companies in case of Dividend Option, ranks first with thehighest in all four months and with the highest average return of 1.561799.
8/7/2019 A Study on Different Schemes With Comparison &
http://slidepdf.com/reader/full/a-study-on-different-schemes-with-comparison- 11/17
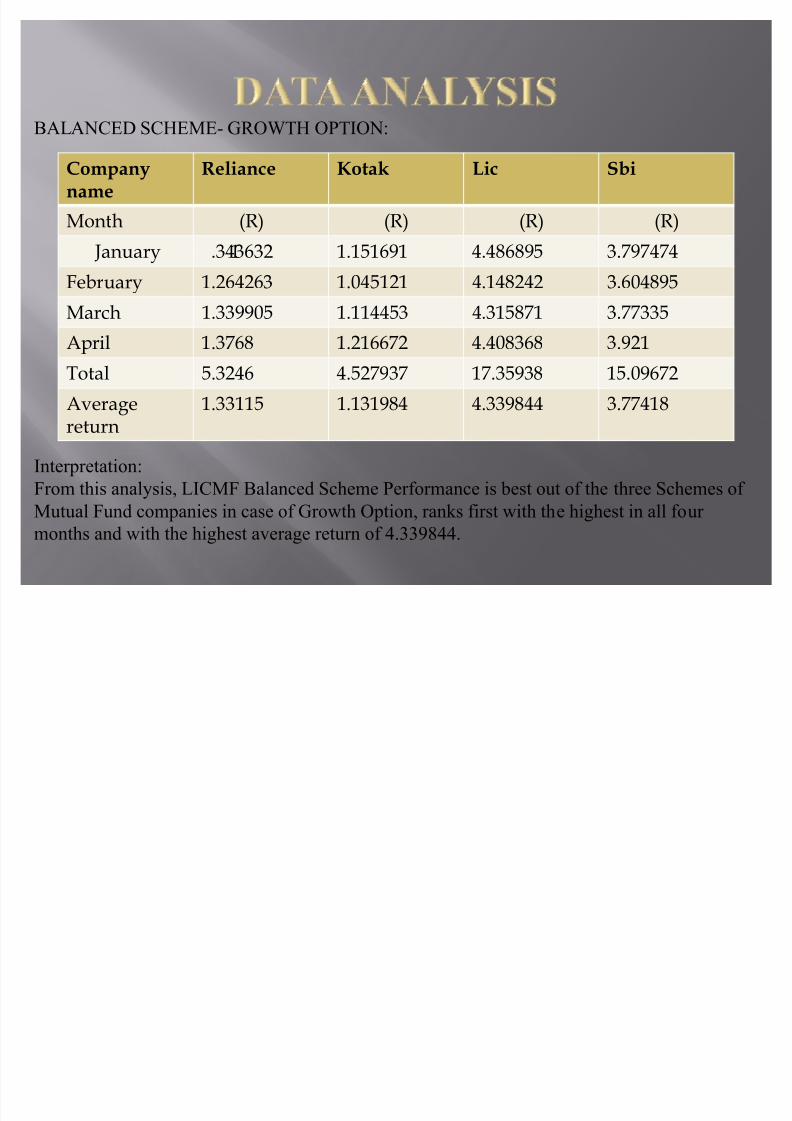
Company
nameReliance Kotak Lic Sbi
Month (R) (R) (R) (R)
January 1.343632 1.151691 4.486895 3.797474
February 1.264263 1.045121 4.148242 3.604895
March 1.339905 1.114453 4.315871 3.77335
April 1.3768 1.216672 4.408368 3.921
Total 5.3246 4.527937 17.35938 15.09672
Averagereturn
1.33115 1.131984 4.339844 3.77418
BALANCED SCHEME- GROWTH OPTION:
Interpretation:
From this analysis, LICMF Balanced Scheme Performance is best out of the three Schemes of
Mutual Fund companies in case of Growth Option, ranks first with the highest in all four
months and with the highest average return of 4.339844.
8/7/2019 A Study on Different Schemes With Comparison &
http://slidepdf.com/reader/full/a-study-on-different-schemes-with-comparison- 12/17
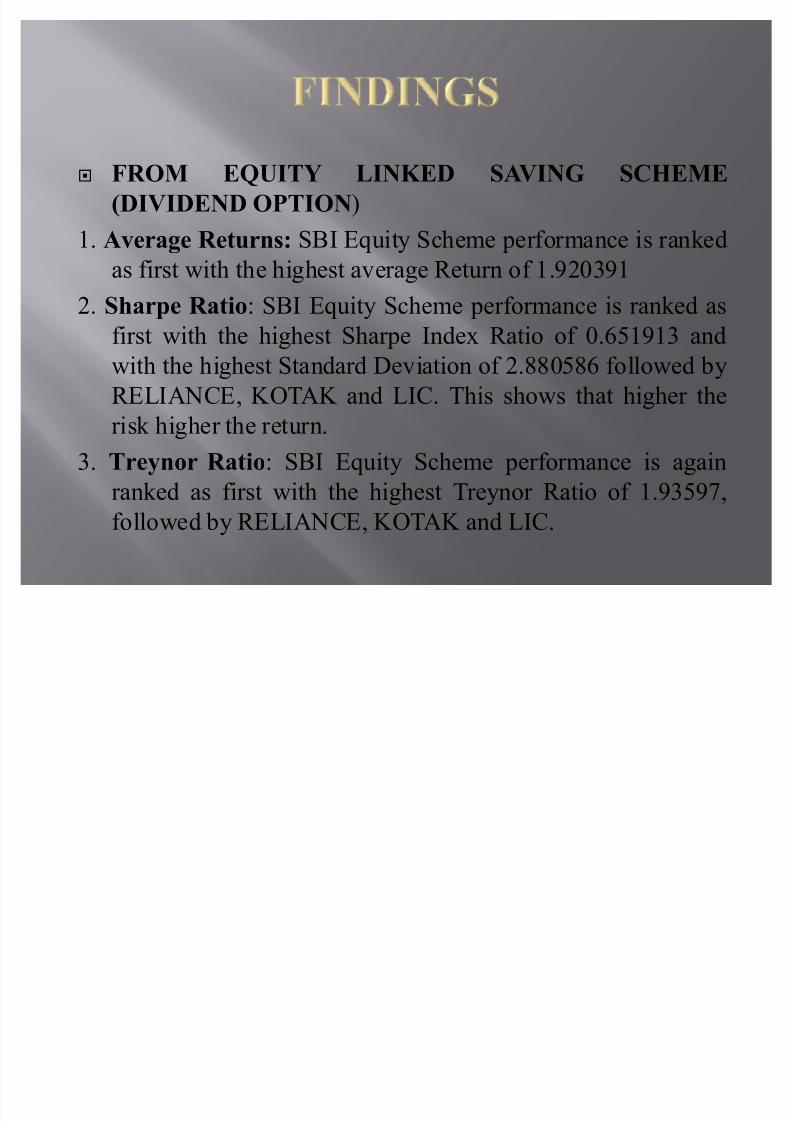
� FROM EQUITY LINKED SAVING SCHEME
(DIVIDEND OPTION)
1. Average Returns: SBI Equity Scheme performance is ranked
as first with the highest average Return of 1.9203912. Sharpe Ratio: SBI Equity Scheme performance is ranked as
first with the highest Sharpe Index Ratio of 0.651913 and
with the highest Standard Deviation of 2.880586 followed by
RELIANCE, KOTAK and LIC. This shows that higher the
risk higher the return.
3. Treynor Ratio: SBI Equity Scheme performance is again
ranked as first with the highest Treynor Ratio of 1.93597,
followed by RELIANCE, KOTAK and LIC.

8/7/2019 A Study on Different Schemes With Comparison &
http://slidepdf.com/reader/full/a-study-on-different-schemes-with-comparison- 13/17
� FROM EQUITY LINKED SAVING SCHEME(GROWTH OPTION)
1. Average Returns: SBI Equity Scheme performance is rankedas first with the highest Average Return of 2.87093
2. Sharpe Ratio: SBI Equity Scheme performance is ranked asfirst with the highest Sharpe Index Ratio of 0.656798 andwith the highest Standard Deviation of 4.306394, followed
by KOTAK, RELIANCE and LIC. This shows that higher the risk higher the return.
3. Treynor Ratio: SBI Equity Scheme performance is againranked as first in case of Treynor ratio with the highestTreynor Ratio of 2.915907, followed by RELIANCE,KOTAK and LIC.
8/7/2019 A Study on Different Schemes With Comparison &
http://slidepdf.com/reader/full/a-study-on-different-schemes-with-comparison- 14/17
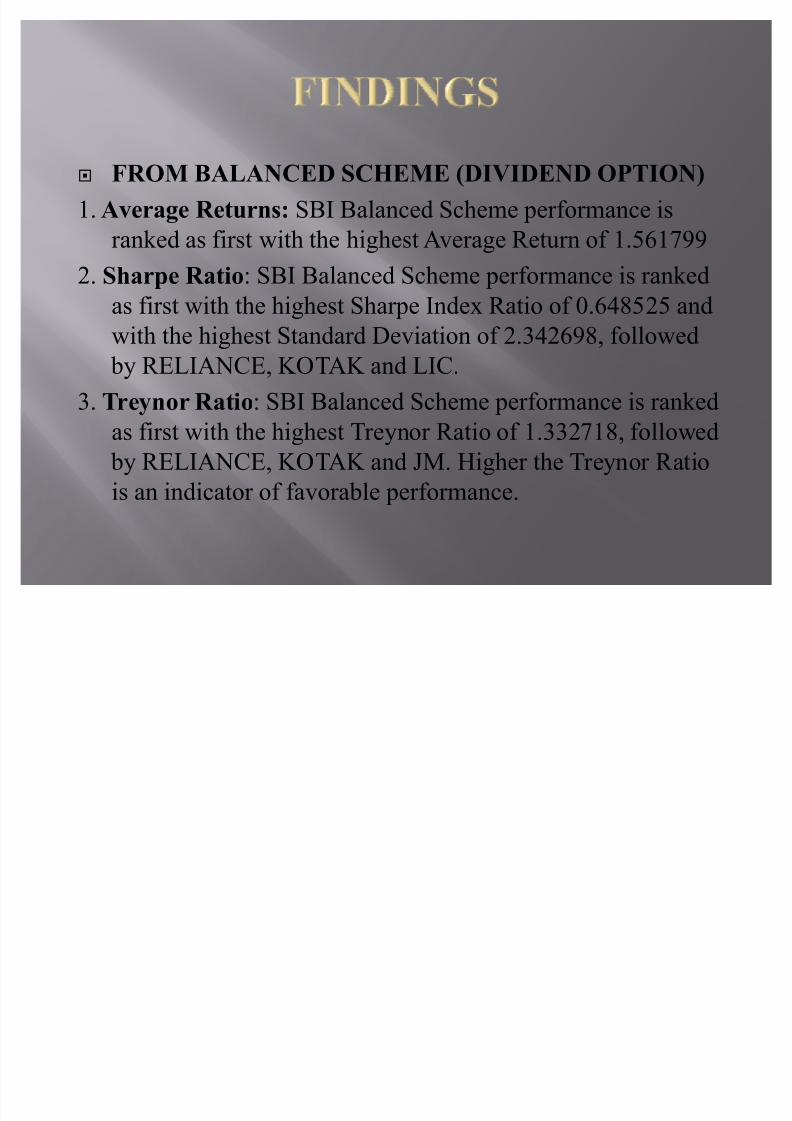
� FROM BALANCED SCHEME (DIVIDEND OPTION)
1. Average Returns: SBI Balanced Scheme performance is
ranked as first with the highest Average Return of 1.561799
2. Sharpe Ratio: SBI Balanced Scheme performance is rankedas first with the highest Sharpe Index Ratio of 0.648525 and
with the highest Standard Deviation of 2.342698, followed
by RELIANCE, KOTAK and LIC.
3. Treynor Ratio: SBI Balanced Scheme performance is ranked
as first with the highest Treynor Ratio of 1.332718, followed
by RELIANCE, KOTAK and JM. Higher the Treynor Ratio
is an indicator of favorable performance.
8/7/2019 A Study on Different Schemes With Comparison &
http://slidepdf.com/reader/full/a-study-on-different-schemes-with-comparison- 15/17
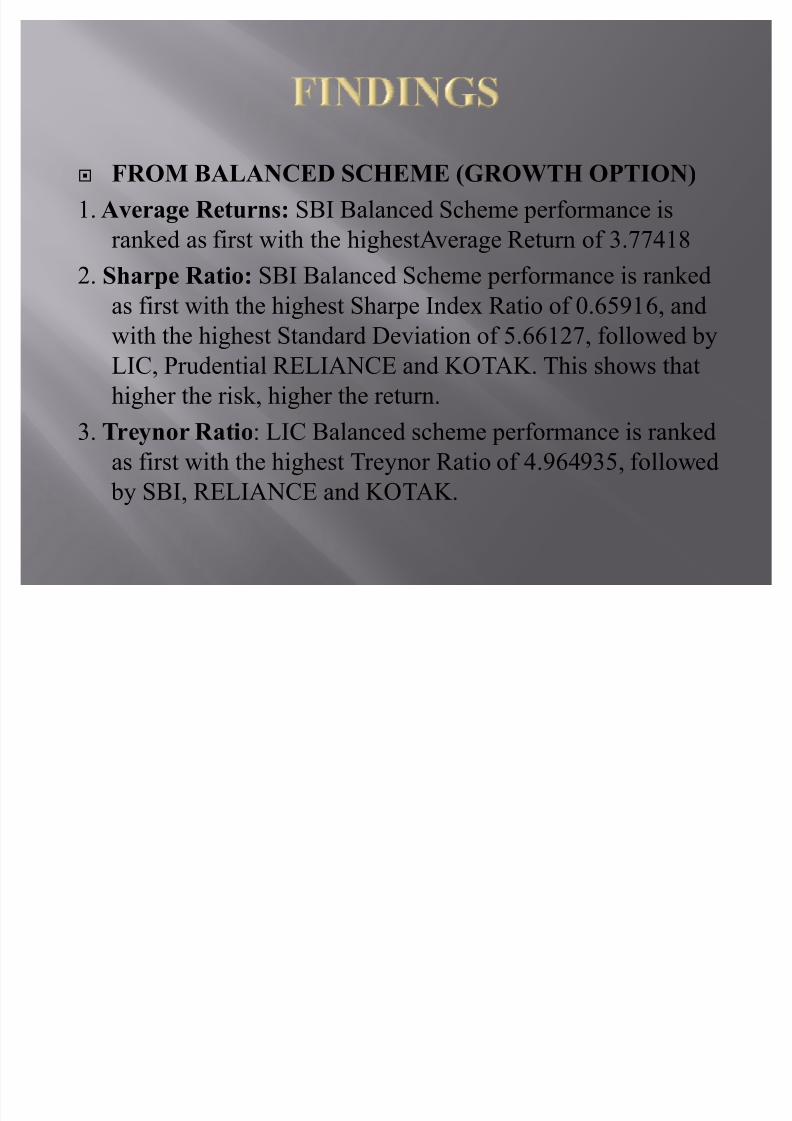
� FROM BALANCED SCHEME (GROWTH OPTION)
1. Average Returns: SBI Balanced Scheme performance is
ranked as first with the highestAverage Return of 3.77418
2. Sharpe Ratio: SBI Balanced Scheme performance is rankedas first with the highest Sharpe Index Ratio of 0.65916, and
with the highest Standard Deviation of 5.66127, followed by
LIC, Prudential RELIANCE and KOTAK. This shows that
higher the risk, higher the return.
3. Treynor Ratio: LIC Balanced scheme performance is ranked
as first with the highest Treynor Ratio of 4.964935, followed
by SBI, RELIANCE and KOTAK.

8/7/2019 A Study on Different Schemes With Comparison &
http://slidepdf.com/reader/full/a-study-on-different-schemes-with-comparison- 16/17
� The Company should come forward to introduce moreschemes at the right time for the benefit of the fundhouse, investors, brokers, and the distributors.
� In general the private sector mutual fund companiesoutperforms the public sector mutual fund companies, if the Kotak Mahindra AMC Company understands their Competitors and the market they will have a hedge over their competitors in the future.
� A typical individual is not likely to have the knowledge,skills, inclination and time to keep track of andunderstand the causes and implication of the pricechanges and trends. So, the Asset managementcompany¶s should come forward to educate individualsabout the benefits of mutual funds.
8/7/2019 A Study on Different Schemes With Comparison &
http://slidepdf.com/reader/full/a-study-on-different-schemes-with-comparison- 17/17
� Mutual Funds are the ideal investment vehicle for today¶s complex and modern financial scenario.
� The public sector mutual fund company¶s performanceis better than the private sector mutual fund companiesin case of Equity Linked Savings Scheme.
� The public sector mutual fund Companies outperformsthe private sector mutual fund companies of two ratiosviz., Sharpe Ratio and Treynor Ratio in case BalancedScheme.
� We can arrive at the conclusion that indeed existingfunds have surpassed newer ones by a mile and wewould be much better off sticking to existing funds withexcellent track records than running after fancy terms,
names & themes.