A Study on Consumer Buying Behaviour
87
A STUDY ON CONSUMER BUYING BEHAVIOUR IN TIKONA DIGITAL NETWORKS (P) LTD Submitted by SATHYANANTHAM.U Reg No - 40909631047 of KARPAGA VINAYAGA COLLEGE OF ENGINEERING & TECHNOLOGY MADHURANTHAGAM (T.k) - 603308 A PROJECT REPORT Submitted to the FACULTY OF MANAGEMENT STUDIES In partial fulfillment for the award of the degree Of MASTER OF BUSINESS ADMINISTRATION IN MARKETING MANAGEMENT ANNA UNIVERSITY:: CHENNAI 600 025 JUNE 2011
-
Upload
shahulsuccess -
Category
Documents
-
view
633 -
download
2
Transcript of A Study on Consumer Buying Behaviour
A STUDY ON CONSUMER BUYING BEHAVIOUR IN TIKONA DIGITAL
NETWORKS (P) LTD
Submitted by
SATHYANANTHAM.U
Reg No - 40909631047
of
KARPAGA VINAYAGA COLLEGE OF ENGINEERING & TECHNOLOGY
MADHURANTHAGAM (T.k) - 603308
A PROJECT REPORT
Submitted to the
FACULTY OF MANAGEMENT STUDIES
In partial fulfillment for the award of the degree
Of
MASTER OF BUSINESS ADMINISTRATION
IN
MARKETING MANAGEMENT
ANNA UNIVERSITY:: CHENNAI 600 025
JUNE 2011
ANNA UNIVERSITY: CHENNAI 600 025
BONAFIDE CERTIFICATE
Certified that this project report “A STUDY ON CONSUMER BUYING
BEHAVIOUR IN TIKONA DIGITAL NETWORKS (P) LTD”is the bonafide
work of “MR.SATHYANANTHAM.U” who carried out the project work under
my supervision. Certified further, that to the best of my knowledge the work
reported herein does not form part of any other project report or dissertation on the
basis of which a degree or award was conferred on an earlier occasion on this or
any other candidate.
SIGNATURE SIGNATURE
HEAD OF THE DEPARTMENT SUPERVISOR
Karpaga Vinayaga College of Engineering & Technology G.S.T.Road, Karpaga Vinayaga Nagar,Chinnakolambakkam,Palayanoor Post,Madhuranthagam (T.K),Kancheepuram District – 603308.
Karpaga Vinayaga College of Engineering & Technology G.S.T.Road, Karpaga Vinayaga Nagar,Chinnakolambakkam,Palayanoor Post,Madhuranthagam (T.K),Kancheepuram District – 603308.
INTERNAL EXAMINER EXTERNAL EXAMINER
Submitted to the university viva – voce held on ________________________
DECLARATION
I, SATHYANANTHAM.U, hereby declare that this project entitled “A
STUDY ON CONSUMER BUYING BEHAVIOUR IN TIKONA DIGITAL
NETWORKS (P) LTD” has been prepared under the guidance of
MS.R.G.NITHYA, faculty, Department of Management Studies Karpaga
vinayaga College of Engineering & Technology- Maduranthagam, in partial
fulfillment of the requirements of the MBA program of Anna University for
JUNE 2011.
Place:
Date:
SATHYANANTHAM.U

ABSTRACT
The project for TIKONA DIGITAL NETWORKS (P) LTD is aimed for
successful functioning of the organization. The researcher collected the primary
information required for the study through a structured questionnaire. Website
and books are the main part of secondary data.
The nature of the study was descriptive. The sampling method used is
convenience Sampling. The sampling size was 100 Respondents. This includes
only consumers. The researcher while analyzing converted data made use of
simple tabulations, percentage, correlation, chi-square test.
The need of the study is to study the CONSUMER BUYING BEHAVIOUR
for successful functioning of TIKONA DIGITAL NETWORKS (P) LTD.
Finally, the last two chapter deal with the finding from the survey and the
suggestion to the company is given followed by the conclusion.
ACKNOWLEDGEMENT
With profound gratitude and due regards I whole heartedly and sincerely
acknowledge with thanks the opportunity provided to me by our Respectful
Director Tmt. Meenakshi Annamalai for allowing me to do this project in
partial fulfillment for the degree of Master of Business Administration under
Anna University, Chennai.
I thank our respectable Advisor Prof. V.C. Ravichandran for his
effective advice and support for planning and processing of the project.
I thank our dedicated Principal Dr. V. Ilangovan for his valuable
suggestions and timely advice which helped me in completing this project on
schedule.
I thank our Dean (Administration) Prof. T. Rangarajalu for his
unrelenting support and guidance and useful tips for completing the project.
I thank our Dean (MBA) Prof. J. Nirmal Joseph for his remorseless
support and guidance and useful tips for completing the project.
I thank our Head of the Department Prof. Dr. V. Vaidyanathan for his
pain taking efforts and very encouraging and proper guidance without which this
project could not have been completed.
I would like to extend my hearty gratitude to My Guide, Lecturer,
Ms.R.G.Nithya for instructing, guiding and encouraging me carrying out this
project work.
I highly intended to my parents and all my dear ones without whose
constant love and encouragement all these would not have been possible.
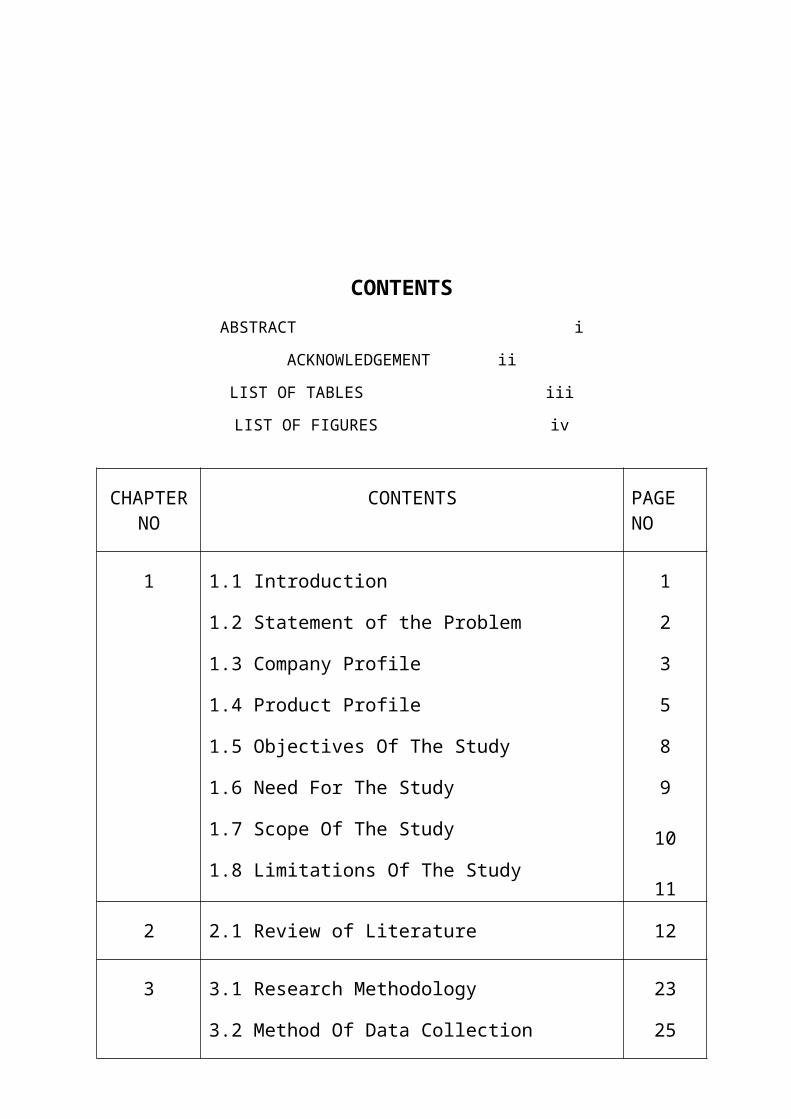
CONTENTS
ABSTRACT i
ACKNOWLEDGEMENT ii
LIST OF TABLES iii
LIST OF FIGURES iv
CHAPTER NO
CONTENTS PAGE NO
1 1.1 Introduction
1.2 Statement of the Problem
1.3 Company Profile
1.4 Product Profile
1.5 Objectives Of The Study
1.6 Need For The Study
1.7 Scope Of The Study
1.8 Limitations Of The Study
1
2
3
5
8
9
10
11
2 2.1 Review of Literature 12
3 3.1 Research Methodology
3.2 Method Of Data Collection
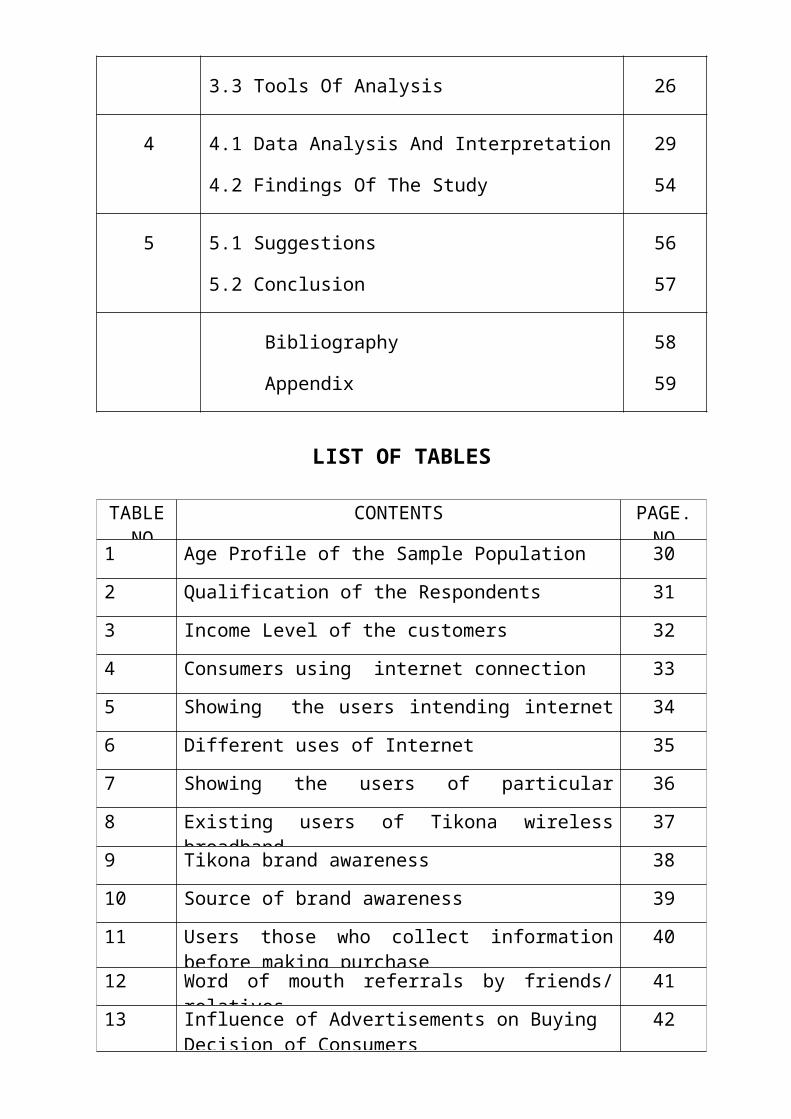
3.3 Tools Of Analysis
23
25
26
4 4.1 Data Analysis And Interpretation
4.2 Findings Of The Study
29
54
5 5.1 Suggestions
5.2 Conclusion
56
57
Bibliography
Appendix
58
59
LIST OF TABLES
TABLE.
CONTENTS PAGE.NO
1 Age Profile of the Sample Population 30
2 Qualification of the Respondents 31
3 Income Level of the customers 32
4 Consumers using internet connection 33
5 Showing the users intending internet connection 34
6 Different uses of Internet 35
7 Showing the users of particular company 36
8 Existing users of Tikona wireless broadband 37
9 Tikona brand awareness 38
10 Source of brand awareness 39
11 Users those who collect information before making purchase
40
12 Word of mouth referrals by friends/ relatives 41
13 Influence of Advertisements on Buying Decision of Consumers
42
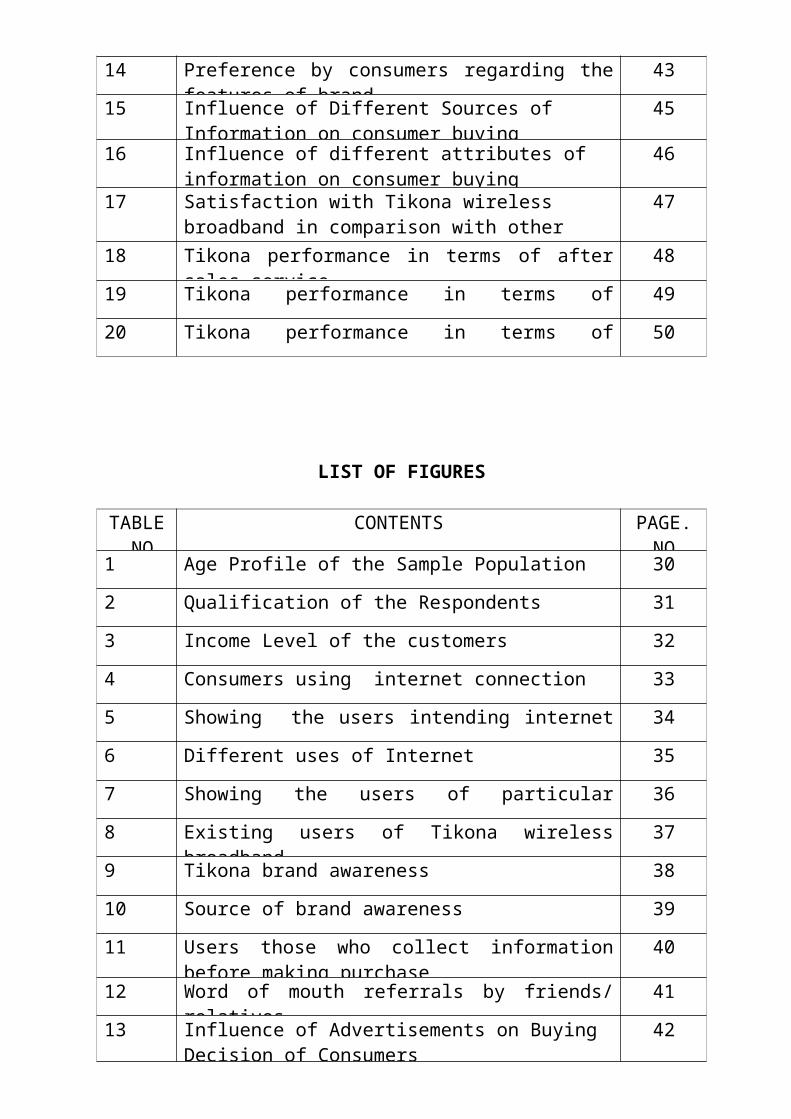
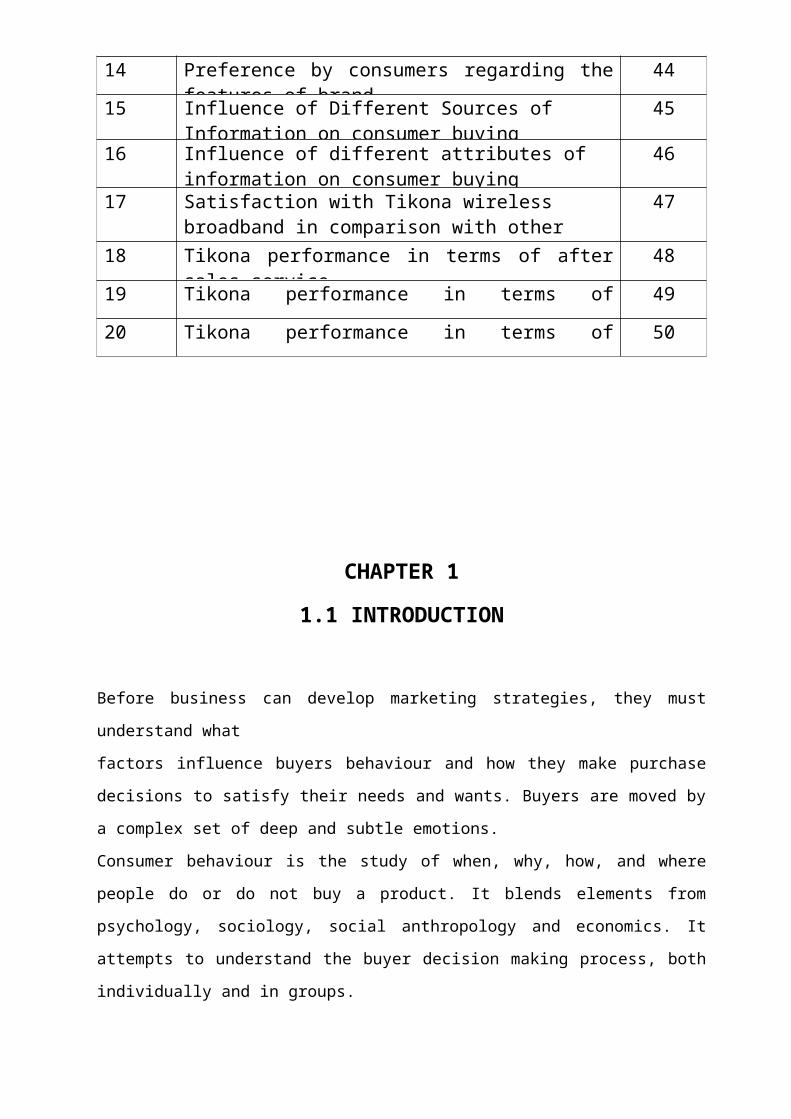
14 Preference by consumers regarding the features of brand 43
15 Influence of Different Sources of Information on consumer buying decision
45
16 Influence of different attributes of information on consumer buying decision
46
17 Satisfaction with Tikona wireless broadband in comparison with other brands
47
18 Tikona performance in terms of after sales service 48
19 Tikona performance in terms of maintenance 49
20 Tikona performance in terms of consumer expectation 50
LIST OF FIGURES
TABLE.
CONTENTS PAGE.NO
1 Age Profile of the Sample Population 30
2 Qualification of the Respondents 31
3 Income Level of the customers 32
4 Consumers using internet connection 33
5 Showing the users intending internet connection 34
6 Different uses of Internet 35
7 Showing the users of particular company 36
8 Existing users of Tikona wireless broadband 37
9 Tikona brand awareness 38
10 Source of brand awareness 39
11 Users those who collect information before making purchase
40
12 Word of mouth referrals by friends/ relatives 41
13 Influence of Advertisements on Buying Decision of Consumers
42
14 Preference by consumers regarding the features of brand 44
15 Influence of Different Sources of Information on consumer buying decision
45
16 Influence of different attributes of information on consumer buying decision
46
17 Satisfaction with Tikona wireless broadband in comparison with other brands
47
18 Tikona performance in terms of after sales service 48
19 Tikona performance in terms of maintenance 49
20 Tikona performance in terms of consumer expectation 50
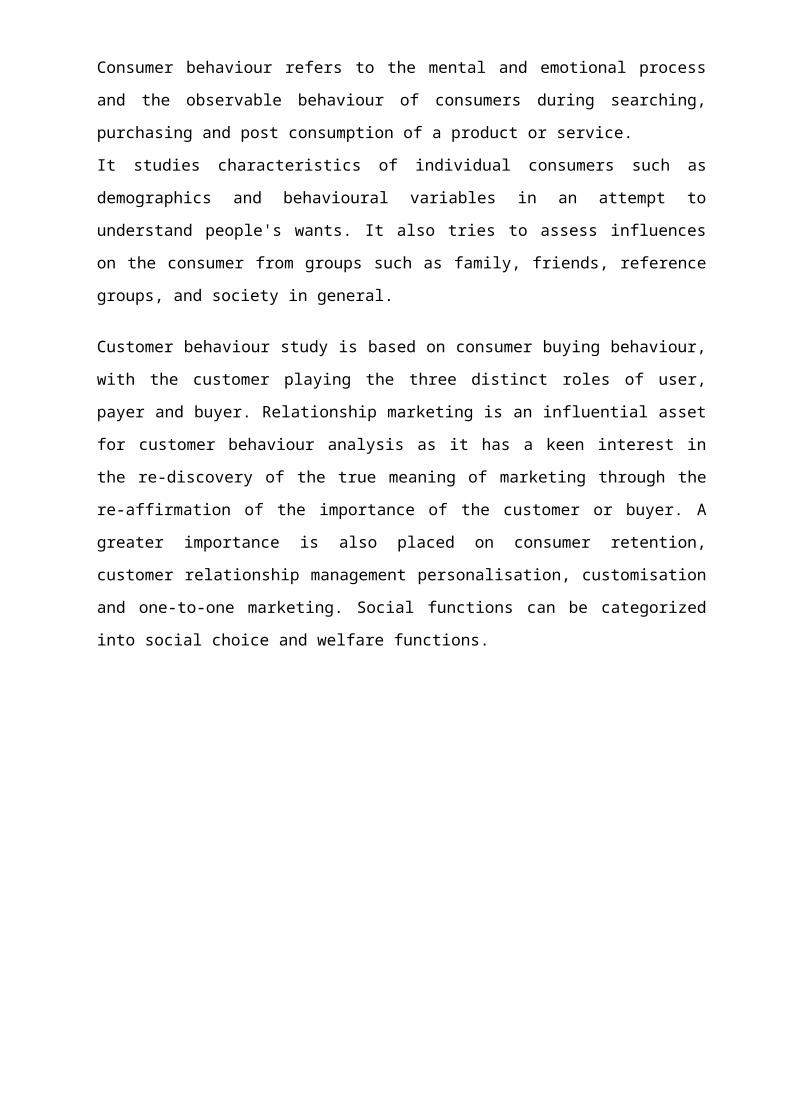
CHAPTER 1
1.1 INTRODUCTION
Before business can develop marketing strategies, they must understand what
factors influence buyers behaviour and how they make purchase decisions to satisfy their needs
and wants. Buyers are moved by a complex set of deep and subtle emotions.
Consumer behaviour is the study of when, why, how, and where people do or do not buy a
product. It blends elements from psychology, sociology, social anthropology and economics. It
attempts to understand the buyer decision making process, both individually and in groups.
Consumer behaviour refers to the mental and emotional process and the observable behaviour
of consumers during searching, purchasing and post consumption of a product or service.
It studies characteristics of individual consumers such as demographics and behavioural
variables in an attempt to understand people's wants. It also tries to assess influences on the
consumer from groups such as family, friends, reference groups, and society in general.
Customer behaviour study is based on consumer buying behaviour, with the customer playing
the three distinct roles of user, payer and buyer. Relationship marketing is an influential asset
for customer behaviour analysis as it has a keen interest in the re-discovery of the true meaning
of marketing through the re-affirmation of the importance of the customer or buyer. A greater
importance is also placed on consumer retention, customer relationship management
personalisation, customisation and one-to-one marketing. Social functions can be categorized
into social choice and welfare functions.
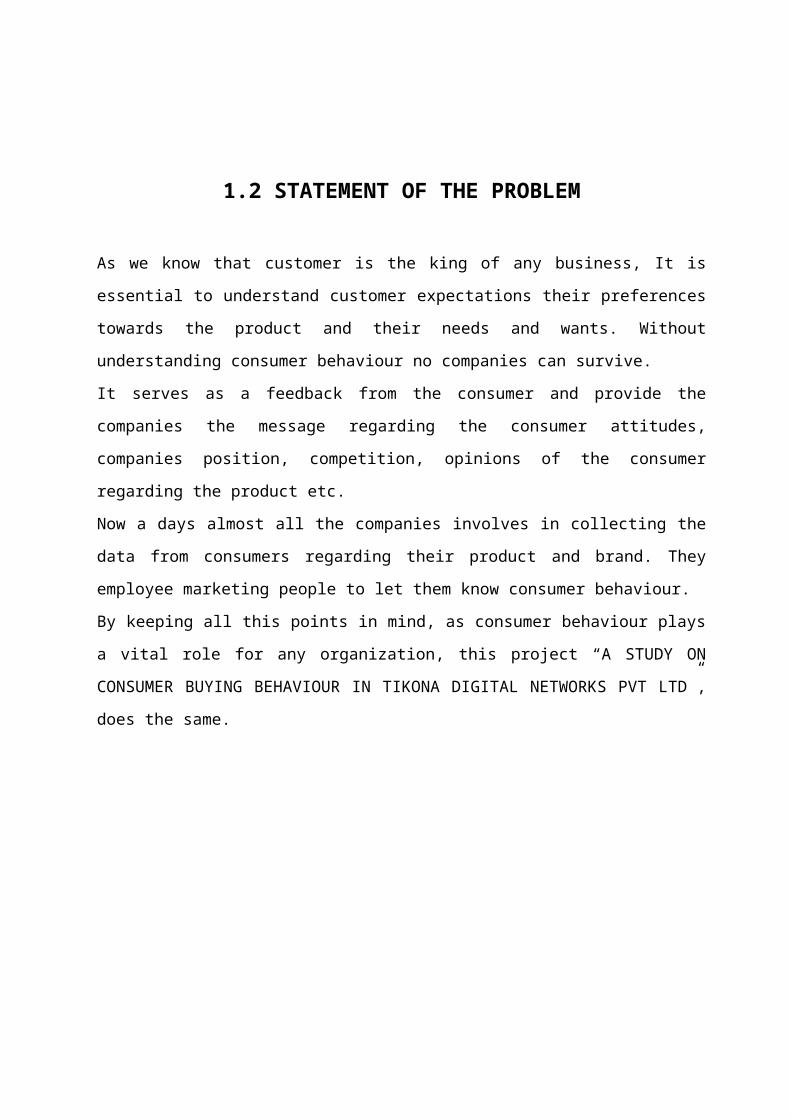
1.2 STATEMENT OF THE PROBLEM
As we know that customer is the king of any business, It is essential to understand customer
expectations their preferences towards the product and their needs and wants. Without
understanding consumer behaviour no companies can survive.
It serves as a feedback from the consumer and provide the companies the message regarding
the consumer attitudes, companies position, competition, opinions of the consumer regarding
the product etc.
Now a days almost all the companies involves in collecting the data from consumers regarding
their product and brand. They employee marketing people to let them know consumer
behaviour.
By keeping all this points in mind, as consumer behaviour plays a vital role for any
organization, this project “A STUDY ON CONSUMER BUYING BEHAVIOUR IN TIKONA
DIGITAL NETWORKS PVT LTD”, does the same.
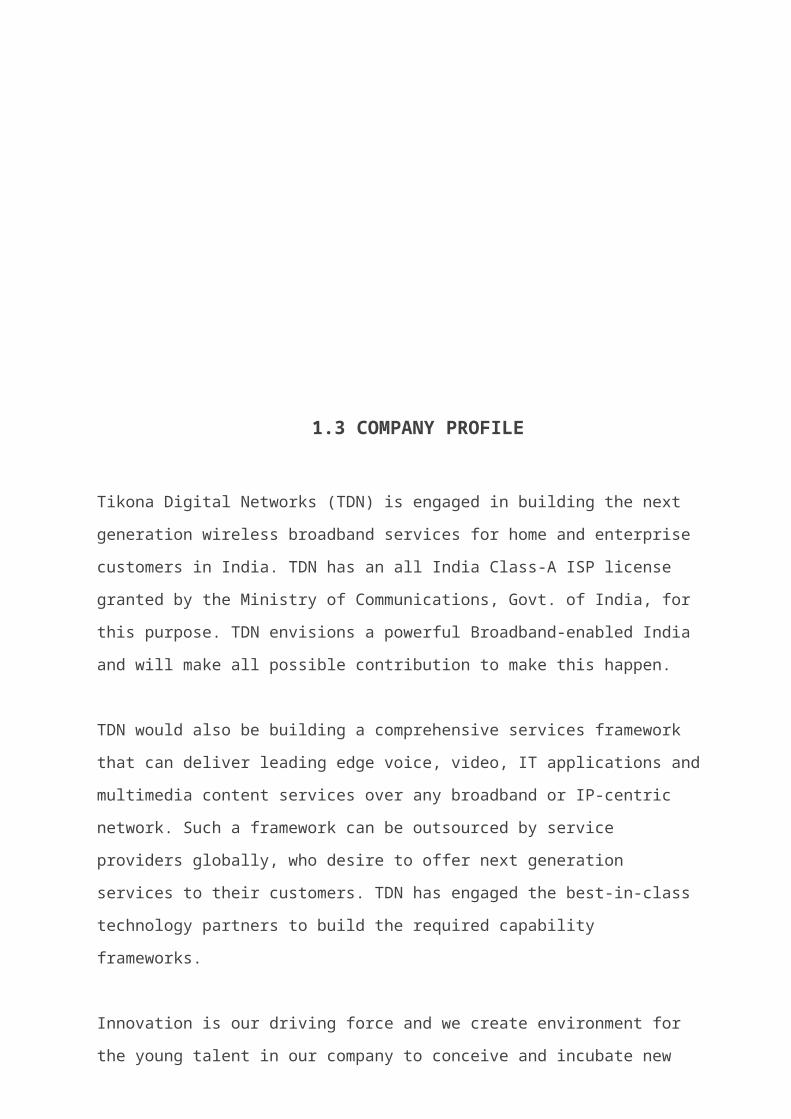
1.3 COMPANY PROFILE
Tikona Digital Networks (TDN) is engaged in building the next generation wireless broadband
services for home and enterprise customers in India. TDN has an all India Class-A ISP license
granted by the Ministry of Communications, Govt. of India, for this purpose. TDN envisions a
powerful Broadband-enabled India and will make all possible contribution to make this
happen.
TDN would also be building a comprehensive services framework that can deliver leading
edge voice, video, IT applications and multimedia content services over any broadband or IP-
centric network. Such a framework can be outsourced by service providers globally, who
desire to offer next generation services to their customers. TDN has engaged the best-in-class
technology partners to build the required capability frameworks.
Innovation is our driving force and we create environment for the young talent in our company
to conceive and incubate new ideas in order to develop and deliver useful services and
solutions for our customers, thereby sustaining our competitive advantages.
TDN was founded in mid 2008 by veterans from the telecom industry, who have built some of
the largest networks in India for mobile, enterprise, broadband and DTH services. TDN is
adequately funded by top-end global investors and is committed to comply with the highest
standards of corporate governance.
Prakash Bajpai
Founder,MD&CEO
Prakash Bajpai has a rich 31 years of experience in IT and Telecom Industry. He has been
instrumental in building and leading organizations and business with revenueof more than
$2billion.
An engineering graduate from Delhi University, Prakash started his career with IBM as an
electronics engineer. He then moved to Phillips, where he was involved in the launch of color
TV transmission in India. He was one of the first few employees of Tata Telecom. His
experience cuts across geographies as he worked with AT&T Network Systems in the US. Post
returning to India, he spearheaded the Marketing, Sales & Network Planning activities at Tata
Lucent Technologies. He then joined Hughes Telecom as President & CEO where he
pioneered India's first Integrated Broadband Network in Maharashtra & Goa. He also led
Hughes Telecom to launch India's first IPO (US$ 225 m) in the telecom sector. Prior to
launching Tikona, Prakash was the President and CEO at Reliance Communications, where he
was responsible for the Broadband, Enterprise, Data Center, PCO and DTH businesses of the
company.
Prakash has also attained graduation from a number of in-house Management Programs
conducted by the AT&T School of Business Management including mini-MBA in Financial
Management
Tarun Kumar
Chief Technology Officer
Tarun has over 19 years of industry experience spanning in IT, broadband and digital broadcast
technologies. He has successfully deployed and managed operations of many technology
intensive projects including enterprise and retail broadband BSS, cutting edge Interactive IPTV
over metro Ethernet network, service delivery platforms for New-age products and broadband
radio access networks.
Tarun is an electronics and communication engineer with M Tech (Integrated Electronics)
from Indian Institute of Technology (1990 batch).
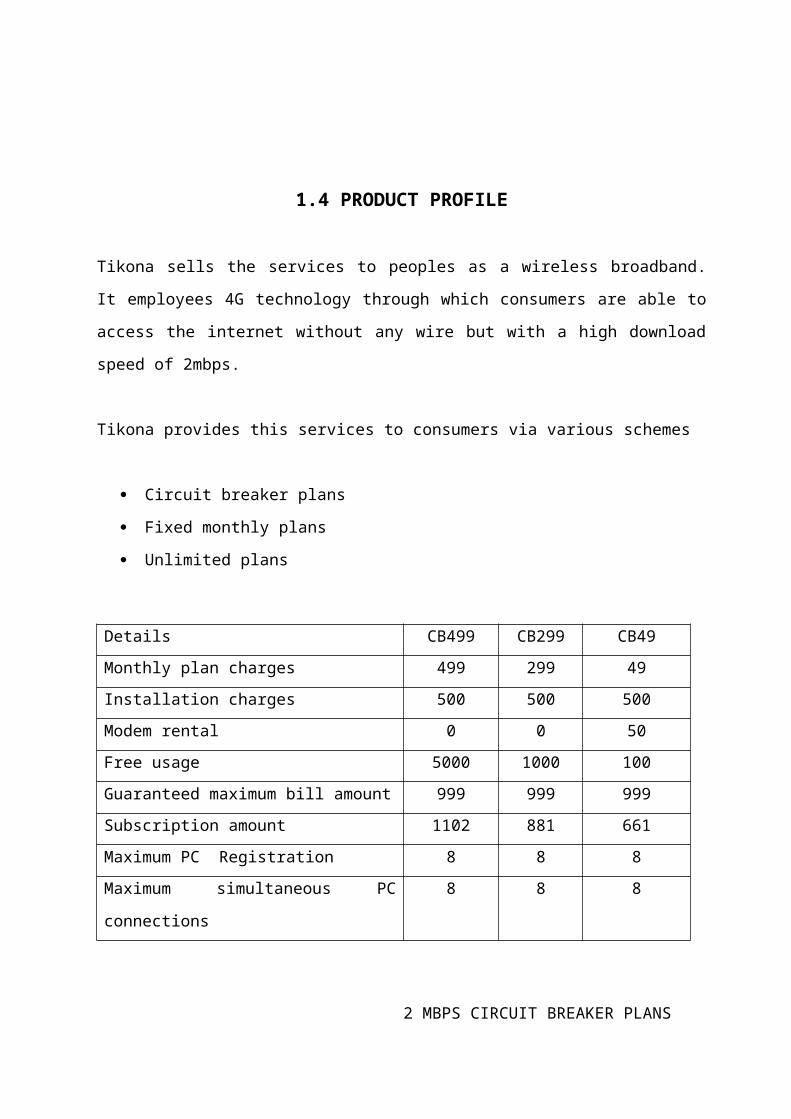
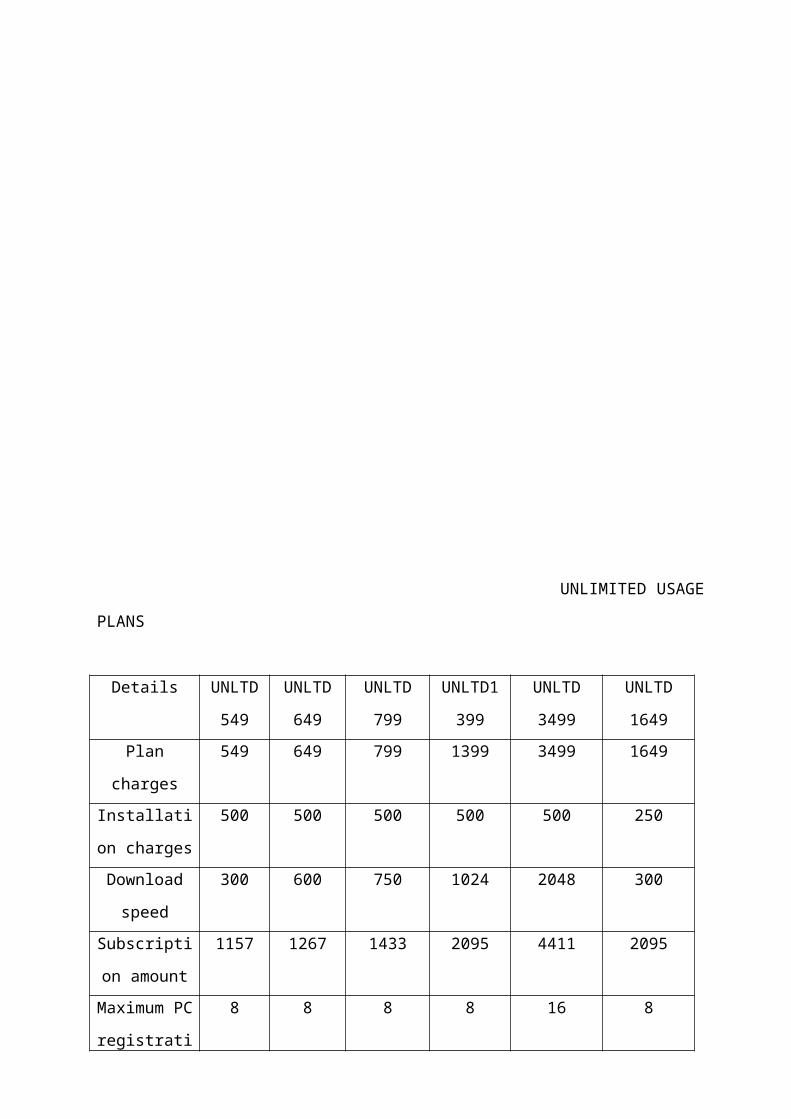
1.4 PRODUCT PROFILE
Tikona sells the services to peoples as a wireless broadband. It employees 4G technology
through which consumers are able to access the internet without any wire but with a high
download speed of 2mbps.
Tikona provides this services to consumers via various schemes
Circuit breaker plans
Fixed monthly plans
Unlimited plans
Details CB499 CB299 CB49
Monthly plan charges 499 299 49
Installation charges 500 500 500
Modem rental 0 0 50
Free usage 5000 1000 100
Guaranteed maximum bill amount 999 999 999
Subscription amount 1102 881 661
Maximum PC Registration 8 8 8
Maximum simultaneous PC connections 8 8 8
2 MBPS CIRCUIT BREAKER PLANS
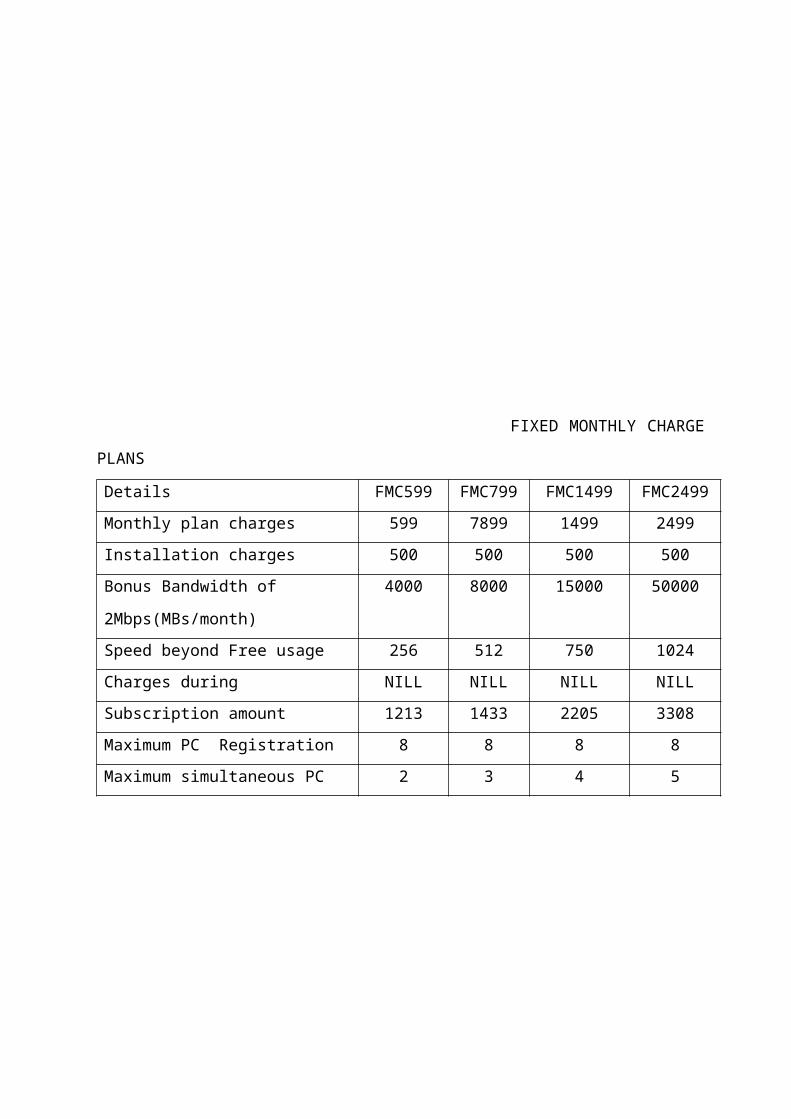
FIXED MONTHLY CHARGE PLANS
Details FMC599 FMC799 FMC1499 FMC2499
Monthly plan charges 599 7899 1499 2499
Installation charges 500 500 500 500
Bonus Bandwidth of
2Mbps(MBs/month)
4000 8000 15000 50000
Speed beyond Free usage 256 512 750 1024
Charges during NILL NILL NILL NILL
Subscription amount 1213 1433 2205 3308
Maximum PC Registration 8 8 8 8
Maximum simultaneous PC 2 3 4 5
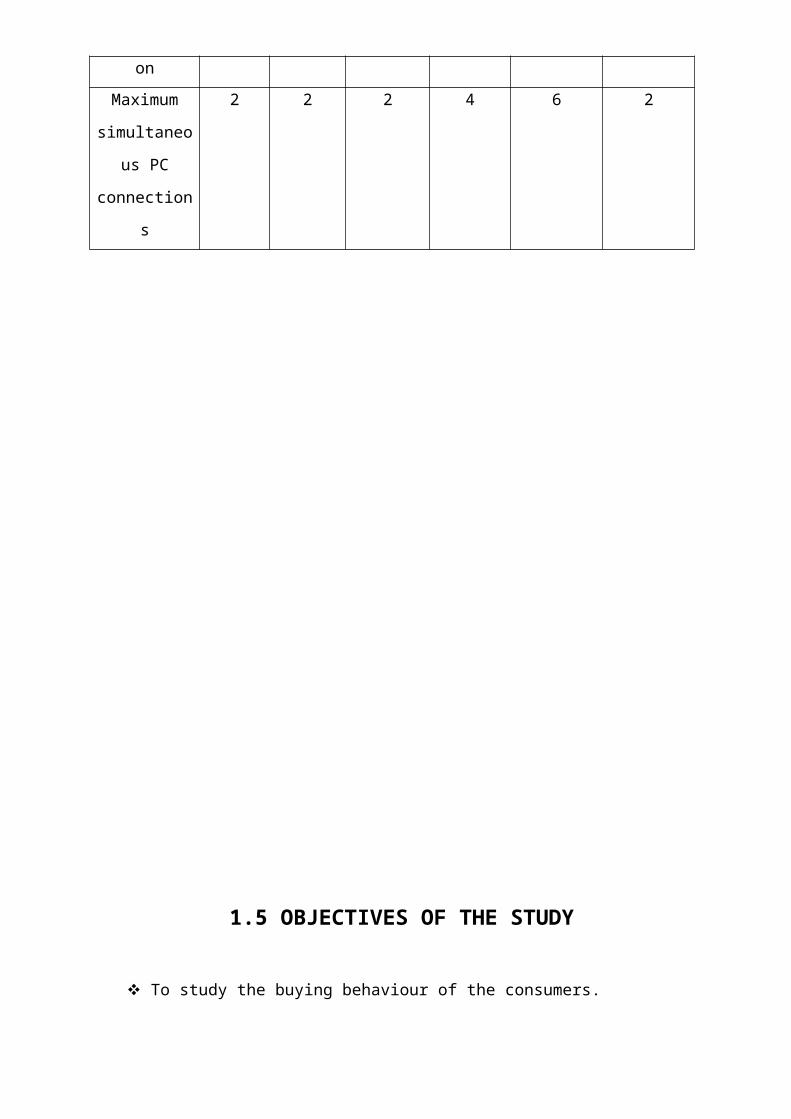
UNLIMITED USAGE PLANS
Details UNLTD
549
UNLTD
649
UNLTD
799
UNLTD1
399
UNLTD
3499
UNLTD
1649
Plan charges 549 649 799 1399 3499 1649
Installation
charges
500 500 500 500 500 250
Download
speed
300 600 750 1024 2048 300
Subscription
amount
1157 1267 1433 2095 4411 2095
Maximum PC
registration
8 8 8 8 16 8
Maximum
simultaneous
PC
connections
2 2 2 4 6 2
1.5 OBJECTIVES OF THE STUDY
To study the buying behaviour of the consumers.
To understand how these factors influence consumers buying decision.
To understand the consumers perception towards the brand.
To know how the Company has been encountering the aggressive marketing strategies
of competitors.
To determine whether there is any deviation between the features of the brand and the
acceptance of the consumers.
To find out what marketing strategies should be undertaken to increase the market
share of the brand.
1.6. NEED FOR THE STUDY
Before business can develop marketing strategies, they must understand what factors in-
fluence buyers behaviour and how they make purchase decision to satisfy their needs
and wants.
This study aims towards collecting information about consumers Psychology towards
wireless internet connection and thus helping Tikona in understanding customers nature
and help in developing strategies which will thus help them in increasing their business.
This study helpful to know in which stage the brand would be in industrial
life cycle.
This study is also helpful to know in which feature the brand excels and where they are
lacking in.
It is done to understand what consumers consider while going for purchasing a wireless
internet broadband connection.
Suggestion regarding the brand are drawn using this study.
By this study we came to know how the organization retaining and sustaining its cus-
tomer.
1.7. SCOPE OF THE STUDY
The main purpose of this project is to study consumers buying
behaviour and develop strategies which help Tikona in increasing their market share.
This study is mainly focused on various factors that affect consumers buying decision.
Such as social, psychological and personal.
The survey was conducted among different groups and all possible local areas in Chen-
nai were considered for the study. The sample size was of 100 people who included
people from various age groups and different income levels. The data was collected
through filling of questionnaire and interview.
The survey helped in understanding the various factors that influenced the buying deci-
sions of the customers and understanding their needs when it comes to wireless broad-
band internet connection.
This study helps to understand the satisfactory level of consumers towards the brand.
This study helps in understanding the consumer attitudes and their buying motives by
means of company brand image.
1.8. LIMITATIONS OF THE STUDY
This study is restricted to marketing area.
Time is the major limitation of this study .
This study is performed only for a period of 90 days.
Convenience sampling is used in this study.
Less number of consumer’s are taken as sample in this study i.e. 100 Respondents.
Information collected is ineffective for consideration becasuse due to less number of
samples.
CHAPTER 2
2. REVIEW OF LITERATURE
LITERARY REVIEW:
Psychologists have long been interested in the topics of buying and shopping
behaviour. Some major perspectives in psychology such as behaviourism and cognitivism have
formulated different theories to explain buying motivation and behaviour. The behaviourists
stress the process of operant conditioning and individual’s history of reinforcement, while the
cognitive approach puts its accent on individual’s free will and intentional, voluntary action.
The views of these two perspectives can be examined in terms of the nature of buying
behaviour and the process of choice.
With regard to the nature of buying behaviour, the behaviourists consider it as a
response to a reinforcer. One of the famous behaviourist, Alhadeff (1982) represents buying
behaviour as the outcome of the relative strengths of conflicting approach and escape
behaviours, each of which is determined by its own reinforcers. Etc. On the other hand, the
cognitive perspective views buying behaviour as more voluntary, rational and intentional in
nature rather than mere response to the environment. People buy what they want to buy and
their reasons for buying embrace "whatever consideration induced, inclined, weighed with or
decided them to buy" (Beck, 1975). Etc.
Based on their different conception about the nature of buying behaviour, the behaviourist
and the cognitive theorists have different views on the process of choice when buying. The
behaviourists propose that consumer choice begins with an external stimulus such as an
advertising message or word-of-mouth communication. Etc. However, the cognitive
psychologists adopt a different approach to explain the process of choice. They consider the
choice of buying as a rule-following behaviour Etc.
To the behaviourists, therefore, choice of buying is simply a behaviour, the only way of
acting in a given set of circumstances defined in terms of controlling contingencies. On the
other hand, the cognitive theorists present choice of buying as an outcome of internal, mental
deliberation and psychological decision. Actually, although the behaviourists and the cognitive
theorists have different ideas of the content of choice, they do share similar view on the
unconscious feature of choice (rather involuntary response to discriminative stimulus and the
following of rules).
THEORITICAL REVIEW:
Consumer is the king and it is the consumer who determines what a business is. Therefore, a
sound marketing program should start with a careful analysis of the habits, attitudes, motives
and needs of consumers.
Consumer behaviour is prerequisite though the process is highly complicated. At the
same time, a firm’s ability to establish and maintain satisfying exchange relationships depends
on the level of understanding of buying behaviour. Thus, buying behaviour is the decision
process and acts of people involved in buying and using products.
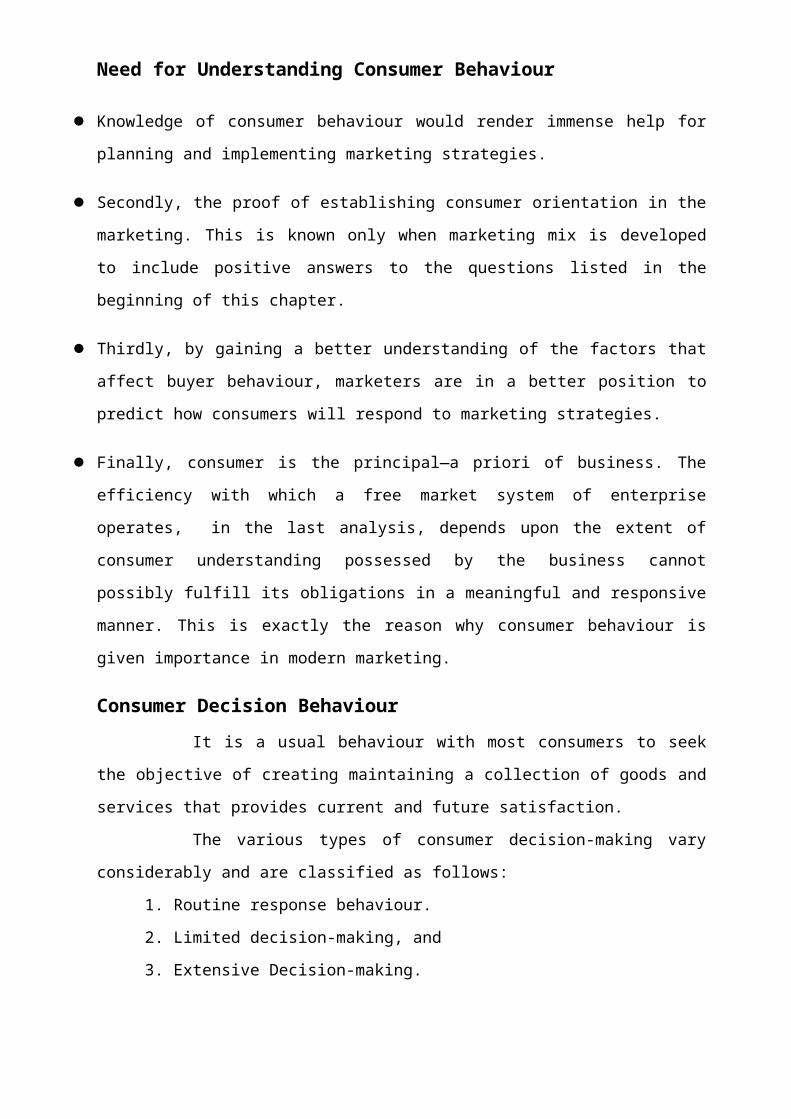
Need for Understanding Consumer Behaviour
Knowledge of consumer behaviour would render immense help for planning and implementing
marketing strategies.
Secondly, the proof of establishing consumer orientation in the marketing. This is known only
when marketing mix is developed to include positive answers to the questions listed in the be-
ginning of this chapter.
Thirdly, by gaining a better understanding of the factors that affect buyer behaviour, marketers
are in a better position to predict how consumers will respond to marketing strategies.
Finally, consumer is the principal—a priori of business. The efficiency with which a free mar-
ket system of enterprise operates, in the last analysis, depends upon the extent of consumer
understanding possessed by the business cannot possibly fulfill its obligations in a meaningful
and responsive manner. This is exactly the reason why consumer behaviour is given impor-
tance in modern marketing.
Consumer Decision Behaviour
It is a usual behaviour with most consumers to seek the objective of creating
maintaining a collection of goods and services that provides current and future satisfaction.
The various types of consumer decision-making vary considerably and are
classified as follows:
1. Routine response behaviour.
2. Limited decision-making, and
3. Extensive Decision-making.
1. Routine decision behaviour - is usually found in the cases of frequently purchased and
low-cost items. Lengthy search for products is not attempted and hence the decision effort
needed is only minimum. Though consumers are branding conscious. They are also aware of
alternative brands, for instance, if you intended to buy a particular would switch over to a
second preferred brand of their choice. Thus, products that are bought through routine response
behaviour are purchased quickly with very little mental effort.
2. Limited decision-making - is pertinent in the case of purchases made by the consumers less
frequently. The investment needed also will be comparably high. Hence, the consumers may
acquire information about all possible brands and some amount of mental exercises would
follow to arrive at a decision about all possible brands and some of a television set makes the
consumer to examine various models and brands, make casual enquiries with the neighbor-
owners and discuss with family members is also considered at length. Thus, limited decision-
making requires a moderate amount of time for information gathering and deliberation.
3. Extensive decision-making _is required when a consumer wants to purchase unfamiliar
products which is totally new, having high unit value and bought preferably once in his life
time. Before such a product is bought, the consumer uses many criteria for evaluating
alternative brands and substitute products and spends much time in seeking information and
deciding on the purchase. Decisions on construction complex type of consumer decision-
making behaviour. An interesting but a notable point in this connection is that the type of
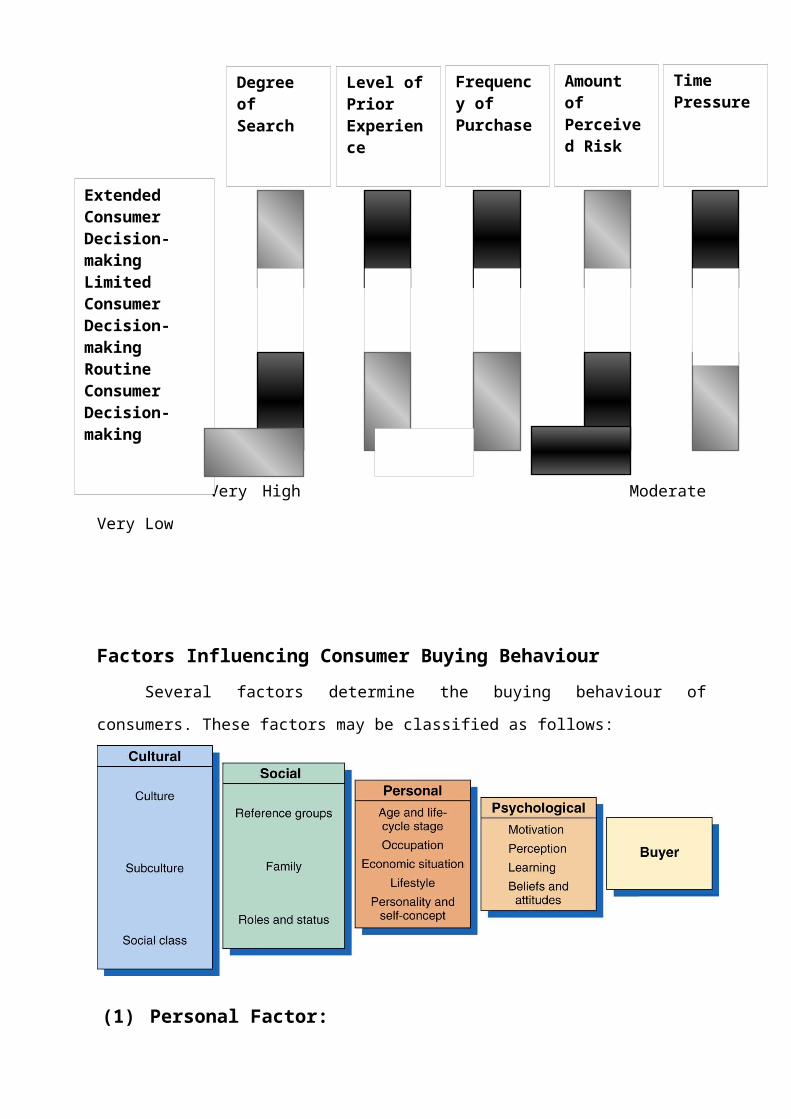
decision-making need not necessarily remain constant. The following illustrates the variations
more clearly.
Very High Moderate Very Low
Factors Influencing Consumer Buying Behaviour
Several factors determine the buying behaviour of consumers. These factors may be
classified as follows:
Extended Consumer Decision-makingLimited Consumer Decision-makingRoutine Consumer Decision-making
Level of Prior Experience
Frequency of Purchase
Amount of Perceived Risk
Time Pressure
Degree of Search
(1) Personal Factor:
These include factors unique to a particular person. Numerous personal factors
influence purchase decisions:
(a) Demographics
Individual characteristics such as age, sex, race, ethnicity, income, occupation and
family life cycle are called demographics. These have a bearing on who is involved in family
decision-making.
(b) Life styles
Life style means an individual’s pattern of living expressed through activities, interests
and opinions. Life style patterns include the ways people spend-time, the extent of their
interaction with others, and their general outlook on life and living, people partly determine
their own life styles and partly these are shaped by personality and demographics.
(c) Situation. Situational factors are influences resulting from circumstances, time and
location that affect the consumer buying behaviour.
(2) Social factors: The factors that other people exert on buying behaviour are called
social factors. These factors are as follows
(a) Roles and Family Role means the activities that a person is supposed to perform. A
person occupies several positions and, therefore, he/she has many roles.
(b) Reference Group A reference group is any group that exercises a positive are
three major types of reference groups—membership, aspiration and dissociative. A reference
group may serve as an individual, point of comparison and source of information.
(c) Opinion leader
The reference group members who provides information about a specific share
that interests members of the group is called opinion leader. An opinion leader is likely to be
most influential when consumers have high product involvement buy low product knowledge,
when they share the attitudes and values of the opinion leader and when the product details are
numerous and complicated.
(d) Social Class
A social class means an open group of individuals with similar social rank.
Quite often people in a society are classified into upper, middle and lower classes on the basis
of their income and occupation. Consumers belonging to a particular social class tend to have
common behavioural patterns. They may have similar attitudes and values. Social class has an
impact on spending and saving an individual buys and uses.
(e) Culture and Sub-cultures
Culture is the aggregate of customs, beliefs, values, and objects that a society
uses to cope with its environment and passes on to future generations. Culture permeates our
daily life and therefore influences buying behaviour. Our culture determines what we want and
wear, where we reside and travel. It also influences how we buy and use products. Cultural
changes affect marketing mix.
(3) Psychological factors:
Factors that operate within individuals and determine their general behaviour
are as follows:
(a) Perception
Perception is the process of selecting, organizing and interpreting information to
derive meaning. Different people perceive the same thing at the same time in different ways.
(b) Motives
A motive means an internal force that orients a person’s activities towards need
satisfaction. A set of motives affects a buyer’s actions. Motives that influence where a person
buys products on a regular basis are known as patronage motives. These include location,
price, variety, service and behaviour of sale people. Marketers use depth interviews, projection
and other methods to know and understand the motives of buyers
(c) Learning
Changes in an individual’s behaviour due to information and experience are
called learning. A consumer tends to repeat purchase actions which create satisfaction.
Inexperienced buyers use price as an indicator of quality more advertisements, salespersons,
friends and relatives. They also learn by buying and using products.
(d) Attitudes
Attitude refers to an individual’s enduring evaluation, feelings and behavioural
tendencies toward an object or idea. An individual’s attitudes remain generally stable and do
not vary from moment to moment. Attitudes play a significant role in determining consumer
behaviour.
(e) Personality
Personality refers to a set of internal traits and distinct behavioural tendencies
that result in consistent patterns of behaviour. An individual’s personality is the outcome of
heredity and personal experiences. It makes the individual unique. Some individuals are
introverts, dogmatic, compulsive and ambitious while others are quite opposite in nature.
Personality influences the type of brand and products purchased.
(f) Self-concept
Self-concept of self-image means a person’s perception or view of himself.
Individuals develop and alter their self=concept through interaction of social and
psychological dimensions. Research shows that a buyer purchases products that reflect and
enhance the self-concept. A person’s self-concept may also influence selection of products
category and brand.
Consumer Buying decision Process
The process which consumers proceed while making their buying decisions is known
as the consumer buying decision process. This process consists of five stages a s shown in
following fig.
Arrows connect all the elements in the decision process and show the impact of
demographics, social factors, and psychological factors upon the process.
Arrows show feedback. (a) Shows the impact of social and psychological
factors
(b) Shows the impact of a purchase on social and psychological factors such as
social class.
Roles and Family
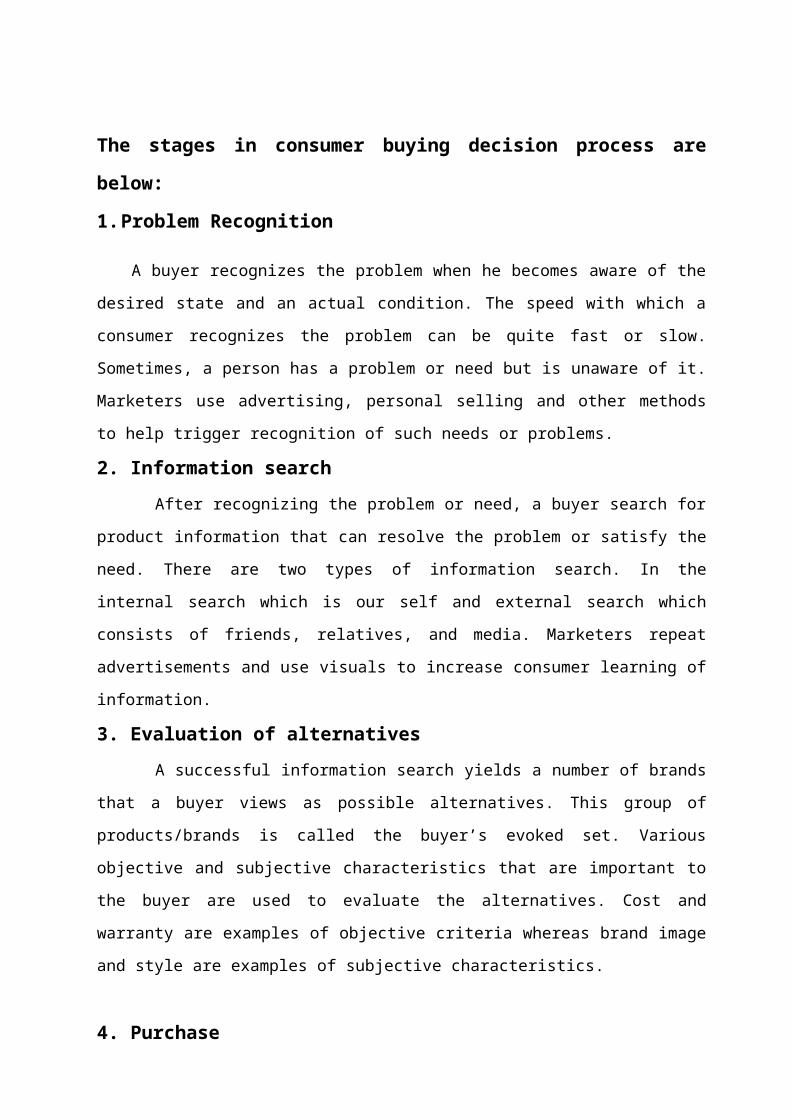
The stages in consumer buying decision process are below:
1. Problem Recognition
Stimulus Problem Awareness
Information Search
Evaluation of
Alternatives
Purchase Decision
Post-purchase
Behaviour
Person Specific Influences
Social & Psychological Influences
A buyer recognizes the problem when he becomes aware of the desired state and an actual
condition. The speed with which a consumer recognizes the problem can be quite fast or slow.
Sometimes, a person has a problem or need but is unaware of it. Marketers use advertising,
personal selling and other methods to help trigger recognition of such needs or problems.
2. Information search
After recognizing the problem or need, a buyer search for product information that can
resolve the problem or satisfy the need. There are two types of information search. In the
internal search which is our self and external search which consists of friends, relatives, and
media. Marketers repeat advertisements and use visuals to increase consumer learning of
information.
3. Evaluation of alternatives
A successful information search yields a number of brands that a buyer views as
possible alternatives. This group of products/brands is called the buyer’s evoked set. Various
objective and subjective characteristics that are important to the buyer are used to evaluate the
alternatives. Cost and warranty are examples of objective criteria whereas brand image and
style are examples of subjective characteristics.
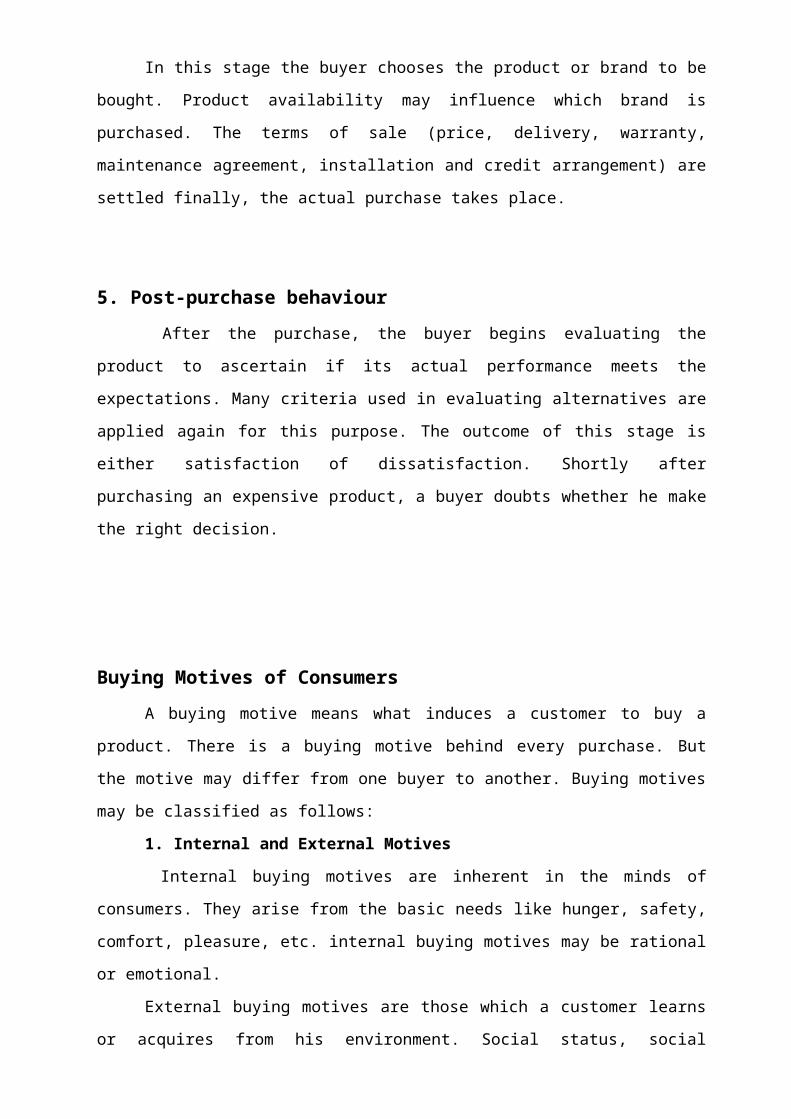
4. Purchase
In this stage the buyer chooses the product or brand to be bought. Product availability
may influence which brand is purchased. The terms of sale (price, delivery, warranty,
maintenance agreement, installation and credit arrangement) are settled finally, the actual
purchase takes place.
5. Post-purchase behaviour
After the purchase, the buyer begins evaluating the product to ascertain if its actual
performance meets the expectations. Many criteria used in evaluating alternatives are applied
again for this purpose. The outcome of this stage is either satisfaction of dissatisfaction.
Shortly after purchasing an expensive product, a buyer doubts whether he make the right
decision.
Buying Motives of Consumers
A buying motive means what induces a customer to buy a product. There is a buying
motive behind every purchase. But the motive may differ from one buyer to another. Buying
motives may be classified as follows:
1. Internal and External Motives
Internal buying motives are inherent in the minds of consumers. They arise from the
basic needs like hunger, safety, comfort, pleasure, etc. internal buying motives may be rational
or emotional.
External buying motives are those which a customer learns or acquires from his
environment. Social status, social acceptance, achievement, etc. are examples of such motives.
Income, education, occupation, religion, culture, family and social environment influence
external motives.
2. Rational and Emotional Motives
Buying motives are those which are based on logical reasoning and
consideration of economic consequences. They include the cost, durability and dependability
of the product/service.
Emotional buying motives are based on personal feelings. These motives
include ego, prestige, love and affection, status, pride, etc.
3. Product and Patronage Motives
Product motives are of two types-primary and secondary. Primary buying
motives are the reasons due to which consumers buy one class of products rather than another.
These motives arise directly from human needs and wants. These include the desire for health,
beauty, knowledge, relaxation, recognition, etc.
Secondary or selective buying motives induce consumers to buy certain kinds of
products. These include desire for convenience, dependability, durability, economy, versatility,
etc.
CHAPTER 3
3.1 RESEARCH METHODOLOGY
The purpose of the research methodology is to describe the research procedure. This includes
the overall design, the sampling procedure, the data collection method analysis procedures.
This section is important because it is hard to discuss methodology without using technical
terms. Yet, most of the reader will not understand the technical language. This study was made
based on primary data. Distributing the questionnaire to the respondents collected the data. The
questionnaire containing questions relating to socio- economic status of the respondents.
RESEARCH DESIGN:
A research design is the specification of methods and procedure for acquiring the
information needed to structure or to solve problem. It is the overall operational pattern of
frame work of the project that stipulates procedures.
A research design is therefore defined as “A plan, structure and strategy of investigation
conceived so as to obtain answers to research question and control vacancies.”
Descriptive Research Design:
Descriptive research is contract to explorative research is marked by the prior
formulation of specific research question. The problem, perhaps as a result of an exploratory
study, before the project is initiated. He should be able to define clearly what he wants to
measures and to setup appropriate and specific means for measuring it. Descriptive research
design includes surveys, fact findings, and enquiries of different kinds.
The main characteristic of this method is that researcher has no control over the variable. He
can only report what has happened or what is happening. Most EX-POST FACTO research
projects are used for descriptive studies in which the researcher seeks to measure such items.
Descriptive research will be applicable to the existing problems.
RESEARCH INSTRUMENT
The research instrument used in this study “structured questionnaire”. Structured
questionnaire are those questionnaire in which there are predetermined question relating to the
aspect for which the researcher collects data. The questions are presented with exactly the
same wording in the same order to all the respondents.
QUESTIONNAIRE DESIGN
The structured questionnaire for appraisal system with the following types of questionnaire
open ended, multiple choice, types of questions.
AREA OF STUDY
The area of study is confined to employees of TIKONA Digital Networks (P) Ltd, Chennai.
SAMPLING METHOD
The sampling method involved is convenient sampling method.
CONVENIENT SAMPLING
Convenient sampling is also known as purposive are deliberate sampling.
This sampling method involves purposive or deliberate selection of particular unit of the
universe for constituting a sample which represents the universe. When population elements
are selected for inclusion in sample based on the case access, it can be called convenience
sampling.
SAMPLE
Sample denotes only a part of the conclusions are drawn on the basis of entire
universe.
SAMPLE SIZE
The sample size is restricted to 100 employees. The sample questionnaire consists of closed
ended quetionnaire.
3.2 DATA COLLECTION METHODS
DATA SOURCES
Data sources can be classified into two types namely.
*Primary data
*Secondary data
PRIMARY DATA
Primary data consists of original information collected for specific
purpose. In this study, primary data has been used. To obtain the primary data a well structured
both open ended and close ended questionnaire was prepared to get the response. The
respondents were given up the questionnaire and made them fill it to get their response.
SECONDARY DATA
Secondary data can be defined as the information already existing some where
having been collected for some other purpose. In this study the secondary information is
obtained from the various books, articles and from the company.
TOOLS FOR DATA COLLECTION
The following tools were used for data collection.
A. Questionnaire
B. Personal interview
3.3 TOOLS OF ANALYSIS
The statistical tools and test used for this study are.
Simple percentage analysis
Chi-square test.
Correlation Analysis
SIMPLE PERCENTAGE ANALYSIS:
Simple percentage analysis is used for analysis of the data that is collected for
research work, simple percentage are often used in data presentation for the simplify, numbers,
through the use of percentages, the data are reduced in standard form with base equal to which
it facilitates the relative comparisons.
Simple percentage method = no. of respondents / total no. of samples * 100.
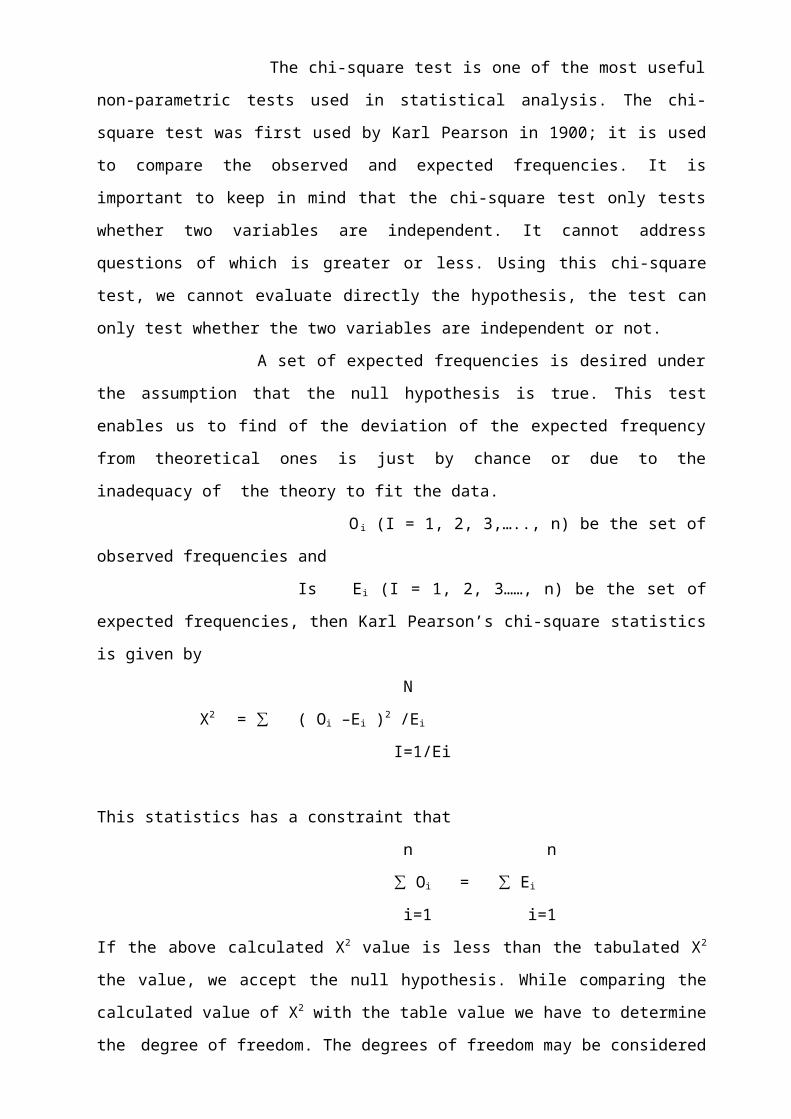
CHI-SQUARE TEST:
The chi-square test is one of the most useful non-parametric tests used in statistical
analysis. The chi-square test was first used by Karl Pearson in 1900; it is used to compare the
observed and expected frequencies. It is important to keep in mind that the chi-square test only
tests whether two variables are independent. It cannot address questions of which is greater or
less. Using this chi-square test, we cannot evaluate directly the hypothesis, the test can only
test whether the two variables are independent or not.
A set of expected frequencies is desired under the assumption that the null hypothesis
is true. This test enables us to find of the deviation of the expected frequency from theoretical
ones is just by chance or due to the inadequacy of the theory to fit the data.
Oi (I = 1, 2, 3,….., n) be the set of observed frequencies and
Is E i (I = 1, 2, 3……, n) be the set of expected frequencies, then Karl Pearson’s
chi-square statistics is given by
N
X2 = ∑ ( Oi –Ei )2 /Ei
I=1/Ei
This statistics has a constraint that
n n
∑ Oi = ∑ Ei
i=1 i=1
If the above calculated X2 value is less than the tabulated X2 the value, we accept the null
hypothesis. While comparing the calculated value of X2 with the table value we have to
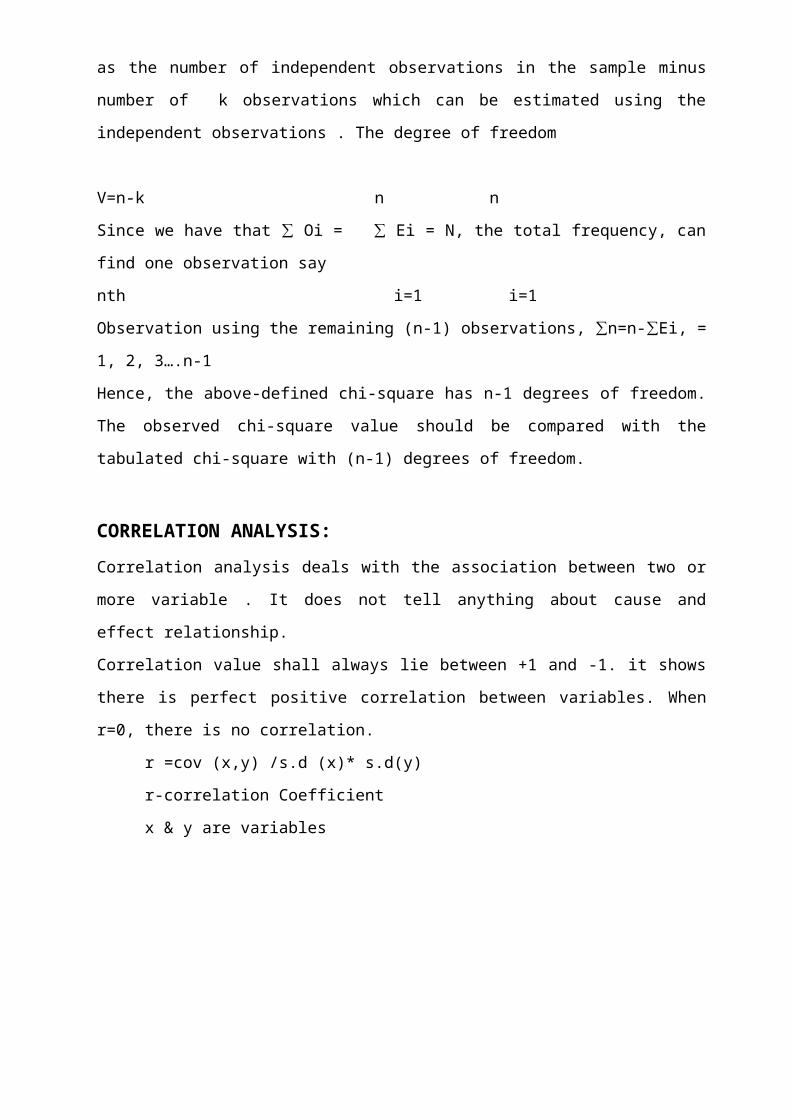
determine the degree of freedom. The degrees of freedom may be considered as the number of
independent observations in the sample minus number of k observations which can be
estimated using the independent observations . The degree of freedom
V=n-k n n
Since we have that ∑ Oi = ∑ Ei = N, the total frequency, can find one observation say
nth i=1 i=1
Observation using the remaining (n-1) observations, ∑n=n-∑Ei, = 1, 2, 3….n-1
Hence, the above-defined chi-square has n-1 degrees of freedom. The observed chi-square
value should be compared with the tabulated chi-square with (n-1) degrees of freedom.
CORRELATION ANALYSIS:
Correlation analysis deals with the association between two or more variable . It does not tell
anything about cause and effect relationship.
Correlation value shall always lie between +1 and -1. it shows there is perfect positive
correlation between variables. When r=0, there is no correlation.
r =cov (x,y) /s.d (x)* s.d(y)
r-correlation Coefficient
x & y are variables
CHAPTER 4
4.1 DATA ANALYSIS & INTERPRETATION
The data after collection has to processed and analyzed in accordance with the outline laid
down for the purpose at the time of developing the research plan. This is essential for a
scientist study and for ensuring that we have all the relevant data. Processing implies editing,
coding, classification and tabulation of collected data so that they acquiescent to analysis.
The term analysis refers to the computation of certain measures along with searching for
patterns of relationships that exits among data groups. Thus, “In the process of analysis,
relationships or difference supporting of conflicting with original or hypothesis should be
subjected to statistical tests of significance to determine with that validity data can be said to
indicate any conclusions.”
Analysis of data in general way involves no: of closely related operation that performed
with the purpose of summarizing the collected data and organizing them in such manner that
the answers the research questions.
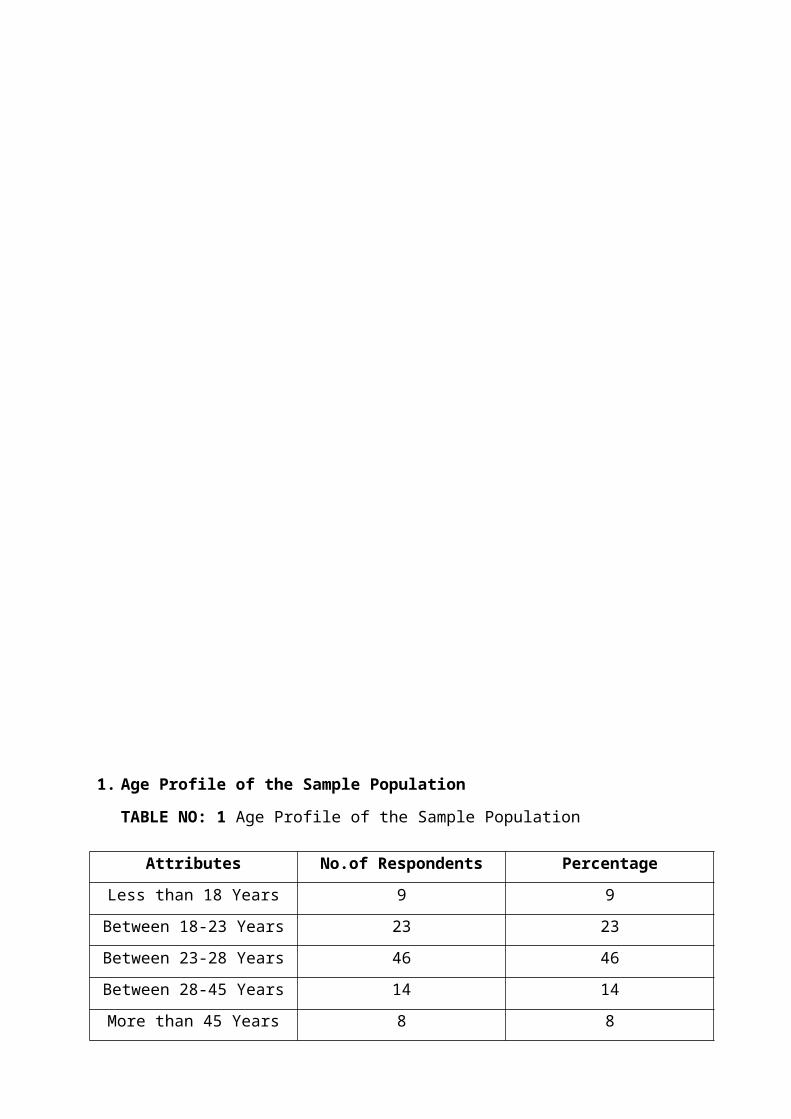
1. Age Profile of the Sample Population
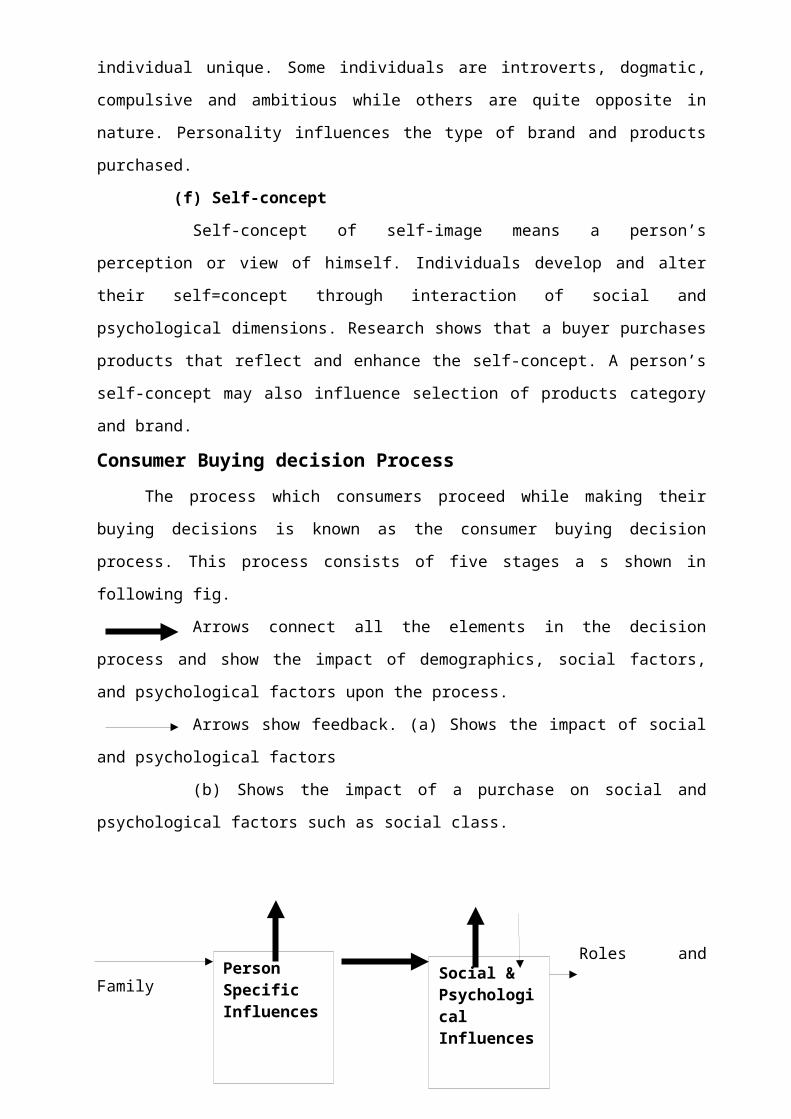
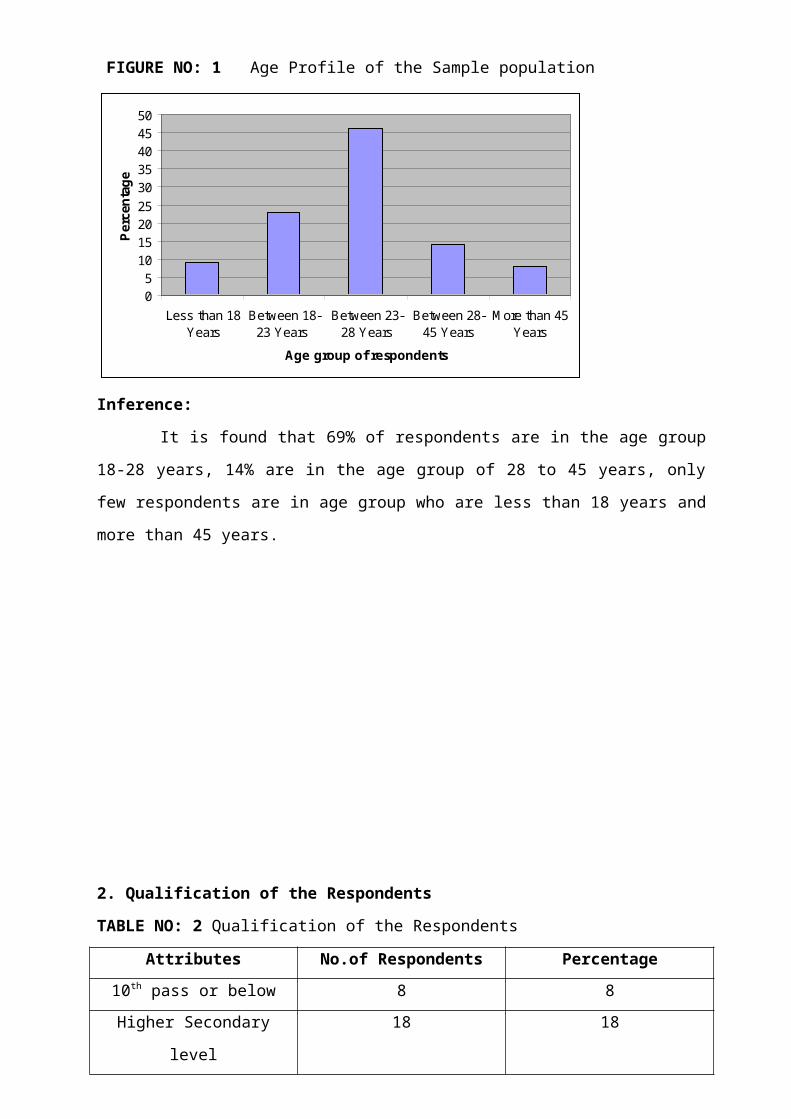
TABLE NO: 1 Age Profile of the Sample Population
Attributes No.of Respondents Percentage
Less than 18 Years 9 9
Between 18-23 Years 23 23
Between 23-28 Years 46 46
Between 28-45 Years 14 14
More than 45 Years 8 8
FIGURE NO: 1 Age Profile of the Sample population
05
10152025
3035404550
Less than 18Years
Between 18-23 Years
Between 23-28 Years
Between 28-45 Years
More than 45Years
Age group of respondents
Per
cen
tag
e
Inference:
It is found that 69% of respondents are in the age group 18-28 years, 14% are in the age
group of 28 to 45 years, only few respondents are in age group who are less than 18 years and
more than 45 years.
2. Qualification of the Respondents
TABLE NO: 2 Qualification of the Respondents
Attributes No.of Respondents Percentage
10th pass or below 8 8
Higher Secondary level 18 18
Graduate 42 42
Post Graduate 32 32
FIGURE NO: 2 Qualification of the Respondents
05
10
15202530
354045
Belowsecondary
level
HigherSecondary
level
Graduate PostGraduate
Qualification
Per
cen
tag
e
Inference:
It is found that 26% of the respondents are below higher secondary level, 42% are
graduates and 32% are post graduates.
3.Income Level of the customers
TABLE NO: 3 Income Level of the customers
Attributes No. of Respondents Percentage
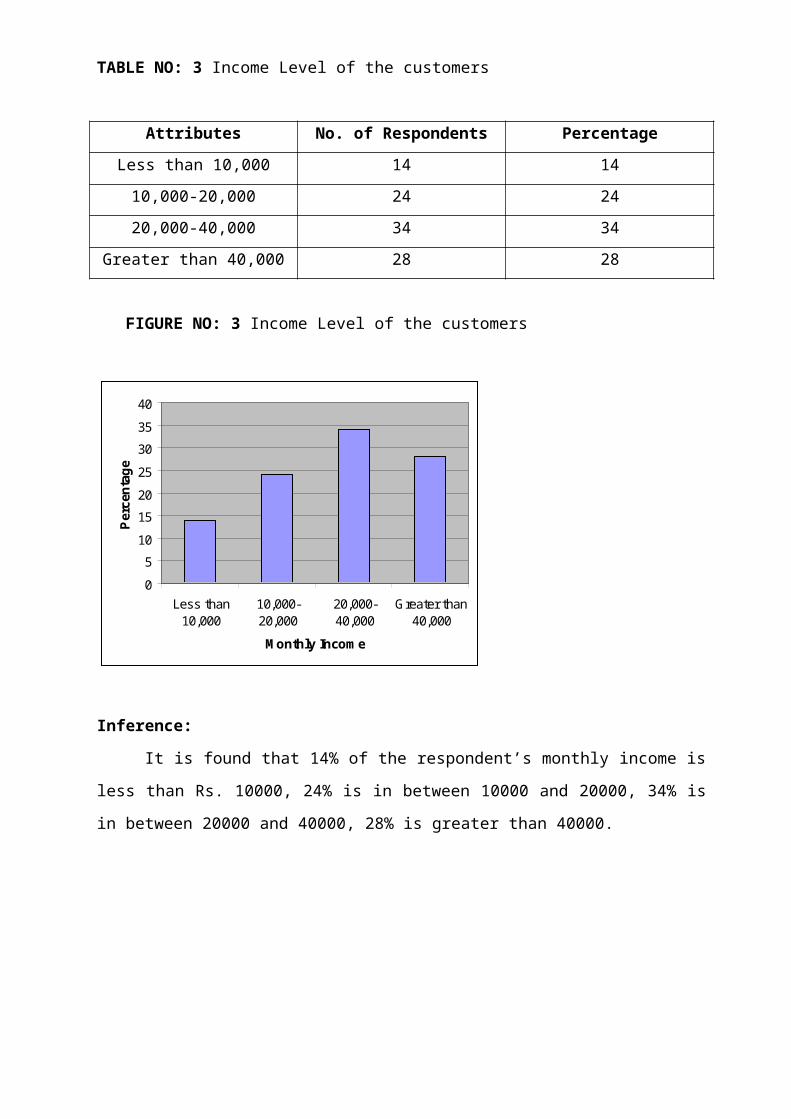
Less than 10,000 14 14
10,000-20,000 24 24
20,000-40,000 34 34
Greater than 40,000 28 28
FIGURE NO: 3 Income Level of the customers
0
5
10
15
20
25
30
35
40
Less than10,000
10,000-20,000
20,000-40,000
Greater than40,000
Monthly Income
Per
cen
tag
e
Inference:
It is found that 14% of the respondent’s monthly income is less than Rs. 10000, 24% is
in between 10000 and 20000, 34% is in between 20000 and 40000, 28% is greater than 40000.
4. Do you have an internet connection?
TABLE NO: 4 Showing the users of internet connection
Attributes No.of Respondents Percentage
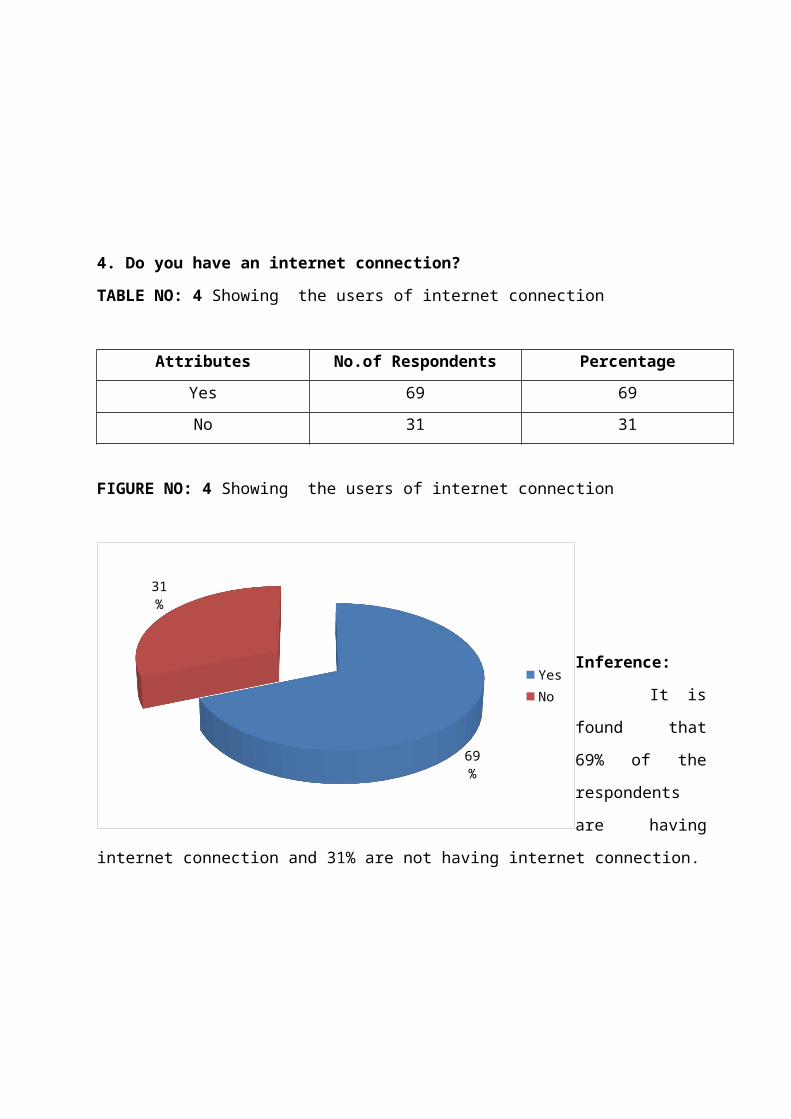
Yes 69 69
No 31 31
FIGURE NO: 4 Showing the users of internet connection
Inference:
It is found that 69% of the respondents are having internet connection and 31% are not
having internet connection.
69%
31%
YesNo
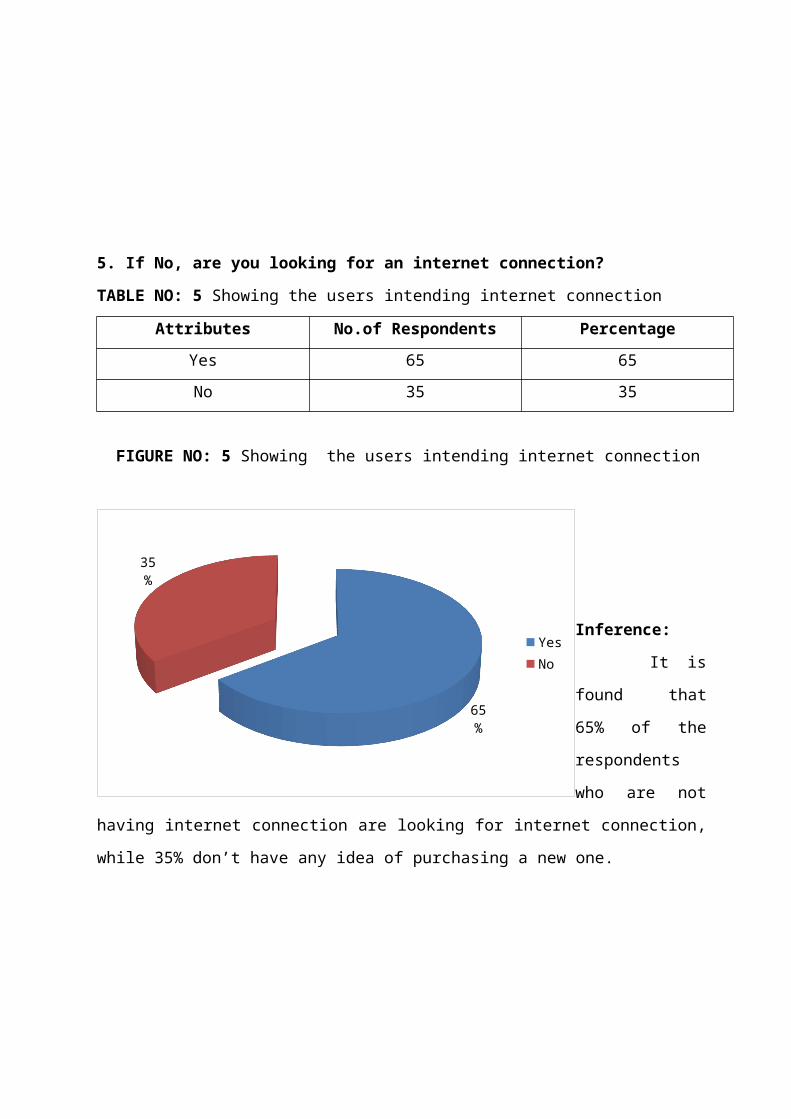
5. If No, are you looking for an internet connection?
TABLE NO: 5 Showing the users intending internet connection
Attributes No.of Respondents Percentage
Yes 65 65
No 35 35
FIGURE NO: 5 Showing the users intending internet connection
Inference:
It is found that 65% of the respondents who are not having internet connection are looking
for internet connection, while 35% don’t have any idea of purchasing a new one.
65%
35%
YesNo
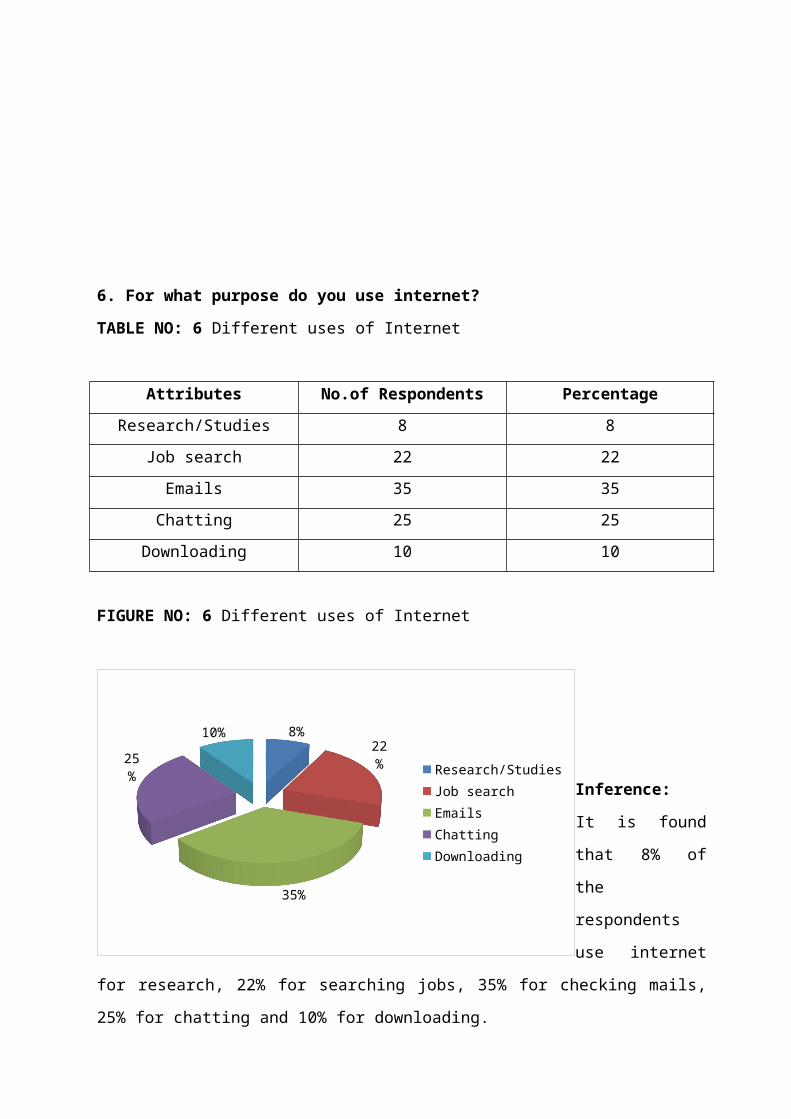
6. For what purpose do you use internet?
TABLE NO: 6 Different uses of Internet
Attributes No.of Respondents Percentage
Research/Studies 8 8
Job search 22 22
Emails 35 35
Chatting 25 25
Downloading 10 10
FIGURE NO: 6 Different uses of Internet
Inference:
It is found that 8% of the respondents use internet for research, 22% for searching jobs,
35% for checking mails, 25% for chatting and 10% for downloading.
8%
22%
35%
25%
10%
Research/StudiesJob searchEmailsChattingDownloading
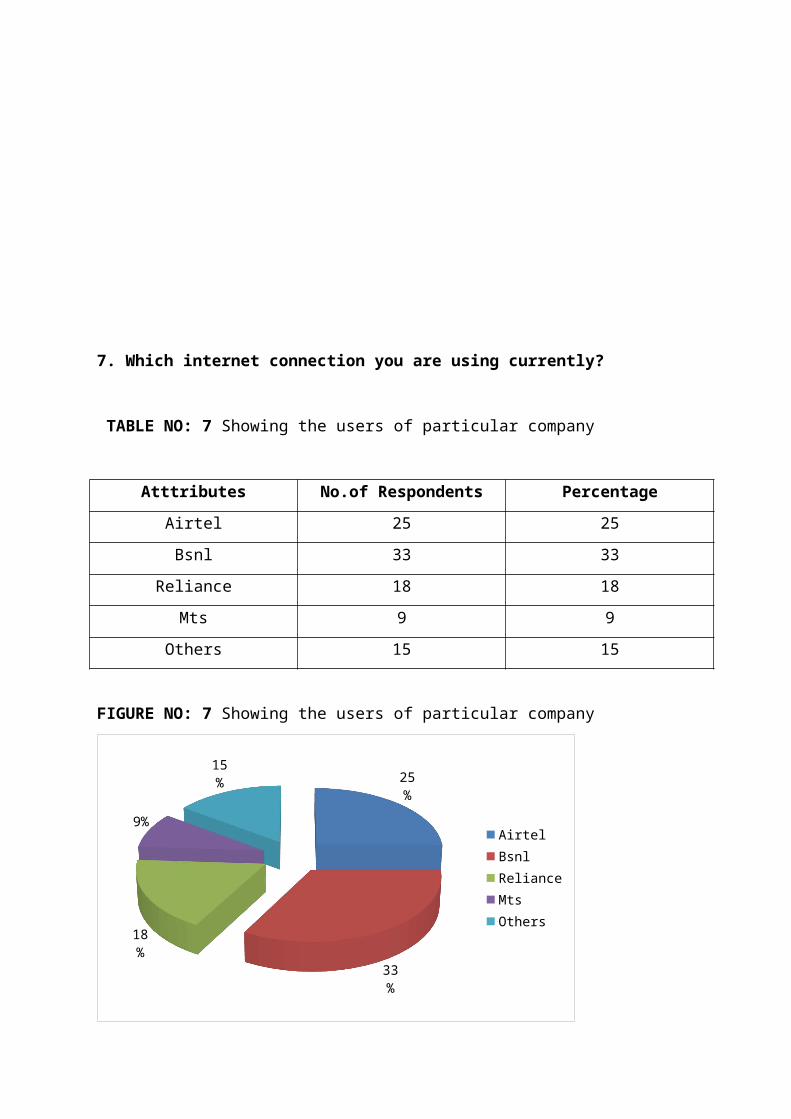
7. Which internet connection you are using currently?
TABLE NO: 7 Showing the users of particular company
Atttributes No.of Respondents Percentage
Airtel 25 25
Bsnl 33 33
Reliance 18 18
Mts 9 9
Others 15 15
FIGURE NO: 7 Showing the users of particular company
25%
33%
18%
9%
15%
AirtelBsnlRelianceMtsOthers
Inference:
It is found that 25% of the respondents use airtel service, 33% are using BSNL, 18%
are using reliance, 9% are using MTS and 15% are using other services.
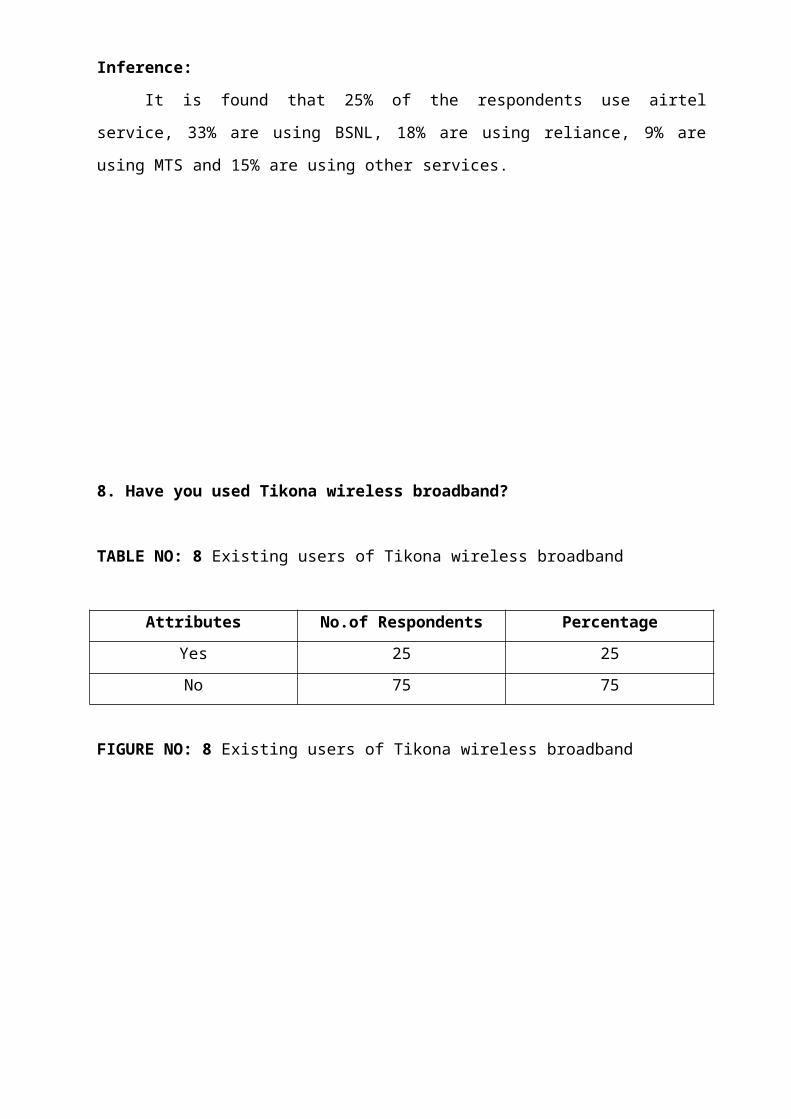
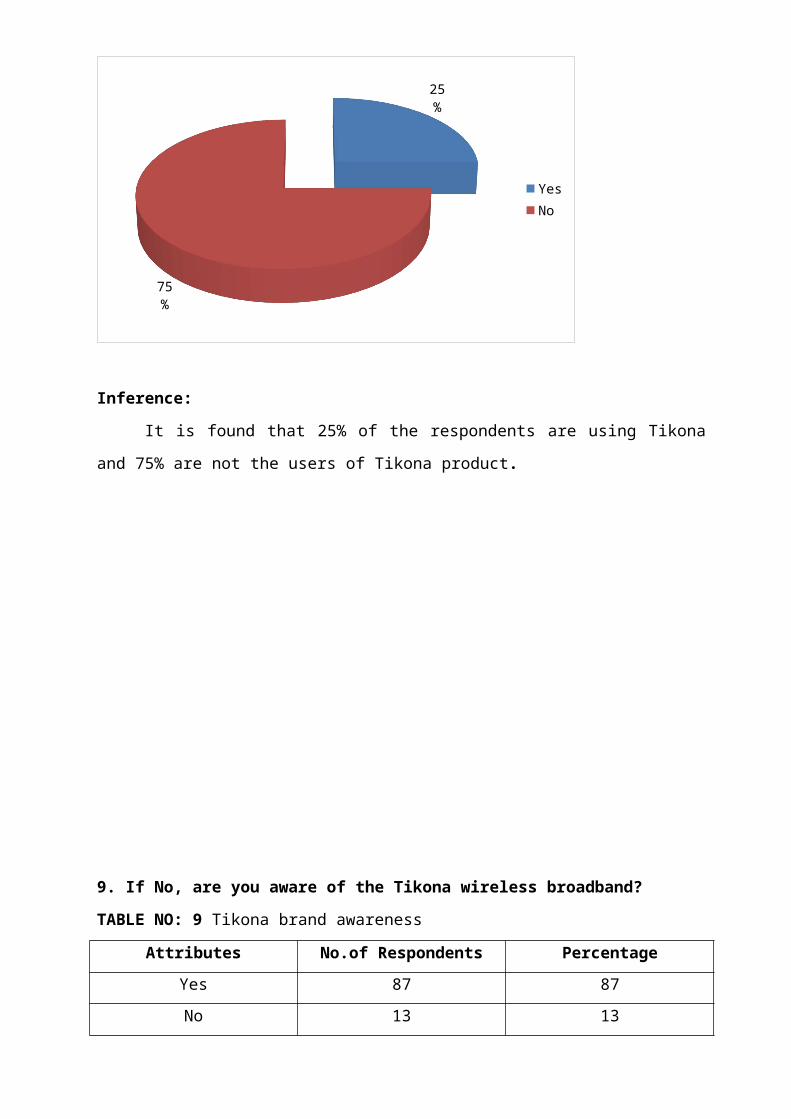
8. Have you used Tikona wireless broadband?
TABLE NO: 8 Existing users of Tikona wireless broadband
Attributes No.of Respondents Percentage
Yes 25 25
No 75 75
FIGURE NO: 8 Existing users of Tikona wireless broadband
25%
75%
YesNo
Inference:
It is found that 25% of the respondents are using Tikona and 75% are not the users of
Tikona product.
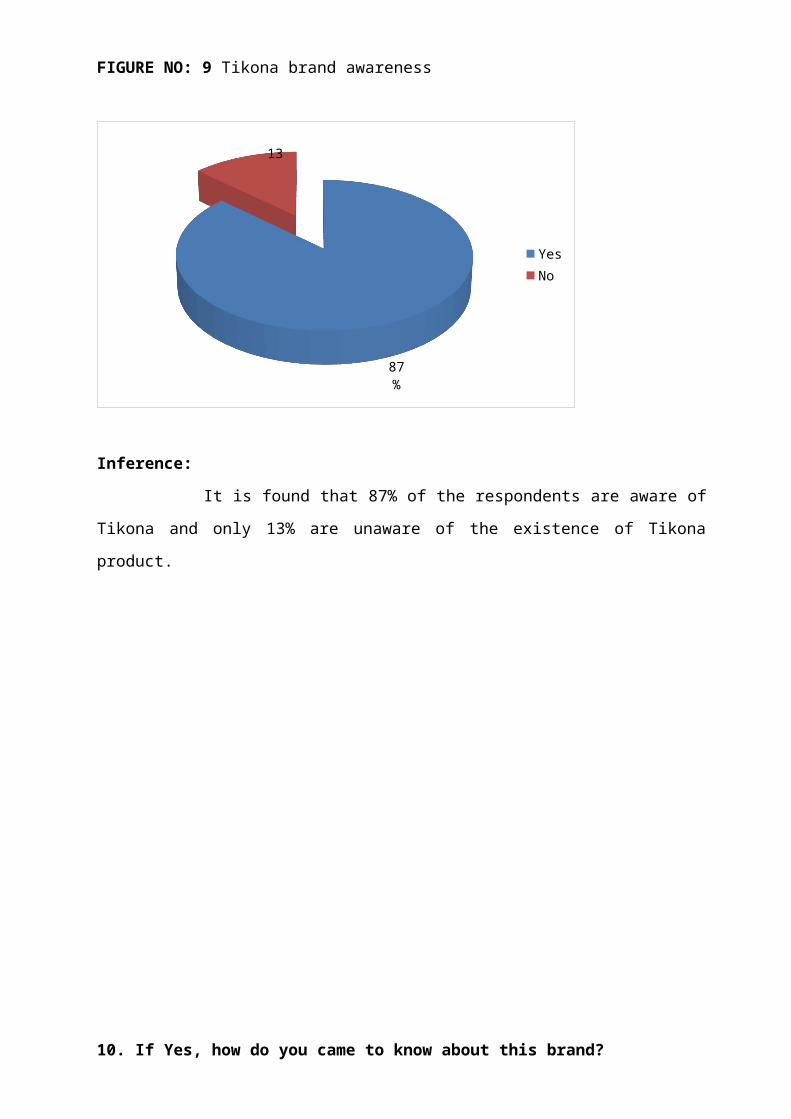
9. If No, are you aware of the Tikona wireless broadband?
TABLE NO: 9 Tikona brand awareness
Attributes No.of Respondents Percentage
Yes 87 87
No 13 13
FIGURE NO: 9 Tikona brand awareness
87%
13
YesNo
Inference:
It is found that 87% of the respondents are aware of Tikona and only 13% are
unaware of the existence of Tikona product.
10. If Yes, how do you came to know about this brand?
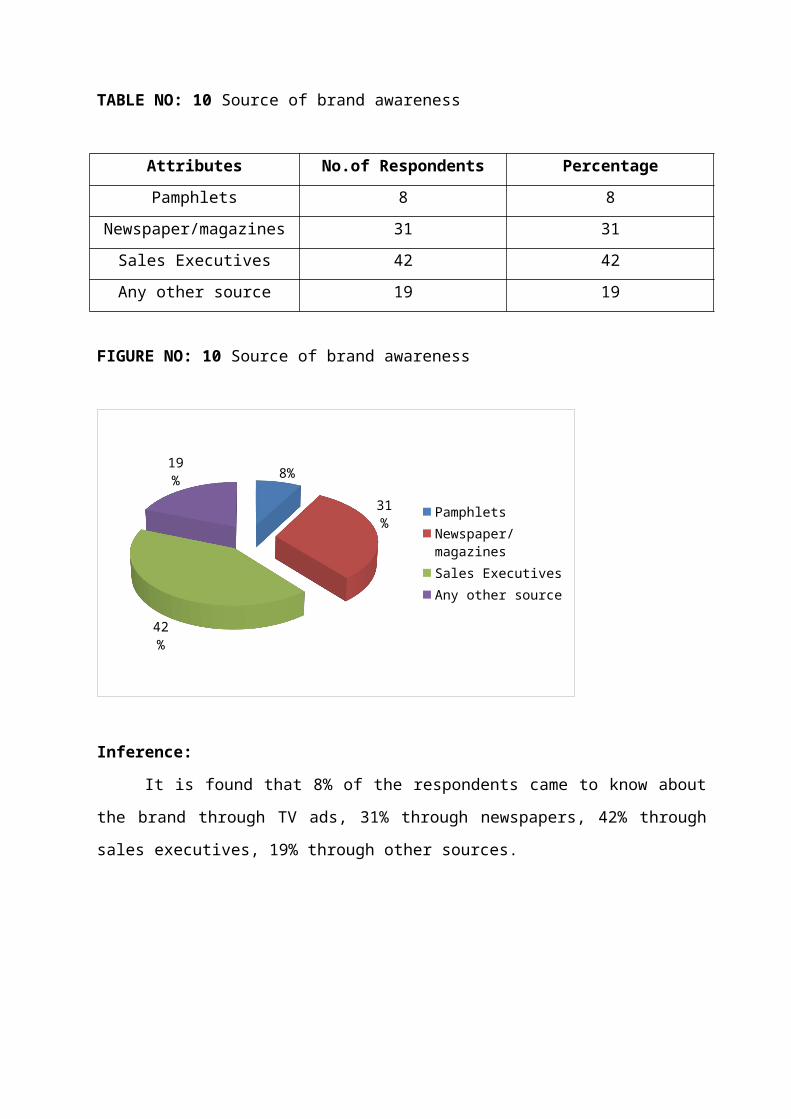
TABLE NO: 10 Source of brand awareness
Attributes No.of Respondents Percentage
Pamphlets 8 8
Newspaper/magazines 31 31
Sales Executives 42 42
Any other source 19 19
FIGURE NO: 10 Source of brand awareness
8%
31%
42%
19%
PamphletsNewspaper/magazinesSales ExecutivesAny other source
Inference:
It is found that 8% of the respondents came to know about the brand through TV ads,
31% through newspapers, 42% through sales executives, 19% through other sources.
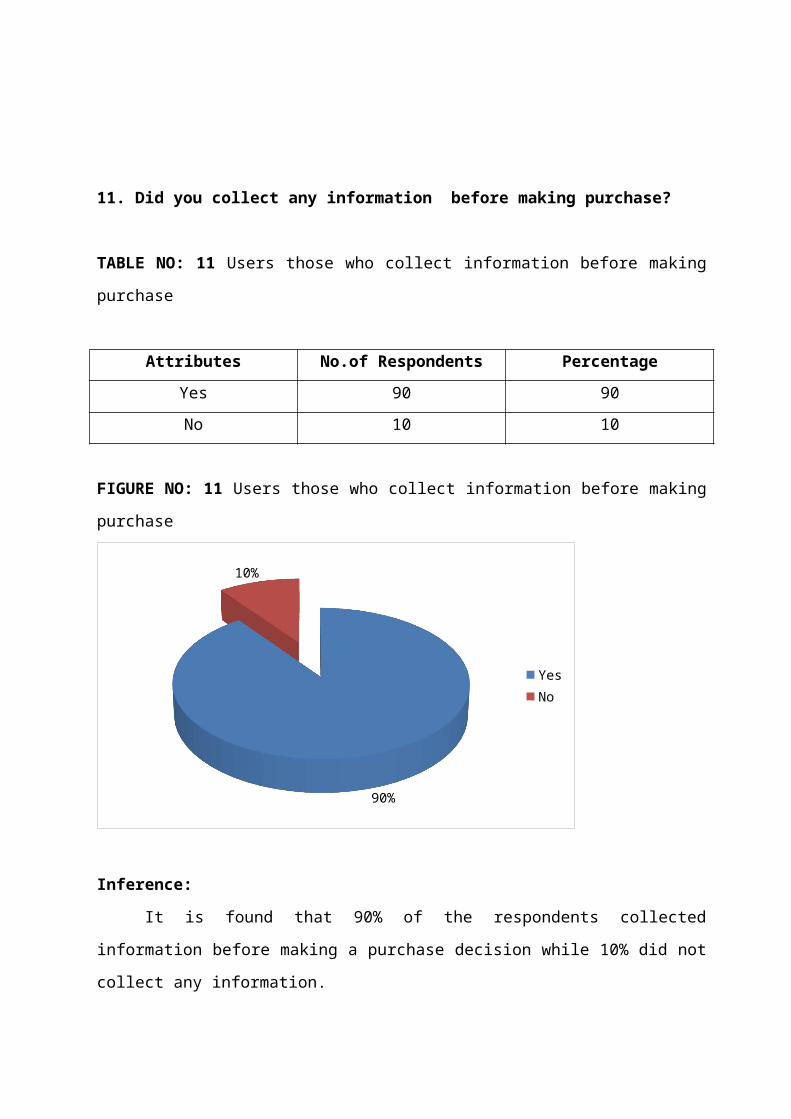
11. Did you collect any information before making purchase?
TABLE NO: 11 Users those who collect information before making purchase
Attributes No.of Respondents Percentage
Yes 90 90
No 10 10
FIGURE NO: 11 Users those who collect information before making purchase
90%
10%
YesNo
Inference:
It is found that 90% of the respondents collected information before making a purchase
decision while 10% did not collect any information.
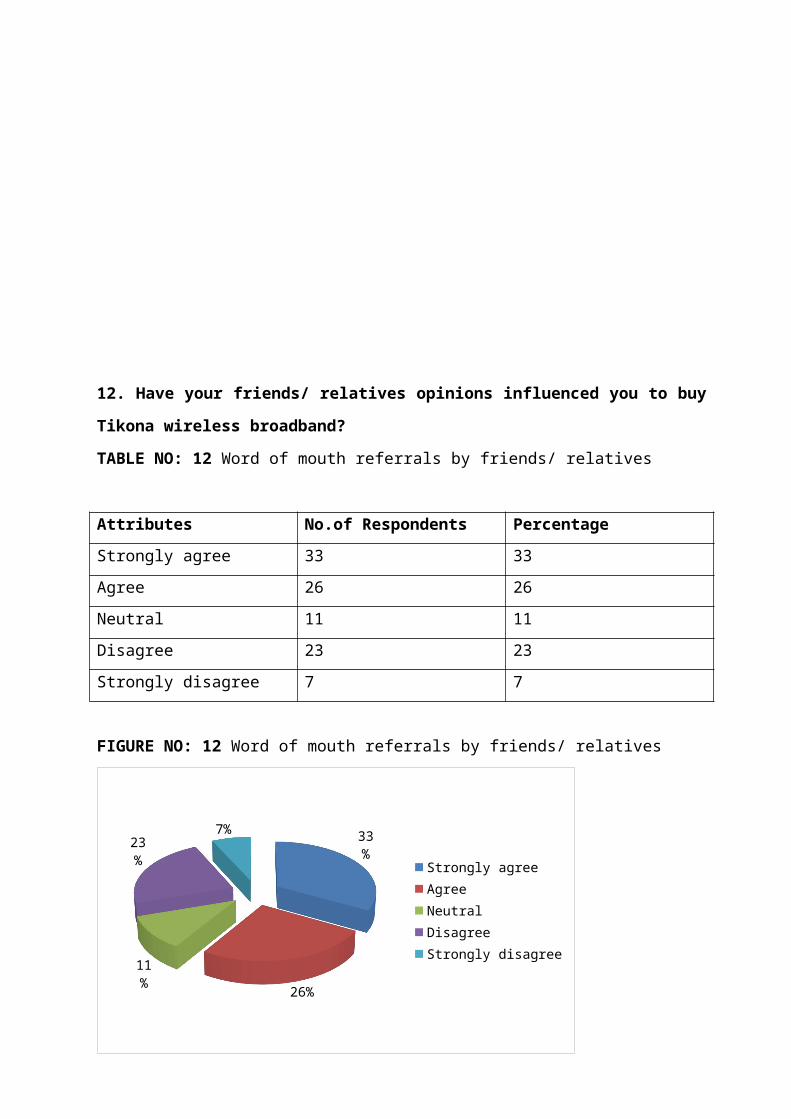
12. Have your friends/ relatives opinions influenced you to buy Tikona wireless
broadband?
TABLE NO: 12 Word of mouth referrals by friends/ relatives
Attributes No.of Respondents Percentage
Strongly agree 33 33
Agree 26 26
Neutral 11 11
Disagree 23 23
Strongly disagree 7 7
FIGURE NO: 12 Word of mouth referrals by friends/ relatives
33%
26%
11%
23%
7%
Strongly agreeAgreeNeutralDisagreeStrongly disagree
Inference:
It is found that 33% of the respondents strongly agree that friends had a major influence in
purchase decision, 26% agree, 11% are neutral, 23% are disagree and 7% strongly disagree
that friends had a major influence in purchase decision.
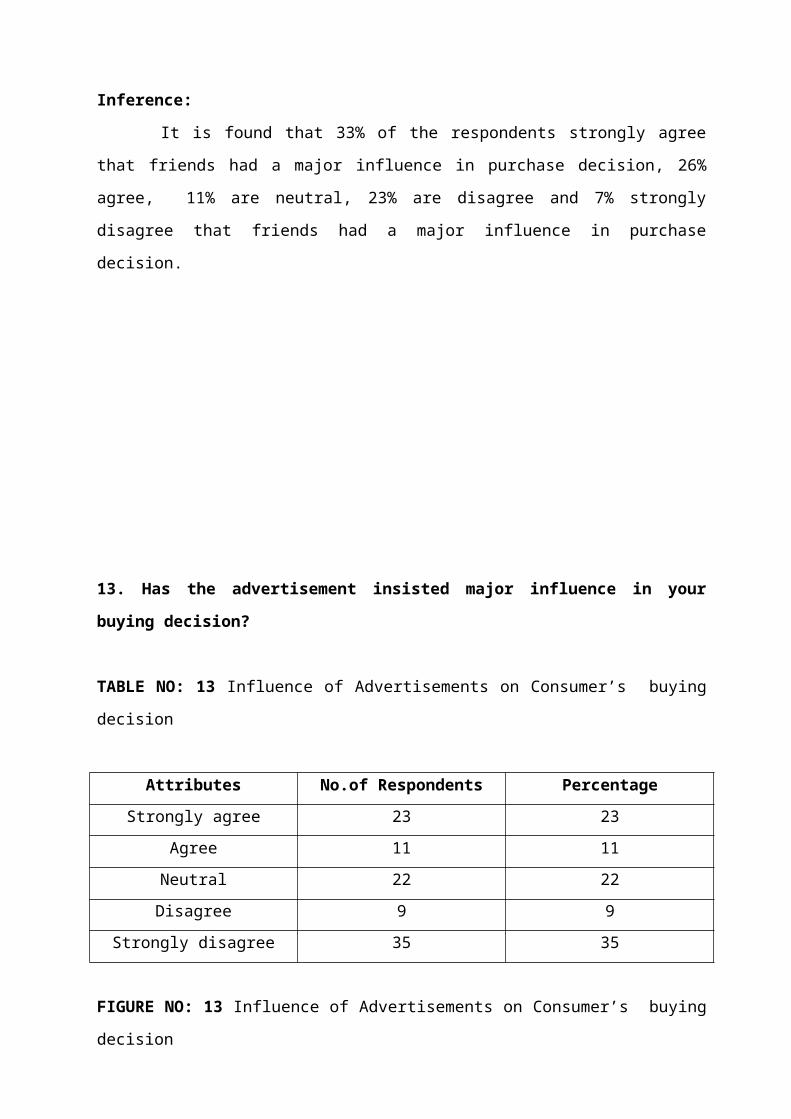
13. Has the advertisement insisted major influence in your buying decision?
TABLE NO: 13 Influence of Advertisements on Consumer’s buying decision
Attributes No.of Respondents Percentage
Strongly agree 23 23
Agree 11 11
Neutral 22 22
Disagree 9 9
Strongly disagree 35 35
FIGURE NO: 13 Influence of Advertisements on Consumer’s buying decision
23%
11%
22%9%
35%
Strongly agreeAgreeNeutralDisagreeStrongly disagree
Inference:
It is found that 23% of the respondents strongly agree that advertisement had a major
influence in purchase decision, 11% agree, 22% are neutral, 9% are disagree and 35% strongly
disagree that advertisement had a major influence in purchase decision.
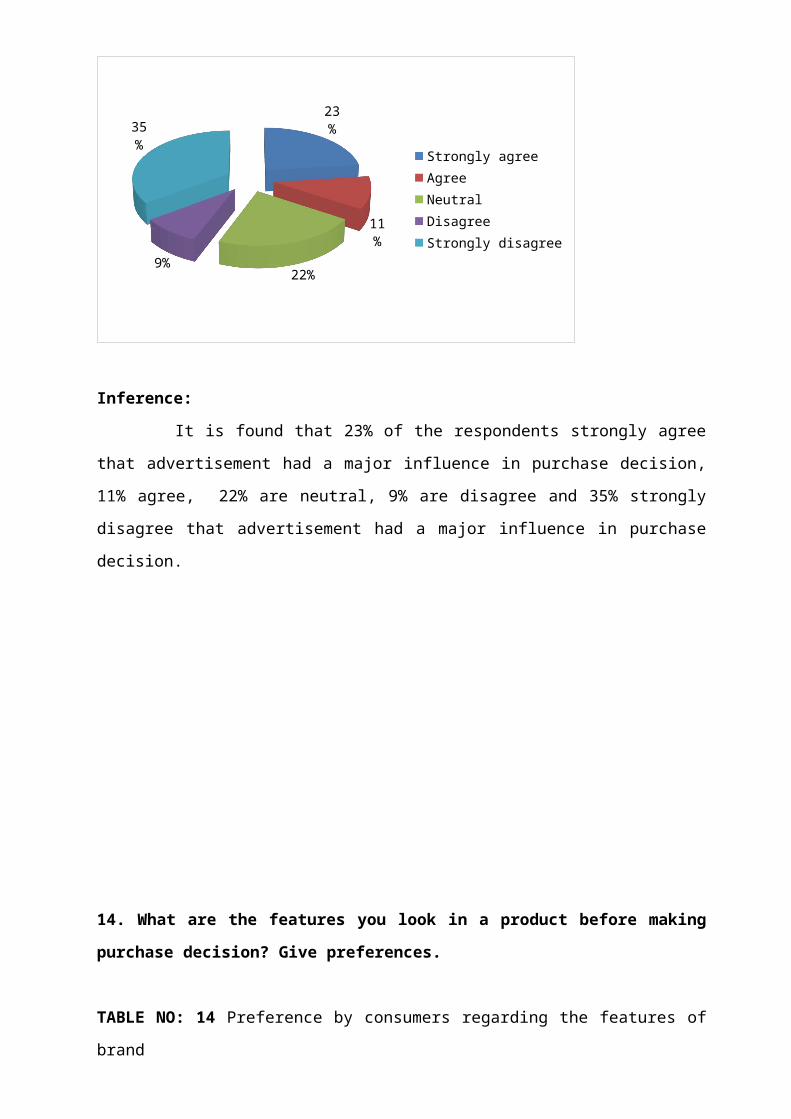
14. What are the features you look in a product before making purchase decision? Give
preferences.
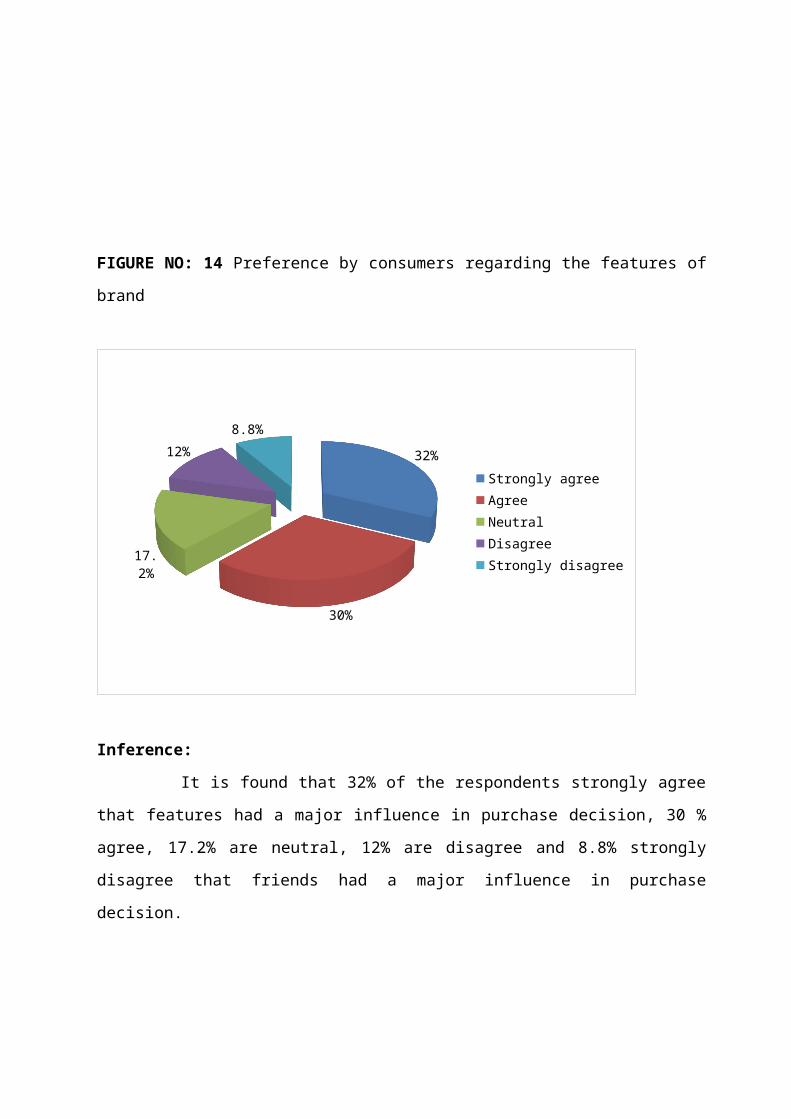
TABLE NO: 14 Preference by consumers regarding the features of brand
Particulars Strongly
agree
Agree Neutral Disagree Strongly
disagree
Brand
Credibility
32 28 16 14 10
Price &
Discount
36 24 14 14 12
After Sales
Service
38 32 12 10 8
Value for
Money
28 34 16 14 8
Add on
features
26 32 28 8 6
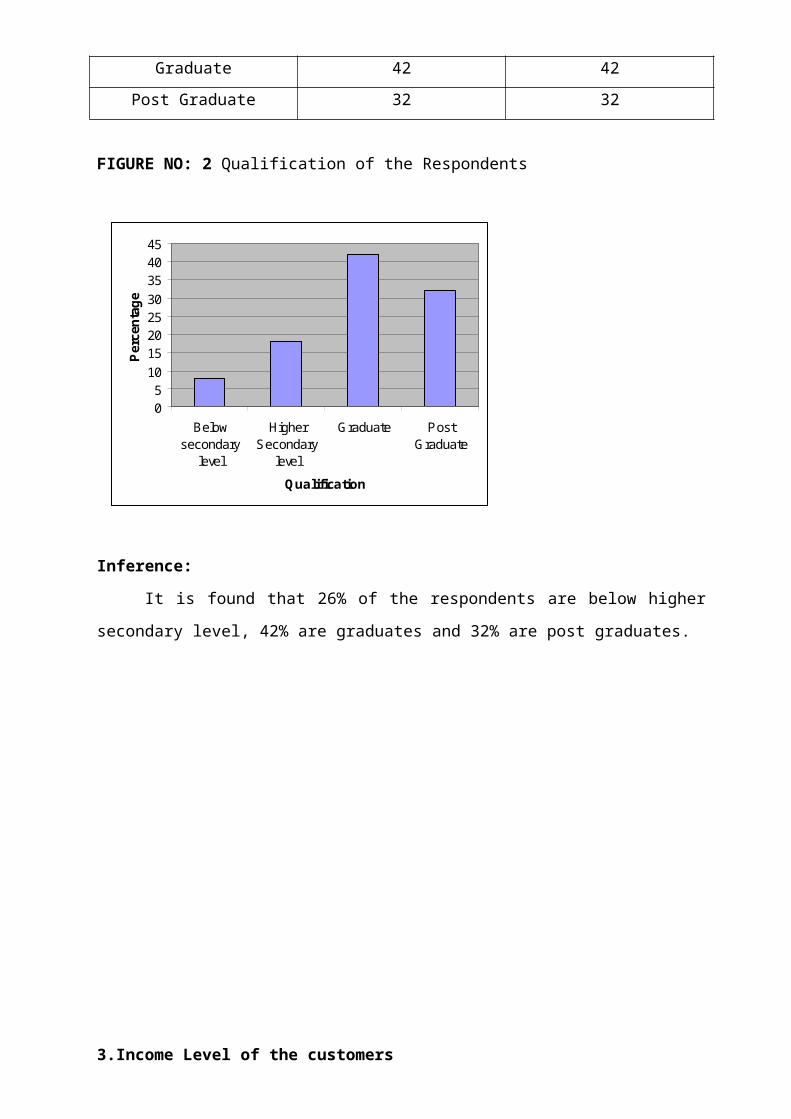
FIGURE NO: 14 Preference by consumers regarding the features of brand
32%
30%
17.2%
12%
8.8%
Strongly agreeAgreeNeutralDisagreeStrongly disagree
Inference:
It is found that 32% of the respondents strongly agree that features had a major influence
in purchase decision, 30 % agree, 17.2% are neutral, 12% are disagree and 8.8% strongly
disagree that friends had a major influence in purchase decision.
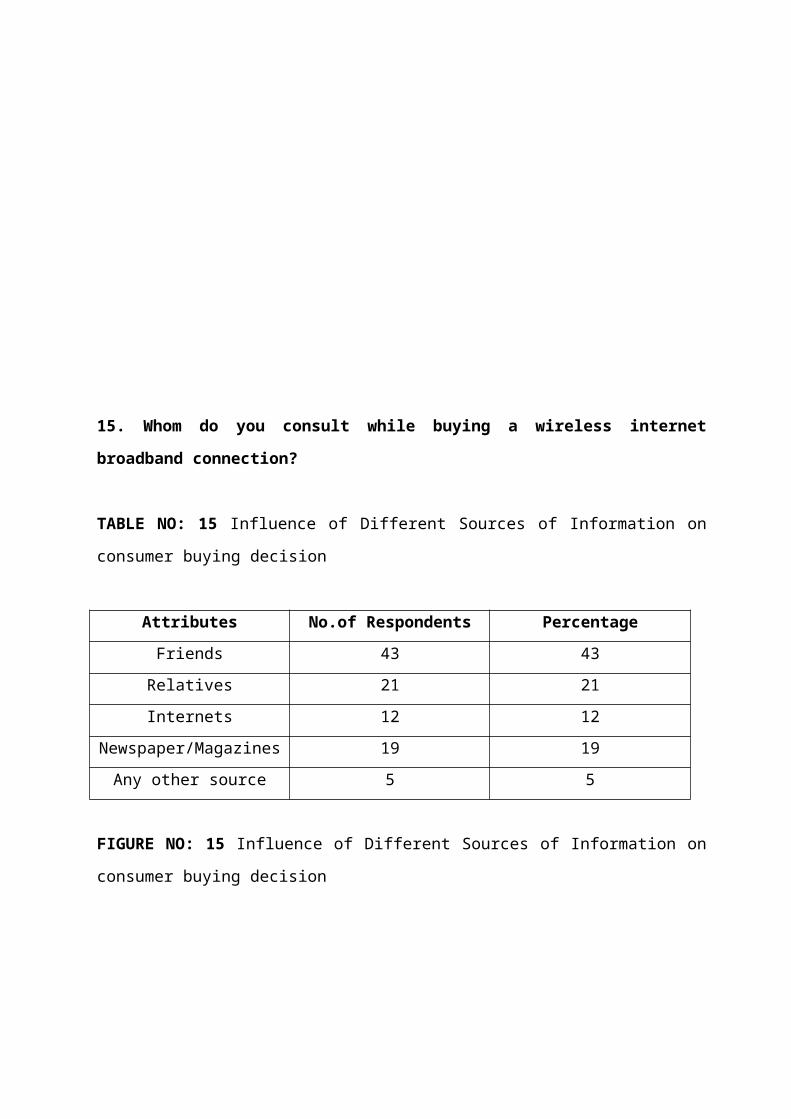
15. Whom do you consult while buying a wireless internet broadband connection?
TABLE NO: 15 Influence of Different Sources of Information on consumer buying decision
Attributes No.of Respondents Percentage
Friends 43 43
Relatives 21 21
Internets 12 12
Newspaper/Magazines 19 19
Any other source 5 5
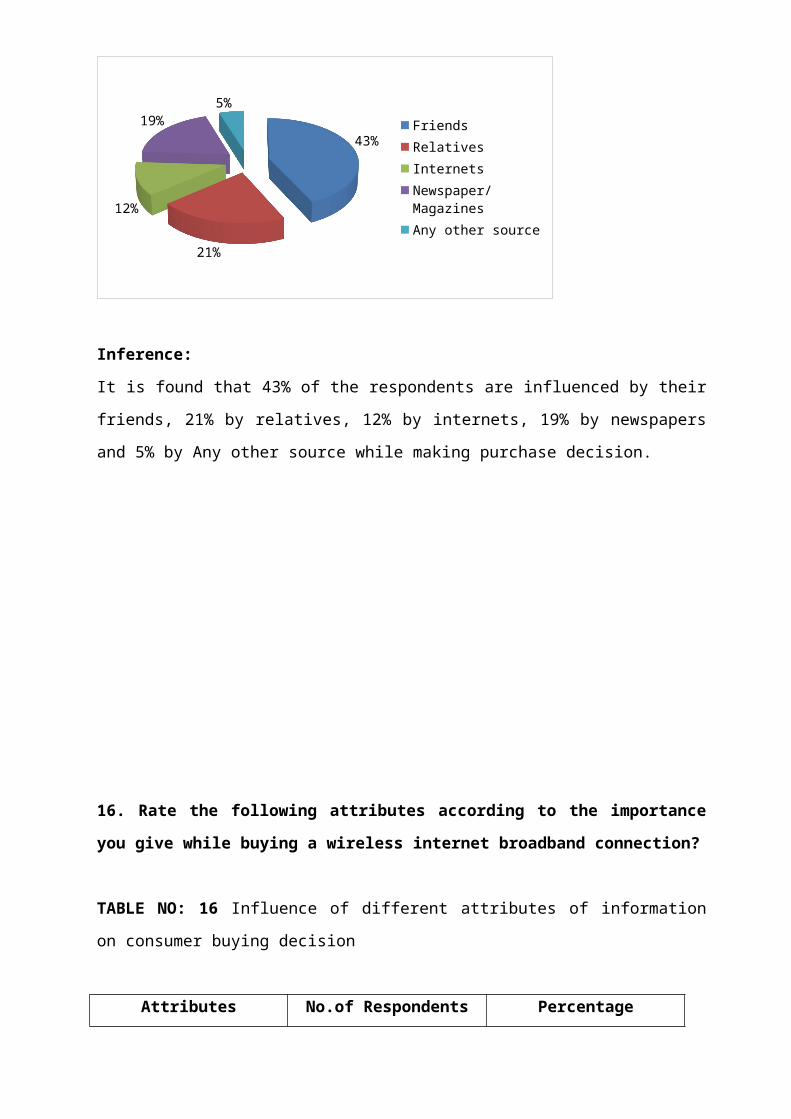
FIGURE NO: 15 Influence of Different Sources of Information on consumer buying decision
43%
21%
12%
19%5%
FriendsRelativesInternetsNewspaper/MagazinesAny other source
Inference:
It is found that 43% of the respondents are influenced by their friends, 21% by relatives, 12%
by internets, 19% by newspapers and 5% by Any other source while making purchase
decision.
16. Rate the following attributes according to the importance you give while buying a
wireless internet broadband connection?
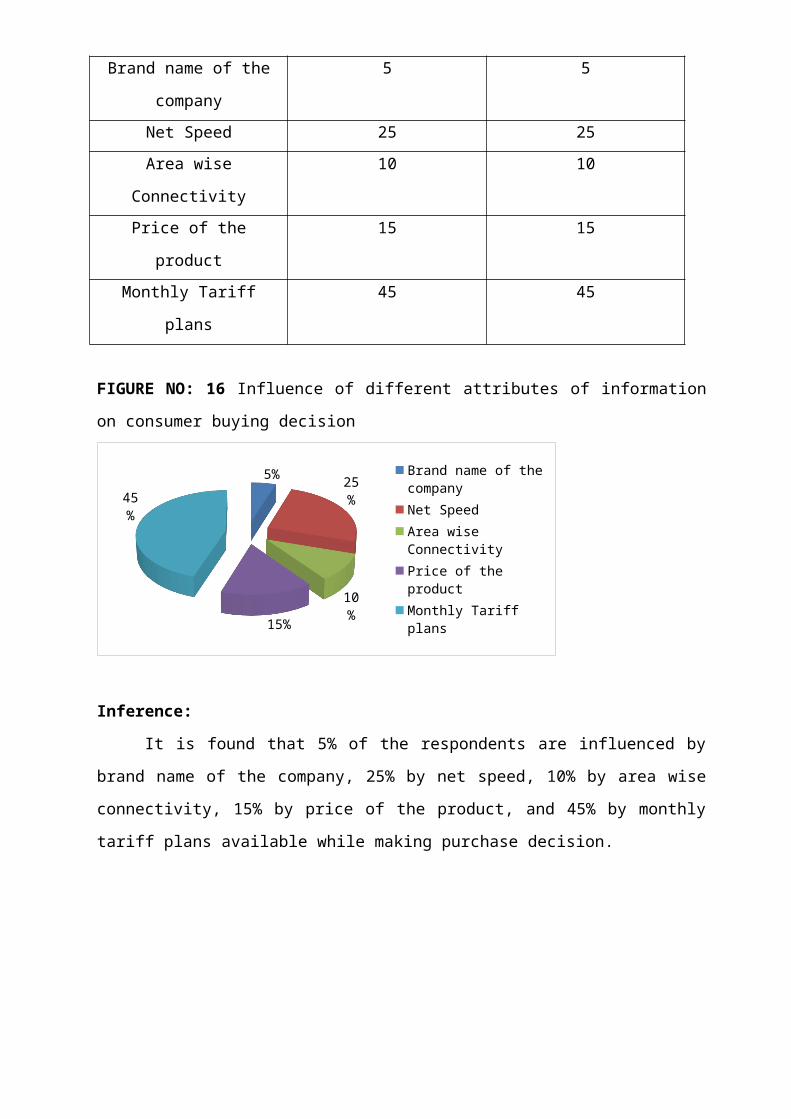
TABLE NO: 16 Influence of different attributes of information on consumer buying decision
Attributes No.of Respondents Percentage
Brand name of the company 5 5
Net Speed 25 25
Area wise Connectivity 10 10
Price of the product 15 15
Monthly Tariff plans 45 45
FIGURE NO: 16 Influence of different attributes of information on consumer buying decision
5%25%
10%
15%
45% Brand name of the
companyNet SpeedArea wise ConnectivityPrice of the productMonthly Tariff plans
Inference:
It is found that 5% of the respondents are influenced by brand name of the company,
25% by net speed, 10% by area wise connectivity, 15% by price of the product, and 45% by
monthly tariff plans available while making purchase decision.
17. How satisfied are you with Tikona wireless broadband compared with the others
substitutes available in the market?
TABLE NO: 17 Satisfaction with Tikona wireless broadband in comparison with other brands
Attributes No.of Respondents Percentage
Highly satisfied 12 12
Satisfied 28 28
Neutral 53 53
Dissatisfied 5 5
Highly dissatisfied 2 2
FIGURE NO: 17 Satisfaction with Tikona wireless broadband in comparison with other
brands
12%
28%
53%
5% 2%
Highly satisfiedSatisfiedNeutralDissatisfiedHighly dissatisfied
Inference:
It is found that 12% of the respondents are highly satisfied with product, 28%
are satisfied, 53% are neutral, 5% are dissatisfied and 2% is highly dissatisfied with product.
18. How would you rate Tikona Performance as your expectation on 5 points scale?
a) After sales service
TABLE NO: 18 Tikona performance in terms of after sales service
Attributes No. of Respondents Percentage
Highly satisfied 15 15
Satisfied 25 25
Neutral 46 46
Dissatisfied 12 12
Highly dissatisfied 2 2
FIGURE NO: 18 Tikona performance in terms of after sales service
15%
25%
46%
12% 2%
Highly satisfiedsatisfiedNeutralDissatisfiedHighly dissatisfied
Inference:
It is found that 15% of the respondents are highly satisfied with after sales service of the
product, 25% are satisfied, 46% are neutral, 12% are dissatisfied and 2% is highly dissatisfied
with after sales service of the product.
b)Maintenance
TABLE NO: 19 Tikona performance in terms of maintenance
Attributes No.of Respondents Percentage
Highly satisfied 12 12
Satisfied 28 28
Neutral 53 53
Dissatisfied 5 5
Highly dissatisfied 2 2
FIGURE NO: 19 Tikona performance in terms of maintenance
12%
28%
53%
5% 2%
Highly satisfiedsatisfiedNeutralDissatisfiedHighly dissatisfied
Inference:
It is found that 12% of the respondents are highly satisfied with maintenance of
product, 28% are satisfied, 53% are neutral, 5% are dissatisfied and 2% is highly dissatisfied
with maintenance of product.
c) Product as per expectation
TABLE NO: 20 Tikona performance in terms of consumer expectation
Attributes No. of Respondents Percentage
Highly satisfied 18 18
Satisfied 28 28
Neutral 43 43
Dissatisfied 10 10
Highly dissatisfied 1 1
FIGURE NO: 20 Tikona performance in terms of consumer expectation
Inference:
It is found that 18% of the respondents are highly satisfied with product, 28% are
satisfied, 43% are neutral, 10% are dissatisfied and 1% is highly dissatisfied with product.
18%
28%43%
10% 1%
Highly satisfiedSatisfiedNeutralDissatisfiedHighly dissatisfied
CHI-SQUARE TEST:
Particulars Strongly
agree
Agree Neutral Disagree Strongly
disagree
Total
Brand
Credibility
32 28 16 14 10 100
Price &
Discount
36 24 14 14 12 100
After Sales
Service
38 32 12 10 8 100
Value for
Money
28 34 16 14 8 100
Add on
features
26 32 28 8 6 100
Total 160 150 86 60 44 500
NULL HYPOTHESIS: H0
There is no significant difference between the features of the brand and the acceptance of the
consumers.
ALTERNATIVE HYPOTHESIS: H1
There is significant difference between the features of the brand and the acceptance of the
consumers.
Calculated value of chi-square=19.528
Tabulated value of chi-square at 5% level of significance=26.3
Since Tabulated value > Calculated value
Null Hypothesis Accepted. There is no significant difference between the features of the
brand and the acceptance of the consumers.
CORRELATION ANALYSIS:
NULL HYPOTHESIS:
There is no significant difference in the purchase influenced by the word of the mouth
referrals of friends and the purchase influenced by the advertisements.
ALTERNATIVE HYPOTHESIS:
There is significant difference in the purchase influenced by the word of the mouth
referrals of friends and the purchase influenced by the advertisements.
X Y XY X2 Y2
33 23 759 1089 529
26 11 286 676 121
11 22 242 121 484
23 9 207 529 81
7 35 245 49 1225
100 100 1739 2464 2440
r= cov(x,y)/s.d(x)*s.d(y)
r= -0.578
Since the value of r is negative,
Alternative hypothesis get accepted. There is significant difference in the purchase
influenced by the word of the mouth referrals of friends and the purchase influenced by
the advertisements.
4.2 FINDINGS OF THE STUDY
Majority of the respondents are in the age group of 18 to 28 years. This group forms the
major target segment of Tikona Broadband.
Majority of the respondents who use internet connections are educated people who
have completed either graduation or post graduation.
Mostly respondents whose monthly income is greater than Rs.20000 are using internet
connection.
70% of the respondents are having internet connections at home.
65% of the respondents who are not having internet connection are looking for internet
connection, while 35% don’t have any idea of purchasing a new one.
Majority of the respondents use internet for chatting, downloading and checking mails.
Only few use it for searching jobs and research purposes.
Majority of the respondents are using reputed broadband services like BSNL, Reliance,
Airtel. Only few use new services like MTS and others.
While majority of the respondents are aware of the existence of Tikona Broadband,
only few respondents have used it.
Majority of the respondents came to about this brand through sales executives and pam-
phlets issued along with newspapers.
Majority of the respondents collect all the relevant information necessary before mak-
ing purchase.
Nearly 60% of the respondents are influenced by their friends and relatives while mak-
ing a purchase decision.
Majority of the respondents are not influenced by the advertisements while making pur-
chase decision.
Monthly tariff plans and net speed are the important factors taken into consideration
while making purchase decision.
40% of the customers are satisfied with Tikona broadband while only 7% are dissatis-
fied with this product, all others response is neutral.
40% of the respondents are satisfied with after sales service while only very few are
dissatisfied with the after sales service.
40% of the customers are satisfied with the maintenance of Tikona broadband while
only 7% are dissatisfied, all others response is neutral.
Nearly 50% of the respondents are satisfied as the product meets the expectation of the
customers while 43% of the respondents feel neutral.
There is no significant difference between the features of the brand and the acceptance
of the consumers.
There is significant difference in the purchase influenced by the word of the mouth re-
ferrals of friends and the purchase influenced by the advertisements.
CHAPTER 5
5.1 SUGGESTIONS
Most of the respondents came to know about this brand only through sales executives.
Steps can be taken to improve the awareness of the product among people.
Majority of the respondents are using reputed brands like BSNL, Reliance etc. Steps
can be taken to make Tikona a reputed brand.
Tikona is bought by majority of the people for its low tariff plan and high net speed.
This shall be maintained.
Further this brand is available only in major cities like Chennai, Bangalore, Mumbai
etc. Steps can be taken to promote the product in other parts of India.
Advertisements play a meager role in influencing people in making a purchase deci-
sion. Only friends and relatives play a major role in influencing people. Steps can be
taken to improve advertisements in television and radio to promote the product.
Respondents are satisfied with the after sales service of the product, feel that the prod-
uct is easy to maintain and also the product meets the expectation of the customers.
This shall be maintained.
5.2 CONCLUSION
Consumer behaviour will play an vital role in recent days so that the researcher
carefully under took an survey among the consumer to find out the same in TIKONA
DIGITAL NETWORKS PVT LTD on the basis of that survey.
All the things are mostly favourable to Tikona, the Tikona should continue the same
strategy. Tikona should concentrate on sales promotional activities & recruits additional
number of employees in service department in order to provide uninterrupted service to
consumers.
Tikona have a good brand image among consumers so in order to retain the consumers
and to sustain the image it is recommended that the organization should follow the suggestions
as given above in the project.
BIBLIOGRAPHY
Dr. GUPTA C.B. Dr. N. RAJAN NAIR. Marketing Management, New Delhi Sultan
Chand & Sons, Publishers 2003.
KOTHARI. C.R. Research methodology, New Delhi, New Age International
GUPTA S.P., STATISTICAL METHODS, New Delhi, Sultan Chand & Sons, Publish-
ers 2003
PHILIP KOTLER, Kevin LANE KELLER, ABRAHAM KOSHY, MITHILESHWAR
Marketing Management,13th Edition, New Delhi, Pearson Education, 2008
LEON G. SCHIFFMAN, LESLIE LAZAR KANUK, Consumer Behaviour,9th Edition,
New Delhi, Prentice Hall of India Pvt. Ltd., 2007
ANNEXURES
QUESTIONNAIRE
Respected madam/sir,
As a part of my project I would like to gather some information from you
Which will help me in an in depth study of project. The information provided by
You will be kept confidential and will be used for academic purpose only. I would
be obliged if you co-operate with me in filling the questionnaire.
1. Name ………………………………………………….
2. Gender
a) Male
b) Female
3. Age
a) Less than 18 years
b) Between 18-23 years
c) Between 23-28 years
d) Between 28-45 years
e) More than 45 years
4. Qualification of the Respondents
a) 10th pass or below
b) Higher secondary level
c) Graduate
d) Post Graduate
5. Monthly Income of the Family
a) Less than Rs. 10,000
b) Between Rs. 10,000-Rs. 20,000
c) Between Rs. 20,000-Rs. 40,000
d) More than Rs. 40,000
6. Do you have an internet connection?
a) Yes
b) No
7. If No, are you looking for an internet connection?
a) Yes
b) No
8. For what purpose do you use internet?
a) Research/Studies
b) Job Search
c) Emails
d) Chatting
e) Downloading
9. Which internet connection you are using currently?
a) Airtel
b) Bsnl
c) Reliance
d) Mts
e) others
10. Have you used Tikona wireless broadband?
a) Yes
b) No
11. Are you aware of the Tikona wireless broadband?
a) Yes
b) No
12. If Yes, how do you came to know about this product?
a) Advertisements
b) Newspapers/ Magazines
c) Company Sales Executives
d) Any other source
13. Do you collect any information before making purchase?
a) Yes
b) No
14. Have your friends/ relatives opinions influenced you to buy Tikona wireless broadband?
a) Strongly agree
b) Agree
c) Neutral
d) Disagree
e) Strongly disagree
15. Has the advertisement insisted major influence in your buying decision?
a) Strongly agree
b) Agree
c) Neutral
d) Disagree
e) Strongly disagree
16. What are the features you look in a product before making purchase decision?
Give preferences.
a) Brand credibility
b) Price and discount
c) After sales services
d) Value for money
e) Add on features
17. Whom do you consult while buying a wireless internet broadband connection?
a) Friends
b) Relatives
c) Internets
d) Newspaper/ Magazines
e) Any other source
18. Rate the following attributes according to the importance you give while buying a wireless
internet broadband connection?
a) Brand name of the company
b) Net Speed
c) Area wise Connectivity
d) Price of the product
e) Monthly Tariff plans
19. How satisfied are you with Tikona wireless broadband compared with the others
substitutes available in the market?
a) Highly satisfied
b) Satisfied
c) Neutral
d) Dissatisfied
e) Highly dissatisfied
20. How would you rate Tikona Performance as your expectation on 5 points scale?
a) After sales service
b) Maintenance
c) Product as per expectation