A STUDY ON ATTITUDE AND SATISFACTION OF PATIENTS …
12
Nabi et al., IJPSR, 2015; Vol. 6(6): 2557-2568. E-ISSN: 0975-8232; P-ISSN: 2320-5148 International Journal of Pharmaceutical Sciences and Research 2557 IJPSR (2015), Vol. 6, Issue 6 (Research Article) Received on 26 October, 2014; received in revised form, 29 January, 2015; accepted, 21 February, 2015; published 01 June, 2015 A STUDY ON ATTITUDE AND SATISFACTION OF PATIENTS TOWARDS UNANI AND AYURVEDIC HEALTH CARE SERVICE WITHIN MEDICAL PLURALISM IN THE CONTEXT OF BANGLADESH Md. Mustofa Nabi 1 , Mohammad Abu Taher 1 , Hasib Sheikh *1 , Md. Shahinoor Rahman Dulal 2 , Md. Khairul Alam 1 , Mohammad Manirul Islam 3 Faculty of Unani and Ayurvedic Medicine 1 , Hamdard University, Sonargaon, Narayanganj, Bangladesh Production, Routi pharmaceutical (Unani) Ltd. 2 , Dhaka, Bangladesh Government Unani and Ayurvedic medical college 3 , Mirpur-13, Dhaka, Bangladesh ABSTRACT: Unani and Ayurvedic heath care system is considerable areas of medical treatment in Bangladesh where patient can avail it from different Govt. or private hospital. This cross-sectional study was undertaken to find out the satisfaction of patients attending in this health care system from January to April 2014. A total of 240 respondents were interviewed with an interviewer administered semi-structured questionnaire. Among the respondents majority (54.2%) of them was aged ranging from 21- 40 years. The study revealed that more than 71% respondents were married and majority of them (55.4%) have history of use of Unani/Ayurvedic medicine before. The study found that majority (79.6%) of the respondent has found satisfactory and good quality behavior from the doctor of these systems and it was also found that a good number of respondents (more than 80%) commented doctor’s service as satisfactory and good. It was found that more than 80% respondent got satisfactory and good behavior from pharmacist and concerned stuff of the hospital. Regarding health service delivery system of the hospital, majority (77.9%) of the respondents gave opinion as satisfactory and good. It was found that maximum (42.1%) respondents said they will come again for health services here in the hospital if necessity arises and 35.4% were not sure. Although this study did not depict the national scenario, findings will help to formulate comprehensive health programs. INTRODUCTION: The use of Traditional or Unani and Herbal medicines continues to expand globally, in parallel to an increasing acceptance of herbal remedies by consumers. Despite the fact that herbal remedies are not classified as drugs by the US Food and Drug Administration, the 1994 Dietary supplement health and education act allows manufacturers to make claims regarding the benefits on the use of these products 1 . QUICK RESPONSE CODE DOI: 10.13040/IJPSR.0975-8232.6(6).2557-68 Article can be accessed online on: www.ijpsr.com DOI link: http://dx.doi.org/10.13040/IJPSR.0975-8232.6(6).2557-68 Complementary and alternative medicine (CAM) has been defined by the Cochrane Collaboration as “a broad domain of healing resources that encompasses all health systems, modalities and practices and their accompanying theories and beliefs, other than those intrinsic to the politically dominant health system of a particular society or culture in a given historical period” 2 . Complementary and alternative medicine (CAM) is a group of diverse medical and health care systems, therapies, and products that are not presently considered to be part of conventional medicine. The U.S. public’s use of CAM increased substantially during the 1990s. This high rate of use translates into large out-of-pocket expenditures on Keywords: Unani, Ayurvedic, Patient, Health care Correspondence to Author: Hasib Sheikh Lecturer, Faculty of Unani and Ayurvedic Medicine, Hamdard University Bangladesh (HUB), New town, Sonargaon, Narayanganj, Bangladesh E-mail: [email protected]
Transcript of A STUDY ON ATTITUDE AND SATISFACTION OF PATIENTS …

Nabi et al., IJPSR, 2015; Vol. 6(6): 2557-2568. E-ISSN: 0975-8232; P-ISSN: 2320-5148
International Journal of Pharmaceutical Sciences and Research 2557
IJPSR (2015), Vol. 6, Issue 6 (Research Article)
Received on 26 October, 2014; received in revised form, 29 January, 2015; accepted, 21 February, 2015; published 01 June, 2015
A STUDY ON ATTITUDE AND SATISFACTION OF PATIENTS TOWARDS UNANI AND
AYURVEDIC HEALTH CARE SERVICE WITHIN MEDICAL PLURALISM IN THE CONTEXT
OF BANGLADESH
Md. Mustofa Nabi 1, Mohammad Abu Taher
1, Hasib Sheikh
*1, Md. Shahinoor Rahman Dulal
2, Md.
Khairul Alam1, Mohammad Manirul Islam
3
Faculty of Unani and Ayurvedic Medicine 1, Hamdard University, Sonargaon, Narayanganj, Bangladesh
Production, Routi pharmaceutical (Unani) Ltd. 2, Dhaka, Bangladesh
Government Unani and Ayurvedic medical college 3, Mirpur-13, Dhaka, Bangladesh
ABSTRACT: Unani and Ayurvedic heath care system is considerable areas of medical
treatment in Bangladesh where patient can avail it from different Govt. or private
hospital. This cross-sectional study was undertaken to find out the satisfaction of patients
attending in this health care system from January to April 2014. A total of 240
respondents were interviewed with an interviewer administered semi-structured
questionnaire. Among the respondents majority (54.2%) of them was aged ranging from
21- 40 years. The study revealed that more than 71% respondents were married and
majority of them (55.4%) have history of use of Unani/Ayurvedic medicine before. The
study found that majority (79.6%) of the respondent has found satisfactory and good
quality behavior from the doctor of these systems and it was also found that a good
number of respondents (more than 80%) commented doctor’s service as satisfactory and
good. It was found that more than 80% respondent got satisfactory and good behavior
from pharmacist and concerned stuff of the hospital. Regarding health service delivery
system of the hospital, majority (77.9%) of the respondents gave opinion as satisfactory
and good. It was found that maximum (42.1%) respondents said they will come again for
health services here in the hospital if necessity arises and 35.4% were not sure. Although
this study did not depict the national scenario, findings will help to formulate
comprehensive health programs.
INTRODUCTION: The use of Traditional or
Unani and Herbal medicines continues to expand
globally, in parallel to an increasing acceptance of
herbal remedies by consumers. Despite the fact that
herbal remedies are not classified as drugs by the
US Food and Drug Administration, the 1994
Dietary supplement health and education act allows
manufacturers to make claims regarding the
benefits on the use of these products 1.
QUICK RESPONSE CODE
DOI: 10.13040/IJPSR.0975-8232.6(6).2557-68
Article can be accessed online on: www.ijpsr.com
DOI link: http://dx.doi.org/10.13040/IJPSR.0975-8232.6(6).2557-68
Complementary and alternative medicine (CAM)
has been defined by the Cochrane Collaboration as
“a broad domain of healing resources that
encompasses all health systems, modalities and
practices and their accompanying theories and
beliefs, other than those intrinsic to the politically
dominant health system of a particular society or
culture in a given historical period” 2.
Complementary and alternative medicine (CAM) is
a group of diverse medical and health care systems,
therapies, and products that are not presently
considered to be part of conventional medicine.
The U.S. public’s use of CAM increased
substantially during the 1990s. This high rate of use
translates into large out-of-pocket expenditures on
Keywords:
Unani, Ayurvedic, Patient, Health care
Correspondence to Author:
Hasib Sheikh
Lecturer, Faculty of Unani and
Ayurvedic Medicine, Hamdard
University Bangladesh (HUB), New
town, Sonargaon, Narayanganj,
Bangladesh
E-mail: [email protected]
Nabi et al., IJPSR, 2015; Vol. 6(6): 2557-2568. E-ISSN: 0975-8232; P-ISSN: 2320-5148
International Journal of Pharmaceutical Sciences and Research 2558
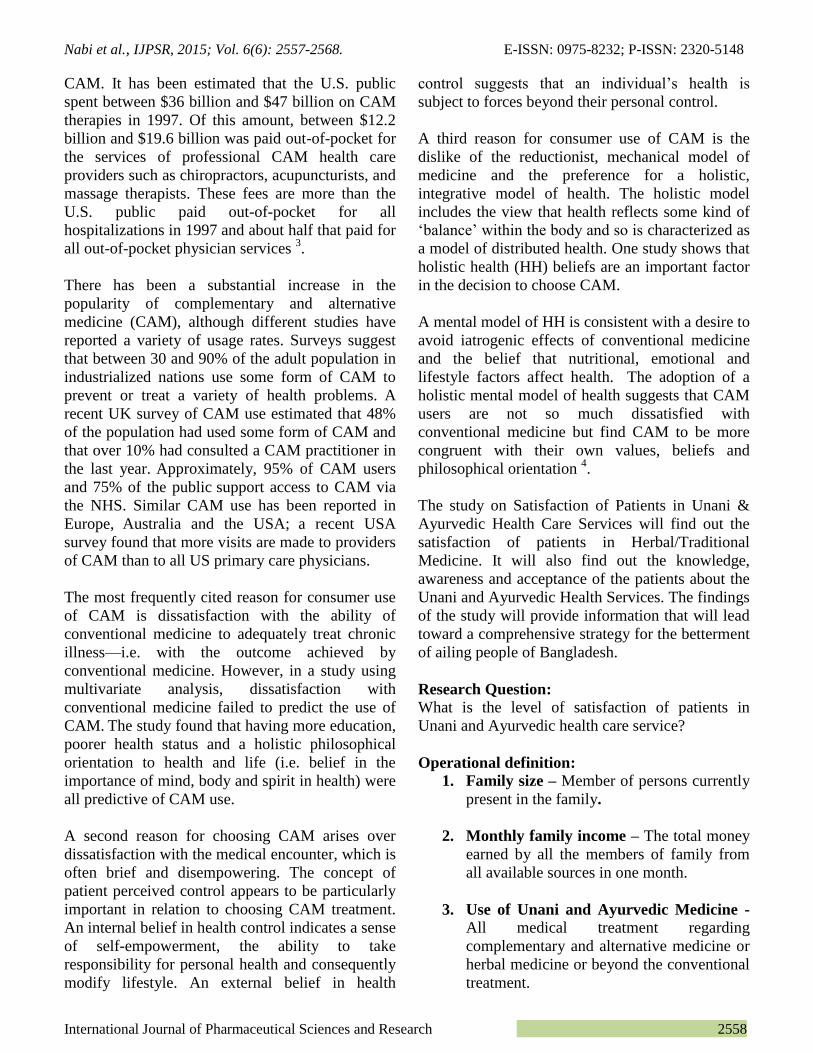
CAM. It has been estimated that the U.S. public
spent between $36 billion and $47 billion on CAM
therapies in 1997. Of this amount, between $12.2
billion and $19.6 billion was paid out-of-pocket for
the services of professional CAM health care
providers such as chiropractors, acupuncturists, and
massage therapists. These fees are more than the
U.S. public paid out-of-pocket for all
hospitalizations in 1997 and about half that paid for
all out-of-pocket physician services 3.
There has been a substantial increase in the
popularity of complementary and alternative
medicine (CAM), although different studies have
reported a variety of usage rates. Surveys suggest
that between 30 and 90% of the adult population in
industrialized nations use some form of CAM to
prevent or treat a variety of health problems. A
recent UK survey of CAM use estimated that 48%
of the population had used some form of CAM and
that over 10% had consulted a CAM practitioner in
the last year. Approximately, 95% of CAM users
and 75% of the public support access to CAM via
the NHS. Similar CAM use has been reported in
Europe,
Australia and the USA;
a recent USA
survey found that more visits are made to providers
of CAM than to all US primary care physicians.
The most frequently cited reason for consumer use
of CAM is dissatisfaction with the ability of
conventional medicine to adequately treat chronic
illness—i.e. with the outcome achieved by
conventional medicine. However, in a study using
multivariate analysis, dissatisfaction with
conventional medicine failed to predict the use of
CAM. The study found that having more education,
poorer health status and a holistic philosophical
orientation to health and life (i.e. belief in the
importance of mind, body and spirit in health) were
all predictive of CAM use.
A second reason for choosing CAM arises over
dissatisfaction with the medical encounter, which is
often brief and disempowering. The concept of
patient perceived control appears to be particularly
important in relation to choosing CAM treatment.
An internal belief in health control indicates a sense
of self-empowerment, the ability to take
responsibility for personal health and consequently
modify lifestyle. An external belief in health
control suggests that an individual’s health is
subject to forces beyond their personal control.
A third reason for consumer use of CAM is the
dislike of the reductionist, mechanical model of
medicine and the preference for a holistic,
integrative model of health. The holistic model
includes the view that health reflects some kind of
‘balance’ within the body and so is characterized as
a model of distributed health. One study shows that
holistic health (HH) beliefs are an important factor
in the decision to choose CAM.
A mental model of HH is consistent with a desire to
avoid iatrogenic effects of conventional medicine
and the belief that nutritional, emotional and
lifestyle factors affect health. The adoption of a
holistic mental model of health suggests that CAM
users are not so much dissatisfied with
conventional medicine but find CAM to be more
congruent with their own values, beliefs and
philosophical orientation 4.
The study on Satisfaction of Patients in Unani &
Ayurvedic Health Care Services will find out the
satisfaction of patients in Herbal/Traditional
Medicine. It will also find out the knowledge,
awareness and acceptance of the patients about the
Unani and Ayurvedic Health Services. The findings
of the study will provide information that will lead
toward a comprehensive strategy for the betterment
of ailing people of Bangladesh.
Research Question:
What is the level of satisfaction of patients in
Unani and Ayurvedic health care service?
Operational definition:
1. Family size – Member of persons currently
present in the family.
2. Monthly family income – The total money
earned by all the members of family from
all available sources in one month.
3. Use of Unani and Ayurvedic Medicine -
All medical treatment regarding
complementary and alternative medicine or
herbal medicine or beyond the conventional
treatment.

Nabi et al., IJPSR, 2015; Vol. 6(6): 2557-2568. E-ISSN: 0975-8232; P-ISSN: 2320-5148
International Journal of Pharmaceutical Sciences and Research 2559
4. Knowledge on patient cure – Information
about incidence or patient cure who have
taken treatment from the hospital.
5. Visit frequency - How many time the
patients come here for treatment.
6. Behavior - The health personnel of the
hospital who give medical treatment to the
patients at this hospital and behavior of
pharmacist and stuffs of the hospital.
7. Clinical Examination - All investigations
need to diagnose diseases.
8. Oral advice – The advices given by the
health personnel of the hospital.
9. Opinion – The opinions given by the
respondents on services provided by the
doctor of the hospital and health service
delivery system of the hospital.
10. Medicines – The medicines advised by the
doctor for the patients at hospital.
Research Methodology:
Socio-demographic variables:
Age, Sex, Religion, Marital Status
Socio-economic and cultural variables:
Monthly family income, Occupation, Family Size,
Education, Housing Condition.
Knowledge & Awareness related variables:
Knowledge about Unani & Ayurvedic Treatment,
Awareness about Unani & Ayurvedic Treatment.
Health Service related variables:
Behavior and attention of the Doctors, Physical
examinations and verbal advices by the Doctors,
Availability of prescribed medicines, Service
provided by the Doctors, Patient’s satisfaction.
FIG.1: CONCEPTUAL FRAME WORK

Nabi et al., IJPSR, 2015; Vol. 6(6): 2557-2568. E-ISSN: 0975-8232; P-ISSN: 2320-5148
International Journal of Pharmaceutical Sciences and Research 2560
Objectives of the study:
To assess the level of satisfaction of patients of
Unani and Ayurvedic Health Care Service.
1. To identify the socio-demographic, socio-
economic and socio-cultural characteristics
of patients of Unani and Ayurvedic Health
Care Service.
2. To find out the knowledge and awareness of
the patients about the Unani and Ayurvedic
Health Care Service.
3. To explore patient’s acceptance of the
Unani and Ayurvedic Health Care Service.
Study Design: It was a cross-sectional study.
Study Population: Patients attending in Out
Patient Department (OPD) at Govt. Unani and
Ayurvedic Medical College Hospital.
Study Area:
This study was conducted at OPD of Govt. Unani
and Ayurvedic Medical College Hospital at
Mirpur-13, Dhaka which lies about 6 kilometers
away from ZERO point of Dhaka.
Study Period:
The duration of the study was four months and
conducted from January to April, 2010.
Inclusion Criteria:
Informed consent and voluntary participant for
interview. Patient attending at OPD of Hospital
Exclusion Criteria:
Patients below 16 years of age, Patient who are
mentally disturbed, Patients not cooperating.
RESULTS: TABLE: 1: DISTRIBUTION OF THE RESPONDENTS BY AGE AND SEX
Variables Frequency (n=240) Percentage (%)
Age distribution
16 to 20 years 36 15.0
21-25 years 31 12.9
26-30 years 45 18.8
31-35 years 23 9.6
36-40 years 31 12.9
41-45 years 29 12.1
46 -50 years 26 10.8
51 years and above 19 7.9
Sex distribution
Male 102 42.5
Female 138 57.5
Table 1 shows that the respondents were divided in
to 8 groups. Among them 45 (18.8%) was in 26-30
years group, showing the highest percentage.
Followed by 36 (15%) was in up to 20 years group,
31 (12.9%) was in both 21-25 and 36-40 years
group, 29 (12.1%) was in 41-45 years group, 26
(10.8%) wan in 46-50 years group, 23 (9.6%) was
in 31-35 years group and 19 (7.9%) was in 51 years
above group showing the lowest percentage.
It was found that 138 (57.5%) respondents were
female and 102 (42.5%) was male.
TABLE 2: DISTRIBUTION OF THE RESPONDENTS BY RELIGION, MARITAL STATUS AND EDUCATIONAL
QUALIFICATION
Variables Frequency (n=240) Percentage (%)
Religion distribution Islam 220 91.7
Hindu 17 7.1
Others 3 1.3
Marital status distribution Married 171 71.3
Nabi et al., IJPSR, 2015; Vol. 6(6): 2557-2568. E-ISSN: 0975-8232; P-ISSN: 2320-5148
International Journal of Pharmaceutical Sciences and Research 2561
Unmarried 69 28.8
Education distribution
Illiterate 70 29.2
Primary 80 33.3
Secondary 42 17.5
Higher Secondary 30 12.5
Graduate/ above 18 7.5
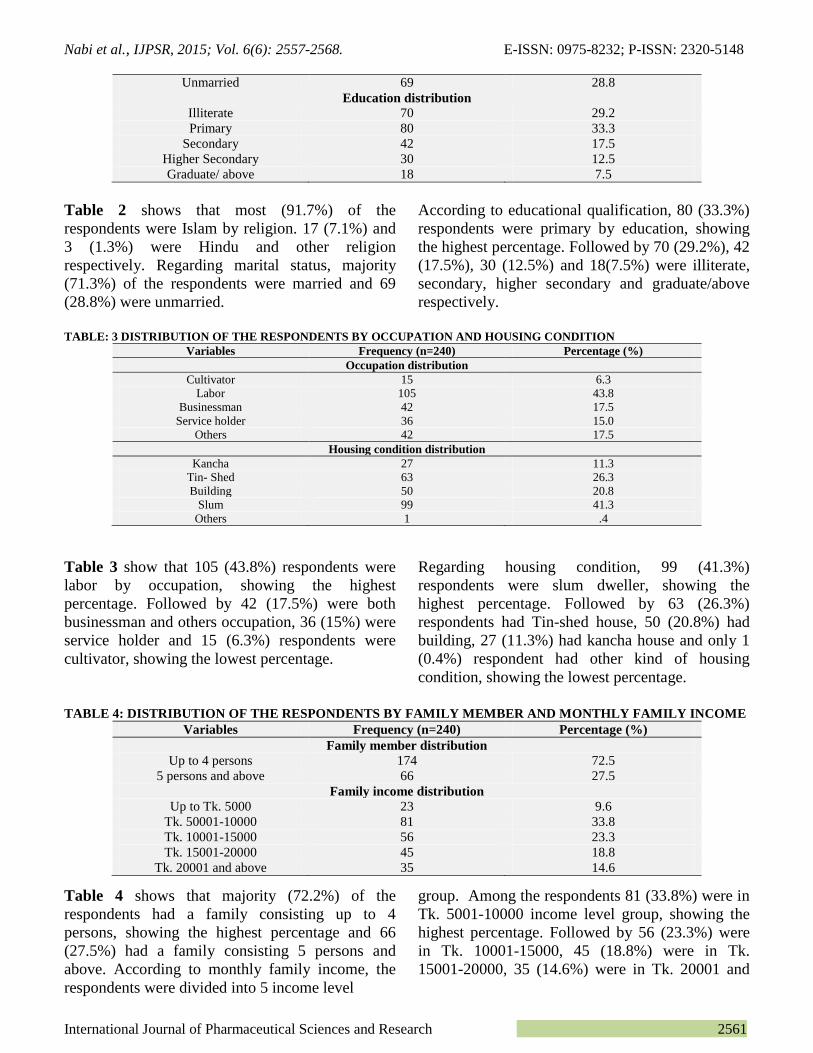
Table 2 shows that most (91.7%) of the
respondents were Islam by religion. 17 (7.1%) and
3 (1.3%) were Hindu and other religion
respectively. Regarding marital status, majority
(71.3%) of the respondents were married and 69
(28.8%) were unmarried.
According to educational qualification, 80 (33.3%)
respondents were primary by education, showing
the highest percentage. Followed by 70 (29.2%), 42
(17.5%), 30 (12.5%) and 18(7.5%) were illiterate,
secondary, higher secondary and graduate/above
respectively.
TABLE: 3 DISTRIBUTION OF THE RESPONDENTS BY OCCUPATION AND HOUSING CONDITION
Variables Frequency (n=240) Percentage (%)
Occupation distribution
Cultivator 15 6.3
Labor 105 43.8
Businessman 42 17.5
Service holder 36 15.0
Others 42 17.5
Housing condition distribution
Kancha 27 11.3
Tin- Shed 63 26.3
Building 50 20.8
Slum 99 41.3
Others 1 .4
Table 3 show that 105 (43.8%) respondents were
labor by occupation, showing the highest
percentage. Followed by 42 (17.5%) were both
businessman and others occupation, 36 (15%) were
service holder and 15 (6.3%) respondents were
cultivator, showing the lowest percentage.
Regarding housing condition, 99 (41.3%)
respondents were slum dweller, showing the
highest percentage. Followed by 63 (26.3%)
respondents had Tin-shed house, 50 (20.8%) had
building, 27 (11.3%) had kancha house and only 1
(0.4%) respondent had other kind of housing
condition, showing the lowest percentage.
TABLE 4: DISTRIBUTION OF THE RESPONDENTS BY FAMILY MEMBER AND MONTHLY FAMILY INCOME
Variables Frequency (n=240) Percentage (%)
Family member distribution Up to 4 persons 174 72.5
5 persons and above 66 27.5
Family income distribution Up to Tk. 5000 23 9.6
Tk. 50001-10000 81 33.8
Tk. 10001-15000 56 23.3
Tk. 15001-20000 45 18.8
Tk. 20001 and above 35 14.6
Table 4 shows that majority (72.2%) of the
respondents had a family consisting up to 4
persons, showing the highest percentage and 66
(27.5%) had a family consisting 5 persons and
above. According to monthly family income, the
respondents were divided into 5 income level
group. Among the respondents 81 (33.8%) were in
Tk. 5001-10000 income level group, showing the
highest percentage. Followed by 56 (23.3%) were
in Tk. 10001-15000, 45 (18.8%) were in Tk.
15001-20000, 35 (14.6%) were in Tk. 20001 and

Nabi et al., IJPSR, 2015; Vol. 6(6): 2557-2568. E-ISSN: 0975-8232; P-ISSN: 2320-5148
International Journal of Pharmaceutical Sciences and Research 2562
above and 23 (9.6%) respondents were in Tk. Up to 5000, showing the lowest percentage.
TABLE 5: DISTRIBUTION OF THE RESPONDENTS BY USE OF UNANI AND AYURVEDIC MEDICINE,
KNOWLEDGE ON PATIENT CURE AND MODE OF HOSPITAL VISIT
Variables Frequency (n=240) Percentage (%)
Use of U/A Medicine distribution Yes 133 55.4
No 107 44.6
Knowledge on patient cure distribution Yes 206 85.8
No 34 14.2
Mode of hospital visit distribution 1st time 111 46.3
2nd time 57 23.8
3rd time or above 72 30.0
Table 5 shows that majority (55.4%) of the
respondents were user of Unani and Ayurvedic
Medicine and 107 (44.6%) were not user of such
medicine. Regarding patient cure incidents of
Unani and Ayurvedic Medicine, most (85.8%) of
the respondents said they are informed about
patients cure incident and 107 (14.2%) respondents
were not informed about such patients care
incident.
It was found that 111 (46.8%) respondents visited
the hospital as 1st time, showing the highest
percentage. Followed by 72 (30.0%) visited as 3rd
time and above and 57 (23.8%) respondents visited
the hospital as 2nd
time, showing the lowest
percentage.
TABLE: 6 DISTRIBUTION OF THE RESPONDENTS BY DOCTOR BEHAVIOR, CLINICAL EXAMINATION AND
VERBAL ADVICE DISTRIBUTION
Variables Frequency (n=240) Percentage (%)
Doctor behavior distribution Very good 1 .4
Good 99 41.3
Satisfactory 92 38.3
Not Satisfactory 39 16.3
Not good 9 3.8
Clinical examination distribution Yes 29 12.1
No 211 87.9
Oral advice distribution Yes 95 39.6
No 145 60.4
Table 6 shows that 99 (41.3%) respondent
commented doctor behavior as good, showing the
highest percentage. Followed by 92 (38.3%)
commented as satisfactory, 39 (16.3%) commented
as not satisfactory, 9 (3.8%) commented as not
good and only 0.4% commented as very good,
showing the lowest percentage.
Regarding clinical examination, most (87.9%) of
the respondents did not have any clinical
examination during their treatment and 29 (12.1%)
respondent had clinical examination. It was found
that majority (60.4%) of the respondent got oral
advice during their treatment and 95 (39.6%) did
not get any oral advice.
TABLE 7: DISTRIBUTION OF THE RESPONDENTS BY OPINION ON DOCTOR’S SERVICE AND
AVAILABILITY OF ADVISED MEDICINE.
Variables Frequency (n=240) Percentage (%)
Opinion on doctor’s service distribution Very good 3 1.3

Nabi et al., IJPSR, 2015; Vol. 6(6): 2557-2568. E-ISSN: 0975-8232; P-ISSN: 2320-5148
International Journal of Pharmaceutical Sciences and Research 2563
Good 94 39.2
Satisfactory 100 41.7
Not Satisfactory 36 15.0
Not good 7 2.9
Availability of advised medicine distribution
Yes 25 10.4
Partially Available 150 62.5
No 65 27.1
Table 7 shows that100 (41.7%) respondents
commented doctor advice as satisfactory, showing
the highest percentage. Followed by 94 (39.2%)
commented as good, 36 (15.0%) commented as not
satisfactory, 7 (2.9%) commented as not good and
only 3 (1.3%) respondents commented doctor
advice as very good , showing the lowest
percentage.
Regarding availability of advised medicine in the
hospital, majority (62.5%) of the respondents said
advised medicine was partially available, showing
the highest percentage. Followed by 65 (27.1%)
said not available and 25 (10.4%) respondent said
advised medicine was available at hospital during
their treatment.
TABLE 8: DISTRIBUTION OF THE RESPONDENTS BY BEHAVIOR OF PHARMACIST AND BEHAVIOR OF
OTHER STUFFS
Variables Frequency (n=240) Percentage (%)
Behavior of pharmacist distribution Very good 3 1.3
Good 70 29.2
Satisfactory 121 50.4
Not Satisfactory 40 16.7
Not good 6 2.5
Behavior of other stuffs distribution
Very good 5 2.1
Good 114 47.5
Satisfactory 83 34.6
Not Satisfactory 32 13.3
Not good 6 2.5
Table 8 shows that more than fifty percent (50.4%)
respondents commented pharmacist behavior as
satisfactory, showing the highest percentage.
Followed by 70 (29.2%) commented as good, 40
(16.7%) commented as not satisfactory, 6 (2.5%)
commented as not good and only 3 (1.3%)
respondents commented pharmacist behavior as
very good , showing the lowest percentage.
It was found that114 (47.5%) respondents
commented behavior of others stuffs as good,
showing the highest percentage. Followed by 83
(34.6%) commented as satisfactory, 32 (13.3%)
commented as not satisfactory, 6 (2.5%)
commented as not good and only 5 (2.1%)
respondents commented behavior of others stuffs as
very good , showing the lowest percentage.
TABLE 9: DISTRIBUTION OF THE RESPONDENTS BY OPINION ON HEALTH SERVICE DELIVERY, PERCEPTION
ABOUT PRIVATE TREATMENT WOULD BE BETTER AND COME AGAIN HERE IF NECESSARY
Variables Frequency (n=240) Percentage (%)
Opinion on heath service delivery distribution Very good 5 2.1
Good 86 35.8
Satisfactory 101 42.1
Not Satisfactory 40 16.7
Not good 8 3.3
Perception about private treatment would be better distribution Yes 101 42.1
No 50 20.8

Nabi et al., IJPSR, 2015; Vol. 6(6): 2557-2568. E-ISSN: 0975-8232; P-ISSN: 2320-5148
International Journal of Pharmaceutical Sciences and Research 2564
Not sure 89 37.1
Come again for health services if necessary distribution Yes 101 42.1
No 54 22.5
Not sure 85 35.4
Table 9 shows that 101 (42.1%) respondents
commented health service delivery of the hospital
as satisfactory, showing the highest percentage.
Followed by 86 (35.8%) commented as good, 40
(16.7%) commented as not satisfactory, 8 (3.3%)
commented as not good and only 5 (2.1%)
respondents commented health service delivery of
the hospital as very good , showing the lowest
percentage. It was found that maximum (42.1%)
respondents said private medical treatment would
be better than government hospital. Among them
89 (37.1%) were not sure and 50 (20.8%) did not
agree with the statement It was also found that
maximum (42.1%) respondents said they will come
again for health services if necessary. Among them
85 (35.4%) were not sure and 54 (22.5%) said they
will not agree with the statement come again for
health services if necessary.
TABLE: 10 ASSOCIATION BETWEEN SEX AND USE OF UNANI AND AYURVEDIC MEDICINE
Variables Use of Unani and Ayurvedic Medicine p-value*
Yes No Total
No. % No. % No. %**
Sex 0.354
Male 53 39.8 49 45.8 102 42.5
Female 80 60.2 58 54.2 138 57.5
*p value from Chi square test
**Percentage shows the column percent
Table 10 shows that ‘use of Unani and Ayurvedic
medicine’ was found high among female
respondents and it was 60.2% and 39.8%
respondents were male. The p value was found
0.354 and it was not statistically significant.
TABLE 11: ASSOCIATION BETWEEN EDUCATION AND USE OF UNANI AND AYURVEDIC MEDICINE Variables Use of Unani and Ayurvedic Medicine p-value*
Yes No Total
No. % No. % No. %**
Education 0.000
Illiterate 63 47.4 7 6.5 70 29.2
Educated 70 52.6 100 93.5 170 70.8
*p value from Chi square test
**Percentage shows the column percent
Table15 shows that ‘use of Unani and Ayurvedic
medicine’ was found high among educated
respondents and it was 52.6% and 47.4%
respondents were illiterate. The p value was found
0.00 and it was statistically significant.
TABLE: 12: ASSOCIATION BETWEEN EDUCATION AND FREQUENCY OF HOSPITAL VISIT
Variables Frequency of hospital visit p-value*
1st time More than one time Total
No. % No. % No. %**
Education 0.000
Illiterate 9 8.1 61 47.3 70 29.2
Educated 102 91.9 68 52.7 170 70.8
*p value from Chi square test
**Percentage shows the column percent

Nabi et al., IJPSR, 2015; Vol. 6(6): 2557-2568. E-ISSN: 0975-8232; P-ISSN: 2320-5148
International Journal of Pharmaceutical Sciences and Research 2565
Table 16 shows that ‘frequency of hospital visit’
was found high among educated respondents and it
was 91.9% and 8.1% respondents were illiterate.
The p value was found 0.00 and it was statistically
significant.
TABLE 13: ASSOCIATION BETWEEN EDUCATION AND OPINION ON HEALTH SERVICES
Variables Opinion on health services p-value*
Satisfactory Not satisfactory Total
No. % No. % No. %**
Education 0.033
Illiterate 62 32.3 8 16.7 70 29.2
Educated 130 67.7 41 83.3 170 70.8
*p value from Chi square test
**Percentage shows the column percent
Table18 shows that ‘satisfactory opinion on health
services’ was found high among educated
respondents and it was 67.7% and 32.3%
respondents were illiterate. The p value was found
0.033 and it was statistically significant.
TABLE 14: ASSOCIATION BETWEEN EDUCATION AND COME AGAIN FOR HEALTH SERVICES IF
NECESSARY
Variables Come again for health services if necessary p-value*
Yes No Total
No. % No. % No. %**
Education 0.000
Illiterate 48 47.5 22 15.8 70 29.2
Educated 53 52.5 117 84.2 170 70.8
*p value from Chi square test
**Percentage shows the column percent
Table19 shows that ‘come again for health services
if necessary’ was found high among educated
respondents and it was 52.5% and 47.5%
respondents were illiterate. The p value was found
0.000 and it was statistically significant.
TABLE 15: ASSOCIATION BETWEEN CLINICAL EXAMINATION AND COME AGAIN FOR HEALTH SERVICES IF
NECESSARY
Variables Come again for health services if necessary p-value*
Yes No Total
No. % No. % No. %**
Clinical Examination 0.002
Yes 20 19.8 9 6.5 29 12.1
No 81 80.2 130 93.5 211 87.9
*p value from Chi square test
**Percentage shows the column percent
Table 21 shows that ‘come again for health
services if necessary’ was found high among the
respondents who did not face any clinical
examination and it was 80.2% and 19.8%
respondents faced clinical examination. The p
value was found 0.002 and it was statistically
significant.
TABLE: 16 ASSOCIATION BETWEEN VERBAL ADVICE AND COME AGAIN FOR HEALTH SERVICES IF NECESSARY
Variables Come again for health services if necessary p-value*
Yes No Total
No. % No. % No. %**
Oral advice 0.000
Yes 55 54.5 40 28.8 95 39.6
No 46 45.5 71 71.2 145 60.4
*p value from Chi square test
**Percentage shows the column percent

Nabi et al., IJPSR, 2015; Vol. 6(6): 2557-2568. E-ISSN: 0975-8232; P-ISSN: 2320-5148
International Journal of Pharmaceutical Sciences and Research 2566
Table 23 shows that ‘come again for health
services if necessary’ was found high among the
respondents who got oral advice and it was 54.5%
and 45.5% respondents din not get oral advice. The
p value was found 0.000 and it was statistically
significant.
DISCUSSION: Regarding age of the respondents,
present study found that the majority of them
(18.8%) were between 26-30 years old. On the
other hand 9.6% were between 31-35 years and
12.9% were between 36-40 years old. It seems that
more than 20% respondents of present study belong
to age limit 31-40 years and more than 18% were
46 years and above (Table 1). Al-Faris et al 5 found
that the mean (±) age of the respondents was 35.5
(±13.9) years and Chan et al 6 found that 24% of
the sample was noted for being older which is
consistent with the present study.
Present study revealed that 42.5% respondent were
men (Table 1). Al-Faris et al 5 found that 39%
were men which is consistent with the present
study.
Regarding use of Unani/Ayurvedic/Complementary
and Alternative Medicine, present study revealed
that 55.4% respondent has used such type of
medicine in the past (Table 5). Evans et al 7 found
that 91% had used herbal medicine, Lam et al 8
found that 57.1% used Chinese medicine/herbal
medicine, Kessler et al 9 found that 67.6% of
respondents had used Complementary and
Alternative Medicine, Hanssen et al 10
found that
49% had used herbal medicine, Araz et al 11
found
that 58.6% had used alternative medicine, Langlois
et al 12
found that 63.5% of AIDS patients had used
herbal medicine after HIV diagnosis, Lim et al13
found that 76% had used alternative Medicine, Joos
et al14
found that 52 % patients use complementary
and alternative medicine, Hooper et al 15
found that
82.5% respondents had use herbal medicine,
Oldendic et al 16
found that 44% had used
complementary and alternative medicine, Bames et
al17
found that 69% respondents had use alternative
medicine, which are consistent with the present
study.
The present study found that 85.8% respondent
knew that patients get rid of disease after receiving
treatment from the hospital where study took place
(Table 5). A Population-Based Survey of
Complementary and Alternative Medicine Usage,
Patient Satisfaction, and Physician Involvement 18
found that more than 60% perceived alternative
medicine therapy as very effective, and 89% said
they would recommend it to others which are
consistent with present study.
Regarding significant association (p<0.05) between
education and use of herbal medicine, present study
found that educated respondents are found as
bigger user of herbal medicine than illiterate
respondents (Table 15). A Population-Based
Survey of Complementary and Alternative
Medicine Usage, Patient Satisfaction, and
Physician Involvement18
found that higher
education were significantly associated with
complementary and alternative medicine use which
is consistent with the present study.
It was found that more than 45% respondents
visited the hospital as 1st time (Table 5). It
indicates that people are feeling interest and
moving towards alternative medicine or Unani and
Ayurvedic health care services.
Regarding doctor behavior, more than 40%
respondent commented as good behavior and
38.3% commented as satisfactory. It shows a
positive sign towards heath care providers of our
country.
Regarding clinical examination, most (87.9%) of
the respondents did not have any clinical
examination during their treatment (Table 6). It
indicates that doctors of alternative medicine try to
avoid clinical examination.
Present study found that more than 40%
respondents were satisfied with doctor service and
39.2% commented service as good advice (Table
7). It indicates that doctors of the hospital try to
give optimum service to all patients which lead sick
people towards satisfaction.
Regarding availability of advised medicine in the
hospital, more than 62% respondents got partially
(Table 8) which indicates that govt. hospital can’t
supply all item of advised medicine to patients.

Nabi et al., IJPSR, 2015; Vol. 6(6): 2557-2568. E-ISSN: 0975-8232; P-ISSN: 2320-5148
International Journal of Pharmaceutical Sciences and Research 2567
Present study revealed that more than 42%
respondents found satisfactory health service
delivery system and 35.8% commented as good
health service delivery system (Table 9). It
indicates disciplined management prevails here in
the hospital. It was found that maximum
respondents answered that private medical
treatment would be better than government hospital
(Table 9). It indicates that doctor gives more
attention to patient at their private chamber.
It was also found that maximum (42.1%)
respondents said they will come again for health
care services here in the hospital if necessary arises
and 35.4% were not sure (Table 9). It indicates that
majority of the respondents confirmed to have
repeated treatment from the hospital and showing
interest to alternative medicine as well. It also
indicates the increased level of satisfaction of the
patients.
CONCLUSION AND RECOMMENDATIONS: On the basis of significant findings in the study, an
array of concluding remarks is attempted. It was
found that most of them (>70%: Table 2) were
educated and majority of them (55.4%: Table 5)
used the Unani and Ayurvedic/Alternative/
Complimentary/ Herbal system of medicines
before. The study revealed that majority of the
respondents has found satisfactory (38.3%: Table
6) and good (41.3%: Table 6) quality of behavior
from the doctors and it was also revealed that
majority of them commented the doctors service as
satisfactory (41.7%: Table 7) and 39.2% (Table 7)
as good. Majority of the respondents commented
the behavior of the pharmacists as good (50.4%:
Table 8) and other stuffs as good (47.5%: Table 8).
Regarding the health service delivery system of the
hospital, majority of the respondents gave opinion
as satisfactory (42.1%: Table 9) and as good
(35.8%: Table 9). It was revealed that the majority
of the respondents (42.1%: Table 9) said that they
will come again for health services here in the
hospital if necessity arises and 35.4% (Table 9)
were not sure. It is expected that information
provided by this study will help health policy
makers and planners to formulate proper plan for
the improvement of Unani and Ayurvedic Health
care in Bangladesh.
RECOMMENDATIONS: This study suggests the
following recommendations for the betterment of
Alternative/Herbal Medicine. Unani and
Ayurvedic/Alternative/Herbal Medicine should be
available at every govt. hospital as the present
study reveals that the majority of the respondents
are satisfied with such Health Care Services.
A nation-wide study should be conducted to collect
specified data on patient satisfaction in
Traditional/Herbal medicine on the basis of which
necessary health and welfare programs can be
prepared. Necessary development program should
be taken to maximize service delivery system as
majority respondents found satisfactory services.
Sufficient in-depth study should be organized to
provide a real insight into the Traditional/Herbal
medicine to allow a meaningful program
development.
REFERENCES:
1. Fahmy SA, Abu S, Khair MA. Pharmacists’ attitude,
perceptions and knowledge towards the use of herbal
products in Abu Dhabi, United Arab Emirates. Pharmacy
Practice 2010; vol. 8 (2): 109-115.
2. Shankar PR, Subish P, Das B, Dubey AK, Upadhyay DK.
Student attitude towards integrative medicine in a medical
college in Western Nepal: a questionnaire-based study .
The online journal for the American Association of
Integrated Medicine 2006.
3. Patricia M. Barnes M.A., Eve PG, Kim MF, Richard LN.
Complementary and Alternative Medicine Use among
Adults: United States 2002. Advance Data, May 2004, no.
343.
4. Hyland ME, Lewith GT, Westoby C. Developing a
measure of attitudes: the holistic complementary and
alternative medicine questionnaire. Complementary
Therapies in Medicine 2003; Vol. 11:33-38.
5. Al-Faris EA, Al-Roais N, Mohamed AG, Al-Rukban MO,
Al-Kurdi A, Al-Noor MAB, Al-Harby S, Sheikh A.
Prevalence and Pattern of Alternative Medicine use: The
results of a household survey 2008; Vol. 28(1):4-10.
6. Chan MF, Mok E, Wong YS, Tong TF, Day MC, Tang
CK, Wong DH. Attitudes of Hong Kong Chinese to
traditional Chinese medicine and Western medicine:
survey and cluster analysis. Complement therapy Medicine
Jun 2003; 11(2):103-9.
7. Evans A, Duncan B, McHug P, Shaw J, Wilson C.
Inpatients’ use, understanding, and attitudes towards
traditional, complementary and alternative therapies at a
provincial. New Zealand hospital. Journal of the
Newzeland Medical Association 2008; Vol. 121 (1278).
8. Lam YC, Cheng CW, Peng H, Law CK, Huang X, Bian Z.
Cancer patients' attitudes towards Chinese medicine: a
Hong Kong survey. Chinese Medicine 2009; Vol. 4:25.
9. Kessler RC, Davis RB, Foster D, Rompay MV, Walters
EE, Wilkey SA, Kaptchuk TJ, Eisenberg DM. Long-Term
Trends in the Use of Complementary and Alternative

Nabi et al., IJPSR, 2015; Vol. 6(6): 2557-2568. E-ISSN: 0975-8232; P-ISSN: 2320-5148
International Journal of Pharmaceutical Sciences and Research 2568
Medical Therapies in the United States. Academia and
Clinics.
10. Hanssen B, Grimsgaard S, Launs L, Fonnebo V,
Falkenbergo T, Rasmussen NKR. Use of complementary
and alternative medicine in the scandinavian countries
2005; Vol. 23 (1): 57-62.
11. Araz N, Bulbul S. Use of complementary and alternative
medicine in a pediatric population in southern Turkey.
Clin Invest Med 2011; 34 (1): E21-E29.
12. Langlois-Klasssen D, Kipp W, Jhangri GS, Tubaale T. Use
of traditional herbal medicine by AIDS patients in
Kabarole District, western Uganda. The American Journal
Of ‘Tropical Meidicine and Hygiene Oct 2007; Vol.
77(4):757-63.
13. Lim MK, Sadarangani P. Chan HL, Heng JY.
Complementary and alternative medicine use in multiracial
Singapore. Complementary Therapies in Medicine. Vol.
13(1):16-24.
14. Joos W, Rosemann T, Szecsenyi J, Hahn EG, Willich S,
Brinkhaus B. Use of complementary and alternative
mediciene in Germany –A Survey of Patients with
inflammatory bowel disease. BMC Complementary and
Alternative Medicine 2006; Vol 6:19.
15. Hooper KD, Pender MP, Webb PM, McCombe PA. Use of
Traditional and Complementary Medical Care by Patients
with Multiple Sclerosis in South – East Queensland.
International Journal of MS Care 2001; Vol. 3(1).
16. Oldendic R, Coker AL, Wieland D, Raymond JI, Probst
JC, Schell BJ, Stoskopf CH. Population-based survey of
complementary and alternative medicine usage, patient
satisfaction, and physician involvement. Southern Medical
Journal 2000; Vol.93 (4):375-381.
17. Trangmar P, Diaz VA. Investigating Complementary and
Alternative Medicine Use in a Spanish-Speaking Hispanic
Community in South Carolina. Annals of Family Medicine
2008; Vol.6:S12-S15.
18. Population-Based Survey of Complementary and
Alternative Medicine Usage, Patient Satisfaction, and
Physician Involvement. Southern Medical Journal 2000;
Vol. 93(4).
All © 2013 are reserved by International Journal of Pharmaceutical Sciences and Research. This Journal licensed under a Creative Commons Attribution-NonCommercial-ShareAlike 3.0 Unported License.
This article can be downloaded to ANDROID OS based mobile. Scan QR Code using Code/Bar Scanner from your mobile. (Scanners are available on Google
Playstore)
How to cite this article:
Md. Nabi M, Mohammad Taher A, Sheikh H, Md. Dulal SR, Md. Alam K, Mohammad Islam M: A Study on Attitude and Satisfaction of
Patients towards Unani and Ayurvedic Health Care Service within Medical Pluralism in the Context of Bangladesh. Int J Pharm Sci Res
2015; 6(6): 2557-68.doi: 10.13040/IJPSR.0975-8232.6(6).2557-68.