
A Study of Thermistor Performance within a Textile...
14
sensors Article A Study of Thermistor Performance within a Textile Structure Theodore Hughes-Riley 1, *, Pasindu Lugoda 1 , Tilak Dias 1 , Christophe L. Trabi 2 and Robert H. Morris 2 1 Advanced Textiles Research Group, School of Art & Design, Nottingham Trent University, Bonington Building, Dryden Street, Nottingham NG1 4GG, UK; [email protected] (P.L.); [email protected] (T.D.) 2 School of Science and Technology, Nottingham Trent University, Clifton Lane, Nottingham NG11 8NS, UK; [email protected] (C.L.T.); [email protected] (R.H.M.) * Correspondence: [email protected]; Tel.: +44-(0)115-848-8178 Received: 5 July 2017; Accepted: 3 August 2017; Published: 5 August 2017 Abstract: Textiles provide an ideal structure for embedding sensors for medical devices. Skin temperature measurement is one area in which a sensor textile could be particularly beneficial; pathological skin is normally very sensitive, making the comfort of anything placed on that skin paramount. Skin temperature is an important parameter to measure for a number of medical applications, including for the early detection of diabetic foot ulcer formation. To this end an electronic temperature-sensor yarn was developed by embedding a commercially available thermistor chip into the fibres of a yarn, which can be used to produce a textile or a garment. As part of this process a resin was used to encapsulate the thermistor. This protects the thermistor from mechanical and chemical stresses, and also allows the sensing yarn to be washed. Building off preliminary work, the behaviour and performance of an encapsulated thermistor has been characterised to determine the effect of encapsulation on the step response time and absolute temperature measurements. Over the temperature range of interest only a minimal effect was observed, with step response times varying between 0.01–0.35 s. A general solution is presented for the heat transfer coefficient compared to size of the micro-pod formed by the encapsulation of the thermistor. Finally, a prototype temperature-sensing sock was produced using a network of sensing yarns as a demonstrator of a system that could warn of impending ulcer formation in diabetic patients. Keywords: wearable electronics; smart textiles; temperature-sensing; diabetic ulcers; thermistor; wound management; sensor network 1. Introduction The aim of this publication is to report the new knowledge that has been established in order to better understand how the performance of a thermistor is affected when embedded within the fibers of a yarn with a focus on the polymer micro-pod crafted to protect the thermistor from the mechanical and chemical stresses that a yarn would encounter when contained in a garment. Prototype temperature-sensing yarns had their response to temperature changes characterized before being incorporated into a prototype temperature-sensing sock, showing a potential future use of temperature-sensor yarns. The motivation for developing temperature-sensor yarns by using commercially available thermistors is summarized below. Textiles can provide a platform for embedding sensors when creating wearable medical devices. These are the perfect substrate for many applications as textiles are conformable, drapeable, flexible, and breathable making them comfortable to wear. Textiles can be constructed from individual yarns made of fibres, and formed into a structure using methods such as knitting or weaving. Sensors 2017, 17, 1804; doi:10.3390/s17081804 www.mdpi.com/journal/sensors
Transcript of A Study of Thermistor Performance within a Textile...

sensors
Article
A Study of Thermistor Performance within aTextile Structure
Theodore Hughes-Riley 1,*, Pasindu Lugoda 1, Tilak Dias 1, Christophe L. Trabi 2 andRobert H. Morris 2
1 Advanced Textiles Research Group, School of Art & Design, Nottingham Trent University,Bonington Building, Dryden Street, Nottingham NG1 4GG, UK; [email protected] (P.L.);[email protected] (T.D.)
2 School of Science and Technology, Nottingham Trent University, Clifton Lane, Nottingham NG11 8NS, UK;[email protected] (C.L.T.); [email protected] (R.H.M.)
* Correspondence: [email protected]; Tel.: +44-(0)115-848-8178
Received: 5 July 2017; Accepted: 3 August 2017; Published: 5 August 2017
Abstract: Textiles provide an ideal structure for embedding sensors for medical devices. Skin temperaturemeasurement is one area in which a sensor textile could be particularly beneficial; pathologicalskin is normally very sensitive, making the comfort of anything placed on that skin paramount.Skin temperature is an important parameter to measure for a number of medical applications,including for the early detection of diabetic foot ulcer formation. To this end an electronictemperature-sensor yarn was developed by embedding a commercially available thermistor chipinto the fibres of a yarn, which can be used to produce a textile or a garment. As part of this processa resin was used to encapsulate the thermistor. This protects the thermistor from mechanical andchemical stresses, and also allows the sensing yarn to be washed. Building off preliminary work,the behaviour and performance of an encapsulated thermistor has been characterised to determinethe effect of encapsulation on the step response time and absolute temperature measurements.Over the temperature range of interest only a minimal effect was observed, with step responsetimes varying between 0.01–0.35 s. A general solution is presented for the heat transfer coefficientcompared to size of the micro-pod formed by the encapsulation of the thermistor. Finally, a prototypetemperature-sensing sock was produced using a network of sensing yarns as a demonstrator ofa system that could warn of impending ulcer formation in diabetic patients.
Keywords: wearable electronics; smart textiles; temperature-sensing; diabetic ulcers; thermistor;wound management; sensor network
1. Introduction
The aim of this publication is to report the new knowledge that has been established in order tobetter understand how the performance of a thermistor is affected when embedded within the fibersof a yarn with a focus on the polymer micro-pod crafted to protect the thermistor from the mechanicaland chemical stresses that a yarn would encounter when contained in a garment.
Prototype temperature-sensing yarns had their response to temperature changes characterizedbefore being incorporated into a prototype temperature-sensing sock, showing a potential futureuse of temperature-sensor yarns. The motivation for developing temperature-sensor yarns by usingcommercially available thermistors is summarized below.
Textiles can provide a platform for embedding sensors when creating wearable medical devices.These are the perfect substrate for many applications as textiles are conformable, drapeable, flexible,and breathable making them comfortable to wear. Textiles can be constructed from individual yarnsmade of fibres, and formed into a structure using methods such as knitting or weaving.
Sensors 2017, 17, 1804; doi:10.3390/s17081804 www.mdpi.com/journal/sensors
Sensors 2017, 17, 1804 2 of 14
Historically mercury-in-glass thermometers were used to monitor temperature in a clinical setting,however due to the safety issues relating to mercury these have been relegated to laboratory use only.Existing skin temperature measurements are performed using either thermistors or thermocouples,which are both accurate and inexpensive [1]. Clinical thermistors of a very high accuracy (±0.01 C)have previously been reported [2]. Resistance temperature detectors can also be used in a similarway. Beyond this, thermocouples have been employed for skin temperature measurements, as haveresistance wires and thermopiles [3]. Thin-film sensors have also gained interest in recent years asa method to monitor skin temperature [4]. Liquid crystal thermometers are also sometimes employedto take skin temperature measurements in a domestic setting. As well as contact measurements,non-contact skin measurements can be obtained using radiometric methods. In recent years infra-red(IR) thermometry has become a popular alternative method with the performance of infraredthermometers seen to be equal or superior to thermistors for skin-surface thermometry [5,6] based onthe pioneering work by Hardy [7].
In this study, yarn encapsulation technology was used to embed small thermistors discretely intoyarns, and then textiles [8,9], to create sensing garments capable of spatially resolved temperaturemeasurements. Textiles are an ideal medium for employing temperature-sensing on the body,as temperature changes in the skin can indicate underlying pathologies [10–17]. This requires directskin contact for the encapsulated sensor and therefore comfort is essential. Further, traditionalthermometry techniques are not well suited to ambulatory temperature measurement or indeed regularcontact measurements of a single point on the skin as misplacement of the temperature-sensing elementbetween measurements could result in erroneous conclusions. This is also true for IR measurements,where the IR head may not be aimed at the correct location. Misplacement is less likely with a devicethat can be worn and does not need to be removed. A tight-fitting garment such as a sock is not likelyto move significantly during use, making misplacement errors less likely.
The proposed system is superior to existing textile-based temperature-sensors as these are incapableof localised measurements. These systems typically use the voltage drop of a metal conducting wireinlayed within a knitted structure to measure temperature [18]. Other fibre-based systems proposedhave seen a Polyvinylidene fluoride (PDVF) monofilament coated in a thermo-sensitive layer to createtemperature-sensing fibres that can be integrated into garments. This allowed for a temperaturemeasurement across single fibres of 2 to 6 cm lengths but not for point measurements [19]. Flexible,wearable temperature sensors not embedded within textiles are significantly less comfortable to wearas these do not exhibit textile characteristics, such as the ability to bend and shear [4,20,21]. The conceptdiscussed in this work is similar to the e-fibre temperature sensor technology proposed by Cherenacket al., with a major difference being that the e-yarns in this work use a fibrous sheath to give the yarns atrue textile feel [22]. This study builds on previous preliminary work [8] where a temperature-sensingyarn was proposed. Here, the temperature-sensing yarn design has been fully characterised and agarment (a sock) capable of spatially resolved temperature measurements is presented.
An area of particular interest in the development of this technology is to warn of foot ulceration indiabetics. It is known that there is a localized skin temperature change in the feet prior to ulcerformation in diabetic high-risk patients [11,12,14,17], presenting as a >2 C change. Therefore,a temperature-sensing sock able to detect temperature within an accuracy of ±0.5 C would offera useful solution by indicating that an ulcer may be forming. An extensive study (173 diabetes patientswith a history of ulceration over a 15-month period) performed by Lavery et al. had patients measuresix points on the foot—the big toe, the first, third, and fifth metatarsal heads, the heel, and the midfoot.Patients with an at-home device to monitor skin temperature at these points of the foot were lesslikely to develop ulcers (with only 8.5% of the study group developing ulcers) than other groups(with around 30% of the study group developing ulcers) helping validate the concept [12]. It is likelythat these locations were chosen by Lavery et al. as diabetic foot ulcers are commonly known to mostoften form on the base of the big toe, metatarsal heads, and heel. As the relative temperature will only

Sensors 2017, 17, 1804 3 of 14
change in locations where an ulcer is about to form, in the first instance a temperature-sensing sockshould measure at these three locations.
Another application of the technology would be to create a temperature-sensing wound dressing,as wound infection can also be identified by a localised change in temperature [13,15,16] howeverthe current literature does not provide guidance of the actual temperature variations that relate towound infection.
In order to successfully create temperature-sensing yarns and textiles that can provide correcttemperature measurement, it is vital to understand the effects of heat transfer created by the inclusionof encapsulation layers around the thermistor within the yarn. The encapsulation process is essentialin order to protect the thermistor from the mechanical and chemical stresses that a yarn wouldencounter in use. The standard encapsulation process uses three layers; a polymer resin, packing fibres,and a knitted sheath as shown in Figure 1.
Sensors 2017, 17, 1804 3 of 14
often form on the base of the big toe, metatarsal heads, and heel. As the relative temperature will only
change in locations where an ulcer is about to form, in the first instance a temperature-sensing sock
should measure at these three locations
Another application of the technology would be to create a temperature-sensing wound
dressing, as wound infection can also be identified by a localised change in temperature [13,15,16]
however the current literature does not provide guidance of the actual temperature variations that
relate to wound infection.
In order to successfully create temperature-sensing yarns and textiles that can provide correct
temperature measurement, it is vital to understand the effects of heat transfer created by the inclusion
of encapsulation layers around the thermistor within the yarn. The encapsulation process is essential
in order to protect the thermistor from the mechanical and chemical stresses that a yarn would
encounter in use. The standard encapsulation process uses three layers; a polymer resin, packing
fibres, and a knitted sheath as shown in Figure 1.
Figure 1. A cross-sectional schematic of the proposed encapsulation for a thermistor within a yarn.
There are three layers—the polymer resin, packing fibres, and a knitted sheath. Each will retard the
flow of heat to the thermistor, affecting the sensor’s response. The yarn would also include a carrier
yarn within the resin encapsulation to improve the tensile strength of the final yarn.
The packing fibres and knitted sheath should have a minimal effect on heat transfer to and from
the thermistor, given the relatively low mass of the materials and their porous structure. It was the
polymer micro-pod that would retard heat flow more significantly. This potentially alters the step
response time of the sensor (the time taken for the sensor to provide a representative measurement
after a change [23]) or the absolute temperature measurement.
2. Materials and Methods
2.1. Electronic Temperature-Sensing Yarn Construction
The electronic temperature-sensing yarn construction followed the general production steps
described elsewhere in the literature [8,9]. The electronic temperature-sensing yarns were constructed
using a single eight strand copper wire (outer diameter = 140 μm; 16 Ωm−1 copper alloy; Red House
Global, Colmworth, UK) soldered as interconnects to a Murata 10 kΩ, 100 mW 0402 surface-mount
device (SMD) Negative Temperature Coefficient (NTC) thermistor (NCP15XH103F03RC; Murata,
Kyoto, Japan), which was chosen as it was small enough to embed within a thin yarn (0.5 mm × 0.5
mm × 1 mm) and was sensitive to the temperature range of interest (approximately 25–38 °C) [24]. A
thermoplastic monofilament yarn spun from liquid crystal polymer (Vectran™, Kuraray America
Inc., Houston, TX, USA) was used as a carrier fibre to provide mechanical strength to the fine copper
wire. The thermistor, carrier and interconnects were encapsulated in a cylindrical polymer micro-
pod using 5 μL of UV curable resin (Multi-Cure® 9001-E-V-3.5, Dymax, Torrington, CT, USA; thermal
conductivity: 0.2 Wm−1·K−1).
In order to conduct studies to understand the effects of the micro-pod on the sensor’s response,
a number of different thicknesses of micro-pod were investigated with diameters of 0.70 mm, 1.01
Figure 1. A cross-sectional schematic of the proposed encapsulation for a thermistor within a yarn.There are three layers—the polymer resin, packing fibres, and a knitted sheath. Each will retard theflow of heat to the thermistor, affecting the sensor’s response. The yarn would also include a carrieryarn within the resin encapsulation to improve the tensile strength of the final yarn.
The packing fibres and knitted sheath should have a minimal effect on heat transfer to and fromthe thermistor, given the relatively low mass of the materials and their porous structure. It was thepolymer micro-pod that would retard heat flow more significantly. This potentially alters the stepresponse time of the sensor (the time taken for the sensor to provide a representative measurementafter a change [23]) or the absolute temperature measurement.
2. Materials and Methods
2.1. Electronic Temperature-Sensing Yarn Construction
The electronic temperature-sensing yarn construction followed the general production stepsdescribed elsewhere in the literature [8,9]. The electronic temperature-sensing yarns were constructedusing a single eight strand copper wire (outer diameter = 140 µm; 16 Ωm−1 copper alloy; Red HouseGlobal, Colmworth, UK) soldered as interconnects to a Murata 10 kΩ, 100 mW 0402 surface-mountdevice (SMD) Negative Temperature Coefficient (NTC) thermistor (NCP15XH103F03RC; Murata,Kyoto, Japan), which was chosen as it was small enough to embed within a thin yarn (0.5 mm ×0.5 mm × 1 mm) and was sensitive to the temperature range of interest (approximately 25–38 C) [24].A thermoplastic monofilament yarn spun from liquid crystal polymer (Vectran™, Kuraray AmericaInc., Houston, TX, USA) was used as a carrier fibre to provide mechanical strength to the fine copperwire. The thermistor, carrier and interconnects were encapsulated in a cylindrical polymer micro-podusing 5 µL of UV curable resin (Multi-Cure® 9001-E-V-3.5, Dymax, Torrington, CT, USA; thermalconductivity: 0.2 Wm−1·K−1).
Sensors 2017, 17, 1804 4 of 14
In order to conduct studies to understand the effects of the micro-pod on the sensor’s response,a number of different thicknesses of micro-pod were investigated with diameters of 0.70 mm, 1.01 mm,1.50 mm, 1.76 mm, and 1.90 mm. Tests were also conducted using un-encapsulated thermistors. To testthe effects of the micro-pod, these yarn samples were not completed with outer fibrous layers in orderto fully understand the effects of the resin.
To form the final temperature-sensing yarns, the carrier fibres, interconnects and the micro-podwere surrounded with six (167 dtex/48 filament) polyester yarns (packing fibres in Figure 1) anda circular warp-knitted structure (knit braid; RIUS MC braiding machine, RIUS, Barcelona, Spain),which was produced using six additional polyester yarns (167 dtex/48 filaments).
The electronic temperature-sensing yarns used for the calibration experiments and for theprototype sock had 0.87 mm-diameter resin micro-pods.
The temperature-sensing yarns broke at 60.0 N, with 11% elongation, as tested using a tensiletesting machine (Z2.5, Zwick/Roell, Ulm, Germany) in accordance with ASTM D 2256-02 (ASTMInternational, West Conshohocken, USA). This is higher than the breaking point of standard fibres,such as polyester, and therefore made the yarns suitable for undergoing the knitting process. The fibrescovering the electronic components of the yarn broke during testing before the electronic elementswere damaged.
2.2. Supporting Hardware for Temperature Measurements
For all experiments (unless otherwise stated) thermistors were connected to a dedicatedanalogue-to-digital converter (ADC) via a voltage divider circuit. Experiments investigating responsetime used a Teensey v3.2 microcontroller (PJRC, Sherwood, OR, USA) to preform analogue-to-digitalconversion with voltage measurements taken using 13-bits at a sampling rate of 1.3 kHz. The voltagedivider used 9.8 kΩ resistors. The Arduino v1.6.12 (Arduino LLC, Boston, MA, USA) and Teensyduinov1.35 (PJRC, Sherwood, OR, USA) software were used to record temperature measurements.This system closely represented the recording hardware that could be employed in a prototypegarment, given its small size.
Data presented for the prototype garments used a PICO-TC08 (Pico Technology, Cambridge, UK)as an ADC and an NI USB 6008 DAQ data acquisition device (National Instruments™, Austin,TX, USA).
The values of the resistors used in the potential divider circuits were determined with a digitalmulti-meter (Agilent 34410A 6 1
2 digit, Agilent Technologies, Santa Clara, CA, USA) to a precisionof 0.01%.
2.3. Response of Electronic Temperature-Sensing Yarns
2.3.1. Step Response Time Theory
The step response time is a vital parameter for temperature sensors as it determines the temporalresolution of the sensor. Since the thermistor in the electronic temperature-sensing yarn was not indirect contact with the surface being measured, the heat had to be transferred through the polymerresin and the polyester filaments, which provided a thermal resistance, restricting the heat flow. Thestep response time of a measuring system is the time taken by the measuring system to reach a finalsteady value, once it is subjected to an abrupt change between two specified, constant quantities [23].
In the simplest case the response to a temperature change will follow Newton’s law of heating(or Newton’s law of cooling) which describes the temperature change of an object as a function oftime when there is a temperature differential between the object and its surroundings [25]. Ignoringradiative heat transfer, this gives the following relationship:
T(t) = Ts − (Ts − T0)e−tr (1)

Sensors 2017, 17, 1804 5 of 14
where T(t) is the temperature at a given time t; Ts is the temperature of the surroundings; T0 is theinitial temperature of the object; and r is the characteristic thermal time constant.
The sensor step response time is the time taken for the sensor to reach a new equilibrium conditionafter a change. Due to the exponential nature of this relationship, equilibrium will be achieved after5 × r.
2.3.2. Response Time Experiments
To understand the potential limitations of the technology, two heat-transfer conditions wereinvestigated—the thermistors placed into an oil bath, and the thermistors placed directly ontoa precision hotplate. For both conditions, a precision electronic hot plate (Model 1000-1, ElectronicMicro Systems Ltd., Salisbury, UK) was used. When the oil bath was placed on top of the hotplate,the plate was set to 45.0 C which resulted in an oil temperature of ~38 C (monitored witha K-type thermocouple and reader; Six Channel Handheld Temperature Data Logger RDXL6SD,Omega Engineering, Inc., Manchester, UK) with fluctuations not exceeding ±1 C, and normally muchless within single datasets. When samples were placed directly on the plate, the hotplate was set to38.0 C. While the laboratory was not temperature-controlled, room temperatures of 25 ± 1 C wererecorded during the experiment(s). These temperatures (38 and 25 C) were chosen to represent skintemperature and an ambient environment respectively. Healthy skin has an external temperature of34 C, so a value greater than this was chosen in order to test the widest range of temperatures thatwould be likely to be encountered in normal use. For the oil bath, 80 mL of pure sunflower oil (TescoPLC, Welwyn Garden City, UK) in a glass beaker was heated until the temperature had stabilized.The oil was not stirred to limit convection currents.
All test samples (thermistors, encapsulated thermistors, electronic temperature-sensing yarns)were initially held at room temperature before placement into the oil bath or onto the hotplate. For thelatter experiment, double-sided tape was used to ensure good contact between the plate and sample;the tape was always attached to the hotplate and therefore held the same temperature as the plate itself.Samples were then heated for 6 min, ensuring that full equilibrium had been reached, before beingremoved. The recording of the temperature then continued for an additional 9 min. In this manner thedata for both heating and cooling were obtained.
Data fittings were then carried out using IGOR Pro (Version 7.0.2.2; Wavematrics, Tigard, OR, USA)to acquire the characteristic time constant for heat and cooling. In most cases, four repeat measurementswere taken with the standard deviation of these readings showing the level of error.
Additionally, the validity of the absolute temperature readings were checked by averaging285 data points from the stable region once an equilibrium had been reached.
2.4. Calibration of Sensor Yarn
A rigorous calibration was conducted on the electronic temperature-sensing yarns to validatethe calibration data provided by the thermistor manufacturer and to ensure that the presenceof the yarn encapsulation did not affect the response of the encapsulated sensor. The calibrationprocedure consisted of heating five electronic temperature-sensing yarns in the oil bath (as describedin Section 2.3.2), along with an NTC Thermistor (USP11493, US Sensor Corp., Orange, CA, USA,accurate to ±0.05 C). The entire ensemble was contained within a thermally insulating polystyrenebox and temperatures were held for 40 min to ensure that convection effects were minimised. For theseexperiments, the thermistor resistances were obtained using a high-accuracy digital multi-meter(Agilent 34410A).
Figure 2, showing the calibration data, was produced using Python v2.7 (Python SoftwareFoundation, Wilmington, DE, USA) using the SciPy [26] and Matplotlib [27] packages.

Sensors 2017, 17, 1804 6 of 14
Sensors 2017, 17, 1804 6 of 14
Figure 2. Calibration showing readings from five electronic temperature-sensing yarns (ETS yarns).
(a) The averaged values of the resistances of the five electronic temperature-sensing yarns have been
plotted (black markers) against the reciprocal of the temperature. Two polynomial fittings were
applied as well as the manufacturer’s equation to calculate the reciprocal of temperature;
(b) Residuals for each of the Equations (2)–(4).
2.5. Prototype Temperature-Sensing Sock
Electronic temperature-sensing yarns were produced and integrated into a prototype
temperature-sensing sock. The prototype sock was produced using five electronic temperature-
sensing yarns positioned at different points on the sole of the sock for remote temperature
monitoring. It was of most interest to measure the temperature on the big toe, heel, and metatarsal
heads, which informed the placement of the sensors. Given the size of the metatarsal heads, three
sensors were placed there.
Thermistors were positioned correctly by inserting the electronic yarns into 2.0 mm diameter
channels within a seamless knitted sock. The sock with the channels was produced using a
computerized flatbed knitting machine (Model SWG 091N3, 15NPI, Shima Seiki,
Sakata Wakayama, Japan).
In order for the sock to provide remote temperature measurements, the sensor yarns were
connected to a microcontroller (Arduino Pro Mini, Arduino, Scarmagno, Italy) and Bluetooth module
(BlueSmirf, Sparkfun Electronics, Boulder, CO, USA). LabVIEW (2014 SP1, National Instruments™,
Austin, USA) was used to program and create a graphical user interface.
3. Results and Discussion
3.1. Electronic Temperature-Sensing Yarn Calibration
The resistance values from five electronic temperature-sensing yarns with embedded
thermistors were averaged and plotted against the reciprocal of the temperature (in a range spanning
22.25 to 62.15 °C, going beyond the extreme limits of the temperature range of interest). This data first
had a polynomial approximation fitting applied to convert the temperature-sensing yarn’s resistance
into temperature [28] (Figure 2a), with the calibration fitting given by Equation (2). Temperatures for
the calibration were recorded using the US Sensor Corp. Thermistor, which was more accurate (to
±0.05 °C) than the thermistors in the temperature-sensing yarn.
1
𝑇= 0.017598 − 0.003687 [ln(𝑅)] + 0.002545 [ln(𝑅)]3 (2)
where T is the temperature (in °C) and R is the resistance (in kΩ).
Recent literature has shown a more accurate calibration fitting. The data used previously were
therefore fitted with the new polynomial approximation, once again converting the thermistor
resistance into the reciprocal of temperature [29] (Figure 2a), with the second calibration fitting given
in Equation (3).
1
𝑇= 0.040576 + 0.041704 ln (
𝑅
𝑅0) + 0.030514[ln (
𝑅
𝑅0)]
2
+ 0.009980[ln (𝑅
𝑅0)]3 (3)
where T is the temperature (in °C); R0 is the resistance at 25 °C (in kΩ); and R is the resistance (in kΩ).
Figure 2. Calibration showing readings from five electronic temperature-sensing yarns (ETS yarns).(a) The averaged values of the resistances of the five electronic temperature-sensing yarns have beenplotted (black markers) against the reciprocal of the temperature. Two polynomial fittings were appliedas well as the manufacturer’s equation to calculate the reciprocal of temperature; (b) Residuals for eachof the Equations (2)–(4).
2.5. Prototype Temperature-Sensing Sock
Electronic temperature-sensing yarns were produced and integrated into a prototype temperature-sensing sock. The prototype sock was produced using five electronic temperature-sensing yarnspositioned at different points on the sole of the sock for remote temperature monitoring. It was of mostinterest to measure the temperature on the big toe, heel, and metatarsal heads, which informed theplacement of the sensors. Given the size of the metatarsal heads, three sensors were placed there.
Thermistors were positioned correctly by inserting the electronic yarns into 2.0 mm diameterchannels within a seamless knitted sock. The sock with the channels was produced using a computerizedflatbed knitting machine (Model SWG 091N3, 15NPI, Shima Seiki, Sakata Wakayama, Japan).
In order for the sock to provide remote temperature measurements, the sensor yarns wereconnected to a microcontroller (Arduino Pro Mini, Arduino, Scarmagno, Italy) and Bluetooth module(BlueSmirf, Sparkfun Electronics, Boulder, CO, USA). LabVIEW (2014 SP1, National Instruments™,Austin, TX, USA) was used to program and create a graphical user interface.
3. Results and Discussion
3.1. Electronic Temperature-Sensing Yarn Calibration
The resistance values from five electronic temperature-sensing yarns with embedded thermistorswere averaged and plotted against the reciprocal of the temperature (in a range spanning 22.25 to62.15 C, going beyond the extreme limits of the temperature range of interest). This data first hada polynomial approximation fitting applied to convert the temperature-sensing yarn’s resistanceinto temperature [28] (Figure 2a), with the calibration fitting given by Equation (2). Temperaturesfor the calibration were recorded using the US Sensor Corp. Thermistor, which was more accurate(to ±0.05 C) than the thermistors in the temperature-sensing yarn.
1T
= 0.017598 − 0.003687[ln(R)] + 0.002545[ln(R)]3 (2)
where T is the temperature (in C) and R is the resistance (in kΩ).Recent literature has shown a more accurate calibration fitting. The data used previously
were therefore fitted with the new polynomial approximation, once again converting the thermistorresistance into the reciprocal of temperature [29] (Figure 2a), with the second calibration fitting givenin Equation (3).
1T
= 0.040576 + 0.041704 ln(
RR0
)+ 0.030514[ln
(RR0
)]2 + 0.009980[ ln
(RR0
)]3 (3)
Sensors 2017, 17, 1804 7 of 14
where T is the temperature (in C); R0 is the resistance at 25 C (in kΩ); and R is the resistance (in kΩ).It was also important to clarify whether the equation given by the thermistor manufacturer
could be used to provide accurate temperatures. Therefore, average resistance values (Rt) from theelectronic temperature-sensing yarns were used to calculate the reciprocal of the temperature (1/T)using Equation (4).
1T
=
ln(
RtR0
)B
+
(1T0
)(4)
where R0 is 10 kΩ ± 1% resistance at T0, which is 298.15 K (25 C); and B is the material constant(3395 for the temperature range of 20–65 C, provided by the manufacturer). The temperature (T)obtained was in Kelvin and was converted to C. Thereafter the reciprocal of this temperature wasplotted as shown in Figure 2a.
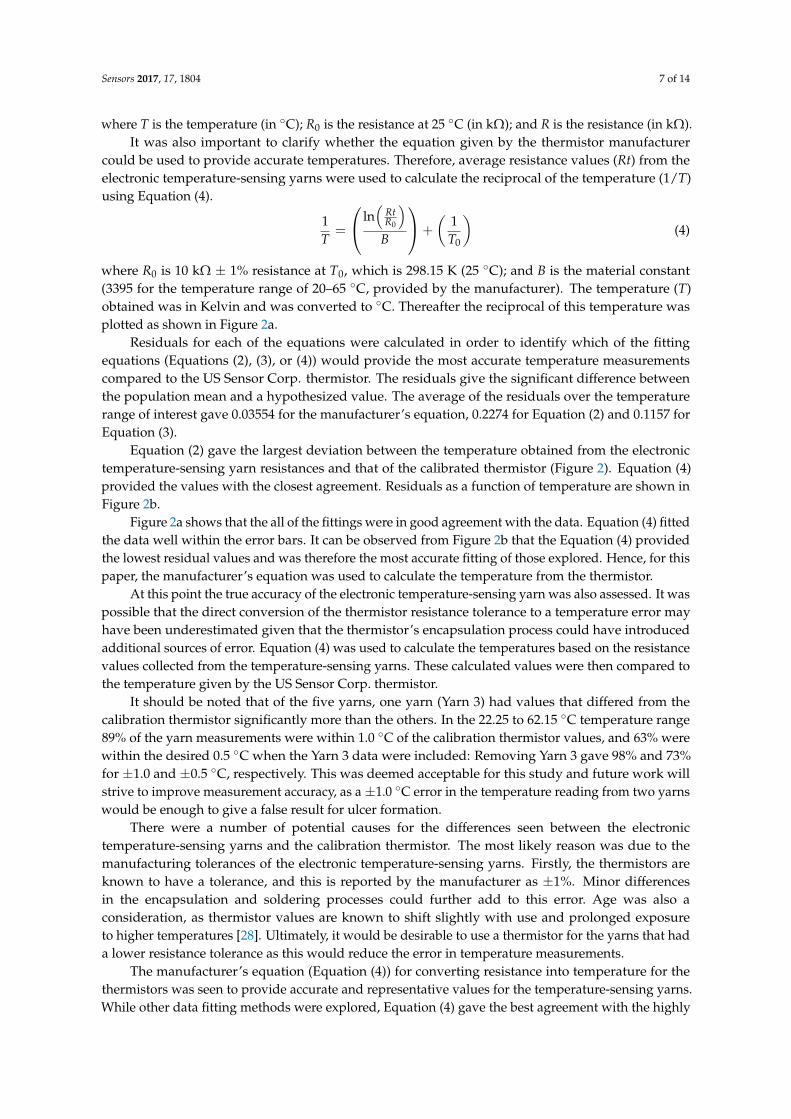
Residuals for each of the equations were calculated in order to identify which of the fittingequations (Equations (2), (3), or (4)) would provide the most accurate temperature measurementscompared to the US Sensor Corp. thermistor. The residuals give the significant difference betweenthe population mean and a hypothesized value. The average of the residuals over the temperaturerange of interest gave 0.03554 for the manufacturer’s equation, 0.2274 for Equation (2) and 0.1157 forEquation (3).
Equation (2) gave the largest deviation between the temperature obtained from the electronictemperature-sensing yarn resistances and that of the calibrated thermistor (Figure 2). Equation (4)provided the values with the closest agreement. Residuals as a function of temperature are shown inFigure 2b.
Figure 2a shows that the all of the fittings were in good agreement with the data. Equation (4) fittedthe data well within the error bars. It can be observed from Figure 2b that the Equation (4) providedthe lowest residual values and was therefore the most accurate fitting of those explored. Hence, for thispaper, the manufacturer’s equation was used to calculate the temperature from the thermistor.
At this point the true accuracy of the electronic temperature-sensing yarn was also assessed. It waspossible that the direct conversion of the thermistor resistance tolerance to a temperature error mayhave been underestimated given that the thermistor’s encapsulation process could have introducedadditional sources of error. Equation (4) was used to calculate the temperatures based on the resistancevalues collected from the temperature-sensing yarns. These calculated values were then compared tothe temperature given by the US Sensor Corp. thermistor.
It should be noted that of the five yarns, one yarn (Yarn 3) had values that differed from thecalibration thermistor significantly more than the others. In the 22.25 to 62.15 C temperature range89% of the yarn measurements were within 1.0 C of the calibration thermistor values, and 63% werewithin the desired 0.5 C when the Yarn 3 data were included: Removing Yarn 3 gave 98% and 73%for ±1.0 and ±0.5 C, respectively. This was deemed acceptable for this study and future work willstrive to improve measurement accuracy, as a ±1.0 C error in the temperature reading from two yarnswould be enough to give a false result for ulcer formation.
There were a number of potential causes for the differences seen between the electronictemperature-sensing yarns and the calibration thermistor. The most likely reason was due to themanufacturing tolerances of the electronic temperature-sensing yarns. Firstly, the thermistors areknown to have a tolerance, and this is reported by the manufacturer as ±1%. Minor differencesin the encapsulation and soldering processes could further add to this error. Age was also aconsideration, as thermistor values are known to shift slightly with use and prolonged exposureto higher temperatures [28]. Ultimately, it would be desirable to use a thermistor for the yarns that hada lower resistance tolerance as this would reduce the error in temperature measurements.
The manufacturer’s equation (Equation (4)) for converting resistance into temperature for thethermistors was seen to provide accurate and representative values for the temperature-sensing yarns.While other data fitting methods were explored, Equation (4) gave the best agreement with the highly

Sensors 2017, 17, 1804 8 of 14
accurate US Sensor Corp. thermistor measurements. As a result, Equation 4 was used to convertresistance to temperature throughout this work.
3.2. Response Time of Encapsulated Thermistor and Stability of Readings
3.2.1. Step Response Time
As expected, the placement of the samples into the oil bath or onto the hotplate resulted in a rapidincrease in the recorded temperature. Removing the samples from the source of heat brought about adrop in the recorded temperature. An example of the raw temperature data as a function of time fromsix samples is shown in Figure 3.
Sensors 2017, 17, 1804 8 of 14
the highly accurate US Sensor Corp. thermistor measurements. As a result, Equation 4 was used to
convert resistance to temperature throughout this work.
3.2. Response Time of Encapsulated Thermistor and Stability of Readings
3.2.1. Step Response Time
As expected, the placement of the samples into the oil bath or onto the hotplate resulted in a
rapid increase in the recorded temperature. Removing the samples from the source of heat brought
about a drop in the recorded temperature. An example of the raw temperature data as a function of
time from six samples is shown in Figure 3.
Figure 3. Sample data set showing the temperature response of three different samples when placed
onto the hotplate (38 °C) and then removed to room temperature (25 °C). The temperature reading
for all of the samples increased to an equilibrium value exponentially. Similarly, cooling shows an
exponential relationship. The diameters of the resin micro-pods are as follows: = 0.70 mm,
= 1.00 mm, = 1.90 mm. Markers appear as lines in the figure due to the density of data.
The absolute temperatures appeared to be similar in most cases but not identical. The increase
and decrease in temperature appeared to be exponential in nature, as would be expected from
Newton’s law of heating or cooling (see Equation (1)), with some variation in the rates. This was
confirmed by applying data fittings, as described in Section 2.3.1, to obtain heating and cooling time
constants. These are displayed for heating and cooling in Figure 4a,b.
It was clear that heating of the samples gave a shorter time constant than cooling, with a
difference of over a factor of thirty between the constants in some cases. It is known that thermal time
constants can be substantially different for the heating or cooling of thermistors [30].
Figure 4. Thermal time constants as a function of the micro-pod diameter. Data presented shows
experiments where an oil bath was used ( ) or the samples were attached directly to a hotplate ( ).
(a) Heating time constant; (b) Cooling time constant. In both cases the effect of the micro-pod on the
time constants were negligible within the experimental error.
It was of interest to note that for both heating and cooling there was an offset in the time constant
depending on whether the oil bath had been used or the sample had been attached to the plate
Figure 3. Sample data set showing the temperature response of three different samples when placedonto the hotplate (38 C) and then removed to room temperature (25 C). The temperature readingfor all of the samples increased to an equilibrium value exponentially. Similarly, cooling showsan exponential relationship. The diameters of the resin micro-pods are as follows:
Sensors 2017, 17, 1804 8 of 14
the highly accurate US Sensor Corp. thermistor measurements. As a result, Equation 4 was used to
convert resistance to temperature throughout this work.
3.2. Response Time of Encapsulated Thermistor and Stability of Readings
3.2.1. Step Response Time
As expected, the placement of the samples into the oil bath or onto the hotplate resulted in a
rapid increase in the recorded temperature. Removing the samples from the source of heat brought
about a drop in the recorded temperature. An example of the raw temperature data as a function of
time from six samples is shown in Figure 3.
Figure 3. Sample data set showing the temperature response of three different samples when placed
onto the hotplate (38 °C) and then removed to room temperature (25 °C). The temperature reading
for all of the samples increased to an equilibrium value exponentially. Similarly, cooling shows an
exponential relationship. The diameters of the resin micro-pods are as follows: = 0.70 mm,
= 1.00 mm, = 1.90 mm. Markers appear as lines in the figure due to the density of data.
The absolute temperatures appeared to be similar in most cases but not identical. The increase
and decrease in temperature appeared to be exponential in nature, as would be expected from
Newton’s law of heating or cooling (see Equation (1)), with some variation in the rates. This was
confirmed by applying data fittings, as described in Section 2.3.1, to obtain heating and cooling time
constants. These are displayed for heating and cooling in Figure 4a,b.
It was clear that heating of the samples gave a shorter time constant than cooling, with a
difference of over a factor of thirty between the constants in some cases. It is known that thermal time
constants can be substantially different for the heating or cooling of thermistors [30].
Figure 4. Thermal time constants as a function of the micro-pod diameter. Data presented shows
experiments where an oil bath was used ( ) or the samples were attached directly to a hotplate ( ).
(a) Heating time constant; (b) Cooling time constant. In both cases the effect of the micro-pod on the
time constants were negligible within the experimental error.
It was of interest to note that for both heating and cooling there was an offset in the time constant
depending on whether the oil bath had been used or the sample had been attached to the plate
= 0.70 mm,
Sensors 2017, 17, 1804 8 of 14
the highly accurate US Sensor Corp. thermistor measurements. As a result, Equation 4 was used to
convert resistance to temperature throughout this work.
3.2. Response Time of Encapsulated Thermistor and Stability of Readings
3.2.1. Step Response Time
As expected, the placement of the samples into the oil bath or onto the hotplate resulted in a
rapid increase in the recorded temperature. Removing the samples from the source of heat brought
about a drop in the recorded temperature. An example of the raw temperature data as a function of
time from six samples is shown in Figure 3.
Figure 3. Sample data set showing the temperature response of three different samples when placed
onto the hotplate (38 °C) and then removed to room temperature (25 °C). The temperature reading
for all of the samples increased to an equilibrium value exponentially. Similarly, cooling shows an
exponential relationship. The diameters of the resin micro-pods are as follows: = 0.70 mm,
= 1.00 mm, = 1.90 mm. Markers appear as lines in the figure due to the density of data.
The absolute temperatures appeared to be similar in most cases but not identical. The increase
and decrease in temperature appeared to be exponential in nature, as would be expected from
Newton’s law of heating or cooling (see Equation (1)), with some variation in the rates. This was
confirmed by applying data fittings, as described in Section 2.3.1, to obtain heating and cooling time
constants. These are displayed for heating and cooling in Figure 4a,b.
It was clear that heating of the samples gave a shorter time constant than cooling, with a
difference of over a factor of thirty between the constants in some cases. It is known that thermal time
constants can be substantially different for the heating or cooling of thermistors [30].
Figure 4. Thermal time constants as a function of the micro-pod diameter. Data presented shows
experiments where an oil bath was used ( ) or the samples were attached directly to a hotplate ( ).
(a) Heating time constant; (b) Cooling time constant. In both cases the effect of the micro-pod on the
time constants were negligible within the experimental error.
It was of interest to note that for both heating and cooling there was an offset in the time constant
depending on whether the oil bath had been used or the sample had been attached to the plate
= 1.00 mm,
Sensors 2017, 17, 1804 8 of 14
the highly accurate US Sensor Corp. thermistor measurements. As a result, Equation 4 was used to
convert resistance to temperature throughout this work.
3.2. Response Time of Encapsulated Thermistor and Stability of Readings
3.2.1. Step Response Time
As expected, the placement of the samples into the oil bath or onto the hotplate resulted in a
rapid increase in the recorded temperature. Removing the samples from the source of heat brought
about a drop in the recorded temperature. An example of the raw temperature data as a function of
time from six samples is shown in Figure 3.
Figure 3. Sample data set showing the temperature response of three different samples when placed
onto the hotplate (38 °C) and then removed to room temperature (25 °C). The temperature reading
for all of the samples increased to an equilibrium value exponentially. Similarly, cooling shows an
exponential relationship. The diameters of the resin micro-pods are as follows: = 0.70 mm,
= 1.00 mm, = 1.90 mm. Markers appear as lines in the figure due to the density of data.
The absolute temperatures appeared to be similar in most cases but not identical. The increase
and decrease in temperature appeared to be exponential in nature, as would be expected from
Newton’s law of heating or cooling (see Equation (1)), with some variation in the rates. This was
confirmed by applying data fittings, as described in Section 2.3.1, to obtain heating and cooling time
constants. These are displayed for heating and cooling in Figure 4a,b.
It was clear that heating of the samples gave a shorter time constant than cooling, with a
difference of over a factor of thirty between the constants in some cases. It is known that thermal time
constants can be substantially different for the heating or cooling of thermistors [30].
Figure 4. Thermal time constants as a function of the micro-pod diameter. Data presented shows
experiments where an oil bath was used ( ) or the samples were attached directly to a hotplate ( ).
(a) Heating time constant; (b) Cooling time constant. In both cases the effect of the micro-pod on the
time constants were negligible within the experimental error.
It was of interest to note that for both heating and cooling there was an offset in the time constant
depending on whether the oil bath had been used or the sample had been attached to the plate
= 1.90 mm. Markers appear as lines in the figure due to the density of data.
The absolute temperatures appeared to be similar in most cases but not identical. The increase anddecrease in temperature appeared to be exponential in nature, as would be expected from Newton’slaw of heating or cooling (see Equation (1)), with some variation in the rates. This was confirmedby applying data fittings, as described in Section 2.3.1, to obtain heating and cooling time constants.These are displayed for heating and cooling in Figure 4a,b.
Sensors 2017, 17, 1804 8 of 14
the highly accurate US Sensor Corp. thermistor measurements. As a result, Equation 4 was used to
convert resistance to temperature throughout this work.
3.2. Response Time of Encapsulated Thermistor and Stability of Readings
3.2.1. Step Response Time
As expected, the placement of the samples into the oil bath or onto the hotplate resulted in a
rapid increase in the recorded temperature. Removing the samples from the source of heat brought
about a drop in the recorded temperature. An example of the raw temperature data as a function of
time from six samples is shown in Figure 3.
Figure 3. Sample data set showing the temperature response of three different samples when placed
onto the hotplate (38 °C) and then removed to room temperature (25 °C). The temperature reading
for all of the samples increased to an equilibrium value exponentially. Similarly, cooling shows an
exponential relationship. The diameters of the resin micro-pods are as follows: = 0.70 mm,
= 1.00 mm, = 1.90 mm. Markers appear as lines in the figure due to the density of data.
The absolute temperatures appeared to be similar in most cases but not identical. The increase
and decrease in temperature appeared to be exponential in nature, as would be expected from
Newton’s law of heating or cooling (see Equation (1)), with some variation in the rates. This was
confirmed by applying data fittings, as described in Section 2.3.1, to obtain heating and cooling time
constants. These are displayed for heating and cooling in Figure 4a,b.
It was clear that heating of the samples gave a shorter time constant than cooling, with a
difference of over a factor of thirty between the constants in some cases. It is known that thermal time
constants can be substantially different for the heating or cooling of thermistors [30].
Figure 4. Thermal time constants as a function of the micro-pod diameter. Data presented shows
experiments where an oil bath was used ( ) or the samples were attached directly to a hotplate ( ).
(a) Heating time constant; (b) Cooling time constant. In both cases the effect of the micro-pod on the
time constants were negligible within the experimental error.
It was of interest to note that for both heating and cooling there was an offset in the time constant
depending on whether the oil bath had been used or the sample had been attached to the plate
Figure 4. Thermal time constants as a function of the micro-pod diameter. Data presented showsexperiments where an oil bath was used (
Sensors 2017, 17, 1804 8 of 14
the highly accurate US Sensor Corp. thermistor measurements. As a result, Equation 4 was used to
convert resistance to temperature throughout this work.
3.2. Response Time of Encapsulated Thermistor and Stability of Readings
3.2.1. Step Response Time
As expected, the placement of the samples into the oil bath or onto the hotplate resulted in a
rapid increase in the recorded temperature. Removing the samples from the source of heat brought
about a drop in the recorded temperature. An example of the raw temperature data as a function of
time from six samples is shown in Figure 3.
Figure 3. Sample data set showing the temperature response of three different samples when placed
onto the hotplate (38 °C) and then removed to room temperature (25 °C). The temperature reading
for all of the samples increased to an equilibrium value exponentially. Similarly, cooling shows an
exponential relationship. The diameters of the resin micro-pods are as follows: = 0.70 mm,
= 1.00 mm, = 1.90 mm. Markers appear as lines in the figure due to the density of data.
The absolute temperatures appeared to be similar in most cases but not identical. The increase
and decrease in temperature appeared to be exponential in nature, as would be expected from
Newton’s law of heating or cooling (see Equation (1)), with some variation in the rates. This was
confirmed by applying data fittings, as described in Section 2.3.1, to obtain heating and cooling time
constants. These are displayed for heating and cooling in Figure 4a,b.
It was clear that heating of the samples gave a shorter time constant than cooling, with a
difference of over a factor of thirty between the constants in some cases. It is known that thermal time
constants can be substantially different for the heating or cooling of thermistors [30].
Figure 4. Thermal time constants as a function of the micro-pod diameter. Data presented shows
experiments where an oil bath was used ( ) or the samples were attached directly to a hotplate ( ).
(a) Heating time constant; (b) Cooling time constant. In both cases the effect of the micro-pod on the
time constants were negligible within the experimental error.
It was of interest to note that for both heating and cooling there was an offset in the time constant
depending on whether the oil bath had been used or the sample had been attached to the plate
) or the samples were attached directly to a hotplate (
Sensors 2017, 17, 1804 8 of 14
the highly accurate US Sensor Corp. thermistor measurements. As a result, Equation 4 was used to
convert resistance to temperature throughout this work.
3.2. Response Time of Encapsulated Thermistor and Stability of Readings
3.2.1. Step Response Time
As expected, the placement of the samples into the oil bath or onto the hotplate resulted in a
rapid increase in the recorded temperature. Removing the samples from the source of heat brought
about a drop in the recorded temperature. An example of the raw temperature data as a function of
time from six samples is shown in Figure 3.
Figure 3. Sample data set showing the temperature response of three different samples when placed
onto the hotplate (38 °C) and then removed to room temperature (25 °C). The temperature reading
for all of the samples increased to an equilibrium value exponentially. Similarly, cooling shows an
exponential relationship. The diameters of the resin micro-pods are as follows: = 0.70 mm,
= 1.00 mm, = 1.90 mm. Markers appear as lines in the figure due to the density of data.
The absolute temperatures appeared to be similar in most cases but not identical. The increase
and decrease in temperature appeared to be exponential in nature, as would be expected from
Newton’s law of heating or cooling (see Equation (1)), with some variation in the rates. This was
confirmed by applying data fittings, as described in Section 2.3.1, to obtain heating and cooling time
constants. These are displayed for heating and cooling in Figure 4a,b.
It was clear that heating of the samples gave a shorter time constant than cooling, with a
difference of over a factor of thirty between the constants in some cases. It is known that thermal time
constants can be substantially different for the heating or cooling of thermistors [30].
Figure 4. Thermal time constants as a function of the micro-pod diameter. Data presented shows
experiments where an oil bath was used ( ) or the samples were attached directly to a hotplate ( ).
(a) Heating time constant; (b) Cooling time constant. In both cases the effect of the micro-pod on the
time constants were negligible within the experimental error.
It was of interest to note that for both heating and cooling there was an offset in the time constant
depending on whether the oil bath had been used or the sample had been attached to the plate
).(a) Heating time constant; (b) Cooling time constant. In both cases the effect of the micro-pod on thetime constants were negligible within the experimental error.
It was clear that heating of the samples gave a shorter time constant than cooling, with a differenceof over a factor of thirty between the constants in some cases. It is known that thermal time constantscan be substantially different for the heating or cooling of thermistors [30].

Sensors 2017, 17, 1804 9 of 14
It was of interest to note that for both heating and cooling there was an offset in the time constantdepending on whether the oil bath had been used or the sample had been attached to the plate directly.When using the oil bath the samples took less time to reach equilibrium when heated, and longerto cool compared to when the samples were attached to the plate directly. The greater cooling timeconstant, observed when samples were removed from the oil bath, was due to the layer of oil thatclung to the surface of the samples. This heated oil layer acted as an additional thermally resistivebarrier that slowed the cooling process. It is important to note that the differences between the resultswere minimal within the experimental error (as shown by the error bars in Figure 4). A shorter timeconstant for heating was likely due to the entire yarn being submerged in the oil, therefore heatingwould occur on all sides of the yarn and not just on one side (i.e., the side of the thermistor which is indirect contact with the heating surface) as was the case with the hotplate.
Ultimately, the presented data gave thermal time constants between 1716–8012 µs when heating,and 3595–69,898 µs when cooling. The corresponding step response times were 8578–40,061 µs(0.01–0.04 s) for heating and 17,976–349,490 µs (0.02–0.35 s) for cooling. A maximum step responsetime of 0.35 s would be negligible for most skin temperature monitoring applications—temperaturechanges due to ulcer formation or wound infection would occur over a period of the order of hours.
Preliminary experiments were conducted with a resin type with superior thermal transfercharacteristics (Dymax Multi-Cure® 9-20801, Dymax Corporation, Torrington, CT, USA; thermalconductivity: 0.9 Wm−1K−1), which provided shorter time constants compared to the Dymax9001-E-V-3.5, as would be expected. Given that the thermal time constants obtained when the Dymax9001-E-V-3.5 was used were sufficiently short for this application, full characterization using theDymax 9-20801 was not conducted.
A linear relationship between the thermal time constant and micro-pod diameter was clearlyapparent when samples were attached to the hotplate directly (as shown in Figure 4). This was due tothe greater volume of resin around the chip causing a restriction to heat flow, and therefore increasingthe thermal time constant as a function of the micro-pod size. A relationship was less clear when theoil bath was used due to a greater level of variation in the results, as shown by the error bars. To betterunderstand this effect, the volume fraction of resin surrounding the thermistor was calculated andcompared to the volume of the thermistor itself. The volume fraction was then plotted against thethermal time constant as shown in Figure 5.
Sensors 2017, 17, 1804 9 of 14
directly. When using the oil bath the samples took less time to reach equilibrium when heated, and
longer to cool compared to when the samples were attached to the plate directly. The greater cooling
time constant, observed when samples were removed from the oil bath, was due to the layer of oil
that clung to the surface of the samples. This heated oil layer acted as an additional thermally resistive
barrier that slowed the cooling process. It is important to note that the differences between the results
were minimal within the experimental error (as shown by the error bars in Figure 4). A shorter time
constant for heating was likely due to the entire yarn being submerged in the oil, therefore heating
would occur on all sides of the yarn and not just on one side (i.e., the side of the thermistor which is
in direct contact with the heating surface) as was the case with the hotplate.
Ultimately, the presented data gave thermal time constants between 1716–8012 μs when heating,
and 3595–69,898 μs when cooling. The corresponding step response times were 8578–40,061 μs
(0.01–0.04 s) for heating and 17,976–349,490 μs (0.02–0.35 s) for cooling. A maximum step response
time of 0.35 s would be negligible for most skin temperature monitoring applications—temperature
changes due to ulcer formation or wound infection would occur over a period of the order of hours.
Preliminary experiments were conducted with a resin type with superior thermal transfer
characteristics (Dymax Multi-Cure® 9-20801, Dymax Corporation, Torrington, CT, USA; thermal
conductivity: 0.9 Wm−1K−1), which provided shorter time constants compared to the Dymax 9001-E-
V-3.5, as would be expected. Given that the thermal time constants obtained when the Dymax 9001-
E-V-3.5 was used were sufficiently short for this application, full characterization using the Dymax
9-20801 was not conducted.
A linear relationship between the thermal time constant and micro-pod diameter was clearly
apparent when samples were attached to the hotplate directly (as shown in Figure 4). This was due
to the greater volume of resin around the chip causing a restriction to heat flow, and therefore
increasing the thermal time constant as a function of the micro-pod size. A relationship was less clear
when the oil bath was used due to a greater level of variation in the results, as shown by the error
bars. To better understand this effect, the volume fraction of resin surrounding the thermistor was
calculated and compared to the volume of the thermistor itself. The volume fraction was then plotted
against the thermal time constant as shown in Figure 5.
Figure 5. Thermal time constant against the volume fraction of resin surrounding the thermistor
compared to the thermistor’s volume. Data presented shows when samples were directly attached to
the hotplate ( ; previously shown in Figure 4a). (a) Heating thermal time constant. A direct linear
relationship (r2 = 0.776) is observed as shown in Equation (5); (b) Cooling thermal time constant. The
linear relationship (r2 = 0.629) observed is shown in Equation (6).
In Figure 5a there is a clear linear relationship between the volume fraction and thermal time
constant (Equation (5)), with the thermal time constant increasing with a greater volume fraction.
Thermal time constant = 3606.1 ± 643.0 − 346.7 ± 93.1 × Volume fraction (5)
Figure 5b gives a similar linear relationship (Equation (6)).
Thermal time constant = 9806.6 ± 3210.0 − 1213.6 ± 466.0 × Volume fraction (6)
Figure 5. Thermal time constant against the volume fraction of resin surrounding the thermistorcompared to the thermistor’s volume. Data presented shows when samples were directly attached tothe hotplate (
Sensors 2017, 17, 1804 9 of 14
directly. When using the oil bath the samples took less time to reach equilibrium when heated, and
longer to cool compared to when the samples were attached to the plate directly. The greater cooling
time constant, observed when samples were removed from the oil bath, was due to the layer of oil
that clung to the surface of the samples. This heated oil layer acted as an additional thermally resistive
barrier that slowed the cooling process. It is important to note that the differences between the results
were minimal within the experimental error (as shown by the error bars in Figure 4). A shorter time
constant for heating was likely due to the entire yarn being submerged in the oil, therefore heating
would occur on all sides of the yarn and not just on one side (i.e., the side of the thermistor which is
in direct contact with the heating surface) as was the case with the hotplate.
Ultimately, the presented data gave thermal time constants between 1716–8012 μs when heating,
and 3595–69,898 μs when cooling. The corresponding step response times were 8578–40,061 μs
(0.01–0.04 s) for heating and 17,976–349,490 μs (0.02–0.35 s) for cooling. A maximum step response
time of 0.35 s would be negligible for most skin temperature monitoring applications—temperature
changes due to ulcer formation or wound infection would occur over a period of the order of hours.
Preliminary experiments were conducted with a resin type with superior thermal transfer
characteristics (Dymax Multi-Cure® 9-20801, Dymax Corporation, Torrington, CT, USA; thermal
conductivity: 0.9 Wm−1K−1), which provided shorter time constants compared to the Dymax 9001-E-
V-3.5, as would be expected. Given that the thermal time constants obtained when the Dymax 9001-
E-V-3.5 was used were sufficiently short for this application, full characterization using the Dymax
9-20801 was not conducted.
A linear relationship between the thermal time constant and micro-pod diameter was clearly
apparent when samples were attached to the hotplate directly (as shown in Figure 4). This was due
to the greater volume of resin around the chip causing a restriction to heat flow, and therefore
increasing the thermal time constant as a function of the micro-pod size. A relationship was less clear
when the oil bath was used due to a greater level of variation in the results, as shown by the error
bars. To better understand this effect, the volume fraction of resin surrounding the thermistor was
calculated and compared to the volume of the thermistor itself. The volume fraction was then plotted
against the thermal time constant as shown in Figure 5.
Figure 5. Thermal time constant against the volume fraction of resin surrounding the thermistor
compared to the thermistor’s volume. Data presented shows when samples were directly attached to
the hotplate ( ; previously shown in Figure 4a). (a) Heating thermal time constant. A direct linear
relationship (r2 = 0.776) is observed as shown in Equation (5); (b) Cooling thermal time constant. The
linear relationship (r2 = 0.629) observed is shown in Equation (6).
In Figure 5a there is a clear linear relationship between the volume fraction and thermal time
constant (Equation (5)), with the thermal time constant increasing with a greater volume fraction.
Thermal time constant = 3606.1 ± 643.0 − 346.7 ± 93.1 × Volume fraction (5)
Figure 5b gives a similar linear relationship (Equation (6)).
Thermal time constant = 9806.6 ± 3210.0 − 1213.6 ± 466.0 × Volume fraction (6)
; previously shown in Figure 4a). (a) Heating thermal time constant. A direct linearrelationship (r2 = 0.776) is observed as shown in Equation (5); (b) Cooling thermal time constant.The linear relationship (r2 = 0.629) observed is shown in Equation (6).
In Figure 5a there is a clear linear relationship between the volume fraction and thermal timeconstant (Equation (5)), with the thermal time constant increasing with a greater volume fraction.
Thermal time constant = 3606.1 ± 643.0 − 346.7 ± 93.1 × Volume fraction (5)

Sensors 2017, 17, 1804 10 of 14
Figure 5b gives a similar linear relationship (Equation (6)).
Thermal time constant = 9806.6 ± 3210.0 − 1213.6 ± 466.0 × Volume fraction (6)
The intercept is the intrinsic thermal time constant of the thermistor and could be expected tobe different during either heating or cooling [30]. It was important to note that neither fitting thatwas presented represented the un-encapsulated thermistor well. The gradients also differed notably,by a factor of 3.5. Heating and cooling should have occurred at the same rate if conditions wereidentical, hence if the relationship between volume fraction and time constant was purely due to arestriction of heat flow, the same effect should be observed for both heating and cooling. The differenceobserved may have been due to heat transfer mechanisms occurring as the samples cooled (principallyconvective) as opposed to heated (principally conductive).
For a practical application of the types described, where the garment with temperature-sensingyarns would have close contact with the skin, the latter was of most interest as conductive heat transferwould be dominant. This was a useful general relationship to understand, as future iterations of thistechnology may employ other thermistor types (that are physically larger or smaller). This generalsolution can be applied if a new temperature sensor type is employed. Similarly, this may prove usefulfor engineering the encapsulation for devices that heat up, such as LEDs.
3.2.2. Step Response Time for Electronic Temperature-Sensing Yarns with a Fibre Sheath
Once the thermally resistive effects of the resin micro-pod encapsulation were understood, two setsof experiments were conducted using electronic temperature-sensing yarns to determine how thefibre layers affected the step response time. Two electronic temperature-sensing yarn samples wereattached directly to the hotplate (the oil bath was not used). Two conditions were investigated, usinga temperature-sensing yarn of approximately 1.5 mm diameter, and using a temperature-sensing yarnencased in a secondary knitted sleeve (approximately 4 mm diameter), to better represent a systemwhere a temperature-sensing yarn had been embedded within a textile. In both cases the thermal timeconstants for heating were longer than those when only a resin micro-pod was used as encapsulation.The heating thermal time constants were 8210 ± 1444 µs and 34,175 ± 13,263 µs, and cooling timeconstants 19,440 ± 7339 µs and 37,425 ± 2246 µs for the electronic temperature-sensing yarn withthe additional sleeve and the electronic temperature-sensing yarn, respectively. This correspondedto step response times for heat of 41,050 and 170,875 µs (0.04 and 0.17 s) and cooling of 97,200 and187,125 µs (0.01 and 0.19 s) for the electronic temperature-sensing yarn with the additional sleeveand the electronic temperature-sensing yarn, respectively. It was interesting to note that the examplewith the additional knitted sleeve, and therefore more fibres between the thermistor and hotplate,gave shorter time constants.
The shorter time constant may relate to the thermal properties of the knitted structure due to airbeing trapped within the knitted loops. This potentially trapped warm air may create a micro-climatearound the yarn, limiting heat loss through the top of the yarn (which was not in contact with thehotplate), and allowing the embedded thermistor to heat up more rapidly.
These results support the earlier assertion that the porous knitted structure itself has a limitedeffect on the heat flow to the thermistor. This was reinforced by the fact that the cooling time constantswere not substantially different to those shown in Figure 4.
The above time constants gave a maximum step response time of 0.17 ± 0.07 s for heating,or 0.19 ± 0.01 s for cooling.
3.2.3. Stability and Accuracy of Temperature Readings
Figure 6 shows the recorded temperature of samples with different micro-pod diameters, once anequilibrium condition had been reached.

Sensors 2017, 17, 1804 11 of 14Sensors 2017, 17, 1804 11 of 14
Figure 6. Averaged temperature values once an equilibrium was reached for samples with micro-pod
diameters from 0 mm (unencapsulated) to 1.90 mm. (a) Data presented shows experiments where an
oil bath was used ( ); (b) The samples were attached directly to a hotplate ( ). Data from samples
that have included covering fibres; temperature-sensing yarn ( ), temperature-sensing yarn with an
additional fibrous sheath ( ).
When the oil bath was used (~38 °C), averaged temperatures spanned between 38.184–41.169 °C,
meaning that the temperature readings were in agreement within the measurement error (with one
exception: 1.76 mm diameter encapsulation). The large experimental errors were likely to be due to
convection effects in the oil caused by the insertion of the yarns into the bath (the heating step). The
results of greater interest were those when the samples were placed directly onto the hotplate. This
provided a 38 °C temperature to one side of the thermistor and exposure to the ambient temperature
(25 °C) on the other. This closely represents the conditions that the system would likely experience in
normal operation (in contact with skin on one side and air on the other). Here, the variation in the
results was more restricted, with standard deviations ranging between 0.02 and 0.545 °C. The range
of the averaged temperatures (for four measurements) covered 36.592–38.497 °C, or covered
36.592–37.631 °C when the results from the un-encapsulated package die were excluded. This gave a
higher temperature reading (Figure 6). It was not clear whether the lack of encapsulation meant that
this higher temperature reading of 38.5 °C was achieved, or whether this discrepancy of up to 1.9 °C
was within the manufacturing tolerance of the thermistors. Additional experiments (not presented)
have suggested that a larger temperature difference between the hotplate and ambient temperature
resulted in a greater change in the recorded temperature when encapsulation was used. This would
be due to the greater temperature gradient and therefore the energy losses in the system would mean
that thicker resin micro-pods would never reach the same temperature as the hotplate.
Stability data from the two samples where covering fibres have been included have also been
presented (Figure 6). The data from the electronic temperature-sensing yarn with an additional fibre
sheath ( ) is in agreement with the other data. It is possible that the yarn with the additional fibrous
sheath gave higher recorded temperatures than when only one sheath was used (i.e., normal
temperature-sensing yarn; ) due to warm air becoming trapped within the loops of the knitted
structure, and small air-gaps between the sheath and temperature-sensing yarn. As discussed earlier,
this may create a microclimate around the temperature-sensing yarn, minimizing heat losses to the
environment. It is important to highlight that within a textile the temperature-sensing yarn would be
surrounded by an additional fibrous layer, making the temperature-sensing yarn within an
additional fibre sheath a more representative model of the yarns in their final intended use.
For wound care or diabetic ulcer formation a temperature difference is desired, and not an
absolute temperature. Therefore, any ambiguity about the absolute temperature measurements is not
relevant for these applications as a relative measurement is suitable for predicting foot ulceration or
wound infection. In potential future applications where the yarns might experience a greater
temperature differential an absolute temperature reading could be required. Further work may be
necessary to better characterize this effect.
Figure 6. Averaged temperature values once an equilibrium was reached for samples with micro-poddiameters from 0 mm (unencapsulated) to 1.90 mm. (a) Data presented shows experiments where anoil bath was used (
Sensors 2017, 17, 1804 11 of 14
Figure 6. Averaged temperature values once an equilibrium was reached for samples with micro-pod
diameters from 0 mm (unencapsulated) to 1.90 mm. (a) Data presented shows experiments where an
oil bath was used ( ); (b) The samples were attached directly to a hotplate ( ). Data from samples
that have included covering fibres; temperature-sensing yarn ( ), temperature-sensing yarn with an
additional fibrous sheath ( ).
When the oil bath was used (~38 °C), averaged temperatures spanned between 38.184–41.169 °C,
meaning that the temperature readings were in agreement within the measurement error (with one
exception: 1.76 mm diameter encapsulation). The large experimental errors were likely to be due to
convection effects in the oil caused by the insertion of the yarns into the bath (the heating step). The
results of greater interest were those when the samples were placed directly onto the hotplate. This
provided a 38 °C temperature to one side of the thermistor and exposure to the ambient temperature
(25 °C) on the other. This closely represents the conditions that the system would likely experience in
normal operation (in contact with skin on one side and air on the other). Here, the variation in the
results was more restricted, with standard deviations ranging between 0.02 and 0.545 °C. The range
of the averaged temperatures (for four measurements) covered 36.592–38.497 °C, or covered
36.592–37.631 °C when the results from the un-encapsulated package die were excluded. This gave a
higher temperature reading (Figure 6). It was not clear whether the lack of encapsulation meant that
this higher temperature reading of 38.5 °C was achieved, or whether this discrepancy of up to 1.9 °C
was within the manufacturing tolerance of the thermistors. Additional experiments (not presented)
have suggested that a larger temperature difference between the hotplate and ambient temperature
resulted in a greater change in the recorded temperature when encapsulation was used. This would
be due to the greater temperature gradient and therefore the energy losses in the system would mean
that thicker resin micro-pods would never reach the same temperature as the hotplate.
Stability data from the two samples where covering fibres have been included have also been
presented (Figure 6). The data from the electronic temperature-sensing yarn with an additional fibre
sheath ( ) is in agreement with the other data. It is possible that the yarn with the additional fibrous
sheath gave higher recorded temperatures than when only one sheath was used (i.e., normal
temperature-sensing yarn; ) due to warm air becoming trapped within the loops of the knitted
structure, and small air-gaps between the sheath and temperature-sensing yarn. As discussed earlier,
this may create a microclimate around the temperature-sensing yarn, minimizing heat losses to the
environment. It is important to highlight that within a textile the temperature-sensing yarn would be
surrounded by an additional fibrous layer, making the temperature-sensing yarn within an
additional fibre sheath a more representative model of the yarns in their final intended use.
For wound care or diabetic ulcer formation a temperature difference is desired, and not an
absolute temperature. Therefore, any ambiguity about the absolute temperature measurements is not
relevant for these applications as a relative measurement is suitable for predicting foot ulceration or
wound infection. In potential future applications where the yarns might experience a greater
temperature differential an absolute temperature reading could be required. Further work may be
necessary to better characterize this effect.
); (b) The samples were attached directly to a hotplate (
Sensors 2017, 17, 1804 11 of 14
Figure 6. Averaged temperature values once an equilibrium was reached for samples with micro-pod
diameters from 0 mm (unencapsulated) to 1.90 mm. (a) Data presented shows experiments where an
oil bath was used ( ); (b) The samples were attached directly to a hotplate ( ). Data from samples
that have included covering fibres; temperature-sensing yarn ( ), temperature-sensing yarn with an
additional fibrous sheath ( ).
When the oil bath was used (~38 °C), averaged temperatures spanned between 38.184–41.169 °C,
meaning that the temperature readings were in agreement within the measurement error (with one
exception: 1.76 mm diameter encapsulation). The large experimental errors were likely to be due to
convection effects in the oil caused by the insertion of the yarns into the bath (the heating step). The
results of greater interest were those when the samples were placed directly onto the hotplate. This
provided a 38 °C temperature to one side of the thermistor and exposure to the ambient temperature
(25 °C) on the other. This closely represents the conditions that the system would likely experience in
normal operation (in contact with skin on one side and air on the other). Here, the variation in the
results was more restricted, with standard deviations ranging between 0.02 and 0.545 °C. The range
of the averaged temperatures (for four measurements) covered 36.592–38.497 °C, or covered
36.592–37.631 °C when the results from the un-encapsulated package die were excluded. This gave a
higher temperature reading (Figure 6). It was not clear whether the lack of encapsulation meant that
this higher temperature reading of 38.5 °C was achieved, or whether this discrepancy of up to 1.9 °C
was within the manufacturing tolerance of the thermistors. Additional experiments (not presented)
have suggested that a larger temperature difference between the hotplate and ambient temperature
resulted in a greater change in the recorded temperature when encapsulation was used. This would
be due to the greater temperature gradient and therefore the energy losses in the system would mean
that thicker resin micro-pods would never reach the same temperature as the hotplate.
Stability data from the two samples where covering fibres have been included have also been
presented (Figure 6). The data from the electronic temperature-sensing yarn with an additional fibre
sheath ( ) is in agreement with the other data. It is possible that the yarn with the additional fibrous
sheath gave higher recorded temperatures than when only one sheath was used (i.e., normal
temperature-sensing yarn; ) due to warm air becoming trapped within the loops of the knitted
structure, and small air-gaps between the sheath and temperature-sensing yarn. As discussed earlier,
this may create a microclimate around the temperature-sensing yarn, minimizing heat losses to the
environment. It is important to highlight that within a textile the temperature-sensing yarn would be
surrounded by an additional fibrous layer, making the temperature-sensing yarn within an
additional fibre sheath a more representative model of the yarns in their final intended use.
For wound care or diabetic ulcer formation a temperature difference is desired, and not an
absolute temperature. Therefore, any ambiguity about the absolute temperature measurements is not
relevant for these applications as a relative measurement is suitable for predicting foot ulceration or
wound infection. In potential future applications where the yarns might experience a greater
temperature differential an absolute temperature reading could be required. Further work may be
necessary to better characterize this effect.
). Data from samplesthat have included covering fibres; temperature-sensing yarn (
Sensors 2017, 17, 1804 11 of 14
Figure 6. Averaged temperature values once an equilibrium was reached for samples with micro-pod
diameters from 0 mm (unencapsulated) to 1.90 mm. (a) Data presented shows experiments where an
oil bath was used ( ); (b) The samples were attached directly to a hotplate ( ). Data from samples
that have included covering fibres; temperature-sensing yarn ( ), temperature-sensing yarn with an
additional fibrous sheath ( ).
When the oil bath was used (~38 °C), averaged temperatures spanned between 38.184–41.169 °C,
meaning that the temperature readings were in agreement within the measurement error (with one
exception: 1.76 mm diameter encapsulation). The large experimental errors were likely to be due to
convection effects in the oil caused by the insertion of the yarns into the bath (the heating step). The
results of greater interest were those when the samples were placed directly onto the hotplate. This
provided a 38 °C temperature to one side of the thermistor and exposure to the ambient temperature
(25 °C) on the other. This closely represents the conditions that the system would likely experience in
normal operation (in contact with skin on one side and air on the other). Here, the variation in the
results was more restricted, with standard deviations ranging between 0.02 and 0.545 °C. The range
of the averaged temperatures (for four measurements) covered 36.592–38.497 °C, or covered
36.592–37.631 °C when the results from the un-encapsulated package die were excluded. This gave a
higher temperature reading (Figure 6). It was not clear whether the lack of encapsulation meant that
this higher temperature reading of 38.5 °C was achieved, or whether this discrepancy of up to 1.9 °C
was within the manufacturing tolerance of the thermistors. Additional experiments (not presented)
have suggested that a larger temperature difference between the hotplate and ambient temperature
resulted in a greater change in the recorded temperature when encapsulation was used. This would
be due to the greater temperature gradient and therefore the energy losses in the system would mean
that thicker resin micro-pods would never reach the same temperature as the hotplate.
Stability data from the two samples where covering fibres have been included have also been
presented (Figure 6). The data from the electronic temperature-sensing yarn with an additional fibre
sheath ( ) is in agreement with the other data. It is possible that the yarn with the additional fibrous
sheath gave higher recorded temperatures than when only one sheath was used (i.e., normal
temperature-sensing yarn; ) due to warm air becoming trapped within the loops of the knitted
structure, and small air-gaps between the sheath and temperature-sensing yarn. As discussed earlier,
this may create a microclimate around the temperature-sensing yarn, minimizing heat losses to the
environment. It is important to highlight that within a textile the temperature-sensing yarn would be
surrounded by an additional fibrous layer, making the temperature-sensing yarn within an
additional fibre sheath a more representative model of the yarns in their final intended use.
For wound care or diabetic ulcer formation a temperature difference is desired, and not an
absolute temperature. Therefore, any ambiguity about the absolute temperature measurements is not
relevant for these applications as a relative measurement is suitable for predicting foot ulceration or
wound infection. In potential future applications where the yarns might experience a greater
temperature differential an absolute temperature reading could be required. Further work may be
necessary to better characterize this effect.
), temperature-sensing yarn with anadditional fibrous sheath (
Sensors 2017, 17, 1804 11 of 14
Figure 6. Averaged temperature values once an equilibrium was reached for samples with micro-pod
diameters from 0 mm (unencapsulated) to 1.90 mm. (a) Data presented shows experiments where an
oil bath was used ( ); (b) The samples were attached directly to a hotplate ( ). Data from samples
that have included covering fibres; temperature-sensing yarn ( ), temperature-sensing yarn with an
additional fibrous sheath ( ).
When the oil bath was used (~38 °C), averaged temperatures spanned between 38.184–41.169 °C,
meaning that the temperature readings were in agreement within the measurement error (with one
exception: 1.76 mm diameter encapsulation). The large experimental errors were likely to be due to
convection effects in the oil caused by the insertion of the yarns into the bath (the heating step). The
results of greater interest were those when the samples were placed directly onto the hotplate. This
provided a 38 °C temperature to one side of the thermistor and exposure to the ambient temperature
(25 °C) on the other. This closely represents the conditions that the system would likely experience in
normal operation (in contact with skin on one side and air on the other). Here, the variation in the
results was more restricted, with standard deviations ranging between 0.02 and 0.545 °C. The range
of the averaged temperatures (for four measurements) covered 36.592–38.497 °C, or covered
36.592–37.631 °C when the results from the un-encapsulated package die were excluded. This gave a
higher temperature reading (Figure 6). It was not clear whether the lack of encapsulation meant that
this higher temperature reading of 38.5 °C was achieved, or whether this discrepancy of up to 1.9 °C
was within the manufacturing tolerance of the thermistors. Additional experiments (not presented)
have suggested that a larger temperature difference between the hotplate and ambient temperature
resulted in a greater change in the recorded temperature when encapsulation was used. This would
be due to the greater temperature gradient and therefore the energy losses in the system would mean
that thicker resin micro-pods would never reach the same temperature as the hotplate.
Stability data from the two samples where covering fibres have been included have also been
presented (Figure 6). The data from the electronic temperature-sensing yarn with an additional fibre
sheath ( ) is in agreement with the other data. It is possible that the yarn with the additional fibrous
sheath gave higher recorded temperatures than when only one sheath was used (i.e., normal
temperature-sensing yarn; ) due to warm air becoming trapped within the loops of the knitted
structure, and small air-gaps between the sheath and temperature-sensing yarn. As discussed earlier,
this may create a microclimate around the temperature-sensing yarn, minimizing heat losses to the
environment. It is important to highlight that within a textile the temperature-sensing yarn would be
surrounded by an additional fibrous layer, making the temperature-sensing yarn within an
additional fibre sheath a more representative model of the yarns in their final intended use.
For wound care or diabetic ulcer formation a temperature difference is desired, and not an
absolute temperature. Therefore, any ambiguity about the absolute temperature measurements is not
relevant for these applications as a relative measurement is suitable for predicting foot ulceration or
wound infection. In potential future applications where the yarns might experience a greater
temperature differential an absolute temperature reading could be required. Further work may be
necessary to better characterize this effect.
).
When the oil bath was used (~38 C), averaged temperatures spanned between 38.184–41.169 C,meaning that the temperature readings were in agreement within the measurement error (with oneexception: 1.76 mm diameter encapsulation). The large experimental errors were likely to be dueto convection effects in the oil caused by the insertion of the yarns into the bath (the heating step).The results of greater interest were those when the samples were placed directly onto the hotplate.This provided a 38 C temperature to one side of the thermistor and exposure to the ambienttemperature (25 C) on the other. This closely represents the conditions that the system wouldlikely experience in normal operation (in contact with skin on one side and air on the other). Here,the variation in the results was more restricted, with standard deviations ranging between 0.02 and0.545 C. The range of the averaged temperatures (for four measurements) covered 36.592–38.497 C,or covered 36.592–37.631 C when the results from the un-encapsulated package die were excluded.This gave a higher temperature reading (Figure 6). It was not clear whether the lack of encapsulationmeant that this higher temperature reading of 38.5 C was achieved, or whether this discrepancyof up to 1.9 C was within the manufacturing tolerance of the thermistors. Additional experiments(not presented) have suggested that a larger temperature difference between the hotplate and ambienttemperature resulted in a greater change in the recorded temperature when encapsulation was used.This would be due to the greater temperature gradient and therefore the energy losses in the systemwould mean that thicker resin micro-pods would never reach the same temperature as the hotplate.
Stability data from the two samples where covering fibres have been included have also beenpresented (Figure 6). The data from the electronic temperature-sensing yarn with an additionalfibre sheath (
Sensors 2017, 17, 1804 11 of 14
Figure 6. Averaged temperature values once an equilibrium was reached for samples with micro-pod
diameters from 0 mm (unencapsulated) to 1.90 mm. (a) Data presented shows experiments where an
oil bath was used ( ); (b) The samples were attached directly to a hotplate ( ). Data from samples
that have included covering fibres; temperature-sensing yarn ( ), temperature-sensing yarn with an
additional fibrous sheath ( ).
When the oil bath was used (~38 °C), averaged temperatures spanned between 38.184–41.169 °C,
meaning that the temperature readings were in agreement within the measurement error (with one
exception: 1.76 mm diameter encapsulation). The large experimental errors were likely to be due to
convection effects in the oil caused by the insertion of the yarns into the bath (the heating step). The
results of greater interest were those when the samples were placed directly onto the hotplate. This
provided a 38 °C temperature to one side of the thermistor and exposure to the ambient temperature
(25 °C) on the other. This closely represents the conditions that the system would likely experience in
normal operation (in contact with skin on one side and air on the other). Here, the variation in the
results was more restricted, with standard deviations ranging between 0.02 and 0.545 °C. The range
of the averaged temperatures (for four measurements) covered 36.592–38.497 °C, or covered
36.592–37.631 °C when the results from the un-encapsulated package die were excluded. This gave a
higher temperature reading (Figure 6). It was not clear whether the lack of encapsulation meant that
this higher temperature reading of 38.5 °C was achieved, or whether this discrepancy of up to 1.9 °C
was within the manufacturing tolerance of the thermistors. Additional experiments (not presented)
have suggested that a larger temperature difference between the hotplate and ambient temperature
resulted in a greater change in the recorded temperature when encapsulation was used. This would
be due to the greater temperature gradient and therefore the energy losses in the system would mean
that thicker resin micro-pods would never reach the same temperature as the hotplate.
Stability data from the two samples where covering fibres have been included have also been
presented (Figure 6). The data from the electronic temperature-sensing yarn with an additional fibre
sheath ( ) is in agreement with the other data. It is possible that the yarn with the additional fibrous
sheath gave higher recorded temperatures than when only one sheath was used (i.e., normal
temperature-sensing yarn; ) due to warm air becoming trapped within the loops of the knitted
structure, and small air-gaps between the sheath and temperature-sensing yarn. As discussed earlier,
this may create a microclimate around the temperature-sensing yarn, minimizing heat losses to the
environment. It is important to highlight that within a textile the temperature-sensing yarn would be
surrounded by an additional fibrous layer, making the temperature-sensing yarn within an
additional fibre sheath a more representative model of the yarns in their final intended use.
For wound care or diabetic ulcer formation a temperature difference is desired, and not an
absolute temperature. Therefore, any ambiguity about the absolute temperature measurements is not
relevant for these applications as a relative measurement is suitable for predicting foot ulceration or
wound infection. In potential future applications where the yarns might experience a greater
temperature differential an absolute temperature reading could be required. Further work may be
necessary to better characterize this effect.
) is in agreement with the other data. It is possible that the yarn with the additionalfibrous sheath gave higher recorded temperatures than when only one sheath was used (i.e., normaltemperature-sensing yarn;
Sensors 2017, 17, 1804 11 of 14
Figure 6. Averaged temperature values once an equilibrium was reached for samples with micro-pod
diameters from 0 mm (unencapsulated) to 1.90 mm. (a) Data presented shows experiments where an
oil bath was used ( ); (b) The samples were attached directly to a hotplate ( ). Data from samples
that have included covering fibres; temperature-sensing yarn ( ), temperature-sensing yarn with an
additional fibrous sheath ( ).
When the oil bath was used (~38 °C), averaged temperatures spanned between 38.184–41.169 °C,
meaning that the temperature readings were in agreement within the measurement error (with one
exception: 1.76 mm diameter encapsulation). The large experimental errors were likely to be due to
convection effects in the oil caused by the insertion of the yarns into the bath (the heating step). The
results of greater interest were those when the samples were placed directly onto the hotplate. This
provided a 38 °C temperature to one side of the thermistor and exposure to the ambient temperature
(25 °C) on the other. This closely represents the conditions that the system would likely experience in
normal operation (in contact with skin on one side and air on the other). Here, the variation in the
results was more restricted, with standard deviations ranging between 0.02 and 0.545 °C. The range
of the averaged temperatures (for four measurements) covered 36.592–38.497 °C, or covered
36.592–37.631 °C when the results from the un-encapsulated package die were excluded. This gave a
higher temperature reading (Figure 6). It was not clear whether the lack of encapsulation meant that
this higher temperature reading of 38.5 °C was achieved, or whether this discrepancy of up to 1.9 °C
was within the manufacturing tolerance of the thermistors. Additional experiments (not presented)
have suggested that a larger temperature difference between the hotplate and ambient temperature
resulted in a greater change in the recorded temperature when encapsulation was used. This would
be due to the greater temperature gradient and therefore the energy losses in the system would mean
that thicker resin micro-pods would never reach the same temperature as the hotplate.
Stability data from the two samples where covering fibres have been included have also been
presented (Figure 6). The data from the electronic temperature-sensing yarn with an additional fibre
sheath ( ) is in agreement with the other data. It is possible that the yarn with the additional fibrous
sheath gave higher recorded temperatures than when only one sheath was used (i.e., normal
temperature-sensing yarn; ) due to warm air becoming trapped within the loops of the knitted
structure, and small air-gaps between the sheath and temperature-sensing yarn. As discussed earlier,
this may create a microclimate around the temperature-sensing yarn, minimizing heat losses to the
environment. It is important to highlight that within a textile the temperature-sensing yarn would be
surrounded by an additional fibrous layer, making the temperature-sensing yarn within an
additional fibre sheath a more representative model of the yarns in their final intended use.
For wound care or diabetic ulcer formation a temperature difference is desired, and not an
absolute temperature. Therefore, any ambiguity about the absolute temperature measurements is not
relevant for these applications as a relative measurement is suitable for predicting foot ulceration or
wound infection. In potential future applications where the yarns might experience a greater
temperature differential an absolute temperature reading could be required. Further work may be
necessary to better characterize this effect.
) due to warm air becoming trapped within the loops of the knittedstructure, and small air-gaps between the sheath and temperature-sensing yarn. As discussed earlier,this may create a microclimate around the temperature-sensing yarn, minimizing heat losses to theenvironment. It is important to highlight that within a textile the temperature-sensing yarn would besurrounded by an additional fibrous layer, making the temperature-sensing yarn within an additionalfibre sheath a more representative model of the yarns in their final intended use.
For wound care or diabetic ulcer formation a temperature difference is desired, and not an absolutetemperature. Therefore, any ambiguity about the absolute temperature measurements is not relevantfor these applications as a relative measurement is suitable for predicting foot ulceration or woundinfection. In potential future applications where the yarns might experience a greater temperature

Sensors 2017, 17, 1804 12 of 14
differential an absolute temperature reading could be required. Further work may be necessary tobetter characterize this effect.
3.3. Prototype Temperature-Sensing Sock
A temperature-sensing sock capable of remotely monitoring skin temperature was producedto show the utility of a network of electronic temperature-sensing yarns in a garment. Electronictemperature-sensing yarns were incorporated into the knitted, prototype sock. The sock was testedon one of the investigators as shown in Figure 7 (left). The sensor network provided temperaturemeasurements of 29.4 C, 29.2 C, 29.9 C, 29.6 C, 29.6 C from five points in contact with thesole of a foot. While these absolute temperatures were lower than body temperature they werewithin one standard deviation of mean measured foot temperatures presented in the literature(30.6 ± 2.6 C) [31]. The relative measured temperatures differed by a maximum of 0.7 C (ultimately,the relative measurement is of interest for foot ulcer formation).
Sensors 2017, 17, 1804 12 of 14
3.3. Prototype Temperature-Sensing Sock
A temperature-sensing sock capable of remotely monitoring skin temperature was produced to
show the utility of a network of electronic temperature-sensing yarns in a garment. Electronic
temperature-sensing yarns were incorporated into the knitted, prototype sock. The sock was tested
on one of the investigators as shown in Figure 7 (left). The sensor network provided temperature
measurements of 29.4 °C, 29.2 °C, 29.9 °C, 29.6 °C, 29.6 °C from five points in contact with the sole of
a foot. While these absolute temperatures were lower than body temperature they were within one
standard deviation of mean measured foot temperatures presented in the literature (30.6 ± 2.6 °C)
[31]. The relative measured temperatures differed by a maximum of 0.7 °C (ultimately, the relative
measurement is of interest for foot ulcer formation).
Figure 7. Prototype sock made with five electronic temperature-sensing yarns. (Left) Photograph of
the prototype; (Right) Computer interface using LabVIEW. The interface shows temperature readings
for five areas on the prototype garment using both numbers (not visible here) and a colour change.
4. Conclusions
Thermistors were encapsulated within yarns, and subsequently within textiles, to create a novel
skin temperature monitoring solution. The electronic temperature sensor yarns were characterized
to establish their suitability for monitoring diabetic foot ulcer formation and wound infection, which
informed the temperature range and conditions explored within this work.
The formation of a polymer micro-pod to protect the thermistor is a critical step in chip
encapsulation and the effects of this process have been fully investigated for these temperature
monitoring applications. It was observed that very short step response times of 0.01–0.04 s when
heating or 0.02–0.35 s when cooling were achievable. When the encapsulated thermistors were placed
within electronic temperature-sensing yarns a maximum step-response time of 0.17 ± 0.07 s for
heating, or 0.19 ± 0.01 s for cooling was calculated. This was well within the temporal resolution
necessary for a sensor of this type, where temperature changes would occur over the course of hours.
In the temperature range of interest, the inclusion of the micro-pod showed a functional
relationship between the response time (a function of the thermal time constant) and micro-pod
diameter. This relationship has been explored to provide a more general solution for the way in which
encapsulation may affect temperature readings for other thermistor sizes or the heat transfer through
a micro-pod in other applications (for example an encapsulated device such as an LED heating up).
The accuracy of the electronic temperature-sensing yarns was determined to be within ±0.5 °C
for 63% of measurements as shown when the calibration of the yarns was performed. This was further
supported by the data shown in Figure 6b. This level of accuracy (±0.5 °C for 63% of measurements)
may not be sufficient for the application of detecting diabetic foot ulcer formation and if it is found
to be the case then future work will need to investigate the use of more accurate temperature-sensing
elements to improve this.
The creation of a remote, representative, prototype temperature-difference monitoring device (a
sock) for skin measurements opens up a number of exciting possibilities for both clinical and
Figure 7. Prototype sock made with five electronic temperature-sensing yarns. (Left) Photograph ofthe prototype; (Right) Computer interface using LabVIEW. The interface shows temperature readingsfor five areas on the prototype garment using both numbers (not visible here) and a colour change.
4. Conclusions
Thermistors were encapsulated within yarns, and subsequently within textiles, to create a novelskin temperature monitoring solution. The electronic temperature sensor yarns were characterizedto establish their suitability for monitoring diabetic foot ulcer formation and wound infection,which informed the temperature range and conditions explored within this work.
The formation of a polymer micro-pod to protect the thermistor is a critical step in chipencapsulation and the effects of this process have been fully investigated for these temperaturemonitoring applications. It was observed that very short step response times of 0.01–0.04 s whenheating or 0.02–0.35 s when cooling were achievable. When the encapsulated thermistors were placedwithin electronic temperature-sensing yarns a maximum step-response time of 0.17 ± 0.07 s for heating,or 0.19 ± 0.01 s for cooling was calculated. This was well within the temporal resolution necessary fora sensor of this type, where temperature changes would occur over the course of hours.
In the temperature range of interest, the inclusion of the micro-pod showed a functionalrelationship between the response time (a function of the thermal time constant) and micro-poddiameter. This relationship has been explored to provide a more general solution for the way in whichencapsulation may affect temperature readings for other thermistor sizes or the heat transfer througha micro-pod in other applications (for example an encapsulated device such as an LED heating up).
The accuracy of the electronic temperature-sensing yarns was determined to be within ±0.5 Cfor 63% of measurements as shown when the calibration of the yarns was performed. This was furthersupported by the data shown in Figure 6b. This level of accuracy (±0.5 C for 63% of measurements)may not be sufficient for the application of detecting diabetic foot ulcer formation and if it is found to

Sensors 2017, 17, 1804 13 of 14
be the case then future work will need to investigate the use of more accurate temperature-sensingelements to improve this
The creation of a remote, representative, prototype temperature-difference monitoring device(a sock) for skin measurements opens up a number of exciting possibilities for both clinical andpre-clinical studies. In future studies, a system-level evaluation of the presented sock will be conductedto ready the technology for use in potential pre-clinical studies.
Future work will also exploit this innovation to address the apparent absence in the literature ofguidance on the temperature variation during wound infection.
In conclusion, the novel electronic temperature-sensing yarn presented here has been shownto be well-suited for making long-term measurements of temperature when incorporated intoa garment. The yarn was used to create an innovative skin-temperature-difference monitoring devicecapable of providing remote, continuous temperature measurements at given points on the skin.The miniature size of the temperature sensors makes them invisible to the end user and is well-suitedfor wearable applications.
Acknowledgments: The authors would like to thank Carlos Oliveira for knitting the sock, Ioannis Anastaspoulosand Mohamad Nour Nashed for assistance with sample preparation, Arash Shahidi for assistance with thetensile tests, and Dorothy Hardy for proof-reading the manuscript. Pasindu Lugoda gratefully acknowledgesNottingham Trent University for funding under the Vice Chancellors Bursary Award. This research receivedfunding from the Defence Science and Technology Laboratory through the Centre for Defence Enterprise.
Author Contributions: T.D., T.H.R. and P.L. designed the study. P.L. and T.H.R. conducted the experimentsand preformed data analysis. R.H.M. provided specialist expertise in measurement science and interfacing. C.T.provided technical expertise. All authors discussed the results and contributed to producing the final manuscript.
Conflicts of Interest: The authors declare no conflict of interest.
References
1. Sessler, D.I. Temperature monitoring and perioperative thermoregulation. J. Am. Soc. Anesthesiol. 2008, 109,318–338. [CrossRef] [PubMed]
2. Guadagni, D.N.; Kreith, F.; Smyth, C.J.; Bartholomew, B.A. Contact probe for skin temperature measurements.J. Phys. E Sci. Instrum. 1972, 5, 869. [CrossRef]
3. Stoll, A.M. Techniques and uses of skin temperature measurements. Ann. N. Y. Acad. Sci. 1964, 121, 49–56.[CrossRef] [PubMed]
4. Webb, R.C.; Bonifas, A.P.; Behnaz, A.; Zhang, Y.; Yu, K.J.; Cheng, H.; Shi, M.; Bian, Z.; Liu, Z.; Kim, Y.S.; et al.Ultrathin conformal devices for precise and continuous thermal characterization of human skin. Nat. Mater.2013, 12, 938. [CrossRef] [PubMed]
5. Burnham, R.S.; McKinley, R.S.; Vincent, D.D. Three types of skin-surface thermometers: A comparison ofreliability, validity, and responsiveness. Am. J. Phys. Med. Rehabilit. 2006, 85, 553–558. [CrossRef] [PubMed]
6. Tanda, G. The use of infrared thermography to detect the skin temperature response to physical activity.J. Phys. Conf. Ser. 2015, 655, 012062. [CrossRef]
7. Hardy, J.D. The radiation of heat from the human body: III. The human skin as a black-body radiator.J. Clin. Investig. 1934, 13, 615. [CrossRef] [PubMed]
8. Lugoda, P.; Dias, T.; Morris, R. Electronic Temperature Sensing Yarn. J. Multidiscip. Eng. Sci. Stud. 2015, 1,100–103.
9. Dias, T.K.; Rathnayake, A. Electronically Functional Yarns. Patent WO2016/038342 A1, 17 March 2016.10. Lavery, L.A.; Higgins, K.R.; Lanctot, D.R.; Constantinides, G.P.; Zamorano, R.G.; Armstrong, D.G.;
Athanasiou, K.A.; Agrawal, C.M. Home monitoring of foot skin temperatures to prevent ulceration.Diabetes Care 2004, 27, 2642–2647. [CrossRef] [PubMed]
11. Armstrong, D.G.; Holtz-Neiderer, K.; Wendel, C.; Mohler, M.J.; Kimbrielb, H.R.; Lavery, L.A. SkinTemperature Monitoring Reduces the Risk for Diabetic Foot Ulceration in High-Risk Patients. Am. J. Med.2007, 120, 1042–1046. [CrossRef] [PubMed]
12. Lavery, L.A.; Higgins, K.R.; Lanctot, D.R.; Constantinides, G.P.; Zamorano, R.G.; Athanasiou, K.A.;Armstrong, D.G.; Agrawal, C.M. Preventing diabetic foot ulcer recurrence in high-risk patients: Use oftemperature monitoring as a self-assessment tool. Diabetes Care 2007, 30, 14–20. [CrossRef] [PubMed]

Sensors 2017, 17, 1804 14 of 14
13. Nakagami, G.; Sanada, H.; Iizaka, S.; Kadono, T.; Higashino, T.; Koyanagi, H.; Haga, N. Predicting delayedpressure ulcer healing using thermography: A prospective cohort study. J. Wound Care 2010, 19, 465–472.[CrossRef] [PubMed]
14. Peregrina-Barreto, H.; Morales-Hernandez, L.A.; Rangel-Magdaleno, J.J.; Avina-Cervantes, J.G.;Ramirez-Cortes, J.M.; Morales-Caporal, R. Quantitative Estimation of Temperature Variations in PlantarAngiosomes: A Study Case for Diabetic Foot. Comput. Math. Methods Med. 2014, 2014. [CrossRef] [PubMed]
15. Chaves, M.E.A.; Silva, F.S.; Soares, V.P.C.; Ferreira, R.A.M.; Gomes, F.S.L.; Andrade, R.M.; Pinotti, M.Evaluation of healing of pressure ulcers through thermography: A preliminary study. Res. Biomed. Eng.2015, 31, 3–9. [CrossRef]
16. Mufti, A.; Coutts, P.; Sibbald, R.G. Validation of commercially available infrared thermometers for measuringskin surface temperature associated with deep and surrounding wound infection. Adv. Skin Wound Care2015, 28, 11–16. [CrossRef] [PubMed]
17. Yusuf, S.; Okuwa, M.; Shigeta, Y.; Dai, M.; Iuchi, T.; Rahman, S.; Usman, A.; Kasim, S.; Sugama, J.;Nakatani, T.; et al. Microclimate and development of pressure ulcers and superficial skin changes. Int. Wound J.2015, 12, 40–46. [CrossRef] [PubMed]
18. Husain, M.D.; Kennon, R.; Dias, T. Design and fabrication of Temperature Sensing Fabric. J. Ind. Text. 2013,44, 398–417. [CrossRef]
19. Sibinski, M.; Jakubowska, M.; Sloma, M. Flexible temperature sensors on fibers. Sensors 2010, 10, 7934–7946.[CrossRef] [PubMed]
20. Moser, Y.; Gijs, M.A.M. Miniaturized Flexible Temperature Sensor. J. Microelectromech. Syst. 2007, 16,1349–1354. [CrossRef]
21. Krzysztof, G.; Jacek, G.; Jacek, L. Temperature Measurements in a Textronic Fireman Suit and Visualisationof the Results. Fibres Text. East. Eur. 2009, 17, 97–101.
22. Cherenack, K.; Zysset, C.; Kinkeldei, T.; Münzenrieder, N.; Tröster, G. Woven electronic fibers with sensingand display functions for smart textiles. Adv. Mater. 2010, 22, 5178–5182. [CrossRef] [PubMed]
23. Joint Committee for Guides in Metrology. International Vocabulary of Metrology–Basic and General Concepts andAssociated Terms (VIM), 3rd ed.; International Organization for Standardization: Geneva, Switzerland, 2012.
24. Egan, G.F.; Johnson, J.; Farrell, M.; MacAllen, R.; Zamarripa, F.; McKinley, M.J.; Lancaster, J.; Denton, D.;Fox, P.T. Cortical, thalamic, and hypothalamic responses to cooling and warming the skin in awake humans:A positron-emission tomography study. Proc. Natl. Acad. Sci. USA 2005, 102, 5262–5267. [CrossRef][PubMed]
25. Gockenbach, M.; Schmidtke, K. Newton’s law of heating and the heat equation. Involv. J. Math. 2009, 2,419–437. [CrossRef]
26. Jones, E.; Oliphant, T.; Peterson, P. SciPy: Open Source Scientific Tools for Python. 2001. Available online:http://www.scipy.org/ (accessed on 4 May 2017).
27. Hunter, J.D. Matplotlib: A 2D graphics environment. Comput. Sci. Eng. 2007, 9, 90–95. [CrossRef]28. Kimball, B.R.; DeCristofano, B.; Caldarella, G. Thermistor Calibration Procedure for Simulated Skin Sensors;
Technical Report Natick/TR93/024 1993; U.S. Army Natick Research, Development and Engineering CenterNatick: Natick, MA, USA, 1993.
29. White, D.R.; Hill, K.; del Campo, D.; Garcia Izquierdo, C. Guide on Secondary Thermometry: ThermistorThermometry; Bureau International des Poids et Mesures: Paris, France, 2014.
30. Ohizumi-Mfg.jp. Technical Note: Ohizumi Mfg. Co., Ltd. 2017. Available online: http://www.ohizumi-mfg.jp/english/product/technote1.html (accessed on 14 June 2017).
31. Nardin, R.A.; Fogerson, P.M.; Nie, R.; Rutkove, S.B. Foot temperature in healthy individuals: Effects ofambient temperature and age. J. Am. Podiatr. Med. Assoc. 2010, 100, 258–264. [CrossRef] [PubMed]
© 2017 by the authors. Licensee MDPI, Basel, Switzerland. This article is an open accessarticle distributed under the terms and conditions of the Creative Commons Attribution(CC BY) license (http://creativecommons.org/licenses/by/4.0/).


