แนวปฏิบัติการสอบเทียบ Compact Prover (CPP) เทียบกับถังตวง ... · แนวปฏิบัติการสอบเทียบ
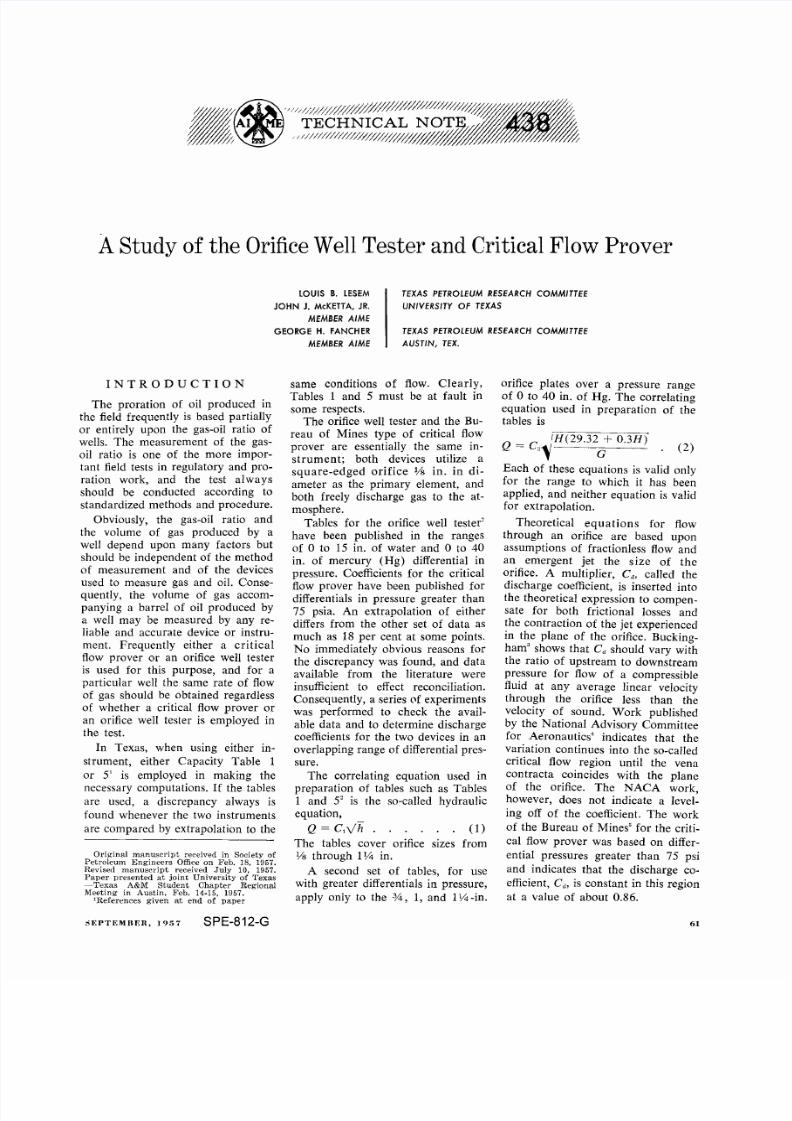
8/11/2019 A Study of the Orifice Well Tester and Critical Flow Prover
http://slidepdf.com/reader/full/a-study-of-the-orifice-well-tester-and-critical-flow-prover 1/4
AStudy of the Orifice Well Tester and Critical Flow Prover
lOUIS B.
lESEM
JOHN J. McKETTA, JR.
TEXAS
PETROLEUM
RESEARCH
COMMITTEE
UNIVERSITY OF TEXAS
MEMBER
AIME
GEORGE H.
FANCHER
MEMBER AIME
TEXAS
PETROLEUM RESEARCH COMMITTEE
AUSTIN
TEX
INTRODUCT ION
The
proration
of
oil produced in
the field frequently
is
based partially
or entirely upon the gas-oil ratio of
wells. The measurement of the gas
oil ratio is one
of
the more impor
tant field tests in regulatory and pro
ration work, and the test always
should be conducted according to
standardized methods and procedure.
Obviously, the gas-oil ratio and
the volume of gas produced by a
well depend upon many factors but
should be independent of the method
of
measurement and
of
the devices
used to measure gas and oil. Conse
quently, the volume of gas accom
panying a barrel of oil produced by
a weI may be measured by any re
liable and accurate device or instru
ment. Frequently either a
critical
flow prover or an orifice well tester
is
used for this purpose, and for a
particular well the same rate of flow
of gas should be obtained regardless
of whether a critical flow prover or
an orifice well tester is employed in
the test.
In Texas, when using either in
strument, either Capacity Table 1
or
5' is employed in making the
necessary computations.
f
the tables
are used, a discrepancy always
is
found whenever the two instruments
are compared by extrapolation to the
Original manuscript
received in Society
of
Petroleum Engineers
Office
on
Feb. 18,
1957,
Revised
manuscript
received July 10.
1957.
Paper
presented
a t joint
University of
T'exas
Texas A&M Student
Chapter
Regional
Meeting in Austin, Feb.
14-15, 1957.
lReferences given
at
end of
paper
SEPTEMBER, ] 957
SPE-812-G
same conditions of flow. Clearly,
Tables 1
and
5 must be at fault in
some respects.
The orifice well tester and the Bu
reau of Mines type of critical flow
prover are essentially the same
in
strument;
both devices utilize a
square-edged orifice V8 in. in di
ameter as the primary element, and
both freely discharge gas to the at
mosphere.
Tables for the orifice well tester'
have been published in the ranges
of
0 to 15 in.
of
water and 0 to 40
in.
of
mercury
(Hg)
differential in
pressure. Coefficients for the critical
flow prover have been published for
differentials in pressure greater than
75 psia.
An
extrapolation of either
differs from the other set of data as
much as
18
per
cent at some points.
No
immediately obvious reasons for
the discrepancy was found,
and
data
available from the literature were
insufficient to effect reconciliation.
Consequently, a series (\f experiments
was performed to check the avail
able data and to determine discharge
coefficients for the two devices in an
overlapping range
of
differential pres
sure.
The correlating equation used in
preparation of tables such as Tables
1 and 5' is the so-called hydraulic
equation,
Q = C,v h .
1)
The
tables cover orifice sizes from
VB
through 11,4 in.
A second set of tables, for use
with greater differentials in pressure,
apply only to the , 1, and 1Y -in.
orifice plates over a pressure range
of 0
to
40 in. of Hg. The correlating
equation used in preparation
of
the
tables is
Q
_ C H(29.32 0.3H)
- ~
G
(2)
Each of these equations
is
valid only
for the range to which it has been
applied, and neither equation is valid
for extrapolation.
Theoretical
equations
for flow
through an orifice are based upon
assumptions of fractionless flow and
an
emergent jet the size of the
orifice. A multiplier,
Cd
called the
discharge coefficient,
is
inserted into
the theoretical expression to compen
sate for both frictional losses and
the contraction of the jet experienced
in the plane
of
the orifice. Bucking
ham shows tha t Cd should vary with
the ratio of upstream to downstream
pressure for flow of a compressible
fluid at any average linear velocity
through the orifice less than the
velocity of sound.
Work
published
by the National Advisory Committee
for Aeronautics' indicates that the
variation continues into the so-called
critical flow region until the vena
contracta coincides with the plane
of the orifice. The NACA work,
however, does not indicate a level
ing off
of
the coefficient.
The
work
of
the Bureau
of
Mines'
for
the criti
cal flow prover was based on differ
ential pressures greater
than
75 psi
and indicates that the discharge co
efficient,
Cd,
is constant in this region
at a value
of
about 0.86.
61
8/11/2019 A Study of the Orifice Well Tester and Critical Flow Prover
http://slidepdf.com/reader/full/a-study-of-the-orifice-well-tester-and-critical-flow-prover 2/4
On
the basis
of
the work which has
been cited, experiments were initiated to
determine the discharge coefficients for
TABLE 1 - CAPACITIES FOR 2 IN. ORIFICE WELL
TESTER'; Mel/DAY, PRESSURE
BASE, 14.65
PSIA SP.
GR. 0.60; BASE AND FLOWING TEMPERATURE, 60°F
Pressure
Inches of
Woter
1.0
1.2
1.4
1.6
1.8
2.0
2.2
2.4
2.6
2.8
3.0
3.2
3.4
J.6
3.8
4.0
4.5
5.0
5.5
6.0
6.5
7.0
8.0
9.0
10.0
11.
12.
13.
14.
15.
16.
17.
18.
19.
20.
22.
24.
26.
28.
30.
32.
34.
36.
38.
40.
42.
44.
46.
48.
50.
52.
54.
~ 6 .
58.
60.
62.
64.
66.
68.
70.
72.
74.
76.
78.
80.
82.
84.
86.
88.
90.
92.
94.
96.
98.
100.
/.
.379
.415
.499
.480
.509
.536
.562
.587
.611
.635
.658
.679
.700
.720
.740
.759
.805
.850
.891
.931
.969
1.01
1.08
1.14
1.20
1.27
1.32
1.38
1.43
1.48
1.53
1.58
1.62
1.67
1.71
1.80
1.88
1.96
2.04
2.11
2.19
2.26
2.32
2.39
2.46
2.52
2.58
2.64
2.70
2.76
2.82
2.87
2.93
2.98
3.04
3.09
3.14
3.19
3.25
3.30
3.35
3.40
3.44
3.49
3.54
3.59
3.64
3.69
3.73
3.78
3.83
3.87
3.92
3.96
4.00
1.75 in. ID.
Orifice Size Inches
I. 3/. /2 f4 1 1 I.
1.51 3.41 6.08 13.9 25.6 44.0
1.66 3.74 6.67
15.2
28.1 48.3
1.79 4.04 7.20 16.4 ~ 0 . 4 52.1
1.92
4.32 7.70 17.6
32.5
55.7
2.03
4.58
8.16 18.6 34.4 59.1
2.14 4.83
8.61
19.6
36.3 62.2
2.25 5.07 9.03 20.6 38.1 65.3
2.35 5.29 9.43
21.5
39.7
68.2
2.45 5.51 9.81 22.4 41.4 70.9
2.54
5.72
10.2
23.3
43.0 73.7
2.63
5.92
10.6 24.1 44.5 76.3
2.72
6.12
10.9
24.9 45.9 78.8
2.80 6.31 11.2 25.6 47.4 81.2
2.88 6.49 11.6 26.4 48.7 83.5
2.96 6.67 11.9 27.1 50.1 85.8
3.04 6.84
12.2
27.8 51.4 88.0
3.22 7.25 12.9 29.5 54.5 93.3
3.40 7.66
13.6
31.1 57.5 98.5
3.57 8.03 14.3 32.6 60.3 103.0
3.72
8.39 14.9
34.1 62.9 108
3.88
8.73
15.6 35.5 65.5 112
4.03
9.07
16.2
36.9
68.1 117
4.31 9.70
17.3
39.4 72.7
124
4.5710.3
18.3
41.8 77.1 132
4.82 10.9
19.3
44.1 81.4 139
5.06
11.4
20.3 46.3 85.5 146
5.29 11.9 21.2 48.4 89.2 152
5.51 12.4 22.1 50.4 93.0 159
5.72 12.9 22.9
52.3
96.5 165
5.93 13.3 23.8 54.2 100.0
171
6.12
13.8
24.6
56.0 103.0 176
6.32 14.2 25.3 57.8 107 182
6.5014.6
.26.1 59.4 110 187
6.69
15.1 26.8 61.1 113 192
6.86 15.4 27.5 62.7 116 197
7.20 16.2 28.9
65.9 121
206
7.53 17.0 30.2 68.9
127 216
7.85 17.7 31.5 71.7 132 225
8.16 18.4 32.7 74.5
137
233
8.45 19.0 33.9 77.2 142 241
8.74 19.7 35.1 79.9 147 249
9.02 20.3
36.2
82.4
152 257
9.30 20.9 37.3 84.9 156 264
9.56 21.5 38.4 87.3 161 272
9.82
22.1
39.4 89.7
165
279
10.1 22.7 40.4 92.0
169 286
10.3
23.3 41.4 94.3 173 293
10.6 23.8 42.3 96.4 177 299
10.8 24.3 43.4 98.7 181 306
,11.0 24.8 44.2
101.0
185 312
11.3
25.4 45.2 103 189 318
11.5 25.9 46.1 105 192 324
11.7 26.4 47.0 107 196 330
11.9 26.9 47.9
109 200 336
12.2 27.4 48.8 111 203 342
12.4 27.8 49.5
113 207 347
12.6 28.3 50.4
115 210 353
12.8 28.8 51.2
117 214 358
13.0 29.2 52.1 118
217 364
13.2
29.7 52.9
120
220
369
13.4
30.2
53.7 122 224 375
13.6
30.6
54.5
124
227
380
13.8 31.0 55.2 126 230 385
14.0 31.5 56.0 127 233 390
14.2
31.9 56.8 129 236 395
14.4 32.3 57.6 131 240 400
14.6 32.8 58.3 133 243 405
14.7
33.2 59.1 134 246 410
14.9 33.6
59.9 136 249 415
15.1 34.0 60.6
138
252
420
15.3 34.5 61.4 139 255
425
15.5
34.9 62.1
141
258
430
15.7
35.3
62.8 143 261 434
15.9
35.7 63.5 144 264 439
16.0 36.0
64.2
146
266
443
TABLE 2 - CAPACITIES FOR 2 IN. ORIFICE WELL
TESTER'; Mel/DAY, PRESSURE BASE, 14.65 PSIA SP.
GR. 0.60;
BASE
AND FLOWING TEMPERATURE, 60°F
Pressure
Inches
of
;-;-_-;-;-_O=-rc:-
ie-c: ::e--=S i =:eC'-
-,I e . c : . c h : ; : . e s = ~
Mercury
Vs
4 3/
2
1.0
1.41
5.65 12.7 22.6
51.6
1.1
1.48 5.92
13.3 23.7 54.1
1.2 1.55
6.19 13.9
24.8
56.6
1.3
1.61 6.45 14.5 25.9 59.0
1.4
1.67 6.69 15.1 26.9 61.2
1.5
1.73
6.94 15.6 27.8 63.4
1.6 1.79 7.18 16.2 28.8 65.6
1.7 1.85 7.40 16.7 29.7 67.6
1.8 1.90 7.62
17.2
30.6 69.6
1.9
1.96
7.84 17.7 31.4 71.6
2.0
2.01 8.04 18.1 32.3 73.5
2.2 2.11 8.46 19.0 33.9 77.3
2.4 2.21
8.84 19.9 35.5 80.8
2.6 2.30 9.21 20.7 37.0 84.2
2.8 2.40
9.59 21.6
38.5 87.6
62
95.3
99.9
104.0
109
113
117
121
125
128
132
135
142
149
155
161
163.0
170
178
185
192
199
206
212
218
224
:lJO
241
252
262
272
the orifice well tester in those
regions where data were
missing and to check pub
lished data.
EXPERIMENTAL
EQUIPMENT
The experimental
setup
used for the determination
of
discharge coefficients was
a 2-in. orifice
meter
run with
flange taps designed to GN
specifications and a commer
cial orifice well tester dis
charging freely to the atmos
phere and located approxi
mately
20 pipe
diameters
downstream from the meter
ing orifice. A 2-in. air line
supplied compressed air. Flow
was controlled by a gate
valve the air line. Differ
ential in pressure was meas
ured with either mercury
or
water manometers as re
quired, and a Bourdon-type
pressure gauge was used to
check
the
upstream
static
pressure
at
the meter.
Four
different sets
of
orifice well
tester plates were tested: brass
plates
VB-in.
thick, aluminum
plates
lis
-in. thick, brass
plates
1/16-in.
thick,
and
thin-edged
stainless
steel
plates designed according to
ASME-AGA
specifications.
EXPERIMENTAL
PROCEDURE
A
meter
plate
of
appropri
ate size was selected
to
main
tain differential pressure
across
the
metering
orifice
such that the flow through
this orifice would be treated
as that of an incompressible
fluid. The orifice to be tested
was installed in the tester and
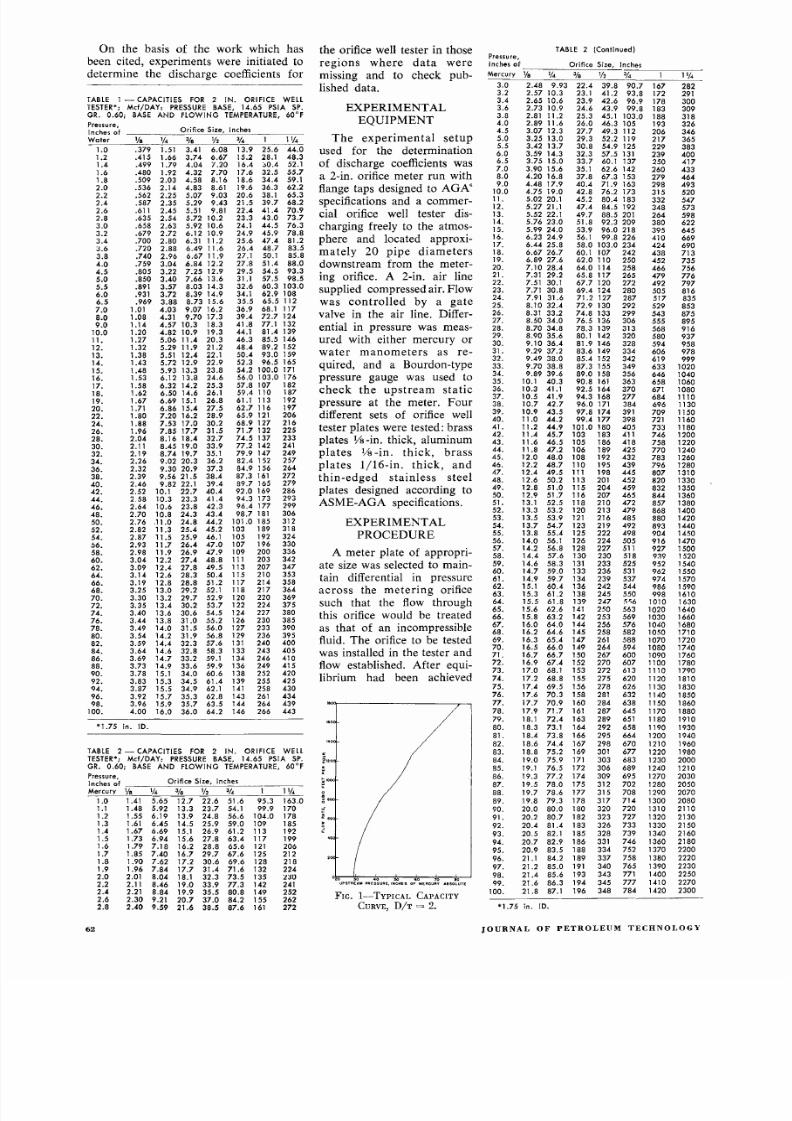
flow established. After equi
librium had been achieved
~ 1 2 0
.
40 W ro
UPSTREAM PRESSURE lNCttES Of MERCURY
A8S0LUfE
FIG. I -TYPIC AL CAPACITY
CURVE, D/T
= 2.
TABLE 2 (Continued)
Pressure
Inches of
Mercury V
1 4
3.0 2.48
9.93
3.2 2.57
10.3
3.4 2.65
10.6
3.6 2.73 10.9
3.8 2.81 11.2
4.0
2.89
11.6
4.5 3.07 12.3
5.0 3.25
13.0
5.5 3.42 13.7
6.0 3.59
14.3
6.5 3.75 15.0
7.0 3.90
15.6
8.0 4.20 16.8
9.0 4.48
17.9
10.0 4.75 19.0
11. 5.02 20.1
12. 5.2721.1
13. 5.52 22.1
14. 5.76
23.0
15.
5.99
24.0
16. 6.23
24.9
17. 6.44 25.8
18. 6.67 26.7
19. 6.89 27.6
20.
7.1028.4
21. 7.31 29.2
22. 7.51 30.1
23. 7.71 30.8
24.
7.91 31.6
25. 8.10 32.4
26.
8.31
33.2
27. 8.50 34.0
28.
8.70 34.8
29.
8.90 35.6
30.
9.10 36.4
31.
9.29 37.2
32.
9.49 38.0
33. 9.70 38.8
34.
9.89
39.6
35. 10.1 40.3
36. 10.3 41.1
37. 10.5
41.9
38.
10.7
42.7
39. 10.9
43.5
40.
11.0
44.2
41. 11.2
44.9
42.
11.4
45.7
43.
11.6
46.5
44. 11.8 47.2
45. 12.0 48.0
46. 12.2 48.7
47. 12.4 49.5
48. 12.6 50.2
49. 12.8
51.0
50.
12.9
51.7
51. 13.1
52.5
52.
13.3 53.2
53.
13.5 53.9
54. 13.7 54.7
55. 13.8
55.4
56. 14.0 56.1
57. 14.2 56.8
58. 14.4 57.6
59.
'14.6
58.3
60. 14.7 59.0
61.
14.9
59.7
62. 15.1
60.4
63. 15.3 61.2
64. 15.5 61.8
65.
15.6 62.6
66.
15.8 63.2
67.
16.0 64.0
68.
16.2
64.6
69.
16.3
65.4
70. 16.5 66.0
71. 16.7 66.7
72. 16.9 67.4
73. 17.0 68.1
74.
17.2
68.8
75.
17.4 69.5
76. 17.6 70.3
77. 17.7
70.9
78. 17.9
71.7
79. 18.1 72.4
80. 18.3 73.1
81. 18.4
73.8
82.
18.6
74.4
83. 18.8 75.2
84. 19.0
75.9
85. 19.1 76.5
86.
19.3
77.2
87. 19.5 78.0
88.
19.7
78.6
89. 19.8
79.3
90.
20.0 80.0
91.
20.2 80.7
92.
20.4
81.4
93. 20.5
82.1
94.
20.7
82.9
95. 20.9 83.5
96.
21.1
84.2
97. 21.2 85.0
98. 21.4
85.6
99. 21.6 86.3
100.
21.8
87.1
1.75 in. ID.
Orifi ce Size Inches
~ 3 f 4 ~ ~ ~ - - I - ~ - . -
22.4
39.8
90.7
167 282
23.1 41.2 93.8 172 291
23.9
42.6 96.9
178 300
24.6 43.9 99.8 183 309
25.3
45.1
103.0
188 318
26.0 46.3 105 193 326
27.7 49.3 112 206 346
29.3 52.2 119 217 365
30.8 54.9 125 229 383
32.3 57.5
131 239 400
33.7 60.1
137 250 417
35.1 62.6 142
260 433
37.8
67.3
153
279 464
40.4 71.9
163
298
493
42.8 76.2 173
315 520
45.2
80.4 183 332
547
47.4 84.5 192
348
573
49.7 88.5 201 264 598
51.8 92.3 209 380 622
53.9 96.0 218 395 645
56.1 99.8226 410 669
58.0 103.0 234 424 690
60.1
107 242 438 713
62.0 110
250 452 735
64.0
114 258 466 756
65.8
117
265
479 776
67.7 120 272
492
797
69.4 124 280 505 816
71.2 127 287 517 835
72.9 130 292 529 853
74.8 133 299 543 875
76.5
136 306 555 895
78.3
139 313 568 916
80.1 142 320
580 937
81.9 146
328
594 958
83.6 149
334
606 978
85.4
152 342
619 999
87.3
155
349
633 1020
89.0
158
356 646 1040
90.8 161 363
658
1060
92.5 164 370 671 1080
94.3 168 277 684 1110
96.0 171 384 696 1130
97.8
174 391 709 1150
99.4 177
398 721
1160
101.0 180 405 733 1180
103 183 411
746
1200
105 186
418
758
1220
106 189 425
770
1240
108 192
432
783 1260
110 195 439 796 1280
111 198 445 807 1310
113 201 452 820 1330
115 204 459 832 1350
116
207 465 844 1360
118
210 472 857 1380
120 213
479
868 1400
121
216
485 880
1420
123 219
492
893 1440
125 222 498 904 1450
126 224 505 916 1470
128 227 511 927 1500
130 230 518 919 1520
131
233 525
952
1540
133 236 531 962 1550
134 239 537 974 1570
136 242 544 986 1 590
138 245 550 998 1610
139
247 1010 1630
141 250 563 1020 1640
142 253
569
1030 1660
144
256
576 1040
1680
145 258 582 1050 1710
147 261 588 1070 1720
149 264 594 1080
1740
150 267 600 1090 1760
152 270 607 1100 1780
153 272 613 1110 1790
155 275
620
1120 1810
156 278 626 1130 1830
158
281
632 1140 1850
160 284 638 1150 1860
161 287 645 1170 1880
163 289 651 1180 1910
164 292 658 1190
1930
166 295 664 1200 1940
167
298
670
1210 1960
169
301
677 1220
1980
171 303 683 1230 2000
172 306 689 1240 1210
174
309 695
1270
2030
175 312 702 1280 2050
177 315 708 1290 2070
178
317 714
1300
2080
180 320 720 1310 2110
182 323
727
1320 2130
183
326 733 1330
2150
185 328 739 1340 2160
186 331
746
1360 2180
188 334 752 1370 2200
189 337 758 1380 2220
191 340 765 1390
2230
193 343 771 1400 2250
194
345
777
1410 2270
196 348 784 1420
2300
JOURNAL OF PETROLEUM TECHNOLOGY

8/11/2019 A Study of the Orifice Well Tester and Critical Flow Prover
http://slidepdf.com/reader/full/a-study-of-the-orifice-well-tester-and-critical-flow-prover 3/4
TABLE 3-ATMOSPHERIC
PRESSURE
MULTIPLIERS
Tester
Atmospher ic Pressure Inches of Mercury
Pressure
In of Water
28.5
27.7 26.9 26.0 25.1
1.0
.9846 .9707 .9566 .9406 .9242
2.0 .9847 .9708 .9568
.9407 .9244
3.0 .9847
.9709 .9569 .9409 .9246
4.0
.9847 .9710 .9570 .9410 .9248
5.0 .9848
.9710 .9571 .9412
.9250
6.0
.9848 .9711 .9572 .9413 .9252
7.0
.9848 .9712 .9573
.9415
.9253
8.0 .9849 .9712
.9574 .9416
.9255
9.0
.9849
.9713
.9575
.9418 .9257
10.0 .9850
.9714
.9576 .9419
.9259
11.0
.9850
.9715
.9577 .9420
.9261
12.0
.9850 .9715 .9578 .9422 .9263
13.0 .9851 .9716 .9579 .9423 .9265
14.0
.9851
.9717
.9580
.9425
.9267
15.0
.9151
.9717
.9581
.9426 .9268
16.0
.9852 .9718 .9582 .9428 .9270
17.0
.9852 .9719
.9583
.9429 .9272
18.0 .9852 .9719 .9585 .9430 .9274
19.0 .9853 .9720 .9586 .9432 .9276
20.0
.9853
.9721
.9587 .9433
.9277
24.0
.9855
.9723
.9591
.9439
.9285
28.0 .9856 .9726
.9594
.9444
.9291
32.0
.9857
.9729
.9598
.9449 .9298
36.0
.
9859
.9731
.9602 .9455 .9305
40.0
.9860
.9734
.9606
.9460 .9312
44.0
.9861 .9736 .9609 .9465 .9318
48.0
.9862
.9738
.9613 •9470 .9324
52.0
.9864
.9741
.9616
.9475
.9331
56.0
.9865 .9743 .9620 .9479 .9337
60.0 .9866 .9745 .9623 .9484 .9343
64.0
.9867 .9748
.9626 .9488 .9348
68.0 .9868
.9750
.9630
.9493 .9354
72.0
.9869 .9752 .9633
.9497
.9360
76.0 .9870 .9754
.9636
.9502
.9365
80.0
.9872 .9756 .9639
.9506 .9371
84.0
.9873 .9758 .9642 .9510 .9376
88.0
.9874 .9760 .9645
.9514 .9382
92.0
.9875 .9762 .9648 .9518
.9387
96.0
.9876 .9764
.9651 .9522 .9392
100.0 .9877 .9766 .9654 .9526 .9397
TABLE 4-ATMOSPHERIC PRESSURE MULTIPLIERS
Tester
Atmospheric Pressure Inches of Mercury
Pressure
In.
of
Mercury
28 5 27.7
26.9
26.0
25.1
1.0 .9851 .9716 .9580
.9424
.9266
2.0 .9856
.9726
.9594
.9443 .9290
3.0
.9860
.9734
.9606 .9461
.9313
4.0 .9864 .9742
.9618 .9477 .9334
5.0 .9868
.9750
.9630 .9493
.9354
6.0
.9872 .9757 .9640
.9508
.9373
7.0
.9876 .9764 .9650
.9522 .9391
8.0
.9879 .9770
.9660 .9535 .9408
9.0
.9882
.9776 .9669 .9547
.9423
10.0
.9885 .9782
.9678 .9559 .9439
11.0
.9888 .9787 .9686
.9570
.9453
12.0
.9891 .9793 .9693
.9581 .9466
13.0
.9893
.9797 .9701
.9591 .9479
14.0
.9896
.9802
.9708 .9600
.9492
15.0
.9898
.9807 .9714
.9609 .9503
16.0
.9900
.9811 .9721
.9618 .9515
17.0
.9903 .9815
.9727
.9627 .9525
18.0
.9905
.9819
.9733
.9635
.9536
19.0
.9907
.9823
.9738 .9642
.9545
20.0
.9908 .9826 .9744
.9650
.9555
21.0
.9910 .9830
.9749
.9657
.9564
22.0
.9912
.9833
.9754 .9664
.9573
23.0
.9914 .9836
.9759
.9670
.9581
24.0
.9915 .9840
.9763
.9676 .9589
TABLE 5-DISCHARGE COEFFICIENTS
FOR
SHARP·EDGED
ORI
FICES*
Tester Tester
Tester
Pressure Pressure
Pressure
In of Water
it
In. of Water
C
In. of Water d
0.0 0.604
11.0
0.610
54.0 0.631
1.0 0.605 12.0
0.611
56.0
0.632
1.2 0.605 13.0 0.611
58.0
0.633
1.4
0.605 14.0
0.612
60.0 0.633
1.6
0.605 15.0
0.612 62.0
0.634
1.8
0.605 16.0 0.613
64.0
0.635
2.0
0.605 17.0
0.613 66.0
0.636
2.2 0.605 18.0 0.614 68.0 0.637
2.4
0.605 19.0
0.614
70.0
0.638
2.6
0.606 20.0 0.615
72.0
0.639
2.8
0.606
22.0 0.616
74.0 0.639
3.0
0.606 24.0 0.617
76.0
0.640
3.2
0.606 26.0
0.618
78.0
0.641
3.4
0.606 28.0 0.619
80.0 0.642
3.6
0.606
30.0 0.620
82.0
0.643
3.8
0.606
32.0
0.621
84.0 0.644
4.0
0.606
34.0
0.622
86.0
0.645
4.5
0.607
36.0
0.623
88.0 0.646
5.0
0.607 38.0
0.624 90.0
0.647
5.5
0.607 40.0
0.625
92.0
0.648
6.0
0.607 42.0
0.626 94.0
0.649
6.5
0.608 44.0
0.626
96.0
0.650
7.0
0.608 46.0
0.628
98.0
0.650
8.0
0.608
48.0
0.628
100.0
0.651
9.0
0.609 50.0
0.629
10.0
0.610
52.0 0.630
0 /1>
8
SEPTEMBER,
1957
. 8 6 C : : : = ~ ~ _ = _- -3-
84 - : ~ : = _ - _ - _ - _ - _ - _ - _ ~ - _ - _
8.
5 W M
e
M
ro n
M
DIFFERENTIAL PRESSURE INCHES OF MERCURY
FIG. 2-GENERALIZED COEFFICIENTS
OF
DISCHARGE. FREE
DIS
CHARGE TO
ATMOSPHERIC PRESSURE OF
29.4 IN.
OF MERCURY
SOLID LINES
INDICATE
REGIONS
FOR
WHICH EXPERIMENTAL
DATA
WERE
OBTAINED•
the differential in pressure across
the metering orifice, the upstream
pressure on the orifice well tester,
and the temperature
of
the flow
stream were read and recorded.
This procedure was repeated a
number of
times to determine
the
differential pressure-capacity curve
for
each orifice tested (Fig.
1).
Barometric pressure was recorded
several times during each run.
RE SUL T S
The published tables
for
the
orifice well tester' for the range
o
to 15 in.
of
water were checked
within the limits
of
experimental
error. The
Bureau
of
Mines co
efficients' for the critical flow
prover were also found to be valid
for the range above 75 in.
of Hg
for all sizes
of
orifices tested.
The
discharge coefficient for a square
edged orifice in free discharge was
found to
be
a function
of
the ratio
of
downstream to upstream pre
sure within the range 1 to 75 in.
of Hg
with the ratio
of
orifice
diameter to edge-thickness as the
governing parameter. Above a dif
ferential
of
75 in.
of
Hg when dis
charging air to atmosphere
at
29.4
in.
of
Hg, the discharge coefficient
was constant for all ratios of diam
eter to thickness employed in this
work. The point at which the dis
charge coefficient becomes a con
stant seems to be a function
of
the
diameter to thickness ratio.
A region
of
unstable flow was
found for ratios
of
to
t of
2
and
3, and reproducible results could
not be obtained in these regions.
The region
of
reverse curvature
just
prior
to the linear portion
of
the curve obtained by plotting the
rate
of
flow against pressure
drop
is
a region of instability and is not
reproducible. This instability
is
not
observed
for
very thick
or
very
thin-edged orifices.
For the
very
thick orifices,
the vena
contract a
lies between
the upstream and
downstream surfaces
of
the orifice.
The emergent jet is attached to the
downstream edge
and
flow remains
stable. For the orifices of intermedi
ate thickness,
the
region
of
instabil
ity develops as the vena contracta
moves downstream with increasing
pressure drop, with
the
result that
a slight change in flow rate will
cause either attachment or detach
ment
of
the emergent jet.
The
vena
contracta
for
the thin-edged plates
is always beyond the downstream
edge of the plate, and consequently
flow is stable.
The discharge coefficient varies
with pressure drop, and a family
of
curves may be obtained
for
which
the
ratio
of
to
t
is a
para
meter (Fig. 2). As the pressure
drop across the orifice is increased,
the vena
contracta expands, caus
ing
an
increase in the discharge
coefficient.
f
fluid flow were fric
tionless, the value of the discharge
coefficient would
approach
1.0,
but
the frictional effects
of
real fluids
limit the useful range of the co
efficient from 0.83 to 0.86 for
sharp-edged orifices.
Discharge coefficients were cal
culated from the ratio
of
actual
flow rate predicted by theoretical
equations for adiabatic flow.' o
discontinuity
was
found
in the dis-
6

8/11/2019 A Study of the Orifice Well Tester and Critical Flow Prover
http://slidepdf.com/reader/full/a-study-of-the-orifice-well-tester-and-critical-flow-prover 4/4
crlarge coefficients
at the point of
transition
from
subcritical to crit
ical flow conditions. The average
discharge coefficient (for all orifices
tested) in
the
critical flow region
beyond a
pressure drop of
75 in.
of
Hg was 0.84. The average
for
orifices with a D/t = 8.0 was 0.83,
a difference
of only
1.2
per
cent.
The
average
for the
orifices
for
use with
the Bureau of Mines'
2-in.
critical flow
prover
was 0.86, a
difference of 2.4 per cent.
The
capacity tables
for the
2-in.
orifice well tester
at
differentials in
pressure less than 25 in.
of Hg
were
calculated from the
equation
Q
= K Y CD.,'
.IP,
6
P
(3)
, d - l + (3' .
in
which if p, and 6P are
in
inches
of Hg, K =
27.284,
and if
P,
and 6
P
are
in inches
of
water,
K = 2.0062.
At differentials in
pressure
greater
than 25 in.
of Hg,
Q =
K'C D,'P, (4)
vi
+
(3' r, /k
in which for a gas with
k
= 1.3 and
if P, is
in
inches
of
Hg, K' = 12.288.
Tables
1
and
2 were calculated
for
free discharge to
an
atmospheric
pressure
of 29.4
in.
of
Hg. f the
barometric pressure differs appreci
ably from 29.4 in. of Hg, the capac
ity of the tester
must
be corrected
by multiplying
the
table value by
the factor F.
F
=
iP ,,,,
+
P
~ 2 9 4 + 6P
(5)
Other
corrections
for
pressures less
than 25 in. of Hg (gas gravity, base
or flowing temperature, pressure
base, etc.)
are standard
corrections
used in all orifice metering work.'
For pressures
greater
than 25 in.
of
Hg, correction factors standard
for
the critical flow
prover'
should be
used.
A few
runs
in the
range
0 to 15 in.
of
water
differential
in
pressure
checked published data for the orifice
well
tester for the same range
within
the limits
of experimental
error. The
basic
equation
of
flow
for
this region
may be relied upon.
CONCLU S I ON S
1. Tables of the capacity
of
the
conventional orifice well tester with
conventional
(thick)
orifices for dif
ferentials in pressure ranging
from
o
to 15 in.
of water and
all ratios
of D/t
as published
by the American
Meter
Co.
and reproduced
by others
are
valid.
64
TABLE 6 DISCHARGE COEFFICIENTS OR
SHARP·EDGED
OR
I FICES
Tester Tester
Tester Pressure Pressure
Pressure In of n of
In. of
Mercury ( Mercury
rt Mercury
Crt
-c0--. 0 - - - - - - - - - - ; c 0
=: 6
7
4c---:
2
'1=-=.0c-'-
0.723
----''''6
c
l=-=.0'-'--0--.
'2-0
1.1 0.612
22.0
0.728 62.0 0.821
1.2 0.613 23.0 0.732 63.0 0.822
1.3 0.614 24.0 0.736 64.0 0.822
1.4 0.614
25.0
0.740 65.0 0.823
1.5 0.615
26.0
0.745
66.0
0.823
1.6
0.616 27.0
0.749 67.0
0.824
1.7
0.616
28.0
0.753
68.0
0.824
1.8
0.617 29.0 0.757 69.0
0.825
1.9 0.618 30.0 0.761 70.0
0.825
2.0
0.618 31.0
0.764 71.0
0.825
2.2 0.620 32.0
0.768
72.0
0.826
2.4
0.621
33.0
0.772
73.0
0.826
2.6
0.622 34.0 0.775
74.0 0.827
2.8 0.624 35.0
0.778
75.0 0.827
3.0 0.625
36.0
0.781 76.0 0.828
3.2 0.626 37.0 0.784 77.0 0.828
3.4 0.628 38.0
0.786
78.0 0.829
3.6 0.629 39.0
0.789 79.0
0.829
3.8
0.630
40.0
0.791 80.0 0.830
4.0 0.631
41.0
0.793 81.0 0.830
4.5 0.634 42.0
0.795 82.0 0.830
5.0 0.637 43.0 0.797
83.0
0.831
5.5 0.640 44.0
0.799 84.0
0.831
6.0
0.643
45.0 0.801
85.0
0.831
6.5
0.646
46.0
0.803 86.0
0.831
7.0
0.649
47.0
0.804
87.0
0.832
8.0 0.655 48.0
0.806 88.0 0.832
9.0 0.661 49.0
0.808 89.0 0.832
10.0 0.666 50.0 0.809 90.0 0.832
11.0 0.672
51.0
0.811 91.0 0.833
12.0 0.677
52.0
0.812 92.0 0.833
13.0 0.683 53.0 0.813 93.0 0.833
14.0
0.688 54.0
0.814 94.0
0.834
15.0 0.693 55.0 0.815 95.0
0.834
16.0 0.699
56.0
0.816 96.0
0.834
17.0 0.703 57.0
0.817 97.0
0.835
18.0 0.709 58.0
0.818 98.0
0.835
19.0 0.714
59.0
0.819
99.0
0.835
20.0
0.719
60.0 0.819
100.0 0.836
0 /1> 8
2. Coefficients developed by the
Bureau of Mines for the conventional
critical flow
prover and
the capaci
ties
dependent on
these coefficients
are valid
for
upstream pressures
greater than 40 psi and all ratios
of D to t.
3.
An
unstable state of
flow
develops between differentials in
pressure
of
15 in. of
water and 40
psi
for
ratios
of
D
to
t
between 1
and
4. Because
of
this condition
of
instability
and
variation in cofficients
of discharge with ratios of upstream
to downstream pressures, neither the
tables usually supplied with the ori
fice well tester
nor
those applicable
to
the usual critical flow
prover can
be extrapolated for use in this inter
mediate region
of
differential in pres
sure.
4. Orifice plates designed in ac
cordance with ASME-AGA specifi
cations for sharp-edged orifices
(made
of stainless steel to resist corrosion,
wear,
and tear) and
used in
the
orifice well tester are accurate, re
liable,
and
satisfactory at all rates
of flow
and
differentials in pressure
likely to be encountered in prac
tical gas-oil ratio
work
in
the
field.
Only one set
oj
tables
and
one in
strument, the orifice well tester,
and
one set
oj
sharp-edged orifices are
required.
Obviously
the new
sharp
edged orifice plates
can
be used
in
the conventional orifice well tester.
Tables 1
and
2 have been
prepared
for thesc orifices covering the range
from 1 in. of water to 100 in. of
Hg
differential in pressure. Above
100 in.
of Hg, Eq.
4
can
be used
to calculate
the
capacity
of
orifice
plates,
and no
discrepancies will be
observed over the entire range of
pressures.
RECOMMENDA
TraNS
ASME-AGA
specifications should
be used
for the construction of
orifice plates
for the
orifice well
tester. These plates should be
made
of
stainless steel
or Monel
metal.
Official manuals of procedure
should require the use of such
plates
and appropriate
tables in all
gas-oil ratio work.
ACKNOWLEDGMENT
The authors
wish to acknowledge
the
help
of
the
members of the
Tex
as
Petroleum Research Committee
and
to
thank them for
permission
to
prepare and
publish this paper.
DEFINITION
OF
SYMBOLS
D = orifice diameter, inches
t = orifice thickness, inches
h
=
differential pressure, inches
of
water
H
=
differential pressure, inches
of
Hg
C = meter coefficient
Cd
= dimensionless discharge co-
efficient
Q
= flow rate
G
=
gas gravity
(air
=
1.0)
K
= dimensional constant for sub
critical flow
K' =
dimensional
constant
for crit
ical flow
Y,
=
dimensionless expansion fac
tor, derived
on the
basis
of
frictionless adiabatic flow
P =
absolute
upstream
pressure
P
=
differential pressure across the
orifice; i. e., tester pressure
(3
= ratio
of
orifice
diameter
to
pipe
diameter
r
=
critical pressure ratio
k = specific heat ratio
REFERENCES
1. Pamphlet for Gas-Oil Ratio Determi
nation,
Railroad Commission of
Texas, Engr. Dept., 1954.
2.
Open
Flow Capacities of Wells,
American
Meter
Co., Inc., Metric
Metal Works, Erie,
Pa.,
Bull. E-7,
1930.
3.
Buckingham,
E.:
Research Paper 303,
Bureau of
Standards
Jour.
of
Research
(May,
1931).
4. Investigation of Flow Coefficient of
Circular, Square and Elliptical Ori
fices, NACA-TN-1947 (Sept. , 1949).
J O U R N A L O F PETROLEUM T E C H N O L O G Y