A STUDY OF THE ADAPTATION OF PARAMETRIC COMPUTER …
152
A STUDY OF THE ADAPTATION OF PARAMETRIC COMPUTER DESIGN AMONG LANDSCAPE ARCHITECTURE PROFESSIONALS IN TEXAS by CHAD ALLEN PAULSON Presented to the Faculty of the Graduate School of The University of Texas at Arlington in Partial Fulfillment of the Requirements for the Degree of MASTER OF LANDSCAPE ARCHITECTURE THE UNIVERSITY OF TEXAS AT ARLINGTON MAY 2017
Transcript of A STUDY OF THE ADAPTATION OF PARAMETRIC COMPUTER …

A STUDY OF THE ADAPTATION OF PARAMETRIC COMPUTER DESIGN
AMONG LANDSCAPE ARCHITECTURE PROFESSIONALS IN TEXAS
by
CHAD ALLEN PAULSON
Presented to the Faculty of the Graduate School of
The University of Texas at Arlington in Partial Fulfillment
of the Requirements
for the Degree of
MASTER OF LANDSCAPE ARCHITECTURE
THE UNIVERSITY OF TEXAS AT ARLINGTON
MAY 2017

ii
Copyright © by Chad Allen Paulson 2017
All Rights Reserved

iii
Acknowledgements
I would like to thank my friends and family, especially Elizabeth Williams who has
helped me stay on track towards finishing my degree in Landscape Architecture, and has
helped numerous times with edits and support. I would like to thank all those who helped me
by writing letters of recommendation and support to help me gain acceptance into the program
at the University of Texas at Arlington, such as Edith Barret Howard, Wendy Morris, and
Glenda Wood. I would also like to thank my family, friends and colleagues, both in the heart
of Texas, and the rich experiences of my first three decades of life experiencing life, laughter,
creativity, and the appreciation of nature in the prairies, forests, rivers, and lakes of the northern
Midwest. Lastly I would like to thank my professors who have molded me into a more
organized technological, philosophical, and artistic version of my former self. I especially
appreciate the effort and time of my thesis chair Dr. Taner R. Ozdil and thesis committee
members Professor Bradley Bell and Dr. Amy Archambeau.
April 24, 2017

iv
Abstract
A STUDY OF THE ADAPTATION OF PARAMETRIC COMPUTER DESIGN AMONG
LANDSCAPE ARCHITECTURE PROFESSIONALS IN TEXAS
Chad Allen Paulson, MLA
The University of Texas at Arlington, 2017
Supervising Professor: Dr. Taner R. Ozdil
Parametric design utilizes algorithmic-based software to produce computational,
generative, responsive, and immersive three-dimensional models for use in landscape
architecture, planning, and architecture (Cantrell & Holzman, 2016; Jabi, 2013). Advanced
parametric software tools such as Rhinoceros and Grasshopper combine to create a robust
system to express a set of customizable parameters that define and clarify the design intent and
set of iterative solutions to a design problem (Jabi, 2013).

v
Although parametric design in architecture has been in use for over 15 years, it has not
been broadly adopted by the field of landscape architecture. Current professional practices
illustrate that software development within the design fields, including landscape architecture,
are strongly trending towards augmented reality, open source software and building
information modeling systems (Bentley, et al. 2016).
The purpose of this research is to understand the adaptation and implementation of the
innovation of parametric design into the field of landscape architecture overall, then
specifically to the practice and the speed with which the innovations are being adapted into
landscape architecture firms in Texas. Research on this topic has the possibility to increase
awareness of technological advancements in the practice and education of landscape
architecture, architecture, and planning. In this study, the researcher documents the current
understanding of parametric design in the practice of landscape architecture nationally and
internationally through literature review, and then compares it to the practice in Texas by
studying landscape architecture professionals’ perceptions on the issue.
This research followed qualitative methods (Deming & Swaffield, 2011) to acquire the
knowledge needed to understand the adaptation and implementation of the innovation of
parametric design in Texas. In this study, this researcher conducted in-depth interviews to
discover patterns in the acceptance or likely adaptation of parametric design in landscape
architecture firms. The subjects were designers or managers of landscape architect firms that
practice landscape architecture in Texas. The snowball technique was used to acquire the study
population (Taylor & Bogdan, 1998).

vi
Rogers’ theory, Diffusion of Innovation, was used to design questions to be used while
interviewing landscape architectural professionals to determine their level of adapting
innovation (Rogers, 1995; Deming & Swaffield, 2011) to their design practices. Themes were
drawn from the interviews using the Diffusion of Innovation categories, to document the
overall rate of adaptation to the process of parametric design experienced from the participants
in the interviews. The responses are studied qualitatively to understand where each firm or
landscape professional stands within its process of innovation (Taylor & Bogdan, 1998;
Deming & Swaffield, 2011).
In conclusion, this research assessed that adaptation is happening in landscape
architecture firms in Texas, and summarizes its current usage and explores the technical,
financial, and educational issues of adapting to these methods. The interviewees had a wide
range of experience in professional management and practice. However, experience with
emerging industry software and technology was more prevalent in the training of new staff then
it is with upper management. Most firms agreed that technology changes are on the horizon,
but there is no clear way of defining what that means for each practice using parametric design.

vii
TABLE OF CONTENTS
Acknowledgements ........................................................................................................................ iii
Abstract ........................................................................................................................................... iv
TABLE OF CONTENTS .............................................................................................................. vii
LIST OF ILLUSTRATIONS ........................................................................................................ xii
Chapter 1
INTRODUCTION ........................................................................................................................... 1
1.1 Introduction ........................................................................................................................... 1
1.2. Problem Statement ............................................................................................................... 1
1.3 Purpose Statement ................................................................................................................. 2
1.4 Research Objectives .............................................................................................................. 3
1.5. Research Questions .............................................................................................................. 4
1.6 Definition of Terms ............................................................................................................... 5
1.7 Research Methods ............................................................................................................... 10
1.8 Significance and Limitations ............................................................................................... 12
1.9 Chapter Summary ................................................................................................................ 13
Chapter 2
LITERATURE REVIEW .............................................................................................................. 15
2.1 Introduction ........................................................................................................................ 15
2.2 What is Parametric Design? ................................................................................................ 15
2.3. History of Parametric Design ............................................................................................. 18
viii
2.3.1 Pioneers in Computer Aided Design and Manufacturing ............................................. 19
2.3.2 Pioneers in Geographical Information Systems ........................................................... 21
2.4. The Development of Parametric Computation: .................................................................. 24
2.4.1 The Development of Parametric Design, 1980's through 1995 .................................... 25
2.4.2 Development of Computer Aided Design 1995 through the present ........................... 28
2.5 Development and Use of Parametric Design ...................................................................... 31
2.5.1 Coding versus Scripting ............................................................................................ 31
2.5.2 Contemporary Use of Parametric Design in Architecture and Public Art ................ 34
2.5.3 Development of Geographical Information Systems ................................................ 43
2.5.4 Development of Building and City Information Modeling ....................................... 45
2.5.4.1 Limitations with Building Information Systems .................................................. 46
2.5.5 Contemporary use of Parametric Design in Planning using City
Information Modeling ............................................................................................................ 48
2.6 Contemporary use and practitioners of Parametric Design ................................................. 50
in Landscape Architecture ......................................................................................................... 50
2.7 The Future of Parametric Design in Landscape Architecture ............................................. 52
2.7.1 Design Competitions ................................................................................................. 53
2.7.2 Responsive Technologies .......................................................................................... 54
2.7.3 Immersive Technologies ........................................................................................... 60
2.8 Summary of Literature Review ........................................................................................... 62

ix
Chapter 3
RESEARCH METHODOLOGY .................................................................................................. 65
3.1 Introduction ......................................................................................................................... 65
3.2 Research Design .................................................................................................................. 65
3.3 Study Location ................................................................................................................... 68
3.4 Study Population ................................................................................................................ 68
3.5 Data Collection Methods .................................................................................................... 69
3.5.1 Interview Procedures .................................................................................................. 69
3.5.2 Research Questions .................................................................................................... 70
3.5.2.1 Landscape Professional Profile Questions ........................................................... 71
3.5.2.2 Landscape Professional Interview Questions ....................................................... 71
3.6 Data Analysis Methods ....................................................................................................... 73
3.6.1 Introduction of Research Theory in Study ................................................................ 73
3.6.2 Rogers’ Key Elements in Diffusion Research ............................................................. 73
3.6.3 Rogers’ Five Factors of Innovation ............................................................................. 74
3.6.3.1 Relative Advantage .............................................................................................. 75
3.6.3.2 Compatibility ........................................................................................................ 75
3.6.3.3 Complexity ........................................................................................................... 76
3.6.3.4 Trialability ............................................................................................................ 76
3.6.3.5 Observability ........................................................................................................ 76
3.7 Significance and Limitations ......................................................................................... 77

x
3.8 Chapter Summary .......................................................................................................... 78
Chapter 4
DATA FINDINGS AND ANALYSIS .......................................................................................... 79
4.1 Summary of Findings .................................................................................................... 79
4.1.1 Demographics of Landscape Professional Study Group ........................................... 80
4.1.2 Findings on In-Depth Interview Questions ............................................................... 86
4.1.2.1 Professional Question #1 ...................................................................................... 86
4.1.2.2 Professional Question #2 ...................................................................................... 87
4.1.2.3 Professional Question #3 ...................................................................................... 89
4.1.2.4 Professional Question #4 ...................................................................................... 93
4.1.2.5 Professional Question #5 ...................................................................................... 94
4.1.2.6 Professional Question #6 ...................................................................................... 96
4.1.2.7 Professional Question #7 ...................................................................................... 98
4.1.2.8 Professional Question #8 .................................................................................... 100
4.1.2.9 Professional Question #9 .................................................................................... 101
4.1.3.0 Additional Professional Questions #2 ................................................................ 104
4.1.3.1 Professional Additional Question #5 .................................................................. 106
4.2 Adaptation Characteristics of Parametric Design in Texas ......................................... 107
4.2.1 Perceptions of Relative Advantage of Adapting to Parametric Design in
Texas ................................................................................................................................. 107
4.2.2 Perceptions of Compatibility to Parametric Design in Texas .................................... 109

xi
4.2.3 Perceptions of Complexity of Parametric Design in Texas ....................................... 110
4.2.4 Perceptions of Trialability of Parametric Design in Texas ........................................ 110
4.2.5 Perceptions of Observability of Parametric Design in Texas .................................. 111
4.3 Chapter Summary ........................................................................................................ 112
Chapter 5
CONCLUSIONS ..................................................................................................................... 118
5.1 Introduction ................................................................................................................. 113
5.2 Summary of Findings .................................................................................................. 113
5.3 Response to Research Questions ................................................................................. 115
5.4 Conclusion and Discussion ......................................................................................... 120
5.5 Suggestions for Future Research ................................................................................. 122
APPENDIX A-B IRB Approval Documents ............................................................................. 124
APPENDIX C Study Population Reqruitment Cover Letter and Study Summary ................... 128
References ................................................................................................................................... 131
Biographical Information ............................................................................................................ 139

xii
LIST OF ILLUSTRATIONS
Figure 2.1.1 Voronoi Pattern in a landscape…………………………………………………..17
Figure 2.1.2 Voronoi Pattern, Bench ………………………………………………………….17
Figure 2.2.1 Steinitz, Early GIS……………………………………………………………….22
Figure 2.4.1 Intergraph, WorkStation…………………………………………….....................26
Figure 2.5.1 Antony Gormley, “Space Station”.………………………………………………36
Figure 2.5.2 Marc Fornes,“Chromaphasia”……………………………………………………37
Figure 2.5.3 P. Art lab Branching Structures………………………………………………….39
Figure 2.5.4 Renzo Piano, Paul Klee Museum………………………………………………...40
Figure 2.5.5 Renzo Piano, Peek & Clopenburg Weltstadthaus…………………......................40
Figure 2.5.6 Morphosis, Perot Museum………………………………………….....................41
Figure 2.5.7 CIM, SketchUp “Modeluer” Extension…………………………….....................49
Figure 2.5.8 CIM, ESRI “City Engine”…………………………………………......................49
Figure 2.6.1 Software Preferences, ASLA top firms study……………………………………51
Figure 2.7.1 Horse Shoe Cove Park, FletcherStudio………………………………..................54
Figure 2.7.2 Fluvial Morphology Test, Harvard Graduate School……………….....................56
Figure 2.7.3 MIMMI, Invivia, Harvard Graduate School of Design………………………….59
Figure 3.1 Rogers’ 4 Key Elements of Innovations 66
Figure 3.2 Rogers’ 5 Attributes of Innovations……………………………………………….67
Figure 3.3 Rogers’ 5 Stages of Innovations………………………………………………..….67
Figure 4.1 Profile Statistics, Experience, Questions #1-3……………………………………..82

xiii
Figure 4.2 Profile Statistics, Education, Questions #4-5………………………………………85
Figure 4.2.1 Texas School LA Degree………………………………………………………...86
Figure 4.3 Professional Question #1, New Technologies…………………………..................91
Figure 4.4 Professional Question #2, Individual Experience…………………….....................92
Figure 4.5 Professional Question #3, What stage is PD Used………………………………....93
Figure 4.6 Professional Question #4, What Software is Used…...............................................95 Figure 4.7 Professional Question #5, Design or Prototype………………………....................97
Figure 4.8 Professional Question #6, Scripting or Coding…………………….………………98
Figure 4.9 Professional Question #7, Advantage in PD………………………….....................99
Figure 4.10 Professional Question #8, Introduction to PD in Education……….....................100
Figure 4.11 Professional Question #9, Level of Adoption in Firm………………..................103
Figure 4.12 Professional Additional Question #2, Future Technology Shift………...............105
Figure 4.13 Professional Additional Question #5, Education Barriers……………................106

1
Chapter One
INTRODUCTION
1.1 Introduction
In this chapter, the question is introduced regarding the extent to which parametric
design (PD) has been adapted among landscape architecture professionals in the state of Texas.
The technical terms associated with the use of PD are defined to aid in the understanding of the
topic. The qualitative research method, Diffusion of Innovations (Rogers, 2003), is outlined
and presented as the guiding principle in the creation of the main research questions, and the
design of practitioner interview questions. The significance of studying PD as it relates to
landscape architecture and the related fields of architecture and planning are outlined as well as
the limitations of the research on this subject.
1.2. Problem Statement
Research suggests that advanced PD such as generative, responsive, and immersive
design is emerging into the field of landscape architecture, and design schools are beginning to
teach it, but it is still not widely sought as a competency for designers entering the job market
(Bentley, et al. 2016). Many examples are showing compatible architectural uses of generative
PD in the creation of public art, arbors, and other architectural amenities such as building
tessellation or tiling. However, there are very few examples of these technologies extending
into the field of landscape architecture (Bentley, et al. 2016).
2
Bradley Cantrell from Harvard Graduate School of Design, among others, believe
responsive and immersive landscape design technologies are at the cutting-edge of academic
research and commercial development respectively (Green, 2017; Tal, 2017; Bentley, et al.
2016). This research paper investigates the status of landscape architects in Texas, and where
they are in the process of adapting to advanced parametric workflows. such as responsive and
immersive design, as well as, accessing the adaptability of other parametric tools such as
Geographical Information Systems (GIS), Computer Aided Design (CAD), Building
Information Modeling (BIM), and City Information Modeling (CIM).
1.3 Purpose Statement
The purpose of this research is to understand the adaptation and implementation of the
growing innovation of parametric design into the field of landscape architecture in Texas.
Specifically the research attempts to understand the computer software tools that are adapted,
similarities and differences in education and practice. And potential impediments in the
adaptation of these new technologies among landscape architecture professionals in Texas.
Through a qualitative research approach to interview questions and the analysis and
conclusions to the interview data, the study draws a picture of the current level of adaptation to
the innovation of PD into landscape architecture firms in Texas. Research in this topic has the
possibility to increase awareness of technological advancements in the practice of landscape
architecture, architecture, and planning; as well as influence both the communication channels
of new innovations, and influence decisions of training at the academic and professional level.

3
1.4 Research Objectives
This research is an inquiry on the level of adaptation to PD by landscape architecture
professionals in Texas. Research suggests that landscape architects in practice have slowly
embraced software coding and computational logic (Bentley, et al., 2016). Furthermore, since
landscape architecture tends to be an ecological practice, landscape architects have been the
least active in the design arts to utilize digital technology in their practices (Pihlak, 2004).
Designers can now use PD tools with the help of computer scripting methods and the
availability of extensions and applications to customize programs and test landscapes over
periods of time through simulation modeling. These new approaches can implement variables
such as; wind speed, microclimates, drainage, social media, and marketplace metrics (Reed &
Nister, 2016). Some design schools have begun to implement classes and workshops to study
this form of design practice, but at this point, it appears to be an emerging subset of landscape
architecture in the early innovation stage (Bentley, et al., 2016; Rogers, 2003).
Research in the review of the literature on this topic holds a deeper understanding of the
history and current uses of parametric design nationally, and internationally (Bozdoc, 2003;
Merideth, et al., 2008). Through a qualitative study of the social and technical aspects of this
design practice within the contemporary design office, it is hypothesized that these new
processes can aid in the creation and implementation of new landforms, spaces, management,
and infrastructure for urban, suburban, and natural landscapes.

4
1.5. Research Questions
The questions emerging in this study stem from a desire for understanding
what is considered parametric design in landscape architecture, and how is it being accepted
and utilized into the field of landscape architecture. The subject group was established as
landscape architecture professionals, licensed or non-licensed. It was decided to conduct
interviews to determine themes in the practice of landscape architecture. The central questions
in this study are:
1. To what extent is parametric design adapted into the field of landscape architecture in
Texas?
2. What computer software tools are adapted for use in parametric design in Texas?
3. Are there similarities or differences in the level of adaptation of parametric design
between education and practice? If so, what are they?
4. What is the most important factor of adapting to innovation in PD for landscape
architect practices in Texas?
Additional questions such as the demographics within the firm or individual
practitioners that, if any, are involved in the design process using computational software, will
be noted within the interview process in Chapter Four.

5
1.6 Definition of Terms
Algorithm: Systematic procedures for solving mathematical problems. Algorithms
usually have an input, go through a process, and then create an output solution
(Jabi, 2013, p. 200).
Biophilic Design: Designing with the intent of affiliating with the love of life
(biophilia) beyond the human condition, to incorporate natural forces such as the wind, water,
sound, color, animals, in the built environment (Beatley, 2011).
Boolean Solids: A form of constructed solid geometry (CSG) used in 3D modeling to
produce a complex surface or object. (Foley,1996). In regards to 3D computer modeling, it is
used as a union of two or more objects or subtraction (Jabi, 2013).
BIM: Building Information Modeling. A computer aided method of conducting design
alongside statistics such as the cost of materials, spatial relationships, and building components
(Jabi, 2013).
CAD: Computer Aided Design, developed as a tool to create vector based graphics for
drawing and structural analysis. This innovation is one of the most used designing tools in the
world. Its usage varies from Architecture, to Landscape Architecture, to Mechanical and Civil
Engineering.
CAM: Computer Aided Manufacturing initially designed for the Automotive and
Aeronautic industries to develop three-dimensional drafting for use in manufacturing, and
current 3D printer, laser cutters, and other manufacturing tools.

6
CATIA: Acronym of computer-aided three-dimensional interactive application used
for Computer Aided Design (CAD), Computer-Aided Manufacturing (CAM), Computer-Aided
Engineering (CAE) product lifestyle management (PLM), and 3D modeling (Bernard, 2003).
City Engine: Software developed by Environmental Systems Research Institute (ESRI)
to convert 2D plan drawings into 3 dimensional buildings with the ability to store and change
data based on parameters set into the City Information Model (ESRI, 2017).
Coding: A set of characters used to convey a set of instructions within a computer
application. These instructions are the framework in which a software program runs on. Code
that a programmer writes is called source code. Once compiled, it is referred to as object code.
Code that is ready to run software is called executable code or machine code (Beal, 2017).
Computational: An algorithm that performs a predefined task such as creating standard
geometry or computing data
Grasshopper: A generative modeling plug in for Rhino 3D CAD system that can
perform advanced programing through visual scripting to explore 3D surfaces and forms,
through the input of a visual programming interface (VPI) (Payne, 2008)
Generative Form: An algorithm that simulates a natural evolution in search of the fittest
solution to a problem over the exploration of many design iterations (Jabi, 2013)
Geographic Information Systems (GIS): Computer Mapping System designed to
overlap environmental conditions with economic and legal boundaries in Vector and Raster
formats (Marsh, 2010).

7
Human Computer Interface: (HCI) A perspective between a computer or simulation
table and a human that sets forth a design directive, then crafts new instructions to reach a
design project solution (Cantrell & Holzman, 2016).
Mesh: A process of creating a "skin" over an object or the top of a non-prismatic shape
or framework such as topology or geometric shapes for further computer design iteration.
Unlike solid mesh, modeling meshes have less digital mass to them, allowing more precise
modeling surfaces and shortening the rendering process later (Young, 2012).
New Urbanism: An urban design movement which promotes walkable neighborhoods,
mixed-use, and transit-oriented development, and design practices standard before the rise of
the automobile in the 1930s (Greenbelt, 2015).
NURBS: Non-Uniform Rational B-Splines: are mathematical representations of 3D
geometry that can accurately describe any shape, from a simple 2D line or curve to the most
complex 3D organic freeform surface, solid or mesh. Because of their flexibility and accuracy,
NURBS models are used in any process from graphic representation to fabrication
(Packerham, 2014).
Open Graphic Library: A software interface to graphics hardware consisting of a set of
several hundred procedures and functions that allow a programmer to specify the objects and
operations involved in producing high-quality graphical images, specifically color images of
three-dimensional objects. Many OpenGL calls also pertain to drawing objects such as points,
lines, and polygons, and animation framebuffer manipulation (Segal, 2010).

8
Open Source Software: (OSS) Computer software with its source code made available
through a license by which the copyright holder provides the rights to study, change, and
distribute the software to anyone and for any purpose. This software is sometimes available to
the public for free to aid the process of innovation such as applications and extensions
(St. Laurent, 2008, p.4)
Parameters: Set of variables within an equation that sets constraints on the possible
outcomes of a given mathematical equation (Stover, 2016).
Parametric Design: Is a process, based on algorithmic thinking that enables the
expression of parameters and rules that, together, define, encode and clarify the relationship
between design intent and design response (Jabi, 2013, p.201). Parametric design as a process
of not fixed metric quantities but of relationships between objects, allowing changes to occur in
one of the objects then makes corresponding changes to the other objects
(Merideth, et al. 2008).
Parametricism: Has its origin in parametric design, which is based on the constraints in
a parametric equation it relies on programs, algorithms, and computers to manipulate equations
for design purposes (Schumacher, 2010).
Parametric Equation: A set of equations that express a set of quantities as specific
functions of independent variables, known as "parameters" (Stover, 2016).
Performative Landscapes: A way of designing with the aid analysis of physical systems
such as the wind, water, the sun, and biology through analysis, then using that analysis to
design better micro conditions for those physical systems (Hock, 2013).

9
Placemaking: A process of creating active plazas, walkable streets, and other attractive
public destinations for the use of collective urban socialization (Project for Public Spaces,
2009).
Polygonal Mesh: A type of geometrical modeling using vertices, edges, and faces to
help define an object in the form of triangles quadrilaterals or polygons (Smith, 2006).
Responsive Technologies: It is an interaction between environmental phenomenon and
architectural space utilizing low-tech sensors and robotic actuators to test simulations and to
communicate dynamic natural forces, social awareness, and the creation of new design
iterations through a human-computer interface (HCI) (Cantrell & Holzman, 2016).
Rhinoceros: Also called Rhino, is a standalone 3D modeling program that offers
precision and flexibility for anything from product design, to architecture and engineering. It is
also the platform for Grasshopper and several other extensions (Packerham, 2014).
Scripting: A method of using algorithmic design to generate complex forms while
maintaining the individual characteristics of pure geometry in the original form. It is taking the
source code of software and refining it to solve a problem (Jabi, 2013). It can also be used to
take on a geometric based ornamental quality or refine existing commands
(Merideth, et al. 2008).
Shape Files: A spatial data format within GIS software developed by ESRI, developed
to be shareable among other GIS applications and software products. These files can describe
Vector features such as points, lines, and polygons that may represent anything from water
sources, property lines, and other non-topological data (ESRI, 1988).

10
Smart Cities: Cities working towards better technological connections with available
open data. It is the ability to influence anything such as maintenance, traffic, energy costs, and
notifications for health risks and more (Cnet, 2017).
Smart Growth: Is development that better serves the economic, environmental and
social needs of communities. Such as planning for mix land uses, compact building design,
walkable neighborhoods, preserved open space, and community stakeholder collaboration in
development decisions, among other things (Greenbelt, 2015).
Tessellation: In regards to geometry that refers to a process of tiling a repeating
geometric shape surface with no overlapping surfaces (Jabi, 2013).
Tiling: Is the arrangement of repeating or relating planar shapes to cover any given area
without overlapping or leaving gaps. Used to create urban hardscapes and patterning
frameworks for glass and other materials in architecture (Jabi, 2013).
Visual Programming Environment: A calculation module within the structure of a
software extension that interacts with the geometry of a CAD model using indicators or
parameters to change the form or structure of a parametric model (Payne, 2008; Jabi, 2013).
1.7 Research Methods
This research utilizes a qualitative methods (Deming & Swaffield, 2011) to acquire the
knowledge needed for this research. The research primarily uses in-depth interviews as data
collection methods. The interview subjects were landscape architecture professional designers,
or managers of firms that are practicing landscape architecture in Texas. The snowball
11
technique was used to acquire the study population (Taylor & Bogdan, 1998). The study uses in
depth interviews with landscape architecture professionals to decipher themes in the adaptation
or rejection of parametric design practices in landscape architecture firms.
Rogers’ theory, Diffusion of Innovation is used to design questions to be used while
interviewing landscape architecture professionals (Rogers, 2003). Questions were administered
in person, on the phone, or online interviews. Themes were retrieved in the interviews reported
by the interviewees. The answers were studied qualitatively to understand where each firm or
landscape professional stands with respect to the Diffusion of Innovation of parametric design
in landscape architecture (Taylor & Bogdan, 1998).
The overall rate of adaption to the process of these design methods were studied in a
five-step process that is implemented into the design of the interview questions. Rogers’
Diffusion of Innovation Theory qualitatively examines an Innovation implementation, or non-
acceptance within a particular social system. This five-step rate of Innovation process is
(Rogers, 2003).
1. Perceptions of Relative Advantage
2. Perceptions of Compatibility
3. Perceptions of Complexity
4. Perceptions of Trial ability
5. Perceptions of Observability
(Rogers, 2003)
12
Once the analysis is completed through investigating themes in Rogers’ diffusion
theory, the data from the interviews, as well as themes generated from the interviews will be
used to answer the questions posed in the main research questions. Further clarification of
Rogers’ diffusion theory such as the elements of innovation, discussion of change agents, and
the perceived attributes of the innovation (Rogers, 2003), as well as detailed methods and
analysis, will be further explained in Chapter Three, Research Methods, and Chapter Four
Analysis and Findings of this thesis.
1.8 Significance and Limitations
This study is about understanding the importance and limitations of adapting to the
broader innovation of PD of Texas landscape architecture firms, and an investigation into the
educational, technical, and the cultural factors of the modern-day landscape architecture design
firm. The study has the potential not only to influence what is experienced as technical
challenges in the modern day design office, but also it’s visionary thinking about the future.
This research has the potential to affect the decisions of faculty and administration that make
up decisions about coursework and requirements for professional degrees at the university
level. The research benefited from interviews from LA professionals with various levels of
experience in Texas given that the interview pool was a small portion of landscape architectural
professionals in Texas. At the end of the research, it was realized that the majority of the
interviewees were not using parametric tools on a day to day basis. These interviewees were
primarily in management positions.

13
Another limitation in the research was the definition and understanding of parametric
design as a term, as well as a tool for landscape architecture professionals interviewed.
Although this concern is minimized by providing a common set of definitions and a list of the
available software tools for PD (See Appendix.C), the interviewees typically seemed to respond
to questions with limited knowledge about the overall concept of parametric design.
1.9 Chapter Summary
The focus of Chapter One has been to give an introduction of the thesis question and
intent, as well as defining the objective of the research questions for in-depth interviews. The
technical terms were defined to make the topic more understandable. The research methods
were introduced briefly to summarize Rogers’ Diffusion of Innovation (Rogers, 2003). The
perceived significance and limitations of the research were also discussed.
Through an intensive literature review in Chapter Two, the history, concepts, and
research and development that led to past innovations is studied to understand the innovations
of today and into the future. Chapter Three focuses on the research methods following
diffusion of innovation theory (Rogers, 2003) and explains the procedures followed to study
parametric design software with landscape architecture professionals in Texas.
Through the interview process, the adaptation of innovations past, present, and future in
landscape architecture firms in the state of Texas are reviewed, analyzed, and summarized in
Chapters Four and references with Rogers’ Diffusion of Innovation Theory. Chapter Five
summarizes the findings. Within those chapters, the research investigates the interviewees, and
14
the field topic of studying technological innovation. The results of the interviews are
referenced through the lens of Roger’s Diffusion of Innovations adaptation characteristics, Four
main elements of innovation, and the innovation adaption categories, as well as the significance
of the research as it relates to landscape architecture.
The research concludes with a qualitative analysis of the four main research questions.
To conclude that parametric design is developing at various stages depending on the demands
of the marketplace, future research, and vision for the future. The conclusion reflects on where
PD is potentially heading for as a design practice in this changing world and workforce.

15
Chapter 2
LITERATURE REVIEW
2.1 Introduction
This chapter focuses on the literature review of the research on parametric design
among landscape architecture professionals. The review focuses on history, definitions, and
the technological background in parametric design. The study looks at the broader architectural
design background, as well as the use of parametric design in the practice of landscape
architecture. This review explores parametric design both in the United States, internationally,
and Texas. A case study of the top award winning firms in the United States is reviewed to help
give a framework in Chapters 4 and 5, to understand the adaptation of PD software and
workflows into landscape architecture design firms in the State of Texas, compared to others in
the United States.
2.2 What is Parametric Design?
The phrase parametric design as it refers to digital technology stems from the use of
algorithms within a software system’s coding to perform tasks between the human user and the
digital computer. This algorithmic system enables parameters within the software to perform,
define, and clarify relationships between design intent and design response (Jabi, 2013;
Schumacher, 2010). These mathematical equations to a greater or lesser extent exist in most if
not all software that expresses a set of functions. These functions control variables and
parameters, and what decisions those variables and parameters are allowed to go through

16
(Stover & Weisstein, 2017). This study focuses on those software programs that fit this
description that are specific to the field of landscape architecture.
Generative form in parametric design is a process built into the software that reduces
the number of potential variables within an algorithm but maximizes its variability through the
transformation of parameters within a design (Jabi, 2013). Popularized after the architectural
legacy of formalism, and postmodernism, parametricism in architectural design seeks to
discover a balance between clarity of visual form and its buildability from a manufacturing or
construction standpoint (Merideth, et al. 2008). Parametric design can be expressed in classical
Euclidian geometrical shapes in architecture, as well as expressions of biophilic design
Merideth, et al. 2008; Beatley, 2011). Biological form in the past fifteen years or more has
inspired architectural PD. This inspiration has led to the scripting of three-dimensional models
that attempt to emulate patterns found in biology and nature in general (Castell, 2002).
A paradigm shift has occurred in the past decade or more in architectural design that has
opened up new modes of possibilities in landscape architecture and planning (Green, 2017). As
sustainability moves forward as a mainstream design practice in landscape architecture, more
traditional park design moves to the past. Progressive and younger designers are more likely to
manipulate the parameters of a design to make a design a more contemporary, performative,
regional, or ecologically sustainable environment (Margolis, 2008; Bentley, et al. 2016).
An example of a regional design would be with patterns found in nature. A familiar
pattern of this sort is the Voronoi pattern. This mathematical pattern is found in cell structure
as well as the micro-architecture found in bones (Bock, 2009; Li, 2012). This widely used

17
pattern has made an appearance in building facades and structures, urban street furnishings, and
hardscapes worldwide (See Figures 2.1.1 and 2.1.2). These two examples illustrate the
principles of generative form, biophilic design, and prototyping. Studying these conceptual
landscapes, and built street furniture, we can see how landscape architecture has the potential to
be customized from the ground up using parametric generative design.
Figure 2.1.1 Voronoi Pattern, Landscape Esc-studio, Glorieta Juan Carlos I Mula, Spain (Source:WAN, 2010)
Figure 2.1.2 OSSO bench (Source: Factory Furniture, 2017)

18
Through advancements in prototyping technology, materials can be fabricated to
individual project needs. Potential designs can be iterated many times over and still retain their
structure and constructability through advancements in computer-aided design and
manufacturing compatibilities (Jabi, 2013). These advancements have helped to make the
design process more efficient and adaptable.
2.3. History of Parametric Design
Innovations in national defense, automotive, and aerospace industries in the 1950’s and
60’s have led the development of parametric design using computer technology. The mid-
sixties saw the emergence of both machines that compute, and the software that they used
(National Research Council, 1999; Merideth, et al. 2008). These technological developments,
primarily in the engineering world, took around ten years to begin entering the mainstream.
During the early 1980’s, technological developments started to further diffuse computer
technology into the culture, making it more commercially desirable (Bozdoc, 2003). In 1995,
there was significant development, change, and adaptation to the digital environment. The
development of more user-friendly. programming such as Microsoft Windows operating
platform, and the advancement of central processor units (CPU) such as Pentium Pro from Intel
Inc. (Bozdoc, 2003; Intel, 2017), led the development of more advancements in what could be
done with software.
Industry standard software programs such as AutoCAD, Solid Works, Microstation, and
GIS reached the pinnacles of their development in the mid to late nineties, and have continued

19
to provide their respective industries with consistent and reliable software solutions. This
reliability helped universities to train the next generation of employees, and municipalities to
request certain workflows as prerequisites when working with architects and engineers. As
industry standard software made small changes to the layout and brought new tools into the
twenty-first century, a whole new group of developers has created more integrated, open,
collaborative, and user-friendly software to better synthesize disciplines, and iterate concepts
more quickly and efficiently. (Green, 2017).
The last ten years of software development has seen a rise in building and city
integrated modeling such as Autodesk’s Revit, Vectorworks Landmark, and ESRI’s City
Engine among others. Visual modeling software has become more user-friendly. as well as
offering a complete range of tools to customize the rendered output. SketchUp, 3Ds Max, and
Rhino 3D are becoming the industry standards in top landscape architecture firms in the United
States (Keating & Sumerlin, 2016; Green, 2017). Development of sensor technology,
augmented reality, and digital printing is beginning to open up new specialties for design firms
to consider developing future commercial markets in which to move forward in the culture of
design and consumerism in the coming decades of practice (Keating & Sumerlin, 2016; Green,
2017).
2.3.1 Pioneers in Computer Aided Design and Manufacturing
The period from 1963 through 1981 saw a surge in software and hardware development
of CAD and CAM innovation. The production aspect of cars and planes, as well as

20
developments in naval technology made for the explosion of this technology in the 1980’s
(Merideth, et al., 2008) The following section is an overview into the pioneers of parametric
design tools and the computer hardware innovation that followed alongside it. Modern
Computer Aided Design started in 1963 at Massachusetts Institute of Technology (MIT)
University when Ivan Sutherland developed Sketchpad (madlab, 2016).
Sketchpad was a basic tool that was the first graphic user interface tool that could draw
digital objects through pixels, polygons, and establish a special order between objects in space.
The tool was run through a TX-2 computer that was essentially the predecessor of the
minicomputer in size and the computing power of the early personal computers in the early
1980’s to be popularized 20 years later (Henderson, 2009).
During this period companies such as Intel Corporation developed information-
processing technology. Hardware development innovation at Intel started in the late 60’s and
gradually moved away from the giant room-sized computers of the 70’s towards what we now
know as the personal computer in the early 1980’s. IBM collaborated in the development of
several innovations to help with the speed and efficiency of the computer hardware (Intel,
2017).
Programmers at Dassault Aviation developed master geometry software to produce
external geometry for design and manufacturing, for use in aviation design. CATIA was
developed by Dassault starting in 1977, and after ten years of exploratory development, the
goal to create a better and more efficient 3D and computer aided design manufacturing system
was realized (Bernard, 2003).
21
The seventies was also the time during which companies such as Intel developed
information-processing technology. Hardware development innovation at Intel started in the
late 6o’s and gradually moved away from the giant computers of the 60’s and 70’s towards
what we now know as the personal computer. International Business Machines Corporation
(IBM) collaborated in the development of several Innovations to help with the speed and
efficiency of the computer hardware (Intel, 2017).
2.3.2 Pioneers in Geographical Information Systems
Geo design utilizing computational modeling, later known as Geographical Information
Systems (GIS) was rooted in research and development in the mid-60s. The invention of
computer methods for analysis management and display of digital information started with
Howard T Fisher and the Harvard Laboratory for Computer Graphics at Harvard Graduate
School of Design (HGSD) between 1963 in 1965. Fisher, who was an architect by training, led
the laboratory in the development of the Synagraphic Mapping System (SYMAP) with support
from a development grant from the Ford Foundation (Figure: 2.2.1) (Steinitz, 2012; Wilson,
2014). Carl Steinitz joined the faculty at HGSD in 1965 and was able put this spatial analysis
system to use to understand regional development, and conservation land uses on the shared
peninsula of Delmarva (Delaware, Maryland, and Virginia)(Wilson, 2014).

22
Figure 2.2.1 Peter Rogers (left), Carl Steinitz (right) work on the Preliminary GIS model,
(Source: Esri, 2013)
In 1969, Ian McHarg published the book “Design with Nature” which fundamentally
changed the teaching and practice of landscape architecture into a merger with regional
planning, landscape architecture, and city planning. The three disciplines have shared a
common history since the early 19th century when there was a large push to integrate planning
for recreation, transportation, storm drainage, flood control, and wastewater management
(McHarg, 1969). The merger of planning and landscape architecture was one that was not
readily embraced by the typical culture of landscape architects of the time (Spirn, 2000).
Most projects at this time and arguably to some extent to this day were designed per site
without considering the larger intentions of the region. Ian McHarg’s ideas became influential
to regional planning in North America. The regional expansion of the highway system at the
federal level had its effect on rural areas near metropolitan regions; this expansion primarily

23
shaped McHarg’s earlier projects (Marsh, 2010). The ideas that were developed at Penn State
under the direction of Ian McHarg the 60s and 70s led to the innovation of overlay and matrix.
McHarg claimed to have invented the overlay method that Carl Steinitz Paul Parker and Lawrie
Jordan utilized in the first moves towards developing a Geographic Information System at
Harvard in the late sixties (Spirn, 2000).
This overlay and matrix methodology of organizing past present and future uses of land
is preformed though layering integrated disciplines such as geology, topography, soils,
hydrology, vegetation, current land use, and potential future use to identify the most suitable of
locations (McHarg, 1969; Wayne, 2003).
Students developed systems of inventory for ecological conditions, calling it anything
from the layer cake to ecological inventory. The inventory is a list, as standard categories using
climate, geology, hydrology, soils, vegetation, and wildlife. McHarg believed that there should
be an inherent environmental understandability necessary for intelligent design. If a designer
knows the physiography, such as the history, geology, climate, and soils, and understands the
interconnection between the plants and animals, he or she can predict how nature will react
when changes to the landscape occur (McHarg, 1969).
The ecological inventory was, and still is, a diagnostic tool using a checklist of
interrelated systems. Each new inventory can be adapted to its particular region to understand
not only what is there, but also how a landscape functions currently, and how it might change
moving forward. When it came time to link goals of the designer’s plan to the implementation
of a built project the term “adaptive strategies “was coined by Spirn (Spirn, 2000. p.109). This

24
strategy is a method of highlighting potential natural features and processes not immediately
obvious to a particular client’s consciousness (Herrington, 2010; Spirn, 2000).
In 1969, Jack Dangermound, and his wife Laura formed Environmental Systems
Research Institute (ESRI) in Redlands California. The company later became the first to
develop digital maps. Company growth was slow in the 70’s and 80’s with the use of mini-
computers, workstations, then eventually with use of the PC. In 1982 the software became
publically available and was named ArcGIS. This software becomes the company’s flagship
software (Helft, 2016). The software is used on anything from urban design, controlling
disease worldwide, helping prevent natural disasters, or helping with the aftermath of a natural
disaster (Helft, 2016).
2.4. The Development of Parametric Computation:
The 1980's to Present
Around 1980 CATIA developers started a move towards bringing their engineer driven
software into the larger market as a more industry accessible software (Bernard, 2003).
Autodesk entered the marketplace in the same year with AutoCAD and quickly became the
leader in computer-aided design. Over time Autodesk developed most of the Innovation in the
expression of 3D forms and drawing commands such as objectsnap, isometric views, attributes,
the polyline, and Non-Uniform Rational B-Splines (NURBS) among others. This was also the
time when the disciplines of CAD (Computer Aided Design) and CAM (Computer Aided
Manufacturing) become more exclusive of one another (Bozdoc, 2003).

25
2.4.1 The Development of Parametric Design, 1980's through 1995
In the early 1980’s both CATIA and AutoCAD were brought to market. Mike Riddle
wrote the first version of AutoCAD in 1981. Initially, this program was called Micro CAD,
and then later renamed to Interact. In November of that year, AutoCAD released the first CAD
program to run off the PC. AutoCAD became more commercially available two years later in
1983 (Bozdoc, 2003; Kennedy, 2014).
In 1981, Dassault Systems, with roots in the late 6o’s aviation design market, allied
with IBM to help bring their software to a larger audience. The development of CATIA
continued until their 10th anniversary at which point they reached 2500 customers. In the same
year, they acquired CADAM (Computer Augmented Design and Manufacturing) one of their
competitors. Drafting was added to CATIA in 1984 allowing it to act independently from
CADAM
(Bernard, 2003).
In 1984 Bentley systems formed by Keith Bentley, created a prototype for the later
workstation (Chouinard, 2017). The release of the Workstation came a year later, (see Figure
2.4.1), which allowed users to view IGD S (Interactive Graphics Design Software) drawings
without needing Intergraph’s software (Reynolds, 1987). Bentley Systems later merged with
Intergraph to produce a new file sharing system called Design file (DNG). Autodesk’s
AutoCAD sales reached 27 million (Bozdoc, 2003). This is the first year that 3D capabilities

26
and polylines are introduced. CATIA became the leading drafting, 3D solids, and robotic
friendly software for the aeronautical industry (Bernard, 2003).
In 1986, AutoCAD sold fifty thousand copies worldwide. AutoCAD became the leading
software for computer-aided design for at least the next 10 years according to PC World
magazine, a title it holds to this day (Kennedy, 2014). In 1987 AutoCAD developed an
advanced user interface with the menu bar for the menus icons and dialog boxes and also
designed auto lisp, ADS (AutoCAD Development System), and APIs (Application
Programming Interfaces) (Hurley, 2017; Bozdoc, 2003).
Figure 2.4.1 INTERGRAPH Workstation, 1983. (Source: Quondam)

27
In 1990, Bentley System’s Microstation reached hundred thousand users in sales. In
this same year, AutoCAD release 11 was introduced (Bozdoc, 2003). It offered paper space,
animation, and shading technology (Hurley, 2017).
In 1991, Microsoft developed open GL for use with Windows NT. Open GL is
application-programming interface (API) procedure software for producing 2D and 3D vector
graphics; thus improving the software’s ability to make points, lines, and polygons. It provided
additional support for shading, texture mapping, lighting, animation, special effects, and greater
depth of field (Segal & Akeley, 2010). Silicon Graphics Inc. developed this innovation, with
strong ties to the motion picture business; it quickly became the standard for 3D color graphics
and rendering. Applied Geometry (AG) consulted with McNeel software development to
integrate their NURBS geometry library into AutoCAD as a plug in called AccuModel
(McNeel, 2015).
The year 1993 produced promising results with the development of the first
multipurpose software that looked like building information modeling (BIM). The software
was similar to CATIA software that allows 3D design, engineering drawings, and analysis
(Bozdoc, 2003). Autodesk developed 3D studio, and AutoCAD 12. Release 12 became their
most successful release to date. The new release allowed several drawings to be accessed at
once, improved graphic controls, and a provided a separate render window (Hurley, 2017).
McNeel and Applied Geometry changed the name of AccuModel to Sculptura in the
first release of the software, then as McNeel took over as the lead developer and renamed it

28
Sculptura 2, and then nicknamed it Rhinoceros a few months later (McNeel, 2015). The
company Solid Works Inc. was formed in this same year (Bernard, 2003).
In 1994, sales of AutoCAD reached the 1 million-user mark worldwide. The closest
competitor’s to Autodesk at this time were CAD key with 180,000 copies, and Bentley’s
Microstation with 155,000 copies. AutoCAD sales continued to soar through 1994 with sales
reaching $465 million (Bozdoc, 2003). McNeel releases Rhinoceros as a beta program
(McNeel, 2015).
Research and Development of CAD and CAM for use in parametric design, as well as
the development of the computer systems themselves, lead to consistently more efficient and
reliable set of tools for the growing computer aided design world. AutoCAD continued as an
industry leader in CAD software for a range of design uses as early as 1986 a title it holds for
the near future. The popularity of AutoCAD has allowed for efficient sharing of construction
documents for over 35 years (Kennedy, 2014).
2.4.2 Development of Computer Aided Design 1995 through the present
Computer development sped up from 1995 through 2000 as computer processors and
other hardware innovation developed with an active marketplace (Intel, 2017). In this same
time frame the internet becomes a conventional interest of the culture.
In 1995, Autodesk established themselves as the continued leader in computer aided
design software, with 3 million copies of the software sold. This was the first year that they
start to develop 3D Studio Max for the Windows NT platform. AutoCAD expanded its

29
accessibility to 150 file formats, added a correction cloud for viewing and redlining drawings.
They also introduce advanced servicing, and NURBS technology, which stands for (Non-
Uniform Rational Basis Splines). This new advance allowed math and form generation for
surfaces and curves, allowing easier and more efficient workflows in three-dimensional
modeling (Jabi, 2013), over previous multi-faceted surfaces (McNeel, 2015). This
breakthrough helped to develop more interest in using the software as a true parametric design
tool, as evidenced in built works of the mid-1990s’.
Continuing into 1995, Autodesk, Parametric Technology, and Bentley all released 3D
parametric solid modeling software. AutoCAD Designer features AME models and exporting
abilities into 3D studio. The company Parametric Technology releases a parametric modeling
CAD/CAM program this is the first commercially available 3D solid modeling package
(Choulnard, & Bell, 2017). Bentley also advances their Microstation platform in solid
modeling in mechanical design in this same year.
The year 1996 was another big year for development. Bentley’s Microstation started
focusing more on architectural modeling, plant engineering, and geoengineering. Unigraphics
became the largest seller of CAD/CAM contracts in history to General Motors. The product
greatly improved service modeling, assembly capabilities, and checking for interference. This
year produced several innovations in 3D modeling lighting technology and rendering such as
LightScape and LightWave by New Tek. AutoCAD brought to market its stripped down
version AutoCAD LT selling 250,000 copies in one year. (Hurley, 2017).

30
The year 1997 was the first time Autodesk created a toolkit of meshes, fonts, and
animation. AutoCAD release 14 came out with many improvements in 2D and 3D graphics,
and the ability to run with other active X automation compliant applications. The American
Institute of Architects, (AIA), produced a second edition of layering guidelines for AutoCAD
to help aid the efficiency of CAD users. The guidelines seems to indicate a need for training
that the Autodesk company is not meeting. Revit technology Corporation introduced the first
commercially available parametric building information modeling system developed for the
AEC industry (Bozdoc, 2003).
After several mergers and meager development over the course of three years,
McNeels’ Rhinoceros was purchased from the company Alias by Silicon Graphics. A decision
was made to develop a standalone 3Dmodeling version of Rhino for windows. In 1998, Rhino
version 1.0 was released in beta form. Within a year there are 150,000 beta versions being
tested. Rhino was publically released in the United States in October 1998 of that same year,
and also released for use in Japan and Korea in 1999 (McNeel, 2015).
In 1999, a company formed called @last, with a goal to make a powerful 3D rendering
program that was easy and more intuitive to use. After a year of development, SketchUp was
born in August 2000. The receptive success of SketchUp at the AEC Systems conference, and
their collaboration with Google Earth to create a plug-in to geo-locate SketchUp models into
space led Google to purchase the company in March 2006 (Donley, 2011). The ease of use and
customization led to an early success to this 3D modeling tool.

31
2.5 Development and Use of Parametric Design
Development of computing software and hardware continued to evolve. Computer
software has become more capable of advanced aesthetics and analytics, as well as becoming
more intuitive to use. According to data compiled in the research interviews in this study, open
source software platforms such as SketchUp, have enjoyed success in the design fields (Green,
2017); and it is now one of the main tools requested for new employees in landscape
architecture (Bentley, et al, 2016). Open source software allows for an easier way to change
what a software program can do versus the more traditional method of coding. Built into the
source code of the software, it allows a copyright holder the rights to study and change the
software to perform new functions (St. Laurent, 2008).
2.5.1 Coding versus Scripting
Coding and computational logic have become so integrated into the programs that
designers and planners use that it has become easy to take them for granted (Cantrell &
Holzman, 2016). Computer coding has been the primary force behind software development in
the last 50 years, yet the past 10-15 years has seen the rise of a different method of writing and
re-writing of software with the innovation of computing languages, and open sourced software
and scripting (Green, 2017).
Computer coding is a method of designing or writing a computer program. Each coding
language is unique regarding how it uses syntax within the language of the software program.
In general, coding runs a program via syntax, algorithms define parameters, and the program

32
completes the tasks (Payne, 2008; Jabi, 2013). These functions can be manipulated through
scripting within a program or by the development of extensions or applications (Green, 2017).
This is technical subject into itself, which can take months or even years to understand, and is
beyond the scope of this present research.
Scripting is a technique of using algorithmic design to generate complex forms while
maintaining individual characteristics of simple geometry. Scripting is becoming more and
more commonplace as software becomes more open sourced and capable of manipulation
outside the domain of different software companies, to be customized not from the top down,
but from bottom up (Bentley, et al. 2016). There is growing need for controlling project
production, efficiency of materials, and implementation towards the final design. Scripting to
customize the workflow using syntax language is one of the ways to influence how the
computer can perform actions that lead to better outcomes for their use (Merideth, et al. 2008)
New scripting procedures are being adopted by leading landscape architecture firms in
the United States, and abroad to write different methodologies to design spaces and its
amenities. (Wilson, 2016; Keating & Summerlin, 2016). Scripting environments in 3D
programs are varied and many in their syntax, and language. Parametric design landscape
architecture and related fields are about logic, metrics, geometry, topography, and the
interaction of those elements. Algorithms can be rewritten using different syntax. Older
algorithm based 3D design was less user-friendly., if one part of a design was changed, the
designer would need to fix things manually that were as a result of those design decisions. It is
this inflexibility that scripting aims to correct (Frazer, 2017).

33
Processing and MaxScript are the main programing languages in which 2D and 3D
design programs typically use. Processing is for 2D software and takes advantage of being
open source, and Java based. MaxScript is a 3D programming scripting system. Other 3D
scripting systems exist for designers and architects such as AutoLISP in AutoCAD, Maya
Embedded Language (MEL), Python, Generative Components (GC), Java, DesignScript, and
Grasshopper. Maxscript and Design Script excel at 3D programming for designing software.
MaxScript is the language in Autodesk’s’ 3Ds Max software (Jabi, 2013). DesignScript also
developed by Autodesk strives to combine several visual programming approaches to become a
more flexible platform to build new programs (Jabi, 2013).
DesignScript represents a new way of scripting that incorporates form finding to
parametric analysis. It is capable of combining variables such building performance to the
form that the new structure creates. This type of scripting allows bridging of the two main
traditions of programing language, imperative and associative (Jabi, 2013).
Imperative programming is the more basic language of the two; it directs the flow of
variables and parameters. This is the type of programming in Python, C++, Java, and
Processing computer coding language. Associative programming occurs in generative
parametric software such as GC and Grasshopper. GC systems are defined by visual graphs
showing relationships between variables, and how the variables are used. These variables are
not necessarily under the explicit control of the user. DesignScript is a hybrid of these two
languages. The hybrid script is used to solve design problems of interaction of materials, and

34
the ability to choose and change variables and parameters to more effectively design than either
of the styles on their own (Payne, 2008; Jabi, 2013).
2.5.2 Contemporary Use of Parametric Design in Architecture and Public Art
The greatest challenge of parametric design in architecture is that form needs to have a
purpose or cultural relevance. Parametric design cannot stand on its own as a game or
algorithm; the designer must strive for a deeper or regionalism connection to the people or
landscapes they are designing for (Merideth, et al. 2008).
Architecture tends to be more of a social-political and avant-garde style. The
parameters of this cultural landscape can engage the full realm of its capabilities. To produce
truly engaging structures takes a skilled background to interrelate the cultural, natural, and
marketplace relationships between the places where people dwell and play. Parametrics will no
doubt have a large role in the future of buildable structures, yet technology will not fix all our
problems. Parametric solutions have the capability to become more inclusive, adaptable and
less avant-garde, making for more socially relevant work in the years to come
(Meredith, et al. 2008).
One of the ways this work is merging to the design fields is through the formation of
design groups or workshops that often involve the participation of academia to further the
spread of ideas and creative thinking (Vanucci, 2008; Brown, 2009). One such group is
Parametric Applied Research Team (P.Art) out of the UK. This design lab was put together to
expand innovation at the structural and civil engineering consultancy of Adams, Kara, and

35
Taylor in London. This research group brings together designers from a variety of
backgrounds like architecture, structural analysis, computer science, forensic analysis, 3D
visualization, and animation, to research parametric design. The goal was to develop the
discipline of structural engineering using existing software and structural design, in multi-
disciplinary collaboration (Vanucci, 2008).
The most recent shifts in architectural discourse have happened as the result
of the evolution of computational software. Yet without easy integration into various
disciplines of designers and consultants, new software can take years or even decades to
integrate into ordinary practice. The new order of design using generative form making, allows
geometry within the parameters to interact and change in a predictable fashion with the other
variables that it is associated within its equation, to aid in post design problem solving analysis
towards workable, buildable solutions (Meredith, et al. 2008; Simmonds, 2008).
These equations or smart models have a fair amount of flexibility and have started a
shift in how things are designed. This shift is from designing specific objects, to designing
relationships between components within those objects. Parametric design has the possibility
to develop more intricate systems of relationships between objects in a space. The
tendency now is to develop the components that create the object first, versus the other more
typical way around, where the spaces are created first, and then the objects within the space are
designed (Simmonds, 2008).
The artist Antony Gormley utilized parametric design on several sculptures including
work on the “Space Station “exhibition at the Hayward Gallery, London in 2006. A custom

36
computer program was written as a plugin to Rhino using c++ coding language. The purpose
of the program created called Gormley Boxer program was to convert a full body scan of the
artist into a series of boxes representing the overall shape of the artist in the fetal position.
(See Figure 2.5.1) The sculpture was run through a structural analysis tool to avoid face
buckling of the steel plates, and corner crushing under all the weight of the sculpture. Once the
analysis passed, the software reverse assembled the sculpture and numbered the pieces with
adjoining information listed on the face of the pieces. The information was sent off to a
fabricator to produce the pieces for final assembly of the piece (Simmonds, 2008).
Figure 2.5.1: Antony Gormley, “Space Station” Steel, 2006 (Source: Gormley 2007)
The French Architect Marc Fornes has a firm entitled “THE VERY MANY” in which
parametric tools are used to design plates are fastened together with bolts to create elaborate
and playful architectural installations (see Figure 2.5.2). The installations take on the form of
branching coral or floral like patterned like pavilions. Many of these installations are built

37
using 1 mm thick aluminum plate allowing flexibility in the form and rigidity of the structure.
The pieces combine enclosure with structure and the connecting points, create variable
ornamental patterns or
apertures of light. One of the ongoing goals of the project is to create a standardized
production of the installations (Jabi, 2013) through a fabricated part construction method
(Stacy, 2013).
Figure: 2.5.2 “Chromaphasia (Rhythm of Colors) from “THEVERYMANY”, Marc Fornes, Denver Botanical
Garden, Denver, CO. (Source: Chad Paulson)
For now, such pieces are highly customizable and labor intensive to build (Fornes,
2016). Fornes starts each new project writing code and prototyping the projects using 3D
modeling. A computational change had to be made because the software could not model the

38
multi-dimensional configuring needed by Fornes. By changing the NURB surface parameters,
the artists’ team was able to create a form-finding algorithm that emulated the flexibility of the
material to smooth and relax. The shapes forming the structure are then unrolled in the
software to create manufacturable pieces to be cut using a CAM operated laser cutter
(Jabi, 2013).
Architect Frank Gehry firm created software technology based on the CATIA platform
called “Design Project”, which is used to work on geometry and structure at the same time
simultaneously. Design Project has been used in Gehry’s biomorphic public architecture. It is
capable of several methods of working parametrically such as, framing, surfaces, measuring
stress points, and in branching structures, like the work of Frei Otto (Vanucci, 2008)
An example of this branching analysis is found in the collaborative team effort at P.Art.,
which stands for Parametric Applied Research Team. This design lab organized by Adams
Kara Taylor (AKT) lab brainstorms innovative design strategies to be incorporated into
architectural works. The parametric software iterates several design solutions (see Figure
2.5.3). The software can to compute the angle between branches, the number of branches
linked, and the displacements of nodes in the space. It also determines nodes in architecture,
reference points of structural load, and active space on the ground floor. This part of the design
process is a roughed in sketch of the possibilities, also referred to as design iterations.
(Vanucci, 2008)
Parametric design in architecture is heavily led by geometry and algorithmic methods,
which take simple forms and make them more complicated. Creating form with parametric

39
tools is easy but making it simple for the human psyche to understand or effectively
manufacture is much more difficult. The designer’s role is to create a meaningful selection of
elements and procedures to come up with a final solution (Meredith, et al. 2008).
Figure 2.5.3 Branching Structure Iterations. (Source: Merideth, et al. 2008)
Renzo Piano’s building in Berne, Switzerland called the Zentrum Paul Klee
incorporates a changing curvature within the roof structure. Parametric tools were used to
modify the incline angle of the roof structure and the curvature of the supporting beams
(see Figure 2.5.4). In a double curved surface, each curved window in the structure has to be
designed parametrically to be prototyped or manufactured later on (Stacy, 2013)

40
Tiling, another methodology of parametric design and architecture, is noted in Renzo
Piano’s Peek & Clopenburg Weltstadthaus department store in Cologne, Germany (see figure
2.5.5). The structure was filled in with window (tiles) of various sizes over a double curved
surface (Meredith, et al. 2008).
Figure: 2.5.4: Zentrum Paul Klee, Berne, Switzerland, Architect: Renzo Piano (Source: designrulz, 2017)
Figure 2.5.5: Peek & Clopenburg Weltstadthaus dept store, Cologne, Germany, (Source: pinterest, 2017)

41
Another example of tiling is found in Dallas, Texas at the Perot Museum of Nature and
Science, designed by Thom Mayne of Morphosis Architecture (see figure 2.5.6). The
surrounding fascade of the Perot Museum was designed to convey a cross section of geological
strata through parametrically designed fabricated building tiles (Texas Society of Architects,
2011).
Talley and Associates of Dallas, Texas designed the landscape surrounding the Perot
museum to have plants and microenvironments representing a cross section of five ecological
zones expressed through several stories of abstracted hardscape and native Texas plantings
(Texas Society of Architects, 2011). The architecture and landscape was designed to be one
continuous whole, this is part of the larger urban context design approach at Morphosis.
Figure 2.5.6 Perot Museum Dallas, TX. Morphosis, Talley and Associates (Source: Chad Paulson)
Thom Mayne talks about giving shape to the changing social and political environment
of the urban society, and the complex interplay of human and natural forces shaping our cities
42
today. Mayne believes designers must plan for flexible and more adaptive spatial design. He
speaks of a new methodology that links process to product through research. To seek practical
and poetic urban solutions on spatial and systematic operations as a way of developing form.
With a new merger between architecture and human experience, parametric modeling helps to
facilitate an evolving set of user or stakeholder interests (Mayne, 2011).
New developments in computational modeling offer an endless variety of design
iterations, including the ability to shape space three-dimensionally using dynamic volume and
space rather than traditional orthographically oriented stacking. This development allows for
highly individualized yet intricate spaces. Morphosis Architecture seeks to enhance the human
experience in their architecture and to find a new sense of wonder and harmony in a fragmented
urban landscape. (Mayne, 2011).
Advanced computational tools have allowed Morphosis Architecture to try new
geometry. They work to embrace the cultural, behavioral, and diversity of cities by expressing
these features organically. Parametric tools offer exciting possibilities, but they must be used
with great care and thought in a design. “It is a great challenge in today’s world of urban
design to combine the best qualities of traditional placemaking’s character quality and sense of
place, with the latest technology, but to do it in a way that is neither random or overly
simplistic (Mayne, 2011, p.35).”

43
2.5.3 Development of Geographical Information Systems
Geographical Information Systems (GIS) are useful tools for mapping and planning any
number of scales from a city plot to a larger region. Computer advancements in hardware and
software in the 1990s, as well as the development of the internet, expanded the availability and
speed of geographical information worldwide (Gocmen, 2010).
Despite being readily available, GIS was largely underutilized in landscape design
research from 1980-1995 (Nijhuis, 2014). GIS was new in the 1980s and 1990s, The early
software was not particularly intuitive and required command line based operation that was not
particularly helpful for the typical human computer interface (Gocmen, 2010). Furthermore, the
database that was available for users in the 1980’s was not extensive. The database initially
created a constraint for widespread adaption of GIS into conventional planning departments
(Gocmen, 2010).
In around 1997, ESRI released an innovation called the shape file that eased
accessibility issues for the creation of open shared datasets between planning related fields.
Shapefiles store non-topological geometry and other attributes for specific parcels of land. The
geometry for these areas is described with the use of vector coordinates to define point, lines,
and areas. Shape files use less memory then topological files and have the ability to be created
or shared without the direct use of GIS software (ESRI, 1998). This development dramatically
increased the volume of information available, especially on the internet.
Education and research institutes have had the important role of spreading digital
knowledge on the capabilities of GIS applications for landscape architecture (Nijhuis, 2014). In

44
the mid to late 1990s, GIS became part of the planning curriculum in universities across the
United States. GIS analysis lays the groundwork for individuals to study and practice spatial
intelligence for regional and urban development projects. This groundwork is a multifaceted
approach to designing, and it often requires multi-disciplinary involvement from ecologists,
hydrologists, economists, sociologists, geographic scientists as well as other design
professionals (Nijhuis, 2014).
GIS is used to synthesize geographical knowledge, this synthesizes data in the creation
or refinement of a new design that is not apparent from physical observation. This knowledge
can take the form of spatial structure, ecological, economic, and social contexts of a given plan
or design. These observations can be broken down into, three-dimensional construction, site
history, context, scale and evolutionary process (Nijhuis, 2014).
Single layers in GIS alone often have complex models and analysis behind them. GIS
can use systems of weighting indexes for the best solutions such as the least cost path. This
method is called suitability analysis. Most GIS design problems are very complex and are not
easily understood through algorithmic means. Suitability is one method that allows for the
optimization of decisions to be visualized and recreated as shape files (Steinitz, 2012).
If the model has spatial and temporal characteristics, the complexity gets complicated,
as it becomes very difficult to program for the individual aspects. GIS design solutions can be
solved using many different technologies. Carl Steinitz goes on to say design and planning are
two names for the same thing. However, the ability to take a solution too far is very
humanistic. “Parametric design is useful for algorithmic solutions are that already exist,” says
45
Carl Steinitz. “Computational modeling is most effective when going after design that is
routine. Finding a balance between artistic and science-based solutions requires a more refined
and inventive way of designing (Steinitz, 2012, p. 8).”
2.5.4 Development of Building and City Information Modeling
Building Information Modeling (BIM) is the use of 3D models to test and communicate
building project decisions. The use of BIM modeling is growing in such a way that it is
becoming the standard for governments, and organizations worldwide. In the U.S. the
governmental agency the General Services Administration (GSA), the agency that builds and
manages federal facilities, has been requiring BIM use since 2006, and the U.S. Army Corp of
Engineers has required it for demonstrating plans for military construction projects (Autodesk,
2016).
There is a growing need for the architecture, engineering, and construction industries to
collaborate, and thereby save time and costs. BIM provides the best way to connect design
intent to fabricators, contractors, and stakeholders. It also has the potential to become useful in
the rise of sustainable design iterations such as building performance design. This same sort of
concept can be applied to the landscape adjoining a building to improve micro-climate and
building performance together (Lally, 2014).
The concept of performative design in architecture is one that seeks to evaluate the
efficiency of the architecture, as well as the natural system that is that it is surrounded by.
Andreas Ruby states: “Performance does not ask how form looks, but what form is generated
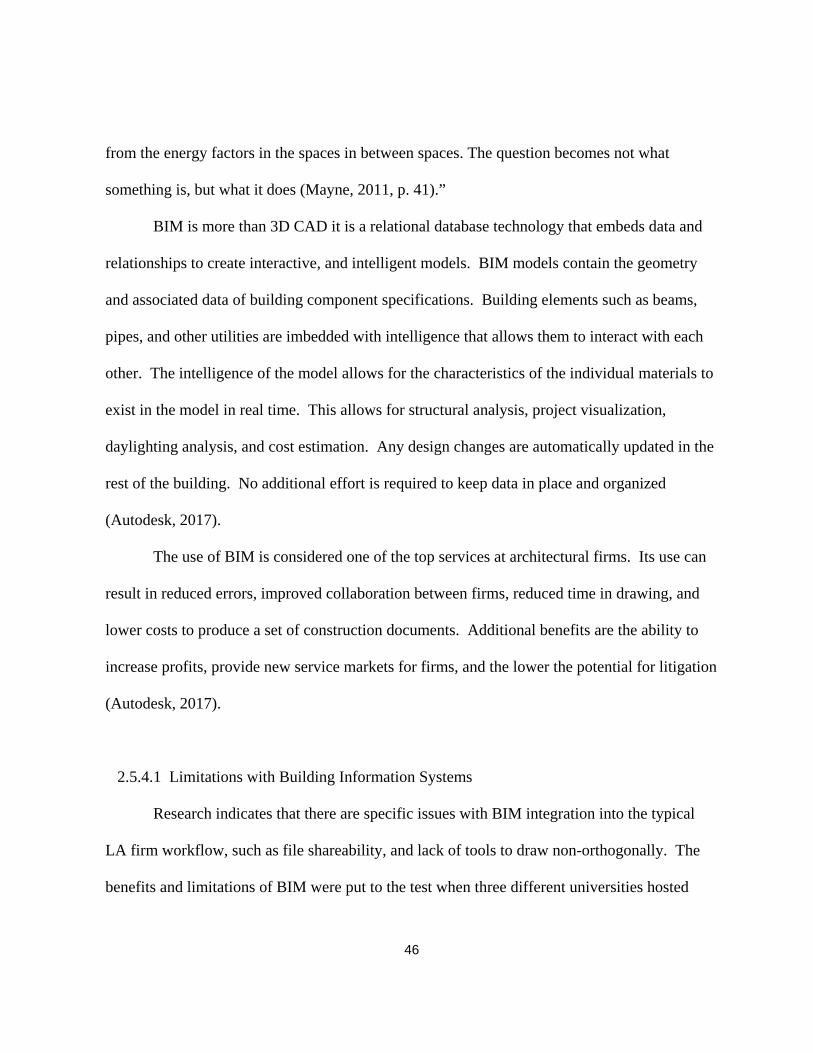
46
from the energy factors in the spaces in between spaces. The question becomes not what
something is, but what it does (Mayne, 2011, p. 41).”
BIM is more than 3D CAD it is a relational database technology that embeds data and
relationships to create interactive, and intelligent models. BIM models contain the geometry
and associated data of building component specifications. Building elements such as beams,
pipes, and other utilities are imbedded with intelligence that allows them to interact with each
other. The intelligence of the model allows for the characteristics of the individual materials to
exist in the model in real time. This allows for structural analysis, project visualization,
daylighting analysis, and cost estimation. Any design changes are automatically updated in the
rest of the building. No additional effort is required to keep data in place and organized
(Autodesk, 2017).
The use of BIM is considered one of the top services at architectural firms. Its use can
result in reduced errors, improved collaboration between firms, reduced time in drawing, and
lower costs to produce a set of construction documents. Additional benefits are the ability to
increase profits, provide new service markets for firms, and the lower the potential for litigation
(Autodesk, 2017).
2.5.4.1 Limitations with Building Information Systems
Research indicates that there are specific issues with BIM integration into the typical
LA firm workflow, such as file shareability, and lack of tools to draw non-orthogonally. The
benefits and limitations of BIM were put to the test when three different universities hosted

47
multi-collaborative design labs to look into the effectiveness of BIM as a design tool to design
and organize in the combined environment (Pihlak, et al. 2011).
The collaborative environment included architects, landscape architects, and engineers.
Engineers were from multi-disciplines: mechanical, structural, electrical, lighting, as well as
construction engineers. The idea was to look into cross-disciplinary design and planning at the
early conceptual stage. BIM’s main advantage has been its ability to design efficiently and
more cost-effectively. The architects tended to be more concerned with aesthetic and design
quality, while the engineers tend to be more interested in the overall efficiency of the project
(Pihlak, et al. 2011).
The scope of this study indicated that several different processes of integration between
disciplines could be achieved. It did not however, create any particular workflow as a
suggested integration of disciplines. The study did indicate that BIM could be incorporated
successfully at either the lower or the upper ends of the design education. Collaboration
between disciplines led to a richer, and better-informed design, however, it did not result in a
significant increase in the aesthetic quality (Pihlak , et al. 2011).
All the studios indicated that the collaboration helped with the process of using BIM. It
was encouraging to see in the research that practitioners looked at methods of using BIM to
evaluate problems, not just determine solutions. The research reinforced the notion of “design
engineering” as the means by which the integration of ideas happen from the outset, as a way to
a more collaborative relationship between landscape architects, architects, and engineers
(Pihlak , et al. 2011).

48
2.5.5 Contemporary use of Parametric Design in Planning using City Information Modeling
City Information Modeling (CIM) is relatively new in the design and planning world, so
new that there is no clear technology leader in the world market. CIM is similar to the structure
of BIM but it is much larger, like the infrastructure scale of an entire city. Many professionals
are touting it as CAD meeting GIS. (Beirao, et al. 2012).
There are many ways to facilitate City Information Modeling in the international
development market, as well as in the United States (Khemiani, 2017). The current software
products used in the international marketplace are Infra Works from Autodesk, ESRI’s City
Engine, Modeluer an extension for SketchUP Pro (Figure 2.5.7), Bentleys CIM products, City
Planner from Agency 9, and Cyber City 3D among others.
Modeluer was used to win the “Smart City Challenge 2016” in Columbus Ohio, and
ESRI’s City Engine was recently used in 3D CIM models of Singapore (Khemiani, 2017;
ESRI, 2017). Virtual City Systems has mapped the largest urban data set to date in Berlin with
a mapped area of 900 kilometers square. Cloud Cities is another promising technology for city
infrastructure modeling that is being developed in Switzerland (Khemiani, 2017).
ESRI has recently released a ninth version of City Engine (Figure 2.5.8). It interpolates
well with GIS data. As an extension of the well-vetted ArcGIS platform, it is able to connect to
shape files to build models that are dense with useful information. This should be one of the
top contenders in the emerging CIM environment for years to come (ArcGIS, 2017).

49
Figure 2.5.7 Modeluer extension for SketchUp Pro (Source: SketchUcation, 2017)
Figure 2.5.8 City Engine, (Source: ESRI, 2017)
City modeling is an exercise in form generation and information indicators, in other
words, aesthetics vs. costs. Some of the basics involved are city codes like building heights,

50
zoning preferences, setbacks, flood zones and more (ESRI, 2017). Additional parameters that
can influence the design such parking spaces, building square footage, plus any number of
parameters such as green space, transit, new urbanism density, biophilic design, among others
can be inserted as data points (ArcGIS, 2017). Custom CIM processes can also be scripted to
bridge hybrid models from software such as Rhinoceros, Grasshopper, and GIS through
scripting methods (Wilson, 2016).
2.6 Contemporary use and practitioners of
Parametric Design in Landscape Architecture
As a measure of parametric design in landscape architecture a study was conducted by
the American Society of Landscape Architects (ASLA) In 2016, 15 ASLA award-winning
firms from 2013 to 2015 were contacted to participate in a study (Figure 2.6 ). The study was
based on what software and graphics these firms used, especially for high-end perspectives.
The survey was broken down into four categories. 2D drawing, 3D modeling, image rendering,
and post processing. The typical workflow was a 2D drafting program used to build the site
and plan. Projects are then transformed in three-dimensional space using 3D modeling. A
rendering program was then used to improve materials and lighting and export as a completed
as a 2D graphic. Final touchups to enhance the aesthetics were done in a post-processing
program (Keating & Sumerlin, 2016).

51
Almost unanimously AutoCAD was the preferred 2D program of the 15 firms surveyed
14 used AutoCAD, the top three preferred software for use in landscape architecture 2D
drafting were; Revit, Vector Works, and Civil 3D AutoCAD. In the 3D modeling area Rhino
3D was the unanimous winner with 87% of the firms using it. SketchUp Pro with was used by
53% of the firms, with Autodesk 3Ds Max coming in at third with 20% usage. Many of the
firms that used Rhino 3D also used SketchUp Pro. SketchUp Pro was preferred with the
project managers because of its ease of use, while production staff, and younger hires tended to
be more favorable with Rhino. Both programs seem to be able to transfer models between the
two programs efficiently. 3Ds max was not preferred as much because of perceived high
learning curve (Keating & Sumerlin, 2016). A hundred percent of firms used Adobe Photoshop
for adding entourage and adjusting overall lighting and saturation of colors in the final post
processing process (Keating & Sumerlin, 2016).
Figure 2.6 Software Preferences at Award winning Firms. (Source: Keating & Sumerlin, 2016)

52
Although the type and size of firm play a role in the decision of what software to use,
the success of projects in the private and public realm, should be of value to understanding an
efficient workflow for the production of high-end graphics for competitions and requests for
proposals. Mastering advanced parametric tools should be very helpful towards landing jobs
and winning competitions. The most interesting discussions within the survey results were
opinions about the direction that software trends should go from here, and who steers that
decision, is it client expectation, competing firms, personal interests, or production staff
(Keating & Sumerlin, 2016; Green, 2017).
Professional firms are hiring program managers, sometimes even as entry-level
production staff, to outreach with new methodologies to create revenue streams within their
firms (Bentley, et al. 2016; Keating & Sumerlin, 2016). To the extent these technologies are
reaching the workplace and making business infrastructure change, how they are being
facilitated, and how they are adapted as innovations are some of the focus areas of the present
research (Keating & Sumerlin, 2016) in this study of PD in Texas.
2.7 The Future of Parametric Design in Landscape Architecture
Many new prospects are turning up in the field of landscape architecture. The future
holds much innovation in parametric design technology. The use of the cloud storage should
change the way how and where people work collaboratively. Augmented reality will be the
new way to show clientele design iterations, in a simulated environment. Sensor technology,
already well adapted in lighting design, will be embedded into new things such as trash can

53
receptacles, making the management of parks more efficient. Microclimate sensory and
climate amenities will change how we think and feel in new spaces. Lastly, parametric design
will be the way in which the customization of landscape features are analyzed, designed,
presented and built, thus changing the way that park designs are communicated to stakeholders,
as well as creating more meaningful relationships into a design concerning sustainability, place
making, biology, hydrology, and geology (Cantrell, et al. 2016; Lally, 2014; Margolis
& Robinson, 2007).
2.7.1 Design Competitions
Literature review suggests that design competitions are great way for interns,
students, and design firms to stretch their minds and build collective creativity and design
methodologies within design firms. Over the past few decades competitions shown to be
proven ways to insert innovative ideas and tools to design and planning fields. As it is covered
in the review of Keating & Sumerlin in section 2.7.1 that various advanced parametric design
software is already within the tool box of landscape architects in conventional design practices.
The Fletcher Studio from the Bay Area in California is a design-winning firm that has
fully embraced advanced parametric design. In their winning design for Horse Shoe Cove
Park, the Fletcher Studio used the visual parametric tools of Grasshopper inside Rhino 3D to
model different scenarios (Figure 2.7.1) (Fletcher, 2017). As the team tested design ideas, they
found that a slight change in slope in one area would influence ADA compliance in another
area. The team credits the scripted software as a time saver and found that it also helped them

54
find solutions that they would not have thought about otherwise through the process of design
iteration (Bentley, et al. 2016).
Literature review also shows that there are various other design competitions which
push the limits of design professionals to not only offer creative product but also introduce
innovative tools and process to design process. These competitions encourage designers to
think outside of the box and apply lessons learned to innovation to designed works in the future
(Margolis & Robinson, 2007).
Figure 2.7.1 Horse Shoe Cove Design Competition, San Francisco, CA (Source: Fletcher Design Studio, 2017)
2.7.2 Responsive Technologies
Responsive technologies is an emerging field that attempts to bridge environmental
phenomenon and technology as a means to sense, process, visualize designs, and maintain

55
landscape environments. It is an interaction between environmental phenomenon and designed
space. It has been in the experimental stage for the past two decades. This new work has come
up in the form of installations, and landscape architectural features that use cross collaboration
and new technologies (Cantrell, et al. 2016). It builds on a history with engineering best
management practices (BMP) and sustainable design in landscape architecture.
Bradley Cantrell is a professor and researcher at Harvard University Graduate School,
where he has been pioneering simulation studies on river deltas at the design lab. The lab uses
a Microsoft Connect simulation tool to mimic waterways and use these methodologies towards
designing new fluvial morphological systems. The lab finds moments in time where change
starts to occur and watch its effect on the system as a whole (Figure 2.7.2). According to
Cantrell this technology will be able to be used to mediate erosion control in watersheds. He
believes that management teams of the future will consist of autonomous robotics working to
maintain ecology and landscape architecture similar to the way a 3D printer makes a prototype
(Bentley, et al. 2016; Cantrell & Holzman, 2016).
Figure 2.7.2 Fluvial Morphology Test, (Source: Harvard Graduate School of Design, 2017)

56
New technologies like low tech sensors and actuators like what you may find in a
remote-controlled cars, are allowing low-cost technologies to iterate new design strategies in
efficient amounts of time. New software and visualization tools, along with robotic kits are
allowing designers to employ innovative solutions to urban and regional problems (Cantrell, et
al. 2016).
Since matter can become programmable through the control of parametric devices,
Cantrell and fellow researcher, Justine Holzman at the University of Tennessee, Knoxville
predict there will be an inter-connection of biology and intelligent machines systems that will
begin to coexist through connected technologies. Their goal is not to input computational
programming within the landscape, but to set up a loop in which one could design and maintain
environments in a more advanced way (Cantrell & Holzman, 2016).
The advancement of parametric toolsets such as the combination of three-dimensional
drafting in Rhino 3D, along with the visual coding language found in Grasshopper, as well as
computational modeling systems like City Engine, and data sources such as GIS; will change
how design and physical resource management will be handled in the future of landscape
architecture and related fields (Bentley, et al. 2016). This was also the time during which
companies such as Intel developed information-processing technology. Hardware development
innovation at Intel started in the late 60’s and gradually moved away from the giant room sized
computers of the 70’s towards what we now know as the personal computer in the early 1980’s.
IBM collaborated in the development of several innovations to help with the speed and
efficiency of the computer hardware (Intel, 2017).

57
Sensing, processing, visualizing, and feedback using parametric tools and analysis are
not new to the process of landscape architecture design, but using these tools in this way is new
to the methodologies of landscape and ecology design and restoration of natural spaces.
Cantrell believes that academic studies utilizing simulation and responsive technologies will
likely lead to computer science and robotic breakthroughs (Bentley, et al. 2016).
Cantrell and Holtzman suggest a conceptual shift from the object-oriented
understanding of technology to a holistic based hybridization of a landscape may become more
prevalent in the future. Rather than having one model, a designer can have several iterations to
encompass climate change, hydrology, geology, flora, fauna, and more. The models can run
simultaneously to test out several design strategies at once to figure out the best strategy in a
design (Cantrell & Holzman, 2016).
The advancement of responsive technologies has increased the scope of designer’s
tools, logics, and methodologies, to not only the design of protocols, but also the processes
within programming logic. Cantrell states this is a good fit for landscape architecture as the
basis of the profession is inherently responsive to the acknowledgment of regeneration, and
interaction of the natural, biological, social and political worlds of landscapes (Cantrell, et al.
2016).
The landscape is a dynamic and changing environment. Responsive technologies have
allowed designers to look at new ways to understand and experience the social, and natural
singularities in the landscape. Landscape architects James Corner and Stan Allen collaborated
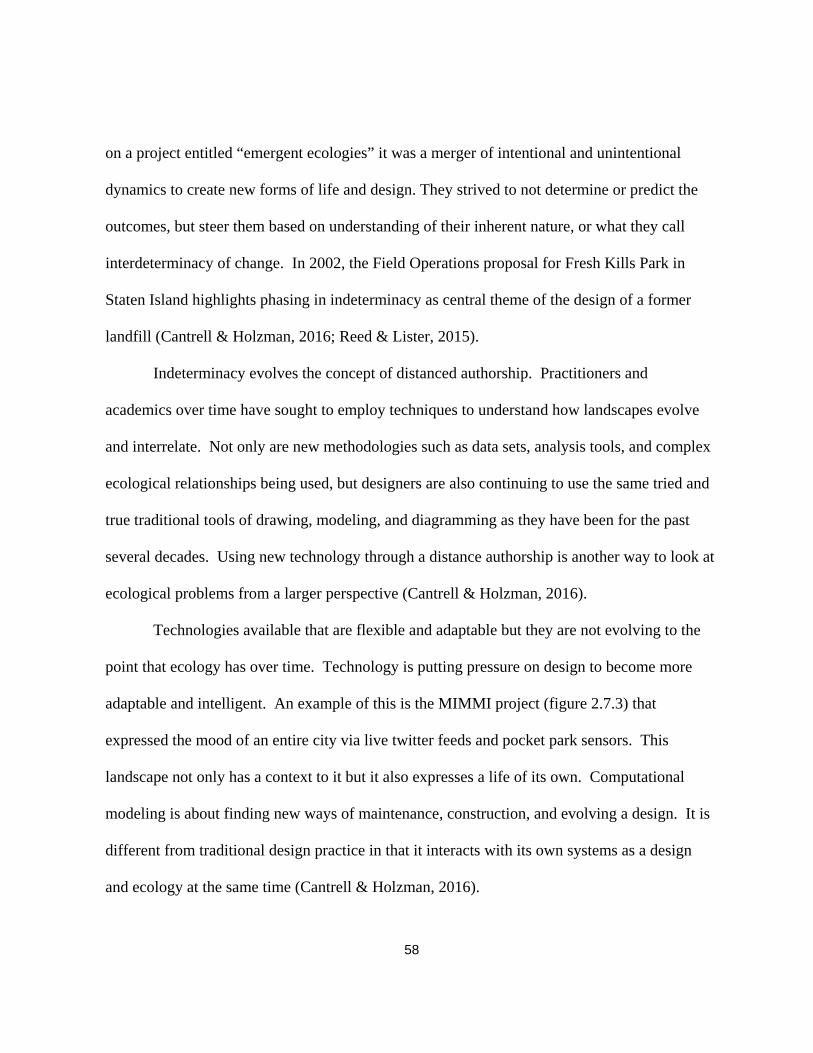
58
on a project entitled “emergent ecologies” it was a merger of intentional and unintentional
dynamics to create new forms of life and design. They strived to not determine or predict the
outcomes, but steer them based on understanding of their inherent nature, or what they call
interdeterminacy of change. In 2002, the Field Operations proposal for Fresh Kills Park in
Staten Island highlights phasing in indeterminacy as central theme of the design of a former
landfill (Cantrell & Holzman, 2016; Reed & Lister, 2015).
Indeterminacy evolves the concept of distanced authorship. Practitioners and
academics over time have sought to employ techniques to understand how landscapes evolve
and interrelate. Not only are new methodologies such as data sets, analysis tools, and complex
ecological relationships being used, but designers are also continuing to use the same tried and
true traditional tools of drawing, modeling, and diagramming as they have been for the past
several decades. Using new technology through a distance authorship is another way to look at
ecological problems from a larger perspective (Cantrell & Holzman, 2016).
Technologies available that are flexible and adaptable but they are not evolving to the
point that ecology has over time. Technology is putting pressure on design to become more
adaptable and intelligent. An example of this is the MIMMI project (figure 2.7.3) that
expressed the mood of an entire city via live twitter feeds and pocket park sensors. This
landscape not only has a context to it but it also expresses a life of its own. Computational
modeling is about finding new ways of maintenance, construction, and evolving a design. It is
different from traditional design practice in that it interacts with its own systems as a design
and ecology at the same time (Cantrell & Holzman, 2016).

59
(Figure 2.7.3) The MIMMI project, Minneapolis, MN (Source: INVIVIA, 2017)
Opportunities for responsive technologies are great but they are still being formed as
possibilities. Many projects are speculative and demonstrate a new methodology of working
beyond conventional definition or perception. The work questions, could it be possible to
design an environment without destroying the ecology of it? Questions have come up as to
how to integrate this into the curriculum, then to get it out into the buildable world. Potential
uses for new design opportunities exist for new social, political, and ecological design
solutions, but they must be prototyped rigorously, fine-tuned, and modified (Cantrell &
Holzman, 2016 ).
Simulations in engineering are used to design complex materials and to understand
material behavior through mathematical models of physical processes. Computational design
incorporates these dynamic advanced physics models and tests them against building resilience,

60
and other dynamic forces. Dynamic models can be tested for an assortment of physical
properties such as light waves, acoustics seismic activity, and even nuclear physics
(Weinstock, 2006), can be tested in Bentleys’ Microstation, and Dassault Systems Solid Works
and CATIA.
Testing the simulation parameters of objects can be modified to observe different
behaviors in the structure. Simulation of sunlight has been incorporated into many software-
modeling packages throughout the world; however, testing for other physics oriented problems
requires adding a plug-in or adjusting the script or coding. Airflow and thermal dynamics
through spaces is also a standard in engineering software (Weinstock, 2006). These are two
directions that could be tested to optimize microclimates in a landscape.
Advanced engineering simulations, have been well developed, and suggest new
directions in which landscape architecture could go. For instance, biomaterials in simulation
are being used to study stress and fluid activity within the behavior of human tissue for
advances in medicine. These simulations are very complex and can be scaled up to study
physical relationships in landscape architectural design with adaptive intelligent environmental
systems (Weinstock, 2006). This could be a research area for firms that are interested in the
conservation side of landscape architecture.
2.7.3 Immersive Technologies
Immersive technology is perhaps the quickest way in which technology is entering our
collective design culture. Virtual Reality (VR), and Augmented Reality (AR) could be solidly
61
into the culture within a few years thanks to advances in digital and cell phone technology.
Virtual Reality has become affordable to the public and at some point may be adapted as a
presentation tool as an interactive way of presenting and designing in real time.
Advancements and availability of gaming platform software such as, Unreal Engine and
Lumion are leading the advancement and availability of virtual and augmented reality design
(Tal, 2017). Both Unreal Engine, and Lumion have a learning curve that can be overcome by
the adapted practice of the tutorial. It is possible to export a Lumion 360 degree model into a
virtual reality environment to be viewed through a virtual reality headset, such as Samsung
Gear VR or Facebook owned Oculus Rift google set among others (Tal, 2017; Barth, 2015).
Founded in Warmond ,Netherlands, in 1998, Lumion is a 3D acceleration software that
takes a CAD drawing and gives the designer the ability to create animations, videos, images,
and panoramic views in a quicker format then what is usually possible for 3D rendered
graphics. The software was launched in December 2010, and has quickly become an industry
standard in the 3D visual acceleration graphics software market in five different countries
(Lumion, 2016).
Unreal Engine is an open source gaming engine software that has incredible graphics.
Is developed for use in creating video games, animations, and movies. It also can create
stunning three-dimensional graphics for potential use in landscape architectural graphics (Epic
Games, 2015).
Technology is developing at such a pace that it is now more of a necessity to have
someone that is technically savvy on staff, knows how hardware works, what programs are out

62
there, and how it can be adapted into the culture of the office to create better efficiency, and
clarity of new design ideas (Green, 2017). It is not uncommon in the culture of contemporary
design offices, to find people who are searching for open source software that could be adapted
into the culture of the firm (Tal, 2017). There seems to be a trend of younger designers that are
having a say in the firms’ work flow earlier then what has been common over previous years.
Not only are virtual-reality headsets becoming more popular, there seems to be
emerging technologies within interactive tablet systems, and the ability to draw three
dimensionally using virtual-reality in a simulated reality environment such as Google Tilt
brush. Other digital simulations such as aerial photography can be performed via laser
surveillance from unmanned drones, or weather balloons, can run the information through
software such as LiDar, UNDET, and open source Autodesk Recap 360, that is available free,
and then run the topography in a 3D model such as SketchUp or other computer aided design
programs (Green, 2017).
2.8 Summary of Literature Review
New technology development is ongoing, and literature review on the professional
trends in parametric design would seem to indicate that is next to impossible to keep up with all
the new trends in technology. The research backs this claim that software develops quicker
than the practitioners can use it, or be trained in new methods to try new and emergent
workflows for particular design firms. It is not that firms are incapable of changing a
workflow; it is more about the overall efficiency of everyone performing at similar levels and

63
skillsets. Educational and institutional issues have remained the top hurdles in the adaptation
of software in the practice of design firms (Gocmen, 2010).
Despite the overwhelming adaption of digital technology into the modern culture, most
people are still unaware of the principles and the innovation of algorithms inside the
computational tools they use (Cantrell, 2016). As a new workforce has grown up with digital
technology, it is becoming more important than ever to be technologically adept. Each new
student entering the field of landscape architecture needs to make choices in the schools they
attend, and the technology they would like to learn before entering the job market.
It is imperative that education has the heartbeat of the workforce and its technology in
mind when designing curriculum. Innovations in computers, and computer technology have
been a constant for over fifty years, it is as important as ever to be able to adapt to newer
technology or workflows if the demand for it is there.
In summary, the literature review outlined the history, past innovations, and
contemporary software tools for designers and planners working in landscape architecture and
related fields. However, the coverage of such innovations in research and practice in landscape
architecture seems to be limited and requires further scientific investigation. One thing that is
clear in the literature review is the use of PD in landscape and related disciplines is expanding.
It is imperative that design firms as well as educational institutions take a stronger note and
understand where they stand in the changing workforce of landscape architecture, and the state
of their parametric design experience moving forward. This research is an attempt to fill some

64
of this gap by understanding adaptation level of these innovations especially among landscape
architectural professionals in Texas.

65
Chapter 3
RESEARCH METHODOLOGY
3.1 Introduction
This research follows qualitative methods to assess the adaptation of parametric design
among landscape architecture professionals. The procedures in this research are informed by
two broader scientific paradigms. The Diffusion of Innovation was the guiding theoretical
framework to structure the interview questions designed to elicit information from interviewing
landscape architectural practitioners (Rogers, 2003). Secondly, qualitative analysis techniques
outlined in Taylor and Bogdan (1998), and Deming & and Swaffield (2011), were used to
decipher patterns within the data gathered from the research population during the in-depth
interviews (Taylor & Bogdan., 1998; Deming &, Swaffield., 2011).
3.2 Research Design
The main research questions for the study were to understand the rate of the adaptation
of parametric design among landscape architecture professionals in Texas. The researcher
adopted the in-depth interview technique to collect the data (Taylor & Bogdan, 1998). The
research questions were designed to answer information categories to Rogers’ Diffusion of
Innovation key elements, and five attributes of Diffusion of Innovation (figure 3.1) (Rogers,
2003). The study of the Diffusion of Innovation was the underlying framework in the
organization of research questions. In particular writing questions then reflecting them back to
the four key elements (figure 3.2), and the five stages of an innovation (figure 3.3) as described
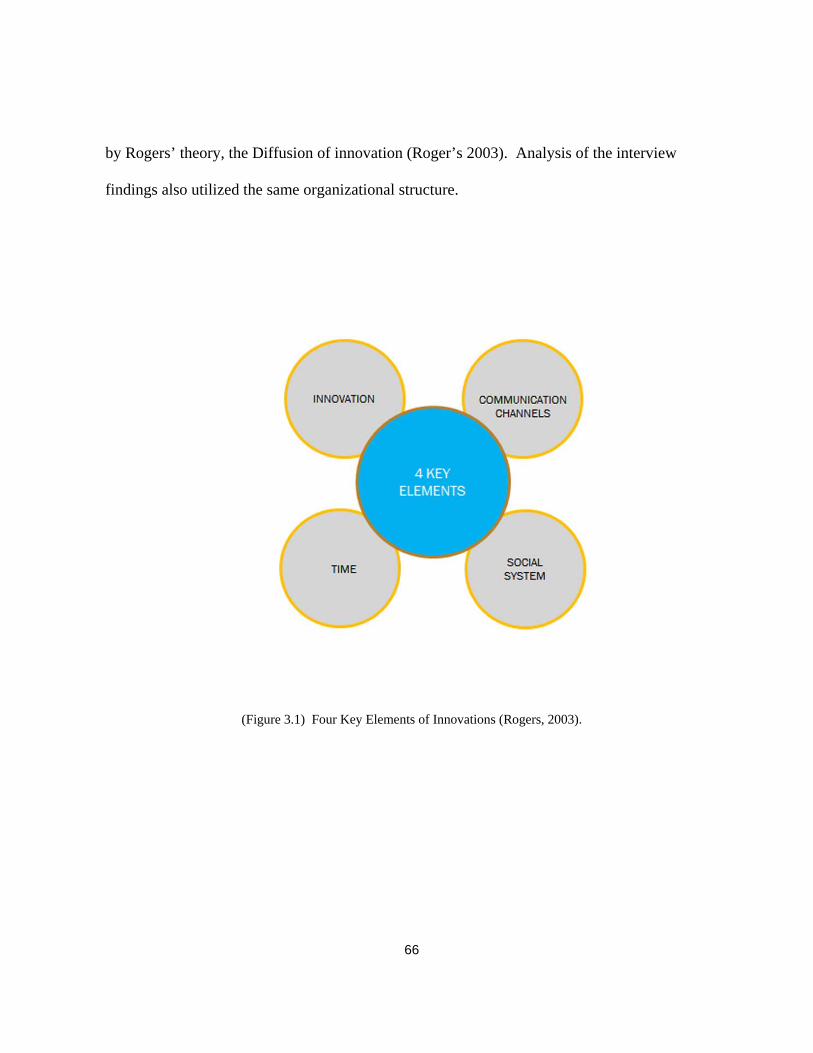
66
by Rogers’ theory, the Diffusion of innovation (Roger’s 2003). Analysis of the interview
findings also utilized the same organizational structure.
(Figure 3.1) Four Key Elements of Innovations (Rogers, 2003).

67
(Figure 3.2) Rogers’ Five Attributes of Innovations (Rogers, 2003)
(Figure 3.3) Five Stages of an Innovation (Source: Bryan Mathers, 2017)

68
3.3 Study Location
After some deliberation, it was determined to study landscape architecture professionals
in the state of Texas. The study location decision was based on keeping the research focused
on a subset of professionals operating within the same professional environment under
somewhat similar set of professional circumstances. Moreover, the research involved in-depth
interviews with professionals, which required extended amount of time for review of the issues
and concepts in person, via e-mail or over the phone rather than a survey method. In addition,
it was decided that spreading the research to a larger area then North Central Texas would
provide a more comprehensive investigation towards understanding the complexities and
similarities in this research study.
3.4 Study Population
In order to understand the level of adaptation in parametric design, landscape
architecture professionals in Texas were selected as the study population in this research. The
study population of Texas landscape architectural practitioners was identified using the
snowball technique (Taylor & Bogdan, 1998) through a publically available website of
registered landscape architecture firms at the Texas Board of Architectural Examiners (TBAE)
in February 2017 (tbae.org, 2017), the researcher compiled an excel spreadsheet list of the 163
registered Landscape Architectural design firms available from the TBAE website. Each firm
received a cover letter with a research study synopsis for distribution. This was part of a
package of documents received the University of Texas at Arlington’s Internal Review Board

69
(IRB) approval on January 30, 2017 (see Appendices A2 and A3). These two documents were
emailed individually to each firm’s designated contact person during the first week of February
2017.
Scheduling of interviews began as the list was distributed, and remained open until the
interviews were transcribed and the coding of information began. The bulk of the interviews
happened in the month of February. Sixteen subjects were interviewed, with five of the
interviews conducted in person, five conducted over the phone, and six subjects responded via
answering the interview questions through an email interview.
3.5 Data Collection Methods
3.5.1 Interview Procedures
After review of various research methods, the in-depth interview technique is adopted
to collect data regarding the adaptation of parametric design among landscape architecture
professionals in Texas. This method is embraced as opposed to survey in order inquire deeper
understanding of the innovation and diffusion of parametric design among landscape architects.
These methods give the researcher to opportunity to ask follow up questions in addition to
primary questions to understand professionals understanding of the phenomena studied by the
researcher.
The interviewees meet the researcher in person, on the telephone, or filled the interview
out and returned it through email. In person interviews, either on phone or in person were
digitally recorded with a recording device. Interviewees were asked five profile questions, ten

70
main interview questions, if there was additional time two or more questions were asked from
the secondary question list. The online interviewees were given the same set of questions and
directed to answer the first ten questions, and encouraged to answer the secondary questions if
they wished to answer them.
Transcripts of those interviews, were analyzed using qualitative methods adapted from
Taylor and Bogdan (1998). The research specifically studied why and when the landscape
architecture professionals made the choice to innovate their workflow within their firms or
individual practice.
The researcher collected data through email transmission of a Microsoft Word
document, and digital recording of in-person and phone interviews using a Phillips Voice
Tracer recording device. These interviews were transcribed by the researcher, then
qualitatively analyzed to draw conclusions based on Rogers’ Diffusion of Innovation theory.
3.5.2 Research Questions
1. To what extent is parametric design adapted into the field of landscape
architecture in Texas?
2. What computer software tools are adapted for use in parametric design in
Texas?
3. Are there similarities or differences in the level of adaptation of parametric
design between education and practice? If so, what are they?
71
4. What is the most important factor of adapting to innovation in PD for landscape
architect practices in Texas?
3.5.2.1 Landscape Professional Profile Questions
Landscape architect professional profile questions
1. What is your role/job title in the firm you are currently working?
2. How long have you been a landscape architecture professional?
3. How many landscape architecture professionals are on staff in your
organization?
4. Which school did you get your LA degree from?
5. Do you have other architecture, design, or planning degrees?
5.1 If so, what are they?
3.5.2.2 Landscape Professional Interview Questions
Primary landscape architecture professionals interview questions
1. Are new technologies being adapted into the culture and knowledge base of the
firm that you represent?
1.1 If so to what capacity?
2. To what extent is your knowledge or experience utilizing parametric design?
3. What part of the design process, do you or other staff members in your firm use
parametric design?
4. What software do you or other staff members currently use for parametric
design?

72
5. To what extent do you or any other staff members design or prototype 3D
objects for the use in landscape?
6. Do you or any other staff members have the potential or knowledge to
manipulate the coding or scripting of software to achieve different results in a
parametric design?
7. Do you perceive an advantage to adapting to the latest software programs using
parametric design or analysis?
8. Have you been introduced to Parametric Design in your education?
8.1 How much of this knowledge is being adapted into your experience of
the practice?
9. In your view, what level of parametric design is adapted in your firm?
9.1 In Texas?
9.2 Among LA professionals nationwide?
10. Is there anything else you want to add on the topic before we end the interview?
Secondary landscape architecture professional interview questions
1. What percentage of your yearly billable hours goes towards designing with
parametric tools?
2. Do you foresee a technology shift within your firm within the next two years?
2.1 In five years?
2.2 If so how?
3. Do you, or any staff members in your firm, had an interest in trying to develop
computational software to run customized simulations or use computational
design in the maintenance, or design function of a landscape environment?
4. Are your workflows compatible with collaborators outside the firm?
5. Is educating staff on new software a barrier to implementing a new workflow
within the firm?

73
3.6 Data Analysis Methods
3.6.1 Introduction of Research Theory in Study
The questions in the interviews were structured to find observable data upon a
qualitative analysis of the results from the interviewees. The structure of the research was
premised on the diffusion of innovation developed by Everett M. Rogers in the late 1950s’ and
published in 1962 (Rogers, 2003). There are several subsets of Rogers’ theory, but the ones
that remained consistent throughout this research are the key elements defining the process in
which an innovation becomes adapted to within a social group.
Qualitative analysis of the interview data post interview was fashioned after the
technique of ethnographic interviews and observations from the research of Steven J. Taylor
and Robert Bogdan (1998). Other themes for analysis were drawn from Deming &,
Swaffields’(2011) research in Landscape Architecture Research. The data was analyzed into
categories and themes were drawn out from the research of diffusion of innovations to
determine statistics to answer the questions in the interviews in Chapter Four. In Chapter five
the Data will be summarized into Rogers’ five attribute categories (Rogers, 2003) it will then
be analyzed against the four main elements of PD.
3.6.2 Rogers’ Key Elements in Diffusion Research
Rogers’ theory states that individuals or social groups adapt to Innovation in a
consistent process. The decision to adapt to an innovation can be measured by studying four

74
key elements such as the Innovation, Communication Channels, Time, and the Social System.
These elements are described in greater detail are as follows.
a.) Innovation: An idea, process, or way of working that is either new to a social
group or individual for the presumed purpose of improving living or working
conditions.
b.) Communication Channels: The process of exchanging knowledge or awareness
from one person, or social group to the next. This typically happens over larger
social channels, mass media, or through interpersonal channels.
c.) Time: It takes for a person, or a social group to adapt or reject an innovation.
This can take anywhere from a few months to several years.
d.) Social System: A group that shares a common interest in a practice or use of an
innovation. The system’s state of effectiveness can be studied through the
acknowledgment of change agents, early adapters, and the percentage of late
adapters within a social system (Rogers’, 2003).
3.6.3 Rogers’ Five Factors of Innovation
Rogers (2003), describes "the adaptability" of an innovation is based on several
attributes. These attributes are effective in determining the speed with which an innovation is
adapted by an individual or social system. The rate of adaption at the personal level happens
much quicker than at an organization level, when more people are involved, the more
complicated adapting to an innovation becomes. Furthermore, technology-based innovation

75
does not always happen quickly. Sometimes, innovation happens in a matter of a few months
to a few years, and others may take decades to reach full diffusion into a social group. The five
attributes of innovation are Relative advantage, Compatibility, Complexity, Trial ability, and
Observability (Rogers, 2003).
3.6.3.1 Relative Aadvantage
Rogers' characteristic of relative advantage relates, "How the innovation has
improved over the previous generation of objects or processes (p.15)”. This
characteristic explains how an innovation relates to an older and previously used
innovation or process (Rogers, 2003). An example of this would be innovation in
computer-aided 3D design. Less adapted software in landscape architecture, like Rhino
and 3DsMax, challenge the older generation of software like AutoCAD.
3.6.3.2 Compatibility
Rogers' attribute of compatibility is, "The degree to which an innovation is
perceived as consistent with the existing values, past experiences, and needs of potential
adapters (p.16)”. This attribute describes how designers perceive a new concept or
method of parametric design, and whether or not the innovation is adapted by future
users within that social system (Rogers, 2003).
76
3.6.3.3 Complexity
Rogers' attribute of complexity deals with the difficulty of adapting to an
innovation. “Rogers notes that the higher the level of complexity, then the slower the
rate of adaption (p.16).” This concept was used by the researcher to look at which
designers are adapting to the innovation of parametric design quicker than others are.
Some innovation are adapted quickly into a social system while others that are more
complicated take longer to integrate. Being able to compare the ease of complexity of
the innovation compared to earlier innovations, is also key to its adaption
(Rogers, 2003).
3.6.3.4 Trialability
Rogers' attribute of trialability refers to the ability to test or trial an innovation
(p.16). This attribute relates to the innovation of PD to be able to create opportunities
for the innovation to be tested. Availability of an innovation as an experiment is
necessary to achieve higher rates of adaption (Rogers, 2003).
3.6.3.5 Observability
Rogers' attribute of observability measures the extent to which an innovation can
be experienced and reflected upon. The idea of experimentation with the innovation
must occur to yield a higher adaption rate. The idea of being able to be experienced and
observed is also crucial for the adaptation of an innovation (Rogers, 2003).

77
3.7 Significance and Limitations
This study furthers understanding the importance and limitations of developing an
innovation, such as the educational, technical, and the cultural factors of the modern-day
landscape architecture professional design office. The methods used to study this subject have
been used in hundreds of studies (Rogers, 2003) worldwide and represent a well-vetted process
into understanding a wealth of psychological behavior and adaptation to innovation.
It is limited in the sense that the information can only be drawn from the subjects that
responded. Even though the study attempted to study a broad range of professional designers
in landscape architecture, it may have been a wide belief that PD is an architectural design
methodology. It may have also been presumed that the researcher was primarily interested in
parametric design first, and adaptation of those innovations overall secondly. This belief,
although not tested, could have influenced potential subjects into not participating.
Although, the study population is Texas professionals, the sample size is relatively
small on the individual firm side to make generalizations beyond the sample size. Given that
various subjects used different methods to respond to interview (in-person, phone, or e-mail)
there might be limitations in their responses based on the techniques used to interview.

78
3.8 Chapter Summary
As it is highlighted in the beginning of the chapter this research follows qualitative
methods to assess the adaptation of parametric design among landscape architect professionals.
The procedures in Chapter Three and Four are informed by two research methodologies. First,
the Diffusion of Innovation was used as a guiding framework to structure the questions for
interviewing landscape architectural practitioners (Roger’s, 2003). Secondly, qualitative
analysis techniques outlined in Taylor and Bogdan were used to decipher patterns within the
qualitative data gathered from the research population (Taylor & Bogdan, 1998, Deming &,
Swaffield, 2011).
After covering research design, this chapter defined in more detail the key elements and
attributes identified by Rogers and tested in numerous research studies. These elements and
attributes form the outline for the analysis of the research population in Chapter Four Data
Findings and Analysis, as well as the Conclusions in Chapter Five.

79
Chapter 4
DATA FINDINGS AND ANALYSIS
4.1 Summary of Findings
The findings in this research study resulted from qualitative analysis of data gained
through in-depth person-to-person interviews. The purpose of the interviews was to assess the
level of parametric design competency and usage among landscape architecture profession in
the State of Texas. The interviewees were asked the same set of questions in person-to-person
interviews, on the phone, as well as in emailed interviews. The answers were grouped to find
percentages in responses, as well as recurring themes related to the diffusion of computer
technology into the culture and practice of landscape architecture in Texas.
The diffusion of innovations of parametric design software and processes was explained
through the lens of Rogers’ Diffusion of Innovation Theory. The two segments of Rogers’
theory, the four elements in the Diffusion of Innovation, and the five attributes of Innovation
were the main devices utilized to summarize the data into conclusions that respond to the main
research questions of this study.
The interviews were digitally recorded in-person, on the phone, or as a collected word
document through email. A bulk of the interviews were recorded in February 2017, and in
March. The interviews were dictated while listening to the recorded playback by the
researcher.

80
4.1.1 Demographics of Landscape Professional Study Group
The subjects in this study were selected from a public website of Texas landscape
architects. Contacts of 163 professional design firms in Texas were contacted via email. The
snowball technique, reaching subjects through personal contacts, was utilized to build a study
population of landscape architecture professionals experienced in working or managing with or
without parametric design (Taylor & Bogdan, 1998). In all 16 subjects were interviewed, 10
in-person or on the phone, and 6 via online interviews through email. Observable patterns were
noticed from mid interview process forward. Because of this, it was determined that an
effective study group had been meet.
The in-person interviews were done either in an office setting, or over the phone. Both
methods used a digital recording device to capture the interview for later dictation. At first the
interviewees are asked about their role and job title in current firms, then they were asked
questions about their, or the firm they represented experience with parametric design. The last
two questions were about education results of studying the demographics of the firm profile
questions are in Figures 4.1 and 4.2 as follows.
Profile Question #1
What is your role or job title within the firm you are currently working?
75% of respondents interviewed were upper management with 10 years or more
experience, 19% were new hires of zero to 5 years, and 6% were senior staff of 5-10 years.

81
(Figure 4.1). This also corresponded with the results in question number two about the
experience in years
Profile Question #2
How long have you been a landscape architecture professional?
75% respondents being of 10 years or more experience (Figure 4.1). Within those of
upper management, six respondents had 30 years or more experience, three subjects had 20
years or more experience, and three of them were in the category of 10 years’ experience or
more.
Three subjects reported having 2 to 4 years’ experience, these respondents were not
registered landscape architects. One subject represented six percent of the respondents as the
sole subject, within senior staff in the 5-10 year range, as their position had changed to project
management.
Profile Question #3
How many landscape architecture professionals are on staff in your organization?
50% of firms were 12 professionals or more (Figure 4.1), 31% represented medium-
size firms of 6 to 12 people, and 19% of firms in this study were six people or less. These
categories were based on representing the averages the data from the subjects interviewed and
not some outside measure

82
Figure 4.1 Profile Questions #1-3, Experience

83
Profile Question #4
Which school did you get your LA degree from?
56% of the subjects received their master’s or bachelors of landscape architect degree,
or equivalent from a Texas University (Figure: 4.2). Additionally, 44% of them received their
degree out-of-state. Of the 56% of the subjects that did get there degrees in Texas, 44 % went
to Texas Tech. Texas A&M and UT Arlington held 22% of the degrees each, with UT Austin
having 11% (Figure 4.2.1).
Profile Question #5
Do you have other architecture design or planning degrees, if so what are they?
Forty-four percent of all the subjects, reported having other degrees related to
architecture, design, or planning while 56% of them did not have other degrees, or their extra
degrees were not related to the design fields directly (Figure 4.2). Of those respondents with
non-secondary degrees in related fields, two had advanced degrees, one in Psychology, and the
other in Biochemistry. Two other respondents had additional training, one in irrigation, the
other in LEED AP. Of the seven subjects that had double degrees within related fields,
respondents #2, #8, and #13 could be identified as advanced parametric users as identified by
software practices in professional questions #2 and #4, which asked about the respondents

84
experience utilizing parametric design, and what programs they or their staff use for parametric
design.
According to the data, the new hires directly out of school with five years of experience
or less had a more comprehensive skill set related to advanced parametric tools. However,
there was one exception of subject # 10, with 14 years’ experience in landscape architecture,
who claimed to have an advanced parametric skill set. This subject did not have a double
degree in a related field, but was largely self-taught in three-dimensional design through a
transition into product design in two economic turndowns, one of which was the recession in
2009.

85
Figure 4.2 Profile Education Questions
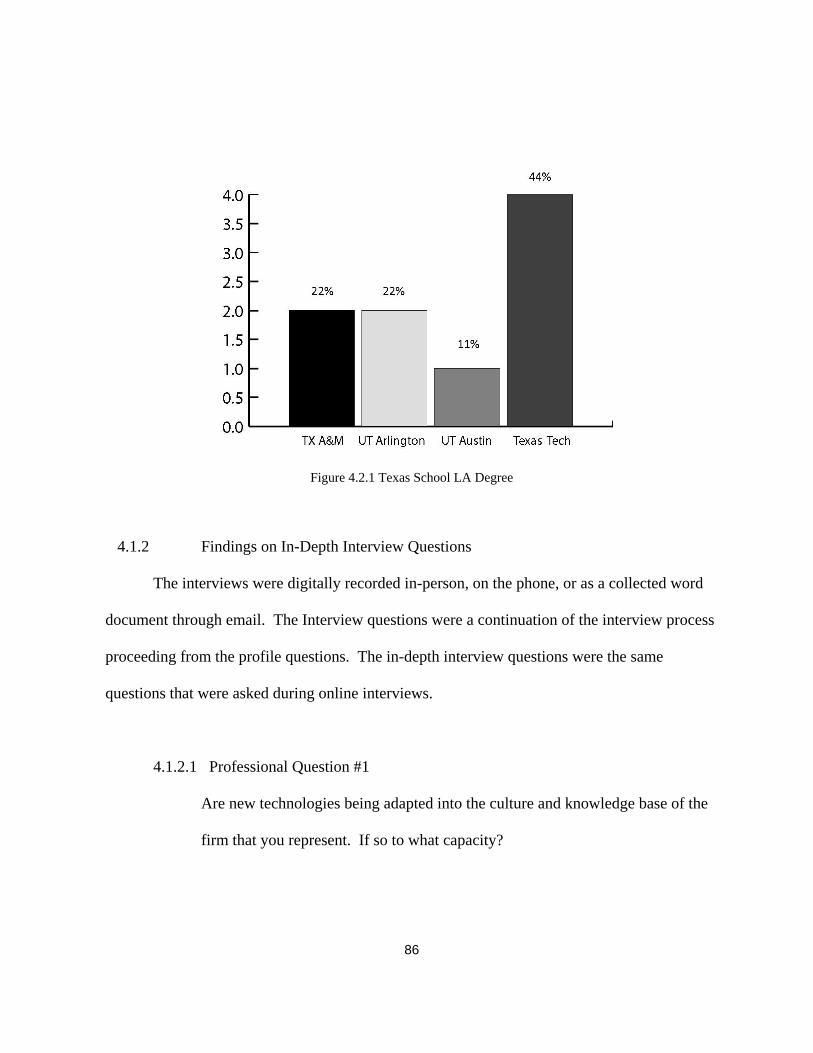
86
Figure 4.2.1 Texas School LA Degree
4.1.2 Findings on In-Depth Interview Questions
The interviews were digitally recorded in-person, on the phone, or as a collected word
document through email. The Interview questions were a continuation of the interview process
proceeding from the profile questions. The in-depth interview questions were the same
questions that were asked during online interviews.
4.1.2.1 Professional Question #1
Are new technologies being adapted into the culture and knowledge base of the
firm that you represent. If so to what capacity?
87
Seventy five percent of the respondents believed that new technologies were being
adapted into the culture and knowledge base of their firms (Figure 4.3). However, the
responses of what they labelled as new technology differed between something as simple as
software updates, to experimenting with new technology such as digital graphic software,
digital prototyping, or advanced 3D modeling software.
Most of the respondents indicated they would either, use 3D software more in the
future, or integrate into a BIM system-modeling platform. The responses from this question
were cross-referenced with professional question #4 regarding the use of software (Figure 4.5).
Two respondents stated that they were not only adapting to new tools, but they were learning to
use their current software better to improve workflow within the firm. Subject #3 just started a
private sole proprietorship practice after 20 years working in a medium sized firm, and was
trying Autodesk Infraworks 360 for use in developing quicker analysis and design phase for
residential and commercial land development. Subject #5 stated, “ We accept new programs,
but only to the degree at which they can provide our firm with the ability to produce a better
product, it is only then that we will integrate the program firm wide.”
4.1.2.2 Professional Question #2
To what extent is your knowledge or experience utilizing parametric design?
Of all the respondents, 75% identified as having entry level experience with advanced
parametric tools (Figure 4.4) The use of AutoCAD, Photoshop and basic SketchUp are

88
Innovation that Rogers’ theory would classify as full, or nearly fully diffused into the culture of
landscape architecture design (Rogers, 2003) according to this particular interview pool. Other
parametric tools that have been around nearly the same time, have not been fully integrated into
the culture of this discipline of design. Advanced tools such as 3Ds Max, Rhino, Lumion, and
Revit, are becoming more popular and in demand as time passes on. This trend is to some
extent is market-based especially in regards to Lumion and Revit, where the clients are
expecting to see metrics and concepts that are realistic earlier on in the decision-making
process. Several subjects reported increasing requests for BIM capability in the past two years.
Growing majority of architects are now using BIM, this technology shift streamlines the
design to the construction document phase, however, this benefit does not necessarily align
with the experience of landscape architects, who speak of a dissatisfaction of using BIM-based
systems. These systems do not recognize design parameters from the landscape architecture
perspective, or parametric generative form for that matter.
Nineteen percent of the research group had developed advanced parametric skills.
These are skills in computer graphics and 3D modeling which have not become fully integrated
into either a design school training or implementation in the professional world. These subjects
would be classified in Rogers’ theory as change agents or early adapters. Of these four
respondents, three of them were new hires with four years’ experience or less. However, one
individual had over 14 years’ of experience in the field of landscape architecture and was
largely self-taught in processes of 3D design.

89
The one subject that was identified as an intermediate parametric design practitioner
reported that he was moving up the chain of management within the firm as a project manager.
The subject self-reported a high level of skill in Civil 3D, AutoCAD, 3Ds Max, and some
Rhino. They believed their software skills were diminishing because of a new program
management role within the firm.
This result was also consistent with the beginner level of advanced parametric tools.
The subjects in upper management had various experience levels ranging from 12 years to 41
years’ of experience. A majority of these subjects were around for the early development of
AutoCAD and had to learn this new technology either on the job, university extension classes,
or at a community college or trade school. As the firms they work for develop their businesses,
a marked majority of them also moved to upper management positions where the use of
technology on a day-to-day basis was not as rigorous as it was before. The subjects also were
more likely to comment that their experience in the marketplace was not demanding them to
develop new technology skillsets.
4.1.2.3 Professional Question #3
What part of the design process do you or other staff members in your firm use
parametric design?
Since the design process is relatively consistent set of steps, from inventory to site
analysis, concepts, schematics, to final documents across different levels of experience, it is
90
relatively easy to assess in general terms where the subjects were using parametric design.
However, there is some subjectivity as to how often the subjects used PD as they reported in
the interviews. With that being said, it is important to note that 57% of the respondents reported
using parametric design in the conceptual stage (Figure 4.4). Each subjects’ responses were
qualitatively analyzed based on what they said in the interviews.

91
Figure 4.3 Professional Questions #1, New Technologies

92
Figure 4.4 Professional Questions #2, Individual Experience
A common theme was using SketchUp to conceptualize things faster, or other 3D
modeling to understand if a complex idea would work well enough to develop it further.
Another theme was that each project might require a different means in which to conceptualize
an idea. Subject #8 stated that the firm he works for has started to use 3D design in SketchUp
earlier in the design process. “Parametric design was typically utilized in the final phase if at
all. A few years ago it was more about hand drawing, but now 3D is used earlier and also
becomes a new source of billable hours for the firm.” Subject #2 also stated they also used PD

93
earlier in the design phase. They also used SketchUp and Rhino, but this is done in the earlier
stages as a means of determining whether an idea was buildable.
Figure 4.5 Professional Questions #3, What Stage is PD Used
4.1.2.4 Professional Question #4
What software do you or other staff members currently use for parametric design?
The practice of using Photoshop and AutoCAD has reached what Rogers’ Theory
(2003) would describe as Critical Mass. This is a point at which any additional Innovation that
occurs is part of a self-sustaining system. The respondents in this study all reported using both
AutoCAD and Photoshop in their design practices (Figure 4.6). Also interesting to note, was
that SketchUp is integrating relatively quickly into the culture and practice of landscape

94
architecture and related design firms. Revit even though it is stated as the fourth most common
software, is a misnomer as most practitioners discussed within the interview that they had
found a workaround to the incompatibility issues that come with using building information
modeling in particular with Revit. The workaround was accomplished using Civil 3D CAD, or
some form of a format change or written code to accomplish opening, working on, and saving
the file.
Lumion, GIS, and 3Ds Max all shared the same statistic with about 25% of the
interviewees reporting that they had used it or were using it in their design practice.
4.1.2.5 Professional Question #5
To what extent do you or any other staff members design or prototype 3D objects for
the use in the landscape?
Responses to this question were touched on the previous question. Many firms are
reporting that they were beginning to use parametric design to study 3D models (Figure 4.7).
Two firms reported dabbling in three-dimensional prototypes for signage and furniture. One of
those two firms had a 3D printer in an affiliated office in Texas, the other one tried out a
manufacturer that could run computer models through a CNC router (Figure 4-7). Respondent
#5 stated that their firm 3D prints objects such as boulders and other natural materials for use in
model making, as they are time consuming and expensive to move. Firm #10 stated they were
thinking of buying a 3D printer very soon. Only three of the 16 respondents were working in

95
three-dimensional prototypes and it was primarily in an experimental phase. These firms were
consistent with the other more advanced parametric users as stated in question number two.
Figure 4.6 Professional Questions #4, What Software is Used

96
Responses to designing in three-dimensional space, however, were the opposite. Of the
16 subjects, 75% reported designing in digital three-dimensional space. Several firms had
within the structure of their organization architects on staff that would typically do any sort of
three-dimensional design in any number of programs, this may have swayed the reporting of
three-dimensional design in landscape architecture. Respondent #1 stated, in regards to
customization of furniture in architectural details that their firm tried to put their own personal
touch on everything they do. Respondents with more years of experience tended to still favor
hand drawing in the conceptual phase before using computers. Other more engineering-based
firms might use three-dimensional analysis for cut and fill, or designing for underground
piping.
4.1.2.6 Professional Question #6
Do you or any of your other staff members have the potential, or the
knowledge to manipulate the coding or scripting of software to achieve different results
in parametric design?
56% of the respondents stated that they do not have the ability to use code or script
(Figure 4.8). However, 38% stated that they knew someone on staff, or they have access to
people who can help them customize software to streamline workflows in either the software
command level, or developing firm wide standardized workflows.

97
Figure 4.7 Professional Questions #5, Design or Prototype
The respondents in a third of those 38% firms reported scripting within Rhino and
Grasshopper, this is what is known as visual scripting. Subject #15 mentioned being able to
code within AutoCAD using AutoLisp language, and knew how to run novice level ruby
scripting in SketchUp. Subject #5 reported having someone within another branch of the same
firm that was able to do coding across the entire firm’s business structure.

98
Figure 4.8 Professional Questions #6, Scripting or Coding
4.1.2.7 Professional Question #7
Do you perceive an advantage to adapting to the latest programs using
parametric design or analysis?
Responses to this question were unanimously positive (Figure 4.9). There was some
trepidation expressed as to whether or not software updates, or learning a new software
program, would lead to more efficiency within an organization. Subject #1 stated, “Some
people embrace change and want to see the new updates, while others fight it like the plague.”
He went on to state,” it is not that people could not learn to adapt to new programs, because
they are perfectly capable, they just resist it.”

99
Even though 87% of the subjects agreed there are advantages to adapting to the latest
software programs, there were three main concerns expressed by respondents. The first
concern was that new updates that were overly complicated influence the workflow. The
second concern was with the workflow itself. Does the update or the innovation improve the
efficiency within the organization? In other words, can the innovation improve efficiency
within a reasonable amount of time? A third concern was whether an innovation or software
update would influence the intuition of the design process.
Subject #5 responded. “I believe that there is an advantage to adapting technology to
the way we work. I do not like assuming that technology fully replaces our “design intuition.”
I think we still need both. No program can replace project experience, and likewise, no amount
of longevity in this profession should prohibit us from trying something that can improve our
analysis, design, and construct-ability. I do not think that parametric design is a replacement for
imagination or imaginative connective conceptualization.”
Figure 4.9 Professional Question #7, Advantage in PD

100
4.1.2.8 Professional Question #8
Question#8 Have you been introduced to parametric design in your education?
Nearly 75% of the subjects reported being upper management with 10 years or more
experience and within that group 75% the majority have 20 years or more experience in the
field of landscape architecture (Figure 4.10). These subjects have seen tremendous
technological change over the course of their careers in technology. Many of them did not
have a formal class in AutoCAD, and if they did, it was often in another discipline such as
mechanical drafting or engineering. To some extent, this type of educational sharing within
disciplines at the academic level still happens. The educational choices in the 1980s and 90s
for any number of parametric tools listed in this study were largely inaccessible. Training
through tutorials on the internet did not take off until nearly a decade later.
Figure 4.10 Professional Question #8, Introduction to PD in Education

101
With that being said, 63% of the subjects within the study stated that they were not
introduced to parametric design in their education. Their adaptation over the course of their
careers was more oriented towards learning AutoCAD and Photoshop. These landscape
architecture practitioners believe that drawing out ideas is one of the better ways of thinking
through the process of design. Because of their level of adaptation to this process, they have
been resistant to change what they know, and what is efficient in their particular experience
with landscape architectural design.
On the other hand, new hires of five years or less reported knowing a plethora of
software. Most common were AutoCAD, Photoshop, Adobe Creative Suite, GIS, and
SketchUp. Other skills include learning Rhino with Grasshopper, Revit, and 3Ds Max. Of the
sixteen subjects in the study, five of them could say that they were introduced to parametric
design within their design education.
4.1.2.9 Professional Question #9
Question #9 In your view what level of parametric design is adapted in your firm in
relation to Texas. Then compared to LA professionals nationwide?
This question generated 14 responses from the pool of 16 subjects (Figure 4.11).
37.5 % believe their firm or their practice was above average in the state of Texas. Subjects
#1,#2,#5, #8, #10 ,and #14 were singled out as above average according to their response and
cross-examination of their various parametric software uses. These respondents also believed

102
that they were above average in there usage of parametric design, but behind in the
development of parametric use within their firms when compared to the nation as a whole.
Three of the 14 responses to this question identified themselves as average users of
parametric design tools. This assessment was based largely upon their own assessment of their
firm in reference to the question. Subject #12 believed that Asian firms used to be the leader in
parametric design and that the United States had caught up to some degree. Subject #15
believed that advanced parametric design, such as Rhino, 3Ds Max, was not being adopted at
either the state or the national level.
Five firms identified themselves with being behind the curve of developing or adapting
to parametric design. Subject #16 believed strongly that adapting to technologies is client
driven. Subject #4 and #9 believe that larger firms were possibly doing more of it. Two
respondents were unclear about whether or not the state of Texas was on par with the rest of the
nation with parametric use in landscape architecture. Subject #11 believed there is a lot of
progress of design work coming out of Texas, and that Texas A&M University was leading the
charge in academic training. With that being said, he identified with his affiliated firm being
behind the curve using parametric design.
Subject #2 believed that since the recession in 2009, smaller firms had gained a
competitive edge against larger firms. This respondent believed it had to do with smaller firms
having a lower overhead, and the availability of highly talented practitioners. As expected, the
more internationally based larger firms were more tech-savvy in their day-to-day practice. They
were more apt to adapt practices such as Rhino and 3Ds Max. An interesting note is that these

103
more tech savvy firms also believe that their firms were behind in use of parametric tools as
compared to the East and West Coast of the United States.
Figure 4.11 Professional Questions #9, Level of Adoption in Firm

104
4.1.3.0 Additional Professional Questions #2
A set of five interview questions was crafted to seek out additional information where
information might have fallen short during the interview and interviews process. Of the five
questions, three emerged as the most popular among online respondents and during the person-
to-person interview process. Questions # 2, #4, and #5 were answered by half the respondents
or more. Questions # 2 & #5 were the most relevant to this study.
Question #2 Do you foresee a technology shift within your firm within the next two
years? Five years? If so how?
Sixty-nine percent of the subjects expressed belief that their firm or their personal
practice was going to evolve technically in the next 2 to 5 years (Figure 4.12). Commonality
between answers was rare. It essentially became a wish list of sorts for the future of the 12
subjects that responded to the question. Respondents that spoke of smaller shifts in technology,
stated they would move towards more three-dimensional drawing. Subject # 3 wanted to learn
more about SketchUp, while subject #8 believed there is only so far that you can take
SketchUp. That subject also believed that CAD would remain the top used software for the
next 15 to 20 years. Subject #10 believed he was going to move to a more adaptable open
source CAD-based software called BricsCAD. He also was hoping to use Rhino more often.
Subject #8 believed that a continuation of new hardware was necessary to keep up with graphic
card based animation in Lumion. Subject #12 thought they would move from a civil 3D

105
platform into something like a Revit platform, while subject #2 believed we would see a lot
more automation and their firm would still strive to become more organized as an innovation.
Better Revit accessibility or usability was again referred to by subjects 12 and 16. Subject #15
believed that the firm he represented would move more toward a Lumion and SketchUp
platform. Subjects 6 and 15 stated that any innovation that happened would still be based on
market or client demands.
Figure 4.12 Professional Additional Questions #2, Future Technology Shift

106
4.1.3.1 Professional Additional Question #5
Question#5 Is educating staff on new software a barrier to implementing a new
workflow within the firm?
Approximately 63% of those who responded to this question believed training was not a
barrier to implementing new workflows (Figure 4.13). Subject #1 believed within his firm that
it is hard to keep up with training members of staff at different levels of technical ability.
Figure 4.13 Professional Additional Questions #5, Education Barriers
Subject#2 stated that all their new hires go through a leveling of technology boot camp
of sorts to assure everyone is at the same base level of technical ability. He also believed that it
was imperative that the culture of the office peers aided in the learning process. Subjects #5
and #6 believed it was imperative that if a firm wanted to keep improving efficient deliverables,

107
and workflows, it needs to keep up with technology. Subject #3 noted that it was a lot easier to
learn now with the availability of online tutorials.
4.2 Adaptation Characteristics of Parametric Design in Texas
According to Rogers Diffusion of Innovation Theory, all adaptations go through a series
of phases. An innovation is an idea perceived as new by an individual or a social group,
regardless if it a few months old or several decades. How well an individual or group perceives
advantages over time within their group determines whether an innovation is diffused into that
social group (Rogers, 2003).
4.2.1 Perceptions of Relative Advantage of Adapting to Parametric Design in Texas
In Rogers’ theory, relative advantage describes the benefits of an innovation through
economic, cultural, and social values. The greater the perceived advantage, the more likely it is
to be adapted into a social group (Rogers, 2003). Subjects that identified more with an
international reach within their firm found more of an advantage to adapting parametric design
tools then the subjects that were more regionally based.
For instance, subject #2 reported that the use of Rhino was nearly an everyday
occurrence. This firm was doing more international business before the recent downturn of the
economy. However, is not certain to what level there were using Rhino prior to the recession
of 2009, but some of the subjects had not even heard of Rhino before this study. It can be
presumed that the software was not used within their professional design circles, so it was not a

108
sought after toolset for them to work with the people they normally work with. Awareness of
an innovation is one of first steps towards becoming interested in adapting to it (Rogers, 2003).
Although AutoCAD can do generative parametric design work, it was perceived as a
complicated tool to work with. This perception led to the innovation of other toolsets that have
become popular over the years such as SketchUp, Rhino, and Lumion. There still needs to be a
market demand for the toolsets to become economically beneficial to the landscape architecture
firms that are seeking to use them.
A similar argument can be made for the demand of the building information software
Revit. Subject #15 stated, “ BIM has been a big thing for the architectural industry just because
of the way it works. In the level of detail that we need to get to, is not the same as most
buildings.” They went on to comment, “there seems to be some potential advantages as far as
speeding up production processes but as far of revolutionizing the way we work I don’t see
much potential there it is really pushed from the client-side.”
According to the interviewees Revit is the tool that is in high demand from the
architecture profession. Many municipalities prefer to work with this software to minimize the
risks of budget and litigation problems. When it comes to landscape architects’ perspective on
this, the economic advantage of such a system is certainly there, but from a billable time
standpoint, the software does not work the way landscape architects need it to work. This has
led to many innovative workarounds with different file format sharing, customization of
software to read Revit files, and even software that seeks to offset these problems completely
within a new software platform such as VectorWorks Landmark.
109
4.2.2 Perceptions of Compatibility to Parametric Design in Texas
Compatibility is the degree in which an innovation is perceived as consistent with
sustained using experiences meets the needs of social group adapting to it (Rogers, 2003
p.240). Many of the subjects in the interviews believed there was compatibility with new
technology in their LA practice. SketchUp for instance has become a very common software
program, it is unique in its ability to aid in the conceptual phase of design. Typically a three
dimensional tool would not be utilized until later in the schematic phase. This is filling a void
in the design process that was not likely considered a design constraint for a majority of
designers.
Compatibility is relevant in regards to what individuals or design firms are interested in
achieving in their design works. High-end marketing graphics, and unique design work such as
customized monuments, and arbors are two of the most compatible uses for advanced
generative form.
The use of computational software such as GIS, BIM, and CIM, becomes compatible
only if the market is there for the particular design firm, such as a planning driven landscape
architecture firm. Since relatively few subjects in this study were oriented towards combined
planning and landscape architecture firms, a proper assessment of the skill set was not possible.
For instance, subject #15 was currently working in a planning firm that did use GIS from time
to time but it was largely the responsibility of other practitioners that were more trained as
planners. There was no mention of using CIM anywhere in this study.

110
4.2.3 Perceptions of Complexity of Parametric Design in Texas
Complexity is the degree in which an innovation is perceived as relatively difficult to
understand and use (Rogers, 2003). The attribute of complexity is most often seen in a
negative perspective of a potential innovation. An example of this within the study is the use of
advanced parametric tools such as Rhino and 3Ds Max. Both of the software’s have been
publicly available since the mid-to late 1990s. Yet they are only beginning to become adapted
into the culture of landscape architecture. If one were to compare United States design studios
to other design studios on international level, a more wide scale use of both software programs
internationally. There does not seem to be an easy explanation why these programs are more
prevalent in one market over another. The software program 3Ds Max was stated by subject #2
as the most complicated design tool, this was also corroborated in the study, that 3Ds Max was
the most complex of the software mentioned in this study.
Sometimes complexity leads to greater innovation. The perceived complexity of
advanced AutoCAD and 3Ds Max, may have led to the innovation of SketchUp, and the
innovation of SketchUp has led the development of other more user-friendly software
particularly within the Autodesk community.
4.2.4 Perceptions of Trialability of Parametric Design in Texas
Trial ability is a term that relates to the innovation of software being adapted to the
culture of both academia and the contemporary design firm (Rogers, 2003). Subject #10 for
instance has had many opportunities to design using advanced parametric tools to the point

111
where he is becoming more comfortable using the tools, yet expressed the wish that there were
more opportunity to use it on a regular basis. Academia perhaps is the best place to test
whether innovation can work in landscape architecture design workflow.
If the opportunity does not arise often, enough, certain design skill sets become rusty
and then the innovation loses its strength as a potential design tool. As technical innovations
continue to arrive for trial, individuals need to determine whether this innovation will become
useful to them or to their design firms in the future. To some degree, landscape architecture in
general is now testing the trial ability of some of these more advanced generative, immersive,
and information based systems. Subject #2 stated, “Advanced modeling skills are part of the
next big thing, it’s relatively new, I would say the past five years that LA students have been
taught these things at the academic level, architecture is still leading the charge in Parametric
Design.”
4.2.5 Perceptions of Observability of Parametric Design in Texas
Observability is the degree in which an innovation can be seen by others. Some
innovations can be easily seen and communicated, while others are difficult to observe, or to
describe to other individuals or social groups (Rogers, 2003).
The more accessible new tools become, the more likely they are to be adapted into the
culture of design, and the presentation of designs in landscape architecture. In the initial phase
of adapting to new technologies, it may become more important for Texas design firms to show
and tell a new design through a new process, rather than expecting the market to request a new

112
design service. Without the trialability of an innovation the opportunity to observe its use
cannot be conducted. Subject #8 reported that the design firm has inserted surprise 3D
renderings into presentations that sometimes lead to additional billable hours for the firm.
Subject #2 stated, “as part of improving office workflow we encourage our staff to identify and
do things in a more efficient matter. We actively encourage our staff to step up if they perceive
a better way in which to improve the office workflow or improve project budgets.”
4.3 Chapter Summary
This chapter reviewed the findings from the interviews. The data was qualitatively
evaluated and analyzed according to Rogers’ Diffusion of Innovation Theory, through the
Attributes of Innovation (Rogers, 2003). This provided a check system to help further pull out
themes with which to reflect back to the original research questions to be further examined in
Chapter 5 Conclusions.
A common theme among the respondents expressed was the complexity in which
adapting to advanced parametric tools presented. For example in the case of adapting to Revit,
the software was observed to be incompatible in its initial form that prevented it from
becoming integrated into the culture and practice of the landscape architecture design firm.
The use of more complicated geometry in generative form brought up issues of
usability, and effective training in which to efficiently produce and market a design. Smaller
design firms are cautious in the trialability of generative form, as they do not have a clear and
present market demand to invest in a new technology.

113
Chapter 5
CONCLUSIONS
5.1 Introduction
The objective of this research has been conceived and carried out to provide an
assessment of how parametric design processes are adapted among Texas landscape
architecture professionals in the creation and implementation of new landforms, creative
spaces, management, and infrastructure for urban, suburban, and natural landscapes. The
research took a critical look at the history of parametric design, its current use, and future
technologies to look for in the future. It also sought to achieve some understanding on what
factors lead to a diffusion of parametric design innovation into landscape architecture
professional’s practice in Texas. In the following section findings are summarized through the
lens of Rogers’ Diffusion Theory, the main repeating elements in the interview questions are
reviewed, and related to answering the four main research questions.
5.2 Summary of Findings
According to Rogers’ Diffusion of Innovations Theory (2003), all innovations go
through a series of phases as they are adapted into a new environment. Rogers’ five factors of
innovation reviewed in Chapter 3 section 3.5.2 identifies these phases as relative advantage,
compatibility, complexity, trialability, and observability (Rogers, 2003). An innovation is an
idea perceived as new by an individual or a social group regardless of how long the innovation
has been available for use.

114
Relative advantage of an innovation is one of the first steps towards becoming
interested in adapting to an innovation (Rogers, 2003). How well an individual or group
perceives advantages over time within their group determines whether an innovation is diffused
into that social group. The greater the perceived advantage, the more likely it is to be adapted
into a social group (Rogers, 2003). Subjects in this study that identified with an international
reach within their firm, found more of an advantage to adapting parametric design tools than
did the subjects that were regionally based.
Compatibility is another way in which an innovation is perceived as consistent with
sustained experiences that meet the needs of the social group that is adapting to it (Rogers,
2003). The accessibility and learnability of a software program often determines its cultural
value to adapting to it.
Complexity affects the rate in which individuals and design firms adapt to innovations
(Roger.2003). This is evident in the way academia has made available programs for training in
the fields of architecture, landscape architecture, and planning. According to the interviewees,
whom are 10 years or less in the field, it appears as though the availability to learn alternative
programs to the typical AutoCAD and Photoshop are becoming more available to students that
are seeking these tools out. It is important to note that Rhino 3D was commercially available in
the mid nineteen nineties and has according to subject #2 in the interviews has just become
more prevalent in the past few years. This represents a shift in awareness of the perceived
compatibility of Rhino for use in parametric design for landscape architecture.

115
Trialability is the degree to which an innovation may be experienced for a limited
amount of time. Trying new technology or software is something that is not readily available
outside of landscape architecture education. It is reported in the interviews that training in new
software and the ability to be trained or the job are the biggest constraints to learning new
software. The exception to this being the availability of open sourced software, beta releases,
or open trials of commercially available programs. More often than not, learning new software
becomes the responsibility of the individual to learn new techniques or processes outside of
work time.
Observability of an innovation is central to whether a social group will accept it into
practice or its culture (Rogers, 2003). Generative, immersive, responsive, and information
based parametric design are all on the cutting edge of practices that will likely become adapted
into landscape architecture in the future. The innovations that make it into the general culture
of landscape architectural design will likely vary according to the interviewees in the coming 5-
10 years as firms and individuals adapt to new systems of analyzing, designing, and creating
three-dimensional modeling, and construction documents.
5.3 Response to Research Questions
At the beginning of this study is set of four questions to tackle as the core of the
adaptation of the innovation of Parametric Design among landscape architecture
professionals in Texas. The following section review’s those four questions as a result of that
research.

116
1. Is parametric design being adapted into the field of landscape architecture in
Texas?
The economic downturn in 2009 has reportedly changed the bottom line on
budgets across several typologies of landscape architectural practice. Thus, the
efficiency of a design firm has become more important than ever. The research
indicates that software that is more intuitive to learn, such as SketchUp, and Lumion
are two of the faster adaptions to the practice of landscape architecture in the past five
years.
According to the interview respondents and the literature review, the younger
generation of designers is leading the charge for software innovation for several of the
larger firms interviewed in this research study. Other less digital technology based
firms are interested in adapting to SketchUp and are beginning to get ready to present
designs in a more realistic way as the client demand may be shifting to viewing designs
and construction in three-dimensional views.
The interview subjects reported adapting to new processes in PD, but this was a
broad response in content between the subjects. The response varied from software
updates, to trying more advanced strategies such as 3D mapping or printing. The
overall sentiment was that Texas was not doing as much the firms on the coasts that
may be reaching for the international market for design projects.
Parametric design is being adopted into firms in Texas at various levels.
Adapting to PD is reported in the research to be largely client driven. If there is an

117
observed need for a new workflow or method of design, it is up to individuals and
leaders in firms to take the charge to innovate.
2. What computer software is adapted for use in parametric design in Texas?
Rogers identifies five innovator adapter categories to help classify individuals
within a social group (Figure 3.3), and the level at which they are involved in increasing
an innovation’s presence. The first of these are the innovators or change agents, they
comprise 2.5 % of the group. Early adapters are next representing 13.5 % of an
innovator’s group. Early and Late Majority adapters compromise 34% of the process of
innovation each. The late adapters or Laggards represent 16 % of social system
involved in the critical mass of an innovation reaching its full immersion into the
culture (Rogers, 2003). AutoCAD and Photoshop are two software programs that have
reached critical mass with 100% use in the firms interviewed. SketchUp is in the late
majority stage with 75% of the subjects using it to some capacity, while programs such
as GIS, Revit, Autodesk Civil 3D, Rhino, Grasshopper, and 3Ds Max are in the early
majority stage. Software in the 0-16% stage represents the innovators and early
adapters. Software such as, Land F/X, Infraworks, BricsCAD, Microstation, Imaginit
(formally Eagle Point), and Autoturn represent this stage in this study.
Revit is adapted by 38 % landscape architecture professionals (Figure 4.3). The
subjects that reported using Revit had to find work around solutions to be able to

118
“insert” their contribution to the design through using compatible software like
Autodesk Civil 3D or SketchUp. Another method of working with a Revit file was to
customize the workflow through scripting a procedure to collaborate with the Revit file.
File conversion software also exists but was not shared during the interview process.
3. Are there similarities or differences in the level of adaptation of parametric
design between education and practice?
It appears that the level of sophistication in CAD experience is higher at most
Design firms, then in academia, as they use this software day in and day out. This is
especially true in multidisciplinary design firms that are working in several projects at
once. This researcher believes, as evidenced in the training of new hires in subjects #2,
#8, #10, #14, and #15 that academia is more adapted in developing new skill sets in
programs like Rhino, Grasshopper, and 3Ds Max, and Lumion. Both education and
professional practice have constraints on the availability of training opportunities.
Several landscape architecture programs are connected to a larger branch of education
such as architecture. Because of this, it is apparent that the training is available, but it
often connects to the curriculum of whichever program has the most momentum for the
technology. The downside of knowing several software programs becomes a lack of
technical aptitude in any one in particular. As noted earlier in the study, further training

119
in computer software is often the responsibility of the student or landscape architecture
professional.
4. What is the biggest factor of adapting to Innovation in Landscape Architecture
practices in Texas?
There seems to be three general concerns regarding when and how to innovate
new design practices in landscape architecture. The subjects interviewed stated several
times that the push to innovate or change workflows was largely client driven.
Workflow efficiency improvement was another of the concerns for and against adapting
to innovation. When a decision was made to make a change or update to newer
software training, some members of the firms handled it with more ease then others.
The time needed to learn new methods in PD, and the perceived advantage to learning
were the leading answers from the interviewees as factors leading to adapting or not
adapting to parametric design in landscape architecture.
An additional concern was not interfering with the intuitive design process.
Subject #1 spoke of being able to know when it is appropriate to use PD in the design
process when they said, “the tools that we use have changed but the processes remain
the same. Thought pattern is still the same, sometimes you get limited by the tools and
you have to do what it takes to get through the thought process. I’ve had two coach
some of our younger landscape designer staff to turn off the computer and quit worrying

120
about the software, dig into the design, and study it however you need to and make the
computer perform to show the design the way you want it to be.”
Training is the number one factor in adapting to other methodologies in PD. In
the professional office, training can interfere with billable hours for the firm. There
needs to be a base technical proficiency in which to work from in order to effectively
work as a team. Any perceived interruption to that workflow is considered an
ineffective way of running a design firm. When a firm decides to adapt to new
software, the trainability of individuals can become a cohesion issue within the firms
social structure. It is only through peer support and determination of an individual that
adapting to new methods in parametric design is possible.
5.4 Conclusion and Discussion
Through the research on this topic in the review of literature, and interviewing
professional landscape designers and architects in the state of Texas, the hope of this researcher
is that an increase in awareness of technological advancements in the practice of landscape
architecture, architecture, and planning, has happened. Leading national design firms have
been seeking out emerging professionals that have knowledge of new software workflows and
procedures (Bentley, et al. 2016). The study may also have educational outcomes by
encouraging training of special processes or technology for those seeking degrees in landscape
architecture.

121
While visiting professional design firms it became apparent that certain firms connect to
certain universities based on the type of training that they are likely to receive from those
schools in Texas. A continuing dialogue between faculty and administration at the academic
level, and senior and junior level management at design firms should go a long ways towards
bridging any training gaps in the future needs of landscape design firms.
Qualitative observation and analysis from interviewing professional landscape designers
and landscape architects suggests that as software, presentation formats, and clientele requests
change, design firms must adapt as best as they can. One of the bigger questions emerging
from this research is that whether new ways of using computational software in analysis and
design will be fully adopted to generate new land form solutions for landscape architecture in
North America and in particular the state of Texas? Or will they remain as an avant-garde form
of design within leading universities and design firms?
Innovation is a constant, there are similarities and differences in the types of software
used at the state, national, and international level. It is imperative that a design professional or
firm strategically plan for innovations when the time is right for their given practice. Interview
subject #5 states the eloquence of this dichotomy facing design firms and academia today.
“I believe that there is an advantage to adapting technology to the way we work. I do
not like assuming that technology fully replaces our “design intuition”. I think we still
need both. No program can replace project experience, and likewise, no amount of
longevity in this profession should prohibit us from trying something that can improve
122
our analysis, design and construction ability. I do not think that parametric design is a
replacement for imagination or imaginative connective conceptualization.”
Perhaps what is most true about the innovation of parametric design is that innovation
in landscape architecture is in a state of flux as a shift in culture is happening with the arrival of
the Millennials into the workforce. Depending on the individual or firm perspective, this
fluctuation is likely to manifest over time as cultural ebbs and flows decide what type of design
innovation is appropriate and when.
5.5 Suggestions for Future Research
It became apparent through the process of researching this subject through the literature
review that there is a new potential in design to customize the landscape. It is possible to
infuse design with information or sensors to create more sustainable landscapes that adapt to
changing environmental dynamics. Factors such as more desirable building to landscape
connections, healthier air, healthier water, or better animal corridors to name a few. One tool
that can handle such a task would be the combination of Rhino and Grasshopper albeit with
some practice, and learning of visual scripting. This study could be taken in Biophilic Design,
for instance using biophilic city parameters within a customized city information model to
compare and contrast to standard building and landscape design practices.

123
A case study conducted into the usability of various Building Informational Modeling
(BIM) systems, using interviews, survey data, or investigation of BIM from a design lab. A
design lab could test the effectiveness of the BIM leader Revit, against the purported more
landscape architecture friendly BIM system Vectorworks Landmark, and compare and contrast
the two models to a custom model run through Rhino and Grasshopper platform or any other
application that is more appropriate. The purpose of this kind of study would be to help the
greater landscape architecture community develop a more efficient workflow that sets values to
landscape elements the same way that BIM does for architecture.
One of the bigger questions emerging from this research is whether new ways of using
computational software in analysis and design will be used to generate new land form solutions
for landscape architecture in North America and in particular the state of Texas, or will they
remain as an avant-garde form of design within leading universities and design firms? This
research done here in this thesis could be conducted at the national level to test things such as
parametric design preferences across the nation to determine patterns of innovations.
A study could be made into the similarities and differences between education and
practice would be an effective way to assess what the future needs are to the current workforce
as well as potential future trends to the landscape architecture practice to be facilitated from the
academic curriculum side. This study could be conducted through surveys or interviews to
determine mutually beneficial strategies for the future of the discipline.

124
APPENDIX A
Internal Review Approval

125
APPENDIX A

126
APPENDIX B
Study Population Cover Letter

127
APPENDIX B
To: From: [email protected] Subject: Request for Landscape Architectural Professional Interviews. Dear Landscape Architecture Professional, I am a graduate student at the University of Texas at Arlington working on my Master’s thesis entitled: “A Study of the Adaptation of Parametric Design among Landscape Architecture Professionals in Texas. The purpose of my study is to assess the diffusion of innovation of parametric design in landscape architecture professionals in landscape architecture firms in the state of Texas. This research will have the potential to further the current understanding of the adaptation of parametric design among landscape architecture professionals and firms, influence the availability for further education for practitioners, and lead to further research in this subject matter. I would like to request your participation in this research through an in person or phone interview, or online response to a set of interview questions. The interview will take approximately 25 minutes of your time. The ideal respondents for this research are landscape architecture professionals on staff, non-licensed or licensed professionals at any level (principles, senior, or junior staff) in a given firm, as long as they are involved in the design or planning of landscapes directly. The information you provide will be kept strictly confidential. The only people that would be able to see the interview responses will be my supervising professor Dr. Taner Ozdil, thesis committee members, and I. No information allowing company and individual identification will be published without acquiring consent. Upon your volunteered acceptance I will contact you to arrange a time for interviews, or dispersal of the interview questionaire. Thank you for your time and consideration. Please let me know of your interest in participation from the contact information below. It is only through the generous support of people like you that research can be successful. Best Regards, Chad Paulson, MLA Candidate The University of Texas at Arlington [email protected] 817 -721-2294

128
APPENDIX C
Parametric Design Overview

129
APPENDIX C
The term parametric originates from mathematics and refers to the use of certain parameters or variables that can be edited to manipulate or alter the end result of an equation or system (Frazer, 2016) In laymen’s terms, it is design that utilizes the computer to calculate form or function to the point one can make a decision on the likeability, suitability, or probability of it becoming a workable solution to the Landscape Design. A software program is parametric if the designer interacts with the computer to figure out a design problem. Such as;
The creation of 3D arbors, pavilions, custom retaining walls, islands, berms, furniture, non-Cartesian geometry (NURBS)
Urban design; planning metrics, irrigation design, lighting design, planting design rendering, cut and fill.
Building Information Modeling (BIM).
City Information Modeling (CIM)
Geographical Information Systems (GIS).
Responsive technologies or simulation modeling.
Examples of Parametric Design Software: 3D Modeling or Visualization Tools Autodesk’s AutoCAD, 3D Maya, 3D Max, Civil 3D Trimble’s SketchUp, Layout, and Style Builder plus third party applications such as Modelur Mcneel’s Rhino and other applications such as; Grasshopper, Python, Weaverbird, Starling AutoDesSys’s Form Z Adobe’s Photoshop for use in 3D modeling or animation Dassault System’s Solid Works Geographical Information Systems/ City Information Modeling ESRI’s Geographical Information System ESRI’s City Engine

130
Bentley’s Micro Station Holistic City’s CityCAD Building Information Modeling Autodesk’s Revit Vectorwork’s Landmark Other gaming based simulation virtual or immersive modeling. Act 3D’s Lumion Rendering Software Accurender NXT Chaos Software’s V Ray Cadalog, Inc. Podium

131
References
ArcGIS, (2017). What is Esri City Engine? Retrieved February 12, 2017, from: http://desktop.arcgis.com/en/cityengine/latest/get-started/overview-cityengine.htm Autodesk, (2017). Revit: Built for BIM. Retrieved February 10, 2017, from Autodesk:
https://www.autodesk.com/products/revit-family/overview Beal, Vangie (2017) Code. Retrieved January 28, 2017,from: Quin Street Enterprise: http://www.webopedia.com/TERM/C/code.html Beatley, T. (2011). Biophilic Cities: Integrating Nature Into Urban Design and Planning. Island Press. Bentley, Chris. Deane, Ryan. & Tal, Daniel (2016, July 16). Follow the script. Landscape Architecture Magazine, Vol 106 (7), 64-72. Beirao, J. Montenegro, N. Arrobas, P. (2012). City Information Modelling: parametric urban
models including design support data. Retrieved December 14, 2016, from Research Gate:https://www.researchgate.net/profile/Nuno_Montenegro/publication/259214034_City_Information_Modelling
Bernard, Francis (2003). A short history of CATIA and Dassault Systems. Retrieved
January 16, 2017 from DassaultSystems: http://ridwan.staff.gunadarma.ac.id/ Downloads/files /8426/history-catia.pdf
Bock, M. Tyagi, A. Kreft, J. Wolfgang, A. (2009). Generalized Voronoi Tessellation as a Model of Two-dimensional Cell Tissue Dynamics. New York. Cornell University Library. Retrieved February 10, 2017from: arXiv:0901.4469 [physics.bio-ph]
Bozdoc, Marian (2003). The history of CAD. Retrieved December 20, 2016, from:
http://mbinfo.mbdesign.net/CAD-History Brown, Tim (2009). Change by Design, New York, NY. Harper Collins
Cantrell, B. Holzman, J. Robinson, A. Hanna, M. (2016). Interfacing with Landscape
Performance: Case Studies and Research in Simulation and Modeling. ASLA Lecture, New Orleans, LA. (October 23, 2016).
Cantrell, Bradley, Holzman, Justine. (2016). Responsive Landscapes: Strategies for Responsive

132
Technologies in Landscape Architecture. New York, Routledge
Castell, Helen (2002). Editorial,Contemporary Techniques in Architecture. Architectural
Design, Wiley Academy. Volume 72, no.1). January 2002
Chouinard, P. Bell, A. (2017). History of MicroStation. Retrieved April 29, 2017 from: BentleyCommunities:https://communities.bentley.com/products/microstation/w/ microstationation__wiki/3164.history-of-microstation
Cnet.com. (2017). Louisville mayor Greg Fischer discusses smart cities at CES 2017 Retrieved
February 17, 2017, from Cnet Video, 2017: https://www.cnet.com/videos/louisville-mayor-greg-fischer-discusses-smart-cities-at-ces-2017
Deming, Elen M. Swaffield, Simon (2011). Landscape Architecture Research. New York, NY: John Wiley and Sons. Design rulz (2017). Zentrum Paul Klee Multimedia Museum. Retrieved March 15, 2017, from:
http://cdn.designrulz.com/wp-content/uploads/2012/09/1-Zentrum-Paul-Klee-designrulz-3.jpg
Donley, Matt (2011). History of SketchUp. Master SketchUp. October 17, 2011, Retrieved March 15, 2017 from: https://mastersketchup.com/history-of-sketchup/ Epic Games. (2015). Make Something Unreal. Retrieved March 12, 2017, from UNREAL
ENGINE: https://www.unrealengine.com/what-is-unreal-engine-4 ESRI. 1998). ESRI Shapefile Technical Description: An ESRI White Paper. Retrieved January
24, 2017, from: http://www.esri.com/library/whitepapers/pdfs/shapefile.pdf P. 1-5
ESRI, (2013). Opengeography.wordpress.com. Retrieved March 5, 2017, from: https://opengeography.wordpress.com/category/esri/
ESRI. (2017). Features. CIM modeling. . Retrieved April 24, 2017, from:
http://www.arcgis.com/features/features.html Factory Furniture, (2017). Osso Bench. Retrieved March 6, 2017, from: http://www.factoryfurniture.co.uk/osso-bench/ Farr, Douglas (2008). Sustainable Urbanism: Urban design with nature,
John Wiley and Sons Inc.
133
Fletcher Design Studio, (2017). Horse Shoe Cove Park. Retrieved May 1, 2017, from:
http://www.fletcherstudio.com/projects/parks-open-space/horseshoe-cove/3
Foley, James D. (1996). Constructive Solid Geometry. Computer Graphics: Principles and Practice. Reading, Mass: Addison-Wesley Professional Fornes, Marc (2016). Marc Fornes: TheVeryMany. Lecture University of Texas at Arlington,
March 2016 Frazer, John (2017). Parametric Computation: History and Future. Architectural Design.
Wiley Academy. March/April 2016 Gocmen, Z Asligul. Ventura, Stephan (2010). Barriers to GIS Use in Planning, Journal of
American Planning Association. Vol. 76, Iss. 2.2010 Gormley, Antony (2007). Space Station, Hayward Art Gallery, London U.K. Retrieved May 2,
2017, from: http://www.galleriacontinua.com/exhibitions/exhibition/222 Green, Jared (2017). Interview with Daniel Tal, ASLA, On technology for Landscape
Architects. ASLA.org. Washington D.C. Greenbelt.org (2015). Definitions infrastructure, new urbanism. Retrieved January 28, 2017,
from: http://www.greenbelt.org/land-use-planning-dictionary/new-urbanism
Harvard Graduate School of Design (2017) Fluvial Morphology Lab Retrieved May 2, 2017,
from: http://www.gsd.harvard.edu/course/responsive-technologies-in-landscape-architecture-spring-2017/
Helft, Miguel (2016), The Godfather of Digital Maps, Retrieved February 12, 2017, from
Forbes Magazine: https://www.forbes.com/sites/miguelhelft/2016/02/10/the-godfather-of-digital-maps/#6837bc914da9
Henderson, Harry (2009). Encyclopedia of Computer Science and Technology. RevisedEdition..
Retrieved March 4, 2017, from: http://www.e-reading.club/bookreader.php/ 135785/Henderson__Encyclopedia_of_Computer_Science_and_Technology.pdf
Herrington, Susan (2010). The Nature of Ian McHargs Science. Landscape Journal 29:1-10

134
Hillier, Ben (1996). Space is the Machine. Retrieved March 28, 2017, from London, United
Kingdom. Space syntax publishing: http://citeseerx.ist.psu.edu/viewdoc/download
Hock, Lieneke van (2013). Performative Landscapes: Enhancing Local Resource Extraction through Computational Morphogenesis. Retrieved March 17, 2017, fromUniversity of Technology Delft, Faculty of Architecture: http://lienekevanhoek.nl/PerformativeLandscapes.html
Hurley, Shaan (2017). AutoCAD Release History. Autodesk, Technology, Design and more.
Retrieved April 16, 2017, from:http://autodesk.blogs.com/between_the_lines/autocad-release-history.html
Intel (2017). Intel Timeline: A History of Innovation. Retrieved March12, 2017, from
http://www.intel.com/content/www/us/en/history/historic-timeline.html
Invivia (2017). The MIMMI project, Minneapolis, MN. Retrieved March 12, 2017, from
2017http://www.invivia.com/portfolio/mimmi/
Jabi, Wassim (2013). Parametric Design for Architecture. London, Lawrence King Publishing
Ltd.
Keating, Michael. Sumerlin, Peter (2016). Software Preferences at Award winning Firms. Retrieved March 3, 2017, fromThe Field, ASLA.org. Mississippi State University: https://thefield.asla.org/2016/07/12/software-preferences-at-award-winning-firms/
Kennedy, Luke (2014). A Brief History of AutoCAD. Retrieved April 30, 2017, from
Scan2CAD: http://www.scan2cad.com/tips/autocad-brief-history/ Khemiani, Lachmi (2017). City Information Modeling. Retrieved April 30, 2017, from:
aecbytes.com/feature/2016/CityInformationModeling.html. September 22, 2016 LAF, (2015). Guide to Evaluate Performance: Guidebook for Metrics and Methods, Retrieved
March 3, 2017 http://landscapeperformance.org
Lally, Sean (2014). The Shape of Energy. Projective Ecologies, New York, Actar Publishers

135
Li, H. Li, X. Bone, L. Zhang, A. (2012). Spatial Modeling of Bone Microarchitecture.
Retrieved: April 20, 2017, from Buffalo, New York, State University of New York:https://pdfs.semanticscholar.org/30aa/847eebf5206d331907a76ad0ceb86368ca7b.pdf
Lumion, (2016). About Lumion. Retrieved February 10, 2017, from Lumion 3d:
https://lumion3d.com/company.html64
Madlab, (2016). After 50 years of Computer Aided Design. Retrieved May 3, 2017, from:
http://www.madlab.cc/after-50-years-of-computer-aided-design/
McHarg, Ian (1969). Design by Nature. John Wiley and Sons
Marsh, William (2010). Landscape Planning, Environmental Applications, Fifth Edition. John
Wiley and Sons
Margolin, Victor (1998). Design for a Sustainable World. Design Issues, 14(2), P. 83-92. Margolis, Liat. Robinson, Alexander (2008). Innovative Materials and Technologies for
Landscape Architecture. Springer Science and Business Media Mathers, Bryan (2017) Rogers+diffusion+of+innovation graphic. Retrieved April 20, 2017 from Bryan Mathers.com: http://bryanmmathers.com/?s=diffusion+of+innovation Mayne, Thom (2011). Combinatory Urbanism: The Complex Behavior and Collective Form.
Culver City, CA: Stray Dog Press. P. 9-52 McNell, Wiki (2015). The History of Rhino. Retrieved March 6, 2017, from:https://wiki.mcneel.com/rhino/rhinohistory. 2015/09/14 Merideth, M. ARUP, A. Sasaki, M. AKT, P.Art (2008). From control to design: Parametric
Algorithmic Architecture. (1st ed.). Barcelona: Actar National Research Council, (1999). 5 lessons from history: Funding a Revolution: Government
Support for Computing Research. Retrieved April 15, 2017, from The National Academies Press. Washington, D.C.: https://www.nap.edu/read/6323/chapter/1#ii

136
Nijhuis, Steffen (2014). Application of GIS in landscape design research. Geo Design Summit Europe 2014. September11-12, 2014. Retrieved January 3, 2017, from: Delft University of Technology,Netherlandshttps://pure.tudelft.nl/portal/files/9994366/nijhuis_2016 applications_of_GIS_in_landscape_design_research.pdf
Payne, Andrew O. (2008). Mode Lab: Grasshopper primer. Third edition. Mode Lab.
http://modelab.is/
Pihlak, Madis (2004). Moving Landscape Architecture into the Digital World: A Practical Approach, Landscape Review 10 (1&2) p. 150
Pihlak M, Deamer P, Holland R, Poerschke U, Messner J, et al. (2011) Building Information
Modeling (BIM) and the Impact on Design Quality. Retrieved December 14, 2016, from Omics Publishing Group:J Architec Engg Technol 1:101. doi:10.4172/2168-9717.1000101
Pinterest, (2017), P & C Department Store, RenzoPiano. Retrieved March 16, 2017, from: https://www.pinterest.com/pin/557390891362818326/ Retrieved
Pinto, Nuno Norte, (2014). Technologies for Urban and Spatial Planning: Virtual Cities and
Territories. United States, IGI Global Publishing, Hershey, PA Project for Public Spaces, ( 2009). What is Placemaking? PBS.org. Dec 31, 2009, Retrieved
March 6, 2017, from Project for Public Spaces: https://www.pps.org/reference/what_is_placemaking/
Quondam, (2017). Intergraph Workstation. Accessed February 12, 2017, from:
http://www.quondam.com/19/1983.htm Reed, C., & Lister, N. M. (2015). Projective Ecologies. Harvard Graduate School of Design,
MA: Actat publishing Reynolds, R.A. (2014). Computing for Architects, UK. Butterworth and Co. Ltd. Rodger, J. Pendharkar, P. Bhatt, G. (1996). Diffusion theory in the adaption of software
innovation: common errors in future issues. Retrieved November 22, 2017, fromThe Journal of high-technology management research, volume 7, Number 1, Southern Illinois University at Carbondale. JAIPress,Inc.:http://docslide.net/documents/diffusion-theory-and-the-adoption-of-software-innovation-common-errors-and.html
Rogers, Everett M. (1995). Diffusion of Innovation. New York, Free Press
137
Rogers, Everett M. (2003). Diffusion of Innovation. New York, Free Press St. Laurent, Andrew M. (2004). Understanding Open Source and Free Software Licensing.
Retrieved January 4, 2017, from O'Reilly Media.com: http://www.oreilly / openbook/osfreesoft/book/ch01 Schumacher, Patrik (2010). Let the style wars begin. http://www.architectsjournal.co.uk Segal, M. Akeley, K. (2001). The Open GL Graphics System: A Specification. Version 1.3
Retrieved March 11, 2017, from: Kronos and Silicon Graphics: https://www.khronos.org/registry/OpenGL/specs/gl/glspec13.pdf
Simmonds, Triston (2007). Spacestation Diary. London. From control to design: Parametric
Algorithmic Architecture. (1st ed.). Barcelona: Actar
SketchUcation. (2017). Modeluer for Urban Design. Retrieved April 12, 2017 from SketchUcation: http://sketchucation. Com/plugin/741-modeluer Smith, Colin (2006), On Vertex-Vertex Meshes and Their Use in Geometric and Biological
Modeling. Retrieved March 13, 2017, from University of Calgary, Department of computer science: http://pages.cpsc.ucalgary.ca/~brosz/theses/PhD
Spirn, Ann Whiston (2000). Ian McHarg, Landscape Architecture, and Environmentalism:
Ideas and Methods in Context. Re- published in; Conan, Michael. Environmentalism in Landscape Architecture, Washington D.C. Dumbarton Oaks Publication Office
Stacy, Michael (2013). Prototyping Architecture. Canada, Library and Archives Canada
Cataloguing in Publication Steinitz, Carl (2012). A Framework for Geodesign: Changing Geography. ESRI Press Sterling, Bruce (2009). Augmented Reality: The ultimate display by Ivan Sutherland 1965.
Retrieved April 25, 2017, from Wired.com.: https://www.wired.com/2009/09/augmented-reality-the-ultimate-display-by-ivan-sutherland-1965/
Stover, Christopher & Weisstein, Eric W (2017). Parametric equations.Retrieved
December 14, 2017, from Mathworld: http://mathworld, Wolfram.com/ ParametricEquations.html
138
Sutherland, Ivan E. (1963). ‘Sketchpad: a man-machine graphical communication System. Retrieved April 28, 2017, from Sage Journals: http://journals.sagepub.com/ doi/abs/10.1177/003754976400200514
Tal, Daniel (2017). More than Toys, Landscape Architecture Magazine. March 2017 Taylor, Steven. Bogdan, Robert (1998). Introduction to Qualitative Research Methods. New
York. John Wiley and Sons Inc Texas Society of Architects, (2011). Coy Talley on the Landscape Architecture of the Perot
Museum, Retrieved October 16, 2015, from:(http://texas architects.org. tbae.org Vanucci, Marco (2008). Open Systems: Approaching novel parametric domains. From control to design: Parametric Algorithmic Architecture (1st ed.). Barcelona: Actar Wan, (2010). New images for esc-studio's complete redevelopment of Glorieta Juan Carlos I
Mula. Retrieved February 12, 2017, from:http://www.worldarchitecturenews.com/ project /2010/15127/ esc-studio/glorieta-juan-carlos-i-mula.html
Wayne, Chris (2003). Suitability Analysis with Raster Data. Retrieved April 16, 2017, from ArcUser. ESRI.com: http://www.esri.com/news/arcuser/0703/files/landfill_2.pdf Weinstock, Michael (2006). Advanced Simulation in Design. Architectural Design, Techniques
and Technologies in Morphogenetic Design. Wiley Academy. Volume 76 No. 2. Stathopoulos, Nikolaos. (March/April,2006)
Wilson, Matthew (2014). Celebrating the Advent of Digital Mapping. Retrived March 3, 2017,
from Arc News, University of Kentucky: http://www.esri.com/esri-news/arcnews/winter1415articles/celebrating-the-advent-of-digital-mapping
Young, Dave (2012). Mesh Modeling in AutoCAD: Creating Content for the Rest of th World. Retrieved March, 6, 2017, from: http://aucache.autodesk.com

139
Biographical Information
Chad Paulson grew up in Hudson, Wisconsin in the 1970’s and 80’s. His backyard was
a prairie that connected to a riparian corridor that merged into a deciduous forest. The deep
connection to prairie, woods, rivers, and lakes carried a sense of play into his adult life with an
exploration of those elements and sense of play while earning a Bachelor’s of Fine Art degree
from the Minneapolis College of Art and Design in Minneapolis, Minnesota in 1993.
Life events brought Chad to the State of Texas in 2009, first as an escape from the cold
winters of the Midwest, then for the pursuit of a Masters’ Degree in Landscape Architecture
from the University of Arlington at Texas, completed in May 2017.